Abstract
Comprehensive evaluation of suburban landscape perception is essential for improving environmental quality and fostering integrated urban–rural development. Despite its importance, limited research has systematically extracted local visual features and analyzed influencing factors in suburban landscapes using multi-source data and machine learning. This study investigated Chongming District, a suburban area of Shanghai. Using Baidu Street View 360° panoramic images, local visual features were extracted through semantic segmentation of street view imagery, spatial multi-clustering, and random forest classification. A geographic detector model was employed to explore the relationships between landscape characteristics and their driving factors. The findings of the study indicate (1) significant spatial variations in the green visibility, sky openness, building density, road width, facility diversity, and enclosure integrity; (2) an intertwined spatial pattern of blue, green, and gray spaces; (3) the emergence of natural environment dimension factors as the primary drivers influencing the spatial configuration. In the suburban industrial dimension, the interaction between the GDP and commercial vitality exhibits the highest level of synergy. Based on these findings, targeted strategies are proposed to enhance the distinctive landscape features of Chongming Island. This research framework and methodology are specifically applied to Chongming District as a case study. Future studies should consider modifying the algorithms and index systems to better reflect other study areas, thereby ensuring the validity and precision of the results.
1. Introduction
The suburban zone, situated on the urban periphery, serves as a transitional area that integrates urban and rural functions regarding its land use, landscape, and economic structure. It has emerged as a conduit for the exchange of urban and rural elements and plays a critical role in addressing the urban–rural dichotomy [1]. Characterized by a blend of natural ecology, cultural heritage, and artificial spaces, the suburban landscape has increasingly been disrupted by urban expansion and the rising demand for industrial land [2]. This has led to ecosystem degradation, diminished service functions, and increased fragmentation and deterioration of the landscape, resulting in an ambiguous identity—neither distinctly urban nor rural [3,4]. Compared to planning in other regions, suburban planning remains underdeveloped. Current plans for suburban areas, such as the Outline of the 14th Five-Year Plan for National Economic and Social Development of Chongming Island and the Rural Unit Village Plan (2022–2035), have made a limited effort to extract or quantitatively assess local landscape features based on user perception, hindering the advancement and sustainable development of suburban environments.
The theory of “place” emphasizes the relationship between people and their environment from psychological, social, and cultural perspectives [5]. The concept of “sense of place” refers to the deep cognitive and emotional connections individuals develop with their surroundings through long-term interaction, encompassing emotional attachment, cultural identity, behavioral loyalty, and spatial perception [6]. According to Duan Yifu, “locality” arises from individual experiences of space, fulfilling both sensory needs and the need for spiritual resonance [7]. It is formed through the dynamic interaction between natural and built environments, reflecting stable natural traits, cultural characteristics, and human activities [8]. Locality encompasses not only physical and geographical elements but also the spiritual and cultural dimensions shaped by human–land relationships [9]. Emerging in the 1960s, landscape perception theory explores the dynamic interactions between individuals and their environments, focusing on how sensory, cognitive, and emotional responses are triggered and processed. Visual perception, as the dominant sensory channel, is central to this theory, involving the interpretation of visual elements, such as the landscape’s form, color, and structure. This process reflects both objective spatial characteristics and subjective esthetic and cultural values, highlighting the integration of spatial function and visual appeal [10]. Visual local landscape perception refers to people’s emotional attachment to and multidimensional evaluation of the cultural information contained in regional landscapes. A comprehensive visual element assessment is essential for informing sustainable development and preserving local identities [11].
With the full implementation of China’s urban–rural integration strategy, visual perception of suburban landscapes has emerged as a key factor in enhancing experiential engagement, subjective awareness, and satisfaction. It has become a growing research focus in landscape ecology, sociology, and human geography, addressing issues such as collective emotion, cultural identity, rural homogenization, and the preservation of landscapes’ authenticity [12]. Traditional methods, such as questionnaires and field interviews, can quantitatively assess emotional responses [13,14], yet they are often time-consuming, costly, and subject to considerable variability among respondents. These drawbacks impede the establishment of standardized evaluation criteria and limit the feasibility of large-scale, fine-grained analysis. With advancements in information technology, machine learning algorithms have emerged as powerful tools for uncovering patterns in visual landscape perception and predicting perceptual outcomes. Such methods are widely applied to environmental information extraction, landscape assessment, and scenario simulation within deep learning contexts [13]. In recent years, numerous studies have adopted single-method approaches, such as the use of convolutional neural networks (CNNs), recurrent neural networks, and semantic scene segmentation, to objectively identify the morphological features of urban streets [15], greening esthetics [16], and building information for a block [17]. Cao et al. (2024) employed a biologically inspired visual processing framework to extract objective features of urban landscapes, including colors, landscape elements, spatial configurations, and perceptual imagery characteristics [13]. While their methodology is well-suited to densely built urban core areas, where comprehensive and high-quality data are readily available, it is less effective in suburban areas, where data may be sparse or incomplete. Hu et al. (2022) applied machine learning techniques to explore the correlation between residents’ perceptions and three specific visual indices derived from urban street imagery: the green, sky, and building view indices [17]. However, their analysis was limited to these three visual elements—greenery, sky, and buildings—thereby excluding the broader spectrum of complex and heterogeneous elements that typically characterize urban visual landscapes. This limitation resulted in certain deficiencies in the research content.
Increases in the size of databases and samples have also increased the diversity and complexity of their related datasets. Among rapid iterative machine learning methods, which can quickly process large amounts of data, clustering algorithms have emerged as a fundamental tool for investigating hidden group structures [18]. However, conventional clustering algorithms can only provide a single clustering result, limiting data exploration to a single rule and pattern. In contrast, multiple clustering can reveal multiple unique clustering patterns either simultaneously or sequentially. This approach overcomes the limitations of traditional clustering, which can only identify a single semantic cluster, by revealing the deep structural properties of data from multiple sources. As such, comprehensively understanding the inherent laws contained in large-scale, complex data can be highly beneficial. At present, multiple clustering algorithms have been gradually applied in bioinformatics, social network analysis, and computer vision [19,20,21], as well as landscape characteristic extraction; these methods can effectively eliminate the subjective bias present in traditional characteristic recognition methods and produce more accurate results [18].
The current landscape research predominantly relies on image databases, such as those containing street view imagery, aerial images, and topographic maps, all of which emphasize “explicit physical features’’ [17]. However, these data sources generally lack ‘‘implicit humanistic data,’’ such as cultural symbols, patterns of folk activities, and the emotional associations of local residents, which are essential for achieving a comprehensive understanding of landscape perception [8]. Furthermore, there is no dedicated ‘‘human–land–scene’’ holographic database specifically tailored to the urban–rural transition zone. As a result, it remains unfeasible to quantify, in real time, the visual impact of fluctuating interactions between urban and rural elements. Consequently, studies on urban–rural landscape perception are often constrained to using urban-centric datasets and evaluation standards, including the building density and green space ratio, which may not accurately reflect the dynamics of suburban or transitional areas [13]. To date, machine learning applications in this domain have largely focused on small-scale urban areas, with minimal extension into large-scale suburban contexts [22,23,24]. This limitation is particularly evident when single machine learning algorithms are employed, as they struggle to effectively manage the fragmented and complex nature of suburban landscape data. Moreover, such methods fall short in uncovering typological patterns or generating actionable recommendations from multiple types of data, especially when assessed from the perspective of subjective human perception [25,26].
Therefore, addressing the complexity of suburban landscapes requires effective integration of multiple machine learning algorithms. This study focuses on Chongming District, a suburban area of Shanghai, as a representative case. We use existing 360° Baidu Street View panoramic imagery, which provides high-fidelity street-level visuals including buildings, vehicles, and pedestrians. Based on this imagery, six key visual perception elements relevant to suburban landscape characteristics are identified: the environmental greenness, sky openness, building density, road width, facility diversity, and enclosure integrity. To quantify and analyze these elements, a combination of deep CNNs (DCNNs), random forest algorithms, and innovative unsupervised multi-clustering methods is employed. This approach enables the classification of visual features across blue, green, and gray spatial domains and facilitates an investigation of the relationship among the six visual elements and three spatial types. This approach enables the integration of multiple machine learning algorithms to extract landscape characteristics and develop optimization strategies from the perspective of human visual perception, offering valuable insights for the high-quality development and study of suburban environments.
2. Materials and Methods
2.1. The Study Area
Chongming District, located in the northeastern suburbs of Shanghai at the mouth of the Yangtze River (Figure 1a), is the world’s largest estuarine alluvial island. It comprises Chongming, Changxing, and Hengsha Islands, with an administrative area of 2494.5 km2, including 1413 km2 of land and nearly 20,000 rivers. Chongming District administers 16 towns and two townships. However, the western parts of the towns of Chenjia, Xinhai, and Dongping lack administrative villages and were therefore excluded from this study. Within the defined study area, 269 administrative villages were identified based on the latest boundary data for Chongming District (Figure 1b). For street view image sampling, road network data were sourced from OpenStreetMap and processed using ArcGIS Pro to generate equidistant sampling points at 50 m intervals along all accessible roads (Figure 1c). These sampling points were then connected to the Baidu Street View API to acquire corresponding panoramic images (Figure 1d). Situated in a northern subtropical zone, the district experiences a mild, humid climate with an average annual temperature of 16.5 °C and a forest coverage rate of 23.2%. Key ecological areas include the Chongming Island National Geopark, Dongping National Forest Park, and China’s first national experimental demonstration zone for sustainable agricultural development. Chongming is distinguished by its island geography and abundant ecological resources. However, rapid urbanization has led to a mixture of outdated and new buildings, insufficient public services, and a decline in green spaces. The traditional interwoven landscape of water and farmland has been increasingly fragmented, making Chongming a typical example of the diminishing local character of Shanghai’s suburban landscapes [18]. In response, the Shanghai Chongming District Master Plan and Land Use Master Plan (2017–2035) proposes to emphasize “Chinese elements, Jiangnan imagery, and island characteristics”. Despite recent development efforts in Chongming, their outcomes have been limited. Many villagers have constructed or renovated high-density residential and public buildings in European or modern architectural styles. In several cases, green spaces and coastlines have been converted into construction zones (Figure 2). Additionally, there has been minimal integration of marine elements in the environmental design. These trends pose major challenges to the realization of the above-mentioned planning goals.
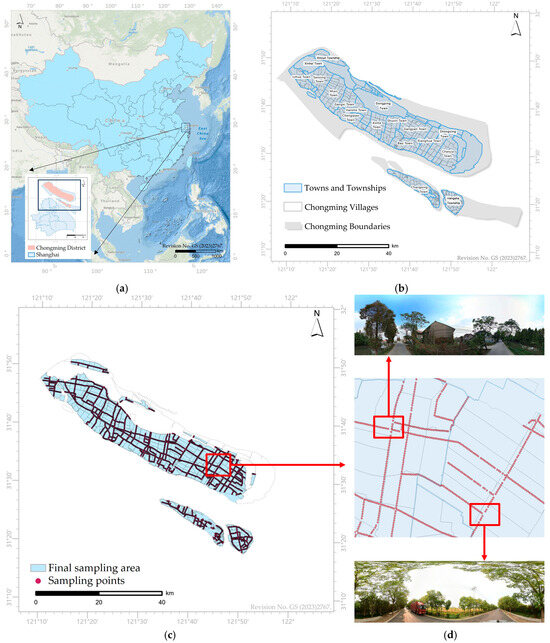
Figure 1.
Overview of the study area. (a) Geographical location of Chongming. (b) Administrative boundaries. (c) Sampling points for street view imagery. (d) Representative examples of sampled images.
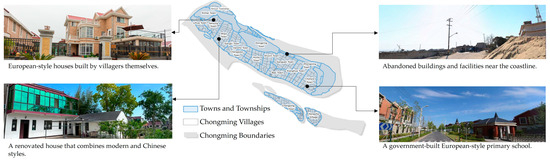
Figure 2.
Current environmental conditions in Chongming, Shanghai.
2.2. Research Methodology
2.2.1. Semantic Segmentation of Street View Images
The DeepLabV3Plus-ResNet101 model, a DCNN implemented using the Pytorch framework (version 1.9.0, by Meta Platforms Inc. Development, Menlo Park, CA, USA), was employed for semantic segmentation of Baidu Street View imagery. This work used data from the publicly available “DeepLabV3Plus-Pytorch” repository (https://github.com/VainF/DeepLabV3Plus-Pytorch, accessed on 11 April 2025), thereby ensuring transparency and reproducibility in both the training and inference stages. The model’s encoder–decoder architecture integrates atrous spatial pyramid pooling (ASPP), which applies parallel dilated convolutions with varying dilation rates to effectively capture multi-scale contextual information. Key landscape elements—the vegetation, sky, buildings, roads, facilities, and enclosures—were accurately extracted [13,27]. Based on these, six indices were calculated: the green view index (GVI), sky openness index (SOI), road width index (RWI), building intensity index (BII), facility diversity index (FDI), and enclosure integrity index (EII) (Figure 3). These were integrated using the unified landscape view index (LVI), as defined in (1):
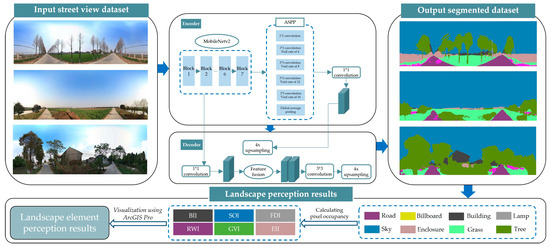
Figure 3.
Semantic segmentation methods.
Equation (1) defines the landscape view index () for a specific type of streetscape element, quantifying the proportion of the image area occupied by that element. In this context, represents the number of pixels corresponding to the xth element, while signifies the total number of pixels in the streetscape image, encompassing the entire visible scene. The subscript corresponds to different categories of streetscape elements, where , and represent the pixel areas occupied by greenery, tree cover, shrubs, lawns, sky, buildings, roads, facilities, including street lamps and benches, and enclosures (e.g., fences and walls), respectively. In practical terms, measures the proportion of the visible streetscape occupied by a specific element. For example, an value of 0.35 indicates that greenery constitutes 35% of the total visible area in the image.
2.2.2. Multi-Cluster Analysis
Unsupervised learning is a machine learning method that identifies underlying structures and patterns in sample data without relying on pre-labeled annotations. Clustering algorithms are widely used in characteristic recognition and type classification tasks to divide data points into several groups (clusters), ensuring that data points in the same cluster are highly similar, while those in distinct clusters are significantly different [21].
The multi-cluster analysis framework was developed in Python 3.10 within the PyCharm 2024.1 integrated development environment, utilizing standard machine learning libraries, such as scikit-learn, for implementing clustering algorithms and conducting performance evaluations. An unsupervised learning clustering approach was applied to extract the suburban landscape features and construct a multi-cluster analysis framework. First, min–max standardization was performed on the green view and sky openness indices to eliminate scale differences. Then, K-Means, Gaussian Mixture Model (GMM), and Geo-Self-Organizing Map (Geo-SOM) algorithms were independently applied to cluster the landscape elements, and their performance was evaluated using silhouette coefficients. The combined application of the K-Means and Geo-SOM algorithms produced the highest coefficients across all six landscape elements (Table 1) and this combination was thus selected for use in integrated clustering (Figure 4). Additionally, the validity of each demarcation line was determined using a voting method, whereby a boundary was retained only if both algorithms classified it within the same category. This approach integrated the strengths of both methods, reduced algorithm-specific biases, and enhanced the overall comprehensiveness and accuracy of the clustering results. Finally, referring to the relevant literature [17,18], the multidimensional clustering results (blue, green, and gray space) were merged to produce a comprehensive distribution map of the local suburban landscape characteristics. This ensemble method improves the stability and interpretability of clustering outcomes and offers an effective solution for identifying complex landscape patterns [28].

Table 1.
Comparison of clustering method results.

Figure 4.
Multi-clustering methods.
2.2.3. Random Forest
Based on multi-clustering classification, this study introduces a random forest regression model to further identify and quantify the contribution of different landscape element indicators (such as the GVI, SOI, BII, RWI, FDI, and EII) to the clustering results for rural landscapes. The model was implemented in Python 3.10 using the PyCharm integrated development environment, utilizing the Random Forest Regressor function from the scikit-learn library for training, fitting, and assessing the feature importance. As an ensemble learning method, random forest has the advantages of being able to handle high-dimensional features, automatically assessing variables’ importance, and strong robustness (Figure 5). It can effectively address potential nonlinear relationships and multicollinearity issues among landscape elements, making it suitable for meeting the complex landscape system modeling requirements of this study, which involved the integration of multiple indicators [29]. Specifically, the various spatial types (blue space, green space, and gray space) of landscapes in the clustering results were first used as target variables, and a regression model was constructed with the six landscape indicators used as input feature variables. Subsequently, the Random Forest Regressor integrated in the scikit-learn library was used for model training and fitting, and the feature importance score was used to evaluate the contribution of each indicator to distinguishing different spatial types in the landscapes. This process not only provided a data-driven explanatory mechanism for spatial type classification, but it also offered quantitative evidence for prioritizing various elements in subsequent landscape optimization strategies, thereby strengthening the logical connection between landscape classification and spatial intervention recommendations.
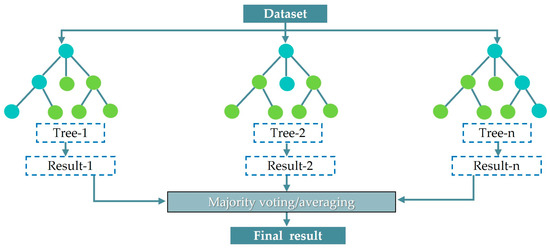
Figure 5.
Random forest process.
2.2.4. Geographic Detector
The main driving factors influencing the local landscape characteristics were quantitatively analyzed using a geographic detector [30]. Based on the relevant literature [31,32], the drivers were categorized into four dimensions—the natural environment, suburban industry, suburban construction, and 11 secondary factors (Table 2)—with the data sources detailed in Table 3. A 300 × 300 m grid was created in ArcGIS Pro 3.2, and all the data were discretized into five categories before analysis using the geographic detector (Figure 6).
Table 2.
Driving factors for landscape characteristics.
Table 3.
Data sources and descriptions.
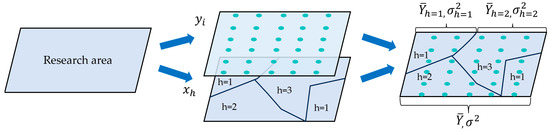
Figure 6.
Geographic detector flowchart.
The influence of the secondary drivers on the overall landscape clustering was first assessed using a one-class geographic detector. Each cluster label was binarized—for example, blue space (label = 0) was assigned a value of 1, and non-blue space (label ≠ 0) was assigned a value of 0. Subsequently, the impact of the secondary drivers on the blue space was analyzed using a two-class geographic detector. The same method was applied to green and gray spaces. The process employed (2) and (3):
where represents the strata of variable or factor (i.e., classification or partitioning); and denote the number of cells in the stratum and the entire region, respectively; and and refer to the variance of within stratum and the whole region, while and SST signify the sum of the within-stratum variances and the total variance of the region, respectively. The value of is. The value of q denotes the proportion of the spatial variation in the distribution of a specific landscape type that can be explained by a given factor. For example, a q value of 0.1 for blue space indicates that 10% of the observed spatial variation in the blue space distribution is attributable to that factor, while the remaining 90% is influenced by other factors or random variation.
Interaction detection examines how pairs of independent variable factors jointly influence the dependent variable by determining whether factors X1 and X2 enhance or diminish the explanatory power. This process involves calculating the individual q-values q(X1) and q(X2), as well as the combined q-values, q(X1 ∩ X2), representing the interaction of both factors. Comparing these values allows for the assessment of the nature and strength of their interaction effects.
2.3. Data Sources
Table 3 provides an overview of the data sources employed in this study, accompanied by detailed descriptions. All raster data were clipped to the boundaries of the study area using ArcGIS Pro 3.2. The collected textual, image, and tabular data were then spatially linked to the corresponding area’s vector data to ensure consistency in the geographic analysis. The Baidu Street View 360° panoramic images used in this study were captured in 2023. Sampling points were placed at 100 m intervals, with locations lacking available images being skipped. A total of 6779 images were initially obtained. After removing incomplete or invalid samples, 4393 street view images were retained, each with an associated ID and geographic coordinates (Figure 1c).
2.4. Technical Processes
This study followed a four-step process illustrated in Figure 7: (1) semantic segmentation of Baidu Street View images from 4393 sampling points in Chongming District to extract six landscape element indicators and generate their distribution maps; (2) classification of suburban landscapes into blue space (sky-dominated), green space (vegetation- and agriculture-dominated), and gray space (building- and facility-dominated) using multiple clustering algorithms, with random forest determining the indicator contributions; (3) application of Type I and Type II geographic detectors to identify the dominant driving factors and their interactions across the natural environment, suburban industry, and construction dimensions; (4) formulation of targeted landscape optimization strategies based on the analysis results.

Figure 7.
Overview of the technical workflow.
3. Results
3.1. Descriptive Analysis of Visual Landscape Elements
Table 4 and Figure 8 present the distribution of the visual landscape element characteristics in Chongming District, categorized by the greening, sky, architecture, roads, small-scale structures, and spatial features. The data reveal that the overall levels of the GVI and SOI fall within moderate ranges, whereas the BII, RWI, and EII are relatively low. Notably, the FDI is the lowest (0.013), indicating that the small-scale infrastructure across the townships is relatively insufficient and requires targeted improvement. Furthermore, the relatively large standard deviations observed in the GVI, SOI, and EII indicate significant regional differences and a lack of spatial equilibrium in these indicators. Specifically, regions with low GVI values would benefit from increased vegetation and greening efforts; areas with SOI values should aim to reduce excessive shading infrastructure; and zones with high EII values may require the selective removal of dilapidated and abandoned building structures to create more accessible and open public spaces.
Table 4.
Visual landscape element statistics (n = 4393).

Figure 8.
Spatial distribution of visual landscape elements: (a) GVI; (b) SOI; (c) BII; (d) RWI; (e) FDI; (f) EII.
Figure 8 illustrates that the GVI, SOI, BII, RWI, and EII indices across most areas of Chongming generally fall within the medium range. However, the FDI values remain relatively low in the majority of towns and townships, with each index exhibiting notable spatial variation. In recent years, the construction of demonstration villages and ecological islands as part of Chongming’s rural revitalization efforts has contributed to more regulated construction activity. As a result, key ecological resources, such as farmland, forests, and wetlands in Xincun Township and the towns of Shuxin and Gangyan, have been effectively preserved. This approach has led to improvements in the GVI (GVI ≥ 0.36) in some villages. Additionally, the absence of significant visual obstructions in extensive farmland areas has contributed to a moderately elevated SOI in these regions. Conversely, the establishment of high-density residential areas in certain towns, particularly Chengqiao and Chenjia, has resulted in a BII ≥ 0.12 and an EII ≥ 0.07. These figures contrast sharply with the predominantly low-density features of Chongming’s suburban landscape. The construction of beautiful villages in Shanghai has significantly improved road connectivity across various towns and villages within the region, resulting in a relatively high RWI. Particularly, high RWI values (≥0.16) are observed along the northern coastal road linking Shanghai’s main urban area with Nantong City, as well as along Chenhai Road, which traverses Chongming Island from east to west. Across most areas within each township and town, small-scale facilities are very sparse (FDI ≤ 0.01). However, exceptions are found in certain commercial streets and residential areas in the towns of Chengqiao and Chenjia, where the development intensity is higher and public services are more comprehensively established.
3.2. Cluster Analysis of Visual Landscape Elements
To synthesize the spatial distribution patterns of the visual landscape elements, clustering analysis was performed based on the results above. Based on insights from the relevant literature [17,31] and with consideration of the interpretability of the classifications, the number of clusters was initially set to three. This selection was subsequently validated through iterative testing across a range of candidate values (k = 2–6), using both the silhouette coefficients and the Calinski–Harabasz index. Among these configurations, k = 3 consistently demonstrated superior clustering performance. The clustering results obtained using the K-Means, GEO-SOM, and an approach integrating the two are presented in Figure 9. To further interpret the clustering outcomes, a random forest model was employed to assess the relative importance of six landscape element indices in predicting each cluster label (0, 1, 2), as illustrated in Figure 10. Based on this analysis, the clusters were interpreted as representing blue space (label = 0), green space (label = 1), and gray space (label = 2).
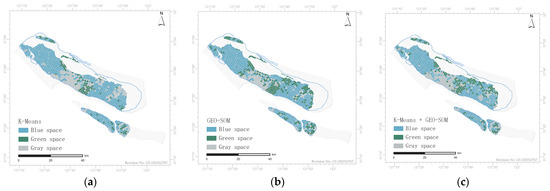
Figure 9.
Clustering analysis of visual landscape elements: (a) K-Means; (b) GEO-SOM; (c) K-Means + GEO-SOM.
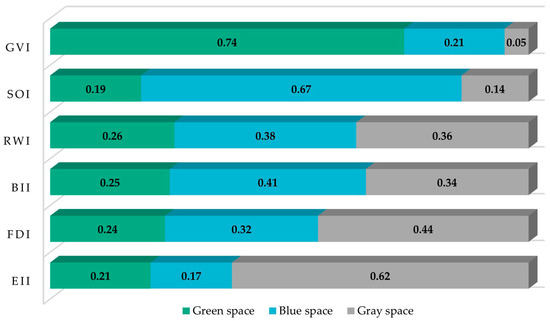
Figure 10.
Indicator contributions in random forest analysis.
- (1)
- The sky openness contributes most significantly to the blue space (0.67), followed by the BII. Blue space is predominant in Chongming, characterized by high sky openness, primarily found in open farmland areas and low-density residential areas. The area is characterized by a low density of buildings and fences, resulting in a relatively simple landscape composition and a pronounced sense of visual openness.
- (2)
- The GVI shows the highest contribution to the green space (0.74). Green spaces are mainly distributed in ecologically sensitive areas, such as the northern part of Dongping Town and Xincun Township on the periphery. In contrast, administrative and commercial zones in Chengqiao Town, as well as industrial areas in the towns of Chenjia and Gangyan, exhibit extensive hard paving and limited greening. Future construction should prioritize the balanced development of ecological corridors and green areas, especially in older neighborhoods, to enhance the integration of the natural and built environments.
- (3)
- The EII provides the highest contribution to the gray space (0.62), followed by the FDI (0.44). Gray spaces are primarily found in the residential, commercial, and office zones of the towns of Chengqiao, Chenjia, Gangyan, and Xianghua, characterized by high construction intensity. In the south, older villages in Hengsha Township and Changxing Town also exhibit dense buildings and strong enclosures. It is recommended to appropriately reduce the building density and over-enclosure of structures in these areas to improve the spatial quality.
The landscape of Chongming is marked by an uneven and interwoven distribution of blue, green, and gray spaces. Each town or township exhibits either a predominant spatial type or a varied combination of two to three types. Overall, blue spaces are the most prominent, reflecting the openness and permeability typical of suburban areas. However, this openness often comes at the expense of spatial enclosure, resulting in limited shielding and spatial definition. Fragmented and underutilized non-agricultural landscapes offer potential for conversion into public green spaces, enhancing their ecological and recreational value. Although certain towns and townships, particularly those featuring forest parks, wetlands, nurseries, and orchards, exhibit relatively high levels of green coverage, these areas collectively occupy less than one-third of Chongming’s total land area. Gray spaces, while limited in their spatial extent, contribute significantly to the overall functional density and spatial compactness of the region. However, areas such as the towns of Chengqiao, Xinhe, and Chenjia demonstrate notably high construction intensity, which may result in a heightened sense of spatial congestion and reduced residential comfort due to the lack of open and breathable urban space. The spatial distribution pattern of these three types of areas reflects the inherent trade-offs between conserving natural landscapes, ecological preservation, and human development, thereby offering a scientific foundation for informed suburban planning.
3.3. Analysis of Drivers
3.3.1. Analysis of the Role of the Dominant Drivers
Figure 11 presents the results of both the Type I and Type II geographic detection analyses. In Type I detection, natural environment factors show the highest explanatory power for the overall landscape characteristics, with q-values ranging from 0.033 to 0.046. In Type II detection, the influence of the driving factors varies significantly across blue, green, and gray spaces.
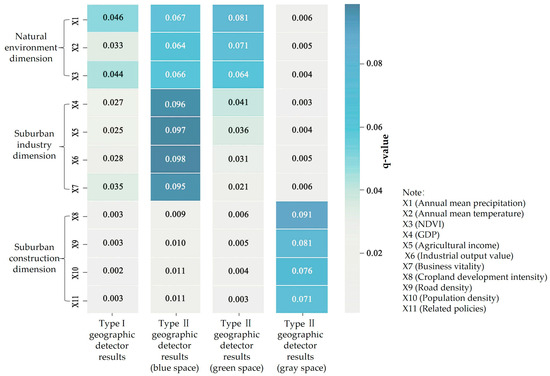
Figure 11.
Results of the geographic detector analysis showing the effects of individual factors.
- (1)
- Green space: Natural environmental factors have the strongest impact. In particular, X1 (average annual precipitation) has a q-value of 0.081, indicating that sufficient rainfall promotes vegetation growth and affects the spatial distribution of greenness.
- (2)
- Blue space: Suburban industry factors contribute the most. The q-value of X6 (industrial output value) is 0.098, indicating the impact of large-scale developments. Recently developed projects, such as the Changxing Town Marine Equipment Industrial Park, Chengqiao Town Industrial Park, and Chenjia Town Modern Agricultural Science and Technology Park, primarily comprise low-rise buildings (one to two floors). These development sites incorporate extensive lawns and agricultural fields, which enhance the openness and sky visibility across the area.
- (3)
- Gray space: Suburban construction factors dominate. Notably, X8 (arable land development intensity) and X9 (high-density buildings) have q-values of 0.091 and 0.081, respectively, showing that rapid urbanization—particularly the expansion of arable land and an increased construction density—has significantly shaped the enclosed and compact nature of gray space.
These findings suggest that each spatial type is influenced by distinct drivers and highlight the differentiated impacts of ecological, industrial, and construction activities on suburban landscape formation in Chongming.
3.3.2. Driver Interaction Analysis
The results of the geographic detector factor interaction analysis are presented in Figure 12, revealing notable variations across different factor combinations. The strongest interactions were observed within the suburban industry dimension, particularly between X4 (GDP) and X7 (business vitality), with a q-value of 0.1989. Chongming’s economic growth is predominantly driven by ecological agriculture and tourism. The agricultural output from rice, shrimp, and crab constitutes 67.5% of the total output value of modern agriculture in the region. Key natural attractions, such as the Dongtan Bird Reserve, Dongping Forest Park, and Mingzhu Lake, are maintained with low-density development, strictly prohibiting high-rise constructions in their vicinity. The introduction of diverse tourism projects has invigorated the region’s commercial activity. Industrial development in these sectors adheres to ecological standards without sacrificing spatial quality, enhancing standards, prioritizing the preservation of spatial quality by enhancing the extent of green and blue spaces, regulating the building density, and minimizing the proportion of gray spaces. Consequently, the alignment between GDP growth and commercial vitality can significantly enhance the impact of industries on the spatial characteristics. Within the natural environment dimension, greater interactions were identified between X1 (average annual precipitation) and X3 (NDVI), suggesting a direct impact on the formation of blue and green spaces. In contrast, the interaction intensity among the suburban construction factors was relatively low. Gray space development appeared to be predominantly influenced by individual factors, largely shaped by planning and policy directives rather than synergistic effects. In summary, the strongest synergistic influence was found in the suburban industry dimension, followed by the natural environment, with the suburban construction dimension exhibiting the weakest interactions. Therefore, priority should be given to integrating synergistic factors within the suburban industry dimension when optimizing suburban landscapes.

Figure 12.
Results of the geographic detector interaction analysis.
4. Discussion
Unlike previous visual landscape studies that depended on a single clustering algorithm or remote sensing imagery alone [33], our approach integrates the K-Means and Geo-SOM through a voting-based consensus clustering framework, enhancing the stability and robustness [34]. This ensemble method consistently outperformed individual algorithms, yielding higher silhouette scores and more reliable spatial segmentation of landscape features. Furthermore, by extracting six detailed landscape view indices via semantic segmentation, we captured richer human-scale environmental details that went beyond traditional vegetation or building metrics. Although this approach demands greater computational resources due to extensive image processing, it produces spatial patterns consistent with urban streetscape research [35] while delivering a higher resolution and more practical insights for rural landscape planning.
4.1. Key Findings
This pilot study yielded two primary findings. First, this study demonstrates that a landscape is a functional space formed through the integration of multiple elements. By utilizing Baidu Street View images, it became feasible to quantify the varying sensory experiences characterized by different visual proportions of greenery, sky, buildings, roads, and facilities (Figure 8 and Figure 9). Based on the analysis of each township, it was found that although Chongming District has the highest forest coverage rate in Shanghai, the distribution of various landscape components is highly fragmented. Particularly in older urban areas and townships, the green coverage is insufficient, the building density index and enclosure integrity index are excessively high, and the facility diversity index is low. These findings closely align with conclusions from the literature [8,13]. Therefore, from the perspective of human visual perception, it is crucial to prioritize improvements in areas that are overly open, densely built, overly shaded, or lack visual barriers, in order to enhance individuals’ comfort, sense of belonging, and place identity [17]. For example, Chengqiao Town should enhance its plant ecology by increasing the greenery in places dominated by hard surfaces and optimizing the local temperatures and humidity. The building density should be strictly controlled, block enclosures should be reduced, and some roads should be widened to alleviate the sense of confinement and overcrowding. Second, through the application of a geographical detector model, it was determined that various driving factors exert significantly differentiated influences on the clustering of blue, green, and gray spaces (Figure 11 and Figure 12). While natural environmental factors played a dominant role in single-factor analyses, the interaction between X4 (GDP) and X7 (commercial vitality) within the suburban industrial dimension exhibited the strongest explanatory power. This result diverges somewhat from findings in conventional suburban landscape studies [3,23]. With the accelerated urbanization in Chongming in recent years, particularly through the development of new residential communities, commercial zones, and marine-themed industrial parks, the economic development level and commercial vibrancy have significantly influenced the suburban landscape, thereby reshaping traditional understandings of driving factors in suburban areas.
4.2. Main Problem and Optimization Strategy
- (1)
- Preparation of detailed special plans for optimizing each visual landscape element: First, to address the issue of scattered green spaces across the district, these areas should be consolidated into planar and linear spatial configurations, with richer plant diversity, layered designs, and enhanced functionality. For instance, the idle green space near the main road in Aiguo Village, Zhongxing Town, could be converted into a vegetable garden, offering visitors a hands-on planting experience. Second, in certain old urban blocks, numerous abandoned buildings and derelict shelters hinder visual connectivity. These structures should be selectively demolished to establish visual corridors and enhance the overall spatial openness. Third, to address narrow roads, dedicated lanes for non-motorized vehicles should be introduced in the old town, while sidewalks are needed along rural branch roads. Fourth, in response to the high building density in older residential and commercial areas, fragmented and underutilized spaces should be consolidated into unified public rest and activity zones. The building density in new communities should be strictly limited, especially the construction of large, medium, and high-rise structures near the coastline [31]. Fifth, planners should create a dedicated plan for the development of small-scale facilities throughout the area and create functional small-scale facilities across the area, incorporating locally themed amenities, such as ones featuring marine culture along the coast and crop-related installations in agricultural parks. Lastly, they should also address the issues of overly narrow and enclosed spaces in older neighborhoods by removing abandoned low walls, increasing courtyard transparency, and using local bamboo and wood for flexible fencing to strengthen residents’ connections and sense of place [32].
- (2)
- Synergistic optimization of blue, green, and gray spaces’ functions and quality: To address the uneven distribution of blue, green, and gray spaces identified through the clustering analysis, planners should establish a data-driven collection and early warning system for these space types. First, in urban and rural renewal, low-rise buildings and expansive open areas should be prioritized, while enhancing blue spaces with limited sky openness [17]. Planners could introduce street parks, leisure plazas, and ecological pathways in older neighborhoods, such as the towns of Chengqiao and Chenjia, to create multifunctional open spaces. These areas should blend living and recreation while emphasizing natural lighting and transparency. Second, they should renovate the large hard-surfaced squares in administrative and commercial zones by blending green spaces with local cultural elements and enhance the waterfront parks in Yingdong Village, Chenjia Town, with amenities, such as rest pavilions, bird-watching platforms, and fishing shelters, to create seamless, premium green areas. Finally, planners should address the dense, enclosed gray spaces in Chongming’s urban areas and older villages by removing abandoned structures, such as pigsties, woodsheds, and low walls, that obstruct views, converting these sites into green or recreational spaces [36].
- (3)
- Innovative development promotion mechanism: To optimize suburban landscapes, development promotion is being stimulated through spatial governance and industrial synergy. First, in view of the dominant role of the annual average precipitation in the natural environment and its strong interaction with the NDVI, ecological conservation efforts have been reinforced by proposing the integration of multi-source data, such as those from weather stations and Internet of Things sensing terminals, into a three-dimensional “Green Map GIS” visualization and monitoring platform [37]. This system enables real-life tracking of environmental changes, pollution levels, and the continued ecological functioning of forest zones [30]. Second, to fully optimize local tourism, boost industrial growth, and balance the GDP with business activity, Chongming’s plans have promoted industrial synergy by developing the “Eco-Island+ Tourism Data” interactive platform [38]. This system enables dynamic analysis of the correlations between ecological indicators and industrial revenue growth, supporting the development of unique local industries, such as agricultural tourism, rural lodging, and horticulture. Key sites, including Dongping National Forest Park and the Flower Expo Culture Park, have been designated as central areas for forest and floral tourism [39].
4.3. Limitations
- (1)
- Data collection: Baidu Street View data primarily covers municipal roads and village roads, with relatively limited coverage in rugged or remote regions. In addition, street view images are typically updated once every 1 to 2 years, causing temporal delays, especially outside urban areas. Most images are captured in spring and summer, which introduces seasonal biases affecting features such as the vegetation and lighting. Due to limitations related to road accessibility and image capture timing, these factors create a spatial and temporal distribution bias that may impact the model accuracy. To address this issue, additional data sources, such as multispectral satellite imagery, high-frequency remote sensing data, and unmanned aerial vehicle photogrammetry, can be used to enhance the temporal resolution and multi-scale dynamic analysis of time series data. In the subsequent modeling phase, deep learning architectures, such as Transformers and graph neural networks, can be used to improve spatial dependency modeling and seamlessly integrate multi-temporal street view data with remote sensing data.
- (2)
- Data analysis: Relying on static analysis of data from a single period may produce biased results. Subsequent studies should integrate socioeconomic, ecological, and environmental data and other relevant data collected across multiple timeframes. Creating feature maps of landscape elements and databases tracking the driving factors every five years would enable the development of a simulation platform capable of long-term, multi-scenario landscape modeling. This platform would combine longitudinal historical analysis with real-time cross-sectional data, enhancing both the understanding and prediction of landscape changes. Additionally, to ensure robustness in multi-clustering methods, statistical tests, such as cross-validation or bootstrapping, should be incorporated to increase the accuracy and reliability of the results.
- (3)
- Applicability of results: This study is limited to the investigation of landscape data and landscape issues within a single region. Future research should expand to cross-regional comparisons, adapting indicators and frameworks to local contexts based on each region’s local characteristics. This approach could validate the utility of the research methods and findings. Additionally, a decision-making system should be developed to assess the impacts of urban–suburban landscape optimization before and after implementation, thereby facilitating the translation of research into practical planning tools.
5. Conclusions
China’s urban and rural development has entered a new stage characterized by deep integration. Utilizing the existing image data and spatial information for suburban environments, machine learning-based semantic segmentation, multiple clustering algorithms, and random forest models were integrated to quantitatively extract and analyze spatial features from regional-scale suburban streetscape images. This approach enables an in-depth exploration of the developmental dynamics of the visual landscape, aiming to enhance the quality of the suburban human environment and strengthen residents’ sense of identity and well-being [17]. The main conclusions of the study are as follows:
- (1)
- Significant spatial variation was observed in the distribution of visual elements across Chongming’s landscape. The areas with a higher building intensity index, enclosure integrity index, and facility diversity index generally corresponded to those with a lower green view index, sky openness index, and road width index, suggesting a trade-off among these landscape elements. Among them, the environmental green visibility was generally moderate, with high-value areas concentrated around ecological corridors and forest or wetland parks, while lower values were found in older urban clusters and suburban industrial parks. The overall sky openness was found to be high, indicating strong spatial permeability. The building density was notably higher in urban centers and certain rural core areas. The road widths were broader along major trunk routes. The richness of the facilities and degree of property enclosure were elevated in older urban areas and zones with a high development intensity but remained low in most areas, which was consistent with the relevant literature [13,17].
- (2)
- The multi-clustering model constructed from street view image data effectively integrated multidimensional variables and accurately identified localized characteristics of visual suburban landscape elements. By combining the K-Means, GEO-SOM, and random forest algorithms, the suburban landscape was classified into three dominant types—blue space, green space, and gray space—based on the prevailing visual features. Overall, blue space covers roughly two-thirds of the district, while green space, primarily in Chongming’s ecological corridors, forests, and wetlands, makes up less than a quarter, falling short of what is expected for an “ecological island.” The gray space, concentrated in the old urban area and the key towns’ cores, lacks sufficient blue and green areas, highlighting it as a priority for future landscape renovation.
- (3)
- Geographic detector analysis indicated that factors within the natural environment dimension served as the primary drivers of the landscape characteristics, with the average annual precipitation and NDVI exerting significant influence. Meanwhile, the influence of suburban industry and construction-related factors has become increasingly prominent. Strengthening the ecological environment supports positive regional landscape development. Notably, a strong synergistic effect between GDP growth and business vitality reflects trends noted in existing studies [38,39]. In the current phase of rapid economic growth, leveraging Chongming’s unique ecological resources to boost key industries and economic dynamism is crucial to enhancing the overall living quality.
In conclusion, building on the current findings, future research can further explore the dynamic nature of suburban landscapes by using temporal data (such as seasonal shifts or long-term urban development trends) to better understand how visual perception and landscape patterns change in response to planning efforts or environmental changes. Furthermore, incorporating different geographical, cultural, and policy contexts can refine the evaluation indicators for more targeted assessments. Integrating socioeconomic data, such as the population density, land use variety, and public service accessibility, with environmental metrics would enable more detailed and comprehensive simulations. These enhancements would improve the model performance and offer valuable insights for urban planners aiming to optimize the spatial layout and ecological quality in suburban areas across regions.
Author Contributions
Methodology, Y.D. investigation, Y.D. and J.Z.; supervision, J.Z.; writing—original draft, S.G.; writing—review and editing, S.G. and Y.D. All authors have read and agreed to the published version of the manuscript.
Funding
This research was supported by the Shanghai Philosophy and Social Science Planning Project (Grant No. 2023BCK011).
Data Availability Statement
The original contributions presented in this study are included in the article. Further inquiries can be directed to the corresponding author.
Conflicts of Interest
The authors declare no conflicts of interest.
References
- Mondal, M.; Mitra, S.; Patra, M.; Roychowdhury, K. Changing landscape and future prediction in and around planned urban centres: A case study on Salt Lake and Rajarhat New Town. Model. Earth Syst. Environ. 2025, 11, 311. [Google Scholar] [CrossRef]
- Aydogan, B.; Güney, S. Mobilizing capitals, forging terroir: Lifestyle migration and envisioning a “better rural landscape”. Planner 2025, 119, 103714. [Google Scholar] [CrossRef]
- Gong, S.N.; Zhang, L.; Pang, J. The spatial-temporal evolution of the trade-offs and synergy between the suburban rural landscape’s production-living-ecological functions: A case study of Jiashan in the Yangtze River Delta eco-green integrated development demonstration zone, China. Sustainability 2024, 16, 7439. [Google Scholar] [CrossRef]
- Velazquez, A.; Fregoso, A.; Siebe, C.; Gopar-Merino, F.; Morales-Casique, E.; Prado, B.; Marin-Castro, B.E.; Mora, L.; Reygadas, D.; Castro-López, V. Multiscale landscape analyses: The Megalopolis of Mexico as a case study. Environ. Dev. 2025, 56, 101262. [Google Scholar] [CrossRef]
- Reid, B. Trellising the girders: Poetry and the imagining of place in Northern Ireland. Soc. Cult. Geogr. 2008, 9, 519–533. [Google Scholar] [CrossRef]
- Lu, Z.L.; Yin, G.W.; Luo, C.J.; Ren, J.M.; Hu, S.Y. The construction of residents’ sense of place under the background of administrative division adjustment: A case study of the merger of Jinan and Laiwu. Hum. Geogr. 2025, 201, 45–52. [Google Scholar]
- Tuan, Y.F. Space and Place: The Perspective of Experience; University of Minnesota Press: Minneapolis, MN, USA, 1977; pp. 159–167. [Google Scholar]
- Gong, S.N.; Zhang, L.; Duan, Y.X. Rural Local Landscape Perception Evaluation: Integrating Street View Images and Machine Learning. Int. J. Geo-Inf. 2025, 14, 251. [Google Scholar] [CrossRef]
- Oakes, T.; Schein, L. Trans-Local China: Linkages, Identities, and the Reimagining of Space; Routledge: New York, NY, USA, 2006; pp. 69–77. [Google Scholar]
- Appleton, J.A. The Experience of Landscape; John Wiley & Sons: Hoboken, NJ, USA, 1975; pp. 49–54. [Google Scholar]
- Steiner, F.; Young, G.; Zube, E. Ecological Planning: Linking Ecology with Land Use; Island Press: New York, NY, USA, 2000; pp. 108–112. [Google Scholar]
- Darby, W.J. Landscape and Identity: Geographies of Nation and Class in England; Routledge: New York, NY, USA, 2020; pp. 88–94. [Google Scholar]
- Cao, Y.H.; Yang, P.F.; Xu, M.; Li, M.; Li, Y.; Guo, R. A novel method of urban landscape perception based on biological vision process. Landsc. Urban Plan. 2025, 254, 105246. [Google Scholar] [CrossRef]
- Montello, D.R.; Goodchild, M.F.; Gottsegen, J.; Fohl, P. Where’s Downtown?: Behavioral Methods for Determining Referents of Vague Spatial Queries; Psychology Press: New York, NY, USA, 2017; pp. 88–93. [Google Scholar]
- Zhao, J.; Chen, R.; Hao, H.C.; Shao, Z. Application progress and Prospect of machine learning technology in landscape architecture. J. Beijing For. Univ. 2021, 43, 137–156. [Google Scholar]
- Naik, N.; Philipoom, J.; Raskar, R.; Hidalgo, C. Street score-predicting the perceived safety of one million streetscapes. In Proceedings of the IEEE Computer Vision and Pattern Recognition, Columbus, OH, USA, 23–28 June 2014; pp. 779–785. [Google Scholar]
- Hu, Y.K.; Zhang, T.L.; Wang, L.; He, J. Measurement and spatial distribution of perception in urban blocks from the perspective of landscape service. Landsc. Archit. 2022, 29, 45–52. [Google Scholar]
- Yu, G.X.; Ren, L.R.; Wang, J.; Domeniconi, C.; Zhang, X.L. Multiple Clusterings: Recent Advances and Perspectives. Comput. Sci. Rev. 2024, 52, 100621. [Google Scholar] [CrossRef]
- Tokuda, T.; Yamashita, O.; Yoshimoto, J. Multiple clustering for identifying subject clusters and brain sub-networks using functional connectivity matrices without vectorization. Neural Netw. 2021, 142, 269–287. [Google Scholar] [CrossRef]
- Binesh, N.; Rezghi, M. Fuzzy Clustering in Community Detection Based on Nonnegative Matrix Factorization with Two Novel Evaluation Criteria. Appl. Soft Comput. 2018, 69, 689–703. [Google Scholar] [CrossRef]
- Raya, S.; Orabi, M.; Afyouni, I.; Al Aghbari, Z. Multi-modal data clustering using deep learning: A systematic review. Neurocomputing 2024, 607, 128348. [Google Scholar] [CrossRef]
- Zellner, M.L. Participatory modeling for collaborative landscape and environmental planning: From potential to realizatio. Landsc. Urban. Plan. 2024, 247, 105063. [Google Scholar] [CrossRef]
- Lin, L.; Bian, Z.; Wang, S. Landscape of machine learning evolution: Privacy-preserving federated learning frameworks and tools. Artif. Intell. Rev. 2024, 58, 51. [Google Scholar] [CrossRef]
- Zheng, T.C.; Pan, Q.; Zhang, X.C.; Wang, C.X.; Yan, Y.; Voorde, T.V.D. Research Note: Linking sensory perceptions with landscape elements through a combined approach based on prior knowledge and machine learning. Landsc. Urban. Plan. 2024, 242, 104928. [Google Scholar] [CrossRef]
- Tao, L. Machine Learning Based Landscape Garden Plan Analysis and Rendering Application. J. Inf. Sci. Eng. 2024, 41, 279–295. [Google Scholar]
- Shen, S.G.; Li, C.L.; Su, L. Research progress in plant colorscape based on visual perception. World For. Res. 2021, 34, 1–6. [Google Scholar]
- Van, D.B.M.; Ode, S.A. Urban natural environments as nature-based solutions for improved public health—A systematic review of reviews. Environ. Res. 2017, 158, 373–384. [Google Scholar]
- Lu, Y.T.; Xu, S.; Liu, S.X.; Wu, J.Y. An approach to urban landscape character assessment: Linking urban big data and machine learning. Sustain. Cities Soc. 2022, 83, 103983. [Google Scholar] [CrossRef]
- Krohn, J.; He, H.; Matisziw, T.C.; Knapp, L.S.P.; Fraser, J.S.; Sunde, M. Detecting the Distribution of Callery Pear (Pyrus calleryana) in an Urban US Landscape Using High Spatial Resolution Satellite Imagery and Machine Learning. Remote Sens. 2025, 17, 1453. [Google Scholar] [CrossRef]
- Wang, J.S.; Xu, C.D. Geographic detections: Principles and prospects. J. Geogr. 2017, 72, 116–134. [Google Scholar]
- Moore, L.J.; Hacker, S.D.; Breithaupt, J.; de Vries, S.; Miller, T.; Ruggiero, P.; Zinnert, J.C. Ecomorphodynamics of coastal foredune evolution. Nat. Rev. Earth Environ. 2025, 6, 417–432. [Google Scholar] [CrossRef]
- Urrutia-Reyes, C.A.; Cruz-Cárdenas, G.; Lina-Manjarrez, P.; Silva-García, J.T.; Ruelas-Monjardín, L.C.; Ceja-Torres, L.F. Urban landscape elements for better walkability in Xalapa’s historic circuit, Mexico. GeoJournal 2025, 90, 92. [Google Scholar] [CrossRef]
- Fentaw, H.W.; Campbell, S.; Caton, S. Exploring quantum control landscape and solution space complexity through optimization algorithms and dimensionality reduction. Sci. Rep. 2025, 15, 14605. [Google Scholar] [CrossRef]
- Burton, R.J.; Cuff, S.M.; Morgan, M.P.; Artemiou, A.; Eberl, M. GeoWaVe: Geometric median clustering with weighted voting for ensemble clustering of cytometry data. Bioinformatics 2023, 39, btac751. [Google Scholar] [CrossRef]
- Switalski, M.; Van Strien, M.; Gret-Regamey, A. Measuring place rather than space: Integrating landscape qualities for the urban-rural gradient using people’s perceptions and machine learning. J. Land. Use Sci. 2025, 20, 61–81. [Google Scholar] [CrossRef]
- Martinez-Sanchez, L.; Hufkens, K.; Kearsley, E.; Naydenov, D.; Czúcz, B.; van de Velde, M. Semantic segmentation dataset of Land Use/Cover Area frame Survey (LUCAS) rural landscape Street View Images. Data Brief. 2024, 54, 110394. [Google Scholar] [CrossRef] [PubMed]
- Brandolini, F.; Kinnaird, T.C.; Srivastava, A.; Costanzo, S.; Compostella, C.; Turner, S. Geoarchaeology reveals development of terrace farming in the Northern Apennines during the Medieval Climate Anomaly. Sci. Rep. 2025, 15, 24989. [Google Scholar] [CrossRef]
- Grano, M.C. Historic Water Mills as regenerative ecosystems: Integrating technologies, community engagement and sustainable landscape management. Cities 2025, 162, 105982. [Google Scholar] [CrossRef]
- Willett, E. Leading the Way: Working Towards Heritage-Led Nature Recovery in Natural England. Hist. Environ. Policy Pract. 2025, 16, 63–79. [Google Scholar] [CrossRef]
Disclaimer/Publisher’s Note: The statements, opinions and data contained in all publications are solely those of the individual author(s) and contributor(s) and not of MDPI and/or the editor(s). MDPI and/or the editor(s) disclaim responsibility for any injury to people or property resulting from any ideas, methods, instructions or products referred to in the content. |
© 2025 by the authors. Licensee MDPI, Basel, Switzerland. This article is an open access article distributed under the terms and conditions of the Creative Commons Attribution (CC BY) license (https://creativecommons.org/licenses/by/4.0/).