Design and Implementation of Health Monitoring System for an Airport Terminal Building with a Large-Span Truss Steel Structure
Abstract
1. Introduction
2. Engineering Background
3. Design and Application of Health Monitoring Systems
- (1)
- Targeted monitoring and analysis: According to the mechanical characteristics of the steel roof structure of the terminal building, finite element analysis is carried out. Moreover, cost effectiveness is considered to achieve a comprehensive understanding of the terminal situation in the most economical way.
- (2)
- Environmental adaptability and durability: Considering the climatic characteristics of the site, such as cold in winter, high summer temperatures, monsoons, and salt spray erosion in coastal areas, monitoring equipment and sensors must be designed to adapt to these environmental conditions.
- (3)
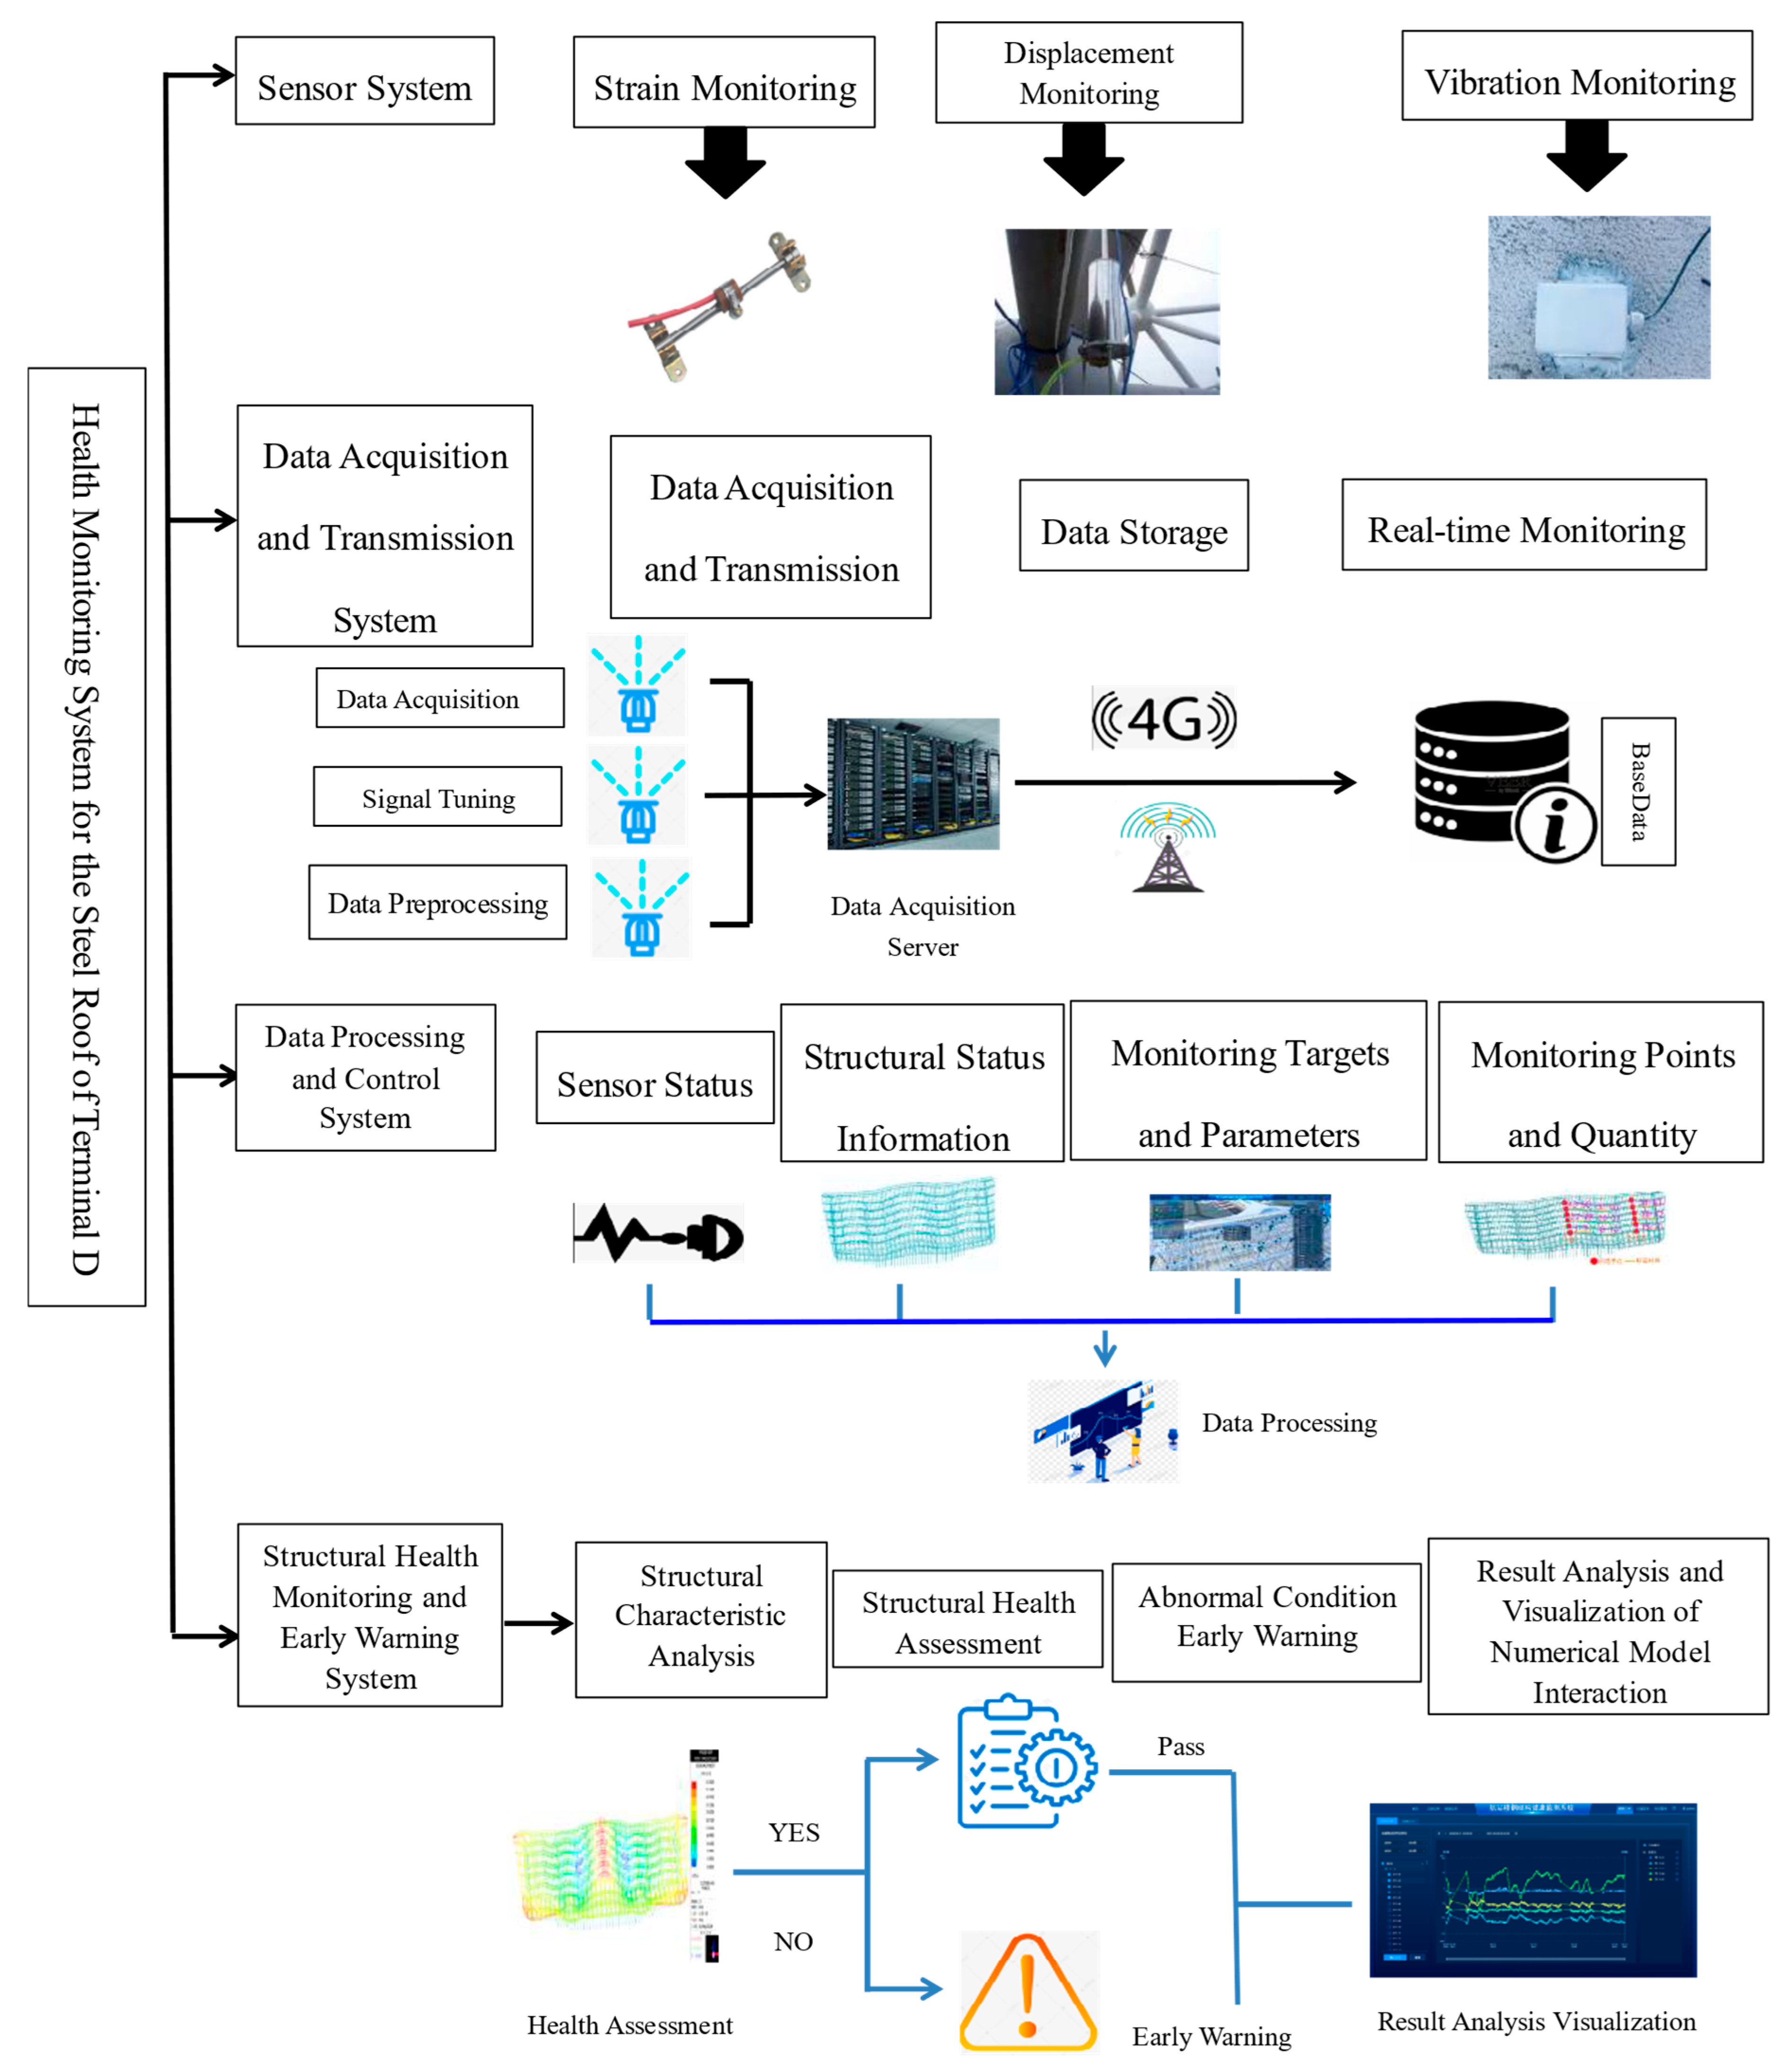
- Visual interface: The interface should clearly display the terminal’s three-dimensional model and monitoring data of the terminal, including real-time strain, displacement, and other information.
- (4)
- Automated monitoring: Terminal monitoring data can be displayed in real time, reducing the need for manual inspection. The system should also support mobile devices and remote access so that managers can easily monitor the status of the structure, ensuring continuity and real-time monitoring.
- (5)
- In the visual interface of the terminal steel roof structure health monitoring system, the service health status of the key rods monitored on site can be observed, and if the strain of a rod exceeds the predetermined threshold, the system can issue a warning to prevent unnecessary safety accidents in the terminal steel roof structure.
3.1. Functional Design of Health Monitoring Systems
3.2. Sensor System Functional Design
- (1)
- Intelligent Surface Vibrating Wire Strain Gauges
- (2)
- High-Intelligence Static Level Meter
- (3)
- Accelerometer
3.3. Main Monitoring Content and Sensor Placement
- (1)
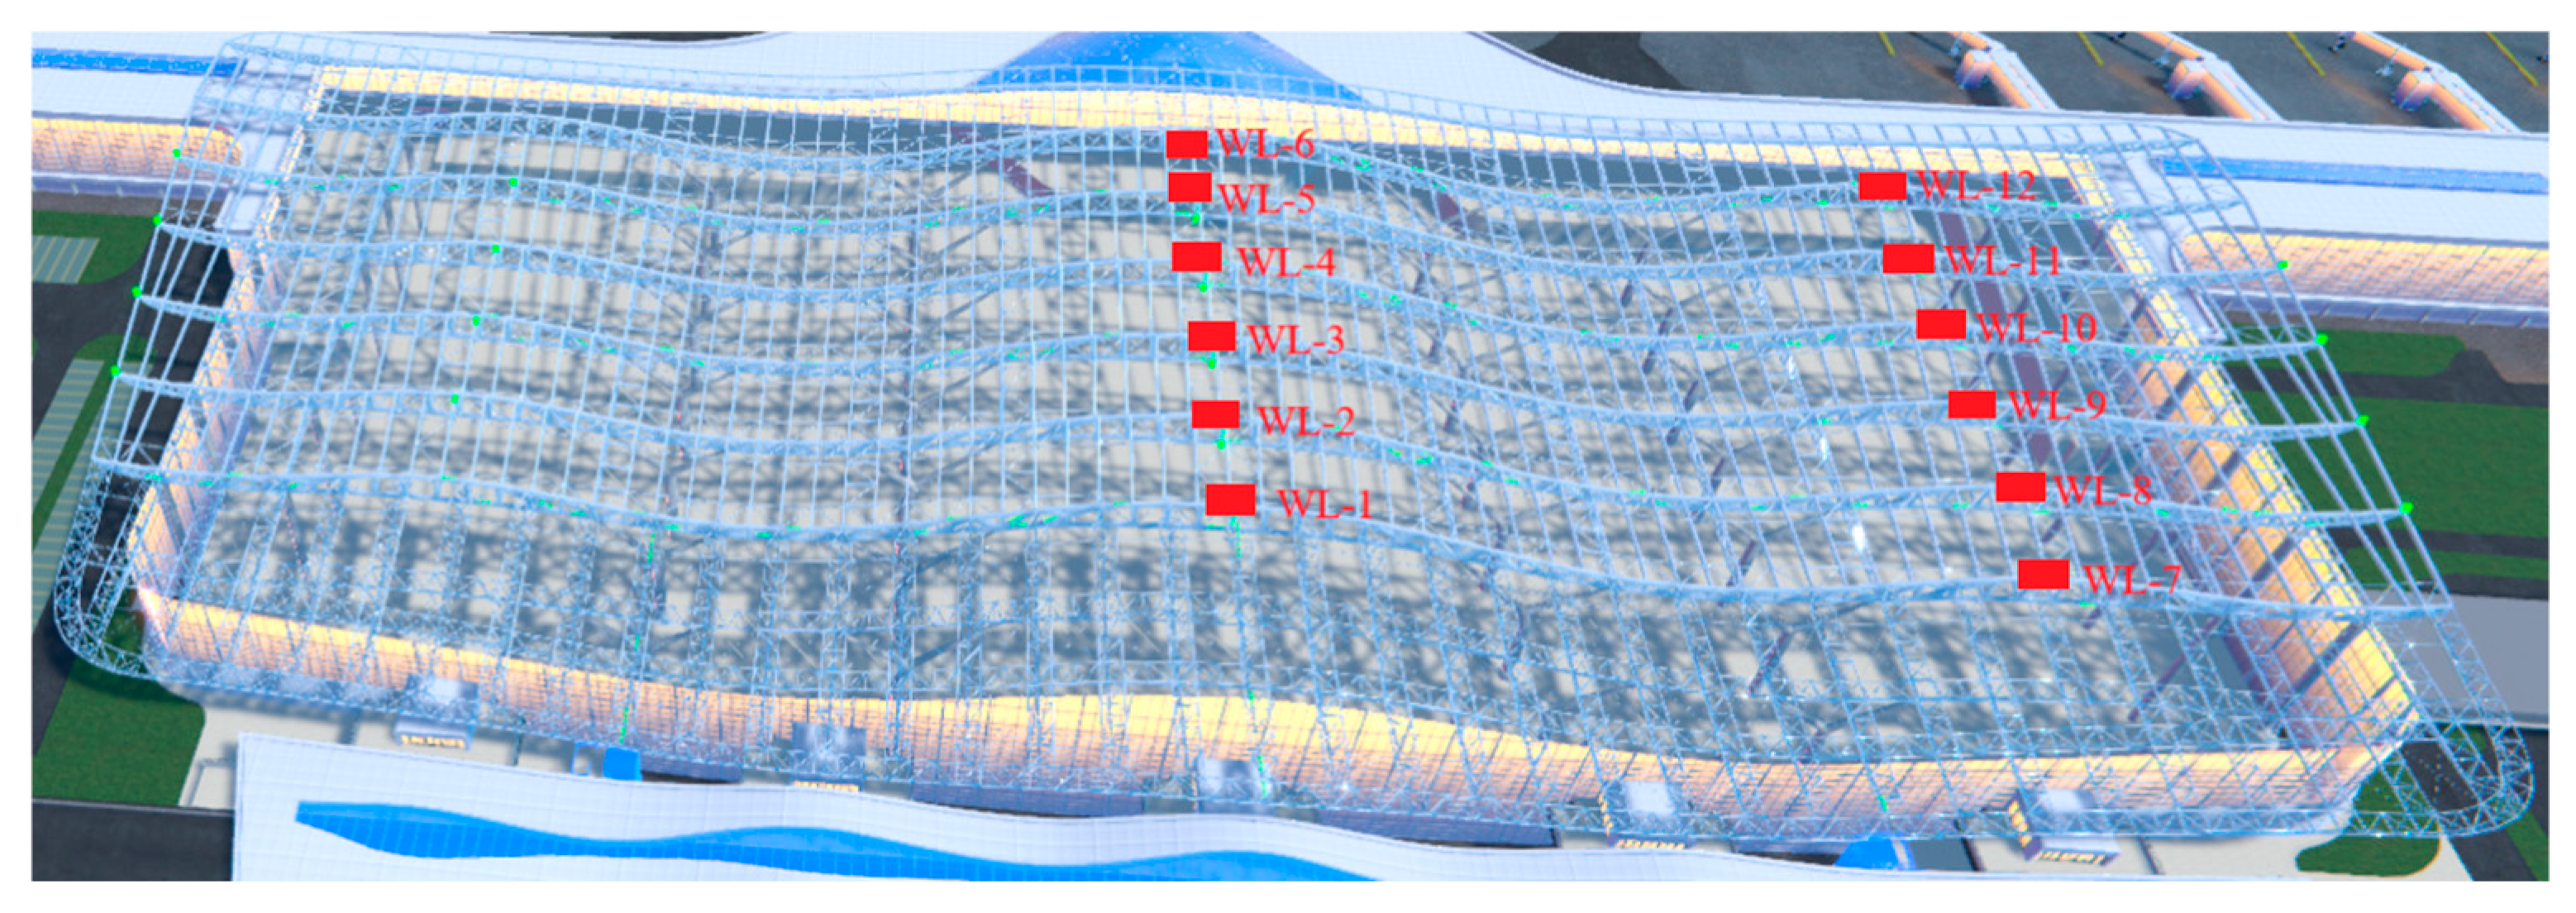
- Stress and strain monitoring of critical sections (including temperature monitoring at sensor locations);
- (2)
- Monitoring the overall displacement of the structure, including horizontal and vertical displacements;
- (3)
- Vibration monitoring of the structure as a whole and in local areas.
- (1)
- To determine the dynamic properties of the structure;
- (2)
- To provide fundamental data for the refinement of the structural finite element model and the safety assessment of the structure through monitoring the overall vibration signals.
3.4. Functions of the Health Monitoring System
- (1)
- Three-dimensional model display: A comprehensive 3D model of the airport terminal’s steel roof, developed using the Unity3D engine, provides an immersive and interactive scene navigation experience, showcasing structural details and the surrounding environment.
- (2)
- Navigation and interaction: Users can control the perspective with the mouse to navigate, view the full scope of the terminal, and access the locations and data of installed sensors, enabling intuitive interaction between the model and data.
- (3)
- Functional panels: The homepage integrates an environmental information panel, a sensor status panel, a monitoring point list panel, and a structure visibility panel, displaying meteorological information, sensor status, and detailed monitoring point information.
- (4)
- Monitoring status display: Real-time reflection of sensor online status, including normal online and abnormal status (highlighted in red), ensuring the timeliness and accuracy of monitoring data.
- (1)
- Real-time data display: The system displays real-time strain, temperature, displacement, and acceleration data monitored by various sensors, presenting them in graphical form for easy observation of data trends.
- (2)
- Historical data query: Supports querying historical sensor data by selecting specific dates or time periods (e.g., current day, past week, past month), with trends displayed in charts.
- (3)
- Data export function: Allows online display and querying of data, enabling users to select specific sensors and time periods to export data for local download and further analysis.
- (1)
- The system’s data analysis module allows for the comparative analysis of multiple sets of measured data from sensors, such as strain and temperature data from strain gauges, displacement data from displacement meters, and acceleration data from accelerometers. By comparatively analyzing the relationships between data indicators measured by different sensors, users can intuitively understand the correlations and trends in the data.
- (2)
- It provides visual chart displays for multiple datasets, enabling users to select and plot data from multiple sensors over any time period. The module also includes a cloud map display function for finite element analysis results.
4. Monitoring of Temperature Effects on Airport Terminals and Analysis of Structural Load Characteristics
4.1. The Impact of Temperature Effects on Structures
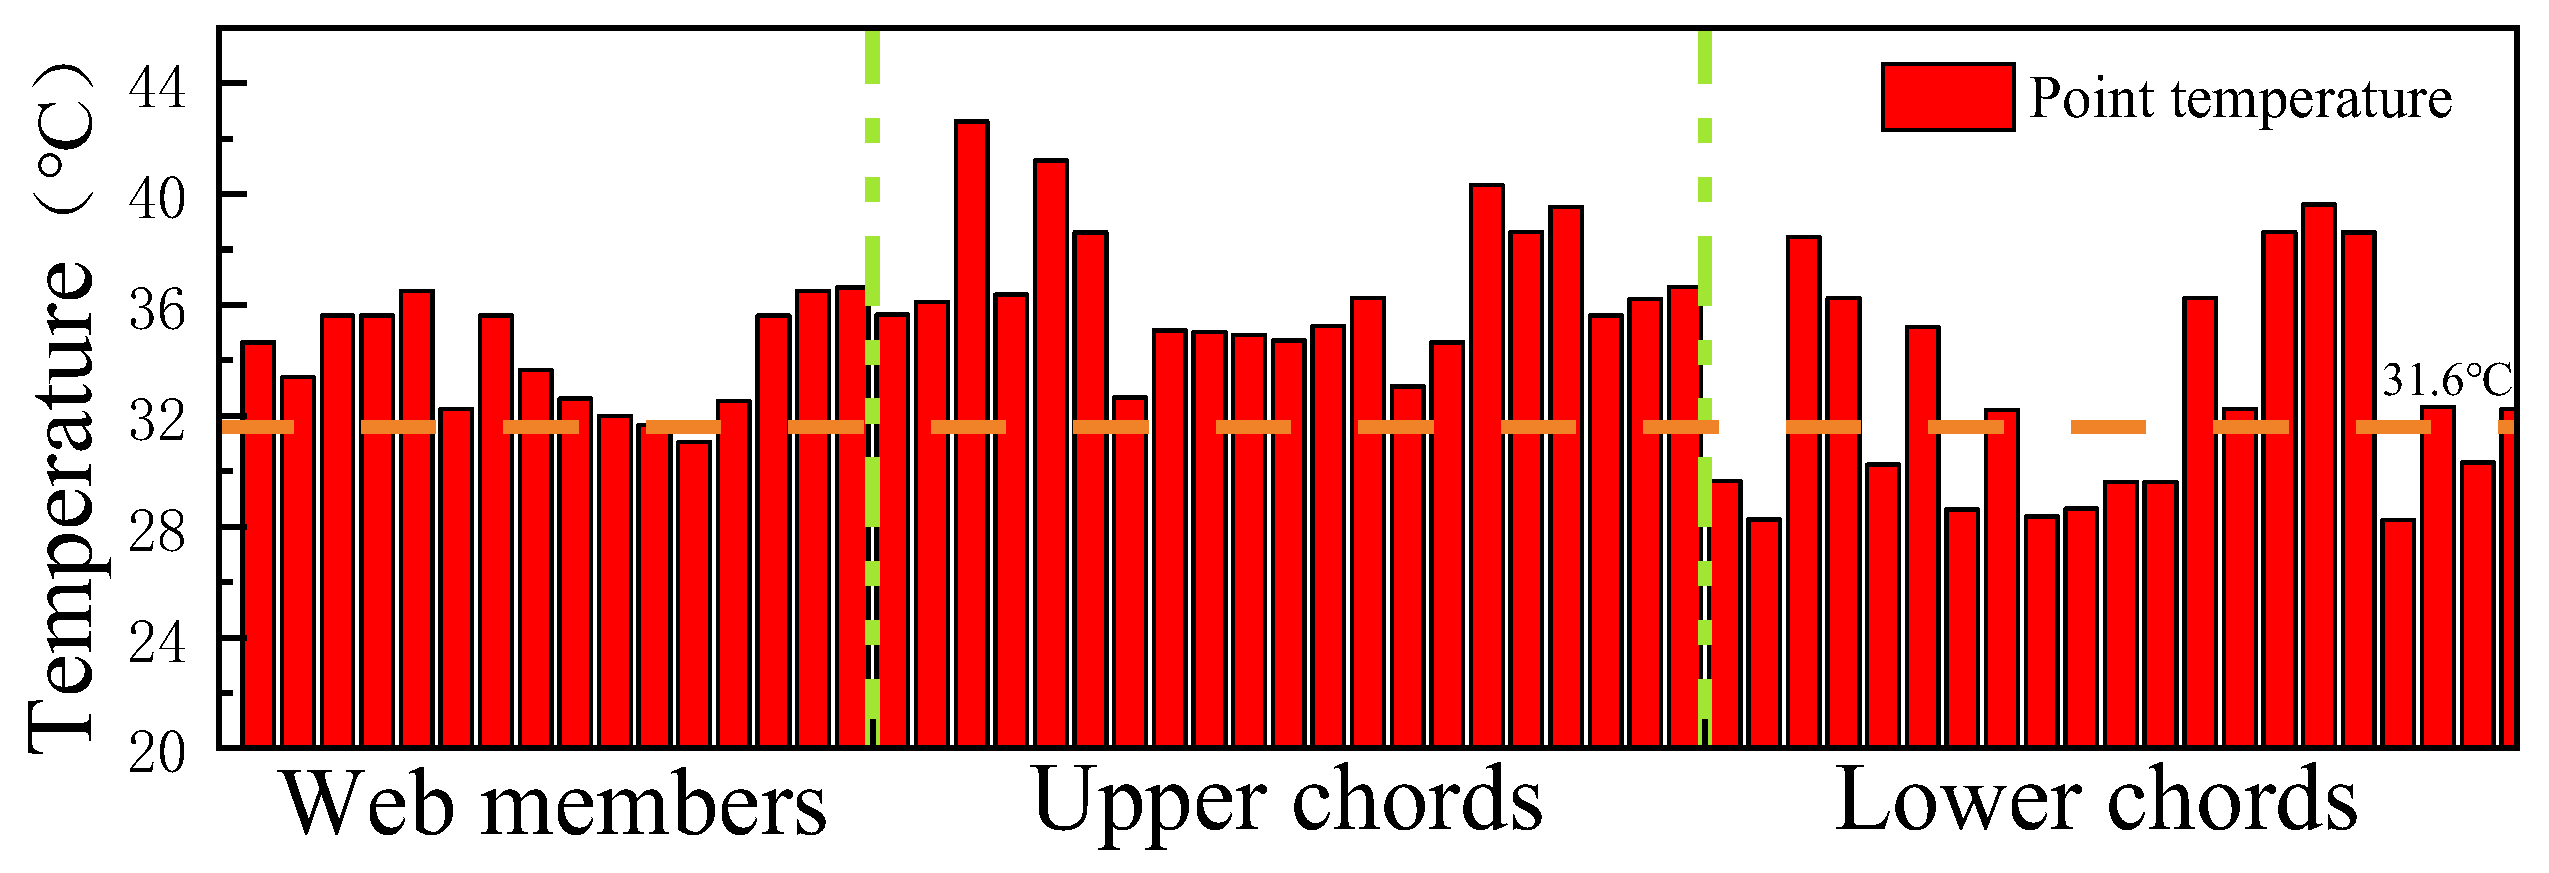
4.2. The Distribution Law of Structural Temperature Under Solar Radiation Conditions
4.3. The Distribution Law of Structural Temperature Under Without Solar Radiation Conditions
- (1)
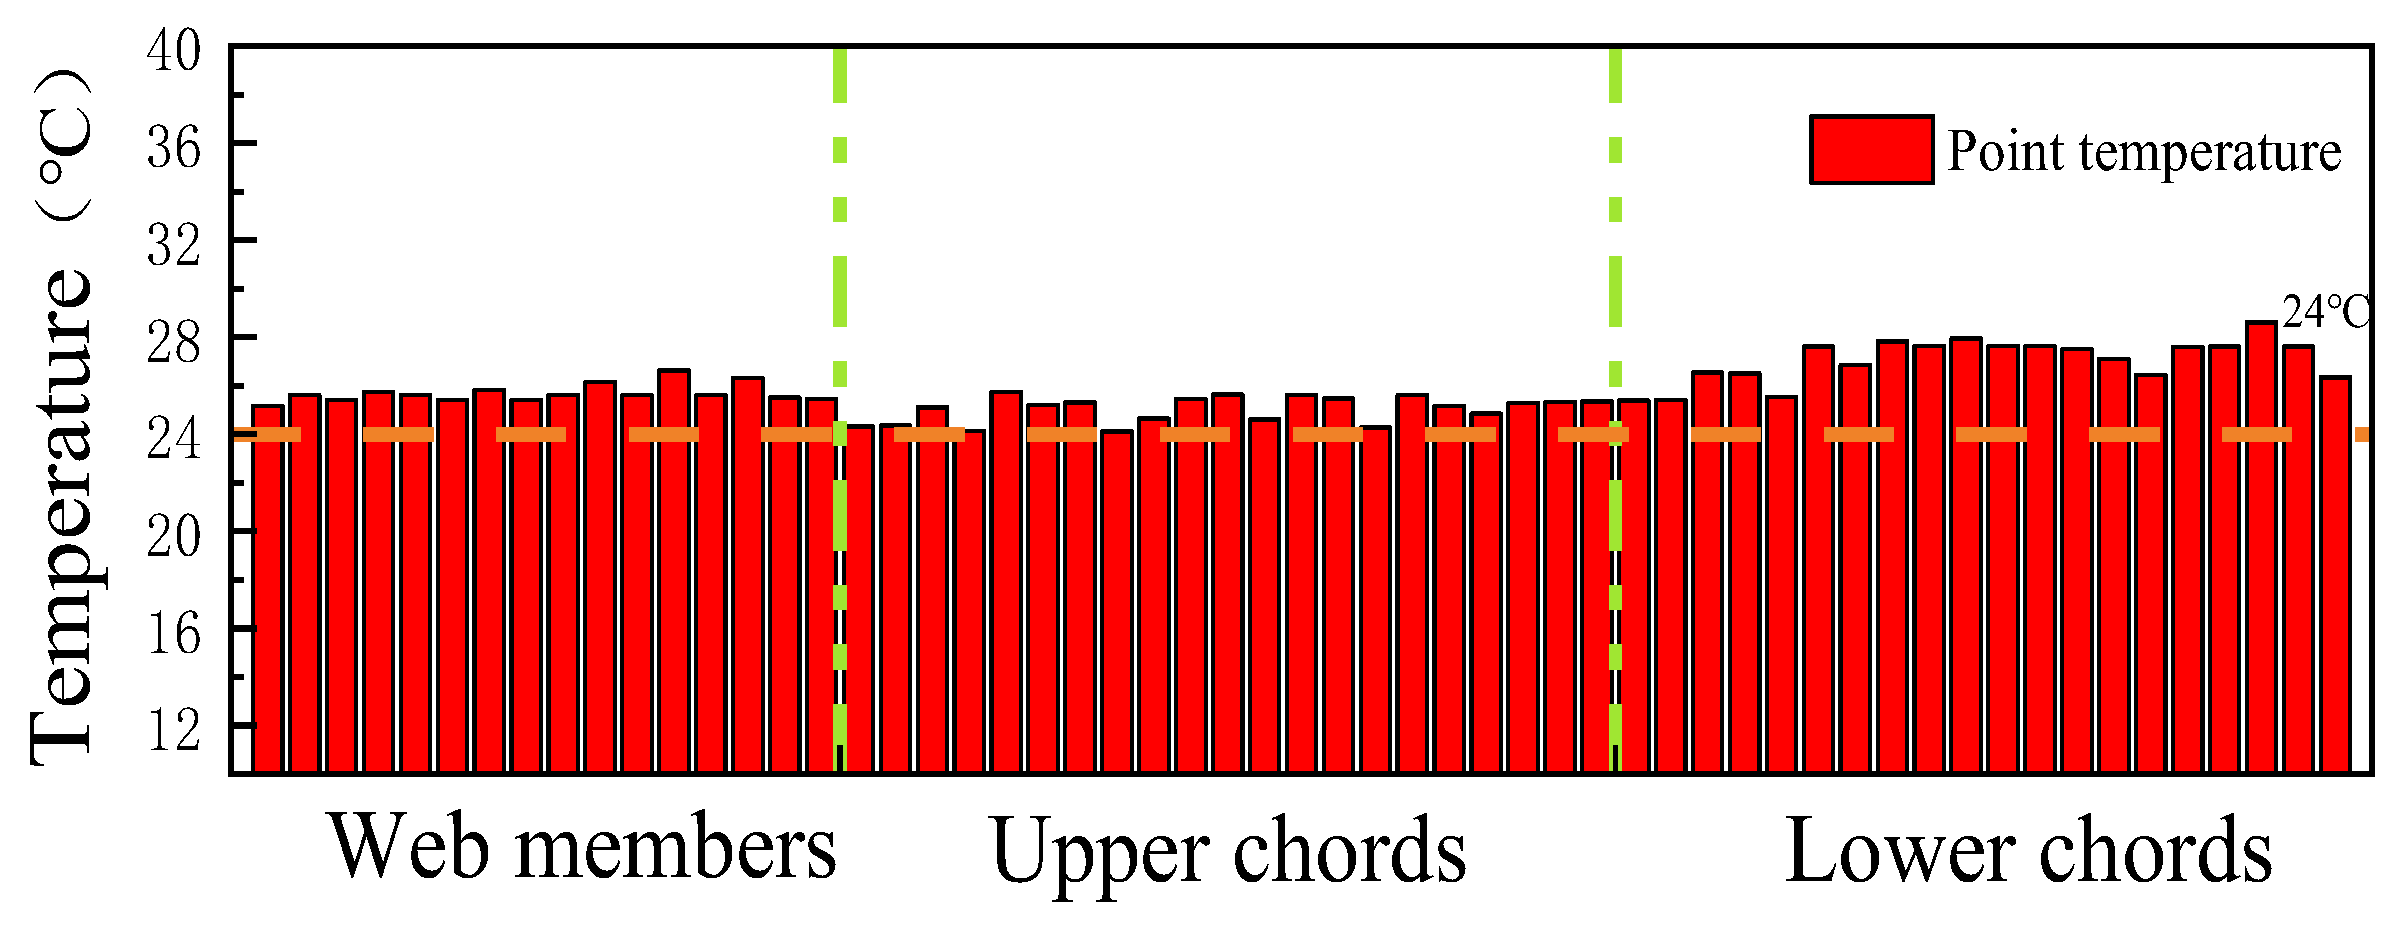
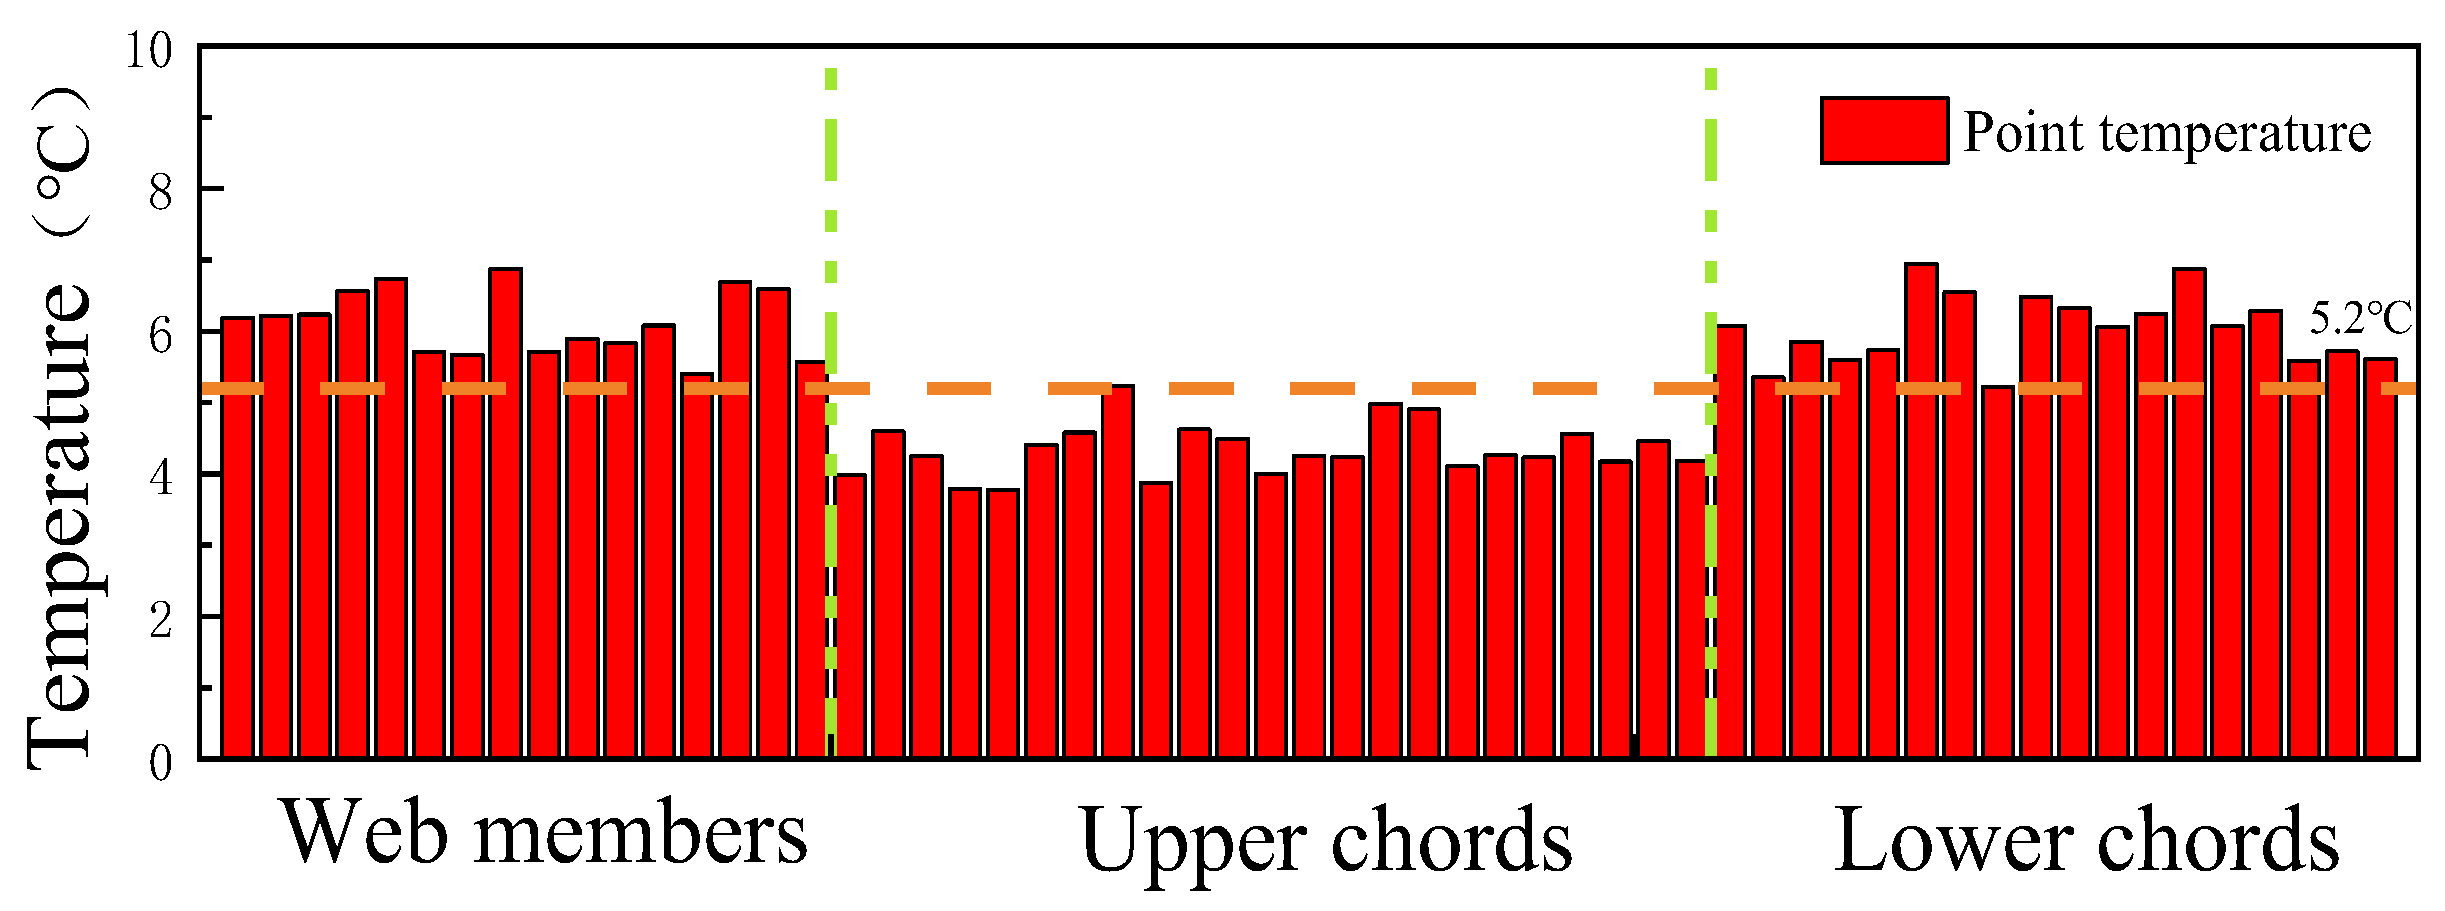
- Under without solar radiation conditions, the temperatures at each measuring point are close to the meteorological temperature, showing a more uniform distribution with a maximum temperature difference of no more than 3.23 °C.
- (2)
- Under without solar radiation conditions, the lower chord’s temperature is generally the highest, followed by the web member, and the upper chord is the lowest. This reveals that structural height significantly impacts temperature distribution. The temperature usually decreases with increasing structural height, which is closely related to the wind speed and ventilation conditions.
- (3)
- Under without solar radiation conditions, the temperature of each measuring point is generally higher than the average temperature in summer, but in winter, the upper chord’s temperature is lower than the average temperature, which indicates that the steel structure is more sensitive to the low-temperature environment.
4.4. Stress Variation Response Under the Action of Temperature
4.5. Structural Stress Variation Under Long-Term Temperature Effect
- (1)
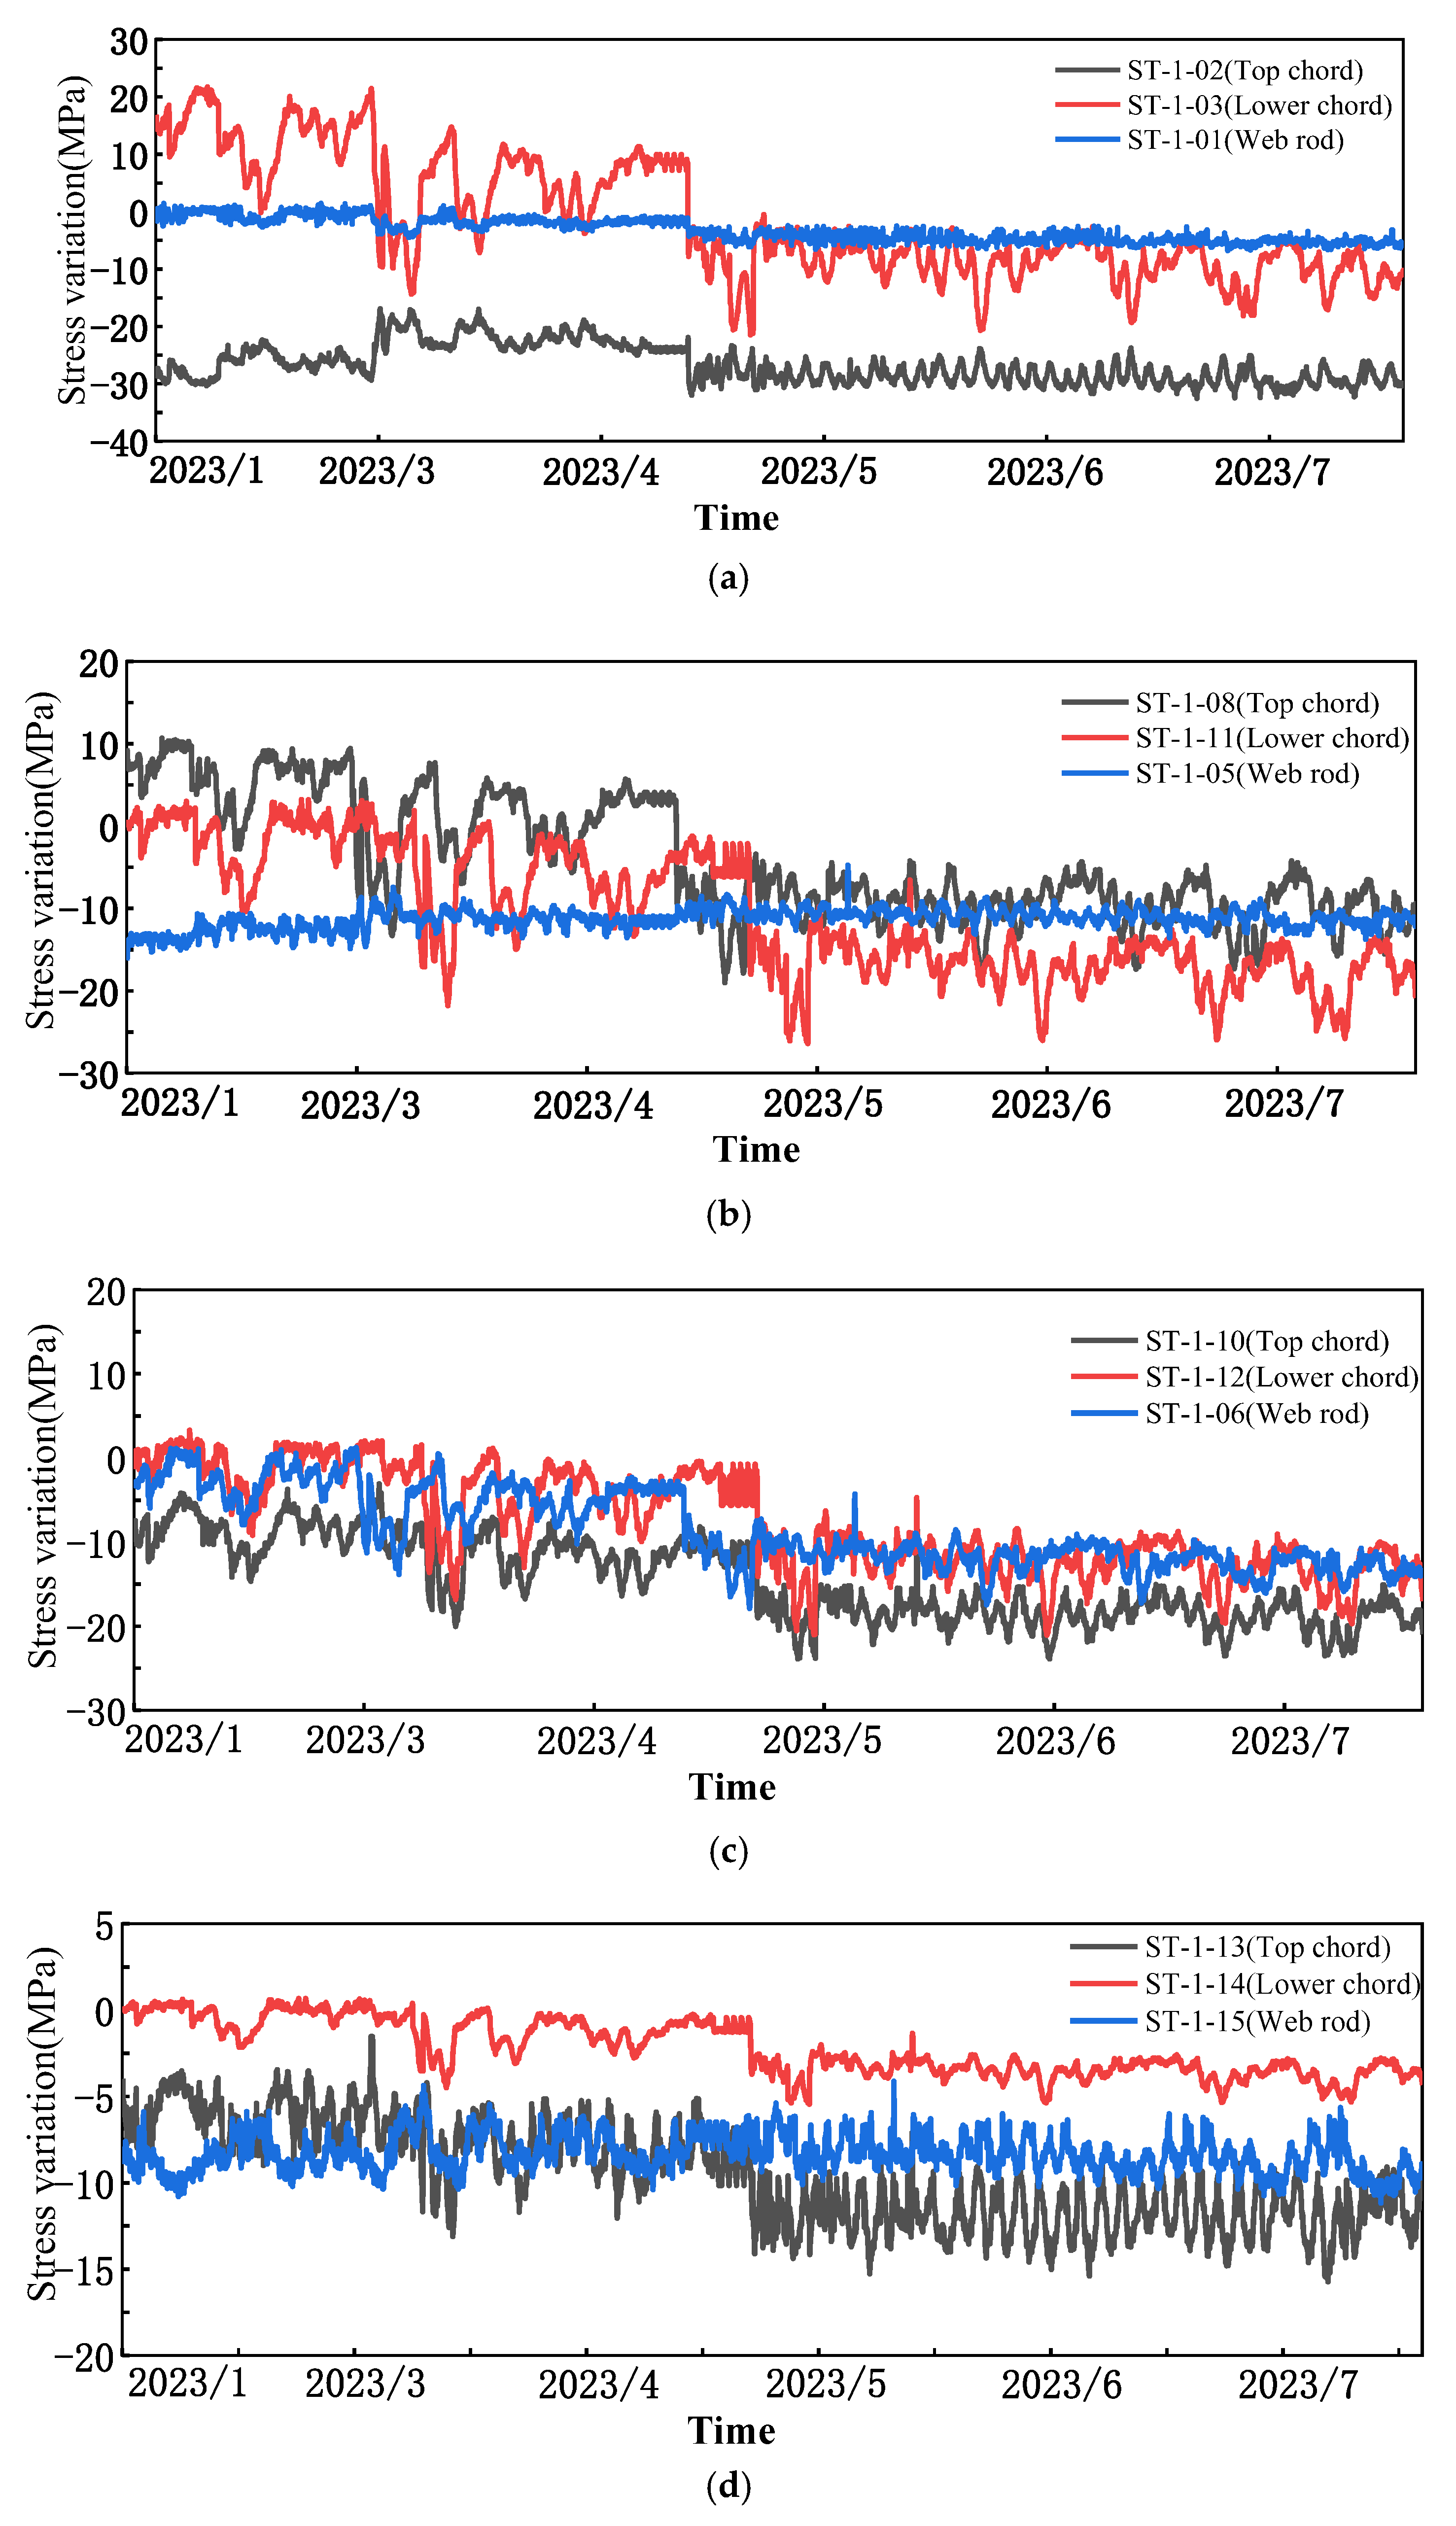
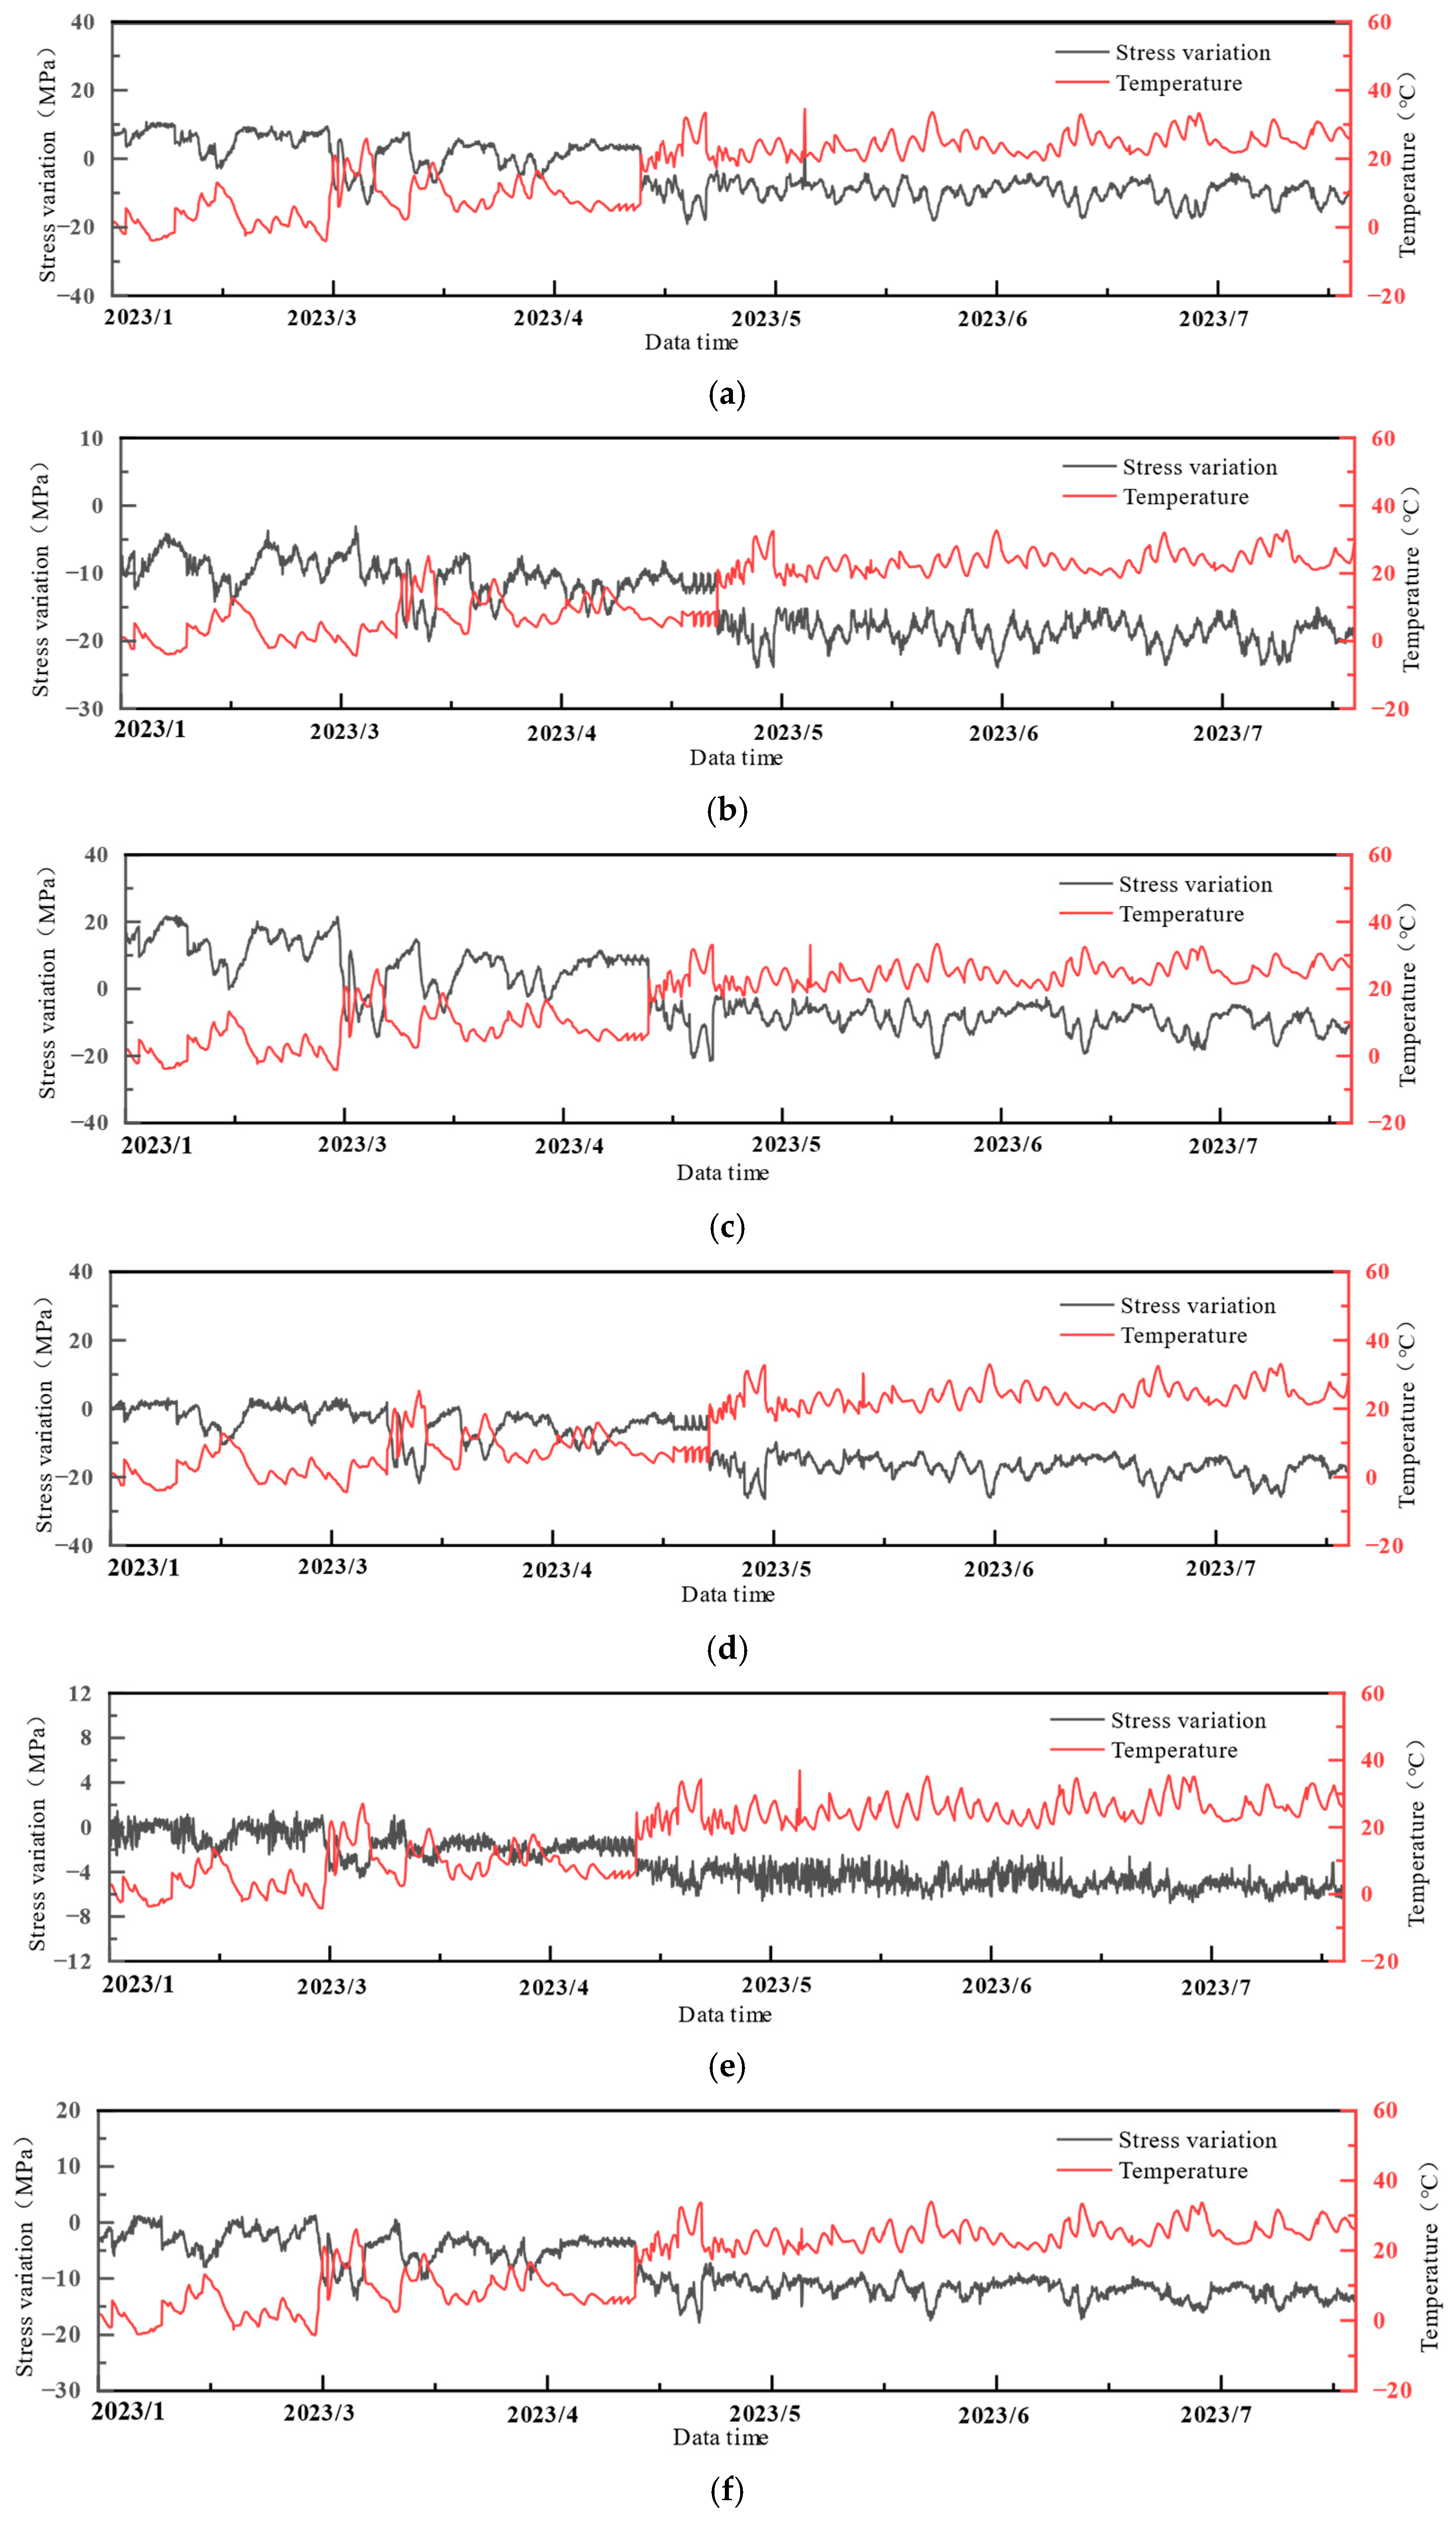
- The bars in different positions have different sensitivities to the temperature action. And the measuring points which are more sensitive to the temperature are mainly concentrated in the upper chords and the lower chords, especially the measuring point ST-1-03 (lower chord) located at the highest point of the main truss midspan. The stress change amplitude reaches 43.23 MPa. These members require special attention to ensure structural stability and safety.
- (2)
- The sensitivity of web members to temperature is generally weak, and the stress change amplitude is generally lower than that of the upper chord and the lower chord. However, the stress change in the measuring point ST-1-06 (diagonal web member) located at the Y-shaped column support is large.
- (3)
- The data shows that the stress values are significantly different in different months, which may be related to seasonal changes and corresponding temperature changes. The measuring point of the upper chord (for example, ST-1-02) has higher stress values in summer (May, June, July), possibly due to material expansion caused by high temperature. The measuring point of the lower chord (for example, ST-1-03) has higher stress values in winter (December, January), possibly due to material shrinkage in low temperatures. The lower chord is more sensitive to temperature changes, especially in winter.
4.6. Analysis of the Structural Force Characteristics Under Long-Term Temperature Effects
5. Prediction of Structural Stress Changes in Airport Terminals Based on BO-CNN-LSTM
5.1. BO-CNN-LSTM Hybrid Model for Structural Prediction
5.2. Experimental Environment and Data Sources
5.3. Predicted Results Based on Unilateral Point Correlation
5.4. Predicted Results Based on Multi-Point Correlation
5.5. Prediction Based on the Temperature Correlation
5.6. Performance Analysis of the BO-CNN-LSTM Prediction Model
6. Conclusions
- (1)
- The designed and implemented monitoring system, through a sensor network, monitors key physical quantities (stress, displacement, temperature, etc.) in real time, enhancing the knowledge of the structural health status and providing a scientific basis for safety assessment. The application of this system has proven its practicality in the field of steel structure health monitoring.
- (2)
- On the basis of a large amount of measured data, the monitoring and force characteristics of airport terminal steel structures under the action of temperature were explored. Through linear regression analysis, the impact of temperature changes on stress was quantified, confirming that temperature changes have a significant effect on structural stress, especially in the upper and lower chords. This study provides a reference for future research on structural health monitoring and performance assessment.
- (3)
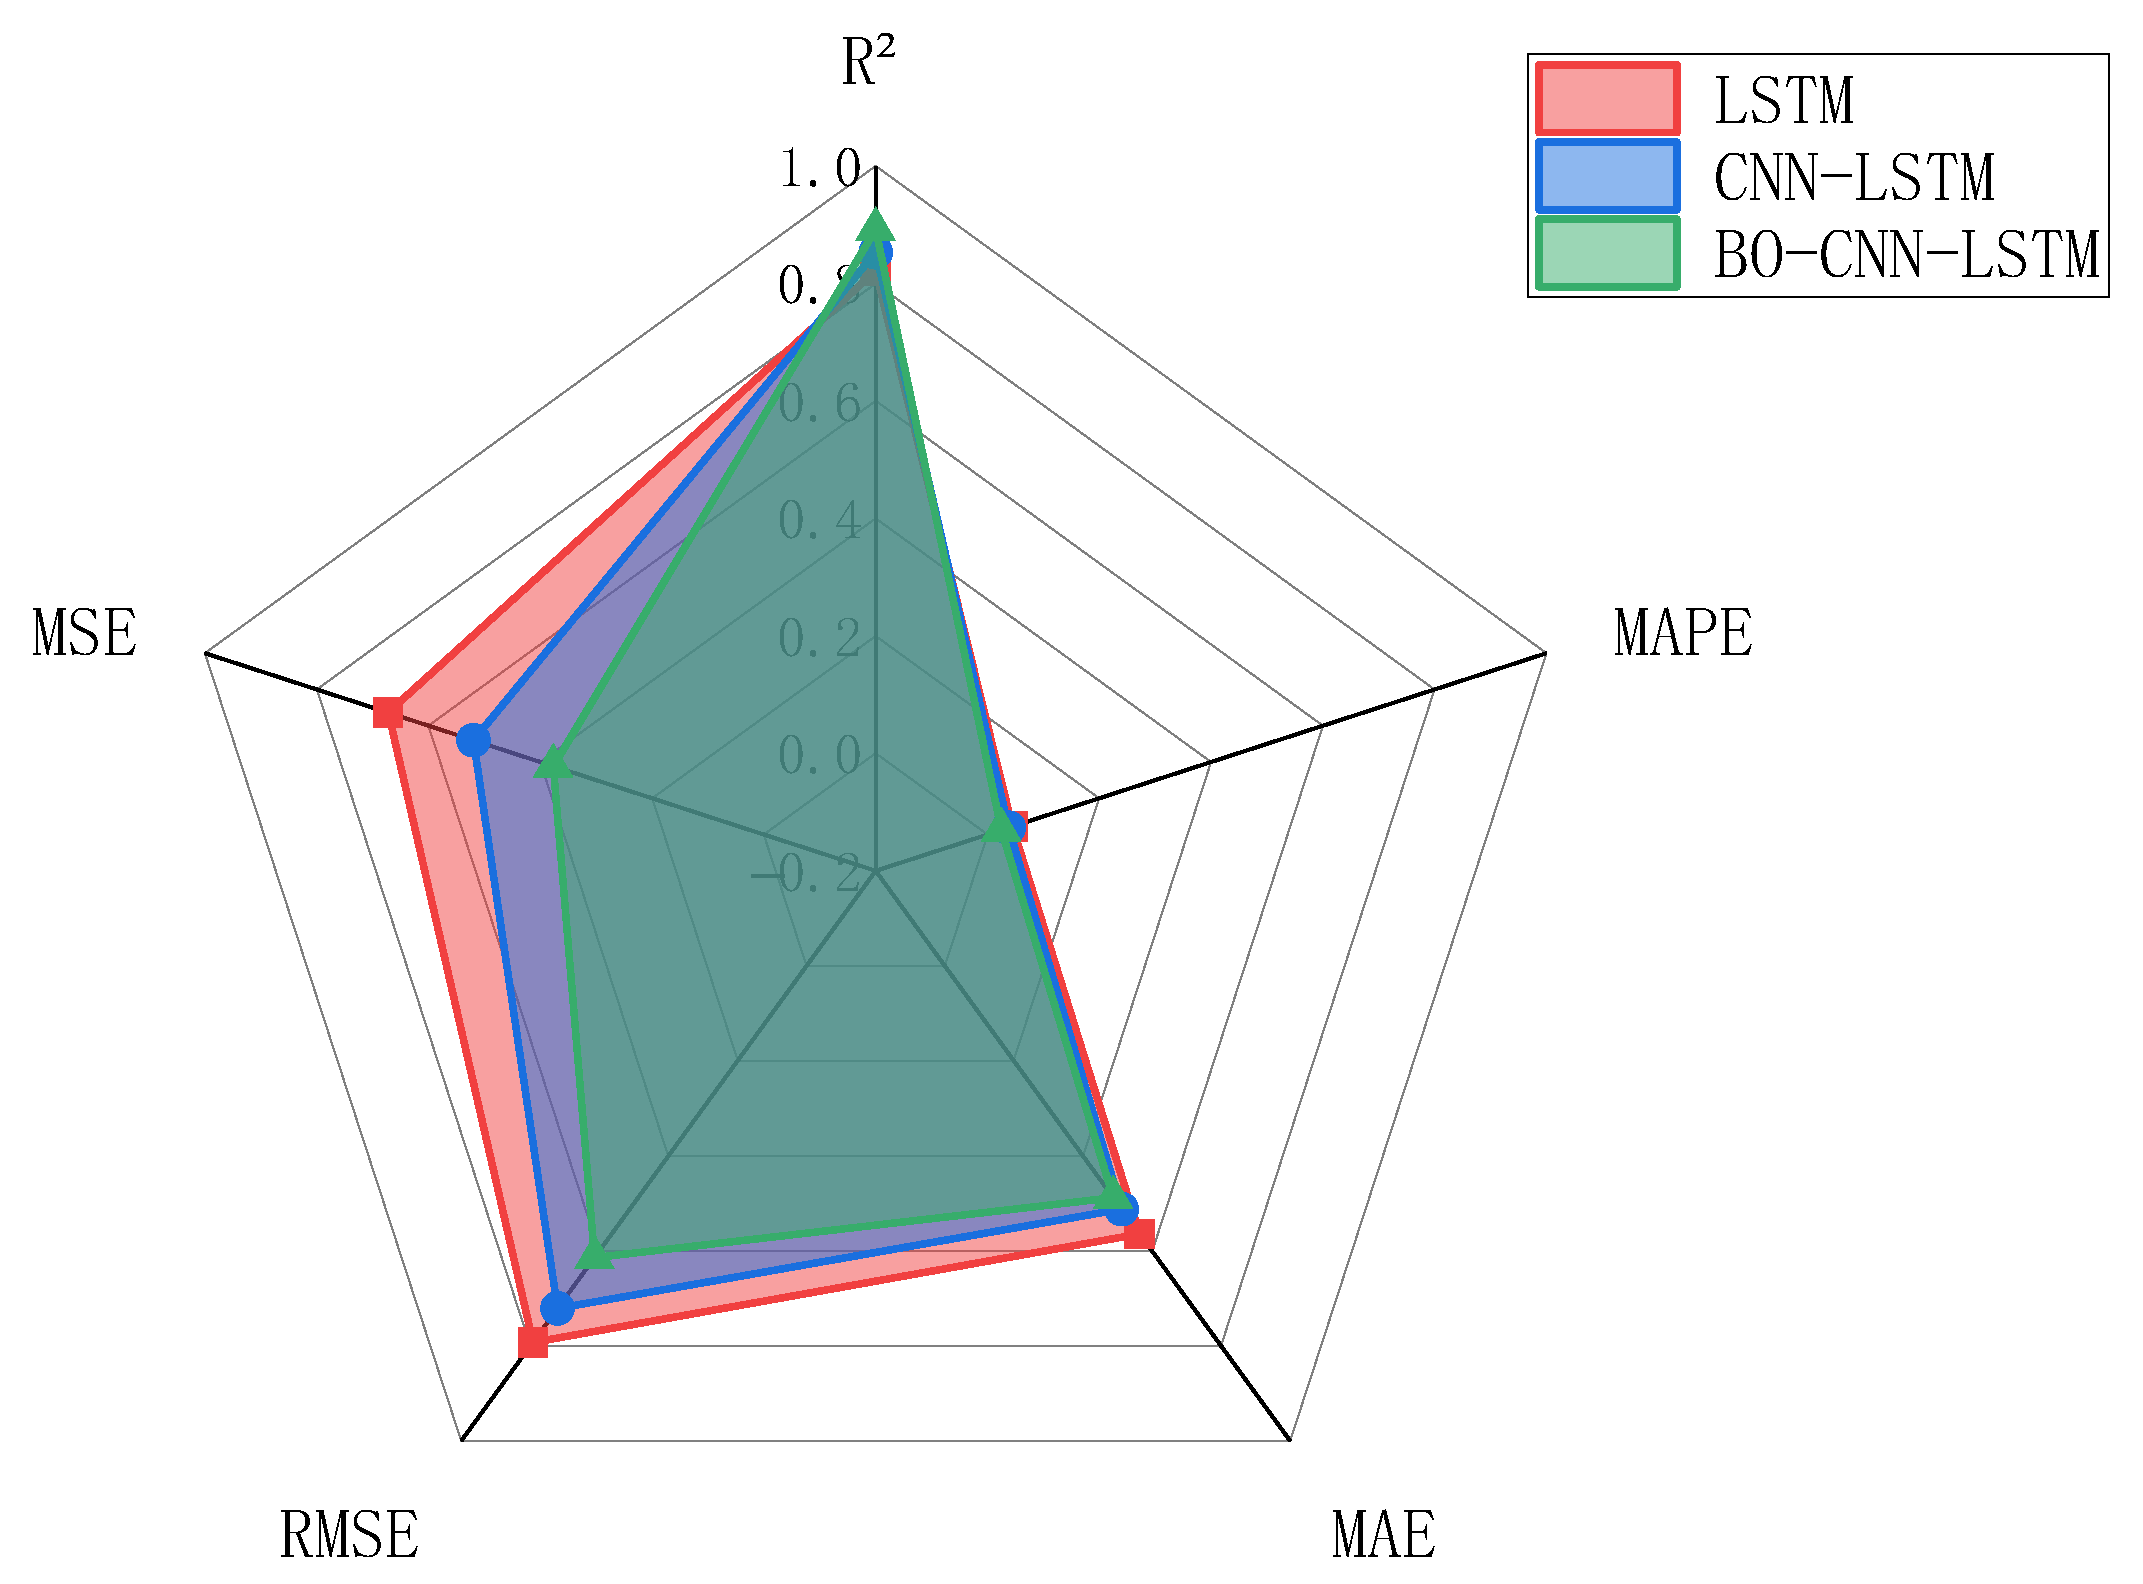
- A BO-CNN-LSTM hybrid prediction model was designed, which demonstrates greater accuracy and reliability in predicting structural stress changes than traditional methods. By comparing three prediction methods (single measurement point correlation, multiple measurement point correlation, and temperature correlation), it was found that the BO-CNN-LSTM model surpasses the LSTM and CNN-LSTM models in various performance evaluation indexes and can effectively integrate various influencing factors and enhance prediction accuracy. In particular, in multiple measurement point correlation prediction, the model can effectively capture the stress variation patterns of a structure under different environmental conditions, providing support for real-time monitoring and early warning.
Author Contributions
Funding
Data Availability Statement
Conflicts of Interest
Correction Statement
References
- Wang, X.L.; Ran, Y.H.; Zhu, Y.P. Research on Health Monitoring for Large Span Steel Structures. In Proceedings of the 17th Biennial International Conference on Engineering, Science, Construction, and Operations in Challenging Environments, Virtual, 19–23 April 2021. [Google Scholar]
- Tang, B.J.; Zhang, X.; Xia, Z.Y.; Shi, H.Y. Construction process monitoring of a large-span steel truss roof based on response-increment comparison strategy. Meas. Sci. Technol. 2024, 35, 025001. [Google Scholar] [CrossRef]
- Xu, C.; Lei, H.; Wang, G. Fatigue life and fatigue reliability assessment for long-span spatial structure based on long-term health monitoring data. Structures 2023, 47, 586–594. [Google Scholar] [CrossRef]
- Svendsen, B.T.C.; Frøseth, G.T.; Øiseth, O.A.; Rönnquist, A.N. A data-based structural health monitoring approach for damage detection in steel bridges using experimental data. J. Civ. Struct. Health Monit. 2021, 12, 101–115. [Google Scholar] [CrossRef]
- Li, X.; Xie, L.; Lu, W.; Xue, S.; Hong, C.; Lan, W.; Shi, Q. Structural health monitoring of a historic building during uplifting process: System design and data analysis Structural. Health Monit. Int. J. 2023, 22, 3165–3188. [Google Scholar] [CrossRef]
- Keshmiry, A.; Hassani, S.; Mousavi, M.; Dackermann, U. Effects of Environmental and Operational Conditions on Structural Health Monitoring and Non-Destructive Testing: A Systematic Review. Buildings 2023, 13, 918. [Google Scholar] [CrossRef]
- Sahar, H.; Ulrike, D. A Systematic Review of Advanced Sensor Technologies for Non-Destructive Testing and Structural Health Monitoring. Sensors 2023, 23, 2204. [Google Scholar] [CrossRef]
- Tang, D.Y.; Wei, X.B.; Sun, Z.H.; WANG, R.C. Research on Structural Health Monitoring System. Intell. Build. Smart City 2023, 8, 6–11. (In Chinese) [Google Scholar]
- Li, X.; Zhang, F.-L.; Xiang, W.; Liu, W.-X.; Fu, S.-J. Structural health monitoring system based on digital twins and real-time data-driven methods. Structures 2024, 70, 107739. [Google Scholar] [CrossRef]
- Desjardins, S.L.; Lau, D.T. Enhanced operational modal analysis and change point detection for vibration-based structural health monitoring of bridges. J. Infrastruct. Intell. Resil. 2024, 3, 100121. [Google Scholar] [CrossRef]
- Alsehaimi, A.; Houda, M.; Waqar, A.; Hayat, S.; Waris, F.A.; Benjeddou, O. Internet of things (IoT) driven structural health monitoring for enhanced seismic resilience: A rigorous functional analysis and implementation framework. Results Eng. 2024, 22, 102340. [Google Scholar] [CrossRef]
- Mayank, M.; Lourenço, P.B.; Ramana, G.V. Structural health monitoring of civil engineering structures by using the internet of things: A review. J. Build. Eng. 2022, 48, 103954. [Google Scholar] [CrossRef]
- Tang, Z.; Chen, Z.; Bao, Y.; Li, H. Convolutional neural network-based data anomaly detection method using multiple information for structural health monitoring. Struct. Control Health Monit. 2019, 26, e2296. [Google Scholar] [CrossRef]
- Zhao, H.; Zhang, X.; Ding, Y.; Guo, T.; Li, A.; Soh, C.-K. Probabilistic mixture model driven interpretable modeling, clustering, and predicting for physical system data. Eng. Appl. Artif. Intell. 2025, 160, 112–160. [Google Scholar] [CrossRef]
- Gong, X.; Song, X.; Li, G.; Xiong, W.; Cai, C.S. Deep learning based anomaly identification of temperature effects in bridge structural health monitoring data. Structures 2024, 69, 107478. [Google Scholar] [CrossRef]
- Zhou, M.; Fan, J.-S.; Liu, Y.-F.; Zhang, J.-X.; Duan, X.-J.; Lei, S.-S. Non-uniform temperature field and effect on construction of large-span steel structures. Autom. Constr. 2020, 119, 103339. [Google Scholar] [CrossRef]
- Sun, S.; Wang, Z.; Xia, Z.; Yi, L.; Yue, Z.; Ding, Y. The Temperature-Induced Deflection Data Missing Recovery of a Cable-Stayed Bridge Based on Bayesian Robust Tensor Learning. Symmetry 2023, 15, 1234. [Google Scholar] [CrossRef]
- Chen, C.B.; Tang, L.Q.; Lu, Y.H.; Wang, Y.; Liu, Z.J.; Liu, Y.P.; Zhou, L.C.; Jiang, Z.Y.; Yang, B. Reconstruction of long-term strain data for structural health monitoring with a hybrid deep-learning and autoregressive model considering thermal effects. Eng. Struct. 2023, 285, 116063. [Google Scholar] [CrossRef]
- Luo, Y.; Mei, Y.; Shen, Y.; Yang, P. Field measurement of temperature and stress on steel structure of the National Stadium and analysis of temperature action. J. Build. Struct. 2013, 34, 24–32. (In Chinese) [Google Scholar]
- Mei, Y.J. Research on the Performance of the National Stadium’s Steel Structure Under Environmental Loads by Field Measurements. Master’s Thesis, Zhejiang University, Hangzhou, China, 2013. (In Chinese). [Google Scholar]
- Wu, S.W. Research on Steel Health Monitoring Scheme and Safety Early Warning of Taiyuan South Station. Master’s Thesis, Taiyuan University of Technology, Taiyuan, China, 2017. (In Chinese). [Google Scholar]
- Liu, F. Design of Qingdao Jiaodong International Airport Health Monitoring System and Numerical Simulation Analysis of Data Missing Repair. Master’s Thesis, Qingdao University of Technology, Qingdao, China, 2019. (In Chinese). [Google Scholar]
- Wang, G.Y. Design and Application of Stadium Structure Health Monitoring System; Inner Mongolia University of Science & Technology: Baotou, China, 2020. (In Chinese) [Google Scholar]
- Xu, X.; Shi, C.; Ren, Y.; Fan, Z.; Guo, Z.; Zeng, X.; Jin, Y.; Huang, Q. Probabilistic anomaly detection considering multi-level uncertainties for cable-stayed bridges. Structures 2023, 58, 105448. [Google Scholar] [CrossRef]
- Luo, Y.Z.; Shen, Y.B.; Tong, R.F.; Wang, X.B. Health Monitoring and Early Warning Technology in Spatial Structure. Constr. Technol. 2009, 38, 4–8. (In Chinese) [Google Scholar]
- Shen, Y.B.; Luo, Y.Z.; Fu, W.W.; Zhang, Z.Y.; Cai, P.C. Structural health monitoring and analysis of main stadium of the Hangzhou Asian Games. J. Build. Struct. 2024, 45, 81–91. (In Chinese) [Google Scholar]
- Luo, Y.Z.; Zhao, J.Y. Research status and future prospects of space structure health monitoring. J. Build. Struct. 2022, 43, 16–28. (In Chinese) [Google Scholar]
- Aktan, E.; Bartoli, I.; Glišić, B.; Rainieri, C. Lessons from Bridge Structural Health Monitoring (SHM) and Their Implications for the Development of Cyber-Physical Systems. Infrastructures 2024, 9, 30. [Google Scholar] [CrossRef]
- Chiara, G.; Giulio, M.; Tommaso, P.; Domenico, A. BIM-based design and setup of structural health monitoring systems. Autom. Constr. 2024, 158, 105245. [Google Scholar]
- Mohsen, E.; Mohsen, G.A.; Omid, B. Integrated Bridge Structural Health Monitoring System. Iran. J. Sci. Technology. Trans. Civ. Eng. 2023, 48, 149–168. [Google Scholar]
- Ur, R.S.; Usman, M.; Younus, T.M.H.; Ali, H.Q. Advancing structural health monitoring: A vibration-based IoT approach for remote real-time systems. Sens. Actuators A. Phys. 2024, 365, 114863. [Google Scholar]
- Shafiqah, A.A.; Abdul, K.S.; Adiza, J.; Kamaliah, M.N.; Kunitomo, S.M. Recent vibration-based structural health monitoring on steel bridges: Systematic literature review. Ain Shams Eng. J. 2024, 15, 102501. [Google Scholar]
- Chen, W.P.; Yu, J.X.; Weng, Y.H.; Wu, J.P.; Xie, B.F. Application Analysis of Structural Health Monitoring Sensors in Civil Engineering. Sichuan Cem. 2023, 5, 86–88. (In Chinese) [Google Scholar]
- Zhou, J.C.; Liu, Y.H.; Chen, A.; Zhang, J. State identification of lateral vibration of rail vehicle body based on BO-CNN-LSTM. J. Railw. Sci. Eng. 2024, 21, 3900–3910. (In Chinese) [Google Scholar]
- Chen, X.Y. CNN-LSTM Stock Price Prediction Model Based on Bayesian Optimization. Master’s Thesis, Lanzhou University, Lanzhou, China, 2023. (In Chinese). [Google Scholar]








| Standard Range | 3000 με |
|---|---|
| Sensitivity | 1 με |
| Temperature Range | −20 to + 125 °C |
| Manual Data Acquisition Method | Collected using a universal readout unit |
| Automated Data Acquisition Method | Requires connection to a system via a processor for automated data acquisition |
| Installation Method | Spot-welded on the surface of steel structures with an additional protective cover |
| Item | Technical Specifications |
|---|---|
| Measurement Range | ±2.0 g |
| Frequency Response Range | DC–120 Hz |
| Nonlinearity | ≤1% FS |
| Dynamic Range | 120 dB |
| Resolution | 10 μg |
| Sensitivity | Low Sensitivity: ±2.5 V/g |
| Types of Temperature Loads | Influencing Factors | Temporal Characteristics | Distribution | Degree of Impact |
|---|---|---|---|---|
| Daily Temperature Variations | Ambient Temperature Changes | Long-term | Overall | Moderate Impact |
| Sudden Temperature Increase | Abrupt Temperature Rise, such as in a Fire | Short-term | Local | Significant Impact |
| Sudden Temperature Decrease | Abrupt Temperature Drop, such as in Extreme Cold Weather | Short-term | Overall | Significant Impact |
| Seasonal Temperature Changes | Temperature Fluctuations Induced by Seasonal Changes | Long-term | Overall | Moderate Impact |
| Measurement Point | Member Position | Pearson Correlation Coefficient | |
|---|---|---|---|
| January | July | ||
| Measurement point ST-1-06 (Web member) | Support location | −0.95 | −0.92 |
| Measurement point ST-5-15 (Web member) | Non-support location | 0.94 | 0.86 |
| Measurement point ST-1-03 (Lower chord) | Non-support location | −0.97 | −0.95 |
| Measurement point ST-5-14 (Lower chord) | Support location | 0.97 | 0.87 |
| Measurement point ST-1-08 (Upper chord) | Non-support location | −0.94 | −0.88 |
| Measurement point ST-5-10 (Upper chord) | Non-support location | −0.92 | −0.87 |
| Measurement Point | Member Type | R2 | K | Equation |
|---|---|---|---|---|
| ST-1-08 | Upper Chord | 0.953 | −0.718 | Y = −0.718X + 7.841 |
| ST-1-10 | Upper Chord | 0.951 | −0.479 | Y = −0.479X − 7.441 |
| ST-1-03 | Lower Chord | 0.976 | −1.021 | Y = −1.021X + 15.640 |
| ST-1-11 | Lower Chord | 0.979 | −0.767 | Y = −0.767X + 0.856 |
| ST-1-1 | Web Member | 0.857 | −0.176 | Y = −0.176X − 0.182 |
| ST-1-06 | Web Member | 0.977 | −0.452 | Y = −0.452X − 0.890 |
| Reference Measurement Point Number | Relative Position to Measurement Point ST-1-10 | Evaluation Index | |||
|---|---|---|---|---|---|
| MAPE | MAE | RMSE | R2 | ||
| ST-1-11 | Within the Near-Distance Region | 0.036 | 0.681 | 0.853 | 0.793 |
| ST-1-12 | Within the Mid-Distance Region | 0.044 | 0.848 | 1.032 | 0.697 |
| ST-1-13 | Within the Distant Region | 0.081 | 1.602 | 2.147 | 0.511 |
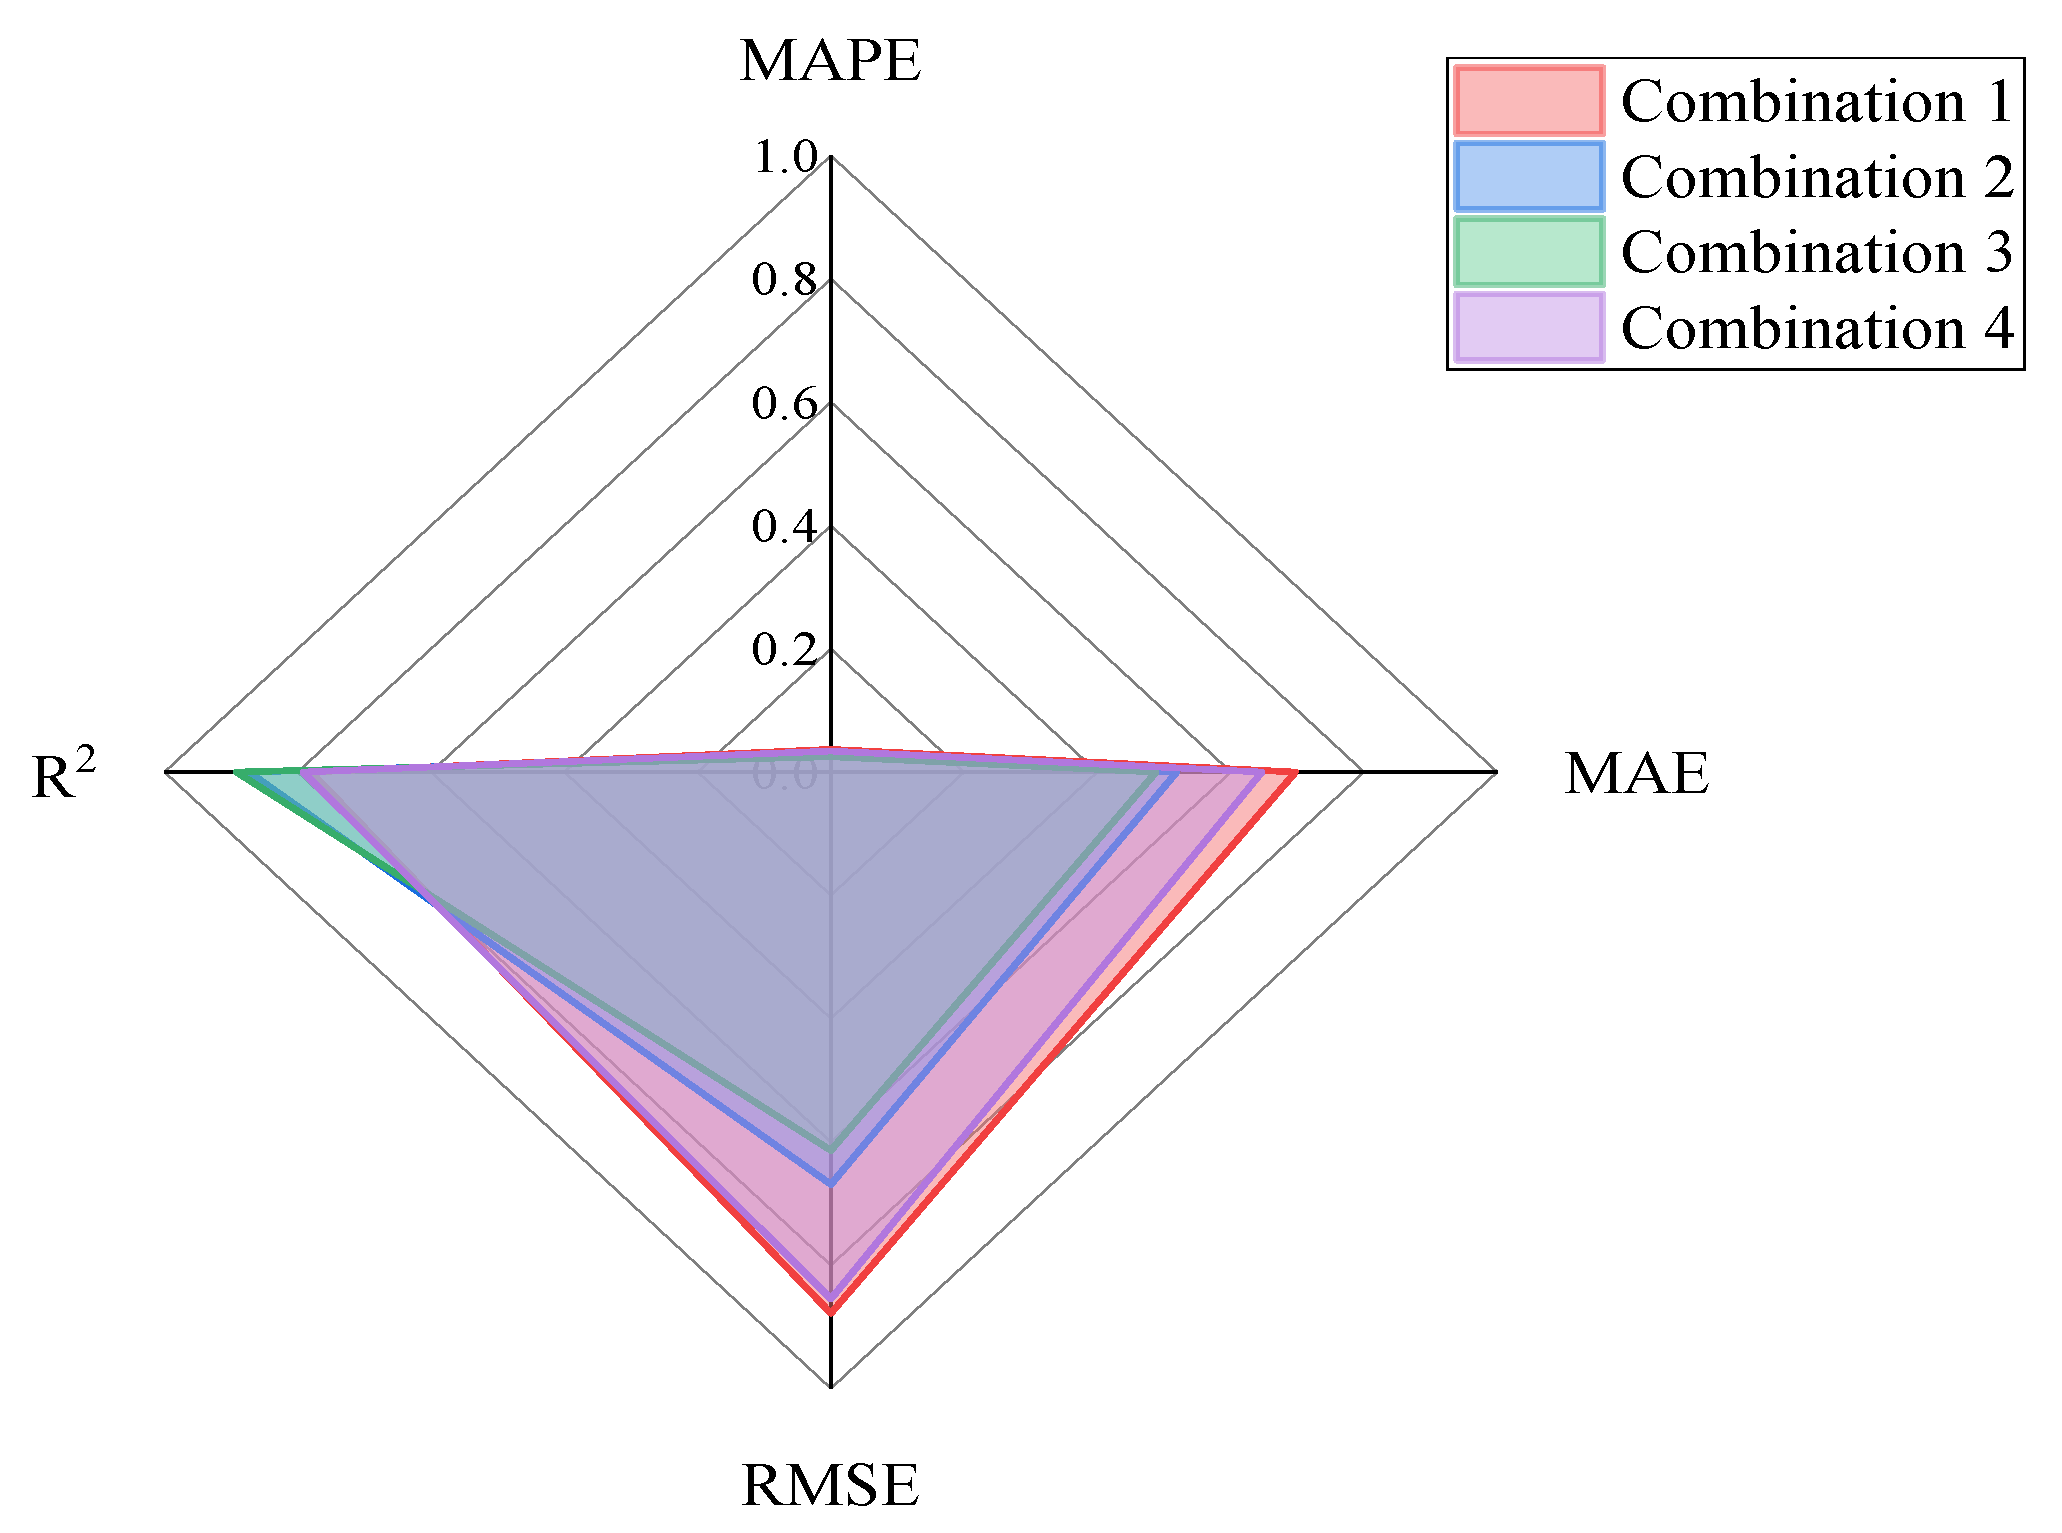
| Combination Number | Measurement Point Combination | Notes |
|---|---|---|
| Combination 1 | ST-1-11, ST-1-12 | Includes two measurement points that are relatively close to each other |
| Combination 2 | ST-1-12, ST-1-13 | Combined one measurement point at a medium distance and one at a greater distance |
| Combination 3 | ST-1-11, ST-1-12, ST-1-13 | Integrated three measurement points at different distances to examine the comprehensive effect of multi-point combinations |
| Combination 4 | ST-1-11, ST-1-12, ST-1-13, ST-1-08 | Includes four measurement points to explore the impact of the increase in the number of measurement points on the predictive performance |
| Combination Number | Evaluation Index | |||
|---|---|---|---|---|
| MAPE | MAE | RMSE | R2 | |
| Combination 1 | 0.037 | 0.697 | 0.878 | 0.780 |
| Combination 2 | 0.027 | 0.519 | 0.669 | 0.873 |
| Combination 3 | 0.025 | 0.488 | 0.614 | 0.892 |
| Combination 4 | 0.034 | 0.647 | 0.855 | 0.792 |
| Measurement Point Number | Correlation Coefficient Between Measurement Point Temperature and Stress Variation | Evaluation Index for Predicted Results | |||
|---|---|---|---|---|---|
| MAPE | MAE | RMSE | R2 | ||
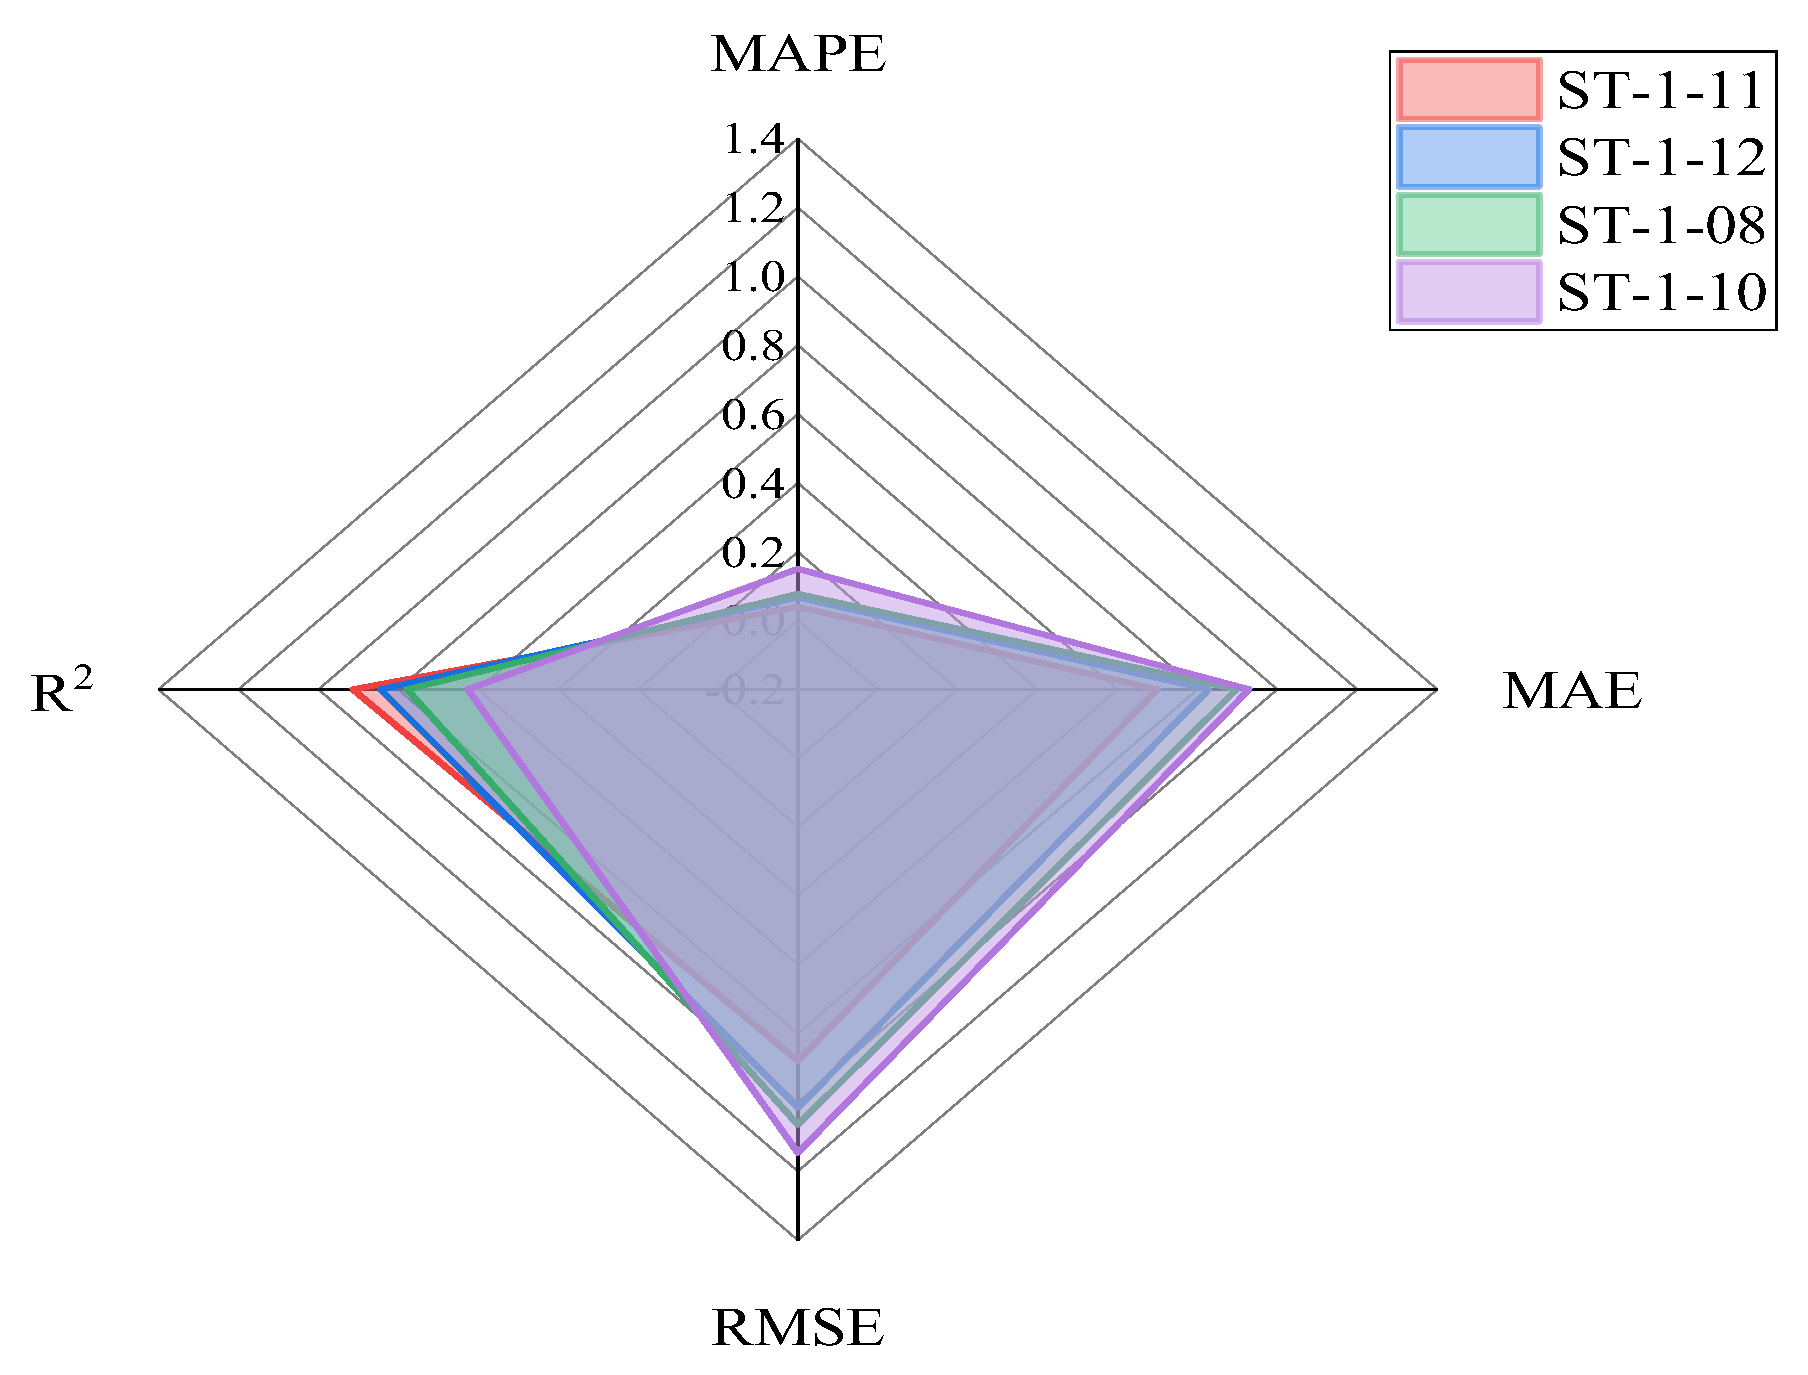
| ST-1-11 | 0.979 | 0.040 | 0.700 | 0.879 | 0.914 |
| ST-1-12 | 0.970 | 0.067 | 0.828 | 1.015 | 0.844 |
| ST-1-08 | 0.953 | 0.077 | 0.898 | 1.065 | 0.778 |
| ST-1-10 | 0.951 | 0.150 | 0.929 | 1.146 | 0.626 |
| Predicted Model | MAPE | MAE | RMSE | R2 | MSE |
|---|---|---|---|---|---|
| LSTM | 0.045 | 0.564 | 0.792 | 0.821 | 0.672 |
| CNN-LSTM | 0.038 | 0.512 | 0.721 | 0.853 | 0.520 |
| BO-CNN-LSTM | 0.025 | 0.488 | 0.614 | 0.892 | 0.377 |
Disclaimer/Publisher’s Note: The statements, opinions and data contained in all publications are solely those of the individual author(s) and contributor(s) and not of MDPI and/or the editor(s). MDPI and/or the editor(s) disclaim responsibility for any injury to people or property resulting from any ideas, methods, instructions or products referred to in the content. |
© 2025 by the authors. Licensee MDPI, Basel, Switzerland. This article is an open access article distributed under the terms and conditions of the Creative Commons Attribution (CC BY) license (https://creativecommons.org/licenses/by/4.0/).
Share and Cite
Cui, J.; Wang, X.; Li, X.; Liu, Y.; Ba, P.; Xu, C.; Chyży, T. Design and Implementation of Health Monitoring System for an Airport Terminal Building with a Large-Span Truss Steel Structure. Buildings 2025, 15, 3308. https://doi.org/10.3390/buildings15183308
Cui J, Wang X, Li X, Liu Y, Ba P, Xu C, Chyży T. Design and Implementation of Health Monitoring System for an Airport Terminal Building with a Large-Span Truss Steel Structure. Buildings. 2025; 15(18):3308. https://doi.org/10.3390/buildings15183308
Chicago/Turabian StyleCui, Jintao, Xuyue Wang, Xuetong Li, Yuchen Liu, Panfeng Ba, Chujin Xu, and Tadeusz Chyży. 2025. "Design and Implementation of Health Monitoring System for an Airport Terminal Building with a Large-Span Truss Steel Structure" Buildings 15, no. 18: 3308. https://doi.org/10.3390/buildings15183308
APA StyleCui, J., Wang, X., Li, X., Liu, Y., Ba, P., Xu, C., & Chyży, T. (2025). Design and Implementation of Health Monitoring System for an Airport Terminal Building with a Large-Span Truss Steel Structure. Buildings, 15(18), 3308. https://doi.org/10.3390/buildings15183308


