Article

Modeling the Fire Response of Reactive Powder Concrete Columns with Due Consideration of Transient Thermal Strain

1
School of Architecture and Civil Engineering, Harbin University of Science and Technology, Harbin 150090, China
2
Heilongjiang Province Academy of Cold Area Building Research, Harbin 150080, China
3
Key Lab of Structures Dynamic Behavior and Control of the Ministry of Education, Harbin Institute of Technology, Harbin 150090, China
4
Key Lab of the Smart Prevention and Mitigation of Civil Engineering Disasters of the Ministry of Industry and Information Technology, Harbin Institute of Technology, Harbin 150090, China
*
Author to whom correspondence should be addressed.
Buildings 2025, 15(18), 3287; https://doi.org/10.3390/buildings15183287
Submission received: 3 August 2025 / Revised: 1 September 2025 / Accepted: 7 September 2025 / Published: 11 September 2025
(This article belongs to the Special Issue Fire Science and Safety of Building Structure)

Abstract

Transient thermal strain (TS) is a unique compressive strain that reactive powder concrete (RPC) experiences during temperature rise. RPC has a more rapid TS development than normal concrete (NC) during temperatures of 300 °C~800 °C, and under the same load level, the TS of RPC is 40% to 60% higher than that of NC. However, while TS is known to be significant in RPC, its quantitative influence on the structural fire response and ultimate fire resistance of RPC columns remains insufficiently understood and inadequately modeled, posing a potential risk to fire safety design. In this study, a method for modelling the fire response of RPC columns with due consideration to TS was developed using ABAQUS. The Drucker–Prager model was applied to assess the impact of TS on the fire resistance of RPC columns. The results indicate that ignoring the effect of TS could lead to unsafe fire resistance predictions for RPC columns. The influence of TS on the fire resistance performance of RPC columns increases with the increase in cross-sectional dimensions. When the cross-sectional dimension of RPC columns increases from 305 mm to 500 mm, the influence of TS on the fire resistance of RPC columns increases from 22% to 43%. Under the same load, the influence of TS on the fire resistance of RPC columns is 31.3%, which is greater than that on NC columns. When the hydrocarbon heating curve is used, if the influence of TS is not considered, the fire resistance will be overestimated by 18.2% and 37.7%. Under fire, the existence of TS will lead to a further increase in the compressive stress of the RPC element in the relatively low temperature region, resulting in a greater stress redistribution, and accelerating the RPC column to reach the fire resistance. Therefore, it is crucial to clearly consider TS for the accurate fire resistance prediction and safe fire protection design of RPC columns. Crucially, these findings have direct significance for the fire protection design of actual projects, such as liquefied petroleum stations.

1. Introduction

RPC is a cementitious composite characterized by ultra-high strength, high durability, and high toughness [1]. Using RPC components in high-rise and large-span structures can effectively reduce the cross-sectional size and self-weight of structural elements, thereby optimizing available space [2]. It is widely used in various fields [3], including bridges, tunnels, marine structures, and nuclear engineering, as shown in Figure 1. Fire is a high-frequency disaster, and among its different types, building fires occur most frequently and may cause significant loss of life and property. With the persistently developing new concrete materials and structural forms, evaluating the impact of fire on concrete structures has become a major research focus in civil engineering. Significant studies have been conducted on the thermal parameters and mechanical properties of RPC at both room and high temperatures.
Although extensive research has been conducted on the fundamental thermomechanical properties of RPC at elevated temperatures [4,5,6,7,8], its deformation behavior under thermo-mechanical coupling—particularly the formation mechanisms and effects of TS—remains a complex and critical area of study. Since the 1970s, the theory of concrete TS has been developed. Illston et al. [9] were the first to propose the concept of TS, which forms part of the high-temperature strain in concrete. Anderberg et al. [10] categorized the total strain of concrete under high temperatures into stress strain, free expansion strain, TS, and high-temperature creep, noting that TS occurred during the initial heating phase of concrete and proposed a calculation model for TS and high-temperature creep under uniaxial stress. Considering that the short-term creep of concrete is much smaller than TS under the same conditions, Schneider et al. [11] considered both TS and short-term creep and divided the total strain into stress strain, thermal expansion strain, and high-temperature creep. Wu et al. [12] determined the high-temperature creep of high-strength concrete (HSC) incorporating polypropylene (PP) fibers and showed that the TS of HSC was greater than that of NC, particularly when the temperature exceeded 500 °C. Sanchayan et al. [13] measured the elastic modulus, free expansion strain, and TS of RPC mixed with steel and polyvinyl alcohol fibers, and calculated the thermal shrinkage coefficient of RPC due to TS. Likewise, Abid et al. [14] investigated the TS and short-term creep of RPC under different stress levels with test methods involving loading before heating and loading after heating. A regression analysis was also conducted to develop calculation models to account for temperature, stress, and time.
The fire resistance performance of concrete components under fire has also been extensively studied. Yang et al. [15] studied the mechanical properties of NC columns and HSC columns at high temperatures. The results show that the HSC column, due to severe spalling at high temperatures, weakens the effective cross-section of the column, resulting in a lower fire resistance limit than the NC column. Kodur et al. [16] conducted fire tests on NC columns and HSC columns, respectively. The research results showed that the fire resistance performance of HSC columns was generally lower than that of NC columns. The presence of carbonate aggregates enhances the fire resistance of HSC columns. Adding steel fibers and PP fibers to HSC columns can improve their ductility and reduce high-temperature spalling. Lee et al. [17] tested two identical full-size columns made of UHPC, which contained PP, nylon, and steel fibers. Under the ISO-834 standard for temperature rise curve and axial load, their fire resistance performance was tested, and only slight spalling occurred as a whole in the columns. Choe et al. [18] conducted a full-scale test on UHPC columns containing PP fibers, nylon fibers, and steel fibers under the ISO-834 standard [19] for fire exposure. However, in Choe’s test, severe spalling occurred in the UHPC columns, thereby reducing the overall fire resistance limit. Li et al. [20] conducted a study on the fire resistance performance of UHPC columns and HSC columns under the ISO-834 standard fire curve. The research results show that the addition of mixed PP fibers and steel fibers makes the UHPC column only exhibit edge spalling, significantly improving the fire resistance. Wu et al. [21,22] analyzed the fire resistance performance of reinforced concrete square columns and cross-shaped irregular columns through the structural fire resistance analysis software SAFIR. The research results show that strictly controlling the load ratio is the key to improving the fire resistance performance of columns.
Different test methods, concrete aggregates, mix proportions, and heating methods have different TS calculation models, and there is a lack of in-depth research on the mechanism of TS generation. However, there is a clear understanding of the changes and response factors of TS of ordinary concrete and high-strength concrete at the macro level. As the TS needs must be measured under constant load and temperature rise, the stress–strain curve of concrete at high temperature measured by force loading or displacement loading usually does not include the TS, and introducing it into the constitutive relationship is challenging. Therefore, the TS is not included in the calculation of the fire resistance of many concrete members. Finite-element (FE) analysis has thus become a crucial tool in modern engineering simulations. Various studies on concrete members have been conducted using FE analyses. Wang et al. [23] proposed two methods to consider the TS in the calculation of the fire resistance of concrete members—one based on ABAQUS, in which the TS was simulated by modifying the thermal expansion coefficient of the material by compiling a subroutine, and the other to transform the calculation of TS into modifying the elastic coefficient of the material through theoretical derivation. Wei et al. [24] studied the influence of TS of concrete on the post-tensioned prestressed concrete slab under fire by numerical simulations and found that the deflection of the plate and the stress of the steel bar can be reduced if the TS is explicitly considered in the fire resistance analysis of the plate, which has a positive effect on the fire resistance of the plate. Sadaousia et al. [25] considered only TS in the FE model and evaluated the impact of TS on the fire resistance of unconstrained reinforced concrete (RC) columns under eccentric compression. It was shown that including TS improved the accuracy of the calculated axial displacement–time curve, with TS contributing additional compressive stress that accelerated column failure. Kodur et al. [26] developed a three-dimensional FE model in ABAQUS to assess the fire behavior of RC columns based on the Drucker–Prager Creep and Creep Power Law models to avoid complex integral calculations, effectively incorporating TS and creep effects on the deformation and fire resistance of concrete and steel reinforcement. Similarly, Alogla et al. [27] used ABAQUS to establish an FE model for the fire resistance of NC columns, confirming that both the temperature rise rate and axial compression ratio significantly influence the impact of TS on fire resistance. It was also shown that neglecting TS in cooling phases led to underestimated axial deformation in concrete columns. In addition, ignoring TS in the fire resistance analysis could lead to overestimating the fire resistance and unsafe structural designs [26,27]. Ren et al. [28,29] calculated the TS magnitude of RPC through the Abid [14] calculation method and, then, superimposed the values onto the high-temperature uniaxial stress–strain relationship of RPC proposed by Luo [5]. Considering the influence of TS, this method achieved excellent calculation results in the numerical simulation of RPC beams. However, the existing methods incorporating TS into fire resistance analysis require complex programming or overly simplistic stress-strain superposition, making them either impractical or inadequate for practical scenarios. Also, the high-temperature response of RPC columns, particularly the influence of TS on their fire resistance, remains unaddressed. As HSC, ultra-high-strength concrete (UHSC), and RPC are increasingly used in building structures, further research is direly needed.
In general, a large number of current studies point to the fact that TS has a significant impact on the fire resistance performance of concrete columns. However, there are still some shortcomings. First, although existing studies have shown that TS can accelerate the failure of RC columns [30,31] and reduce the fire resistance performance of NC columns [32,33], the impact of TS on RPC columns has not been systematically quantified. Second, the current methods for incorporating TS into a fire resistance analysis either rely on complex computational subroutines or use simple strain superposition. Neither of these two methods can capture the highly nonlinear, stress–temperature coupling behavior of TS in RPC. Last but not least, TS in RPC exhibits unique evolution characteristics: it intensifies above 500 °C [13,14] and is highly sensitive to heating rates and applied stress, two critical factors in real fire scenarios that are often overlooked in design codes. Without accurate modeling of TS–RPC interactions, fire resistance assessments may significantly overestimate structural capacity, as has been demonstrated in NC and HSC cases [27,28].
To address the aforementioned research gaps, this study deviates from traditional cumbersome subroutines by integrating the Concrete Damage Plasticity (CDP) model and the Drucker–Prager model within the ABAQUS framework. Specifically, the CDP model is adopted to simulate the mechanical damage evolution of RPC under high-temperature conditions, whereas the Drucker–Prager model is utilized to account for the effects of TS on RPC, systematically investigating the influence of TS on the fire resistance of RPC columns, with a focus on key parameters including cross-sectional dimensions, load levels, reinforcement ratios, heating curves, and fire exposure scenarios. Furthermore, it elucidates the role of TS in stress redistribution across the column section during fire exposure and provides a comparative analysis of the effect of TS on both NC and RPC columns.
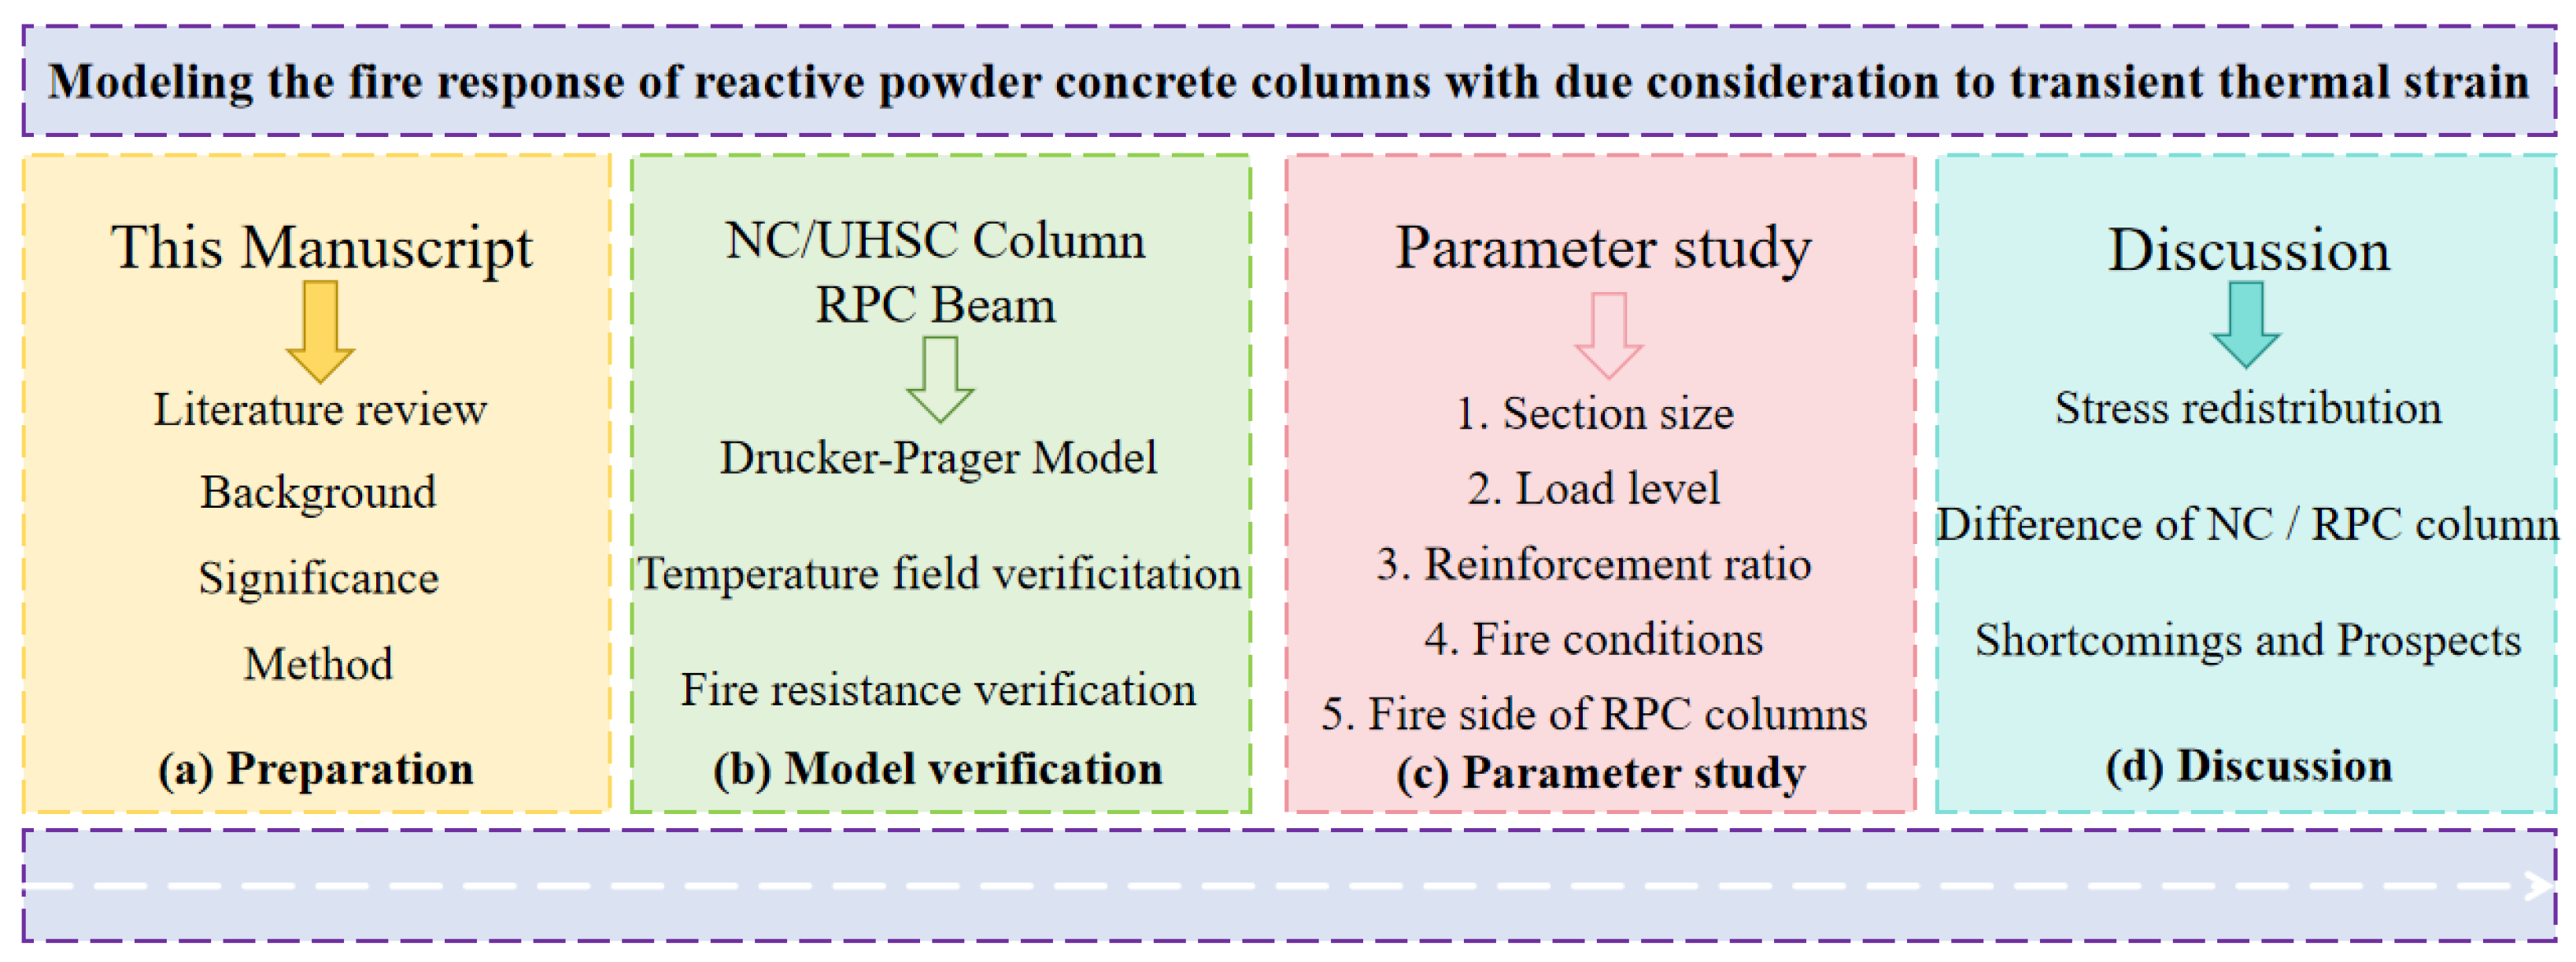
The technical flowchart of this paper is shown in Figure 2.

2. FE Analysis

The FE model of the fire resistance performance of an RPC column under fire was established by using the sequential thermal–mechanical coupling method, and the temperature was raised according to the ISO-834 standard. Based on the calculation relation of TS for RPC obtained by fitting the test data, the relevant creep parameters were determined and incorporated into the Drucker–Prager model so that the influence of TS was considered in the analysis of RPC column fire resistance performance. The model accuracy was validated by the existing open fire tests.

2.1. Material Properties

The thermal conductivity, thermal expansion coefficient, and specific heat capacity of reinforcement were calculated using the method proposed by Lie [32]. In this paper, the thermal conductivity, thermal expansion coefficient, and specific heat capacity of NC, HSC, and RPC were calculated by the thermal conductivity method proposed by Lie [32], Kodur [30], and Zheng [4], respectively. Following Han’s [34] suggestion, the influence of moisture content was considered by modifying the specific heat capacity of concrete at 100 °C.

2.2. Temperature Field Model

The FE model for the temperature field of the RPC column was established in ABAQUS.

2.2.1. Principle of Heat Transfer

Thermal convection is the heat transfer in a fluid caused by the relative displacement of particles, which is divided into natural convection and forced convection. For components in a fire, it is mainly the heat exchange between the surface of the component and the surrounding fluid due to the existence of temperature differences. The process of thermal convection can be described through the convective heat transfer equation.
q c = α c T a T s
In Equation (1), qc is the heat transferred to the unit surface area of the component per unit time, W/m2; αc is the convective heat transfer coefficient, for the standard fire exposure surface, taken at 25 W/(m2·°C); Ta is the room temperature; and Ts is surface temperature of components.
Thermal radiation refers to the heat exchange process in which an object emits electromagnetic energy, which is absorbed by other objects and converted into thermal energy. Thermal radiation has its own characteristics. For instance, the higher the temperature of an object, the more heat it radiates per unit time. Moreover, thermal radiation does not require any medium. Therefore, the efficiency of thermal radiation is the highest in a vacuum. The expression of thermal radiation is:
q r = ε r σ T a + 273 4 T s + 273 4
In Equation (2), qr is the heat radiated per unit area of the component within a unit of time; εr is comprehensive radiation coefficient, take 0.5; and σ is the Stefan–Boltzmann constant value.
Since there is no internal heat source within the component itself, according to Fourier’s law and the thermal equilibrium of the heat-conducting micro-element, the three-dimensional transient heat conduction equation can be expressed as:
c ρ T t = λ 2 T x 2 + 2 T y 2 + 2 T z 2
In Equation (3), ρ is the density; c is the specific heat capacity; T is the temperature at t time of point (x,y,z); λ is the thermal conductivity.
Next, solve the heat conduction equation.
1.
Initial conditions
Before the RPC column is exposed to fire, it is at room temperature. By default, the temperature distribution inside and outside of it is uniform and the same as the ambient temperature, and no heat transfer occurs with the surrounding environment. In this paper, it is taken as 20 °C.
T x , y , z , t = 20   ° C
2.
Boundary conditions
There are mainly four types of boundary conditions:
  • The temperature function of the component surface is known;
  • The heat flux density function on the component surface is known;
  • The fluid temperature, thermal conductivity and radiation coefficient on the surface of the component are known.
  • The heat transfer conditions at the contact surfaces between objects are known.
When solving the temperature field distribution of RPC column sections under fire conditions, the exposed surface is solved according to the third type of boundary conditions, and the unexposed surface is solved according to the first type of boundary conditions.
Therefore, the heat flux balance equation on the component surface can be written as:
λ T n = α c T T f + ε r σ T + 273 4 T f + 273 4
In Equation (5), n is the normal vector of the component surface; Tf is the temperature of fire.

2.2.2. Temperature Field Calculation Model

The relevant modeling parameters were selected as follows:
(1)
Column Geometry and Model Setup
Based on the open fire tests of concrete columns and relevant design specifications, three types of RPC columns were modeled. The geometric parameters of these models are provided in Table 1.
(2)
Reinforcement–Concrete Interaction
A tie constraint was applied between the reinforcement and RPC, ensuring complete heat transfer. Thermal resistance was neglected, i.e., the temperature at the corresponding nodes of both concrete and reinforcement was assumed to be the same.
(3)
Mesh Size and Convergence Analysis
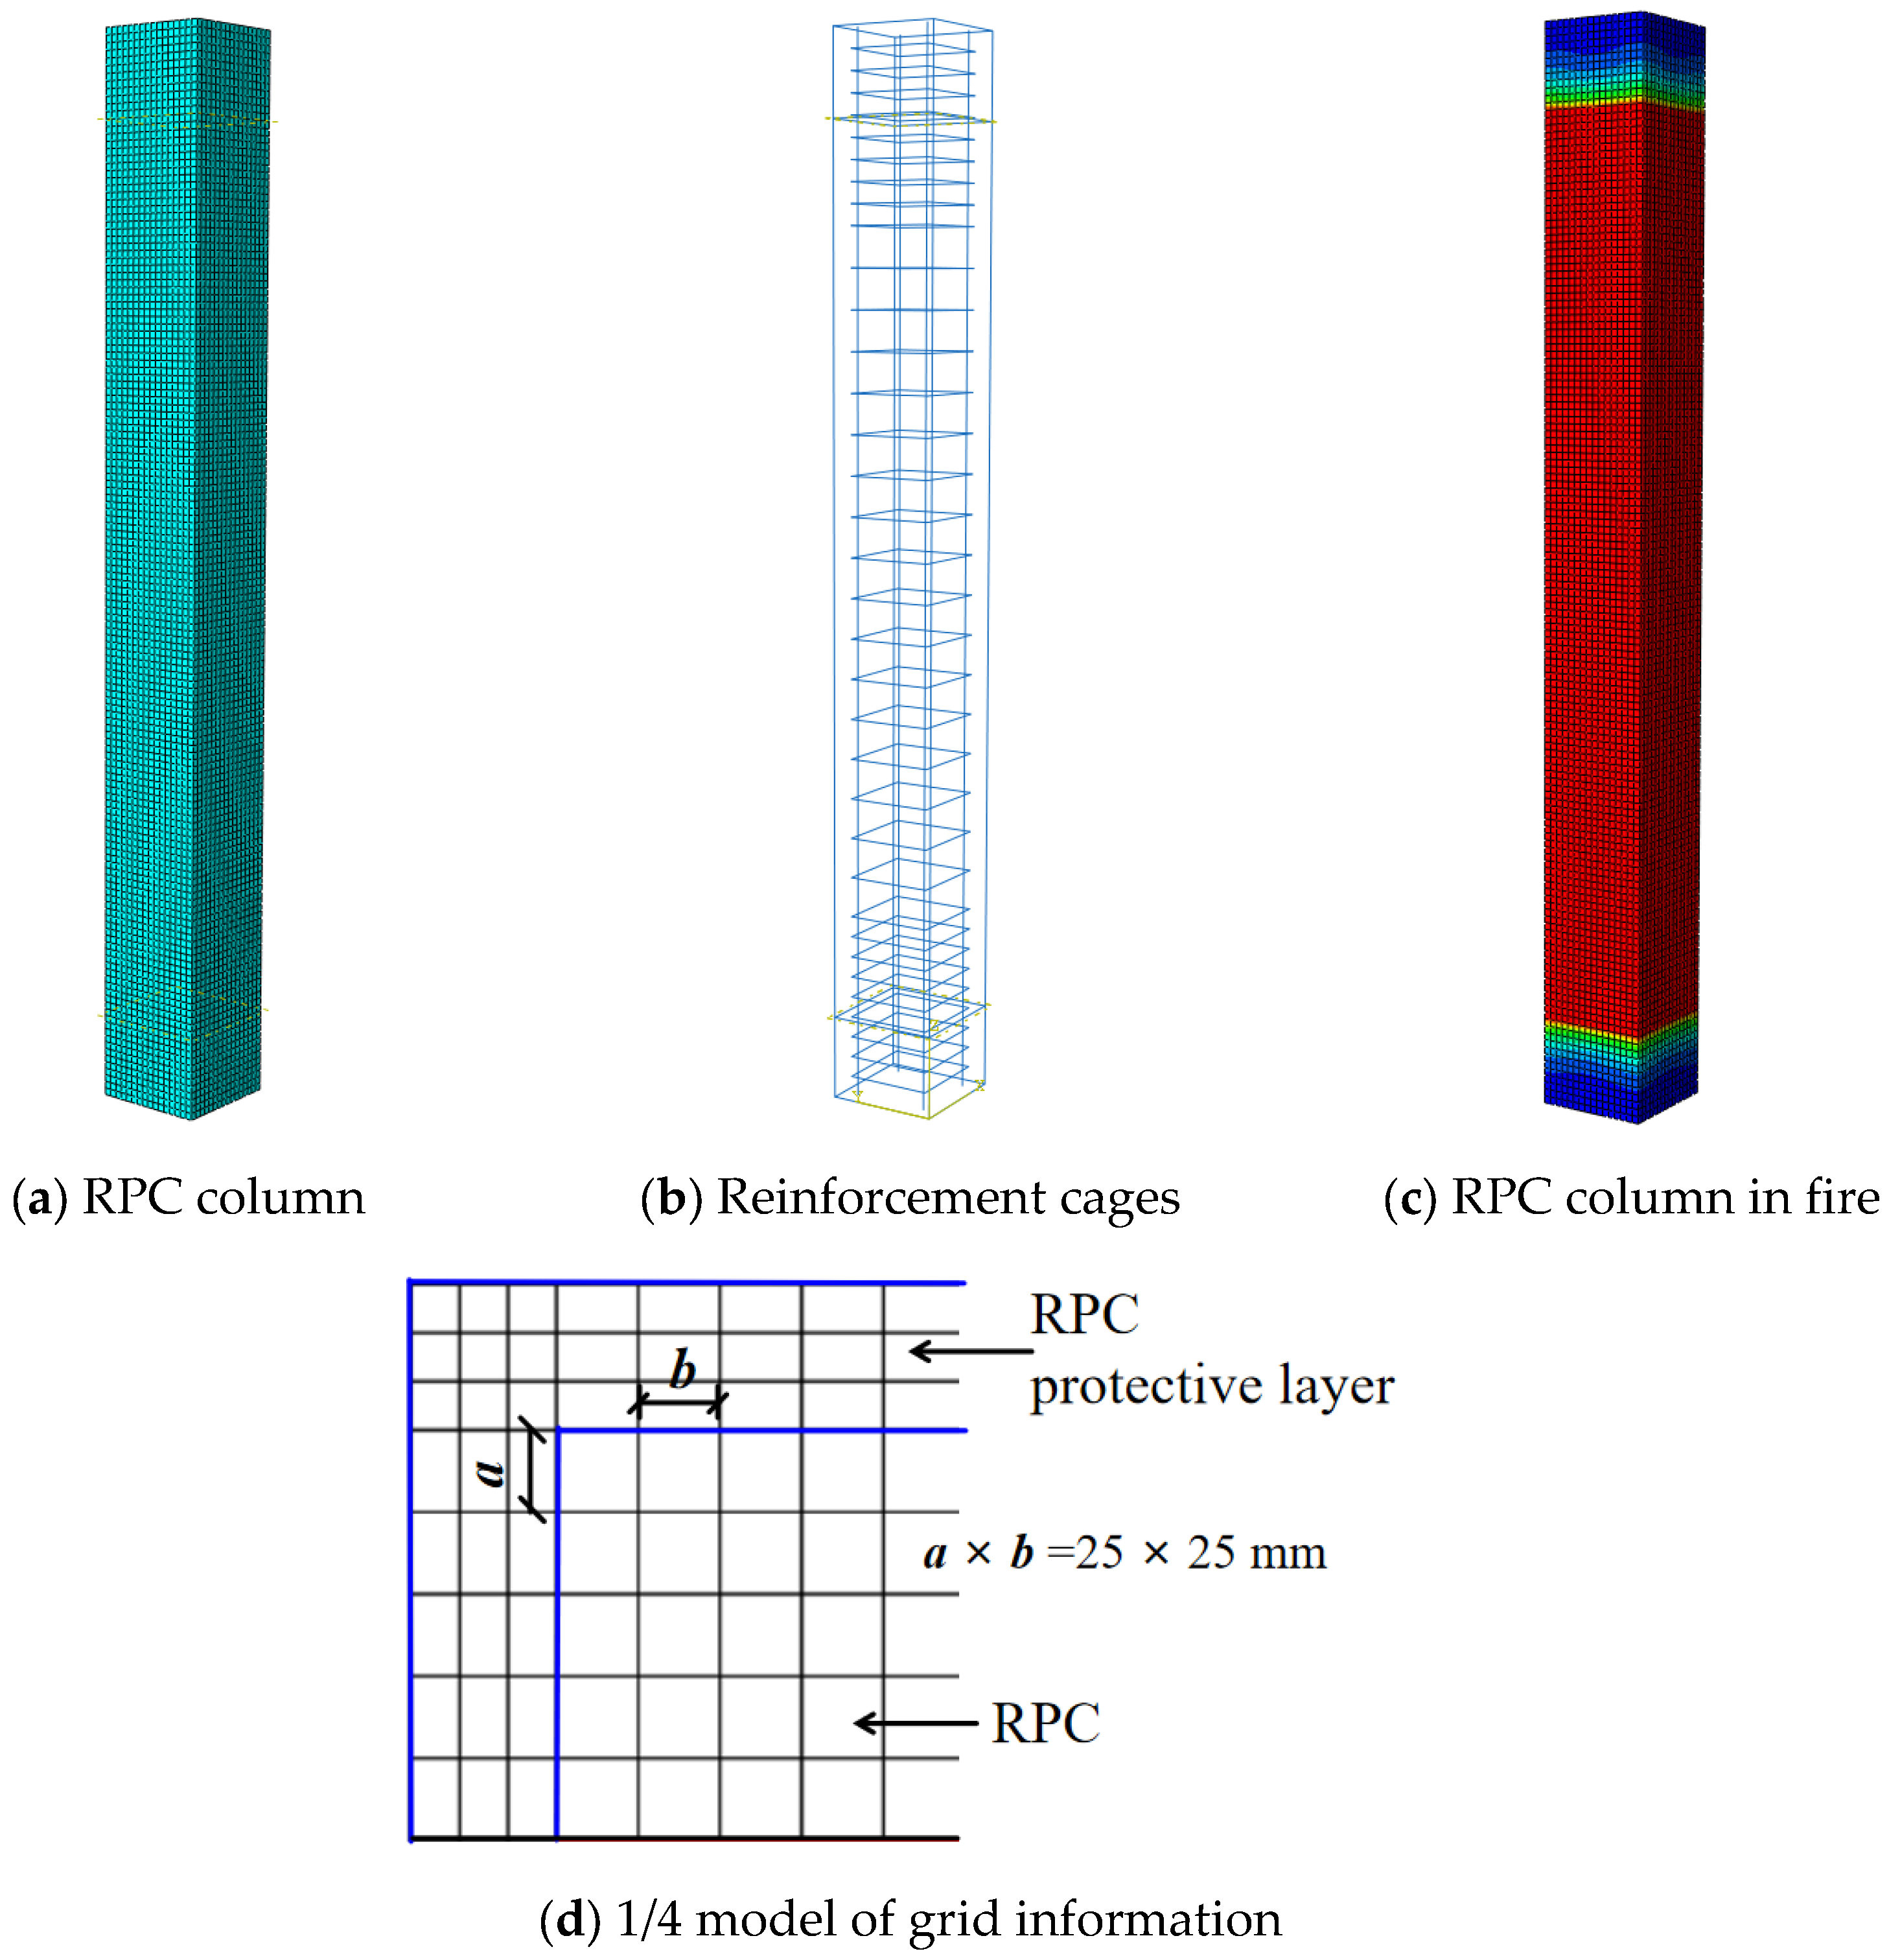
A convergence analysis was performed to determine the optimal mesh size, which was set to 25 mm for both the concrete and reinforcement elements, enabling a balance between computational efficiency and accuracy.
(4)
Element Types
For thermal analysis, RPC was modeled using eight-node, three-dimensional solid elements (DC3D8), whereas the reinforcement was modeled using two-node rod elements (DC1D2).
(5)
Thermal Analysis Settings
The heat transfer module was employed to calculate the temperature field of the RPC column section under fire conditions. The initial analysis step is set to 1 s, with a maximum analysis step set of 300 s. The convergence accuracy was specified as 1 × 10⁻⁵ s.
(6)
Fire Exposure and Boundary Conditions
The temperature rise was based on the ISO-834 standard [19] fire curve. The convection coefficient for the fire surface was set to 25 W/(m2·°C), and the flow coefficient for the rear fire surface was set to 9 W/(m2·°C). The radiation coefficient was taken as 0.5, the Stefan–Boltzmann constant was 5.67 × 10⁻⁸ W/(m2·K4), and the absolute zero temperature was −273 °C.
(7)
Fire Exposure Configuration
The RPC column was exposed to fire on all four sides. The exposed height of Column A and Column B was 3.0 m, whereas Column C was fully exposed to fire.
The established three-dimensional FE model of the RPC column temperature field is shown in Figure 3.

2.3. TS of RPC

Under compressive stress, the inelastic strain produced during the first temperature rise of concrete is called TS ( ε tr ), which was calculated by Equation (6).
ε tr T , σ = ε tot T , σ ε th T , σ = 0 ε el T , σ
where ε tot is the total strain, ε el denotes the elastic strain, and ε sh represents the shrinkage strain.
Abid [14] performed a regression analysis on the test data, and the TS was also expressed as a function of stress level and temperature. The relationship between the TS ε tr of SRPC (2% steel fiber) and HRPC (2% steel fiber and 0.2% PP fiber) and the reference temperature T and stress level σ / f c was given. The calculation method of the TS of SRPC is expressed in Equation (7), while the calculation method of the TS of HRPC is given in Equation (8).
ε tr = K 1 + K 2 2.07 × 10 3 1.86 × 10 3 × e 9.26 σ f c × 10 3 , 0.1 σ f c 0.3 K 1 + K 2 5.42 × 10 3 8.14 × 10 3 × e 5.39 σ f c × 10 3 , 0.3 σ f c 0.6
where K 1 = 2.03 × 10 5 × σ / f c 1.68 and K 2 = e T 146.5 × σ / f c 0.2 .
ε tr = σ f c 6.51 × 10 4 + 3.16 × 10 5 T 1.72 × 10 7 T 2 9.55 × 10 14 T 3 , 20   ° C T 700   ° C σ f c 49.66 × 10 3 6.63 × 10 9 × e 0.0208 T , 700   ° C T 900   ° C

2.4. RPC FE Model Considering TS

The concrete damaged model is commonly used in ABAQUS to assess concrete’s mechanical behavior. By defining the compression damage factor and tensile damage factor, the model can simulate the typical softening and breaking of concrete under compression, as well as the expansion of tensile cracks and microcracks. However, as the constitutive relationship of concrete under high temperature cannot fully and explicitly consider the TS of concrete, accurately simulating the response of the structure under fire by using the concrete damaged place model is complex, and it is often necessary to write subroutines for the secondary development of ABAQUS. The extended Drucker–Prager model provided in ABAQUS can calculate the compression and creep behavior of concrete [26], and its yield criterion can be expressed as Equation (9).
d tan δ h k = 0
where d = f K J 2 = f K 1 6 σ 1 σ 2 2 + σ 2 σ 3 2 + σ 3 σ 1 2 ; h = I 1 3 = σ 1 + σ 2 + σ 3 3 ; f ( K ) = 3 2 1 + 1 K 3 3 2 1 1 K J 3 3 J 2 3 ; σ i is the stress in the I direction; k is the hardening or softening coefficient, controlling yield surface development; and δ is the friction angle, determining the slope of the yield surface (for concrete, the friction angle is taken as 37°, and K is taken from 0.8 to 1.0).
The intrinsic model in the Drucker–Prager Yield Criterion is given by the plastic potential energy function G [26], expressed as Equation (10).
G = d tan β h + C
where β is the expansion angle of the material (for concrete, it is 31°).
Therefore, in the Drucker–Prager model, the compressive deformation of the RPC column can be obtained by knowing the compressive stress–strain relationship and correlation coefficients ( δ , β, K). The total strain rate of concrete can be expressed as a linear superposition of three strain rates, as given in Equation (11).
ε ˙ = ε ˙ e + ε ˙ p + ε ˙ cr
where ε ˙ e is the elastic strain rate, ε ˙ p is the plastic strain rate, and ε ˙ cr is the creep strain.
The creep of steel bars at high temperatures can be considered by using the creep power law model, and the Drucker–Prager creep model of concrete can be calculated and analyzed iteratively by Equation (12).
ε ¯ ˙ cr = A σ ¯ cr n m + 1 ε ¯ cr m 1 m + 1
When the RPC column is under uniaxial compression, ε ¯ ˙ cr represents the creep rate, σ ¯ cr denotes the compressive stress corresponding to the creep, and A, n, and m are the temperature-dependent coefficients related to the creep rate, where A and n must be positive numbers, and the value range of m is (−1,0]. Assuming the size of m is zero, the calculation model of creep rate and creep can be decoupled, and Equation (12) is simplified to Equation (13).
ε ¯ ˙ cr = A σ ¯ cr n
From Equations (2) and (3), the coefficients A and n were fitted by using the least square method. The creep coefficient values of HRPC are listed in Table 2. By introducing the creep coefficients of RPC and reinforcement at various temperatures into the FE model, the TS of concrete and high-temperature creep of reinforcement were included in the high-temperature response of the structure [26,36].

2.5. Thermal–Mechanical Coupling Model of RPC Column

The stress–strain relationship of the steel reinforcement at high temperatures was calculated following EN1992-1-2:2004 [37]. For NC and HSC, the high-temperature stress–strain relationship was based on the uniaxial compression model proposed by Lie [32] and Kodur [27]. The tensile stress–strain relationship was derived from the model presented by Hong [38], whereas Poisson’s ratio was obtained using the proposed relation by Gernay [39]. The calculation model for TS is taken from the expression given by Guo et al. [40]. For RPC, the high-temperature stress–strain model under uniaxial compression proposed by Luo [5] was used. The stress–strain relationship of reinforcing bars at high temperatures is shown in Equation (14). The stress–strain calculation expression of RPC under uniaxial compression at high temperature is shown in Equation (15).
σ s = E s ( T ) ε s ε s ε p ( T ) f p ( T ) c + b a a 2 [ ( ε y ( T ) ε s ) ] 2 ε p ( T ) < ε s ε y ( T ) f y ( T ) ε y ( T ) < ε s ε t ( T ) f y ( T ) 1 ε s ε t ( T ) ε u ( T ) ε t ( T ) ε t ( T ) < ε s ε u ( T ) 0 ε s ε u ( T )
where, in Equation (14), ε p ( T ) = f p ( T ) / E s ( T ) ; ε y ( T ) = 0.02 ; ε t ( T ) = 0.15 ; ε u ( T ) = 0.2 ; a 2 = [ ε y ( T ) ε p ( T ) ] [ ε y ( T ) ε p ( T ) + c / E s ( T ) ] ; b 2 = c [ ε y ( T ) ε p ( T ) ] E s ( T ) + c 2 ; c = [ f y ( T ) f p ( T ) ] 2 [ ε y ( T ) ε p ( T ) ] E s ( T ) 2 [ f y ( T ) f p ( T ) ] ; ε s represents the compressive strain of steel; σ s represents the compressive stress of the steel; f p ( T ) represents the limit of the proportion of steel at high temperatures; f y ( T ) represents the yield strength of the steel at high temperatures; and E s ( T ) represents the elastic modulus of the steel at high temperatures.
y = m x + ( 3 2 m ) x 2 + ( m 2 ) x 3 0 x 1 x n ( x 1 ) 2 + x x > 1
where in Equation (15), x = ε c / ε c , T ; y = σ c / f c , T ; ε c represents the RPC compressive strain of the blended fiber; σ c represents the RPC compressive stress of the blended fibers; ε c , T represents the peak compressive strain of the blended fiber RPC at high temperatures; f c , T represents the axial compressive strength of the blended fiber RPC at high temperatures; and m and n are the parameters of the rising and falling sections of the curve, respectively.
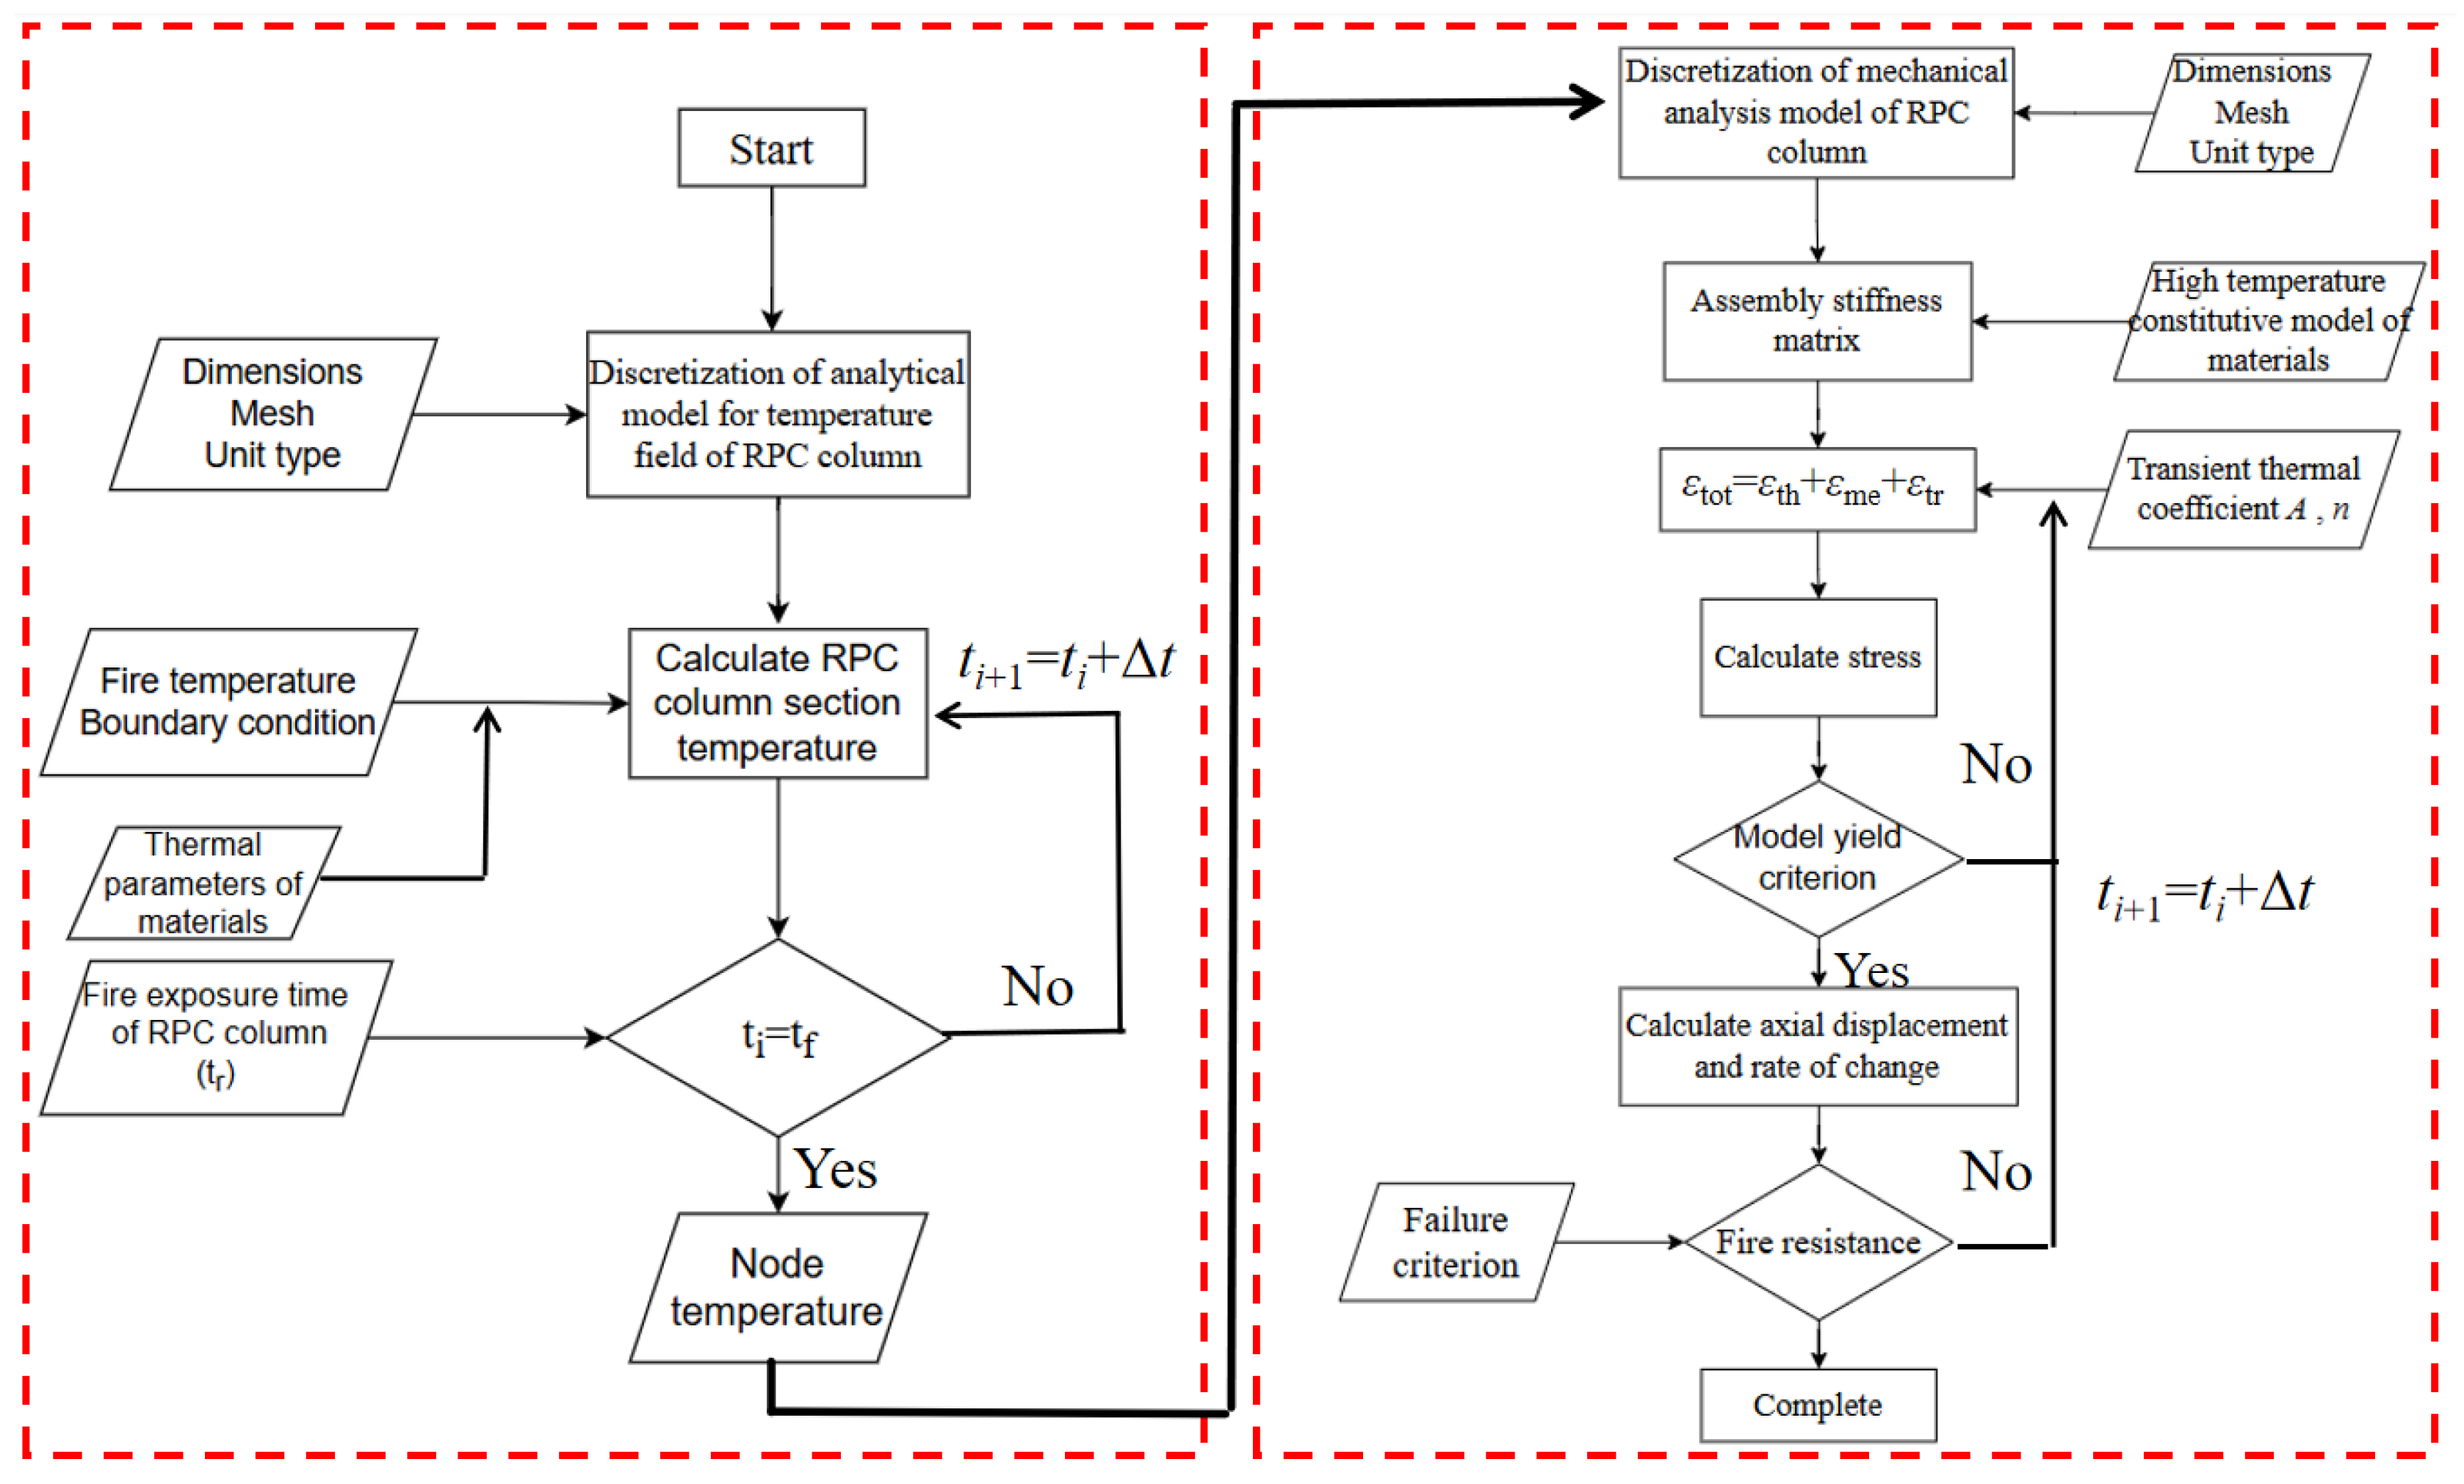
There are limited research studies on the stress–strain relationship of RPC under high-temperature tension. Therefore, in this study, the peak tensile strain (εt,T) of RPC at elevated temperatures was derived using the elastic modulus (Ec,T) and tensile strength (ft,T) of RPC at high temperatures, as proposed by Luo. These values for tensile strength and peak tensile strain were then incorporated into the tensile stress–strain relationship of RPC at room temperature, as suggested by Li [41]. This approach demonstrated favorable results [42]. The fire resistance calculation process for the RPC column is illustrated in Figure 4.

2.6. Model Validation

Due to the lack of a full-scale fire resistance test of RPC columns under load, the FE temperature field model, fire resistance model, and RPC material model were verified by using the reported open fire tests of NC columns, ultra-high-strength concrete (UHSC) columns, and RPC beams.

2.6.1. Verification of NC Column

The detailed information of the NC column is shown in Table 3.
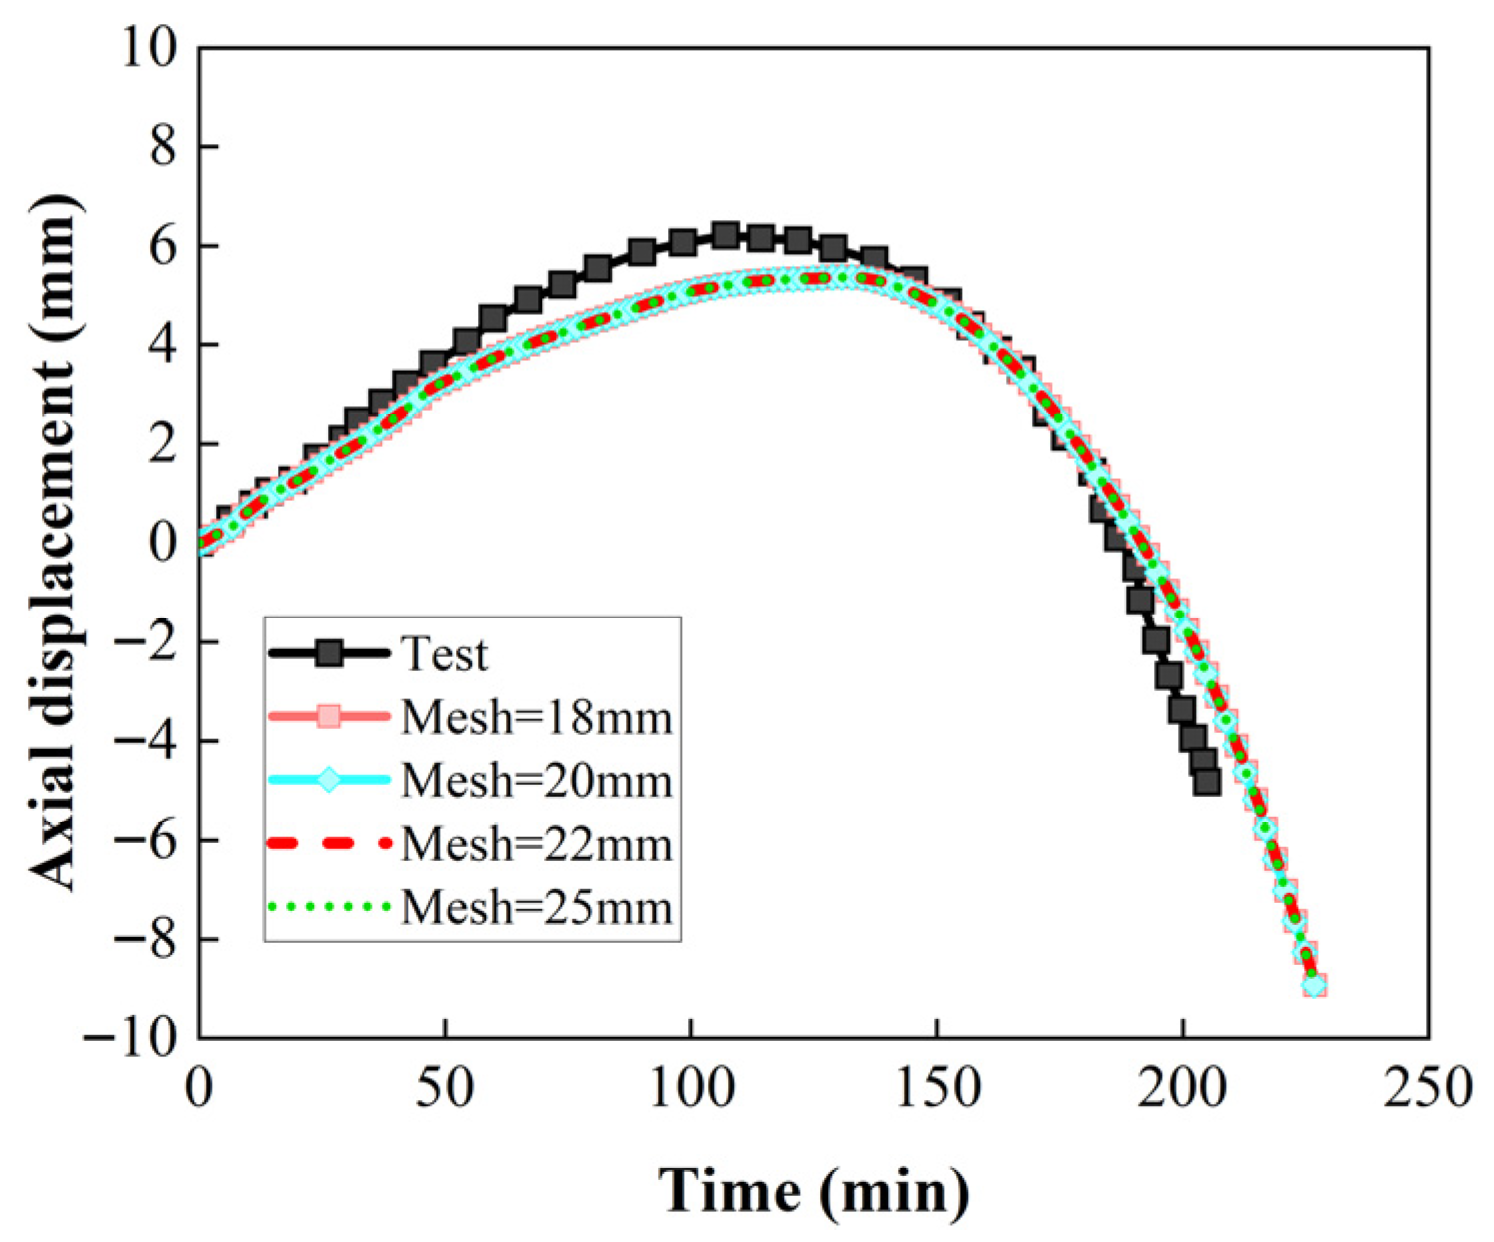
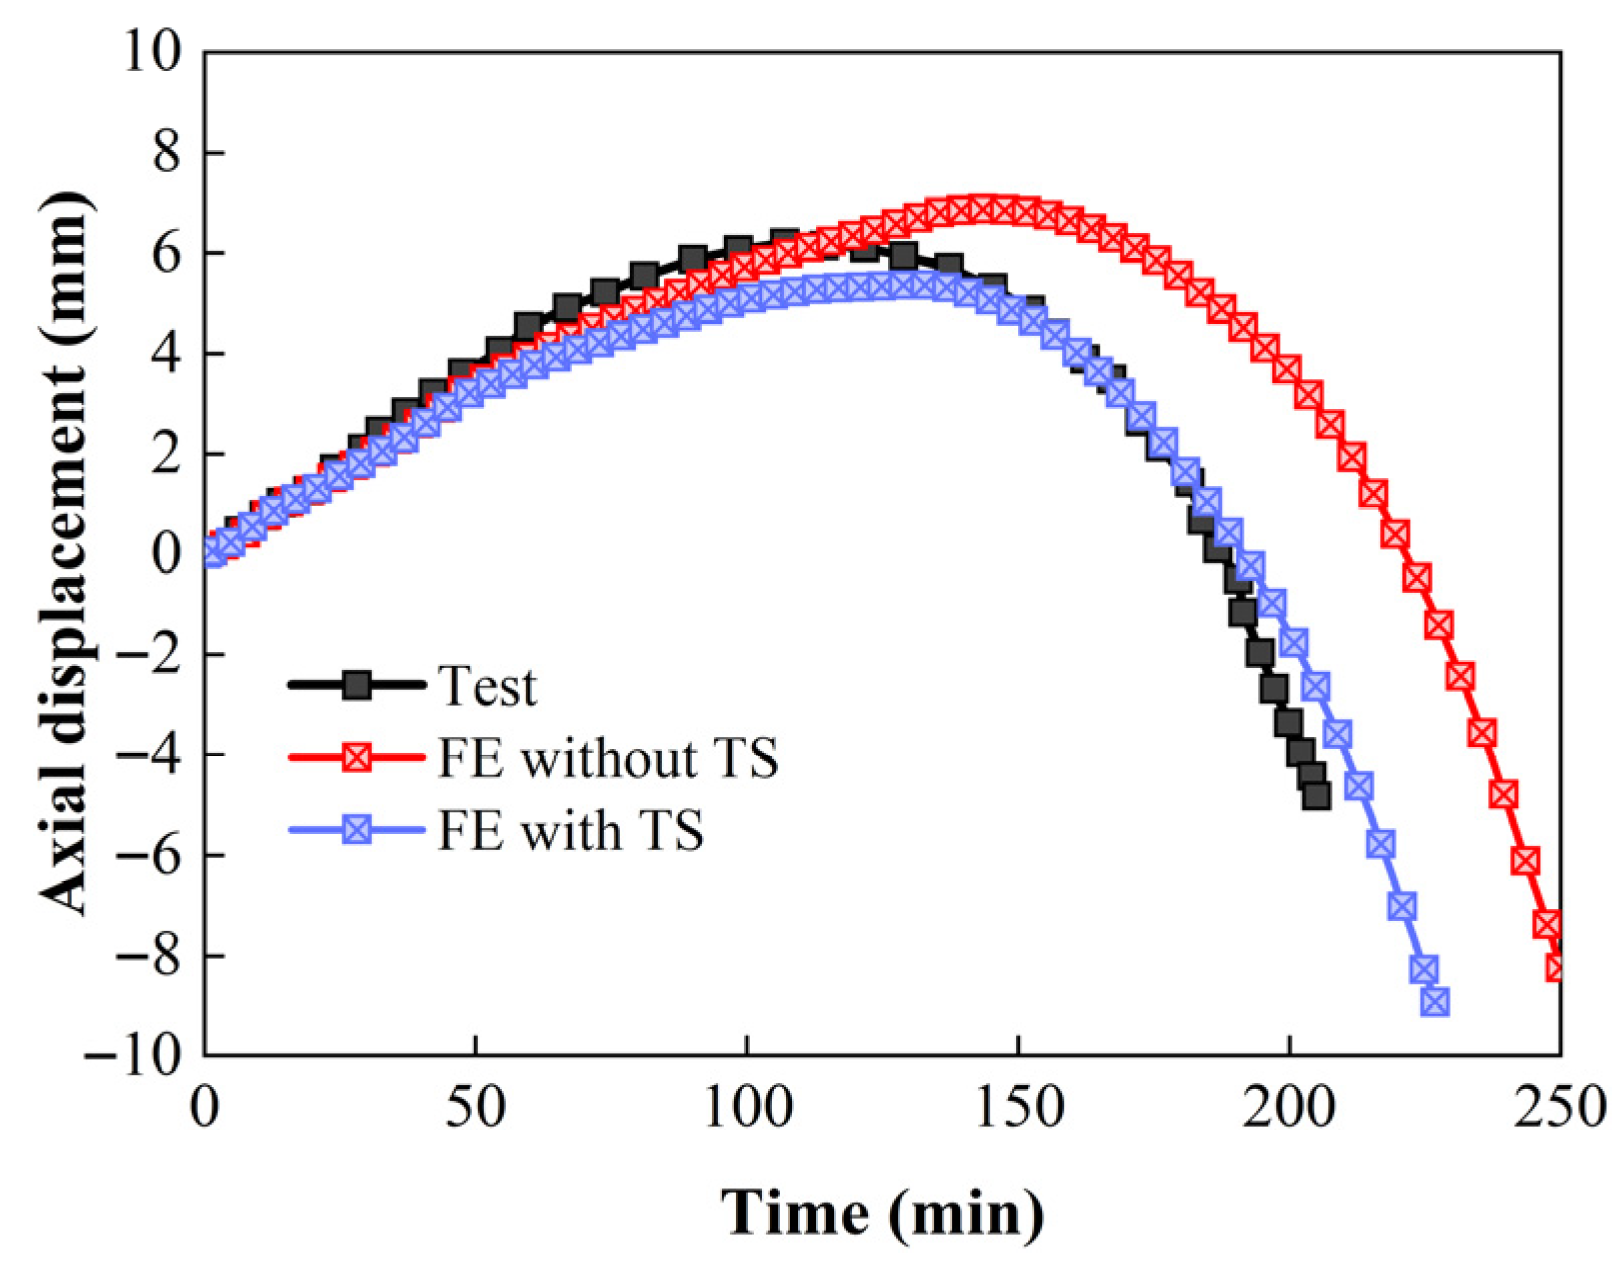
Figure 5 shows the measured temperature–time curves at various positions of the middle section of the column with the simulation results. The calculated results closely align with the experimental data, indicating that the test condition model provides a reliable prediction of the temperature field in RC columns under fire. Figure 6 shows the grid sensitivity analysis. Figure 7 displays the variation in axial displacement of the column top over time. The results confirm that the Drucker–Prager model effectively accounts for the influence of TS on the concrete column under fire. The model predictions are consistent with the experimental and the calculation results reported by Kodur [26].

2.6.2. Verification of UHSC Columns

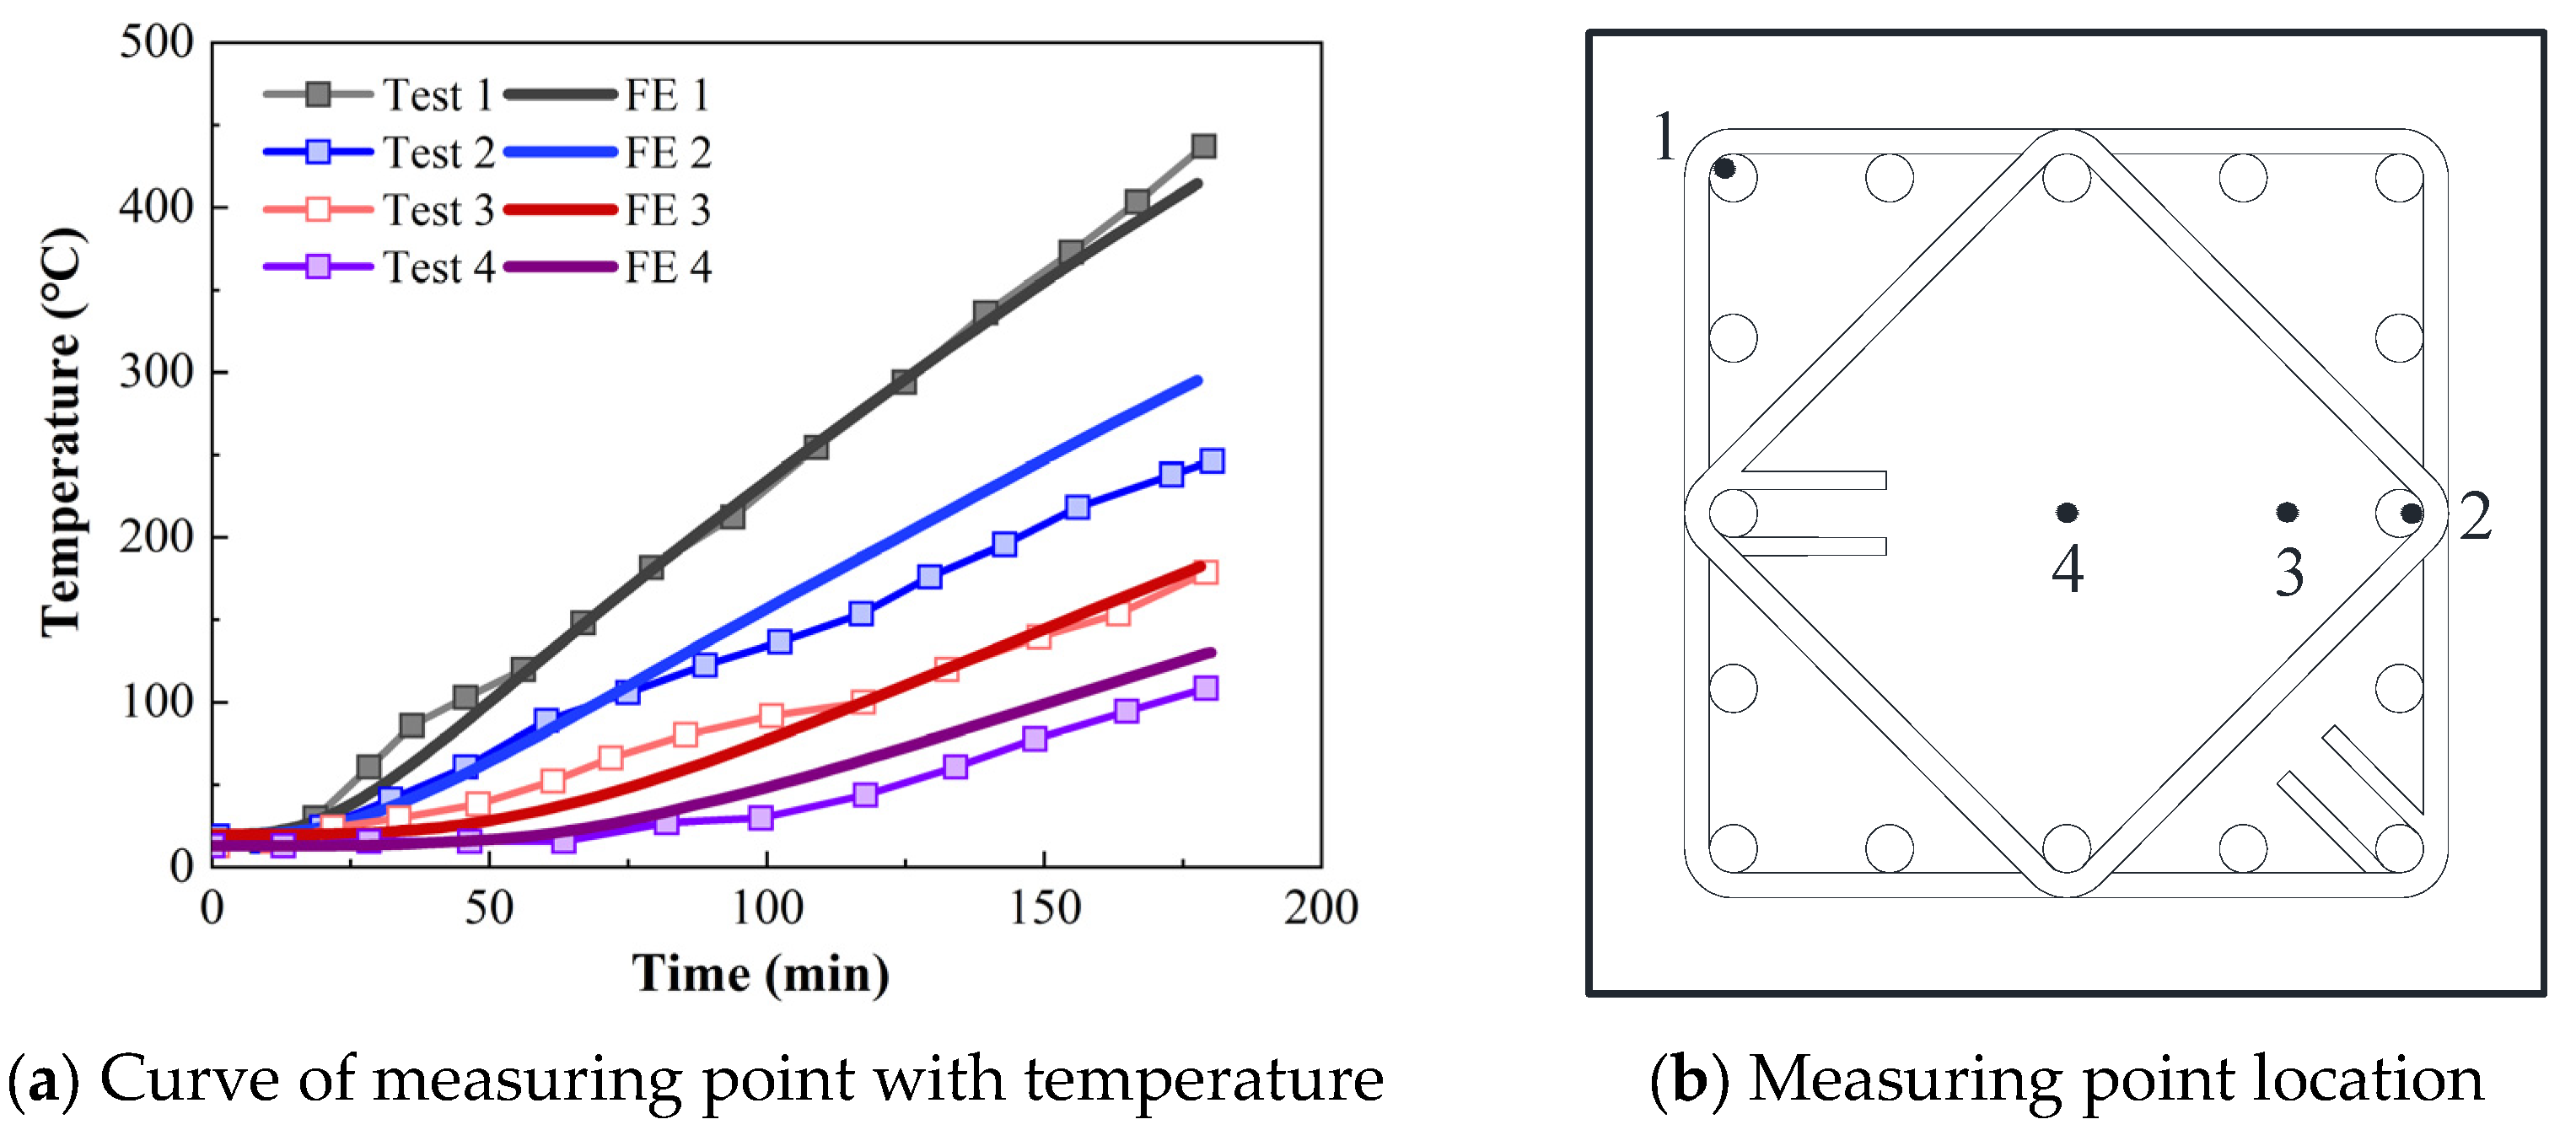
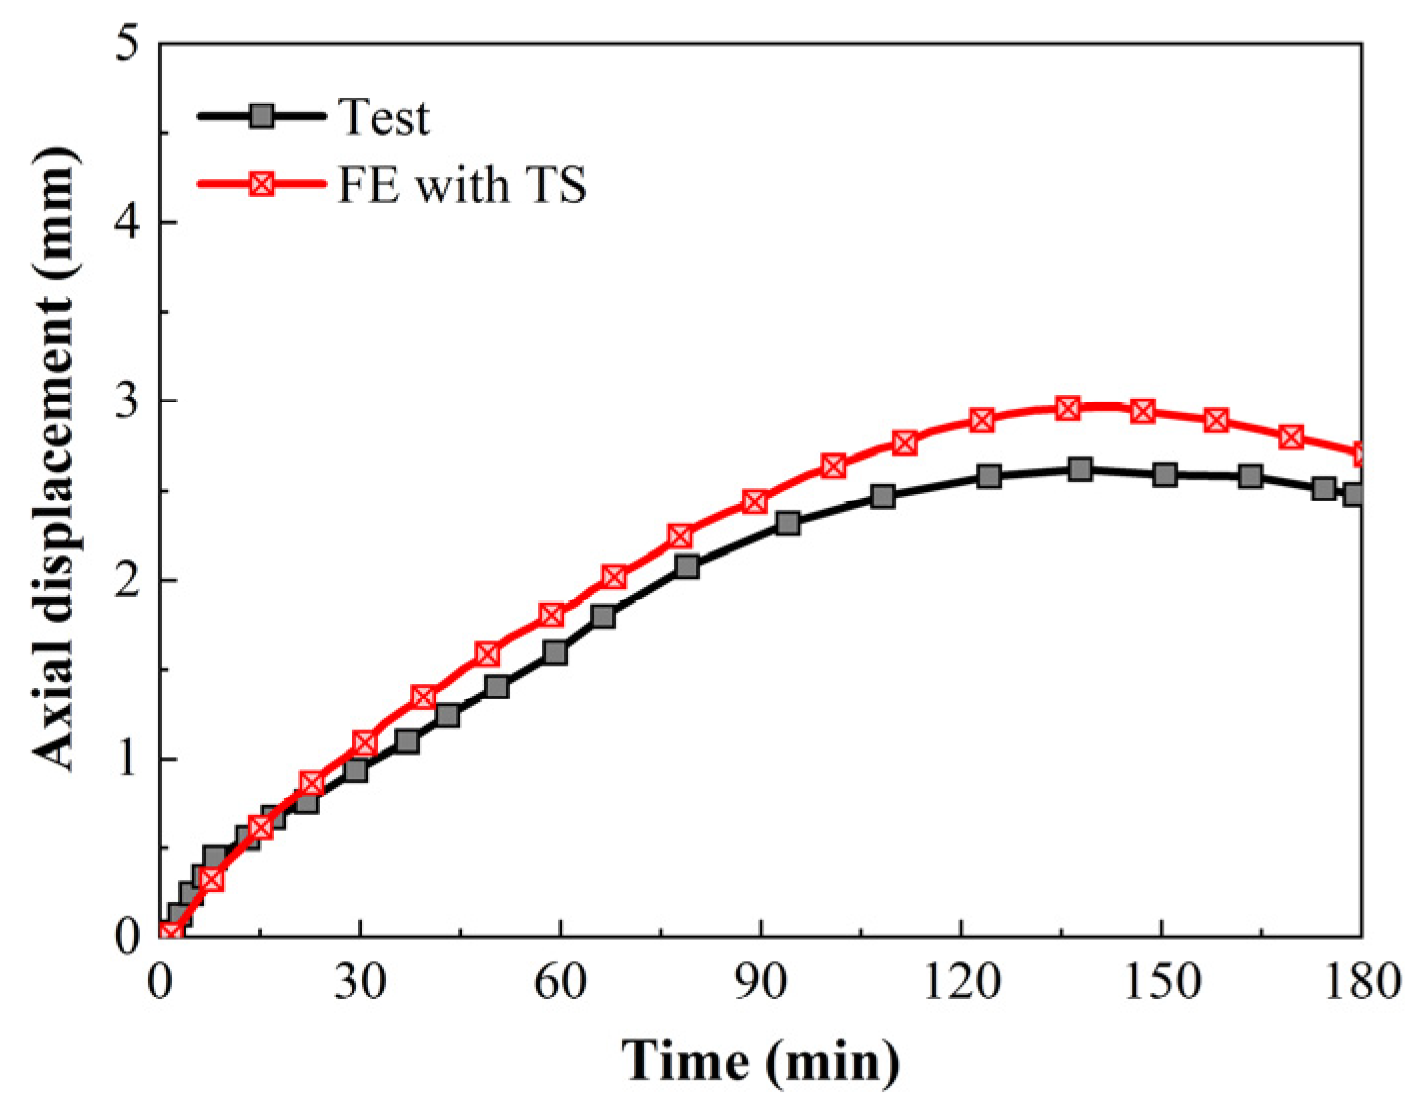
Lee et al. [17] conducted the fire resistance tests of two full-size UHSC concrete columns with 200 MPa compressive strength under fire and post-fire. The column section size was 500 mm × 500 mm, and the column height was 3.48 m, equipped with 16 longitudinal bars with a diameter of 29 mm and a yield strength of 500 MPa, while the stirrup diameter was 13 mm with a spacing of 100 mm. Before the temperature rise, a load of 9500 kN was applied, and the heating was controlled by the ISO 834 temperature rise curve. The UHSC mixture was fiber-reinforced (0.2% PP fibers, 0.2% nylon fibers, 0.5% steel fibers). No spalling occurred during the 3 h heating period. The variation curves of the column section temperature field and the column top displacement with time are shown in Figure 8 and Figure 9.
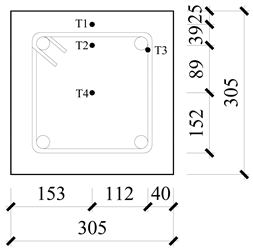
Figure 8 shows that the simulation results generally match the experimental data. However, the simulation results of the UHSC column reinforcement measurement point 2 and the core area temperature measurement point 4 are slightly higher than the test values. This is because, in ABAQUS, the migration of RPC moisture cannot be considered [33]. In Figure 8b, the numbers 1, 2, 3, and 4 respectively represent the positions of the thermocouple measurement points.

2.6.3. RPC Material Constitutive Verification

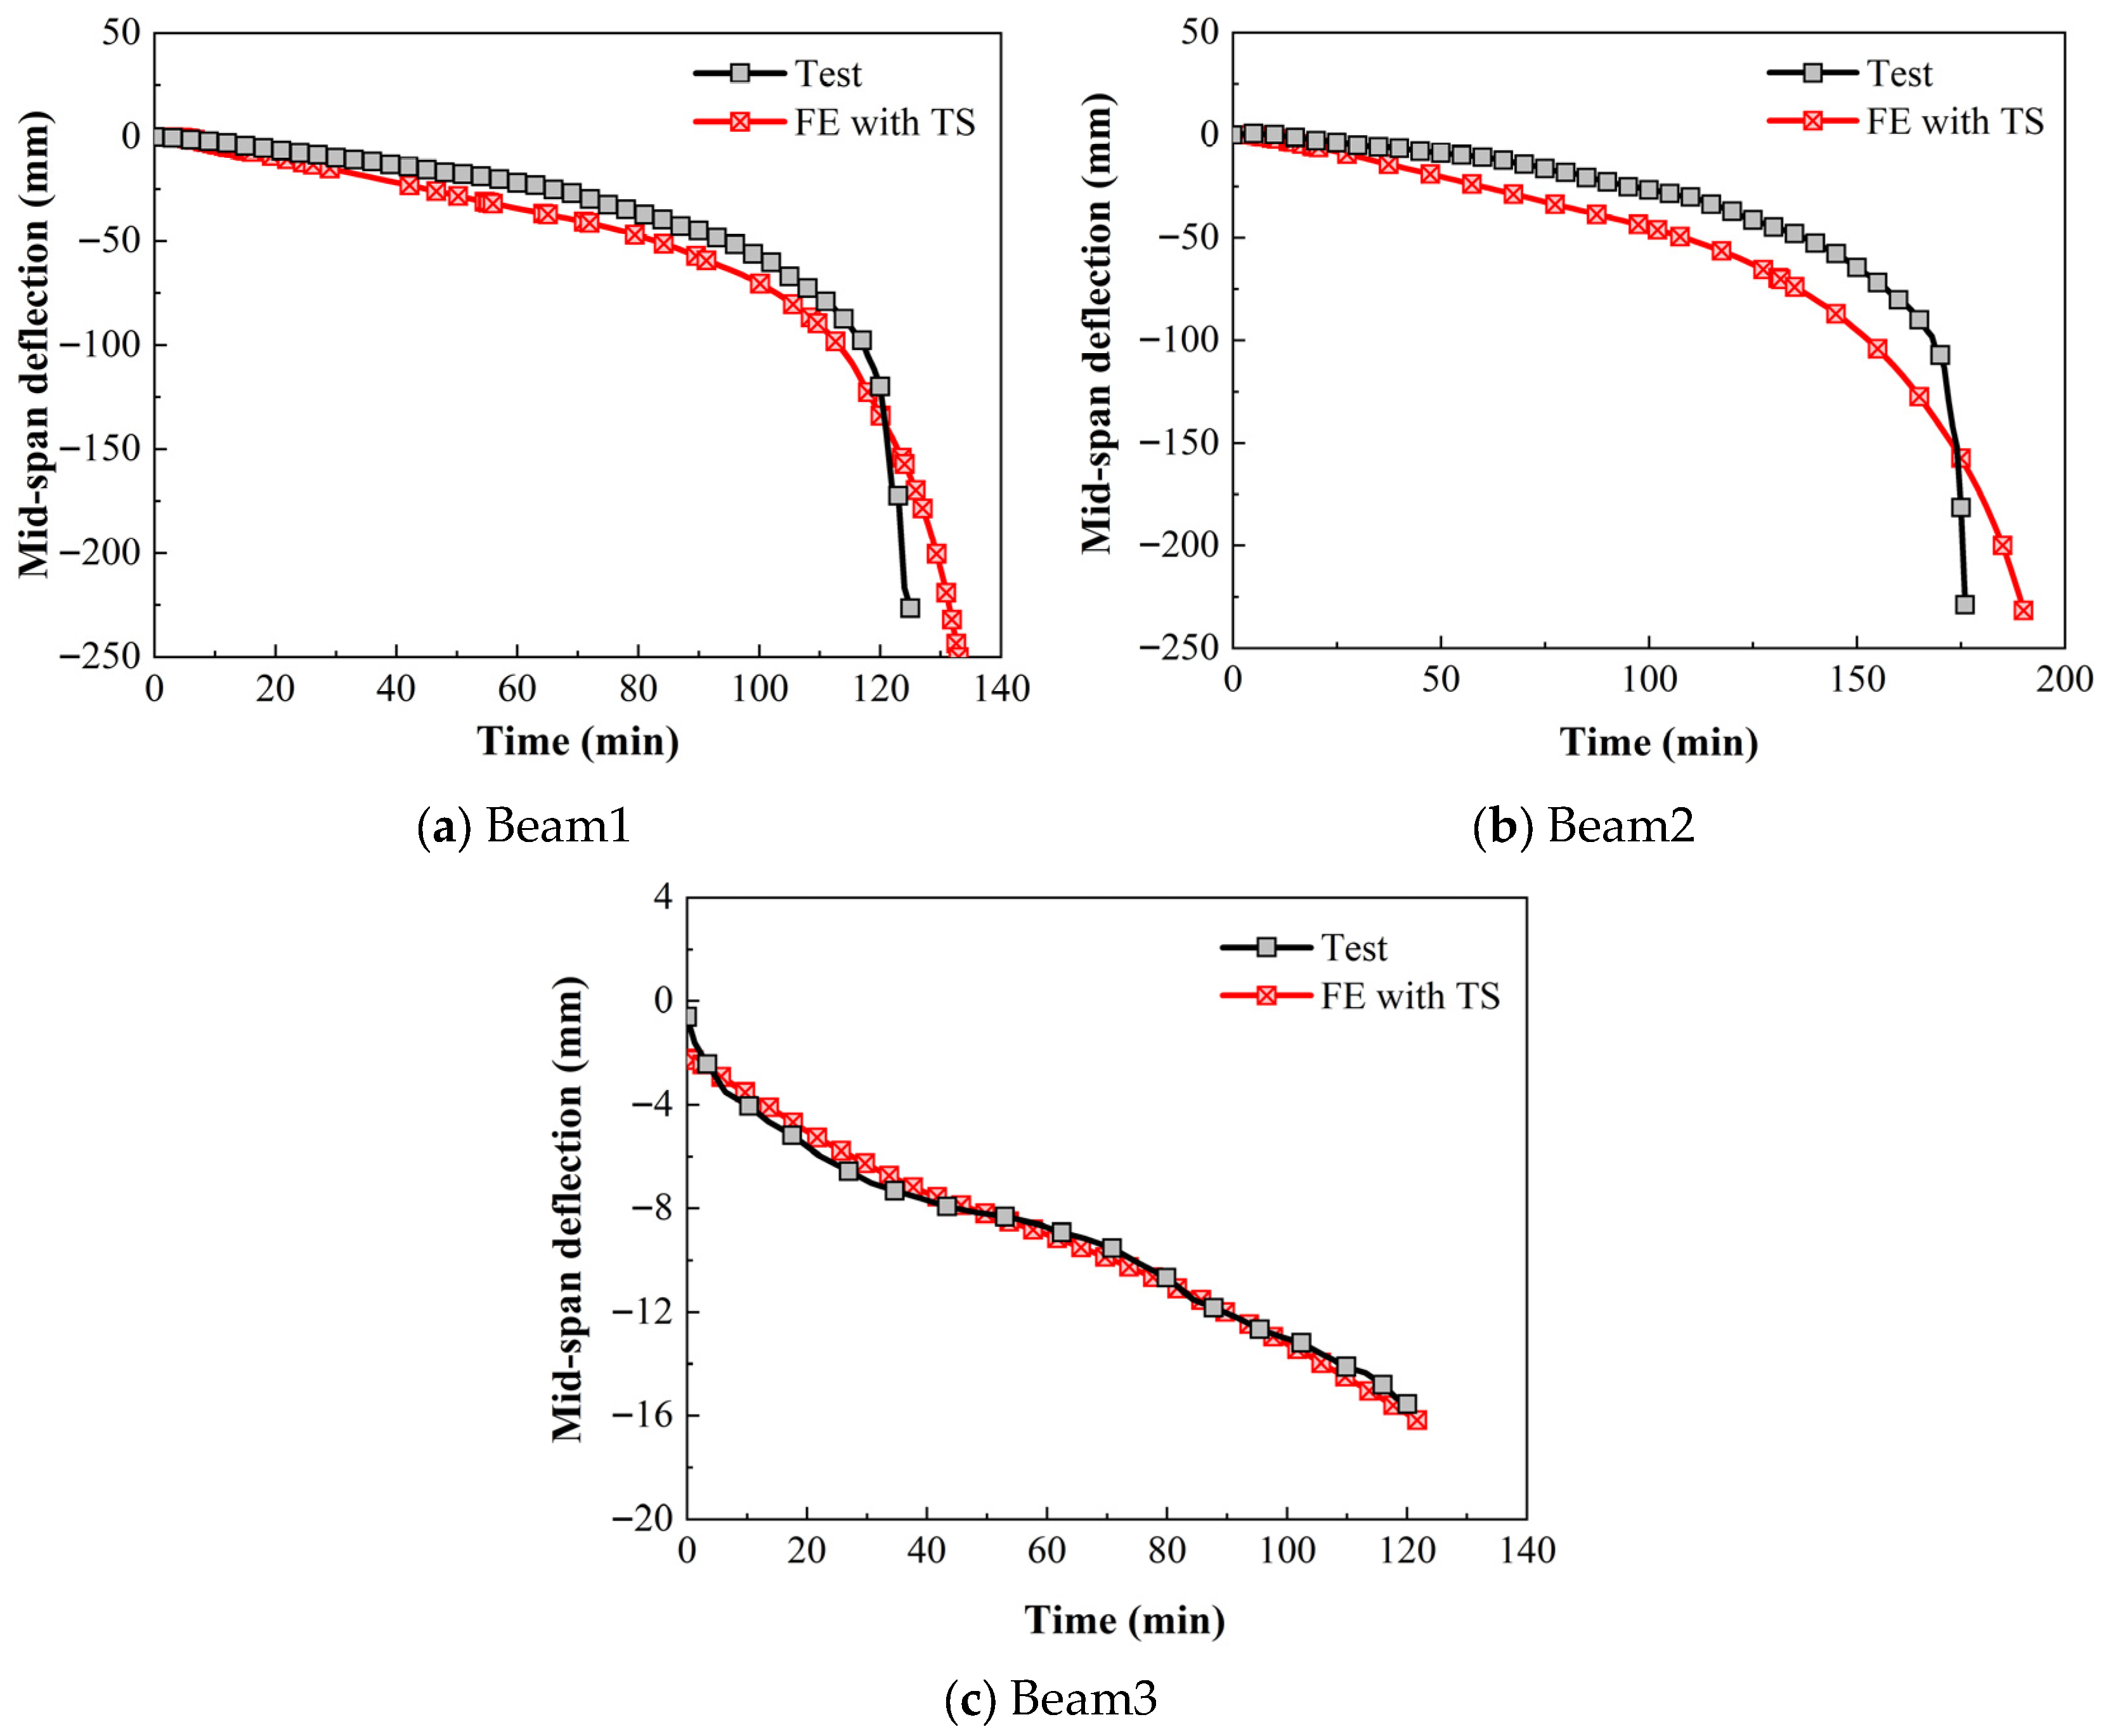
In order to verify the RPC material model, fire resistance tests of three simply supported RPC beams under fire, conducted by Hou [29] and Bayati [44], were selected. These three RPC beams were subjected to concentrated loads at the three-point bending configuration. The bottom and sides of the beams were exposed to fire on three sides. Test details are presented in Table 4.
The thermal parameters and constitutive relationships used in the FE model for the fire resistance of the RPC beams were identical to those used for the RPC columns described earlier. The same elements and meshing techniques were applied. The TS model was also computed by Equation (8). The temperature field and mid-span deflection curves for the RPC beam as a function of fire exposure time are shown in Figure 10. The calculated results are close to the experimental values. Thus, it is concluded that the sequentially coupled FE model of fire resistance established in this study can accurately predict the mechanical performance of RPC beams under fire and effectively accounts for the TS influence.

3. Effect of TS on Fire Resistance of RPC Columns

The effects of different section sizes, axial compression ratios, reinforcement ratios, fire conditions, and concrete protective layer thicknesses on the fire resistance performance and the TS effect of RPC columns were analyzed. For ease of comparison, the same calculation method was applied to the load levels of axially loaded columns, specifically using the ratio of the applied vertical load to the maximum bearing capacity of the RPC column section, as calculated by ACI 318 [45]. The geometric parameters and fire conditions used for the RPC column analysis are presented in Table 5, Table 6, Table 7, Table 8 and Table 9.
The fire resistance of the RPC column refers to the provisions of ISO-834 [19]. In order to analyze the impact of concrete TS on the fire resistance performance of the RPC column, the fire resistance and its error percentage under two working conditions without considering/considering TS were calculated under each working condition. The detailed calculation results are given in Table 10.

3.1. Effect of Section Size

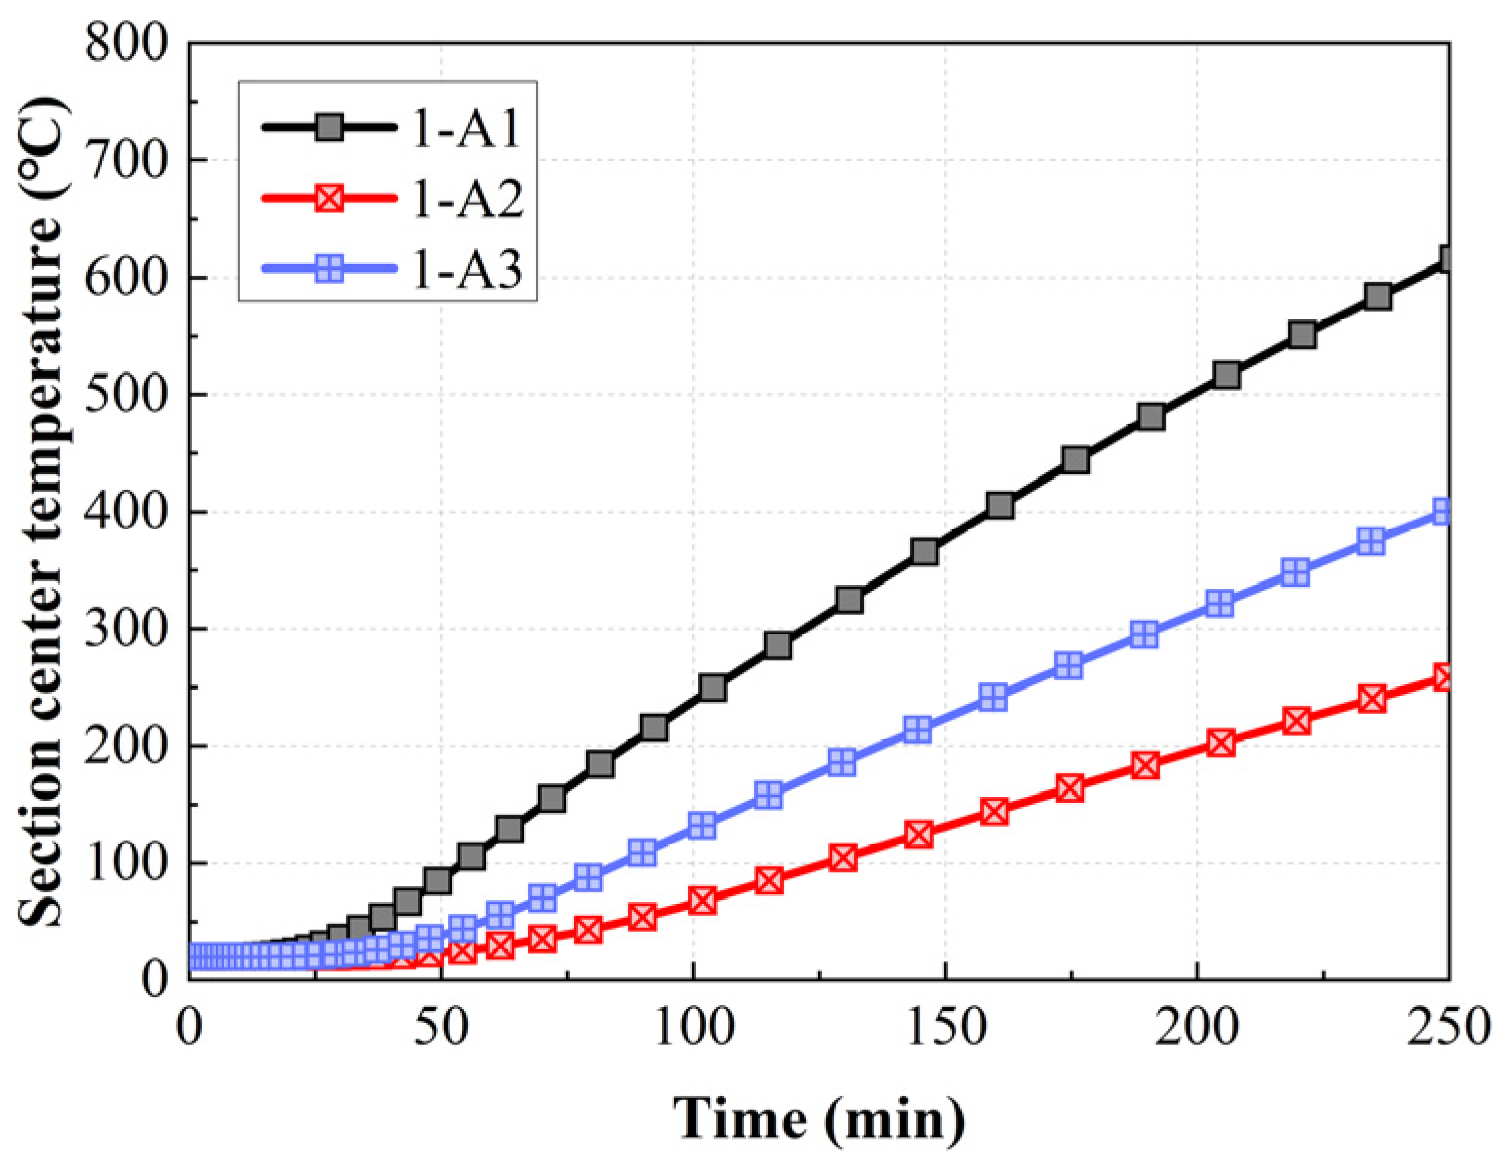
The calculation results in Table 10 show that, with the increase in section size, the fire resistance of the three RPC columns significantly improved for the same reinforcement ratio and load level. Taking the RPC-A column as an example, Figure 11 shows the temperature–time curve for the core unit. When the RPC column 1-A1 with a smaller section size reached a fire resistance of 189 min, the minimum temperature of the cross-section was about 481 °C. In contrast, the temperature at the central point of the cross-section for RPC columns 1-A2 and 1-A3, with relatively larger section sizes, is about 295 °C and 183 °C, respectively, at the same fire duration. This indicates that increasing the section size effectively reduces the proportion of the high-temperature region within the concrete cross-section. It lowers the average temperature, thus improving the fire resistance of the RPC columns. When the section size reached 500 mm, all three RPC column types could meet the 3–4 h fire resistance requirements for column components, as specified by ACI 318 [45] and the Chinese code for the fire protection design of buildings [47].
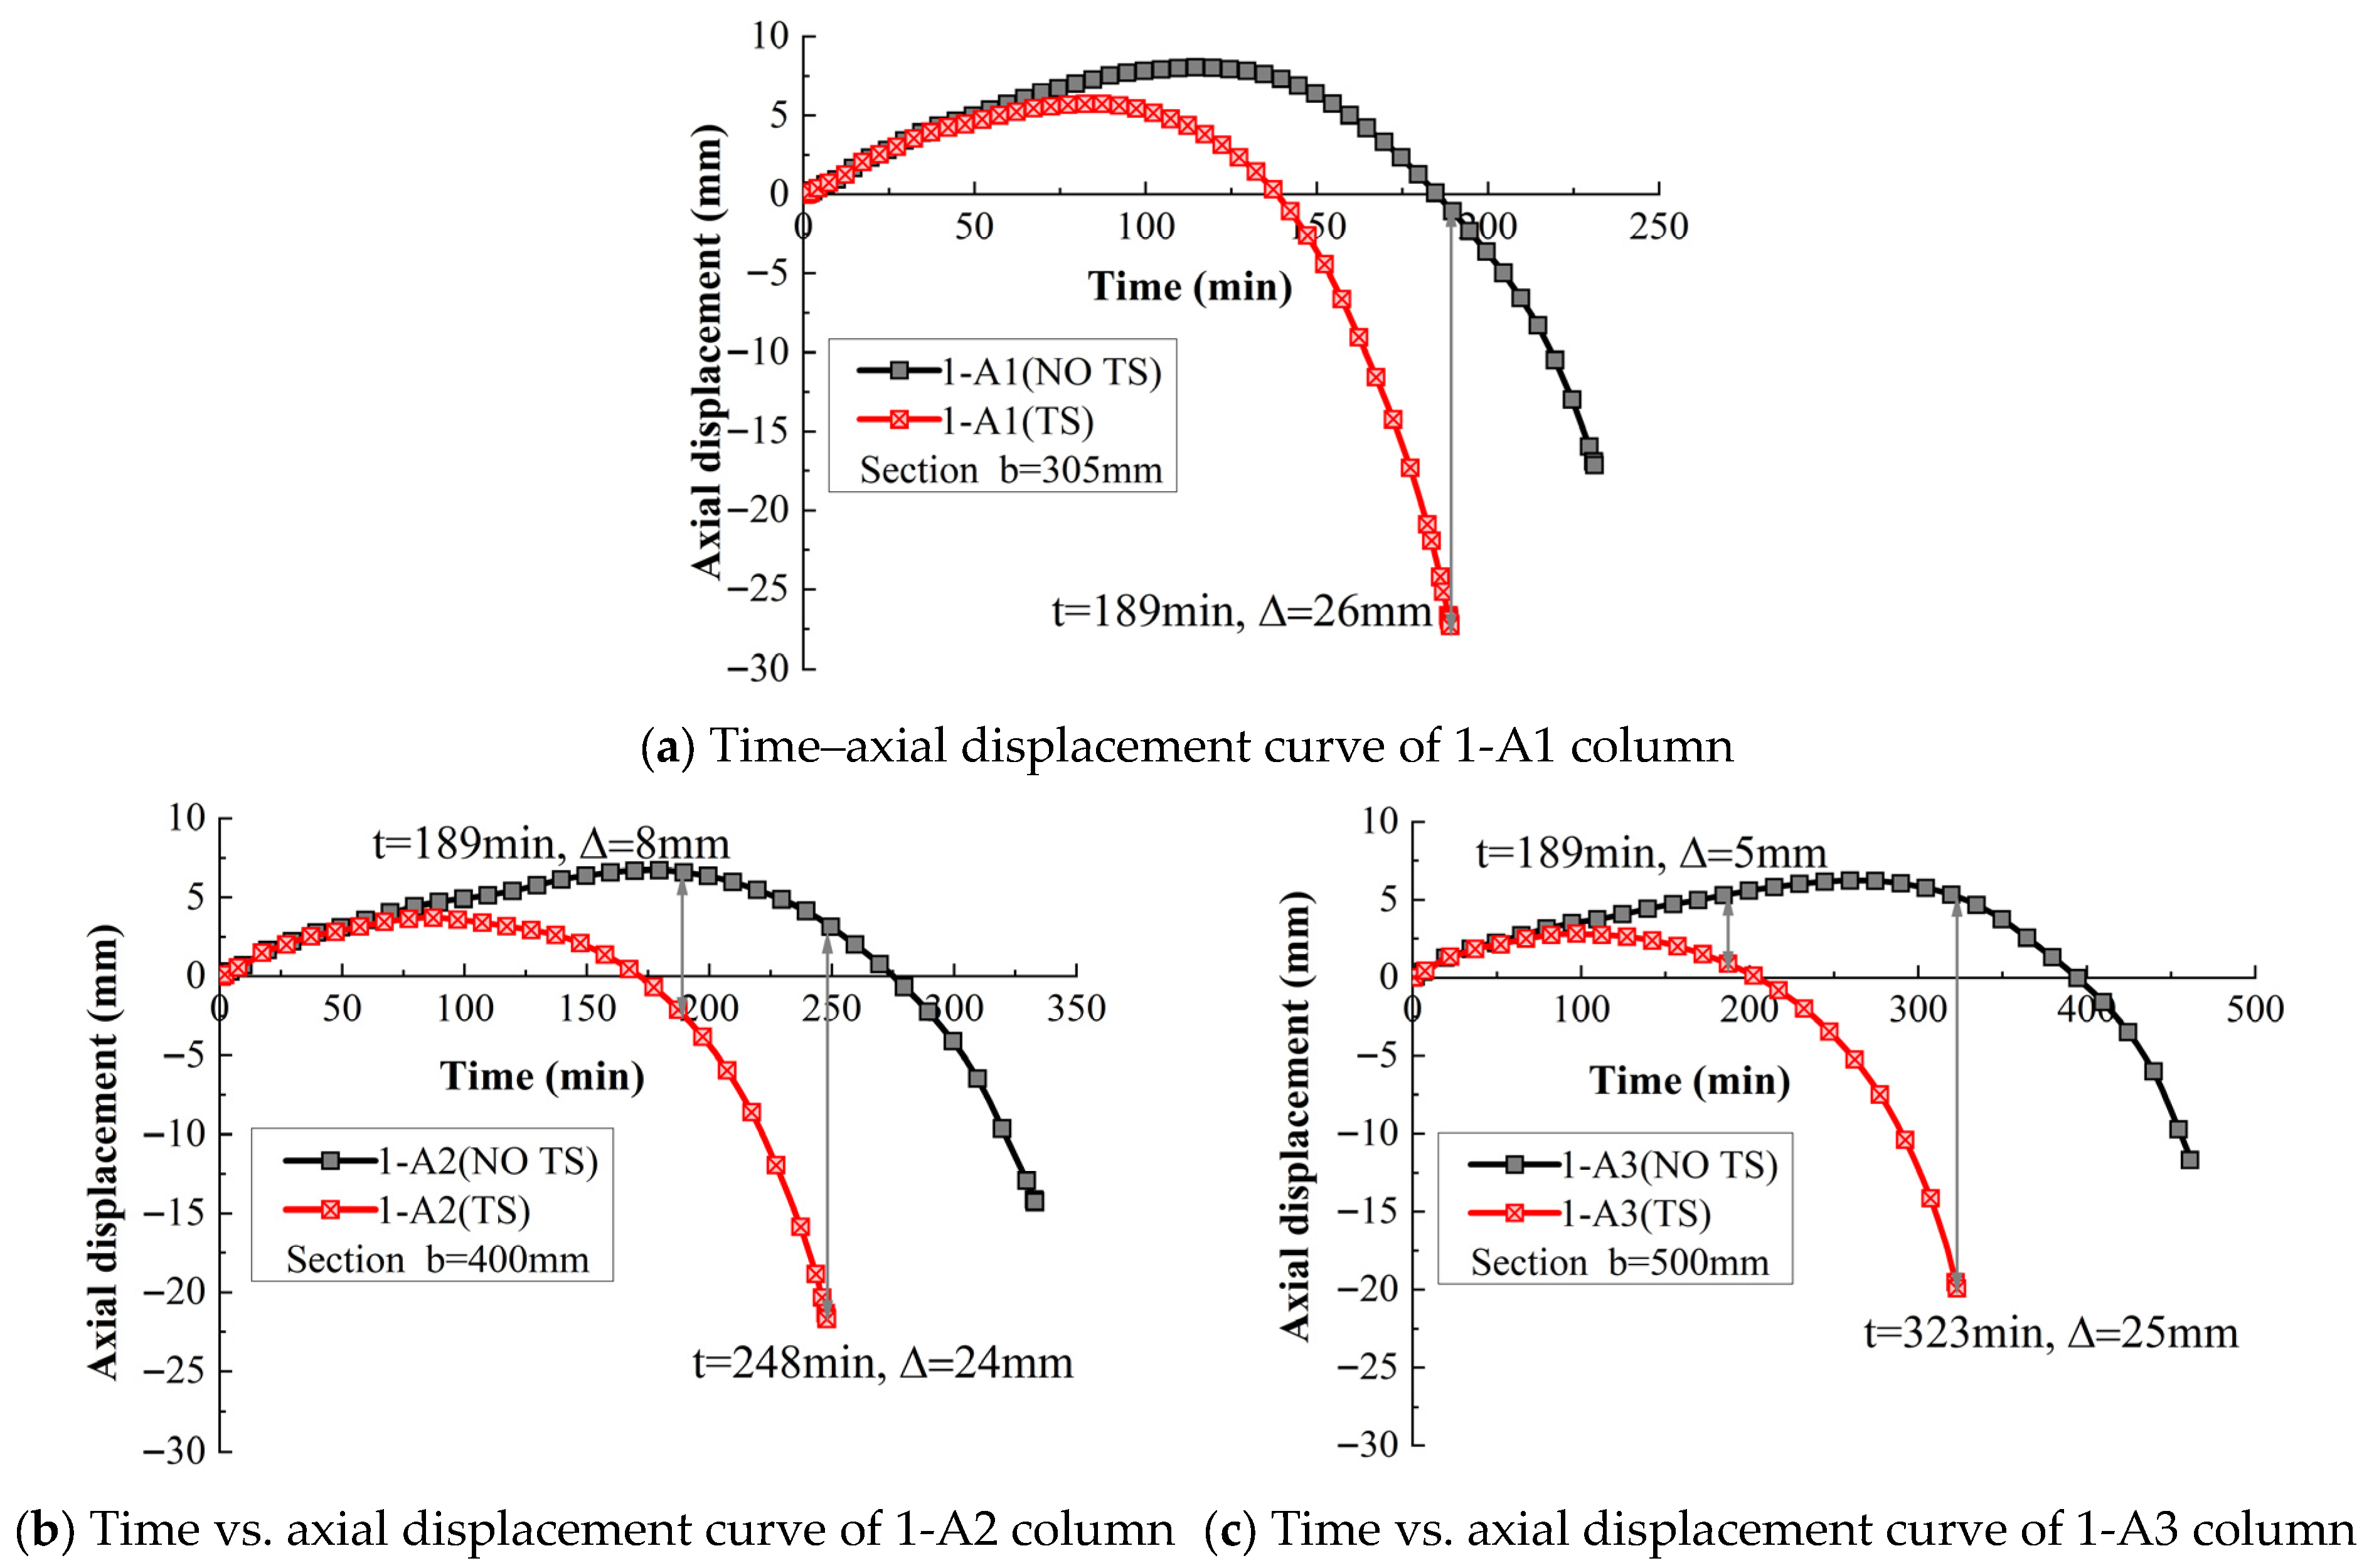
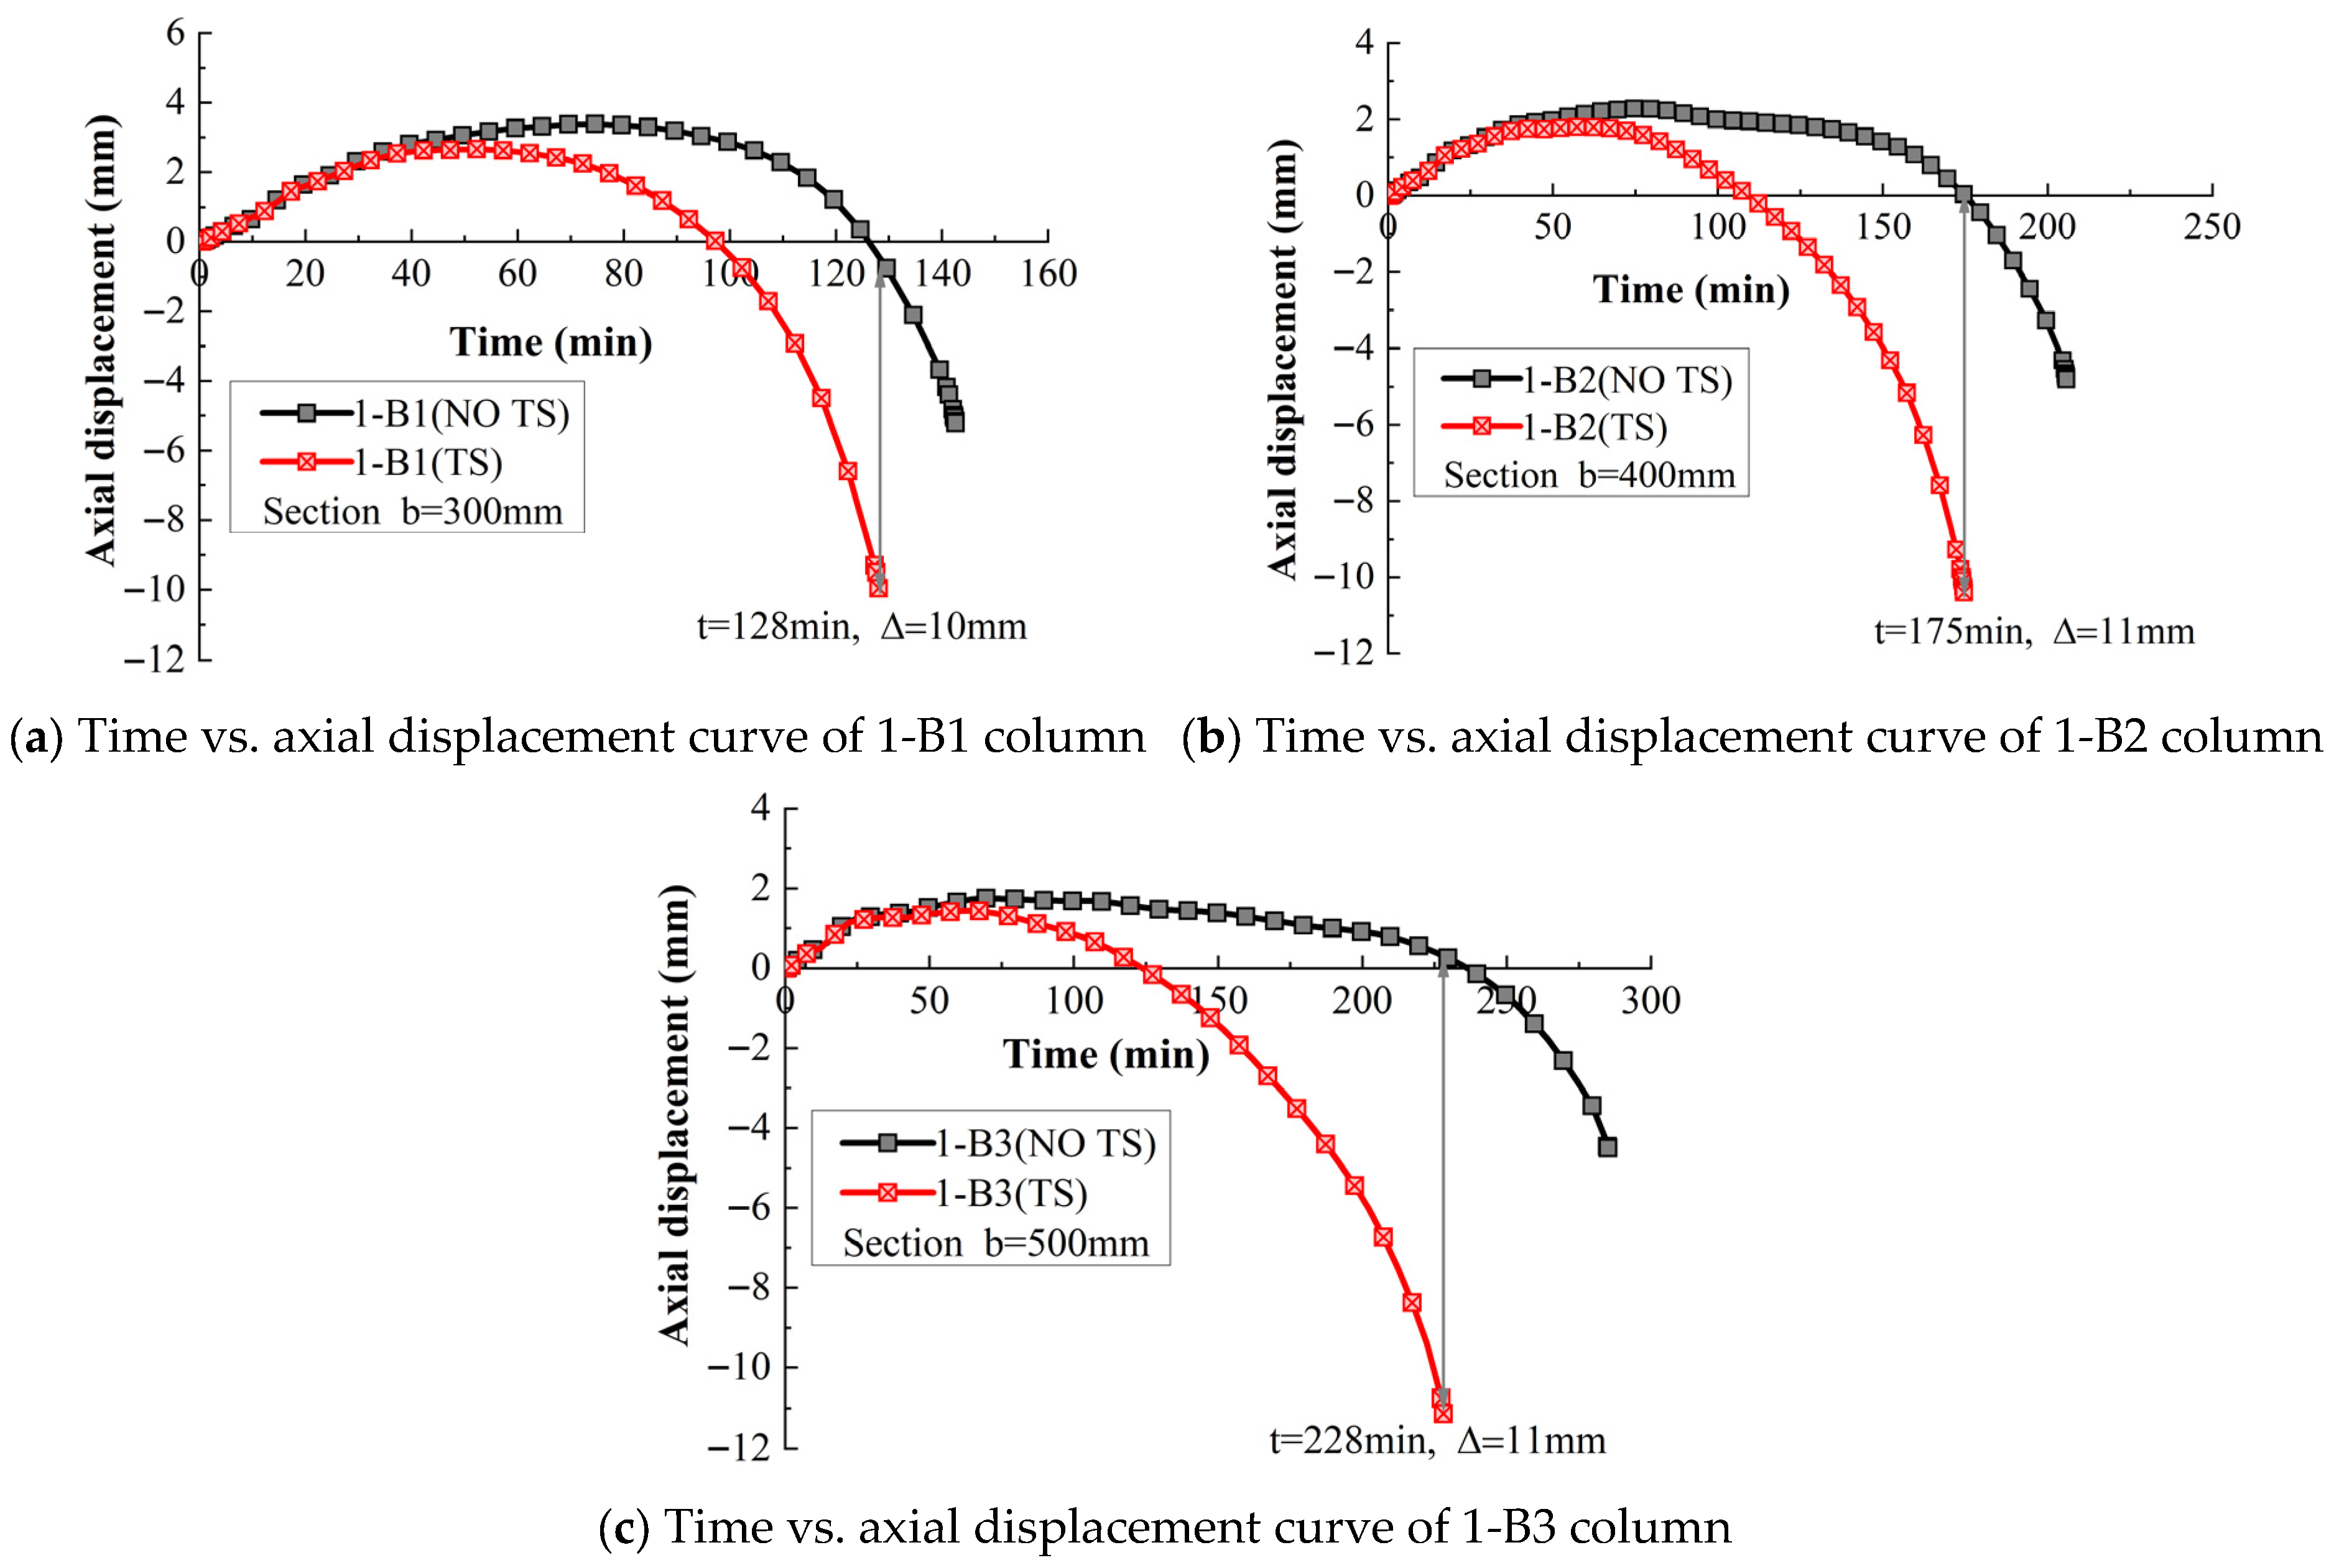
As shown in Figure 12, Figure 13 and Figure 14, it is evident that neglecting TS in the calculation significantly alters the predicted axial deformation of RPC columns under fire conditions. This discrepancy becomes more pronounced with increasing the cross-sectional size and prolonged fire exposure. For the RPC-A column with a 305 mm cross-section, the fire resistance is 189 min when TS is considered, compared to 231 min when TS is ignored—an overestimation of 22%. As the cross-section increases to 400 mm and 500 mm, the fire resistance increases to 248 and 323 min, respectively, while the TS effect correspondingly rises to 34% and 43%. Notably, neglecting TS leads to an underestimation of axial displacement by approximately 25 mm compared to the actual condition. Similar trends are observed in RPC-B and RPC-C columns. With an increasing cross-section, the fire resistance of RPC-B and RPC-C increases by 100 and 78 min, respectively. Meanwhile, the influence of TS on fire resistance increases from 12% and 10% to 25% and 26%. Furthermore, excluding TS results in a reduction of axial displacement at failure by approximately 11 mm for RPC-B and 16 mm for RPC-C.
In summary, neglecting the influence of TS leads to an overestimation of both the fire resistance and axial deformation of RPC columns under fire conditions. First, larger cross-sectional sizes result in steeper temperature gradients and uneven temperature distributions within the cementitious matrix, inducing internal tensile and compressive stresses. These stresses accelerate the formation of microcracks, which amplify the TS effects and generate additional internal stresses, thereby increasing and accelerating the axial deformation of RPC columns during fire exposure. Second, at the same load level, increasing the cross-sectional size leads to a higher total applied load. When the reinforcement configuration remains unchanged, the relative contribution of the steel decreases, causing a greater share of the load to be borne by the concrete. This increases the compressive stress in the concrete and intensifies the development of TS. As a result, the beneficial effect of increasing the cross-sectional size on fire resistance is offset by the amplified TS effect.
Therefore, the influence of TS should be explicitly considered in the fire resistance design of large-section RPC columns, as it may undermine the expected performance benefits of increased cross-sectional dimensions.

3.2. Effect of Load Level

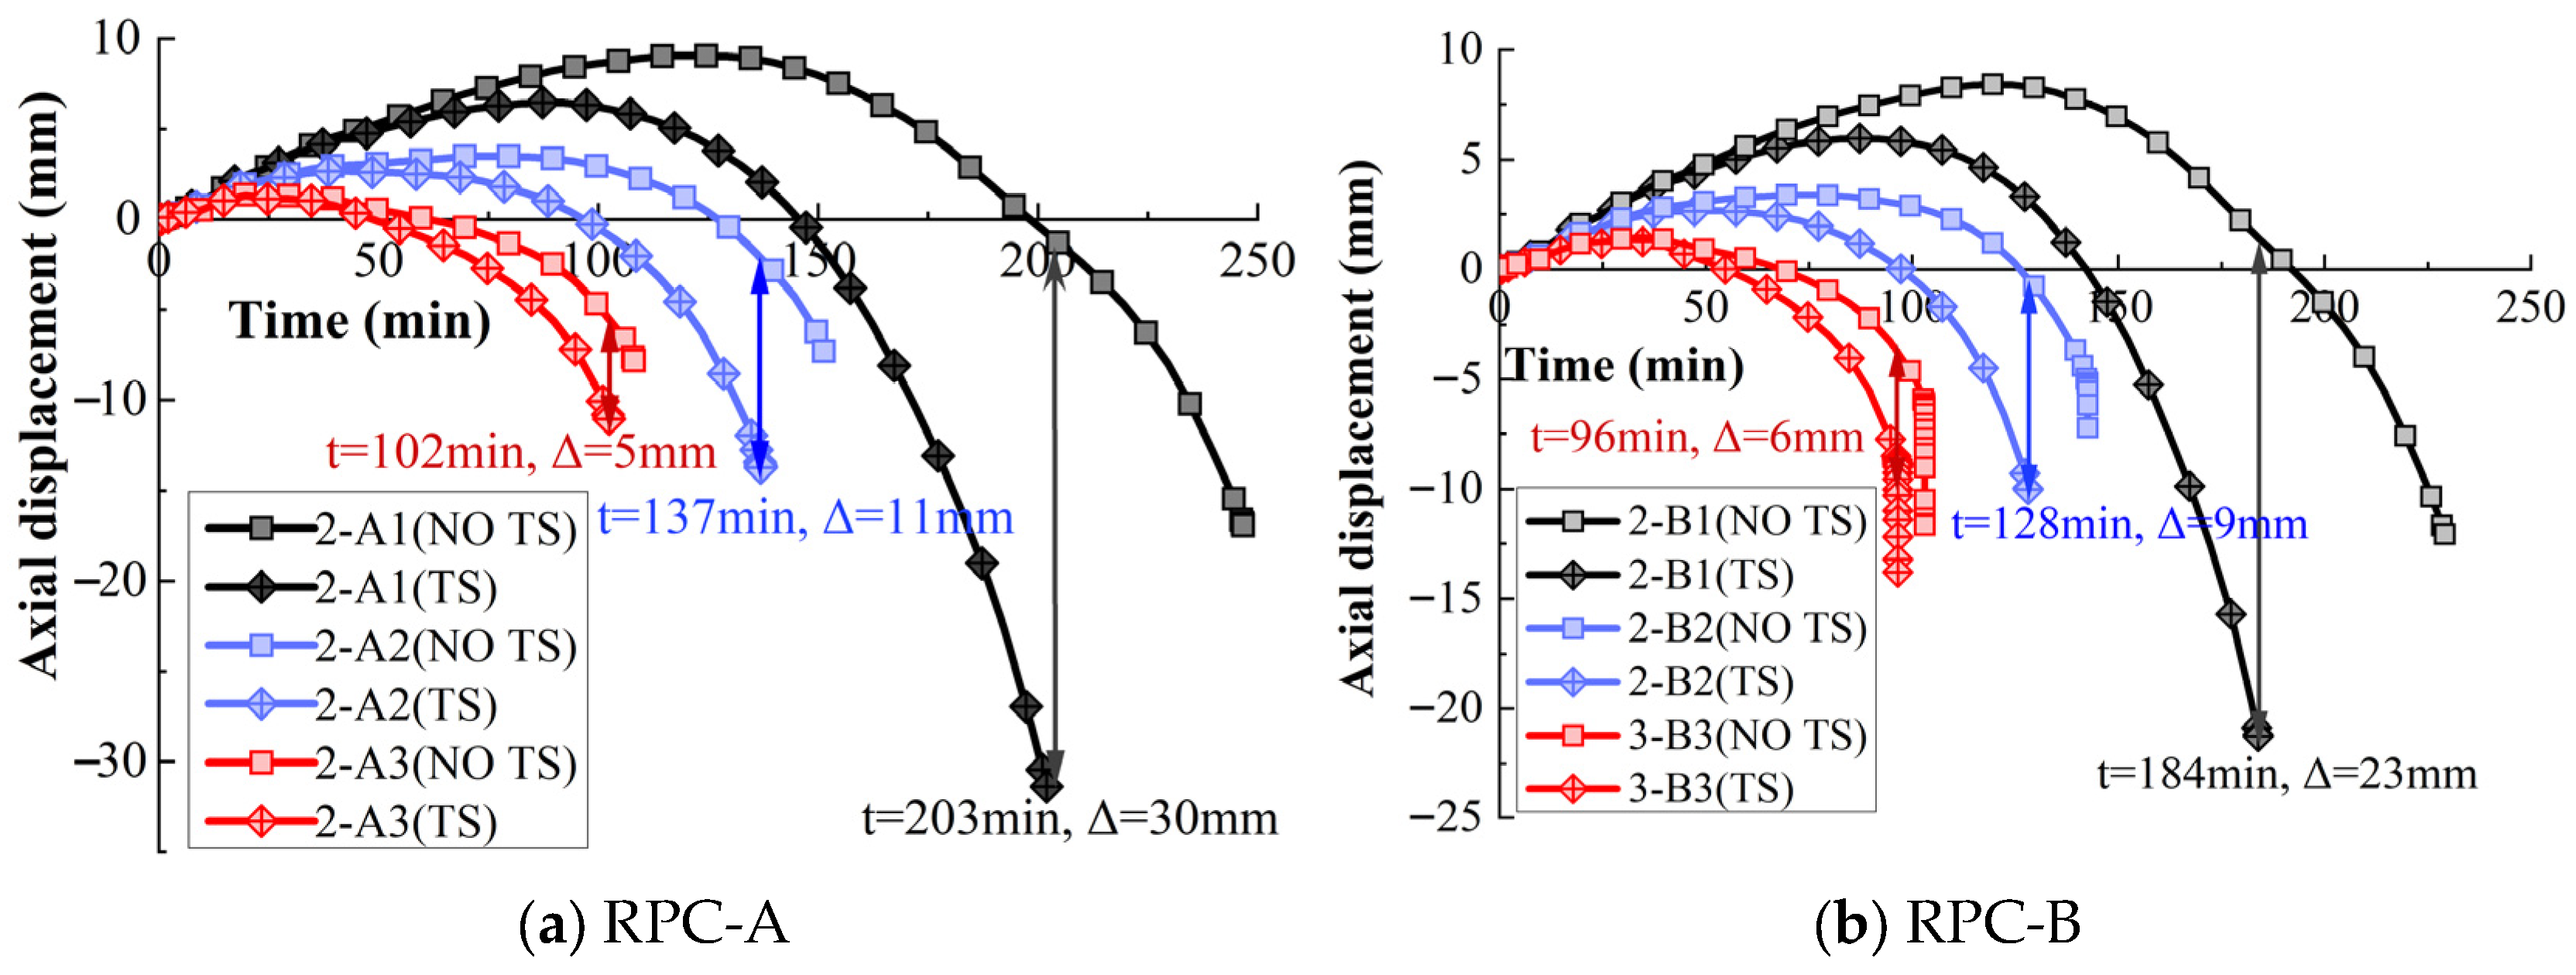
The calculation results in Table 10 indicate that the fire resistance decreases significantly with the increasing load level, and the TS influence on the fire resistance of RPC columns gradually diminishes. For the RPC-A column, when the load level is 44%, the fire resistance is 203 min. However, the calculated fire resistance is 247 min when TS is not considered, resulting in a disparity of 42 min, i.e., 22% of the total fire resistance. As the load level increases to 65% and 88%, the fire resistance decreases to 137 min and 102 min, respectively. The fire resistance calculated without considering TS is noticeably different (152 min and 108 min, respectively), with the TS effect on fire resistance reduced to 11% and 6%. A similar trend was observed for the RPC-B column under the three load levels considered in this study. Further, it is evident from the deformation curves of the RPC-A and RPC-B columns under fire that, as the load increases, the axial deformation at the point of fire resistance becomes smaller, indicating reduced deformation capacity under fire. The difference in axial displacement between the conditions with and without considering TS also decreases as the load level increases.
The calculation results for the RPC-C column show that the aforementioned trend is more pronounced. When the compressive stress is low (i.e., a load level of 42%), the fire resistance is 362 min. However, when TS is not considered, the calculated fire resistance is 497 min, reduced by 135 min, i.e., 37% of the total fire resistance. The TS impact on fire resistance is significant in this case. As the load level increases to 65% and 88%, the fire resistance decreases to 258 min and 192 min, respectively. Without considering TS, the fire resistance is 42 min and 27 min longer, respectively. Consequently, the effect of TS on fire resistance is reduced to 16% and 14%, significantly lower than the 37% error observed at a load level of 42%. This result is different from the typical observation that the greater the stress level in ordinary concrete columns, the greater the impact of TS on fire resistance. The main reasons for this deviation may be as follows.
  • When the RPC column reaches fire resistance, although the temperature outside the RPC section is very high, the temperature of about 53% of the core area of the RPC section is lower than 600 °C, and the RPC TS of the low-temperature part has not been fully developed;
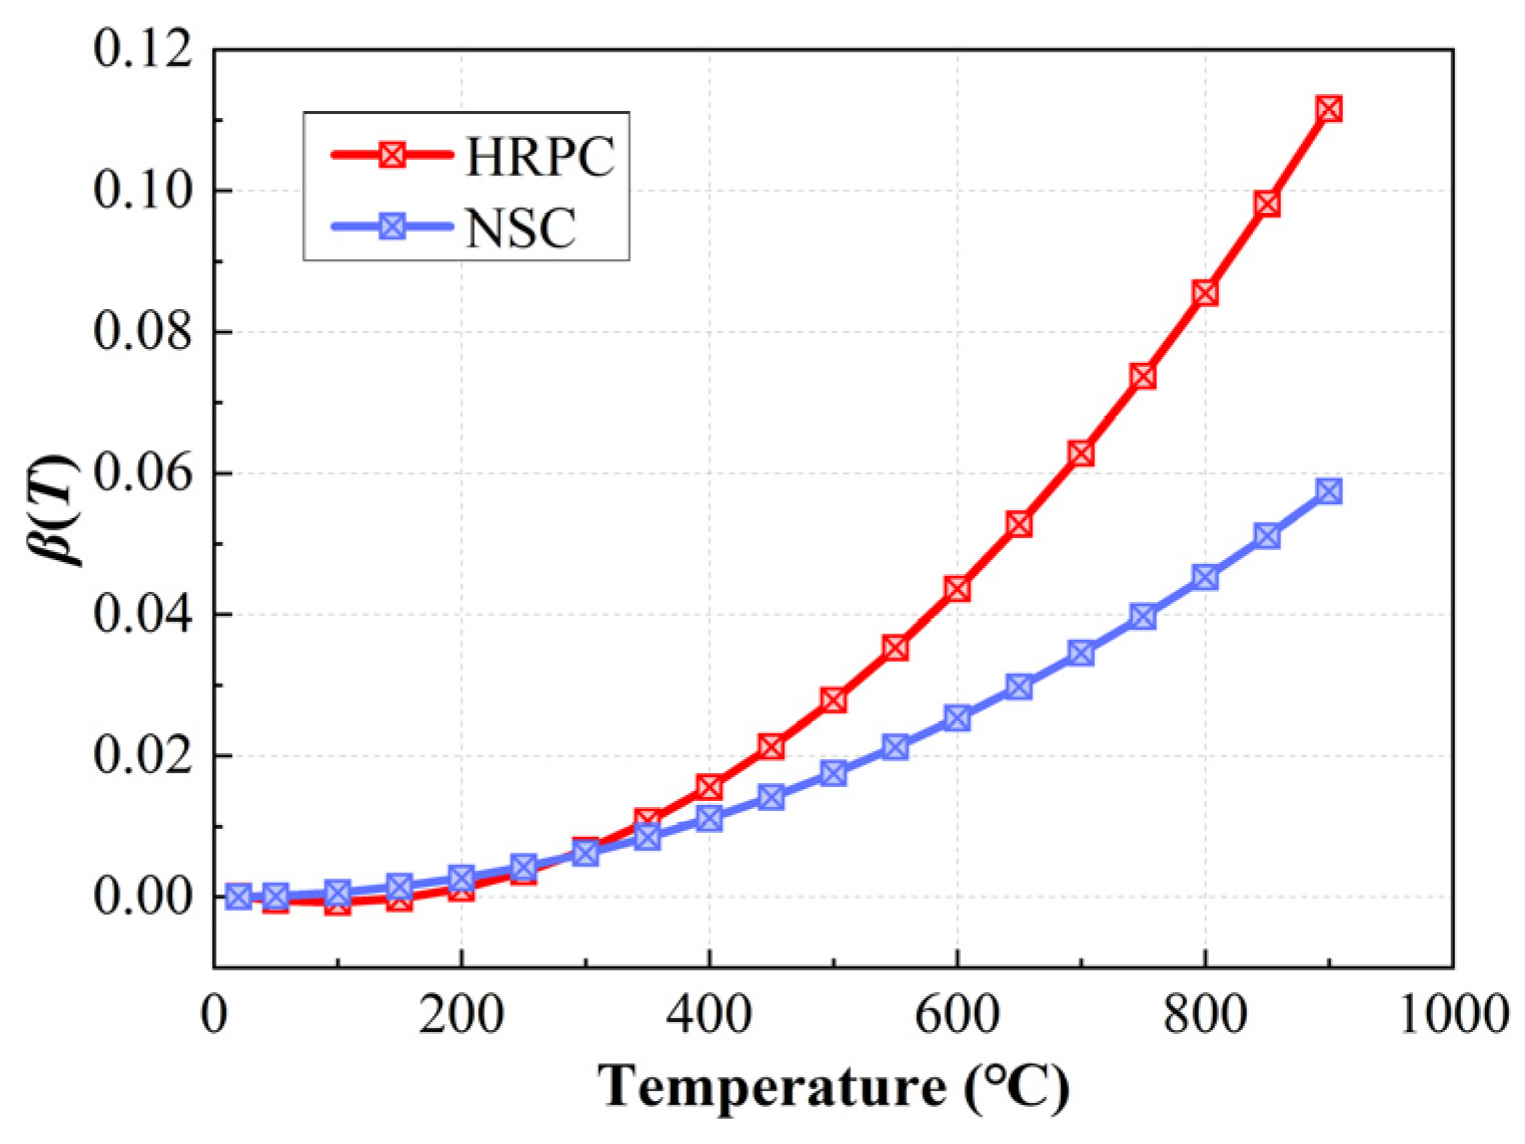
  • The TS calculation model used in this study is mainly related to stress and temperature. The TS of RPC is proportional to the stress level and increases exponentially with the increase in temperature. The unit stress TS value [40] of RPC and NC was introduced, as expressed in Equation (16).
β T = ε tr σ / f c
As shown in Figure 15, for the temperature < 400 °C, the TS of HRPC is very small and almost the same as that of NC. However, with temperature increase, the TS increases significantly, exhibiting a higher temperature sensitivity than NC. Therefore, for RPC columns, the relatively low temperature offsets the effect of TS caused by increasing the load level on the fire resistance duration.
In order to further investigate the influence of compressive stress on the TS effect for the same temperature of the RPC column, the axial deformations were compared based on the fire resistance of three types of RPC columns at the maximum load level, which was taken as the reference time. Figure 16 shows that, for the RPC-A column with a load level of 88%, when column 2-A3 reaches its fire resistance of 102 min, the axial deformation in the case where TS is not explicitly considered is reduced by 5.0 mm. Also, for columns 2-A1 and 2-A2, the differences in axial deformation between considering and ignoring TS are 30 mm and 11 mm, respectively. The same pattern is observed for the RPC-B and RPC-C columns, i.e., the higher the load level, the greater the difference in axial deformation at the same time. By comparing the results of all three types of RPC columns, it is ascertained that the longer the fire exposure, the more pronounced this trend is.
The effect of load level and TS can be categorized into two cases: first, under the same fire duration, the greater the compressive stress on the RPC column, the more significant the impact of TS on fire resistance, leading to a greater difference in axial deformation. This suggests that the influence of TS should be carefully considered for RPC columns under high-stress conditions. Second, when the stress level is low and the RPC column has sufficient fire resistance, TS has a more significant effect on fire resistance due to the simultaneous interaction between temperature and stress levels, as well as the unique properties of RPC.

3.3. Effect of Reinforcement Ratio

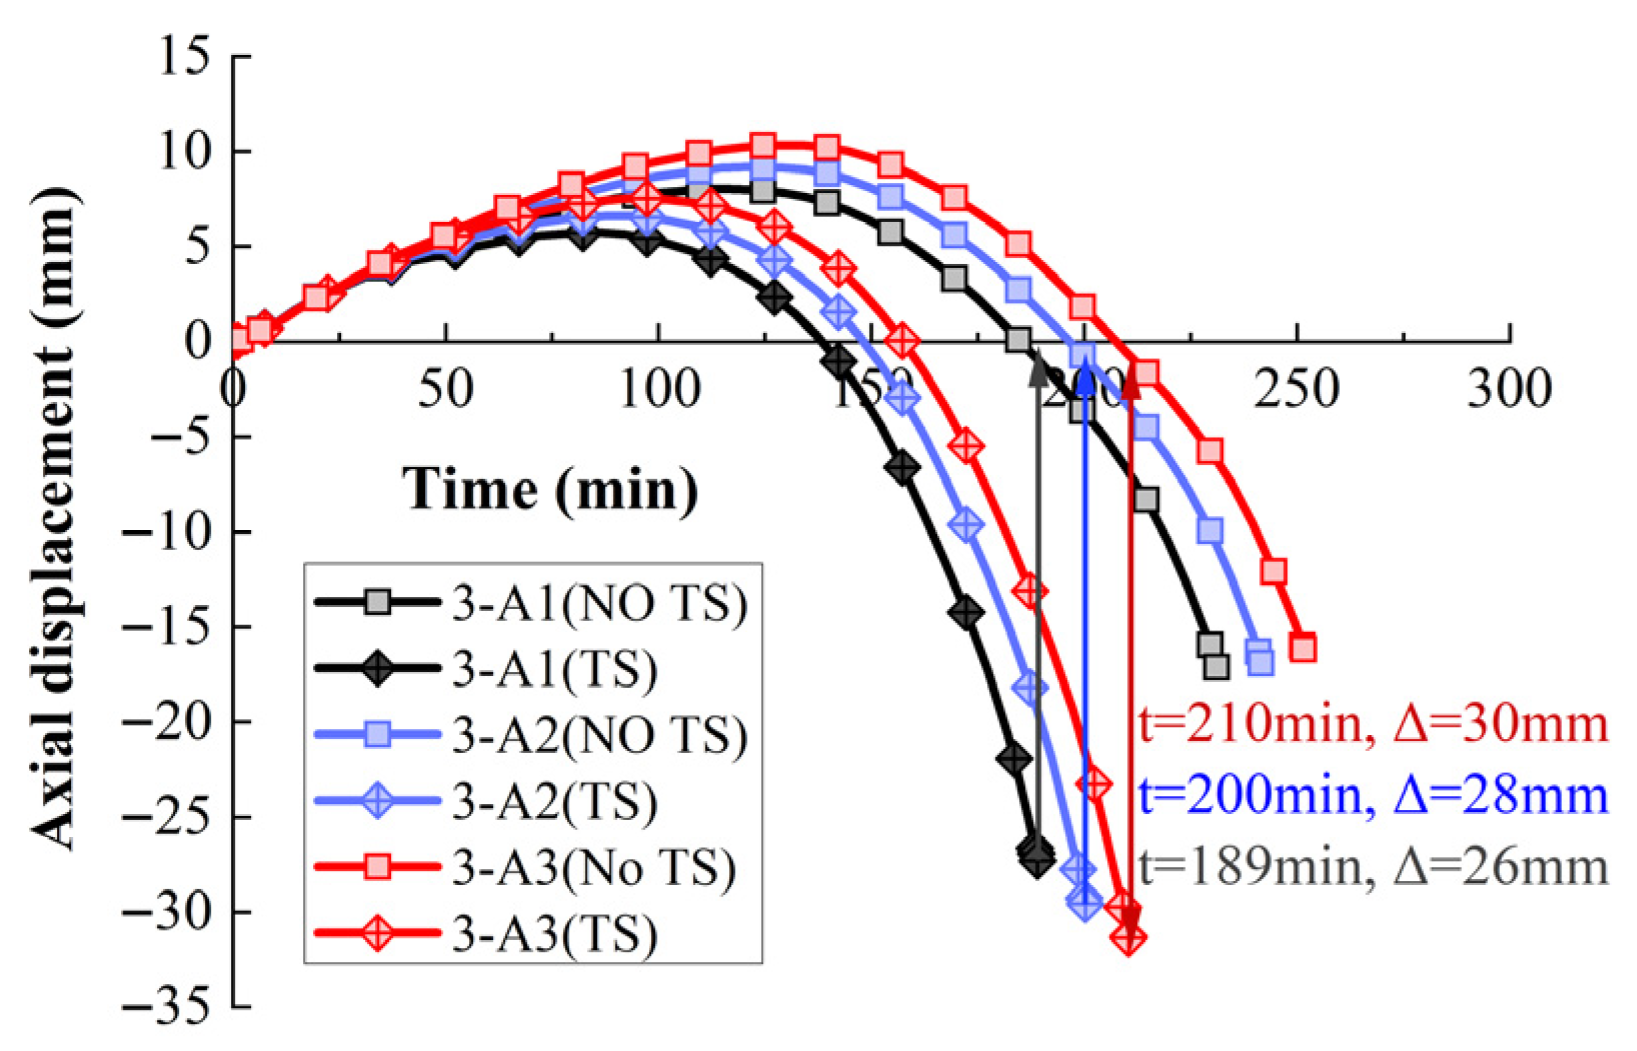
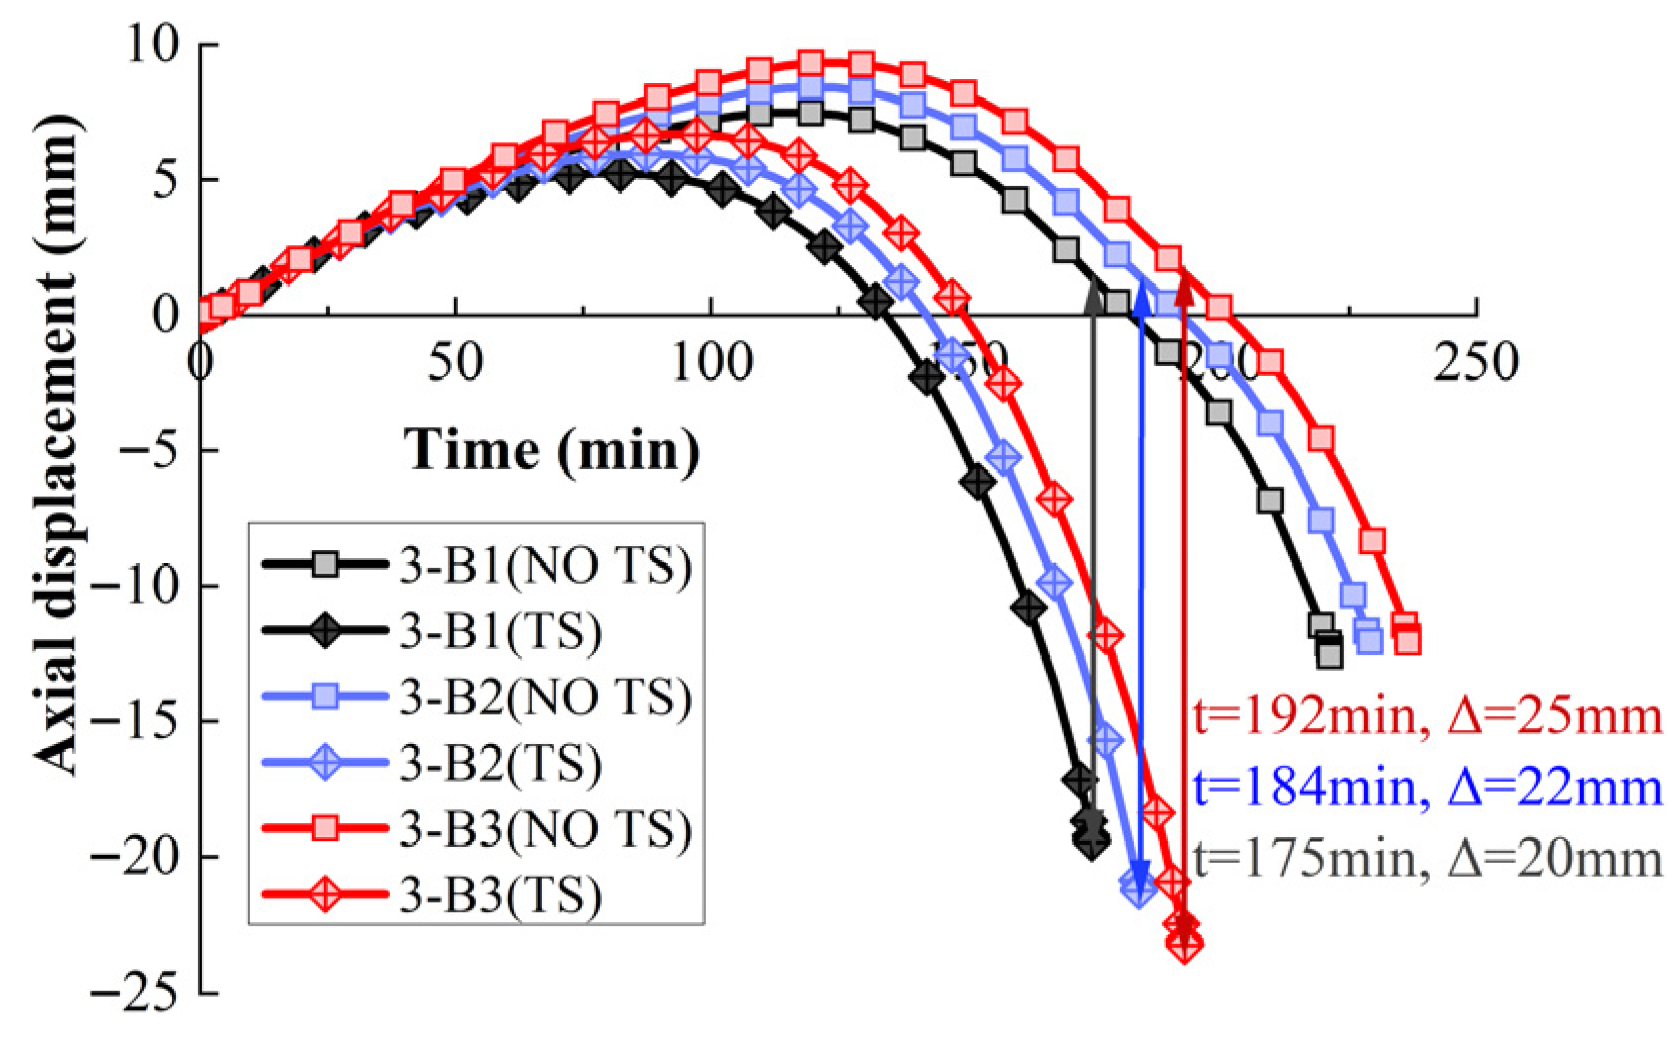
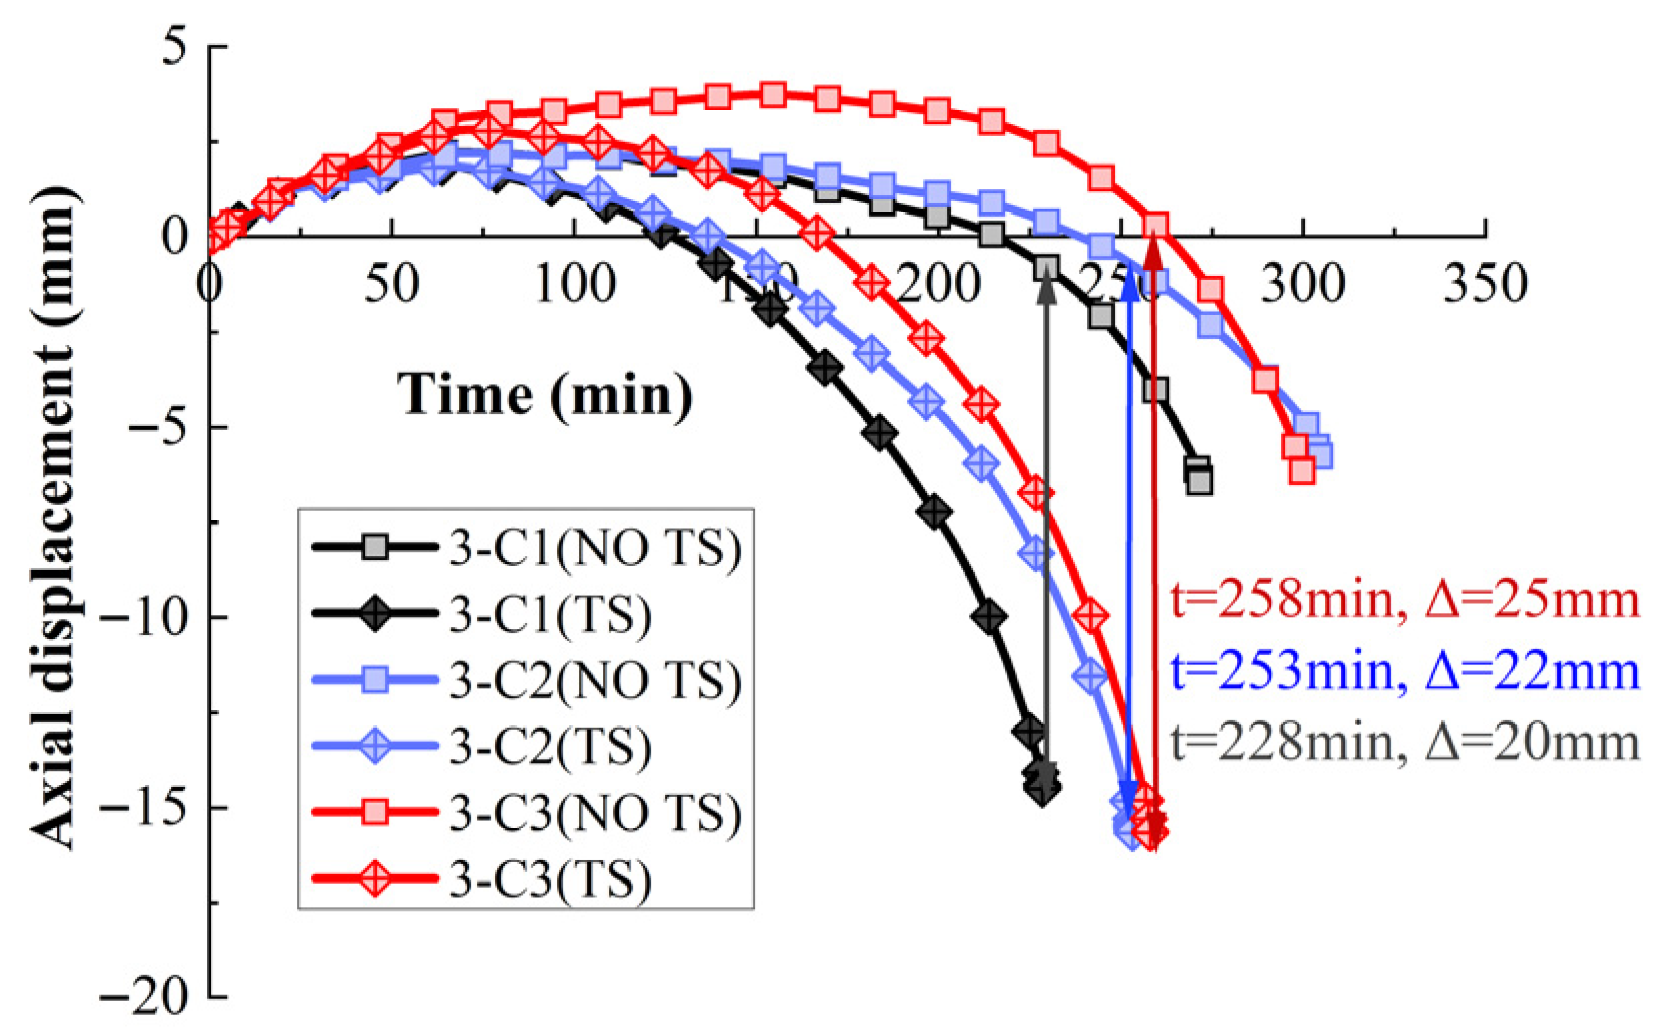
For the three types of RPC columns, the fire resistances of the three types of reinforcement ratios under the two conditions of considering and not considering TS are calculated while keeping the load size and other parameters unchanged. The axial deformation–time curves of three kinds of RPC columns at high temperature are shown in Figure 17, Figure 18 and Figure 19. It can be found that the longitudinal reinforcement of the RPC-A column is increased from 4C25 to 6C25 and 8C25, respectively, and the fire resistance is increased from 189 min to 200 min and 210 min, respectively. The influence of TS on the axial displacement of the RPC column is about 26–30 mm. For RPC-B columns, when the longitudinal reinforcement is increased from 4C20 to 6C20 and 8C20, respectively, the fire resistance is increased from 175 min to 184 min and 192 min. The influence of TS on the axial displacement of the RPC column is about 20–25 mm. The same rule was also found for RPC-C columns. It is worth noting that TS has little effect on the fire resistance of RPC columns under three reinforcement ratios. For RPC-A columns, the effect of TS on the fire resistance is about 42 min, the effect on RPC-B columns is about 45 min, and the effect on RPC-C columns is about 42–51 min.
In summary, increasing the reinforcement ratio has a limited effect on improving the fire resistance of the three types of RPC columns. This trend is consistent with the findings of Wu regarding high-strength concrete columns. Moreover, the influence of TS on the fire resistance of RPC columns remains essentially unchanged across different reinforcement ratios.

3.4. Effect of Fire Conditions

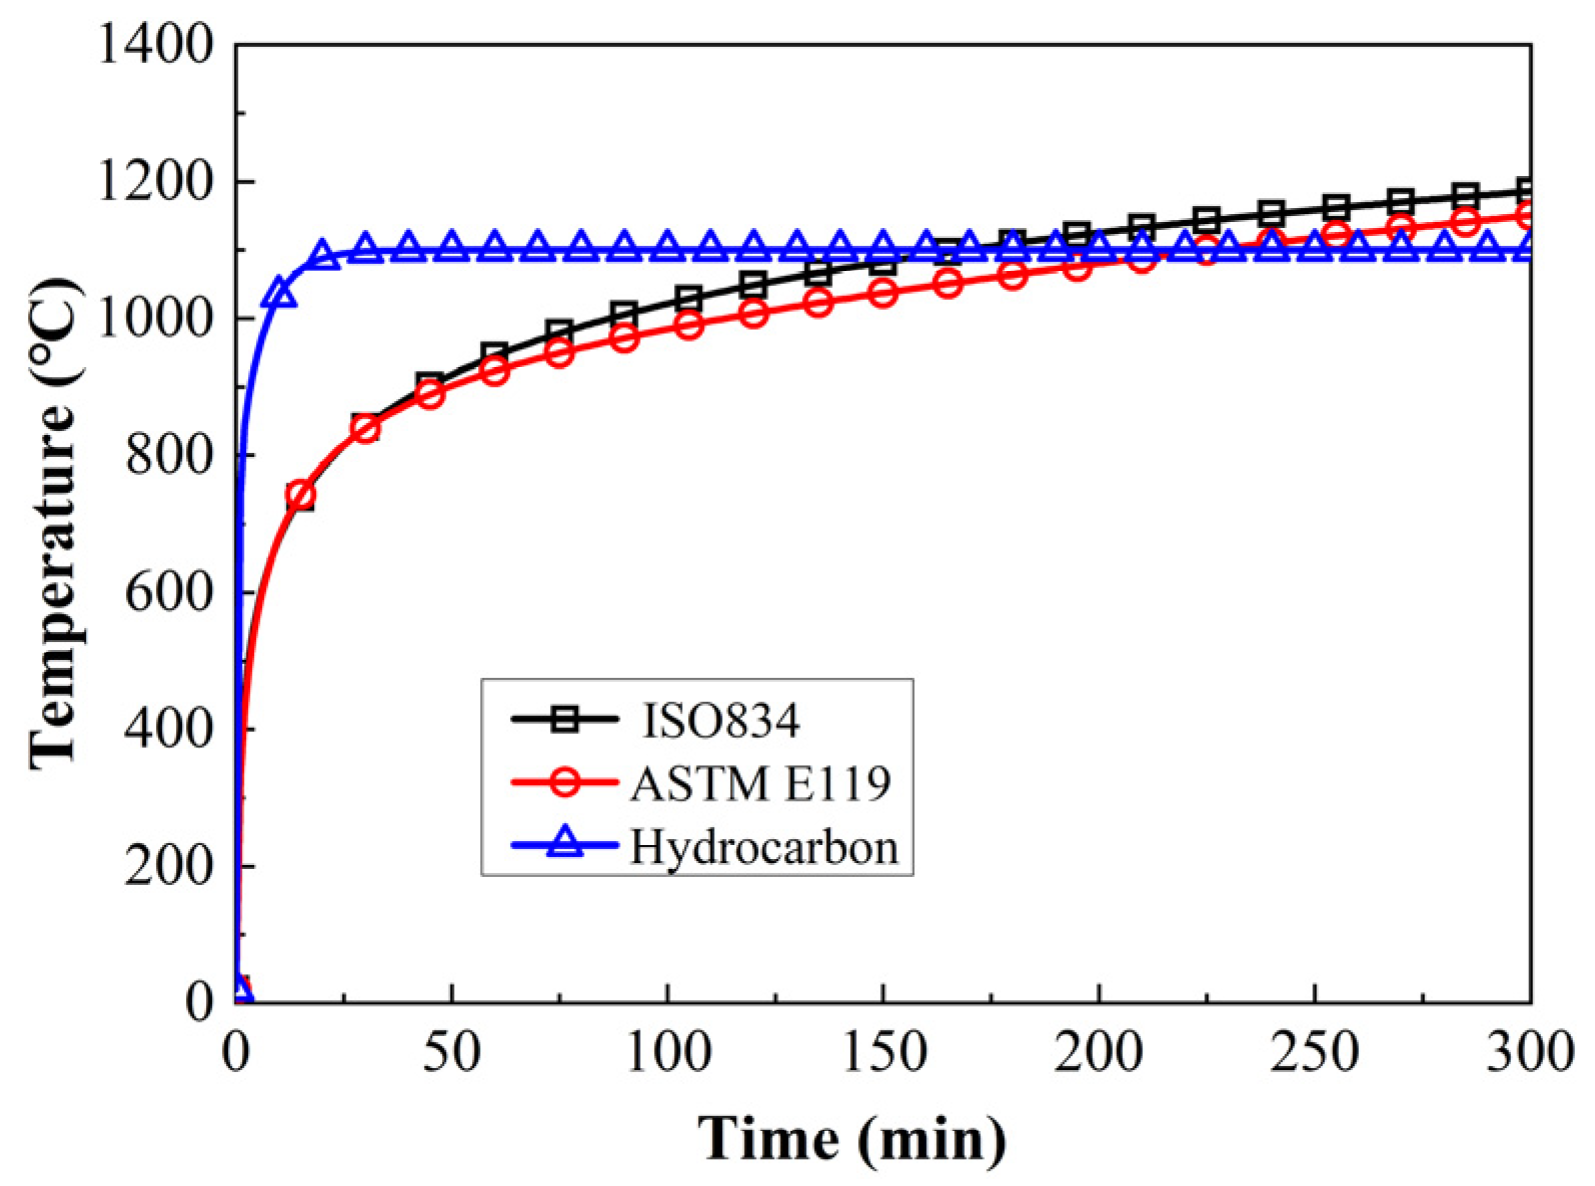
In the event of a fire, the rate of temperature rise within the structure is influenced by the quantity, type, and distribution of combustible materials, as well as the ventilation conditions within the building [48]. A high fire load may cause the internal temperature of the structure to exceed that predicted by the standard temperature rise curve, ISO-834 [19], degrading the fire resistance of the structure. In this section, the temperature rise curve for hydrocarbon and alkane fires, as shown in Figure 20, was selected for analysis [37].
The calculation method of the temperature rise curve of ISO-834 [19] is shown in Equation (17). The calculation method of the temperature rise curve of ASTM E119 [35] is shown in Equation (18). The calculation method of the temperature rise curve of a hydrocarbon fire is shown in Equation (19).
T = 20 + 345 log 10 8 t min + 1
T = 20 + 750 1 exp 3.79553 t min / 60 + 170.41 t min / 60
T = 1080 1 0.325 e 0.167 t min 0.675 e 2.5 t min + 20
where, in Equations (17)–(19), T is the temperature, °C and tmin is the heating time, min.
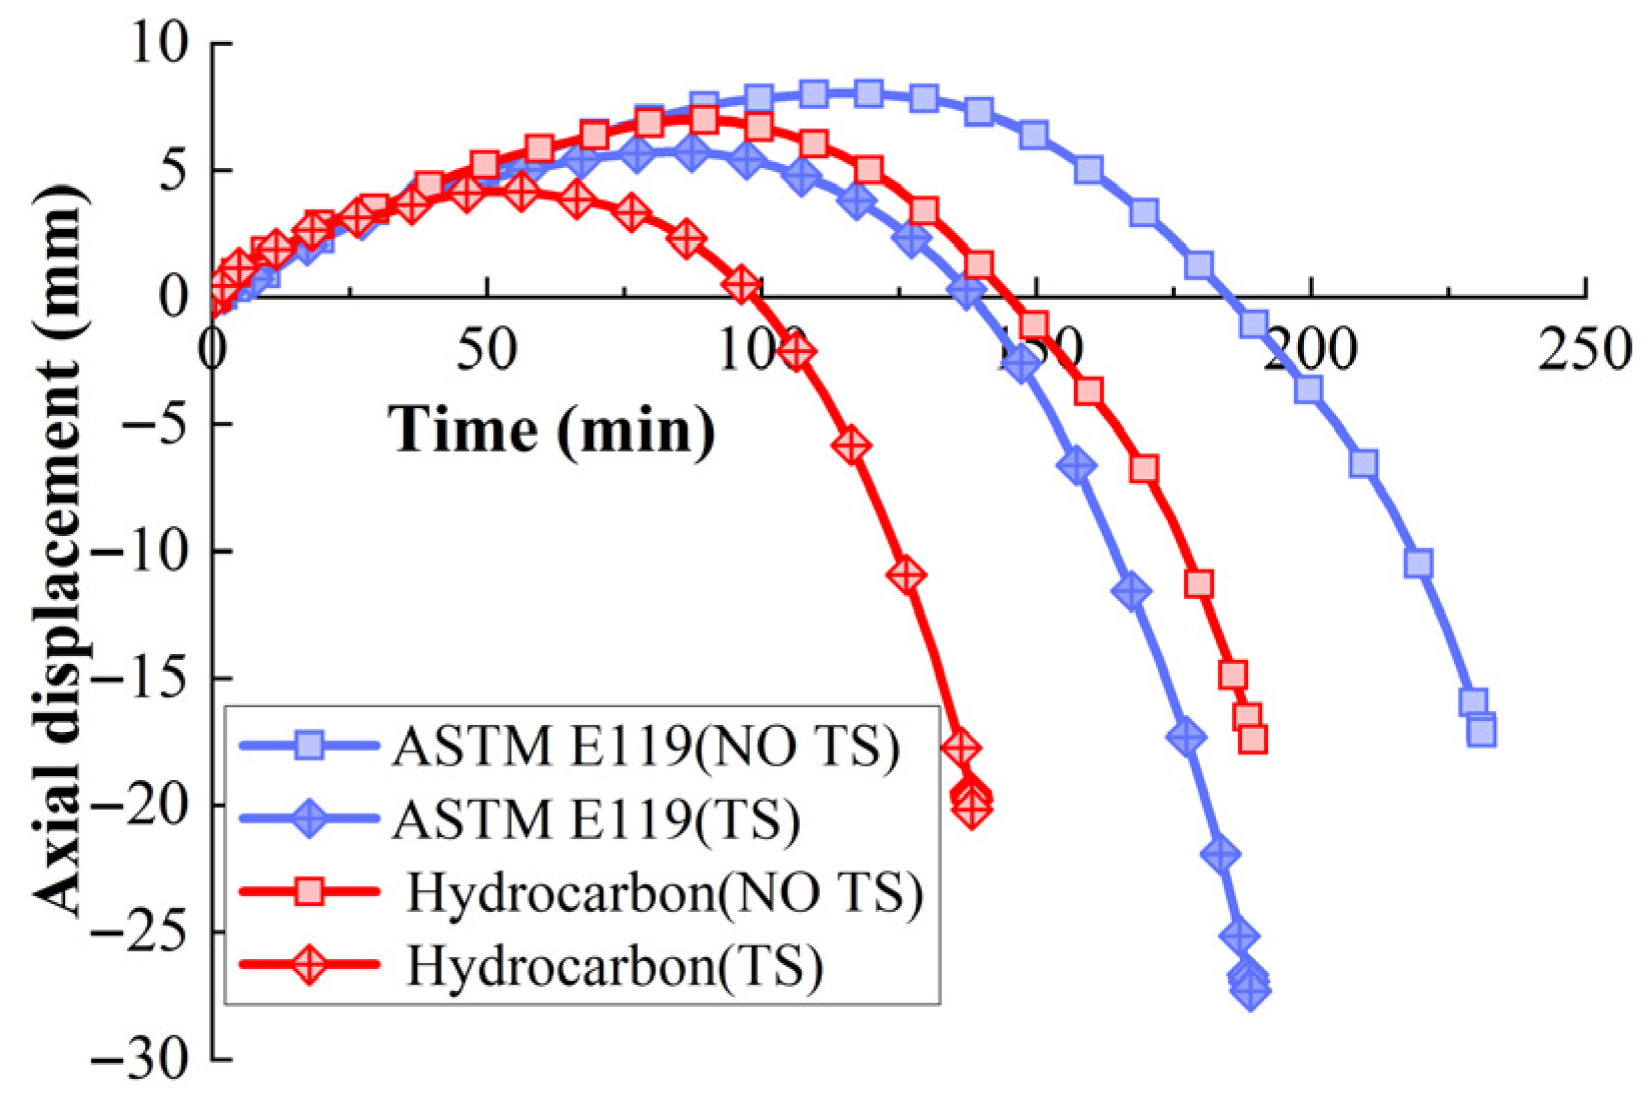
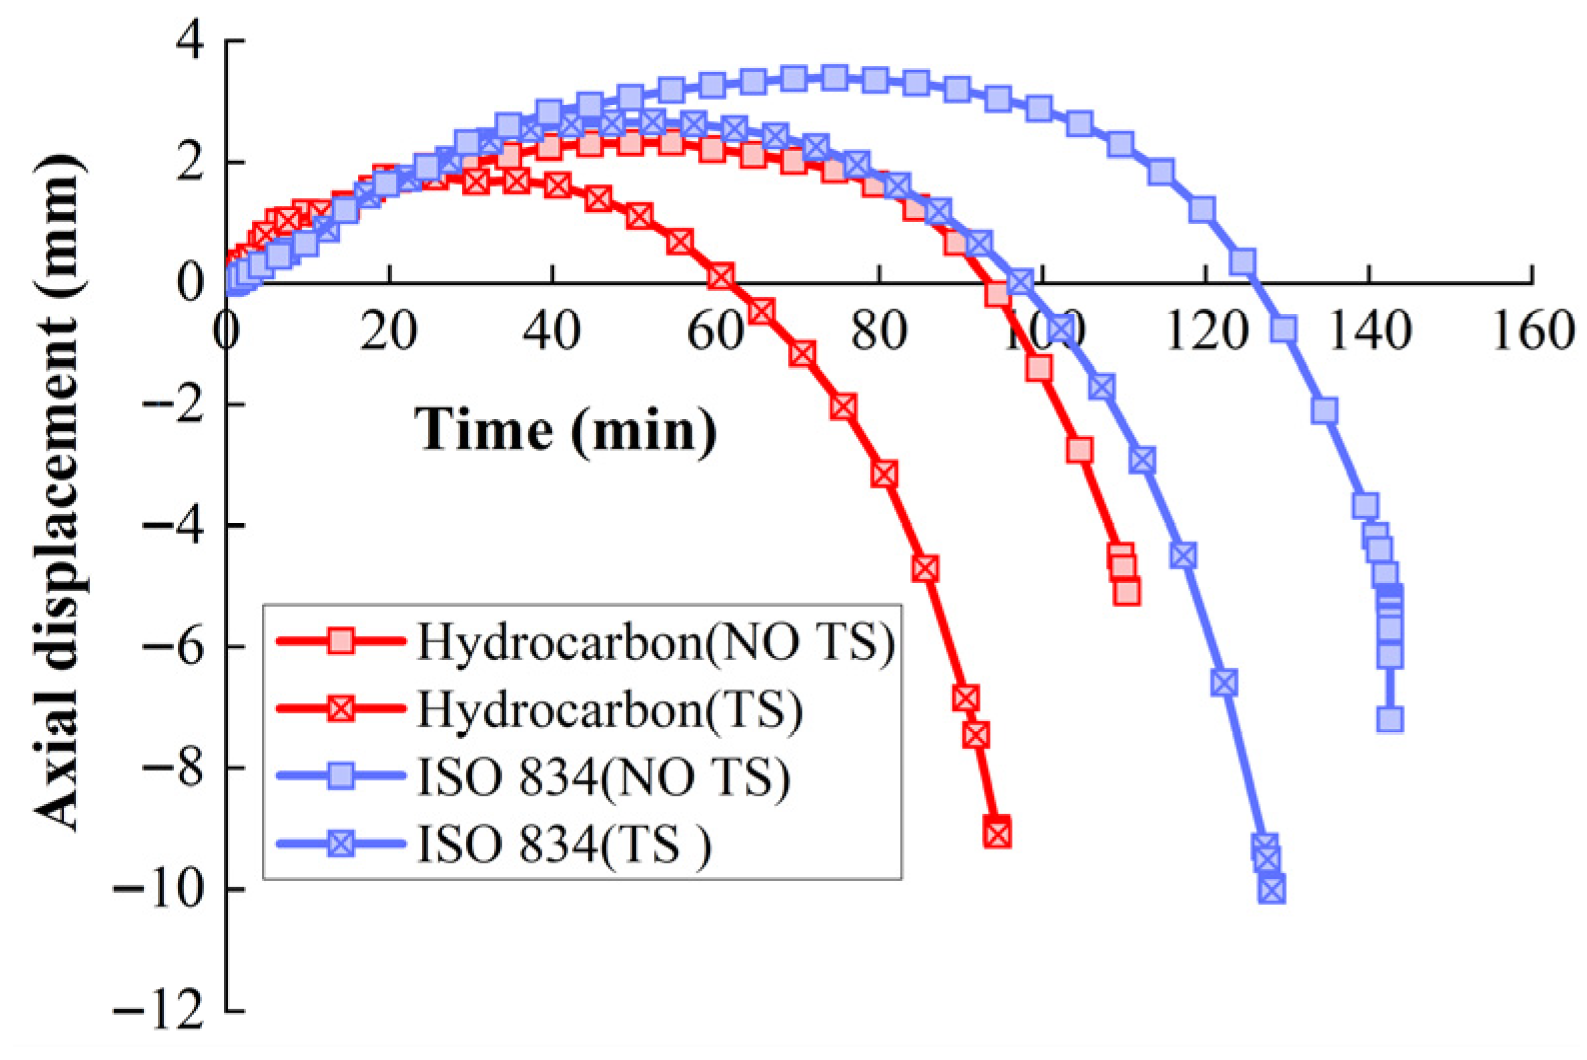
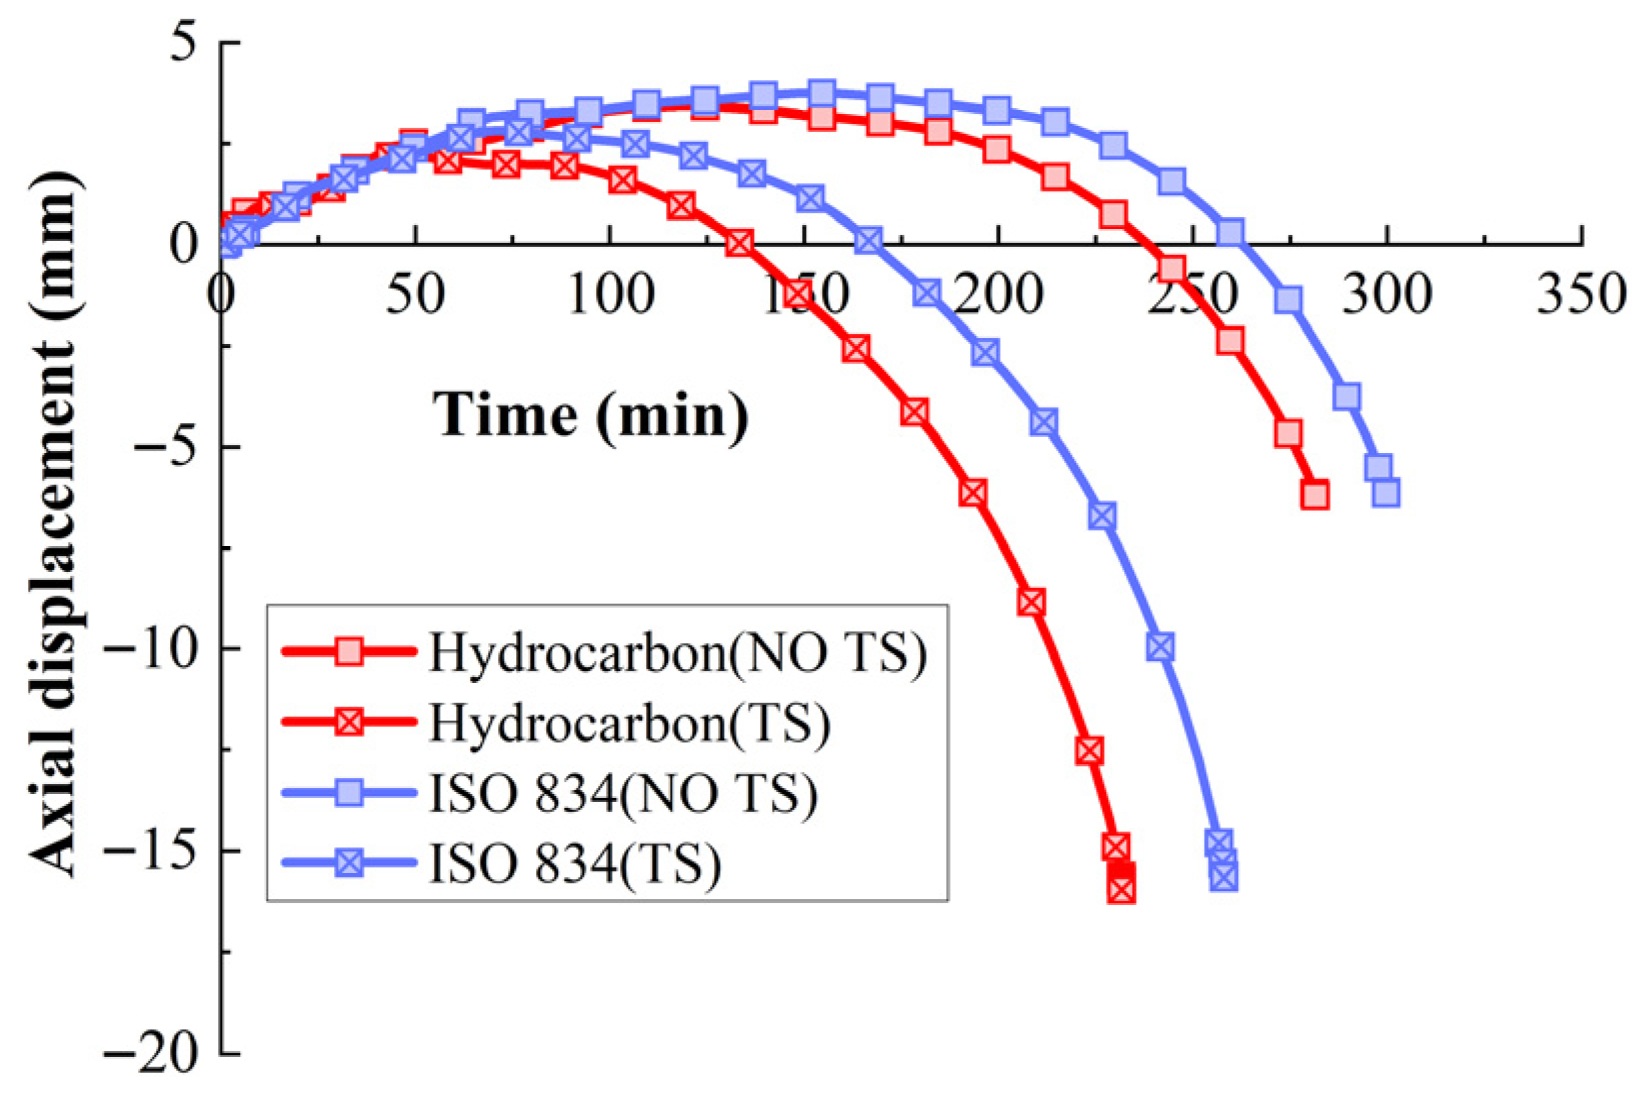
As shown in Figure 21. For RPC-A columns, when the ASTM E119 [35] heating curve is used, the fire resistance calculation result is 189 min. When the hydrocarbon heating curve is used, the fire resistance is 138 min, and the fire resistance is reduced by about 27%. TS has a great influence on the two fire conditions, which are 42 min and 52 min, respectively, and the influence rates are 18.2% and 37.7%, respectively. Relatively speaking, TS has a greater impact on RPC columns using the hydrocarbon heating curve. This is because, when the heating curve uses hydrocarbon, in the initial stage, the temperature rise rate is rapid, resulting in a large temperature gradient in the RPC section, which expands the influence of TS. As shown in Figure 22. For RPC-B columns, when the ISO-834 heating method is used, the fire resistance is 128 min. When the hydrocarbon heating method is used, the fire resistance of RPC columns is 94 min, and the fire resistance is reduced by about 26.6%. The influence of TS on the fire resistance is 15 min and 17 min, and the influence rates are 10.5% and 15.3%, respectively, which are similar to the influence of ASTM E119 [35]. As shown in Figure 23, for RPC-C columns, the fire resistance of RPC columns using the hydrocarbon heating curve is 231 min, which is 10.5% lower than that of RPC columns using the ISO-834 heating curve.
In general, TS has a significant impact on the fire resistance of RPC columns under all three heating regimes. Among them, TS exhibits the greatest sensitivity under the hydrocarbon heating curve. This is due to its rapid initial heating rate and higher peak temperatures at early stages, which generate steep temperature gradients within the RPC cross-section. The resulting uneven temperature field induces substantial differences in TS, leading to pronounced stress redistribution. In particular, the compressive stress in the core region—responsible for carrying the primary axial load—increases further, accelerating the deformation and eventual failure of the column.
Therefore, in fire-resistant design for special-purpose structures, such as chemical plants, the influence of TS should be explicitly considered.

3.5. Effect of Fire Side of RPC Columns

Figure 24 presents the results of four different work scenarios. When the RPC column is exposed to fire on one side, its fire resistance exceeds 300 min. Observing Figure 24, it is evident that, for single-sided fire exposure, the axial deformation remains minimal throughout the designated fire duration and can be divided into an initial expansion stage. In the early stages of heating, TS has little impact on the axial deformation of the RPC column. TS becomes the dominant contributor to high-temperature deformation only in the later heating stage, a behavior consistent with that observed in NC columns under similar load levels [27]. This phenomenon is mainly attributed to the low thermal conductivity and high specific heat capacity of the concrete, which limit heat transfer from the exposed surface to the entire cross-section, keeping most of the section at relatively low temperatures. The lower temperatures restrict both performance degradation and TS growth in the RPC, thereby maintaining sufficient fire resistance.
When two adjacent sides of the RPC column are exposed to fire, TS begins to influence its fire resistance. At 300 min, the RPC column without TS consideration is transitioning from the expansion to the compression stage, whereas the column considering TS has already reached an axial deformation of 10 mm. The uneven temperature gradients resulting from two-sided fire exposure alter the failure mode of the RPC column, and accounting for TS leads to greater ductility and deformation under fire conditions.
For RPC columns under three-sided fire, TS has the most significant effect on the calculation results within the set fire time. The fire resistance of the RPC column, considering TS, is 187 min. Without considering TS, the fire resistance is 218 min, and the effect of TS on the fire resistance is 31 min, 14%. At the same time, the influence on the axial deformation is also greater than that of the RPC column under fire on all sides, and the error of the axial deformation is 14 mm. For RPC columns with a full cross-section under fire, the fire resistance is the shortest. When TS is not considered, the fire resistance is 152 min. If TS is considered, the fire resistance is 137 min. The effect of TS on the fire resistance of RPC columns subjected to a full-section fire is 15 min, 11%.
For RPC columns subjected to three-sided fire exposure, transient thermal strain (TS) has the most significant impact on the calculated fire resistance within the designated fire duration. Considering TS, the fire resistance is 187 min. Without TS, it increases to 218 min, indicating a reduction of 31 min (14%) due to TS. Additionally, TS causes a larger discrepancy in axial deformation compared to columns exposed to fire on all sides, with an error of approximately 14 mm. For RPC columns exposed to fire on the entire cross-section, the fire resistance is the shortest among the cases studied. When TS is neglected, the fire resistance is 152 min; accounting for TS reduces it to 137 min, representing an 11% decrease (15 min).
In summary, RPC columns exposed to fire on all sides exhibit the lowest fire resistance. This is because the temperature within the cross-section under full-fire exposure rises more rapidly than under other fire scenarios, accelerating material degradation at high temperatures and thereby reducing fire resistance. TS has the most pronounced effect on RPC columns subjected to three-sided fire exposure. The uneven temperature distribution across the section causes differential material degradation, shifting the centroid of material strength toward the unfired side and creating an additional eccentricity relative to the load application point. Moreover, the high temperature on the fire-exposed surfaces induces significant TS, increasing the compressive deformation in these regions. Consequently, the RPC column develops additional deflection. This combination of increased bending moment and deflection accelerates the attainment of fire resistances, making the influence of TS on deformation and fire resistance particularly significant.

3.6. Effect of TS on Stress Redistribution

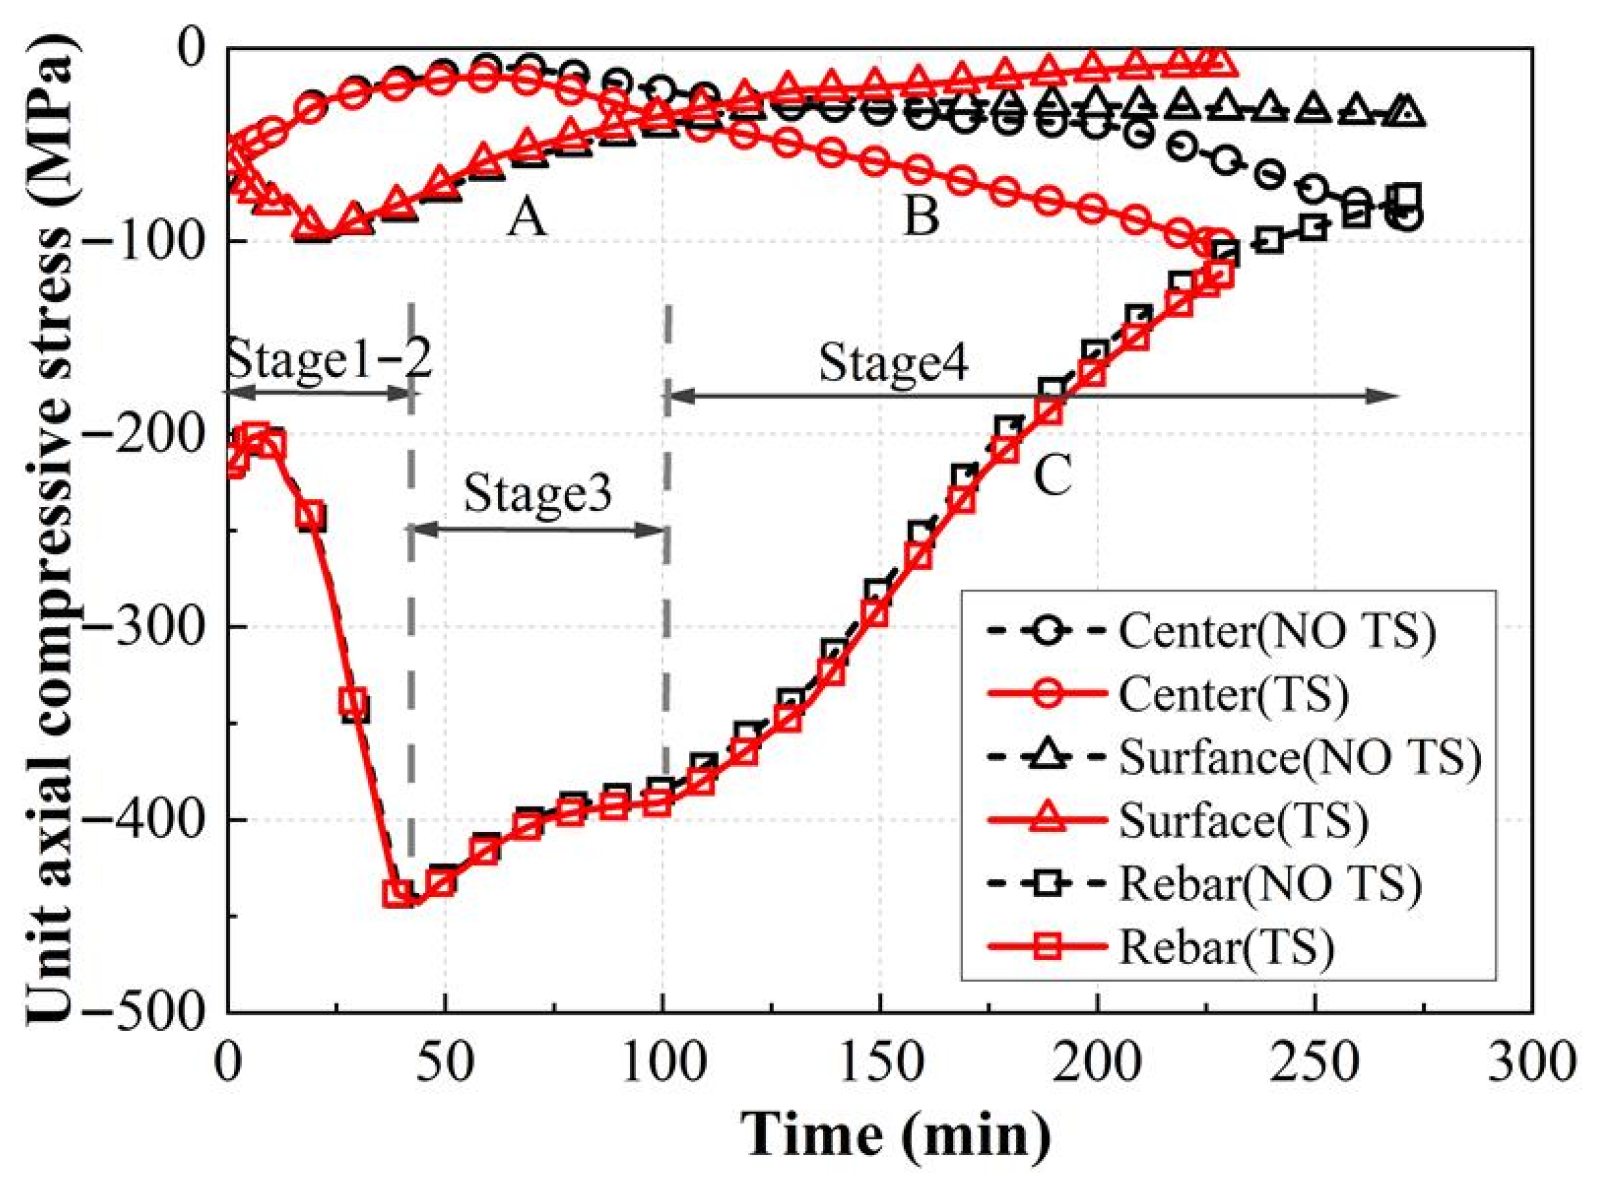
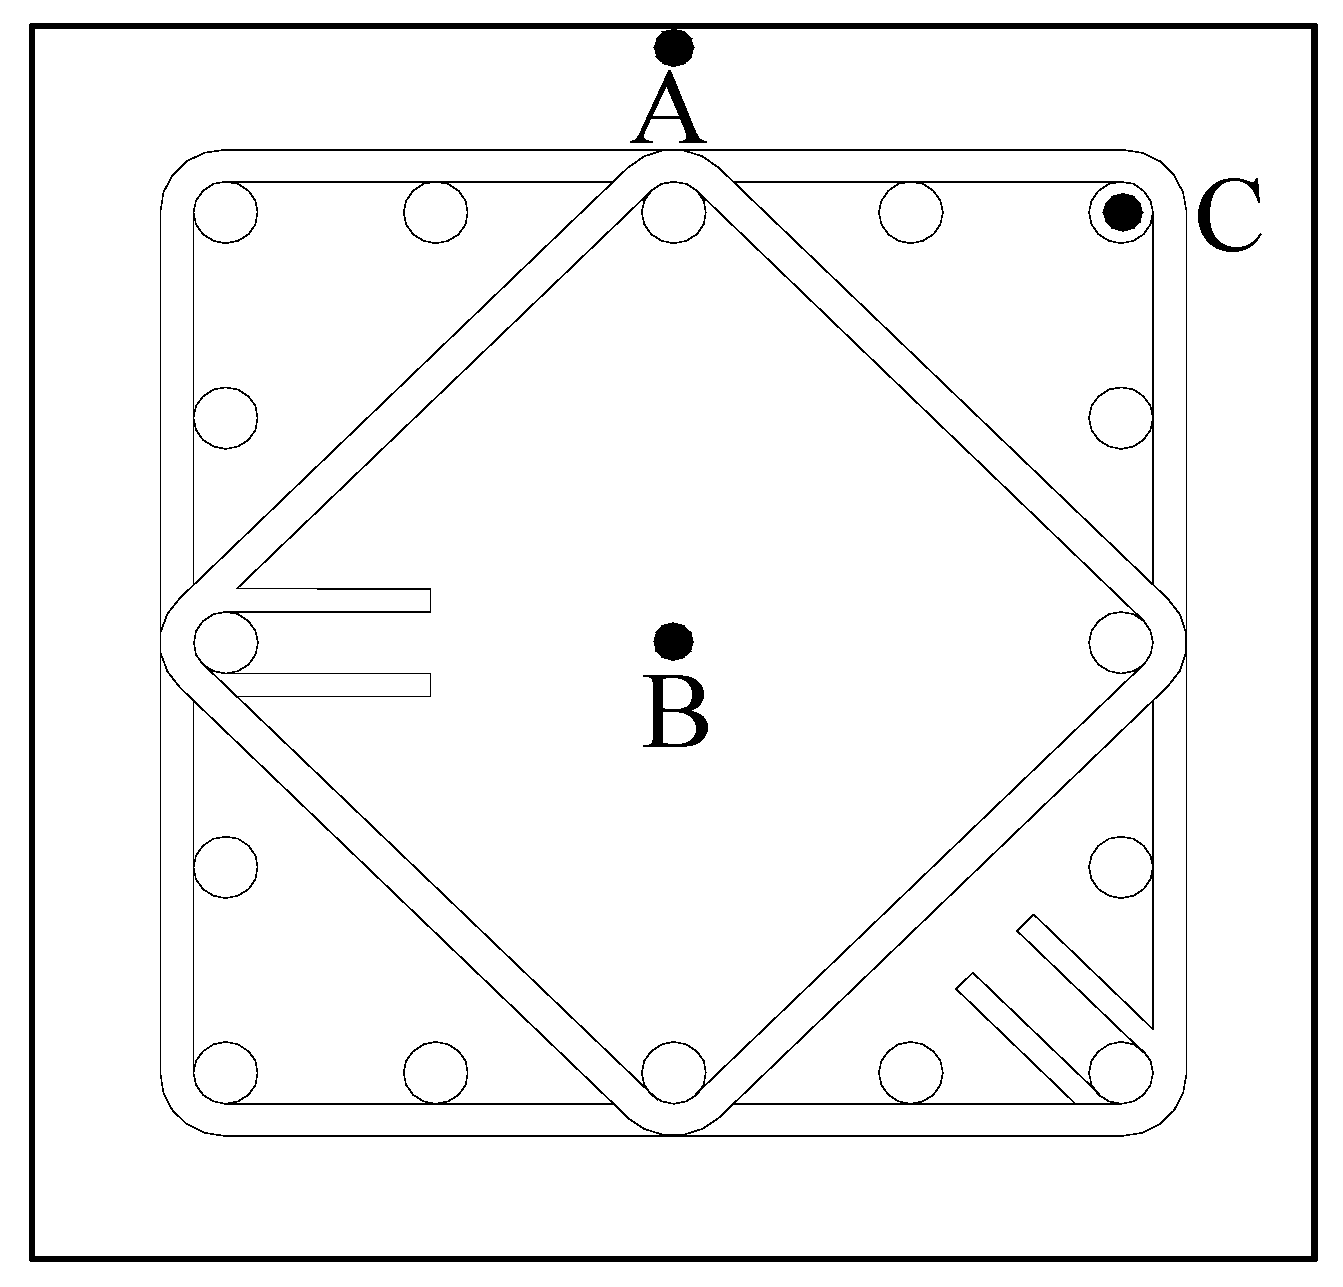
The variation in the stress of the section unit at h/2 of the RPC column 3-C1 with fire time is shown in Figure 25. Axial stresses at three distinct positions, i.e., the section edge RPC unit (point A), the section core RPC unit (point B), and the corner reinforcement unit (point C), were extracted under both explicit consideration of TS and implicit consideration. As shown in Figure 25, noticeable stress redistribution occurs during the fire process of reinforced RPC columns. By analyzing the changes in the reinforcement stress, the process can be categorized into four distinct stages.
In the first stage, the cross-sectional temperature distribution is uneven due to the thermal inertia of RPC at the initial temperature rise. The peripheral RPC expands, and its material strength and elastic modulus slightly degrade, leading to a higher load being borne by the peripheral RPC. Figure 25 shows that the compressive stress of the peripheral unit increases initially, whereas the compressive stress of the reinforcement and core RPC units decreases. However, this phenomenon occurs only for a brief period after the fire begins. The entire RPC column undergoes expansion during this phase.
In the second stage, as the fire continues, the temperature of the RPC column rises further. By this time, the average temperature of the peripheral RPC unit exceeds 355 °C, causing material properties degradation and reducing its bearing capacity. Meanwhile, the temperature of the reinforcement increases, causing expansion, but its mechanical properties change minimally. The external load thus increases rapidly, which persists for t < 50 min. Notably, in the first two stages, the core unit temperature remains relatively low, so the stress variations primarily influence the stress change in the core RPC unit in the peripheral RPC and reinforcement.
In the third stage, the heat transfers inward as heating continues, gradually degrading the mechanical properties of the reinforcement. The temperature of the outer surface of the concrete reaches a high level, causing it to lose its ability to bear significant loads, further reducing compressive stress. Thus, the RPC in the core area takes on the primary load-bearing role, and the compressive stress of the core RPC unit shifts from decreasing initially to gradually increasing.
In the fourth stage, during the final phase of heating, the internal temperature field and cross-sectional temperature gradient of the RPC column remain high. The temperature of the corner reinforcement exceeds 390 °C and continues to rise, leading to significant degradation in the mechanical properties of the reinforcement. As fire time extends, the compressive stress in the reinforcement rapidly decreases, accelerating compression deformation and the overall deformation rate of the RPC column, which eventually approaches failure. In this stage, due to the stabilization of the temperature rise curve, the temperature of the outer surface units stabilizes, and stress changes become less pronounced. To maintain section stress equilibrium, the compressive stress in the core area continues to rise until the column reaches its fire resistance.
Figure 25 illustrates that the influence of TS on the stresses of RPC and steel reinforcement primarily occurs during the third and fourth heating stages. Figure 26 shows the form of the cross-section. In the first two stages, with temperatures of both steel and RPC below 400 °C, TS values remain minimal, exerting a negligible effect on the stresses within the RPC column section. Consequently, no significant differences are observed between steel stress and the stresses of RPC surface and core elements in these early stages. During the third and fourth stages, as the temperature of the outer RPC rises, TS becomes significant. The thermal expansion of the outer RPC is less than the free expansion strain, leading to a reduction in external load. Simultaneously, TS substantially increases the compressive stress in the core region, causing the RPC column to transition from axial expansion to compression deformation. This phenomenon arises because, in the later heating stages, TS in the high-temperature outer region under high stress dominates the overall strain, exceeding the compressive deformation in the cooler core region. Thus, after considering TS, the external load is primarily borne by the lower-temperature RPC core.
Overall, TS induces considerable compressive deformation in the RPC under high-temperature compressive stress. Stress redistribution occurs within the column cross-section under fire: compressive stress in the high-temperature outer region slightly decreases, while that in the cooler core region increases further, with steel stress remaining largely unchanged. This amplified stress differential accelerates the RPC column’s approach to its fire resistance.

3.7. The Difference in Fire Resistance Between RPC Column and NC Column

In order to further explore the differences in fire resistance performance between RPC columns and NC columns, two RPC columns and NC columns were designed, respectively, and the fire mechanical behaviors under the ISO-834 [19] standard temperature rise curve were calculated. The design parameters and calculation results are shown in Table 11.
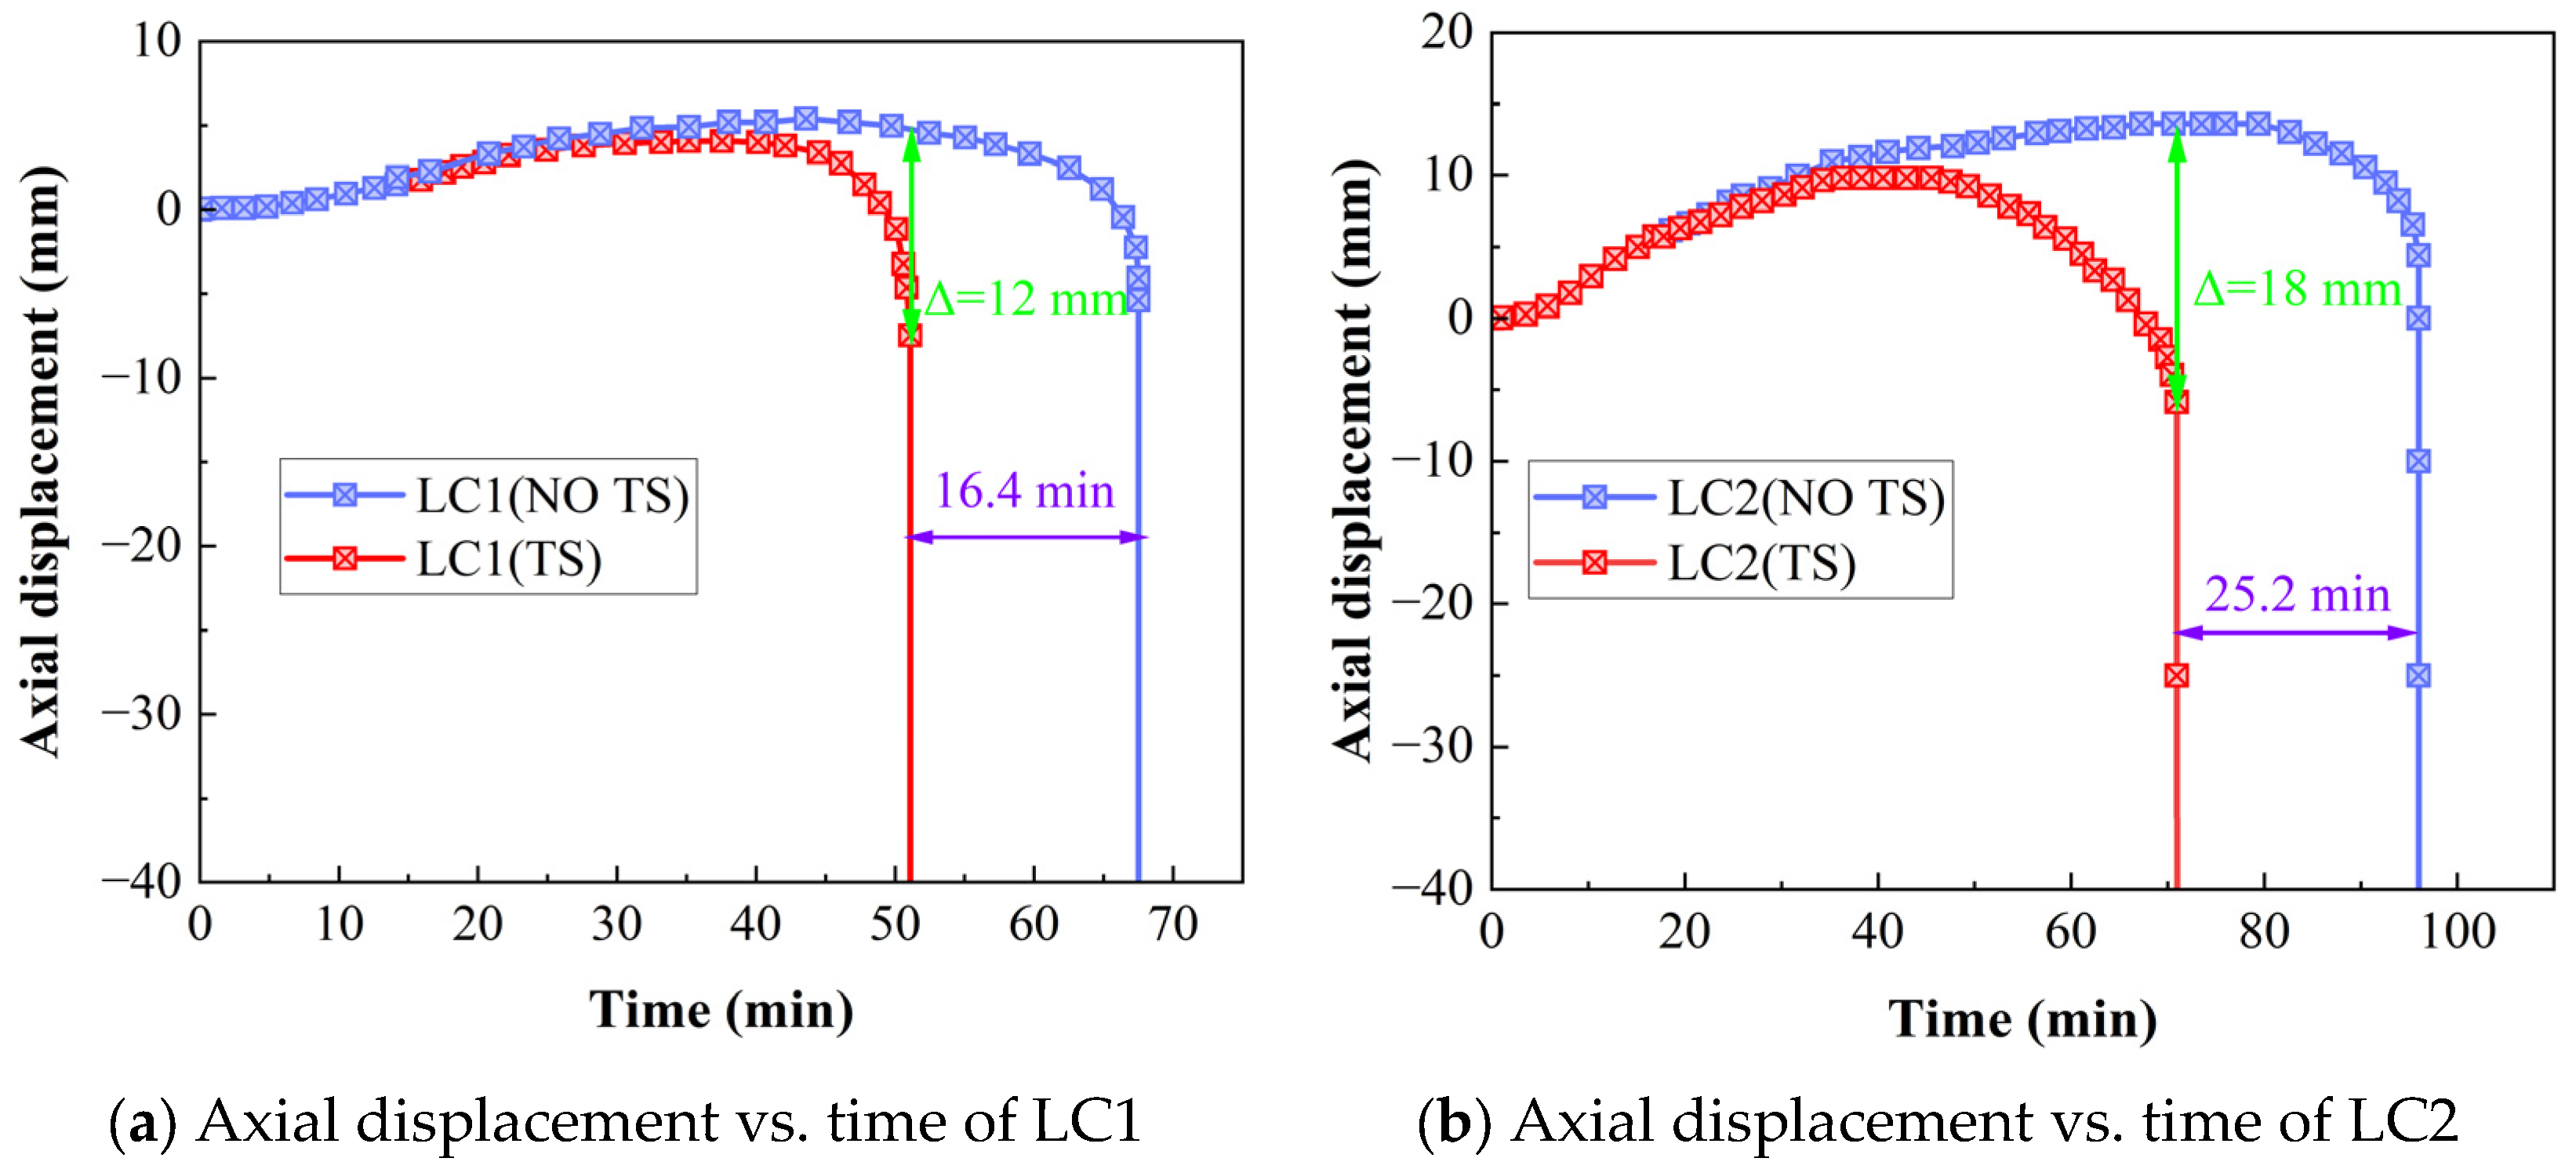
As can be seen from Figure 27 and Table 11, when the NC column and the RPC column are at the boundary conditions of the pinned support connection at both ends, under the same load order of magnitude, the fire resistance performance of the RPC column is superior to that of the NC column. The fire resistance performance of LC1 is 51.1 min, and that of LC2 is 70.9 min. At this point, the influence of TS on the fire resistance performance of LC1 and LC2 is 24.3% and 26.2% respectively, and the influence of TS on axial deformation is 12 mm and 18 mm, respectively. It can be found that, under fire, the influence of TS on the fire resistance performance of RPC columns is greater than that of NC columns. This is because RPC contains steel fibers, which have a relatively high thermal conductivity, resulting in a higher thermal conductivity of RPC than that of NC. Therefore, the cross-sectional temperature of the RPC column is always higher than that of the NC column. At higher temperatures, the influence of TS on RPC is greater than that on NC. Second, due to the rapid temperature rise of RPC on the outer side of the RPC column cross-section and the relatively low temperature inside, a larger cross-sectional temperature gradient than that of NC was formed. This larger temperature gradient accelerated the development of TS. Therefore, in the design of RPC columns in actual engineering, sufficient attention should be paid to TS.

4. Discussion

In this study, the fire resistance performance analysis framework of RPC columns was established by coupling TS with the Drucker–Prager model. Avoid the development that uses subroutines, provide analysis convenience for actual engineers, and offer a safety design basis for high-risk scenarios, such as liquefied petroleum gas stations. First, the influence law of TS on the fire resistance limit of RPC columns was quantified, and the effects of cross-sectional dimensions, load ratio, reinforcement ratio, temperature rise curve, and the development of TS on the exposed surface were discussed in detail. It reveals the mechanism of stress redistribution within RPC caused by TS. That is, the compression deformation of TS in the high-temperature zone leads to a sharp increase in compressive stress in the low-temperature zone, accelerating the overall failure of the RPC column.
However, due to technical flaws, the current model still has certain limitations. First, the TS of RPC relies on the Abid [14] empirical formula and does not take into account the influence of uneven fiber distribution on TS, which may lead to prediction deviations in high-stress areas. Meanwhile, in the simulation, the interference of water migration on the temperature field has not been taken into account at present, resulting in the simulated value of the core temperature of the RPC column being higher than the experimental value.
It should be noted that the melting of PP fibers in RPC under high-temperature conditions will lead to changes in the microstructure of RPC and affect the evolution of TS. Meanwhile, the influence of TS on the fire resistance performance of RPC columns under local fire conditions should be further studied. Meanwhile, the influence mechanism of TS during the cooling stage on the residual bearing capacity of RPC columns is unknown. Moreover, caution is still needed when directly extending the existing conclusions to large sections far beyond the scope of this study. Further research is also required for more complex loading conditions in the future.

5. Conclusions

In this paper, the Drucker–Prager model was used to develop an FE model for the fire resistance stress of RPC columns, considering the TS. The model accuracy was corroborated, and based on this numerical model, the effects of TS on the displacement response and fire resistance of RPC columns were thoroughly analyzed. The following conclusions are drawn from the results obtained.
  • The fire resistance of RPC columns and the influence of TS increase with the increase in cross-sectional dimensions. When the cross-sectional size increases from 305 mm to 500 mm, the influence of TS on the fire resistance limit of RPC columns rises from 22% to 43%. If the influence of TS is ignored, the maximum axial deformation error of the RPC column reaches 26 mm. Therefore, in the fire resistance design of large cross-section RPC columns, the influence of TS should be taken into account;
  • When the exposure time is short, due to the more uniform cross-sectional temperature of the RPC column and the smaller temperature gradient, the influence of TS on the RPC column is lower than that on the NC column. When exposed to fire for a long time, the internal temperature of the RPC column cross-section fully develops, and TS begins to significantly affect the fire resistance performance of the RPC column. At this time, the influence of TS on the RPC column is greater than that on the NC column;
  • The influence of TS on RPC columns is greater than that on NC columns. Under the same load, the impact of TS on the fire resistance performance of RPC columns is 26.2% and that on NC columns is 24.3%. If the influence of TS is not taken into account, it will lead to an overestimation of the axial deformation of the RPC column, with an axial deformation error of up to 18 mm;
  • The presence of TS causes the RPC stress in the low-temperature area of the RPC column to increase under fire, while the stress of the reinforcing bars does not change significantly, resulting in a large stress gradient in the cross-section and accelerating the failure process of the RPC column;
  • Under the temperature rise curves of ASTM E119, ISO 834, and hydrocarbon, respectively, the influence of TS on the fire resistance limit of RPC columns is 22%, 10.5%, and 38%. It can be seen that, under the hydrocarbon temperature rise curve, TS has the greatest impact on the fire resistance performance of RPC columns. Therefore, when designing RPC columns for high fire risk buildings such as chemical plants, the TS effect must be fully considered to ensure fire safety.

Author Contributions

Q.R.: Writing—review and editing. Formal analysis, Data curation, Investigation, Methodology. Z.C.: Writing—original draft, Data curation, Investigation, Validation, Methodology. Z.L.: Conceptualization, Methodology, Project administration, Writing—review and editing. X.H.: Formal analysis, Methodology, Validation. All authors have read and agreed to the published version of the manuscript.

Funding

This research was funded by National Natural Science Foundation of China grant number Nos. 52478157 and 52278169. The Natural Science Foundation of Heilongjiang Province grant number LH2022E089 and the China Postdoctoral Science Foundation grant number No. 2023M731030.

Data Availability Statement

Data will be made available on request.

Conflicts of Interest

The authors declare that they have no known competing financial interests or personal relationships that could have appeared to influence the work reported in this paper.

References

  1. Richard, P.; Cheyrezy, M. Composition of reactive powder concretes. Cem. Concr. Res. 1995, 25, 1501–1511. [Google Scholar] [CrossRef]
  2. Cheyrezy, M. Structural applications of RPC. Concrete 1999, 33, 20–23. [Google Scholar]
  3. Pierre, Y.B.; Marco, C.R. Prestresses Pedestrian Bridge-World’s First Reactive Powder Concrete Structure. PCI J. 1999, 44, 60–71. [Google Scholar] [CrossRef]
  4. Zheng, W.; Wang, R.; Wang, Y. Experimental study on thermal parameter of reactive powder concrete. J. Build. Struct. 2014, 35, 107–114. (In Chinese) [Google Scholar] [CrossRef]
  5. Luo, B. Study on Explosive Spalling Rules and Mechanical Properties of Reactive Powder Concrete at Elevated Temperatures. Ph.D. Thesis, Harbin Institute of Technology, Harbin, China, 2013. (In Chinese). [Google Scholar]
  6. Ge, C. Effect of Pore Pressure and Fire Surface on High Temperature Burst of RPC. Master’s Thesis, Harbin Institute of Technology, Harbin, China, 2019. (In Chinese). [Google Scholar]
  7. Zheng, W.; Luo, B.; Wang, Y. Microstructure and mechanical properties of RPC containing PP fibres at elevated temperatures. Mag. Concr. Res. 2014, 66, 397–408. [Google Scholar] [CrossRef]
  8. Zheng, W.; Luo, B.; Wang, Y. Compressive and tensile properties of reactive powder concrete with steel fibres at elevated temperatures. Constr. Build. Mater. 2013, 41, 844–851. [Google Scholar] [CrossRef]
  9. Illston, J.M.; Sander, P.D. The effect of temperature change upon the creep of tortar under torsional loading. Mag. Concr. Res. 1973, 25, 136–144. [Google Scholar] [CrossRef]
  10. Anderberg, Y.; Thelandersson, S. Stress and deformation characteristics of concrete at high temperatures. 2. Experimental investigation and material behaviour model. Bull. Div. Struct. Mech. Concr. Constr. Bull. 1976, 54, 27–34. [Google Scholar]
  11. Schneider, U. Modelling of concrete behavior at high temperature. In Design of Structures Against Fire; Aston University Birmingham: Birmingham, UK, 1986; pp. 53–69. [Google Scholar]
  12. Wu, B.; Siulhu, L.; Liu, Q.; Chung, Y.; Ho, F. Creep Behavior of High-Strength Concrete with olypropylene Fibers at Elevated Temperatures. ACI Mater. J. 2010, 107, 176. [Google Scholar]
  13. Sanchayan, S.; Foster, S.J. High temperature behavior of hybrid steel-PVA fibre reinforced reactive powder concrete. Mater. Struct. 2016, 49, 769–782. [Google Scholar] [CrossRef]
  14. Abid, M.; Hou, X.; Zheng, W.; Hussain, R.R.; Cao, S.; Lv, Z. Creep behavior of steel fiber reinforced reactive powder concrete at high temperature. Constr. Build. Mater. 2019, 205, 321–331. [Google Scholar] [CrossRef]
  15. Yang, Z.; Zhang, H.; Zhu, H.; Wang, X.; Li, A. Research on Fire Resistance of Reinforced Concrete Columns with Different Curing Period. Struct. Eng. 2020, 36, 5. (In Chinese) [Google Scholar] [CrossRef]
  16. Kodur, V.K.R.; Cheng, F.P.; Wang, T.C.; Sultan, M.A. Effect of Strength and Fiber Reinforcement on Fire Resistance of High-Strength Concrete Columns. J. Struct. Eng. 2003, 129, 253–259. [Google Scholar] [CrossRef]
  17. Lee, J.H.; Sohn, Y.S.; Lee, S.H. Fire resistance of hybrid fibre-reinforced, ultra-high-strength concrete columns with compressive strength from 120 to 200 MPa. Mag. Concr. Res. 2012, 64, 539–550. [Google Scholar] [CrossRef]
  18. Choe, G.; Kim, G.; Gucunski, N.; Lee, S. Evaluation of the mechanical properties of 200 MPa ultra-high-strength concrete at elevated temperatures and residual strength of column. Constr. Build. Mater. 2015, 86, 159–168. [Google Scholar] [CrossRef]
  19. ISO 834; Fire-Resistance Tests-Elements of Building Construction. International Organization for Standardization: Geneva, Switzerland, 1975.
  20. Li, Y.; Du, P.; Tan, K.H. Fire resistance of ultra-high performance concrete columns subjected to axial and eccentric loading. Eng. Struct. 2021, 248, 113158. [Google Scholar] [CrossRef]
  21. Wu, B.; Xu, Y. Fire resistance of reinfoced concrete columns with +-Shaped cross section. Eng. Mech. 2008, 25, 3. [Google Scholar]
  22. Wu, B.; Chen, H. Analysis of Fire Endurance of Reinforced Concrete Columns with Sideway. J. Disaster Prev. Mitig. Eng. 2017, 37, 5. [Google Scholar] [CrossRef]
  23. Wang, Y.; Dong, Y.; Yuan, G.; Wang, Y. Fire Response Analysis of Reinforced Concrete Slabs Considering Transient Strain. J. Hunan Univ. (Nat. Sci.) 2014, 41, 6. (In Chinese) [Google Scholar]
  24. Wei, Y.; Au, F.T.; Li, J.; Tsang, N.C. Effects of transient creep strain on post-tensioned concrete slabs in fire. Mag. Concr. Res. 2017, 69, 337–346. [Google Scholar] [CrossRef]
  25. Sadaoui, A.; Khennane, A. Effect of transient creep on the behaviour of reinforced concrete columns in fire. Eng. Struct. 2009, 31, 2203–2208. [Google Scholar] [CrossRef]
  26. Kodur, V.K.R.; Alogla, S.M. Effect of high-temperature transient creep on response of reinforced concrete columns in fire. Mater. Struct. 2017, 50, 27. [Google Scholar] [CrossRef]
  27. Alogla, S.; Kodur, V.K.R. Quantifying transient creep effects on fire response of reinforced concrete columns. Eng. Struct. 2018, 174, 885–895. [Google Scholar] [CrossRef]
  28. Ren, P.; Hou, X.; Rong, Q.; Zheng, W. Quantifying Fire Insulation Effects on the Fire Response of Hybrid-Fiber Reinforced Reactive Powder Concrete Beams. Fire Technol. 2020, 56, 1487–1525. [Google Scholar] [CrossRef]
  29. Hou, X.; Ren, P.; Rong, Q.; Zheng, W.; Zhan, Y. Comparative fire behavior of reinforced RPC and NSC simply supported beams. Eng. Struct. 2019, 185, 122–140. [Google Scholar] [CrossRef]
  30. Kodur, V.K.R.; Wang, T.C.; Cheng, F.P. Predicting the fire resistance behaviour of HSC columns. Cem. Concr. Compos. 2004, 26, 141–153. [Google Scholar] [CrossRef]
  31. Bo, W.; Zhou, H. Fire resistance of high strength concrete columns. J. South China Univ. Technol. (Nat. Sci. Ed.) 2006, 34, 11. (In Chinese) [Google Scholar]
  32. Lie, T.T. Fire Resistance of Circular Steel Columns Filled with Bar-Reinforced Concrete. J. Struct. Eng. 1994, 120, 1489–1509. [Google Scholar] [CrossRef]
  33. European Convention for Constructional Steelwork (ECCS). Technical Committee 3, and Fire safety of Steel Structures. In European Recommendations for the Fire Safety of Steel Structures: Calculation of the Fire Resistance of Load Bearing Elements and Structural Assemblies Exposed to the Standard Fire; Elsevier Science and Technology: Amsterdam, The Netherlands, 1983; Volume 3. [Google Scholar]
  34. Han, L. Concrete Filled Steel Tubular Structures—Theory and Practice, 3rd ed.; Science Press: Beijing, China, 2016. (In Chinese) [Google Scholar]
  35. ASTM E119-88; Standard Methods of Fire Tests on Building Construction and Materials. American Society for Testing and Materials: Philadelphia, PA, USA, 1990.
  36. Wang, G.; Xue, S. Calculation on TS of concrete. J. Beijing Univ. Technol. 2008, 34, 387–390. (In Chinese) [Google Scholar]
  37. BS EN 1992-1-2; Design of Concrete Structures: Part 1-2: General Rules: Structural Fire Design. British Standards Institution: London, UK, 2004.
  38. Hong, S.; Varma, A.H. Analytical modeling of the standard fire behavior of loaded CFT columns. J. Constr. Steel Res. 2009, 65, 54–69. [Google Scholar] [CrossRef]
  39. Gernay, T.; Millard, A.; Franssen, J.M. A multiaxial constitutive model for concrete in the fire situation: Theoretical formulation. Int. J. Solids Struct. 2013, 50, 3659–3673. [Google Scholar] [CrossRef]
  40. Guo, Z.; Shi, X. High Temperature Performance and Calculation of Reinforced Concrete; Tsinghua University Press: Beijing, China, 2003. [Google Scholar]
  41. Li, L. Study on the Stress Performance and Design Method of Reactive Powder Concrete Beams. Ph.D. Thesis, Harbin Institute of Technology, Harbin, China, 2010. (In Chinese). [Google Scholar]
  42. Ren, P. Research on Spalling Property and Fire Resistance Design Method of Reactive Powder Concrete Beams. Ph.D. Thesis, Harbin Institute of Technology, Harbin, China, 2022. (In Chinese). [Google Scholar]
  43. Lie, T.T.; Lin, T.D.; Abrams, M.S. Fire Resistance of Reinforced Concrete Columns; Division of Building Research, National Research Council of Canada: Ottawa, ON, Canada, 1987. [Google Scholar]
  44. Al-Bayati, E.S.N. Behavior of Reactive Powder Reinforced Concrete Beams Exposed to Fire. Ph.D. Thesis, Tikrit University, Tikrit, Iraq, 2017. [Google Scholar]
  45. American Concrete Institute. Building Code Requirements for Structural Concrete (ACI 318-14): Commentary on Building Code Requirements for Structural Concrete (ACI 318R-14): An ACI Report; American Concrete Institute: Farmington Hills, MI, USA, 2014. [Google Scholar]
  46. GA/T 714-2007; Rapid Rise Fire Test Methods of Fire Protection Materials for Structural Elements. China Standards Press: Beijing, China, 2007.
  47. GB50016-2014; Code for Fire Protection Design of Buildings. China Planning Press: Beijing, China, 2018.
  48. Liu, F. Fire Resistance of Concrete Filled RHS Columns Under Three-Surface Fire Loading. Master’s Thesis, Harbin Institute of Technology, Harbin, China, 2010. [Google Scholar]

Figure 1. The application of RPC in practical engineering.
Buildings 15 03287 g001
Figure 2. Flowchart of this paper.
Buildings 15 03287 g002
Figure 3. Three-dimensional FE model of RPC column temperature field.
Buildings 15 03287 g003
Figure 4. Fire resistance calculation process of RPC column.
Buildings 15 03287 g004
Figure 5. Temperature variation curve of section measuring point with time.
Buildings 15 03287 g005
Figure 6. Grid sensitivity analysis.
Buildings 15 03287 g006
Figure 7. Axial displacement time curve of column 1.
Buildings 15 03287 g007
Figure 8. Temperature test value and simulation value of UHSC column cross-section measuring point.
Buildings 15 03287 g008
Figure 9. Test and simulation values of UHSC column top displacement.
Buildings 15 03287 g009
Figure 10. Variation curve of mid-span deflection of RPC beam with fire time.
Buildings 15 03287 g010
Figure 11. Time–temperature curve.
Buildings 15 03287 g011
Figure 12. Time versus axial displacement curve of RPC columns of 1-A.
Buildings 15 03287 g012
Figure 13. Time versus axial displacement curve of RPC columns of 1-B.
Buildings 15 03287 g013
Figure 14. Time versus axial displacement curve of RPC columns of 1-C.
Buildings 15 03287 g014
Figure 15. The variation curves of unit transient thermal strain of RPC and NC with temperature.
Buildings 15 03287 g015
Figure 16. Variation curve of axial displacement of RPC column with heating time.
Buildings 15 03287 g016aBuildings 15 03287 g016b
Figure 17. Time vs. axial displacement curve of RPC-A.
Buildings 15 03287 g017
Figure 18. Time vs. axial displacement curve of RPC-B.
Buildings 15 03287 g018
Figure 19. Time versus axial displacement curve of RPC-C.
Buildings 15 03287 g019
Figure 20. Different fire temperature rise curves.
Buildings 15 03287 g020
Figure 21. Axial displacement of RPC-A column with different temperature rise curves.
Buildings 15 03287 g021
Figure 22. Axial displacement of RPC-B column with different temperature rise curves.
Buildings 15 03287 g022
Figure 23. Axial displacement of RPC-C column with different temperature rise curves.
Buildings 15 03287 g023
Figure 24. Axial displacement of RPC-A column under the same load.
Buildings 15 03287 g024
Figure 25. Variation curve of element stress of RPC column 3-c1 intermediate section with heating time.
Buildings 15 03287 g025
Figure 26. Section form.
Buildings 15 03287 g026
Figure 27. Axial displacement versus time curve.
Buildings 15 03287 g027
Table 1. Parameter of RPC column model.
Column AColumn BColumn C
Section/mm305 × 305300 × 300500 × 500
Length/m3.813.33.6
RPC compressive strength/MPa150150200
Longitudinal reinforcement f y /MPa354500500
Rebar numbers—diameter
/mm
4–256–2016–29
Stirrup diameter—distance
/mm
D8-75/150D8-250D13-100
Concrete cover thickness
/mm
404050
Temperature rise curveASTM-E119 [35]ISO-834 [19]ISO-834 [19]
Fiber dosage0.2% PP fibers + 2% steel fibers
Notes: D is the diameter of rebars.
Table 2. TS coefficient of HRPC.
AnmT
5.42 × 10−171020
5.42 × 10−1810100
7.48 × 10−1610200
4.11 × 10−1510300
9.59 × 10−1510400
1.72 × 10−1410500
2.69 × 10−1410600
3.88 × 10−1410700
9.96 × 10−1410800
5.83 × 10−1310900
Table 3. NC columns.
DescriptionLie [43]-Column1Section Form
Section (mm)305 × 305Buildings 15 03287 i001
Length (m)3.81
Concrete compressive strength fc (MPa)36.1
Concrete aggregate typeSiliceous
Yield strength of longitudinal reinforcement (MPa)354
Rebar numbers/diameter (mm)4/25
Stirrup diameter and distance (mm)D8/305
Concrete cover thickness (mm)40
Load (kN)1067
Load ratio0.32
Fire resistance (min)208
Table 4. RPC beam.
Table 4. RPC beam.
DescriptionHou/Beam 1Hou/Beam 2Ezzulddin/Beam 3
Section/mm200 × 400200 × 400150 × 200
Beam length/m4.94.92.0
Number of rebar at beam top—diameter/mm
Yield strength/MPa
2D10
415
2D10
415
2D6
500
Number of reinforcement at beam bottom—diameter/mm
Yield strength/MPa
3–25
463
3–25
463
2–8
500
Stirrup diameter and spacing/mm
Yield strength/MPa
D8@60
415
D8@60
415
D8@75
500
Concrete cover thickness/mm25 mm35 mm30 mm
Load/kN50.9 kN49.6 kN22.1 kN·m
Temperature rising curveISO-834ISO-834ASTM-E119
Heating time125 min176 min120 min
Notes: D is the diameter of rebars.
Table 5. Geometric parameters of RPC columns with different section sizes.
TabSection
/mm2
Column Length/mLoad Level %Load/
kN
RPC fc/MPaLongitudinal
Rebars
Heating CurveCover Thickness/
mm
1-A1305 × 3053.814730071504C25ASTM-E119 [35]40
1-A2400 × 4005094
1-A3500 × 5007898
1-B1300 × 3003.36440501506C20ISO834 [19]40
1-B2400 × 4007022
1-B3500 × 50010,842
1-C1400 × 4003.66310,05220016C29ISO834 [19]50
1-C2500 × 50015,000
Table 6. Geometric parameters of RPC columns with different load levels.
TabSection
(mm2)
Length (m)Load Level %Load/
kN
RPC fc/MPaLongitudinal
Rebars
Heating CurveCover Thickness/
mm
2-A1305 × 3053.814427901504C25ASTM-E119 [35]40
2-A2654186
2-A3885580
2-B1300 × 3003.34327001506C20ISO834 [19]40
2-B2644050
2-B3855400
2-C1500 × 5003.642100020016C29ISO834 [19]50
2-C26315,000
2-C3842000
Table 7. Geometric parameters of RPC columns with different reinforcement ratios.
TabSection
(mm2)
Column Length
(m)
Load Level (%)Load
(kN)
RPC fc (MPa)Longitudinal
Rebars
Heating CurveCover Thickness
(mm)
3-A1305 × 3053.814730071504C25ASTM-E119 [35]40
3-A26C25
3-A38C25
3-B1300 × 3003.34327001504C20ISO834 [19]40
3-B26C20
3-B38C20
3-C1500 × 5003.66215,0002008C29ISO834 [19]50
3-C212C29
3-C316C29
Table 8. Geometric parameters of RPC columns under different fire conditions.
TabSection
/mm2
Column Length/mLoad Level %Load/
kN
RPC fc/MPaLongitudinal
Rebars
Heating CurveCover Thickness/
mm
4-A1305 × 3053.814730071504C25ASTM-E119 [35]40
4-A2Hydrocarbon [46]
4-B1300 × 3003.36440501506C20ISO834 [19]40
4-B2Hydrocarbon [46]
4-C1500 × 5003.66215,00020016C29ISO834 [19]50
4-C2Hydrocarbon [46]
Table 9. Geometric parameters of RPC columns under different fire sides.
TabSection
/mm2
Column Length/mFire SideLoad/
kN
RPC fc/MPaLongitudinal
Rebars
Heating CurveCover Thickness/
mm
5-A1305 × 3053.81430071504C25ASTM-E119 [35]40
5-A23
5-A32
5-A41
Table 10. Calculation results of RPC column fire resistance.
TabLoad Level %Load/kNFire Resistance/(min)DifferenceError Percentage
%
TS No TS
Section1-A14730071892314222
1-A250942483338534
1-A3789832346113843
1-B16440501281431512
1-B270221752063118
1-B310,8422282855725
1-C16310,0522212442310
1-C215,0002583004216
Load level2-A14427902032474422
2-A26541861371521511
2-A388558010210866
2-B14327001842294525
2-B26440501281431512
2-B38554009610377
2-C14210,00036249713537
2-C26315,0002583004216
2-C38420,0001922192714
Reinforcement ratio3-A14730071892314222
3-A22002414121
3-A32102524220
3-B14327001752214626
3-B21842294525
3-B31922374523
3-C16215,0002282724419
3-C22533045120
3-C32583004216
Heating curve4-A14730071892314222
4-A21381905238
4-B16440501281431512
4-B2941111718
4-C16215,0002583004216
4-C22312825122
Fire side of RPC column5-A16541861371521511
5-A21872183114
5-A3300300--
5-A4300300--
Notes: The calculation method of error percentage in the table is the ratio of the difference of fire resistance under two working conditions, without considering and considering TS, and the fire resistance with explicit consideration of TS.
Table 11. Example analysis.
LabelLongitudinal Bar/fy
(MPa)
TSNumber of Bars—DiameterHooping Diameter—SpacingfcLength
(mm)
Load
(kN)
BCFR
(min)
LC1355No4–258@1505038101150P-P67.5
355Yes4–258@1505038101150P-P51.1
LC2355No4–258@15015038101150P-P96.1
355Yes4–258@15015038101150P-P70.9
Notes: fy is the yield strength of steel, fc is the compressive strength of concrete (MPa), the diameter of the steel bar and the spacing of the hooping are in mm, BC represents the boundary conditions, P-P is pinned to pinned, FR is the fire resistance time.
Disclaimer/Publisher’s Note: The statements, opinions and data contained in all publications are solely those of the individual author(s) and contributor(s) and not of MDPI and/or the editor(s). MDPI and/or the editor(s) disclaim responsibility for any injury to people or property resulting from any ideas, methods, instructions or products referred to in the content.