Article

Dynamic Response and Failure Mode of Reinforced Concrete Beams Subjected to Impact

1
School of Civil Engineering and Architecture, Wuhan Institute of Technology, Wuhan 430205, China
2
Hubei Key Laboratory of Basin Water Security, Changjiang Survey Planning Design and Research Co., Ltd., Wuhan 430010, China
3
Key Laboratory of Safety Control of Bridge Engineering Ministry of Education, Changsha University of Science and Technology, Changsha 410114, China
4
China Coal Technology & Engineering Group, Nanjing Design & Research Institute Co., Ltd., Nanjing 210031, China
5
Center of Excellence in Transportation Engineering, Pak Austria Facshhoule Institute of Applied Sciences and Technology, Haripur 22600, Pakistan
*
Author to whom correspondence should be addressed.
Buildings 2025, 15(18), 3250; https://doi.org/10.3390/buildings15183250
Submission received: 14 July 2025 / Revised: 11 August 2025 / Accepted: 25 August 2025 / Published: 9 September 2025
(This article belongs to the Section Building Structures)

Abstract

The dynamic behavior of reinforced concrete (RC) beams under impact loads is highly complex. In this work, the failure modes, impact force, displacement, and internal force of RC beams under impact loads were studied in detail with different research parameters. Firstly, a numerical model of RC was established, and its reliability was verified through a series of tests. Then, seventeen groups of different parameters were designed and analyzed. These parameters included the shear–span ratio of the RC beams, the impact velocity of a drop hammer, concrete strength, and boundary conditions. The results indicate that the shear–span ratio and boundary condition of RC beams have no noticeable influence on the maximum impact forces. The maximum displacement, residual displacement, and vibration period of RC beams with fixed-oundary conditions are obviously less than those of supported RC beams. The negative moment of RC beams subjected to impact loads needs to be considered in design due to the many cracks near the supports caused by the negative moments. The shear force of RC beams with a fixed condition is greater at the support section, which requires detailed consideration.

1. Introduction

RC structures are widely used in various engineering fields, such as protection engineering, bridge engineering, marine engineering, etc. In addition to being subjected to seismic loads, they may be subjected to impact loads during the service period, such as vehicle impacts, ship impacts, and impacts of heavy objects falling at high altitude [1,2]. Impact load has the characteristics of a high peak value, short duration, and high energy consumption. The performance of an RC structure under impact load is more complex than its performance under static load, resulting in a limited understanding of its impact resistance [3,4,5,6].
In general, the failure mechanism and dynamic performance of concrete structures subjected to impact loads are highly complex due to the material’s inertia effect and high strain rate [3]. Therefore, the equivalent static calculation method may not be suitable for evaluating the impact resistance of RC beams. It is worth noting that loading speed is a key factor in the performance of RC structures. Saatci and Kishi [4,5,6,7] indicated that RC beams behave differently (bending) under static loading, while further research shows that under impact loading, it results in a shear failure. In addition, Li et al. [8] confirmed that the impact load and the failure mode of RC beams are influenced by the geometry of the drop hammer and the performance of the interlayer properties. In recent years, numerous experiments and theoretical analyses have been conducted on the impact of RC beams, considering the effects of various parameters [3,6,7,9].
In general, the inertia force changes because RC beams experience vibration under impact loads. Due to the influence of the inertia force, the performance of RC beams under impact loads differs from that under static loads. The changes in the inertia force of the RC beams and the distribution of inertia force along the beams have been reported [10]. Banthia et al. [11] investigated the distribution and found that the inertial forces are linear in plain concrete beams, while they behave sinusoidally in reinforced concrete beams. Other studies conducted by Pham et al. [12] revealed that the inertia force exerts the highest impact force through linear distribution, and at the same time, the supporting plastic hinges have a more substantial influence on the overall performance of the reinforced concrete beam. Many other studies have also revealed that inertia forces have a greater influence on impact loading [13,14].
As mentioned above, during the impact-induced vibration process, the internal forces (e.g., shear force and bending moment) change rapidly with respect to time due to the severe variation in impact loads and inertia forces [14]. Pham et al. [3] reported that the distribution of internal force along beams changed significantly over time. Gholipour et al. [15] analyzed the internal force of a column subjected to impact loading under different axial load ratios when the impact position was mid-span of a fixed-oundary column. The results indicated that the maximum shear force and bending moment increased when the axial force increased gradually. Isaac et al. [16] conducted a test on RC beams subjected to impact loads and proposed a moment distribution diagram for the beam considering the inertia force due to the impact loads.
The response of the shear force and bending moment in an RC structure is very complex because of the effects of both the impact force and inertia force. Do et al. [17] investigated the internal force of a pier under vehicle collision and concluded that the relationship between the internal force and the inertial force was complicated.
In this study, the effect of impact loading and inertia force on the internal force response was analyzed in detail considering various parameters, including impact energy, concrete strength, and boundary conditions. Additionally, the failure modes, mid-span displacements, and impact forces of RC beams under impact loading were also examined. After this introduction, the numerical models of RC beams are described in Section 2. The results of the failure modes, impact force, displacement response, bending moment, and shear force are presented in Section 3. Finally, conclusions are summarized in Section 4.

2. Numerical Model Validation and Development

2.1. Introduction to Test Model

Pham et al. [18] conducted tests on static loading and a drop hammer impact on supported beams with varying reinforcement ratios. Beam 2 was used as a physical model to verify the simulation results in this study. The diameters of the longitudinal reinforcing bars and stirrups are 10 mm. The clear span and total length of the RC beam are 1900 mm and 2200 mm, respectively, and the cross-section size is 150 mm × 250 mm. The specific size and reinforcement are plotted in Figure 1. In the test, the mass of the steel projectile and the impact velocity are 203.5 kg and 6.26 m/s, respectively.
The shear–span ratio, impact velocity, concrete strength, and boundary conditions are considered in this work.
Table 1 describes the research program for RC beams with varying parameters.
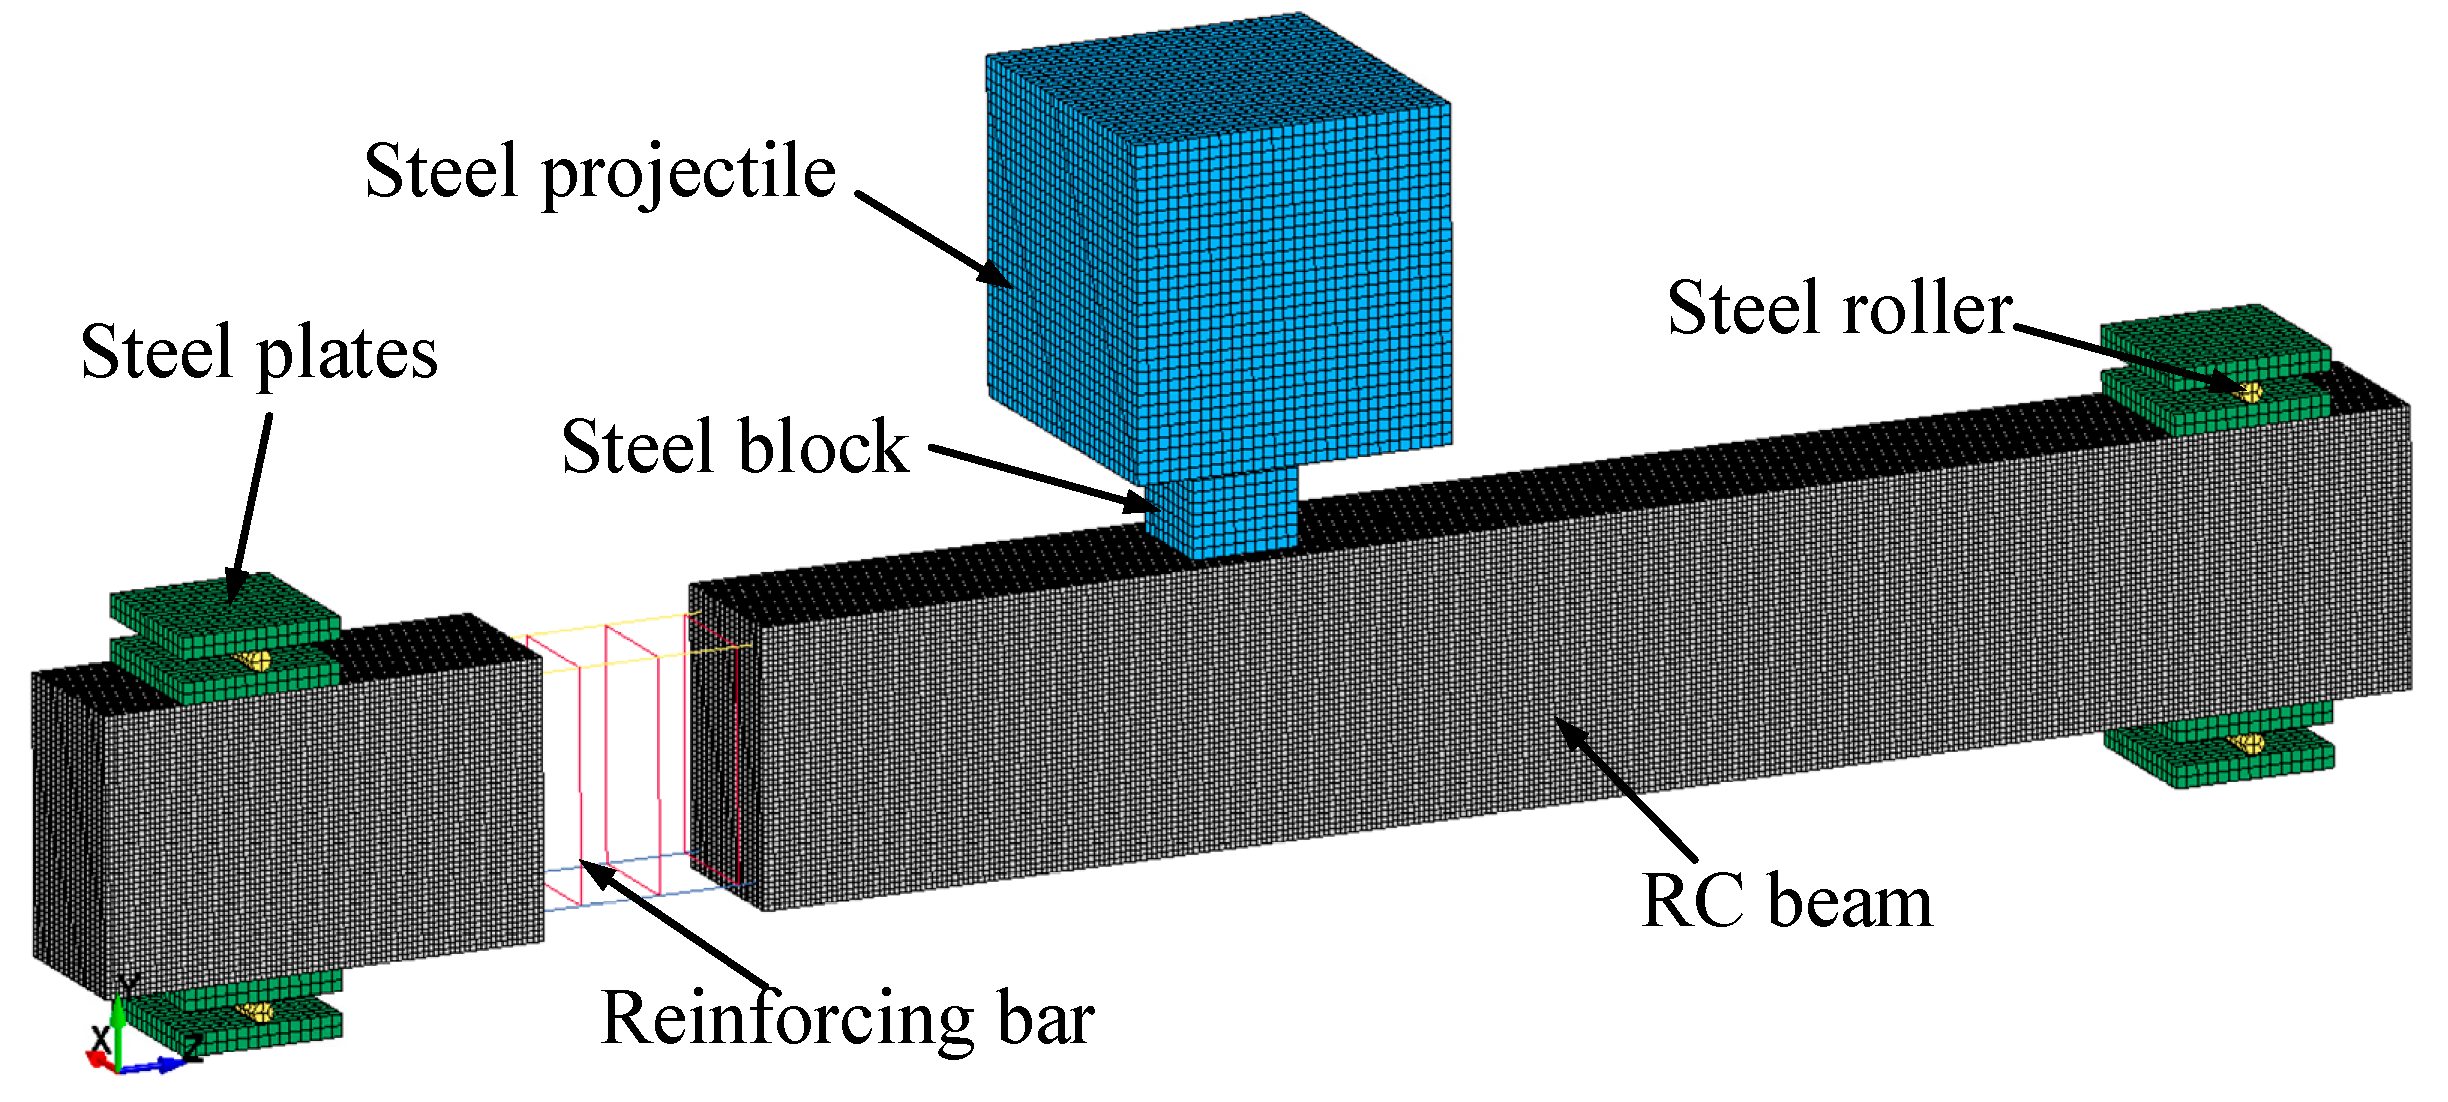
In this work, RC beams subjected to impact loads are simulated by LS-DYNA R13, which is widely used in the impact and explosion field [19,20,21,22,23,24]. The concrete and reinforcement are simulated using SOLID_164 and BEAM_161, respectively, and the slip between reinforcement and concrete is not considered [3,12,17,18]. The mesh size of the RC beam, determined through convergence analysis, is 5 mm. In contrast, the mesh sizes of the drop hammer, steel block, and plates are slightly larger than those of the concrete and reinforcement in order to reduce computational time.
The numerical model of the RC beam is depicted in Figure 2. The method of Automatic_Surface_To_ Surface (ASTS) in LS-DYNA R13 is adopted to simulate the interaction between the impactor and RC beam [25,26].

2.2. Material Model and Strain Rate Effect

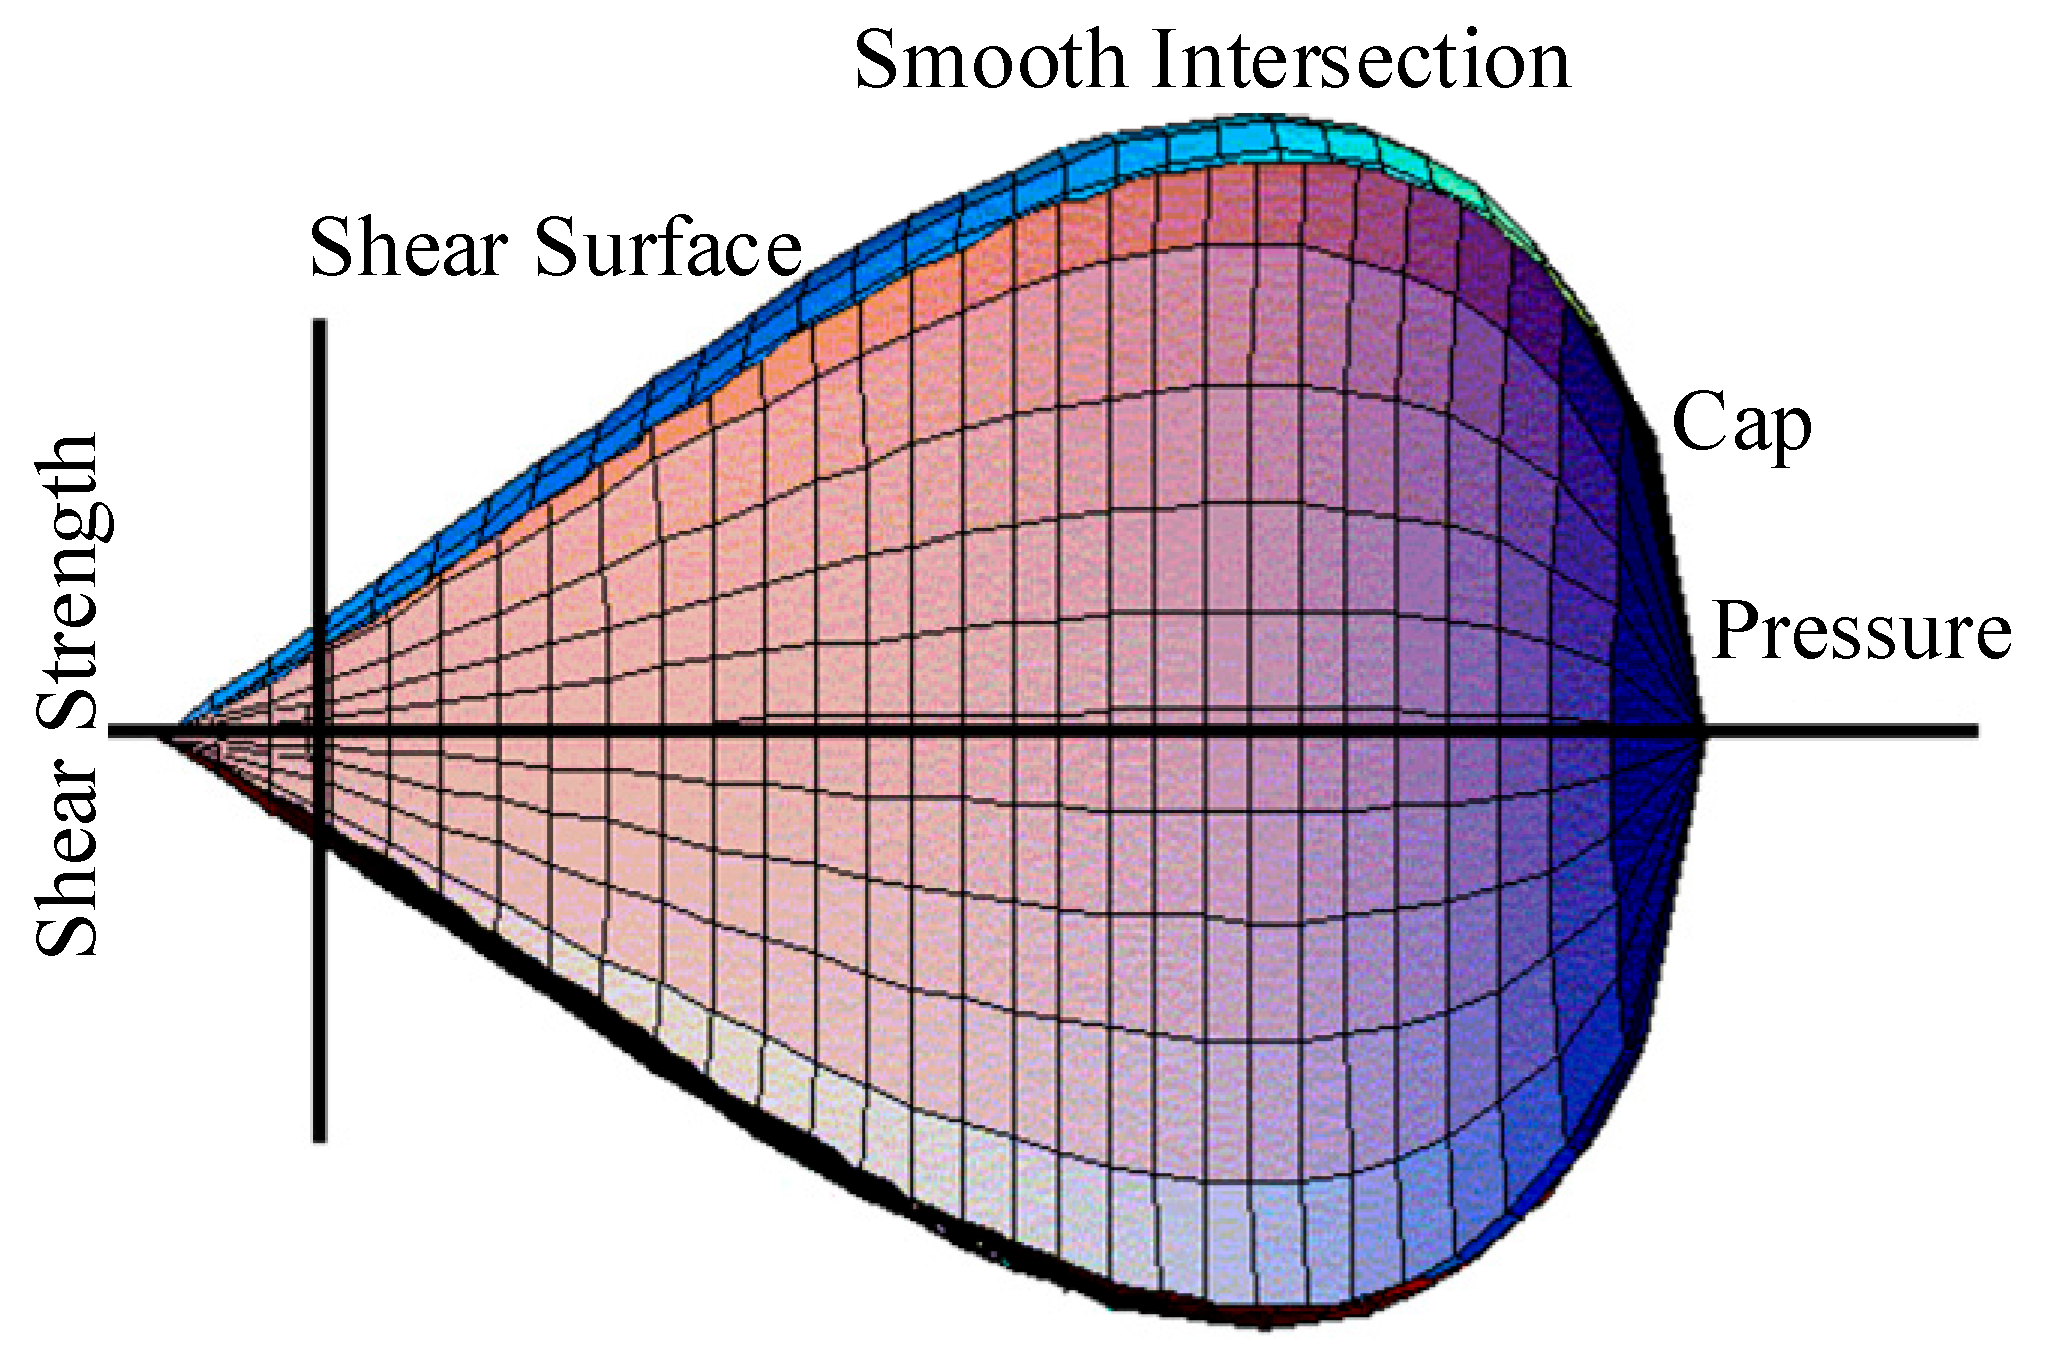
The material model of *MAT_CSCM_CONCRETE (*MAT_159) is used to represent the dynamic performance of concrete under impact loads [27,28]. This type of model is typically referred to as a smooth cap model or continuous surface cap model (CSCM) [29,30,31], as illustrated in Figure 3.
A smooth yield surface is used to describe the transition area between the shear failure surface and the cap hardening surface. Because isotropic materials have three independent stress invariants, the yield surface expresses them by three stress invariants. The first invariant of the stress tensor (J1), the second invariant of the stress tensor (J2), and the third invariant of the stress tensor (J3) are used to express them, respectively. In addition, the cap hardening parameter (k) also needs to be adopted, and the expression is shown as:
f J 1 , J 2 , J 3 , k = J 2 R 2 F f 2 F c 2
where F f is the shear failure surface, F c is the hardening cap, and R is the Rubin three-invariant reduction factor.
When concrete is in tension and low triaxial compression, a shear surface failure is used to define the strength of concrete material. The shear surface failure F f is defined along the compression meridian, and the equation can be shown as:
F f ( J 1 ) = α λ e x p β J 1 + θ J 1
where the value of α , β , λ , and θ can be evaluated by fitting the model surface to strength measurements.
When the stress state of concrete falls within the range of middle- to- high triaxial compression, its strength is controlled by both the shear failure surface and the cap hardening surface. The hardening function of isotropic caps involves a two-part function. When the stress state of concrete material is in tension or a lower triaxial compression stress state, the cap function value is 1. When the stress state of concrete material is in the middle-to-high triaxial compressive stress state, the cap function surface is elliptical, and the yield strength is controlled by both the shear failure surface and the cap surface. The isotropic hardening cap is shown in Figure 4.
F c J 1 , k = 1 J 1 L k [ J 1 L k + J 1 L k ] 2 [ X k L ( k ) ] 2
L k = k   i f   k > k 0 k 0   o t h e r w i s e
where k 0 is the value of J1 at initial intersection of the cap and shear failure surface, and the intersection of the cap with the J1 axis is at J1 = X(k). X k has the following expression:
X k = L k + R F f [ L ( k ) ]
where R is the ratio of its major to minor axes.
The model of CSCM simulates the change in the plastic volume of a material by moving the cap surface. The movement of the cap surface is based on the hardening rule of the following formula:
ε v p = W ( 1 e x p D 1 X X 0 D 2 X X 0 2 )
where ε v p and W are the plastic volume strain and the maximum plastic volume strain, respectively, X0 is the initial location of the cap when k   = k 0 , and D1 and D2 are two input parameters.
There are two ways to control the parameters of the CSCM model. The first model is simplified; the LS-DYNA program automatically calculates all materials in terms of both the aggregate size and axial compressive strength.
Users can customize every parameter in the second model, which is the whole model. Table 2 lists the major parameters for the model that is defined in the present work using the second technique [29,30,31].
The strength of the material under impact loads will increase. Thus, the strain rate effect of the RC structure should be considered in the simulation [12,18]. The Dynamic Increase Factor (DIF) is used to express the increase in concrete strength. Several empirical models are available to calculate the strain rate effect on concrete [32,33,34]. Hao et al. and Chen et al. carried out simulations on the DIF of concrete, and many studies have shown the reliability of the DIF method [35,36,37]. In this research, CEB-FIP is employed to express the DIF of concrete [38]. In addition, the element deletion function is used to overcome excessive distortion. In this work, the control criterion of the damage variable is adopted. When the concrete element satisfies the damage variable equal to 0.999 with a maximum principal strain of 0.1 (ERODE = 1.10), its strength is reduced to 0 MPa and it is removed from the overall model.
Meanwhile, the reinforcing bar is expressed by using *MAT_PIECEWISE_LINE-ARPLASTICITY (*MAT_024). The yield strength and elastic modulus of steel bars are 500 MPa and 200 GPa, respectively. The influence of the strain rate on the yield strength of steel is determined by [39]:
DIF = ( ε . / 10 4 ) 0.074 0.040 f y 414
where ε . and fy is the strain rate of steel and the yield strength of steel in MPa, and the DIF takes a fixed value when ε .   160 s−1.
Additionally, the elastic model is applied to the steel impactor, steel block, steel plate, and roller, with parameters that are consistent with the experimental results. Table 3 describes the material parameters of the RC beam.
In this study, there are two boundary conditions: a supported boundary and a fixed boundary. The RC beams with the boundary condition of being supported are consistent with the experimental ones, i.e., steel plates and steel rollers are set up at the end of the beams, and the external steel plates are fixed. In addition, the boundary condition of the fixed end is achieved by establishing contact steel plates at both ends of the beam, and all degrees of freedom of the steel plates are restrained.

2.3. Calibration of the Numerical Model

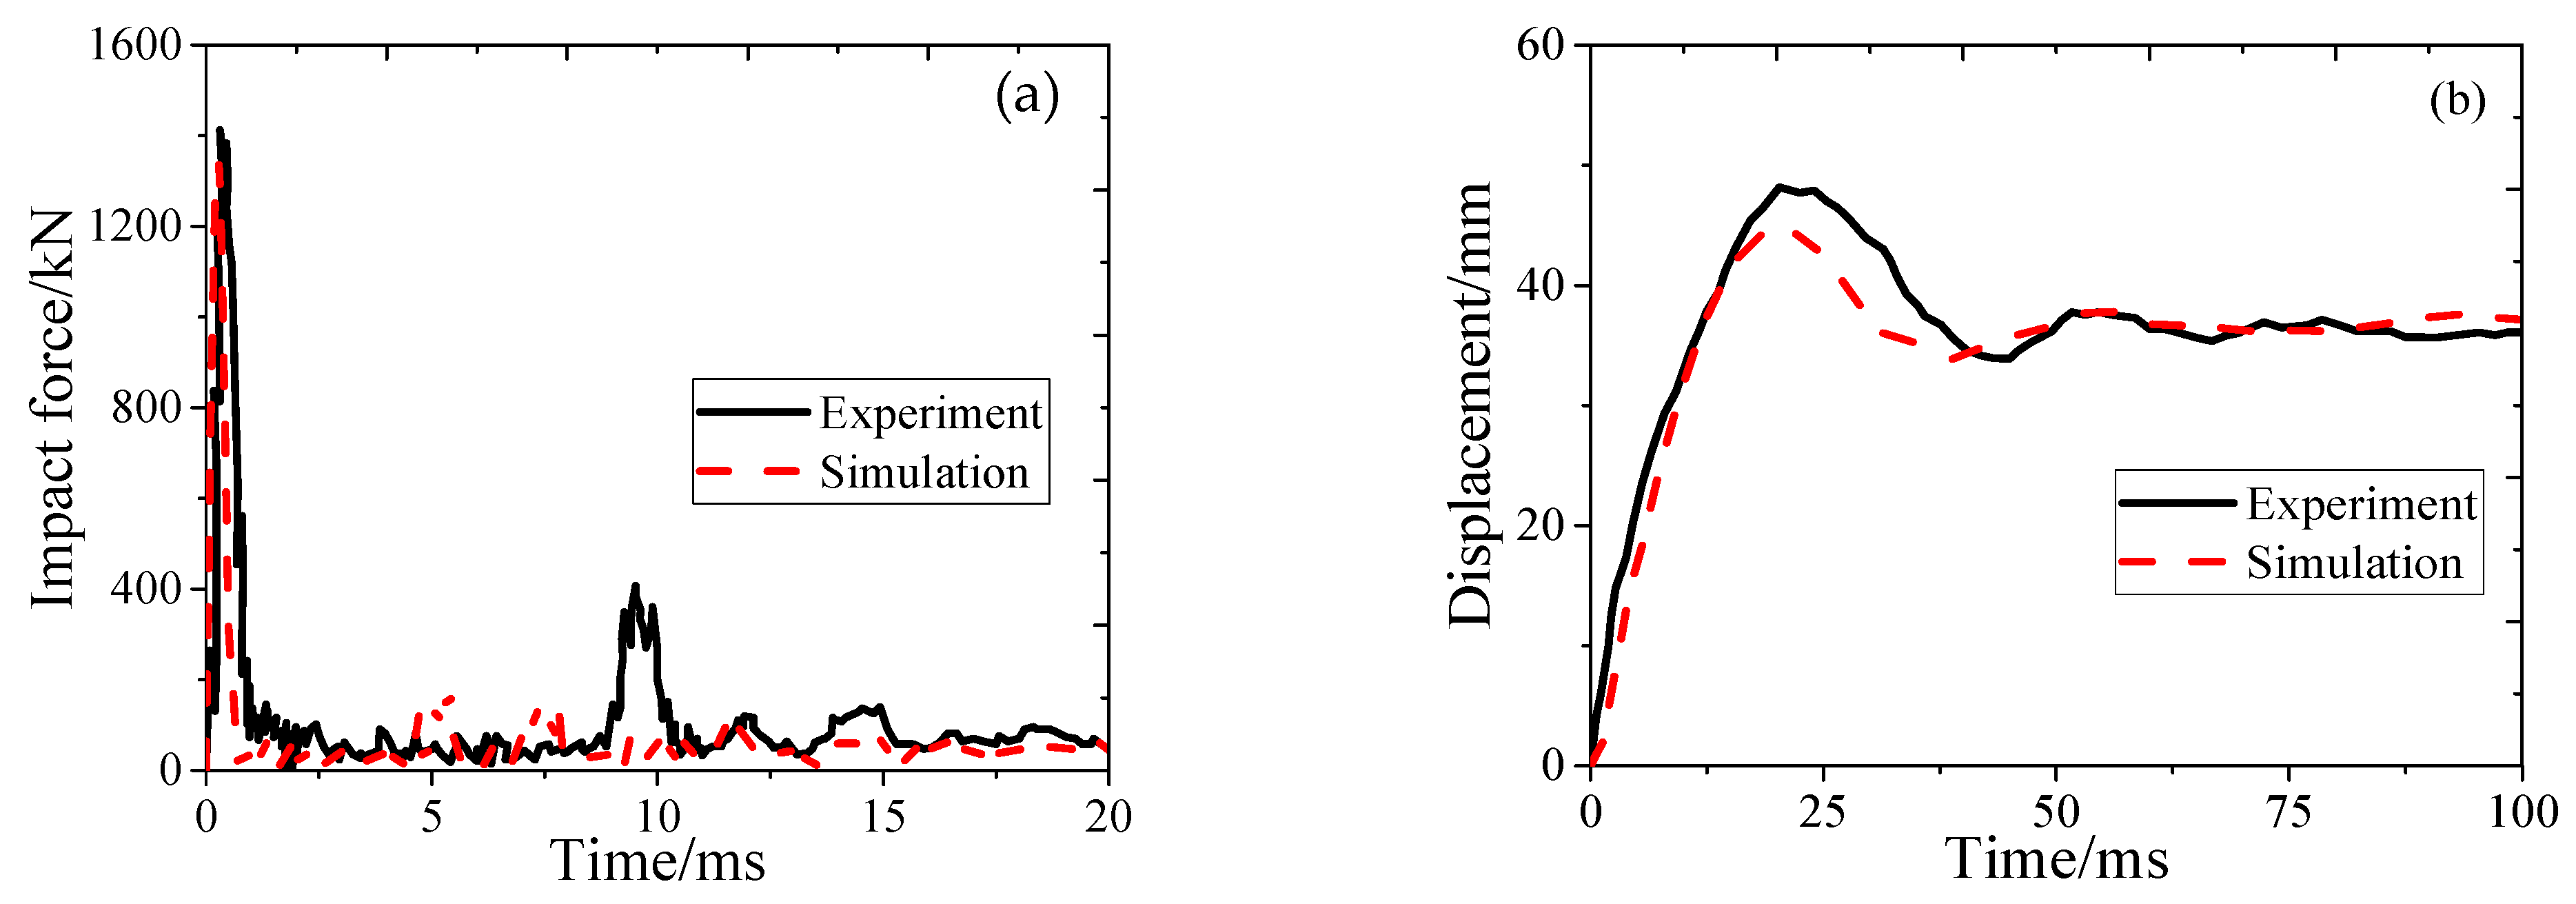
Figure 5 and Figure 6 describe the results of the experiment and the test, respectively. The impact force and mid-span displacement of the RC beams are depicted in Figure 6. The simulation and experimental impacts forces are 1348 kN and 1346 kN, respectively, and the difference between them is 2.7%. Additionally, as seen in Figure 6a, the simulation and experiment durations are close at around 20 ms.
While Figure 6b represents the mid-span displacement of the beam, the simulation result shows a displacement of 44.6 mm, and the experimental result was approximately 46.6 mm. Due to the difference in viscous coefficients required in the model, a non-steady-state vibration response is exhibited [40].
The simulation’s residual displacement is 37.1 mm, while the experiment’s residual displacement is 36.5 mm. As a result, the numerical model’s impact force, maximum displacement, and residual displacement closely resemble the experimental findings.
Figure 5 describes the plastic strain along the beam length under impact load. The results of both the experimental and numerical models indicate bending–shear failure. The bending cracks in the middle span of the beam develop deeper and closer to the top of the beam, and the shear inclined cracks develop sufficiently. Additionally, both the experiment and the numerical model reveal cracks at the negative moment region.
Therefore, the numerical model can reflect the failure mode and the dynamic responses of the RC beam under impact loading.

3. Results and Discussions

3.1. Failure Modes

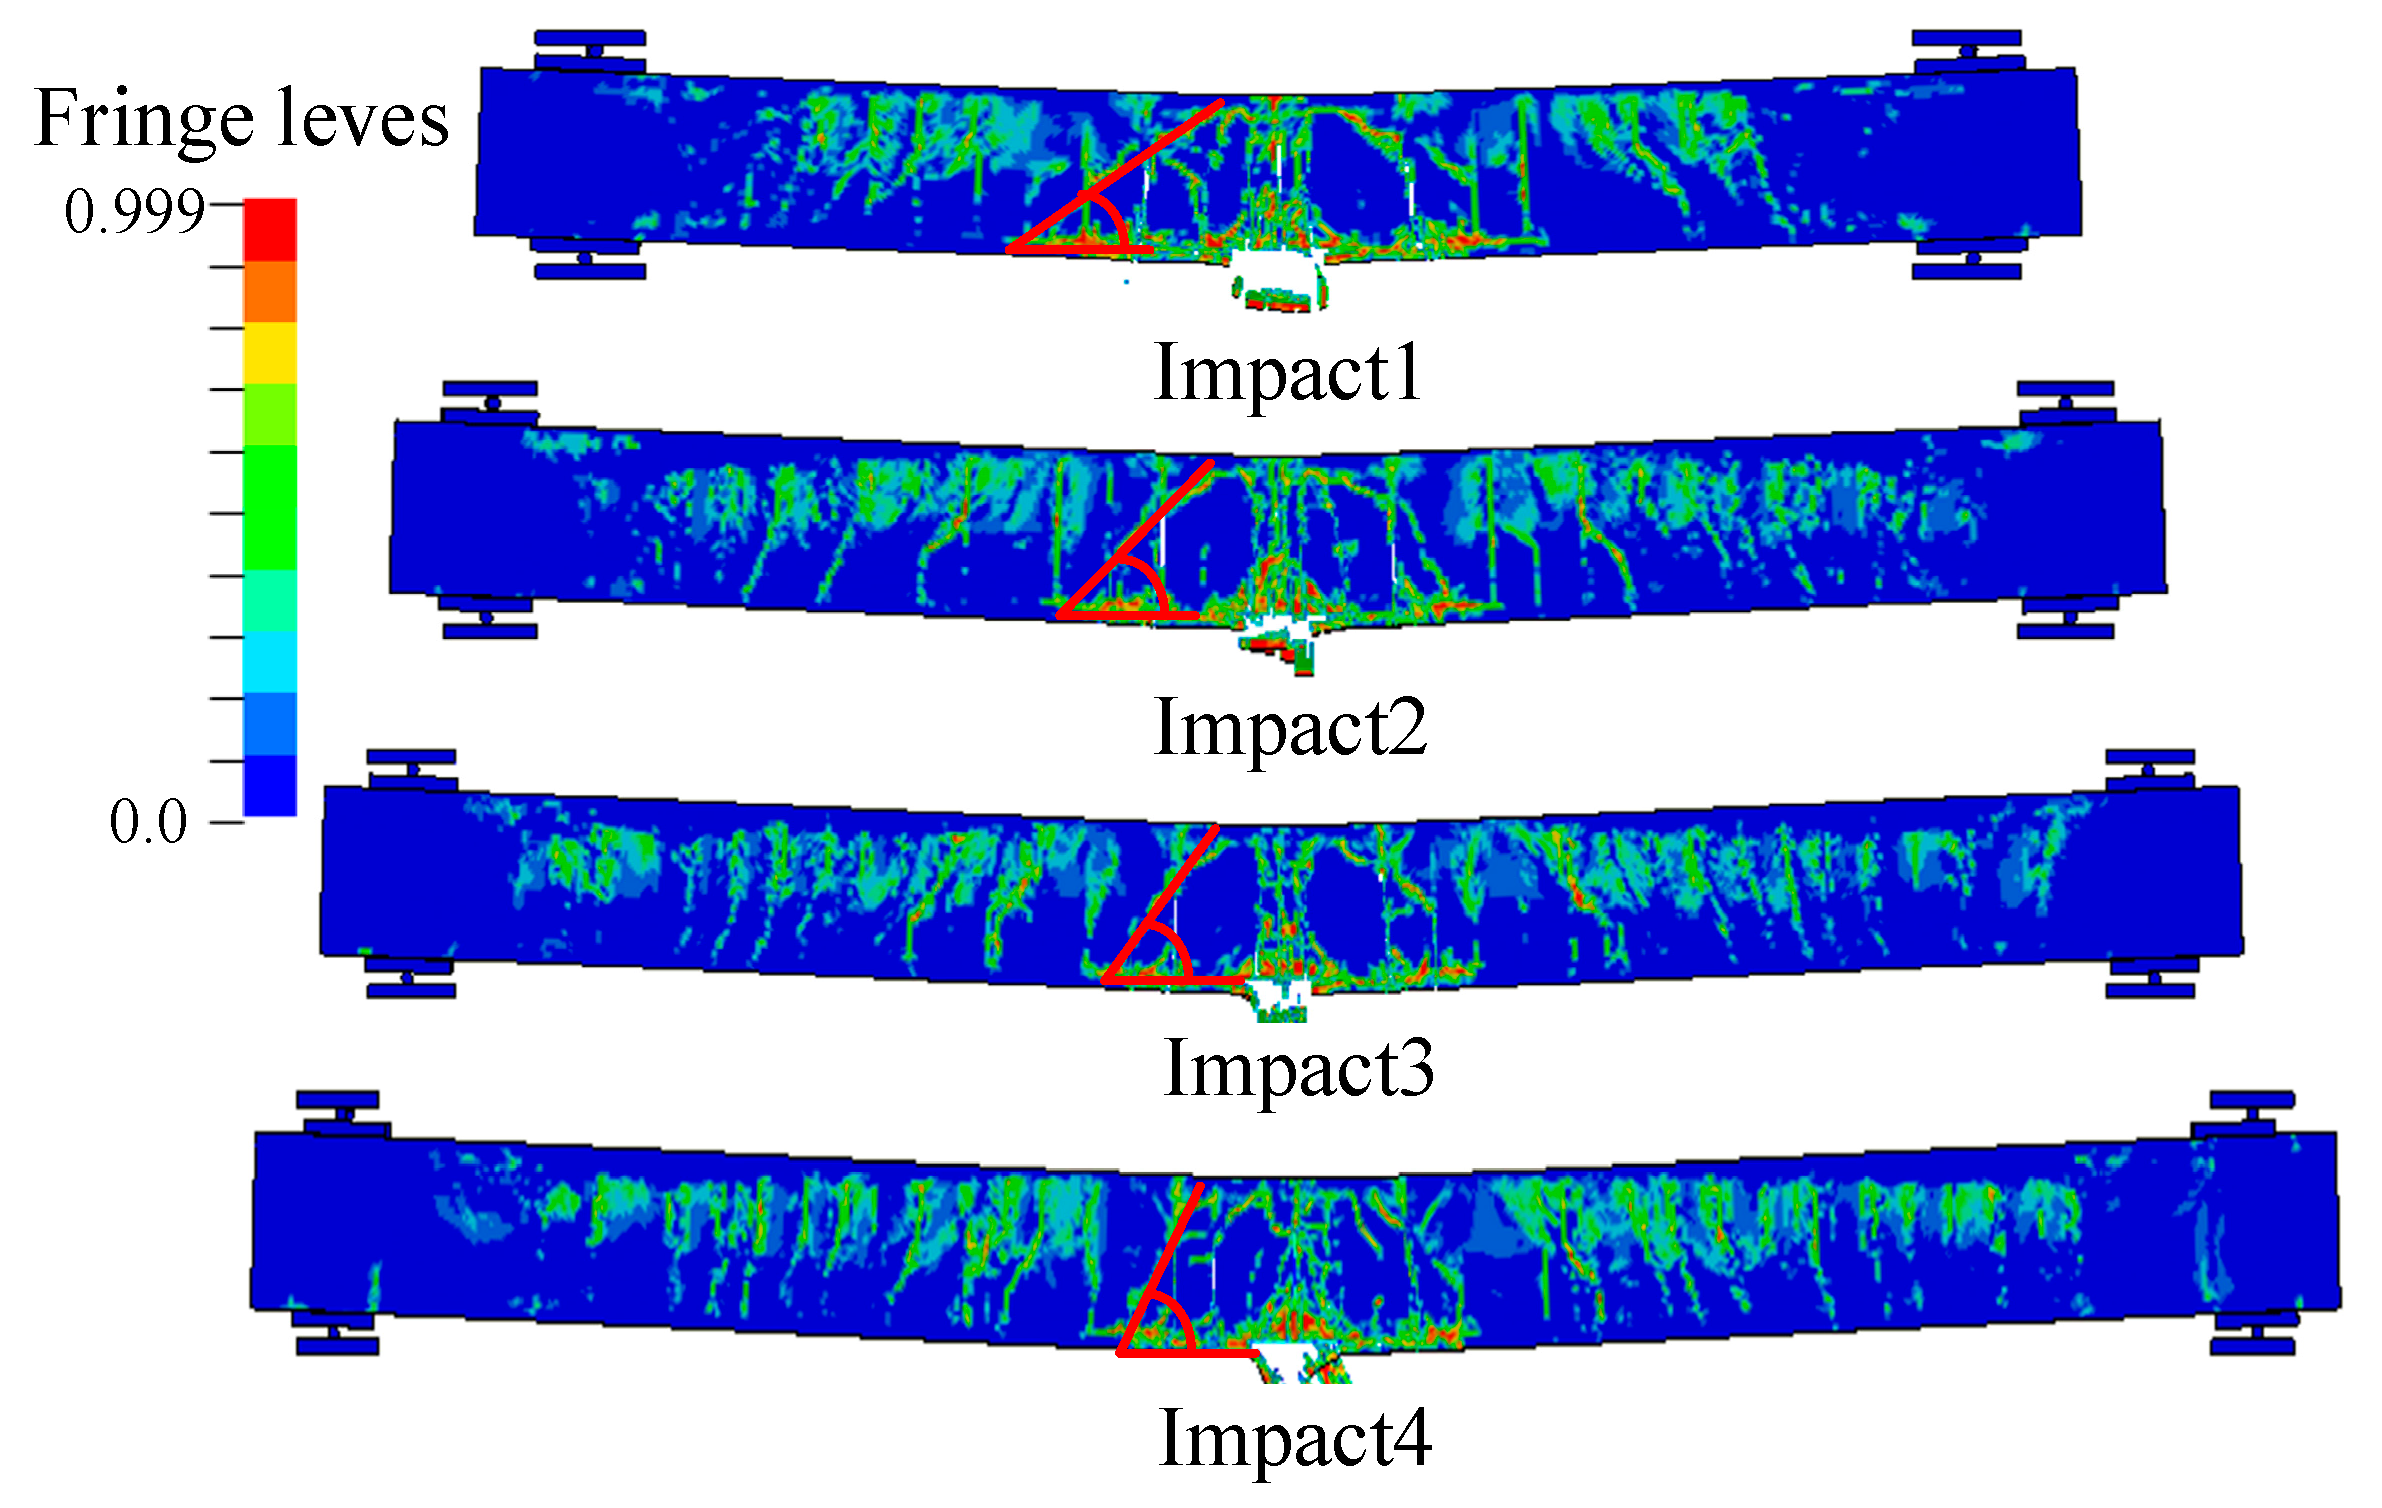
Figure 7 depicts the plastic strain of RC beams under different shear–span ratios. There are many flexural cracks produced in the mid-span of beams close to the top of the beam, and the shear cracks on both sides are fully developed. When the shear–span ratio of the beam increases, the angle between the critical inclined crack and horizontal line increases gradually. In other words, the bending phenomenon of beams under impact loads is more pronounced with an increase in the shear–span ratio.
Figure 8 illustrates the plastic strain of beams subjected to varying impact velocities. As the energy impact increases, the degree of the damage to the beams becomes more severe. Because the end vertical degree of freedom of the RC beams with fixed- boundary conditions is limited, shear cracks occur at the end of the beams. When the impact velocity increases, the degree of damage to the fixed end of the beams becomes more serious.
Figure 9 shows the beam plastic strain under different strengths, and it is evident that the increase in the concrete strength decreases the damage degree of the beams under impact loads. In addition, the failure mode of the beam gradually changes from bending–shear failure to bending failure. When the concrete strength of the beam is 70 MPa, the failure mode is bending–shear failure.
Many vertical bending and shear cracks with oblique failure surfaces occur in the mid-span of the beam. When the concrete strength of the beam is 90 MPa, many vertical cracks happen in the mid-span of the beam, i.e., bending failure.

3.2. Impact Force and Displacement

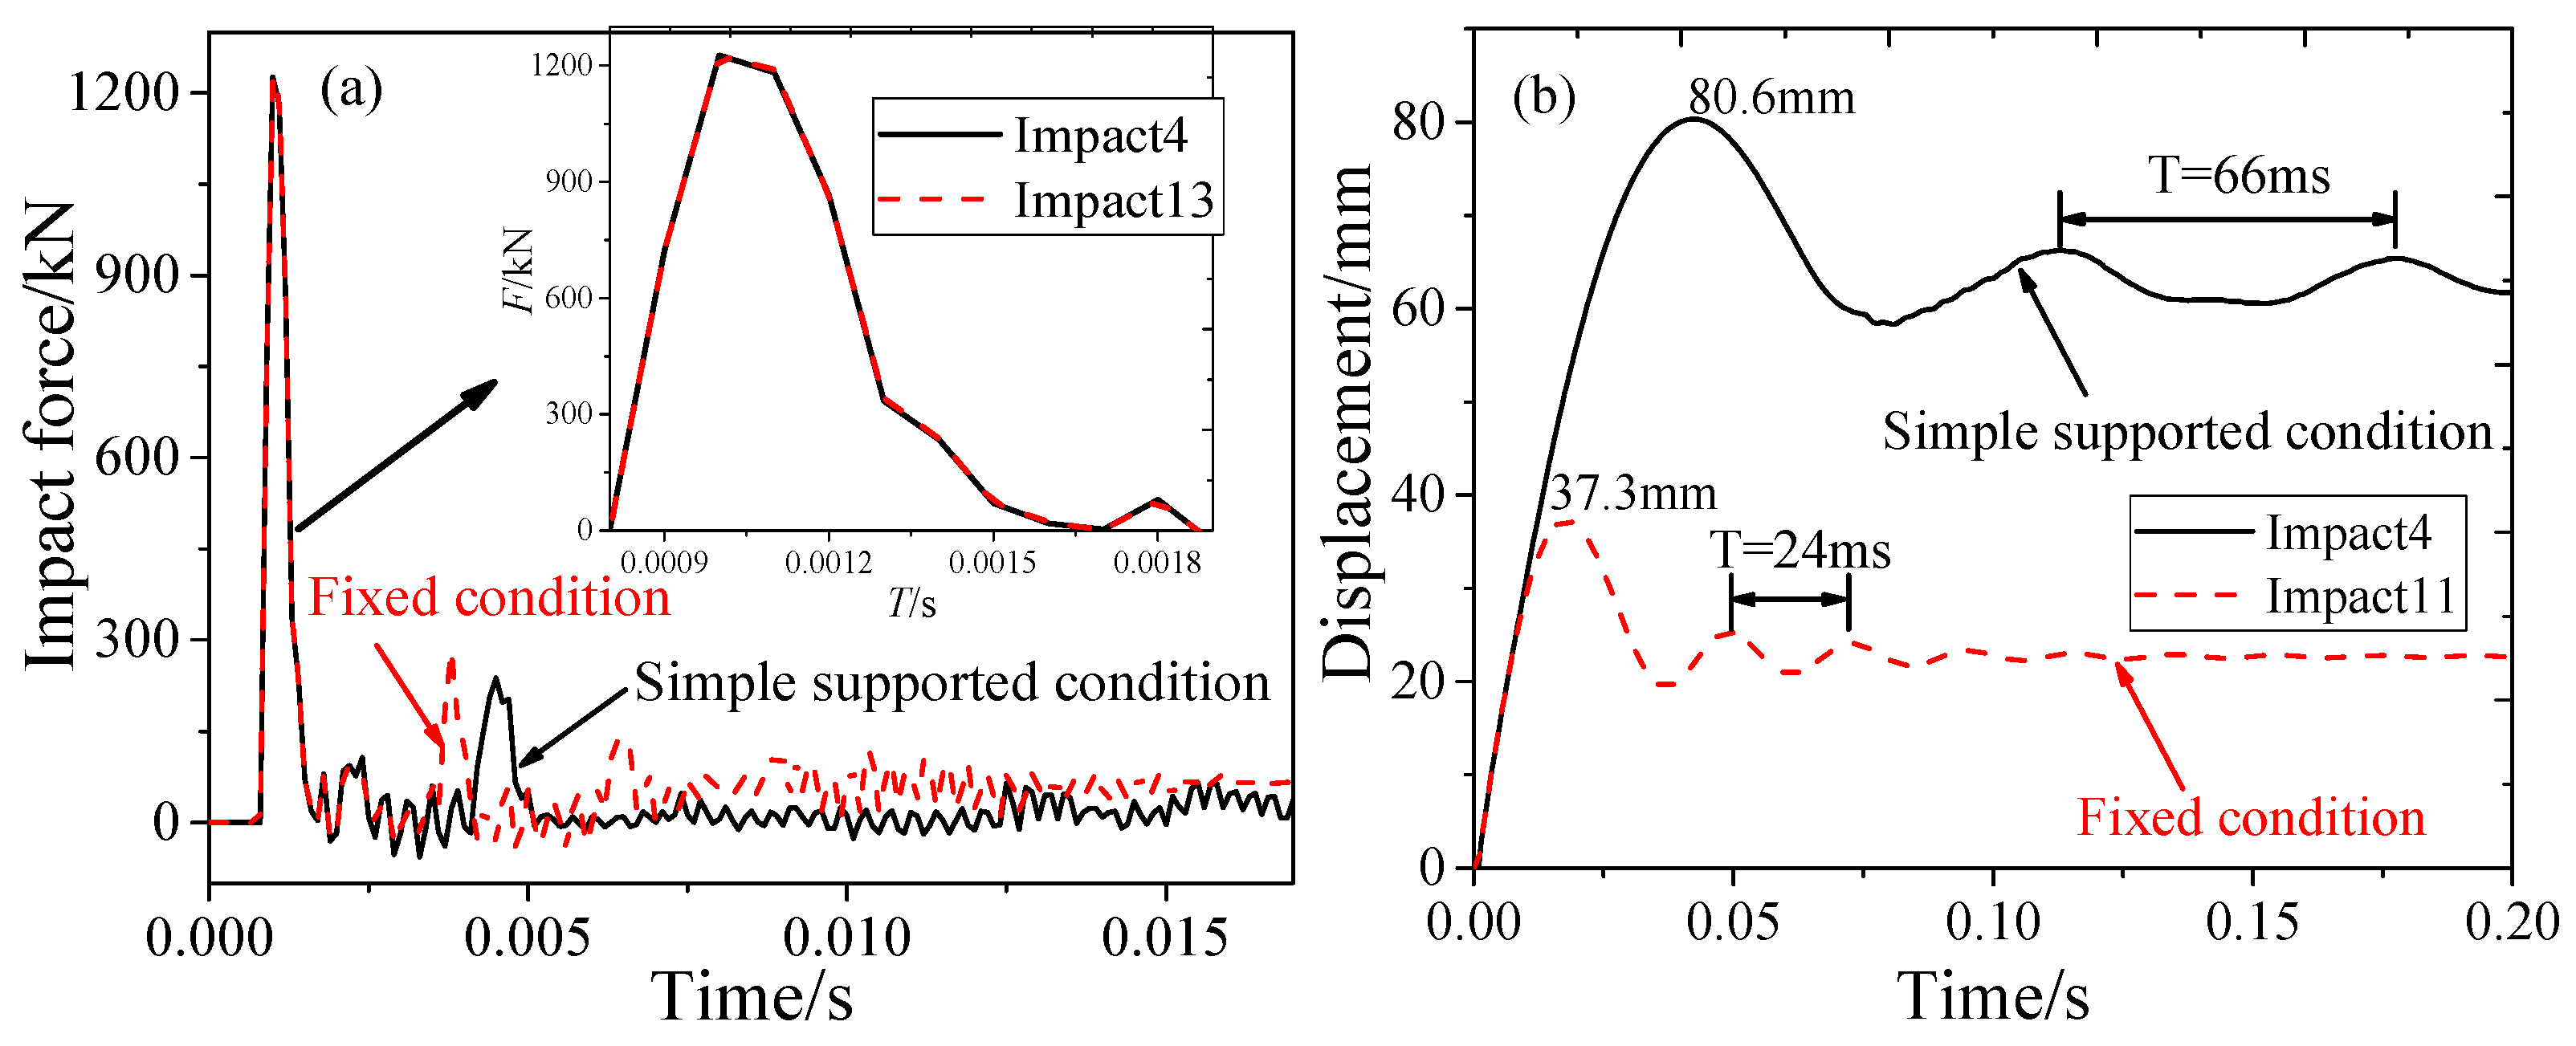
Figure 10 depicts the impact forces and displacements of beams under the conditions of simply supported and fixed boundaries. Since the local stiffness of the RC beam remains unchanged, the maximum impact forces are unaffected by the boundary conditions. The mid-span peak displacement and residual displacement of the beams in the fixed boundary are much smaller than those of the beams with the condition of the beams being supported. Furthermore, the free vibration period of the beams with a simply supported boundary is larger than that of the fixed- boundary beams; the free vibration period of the beams with a simply supported boundary is 66 ms, while that of the beams with the fixed- boundary conditions is 24 ms. The main reason is that the beams with fixed boundaries have improved overall rigidity, which shortens the vibration period of the RC beams.
There are many parameters, including local stiffness, the inertia of the structure itself, and the impact energy of the drop hammer, that will have an obvious effect on the impact force [40].
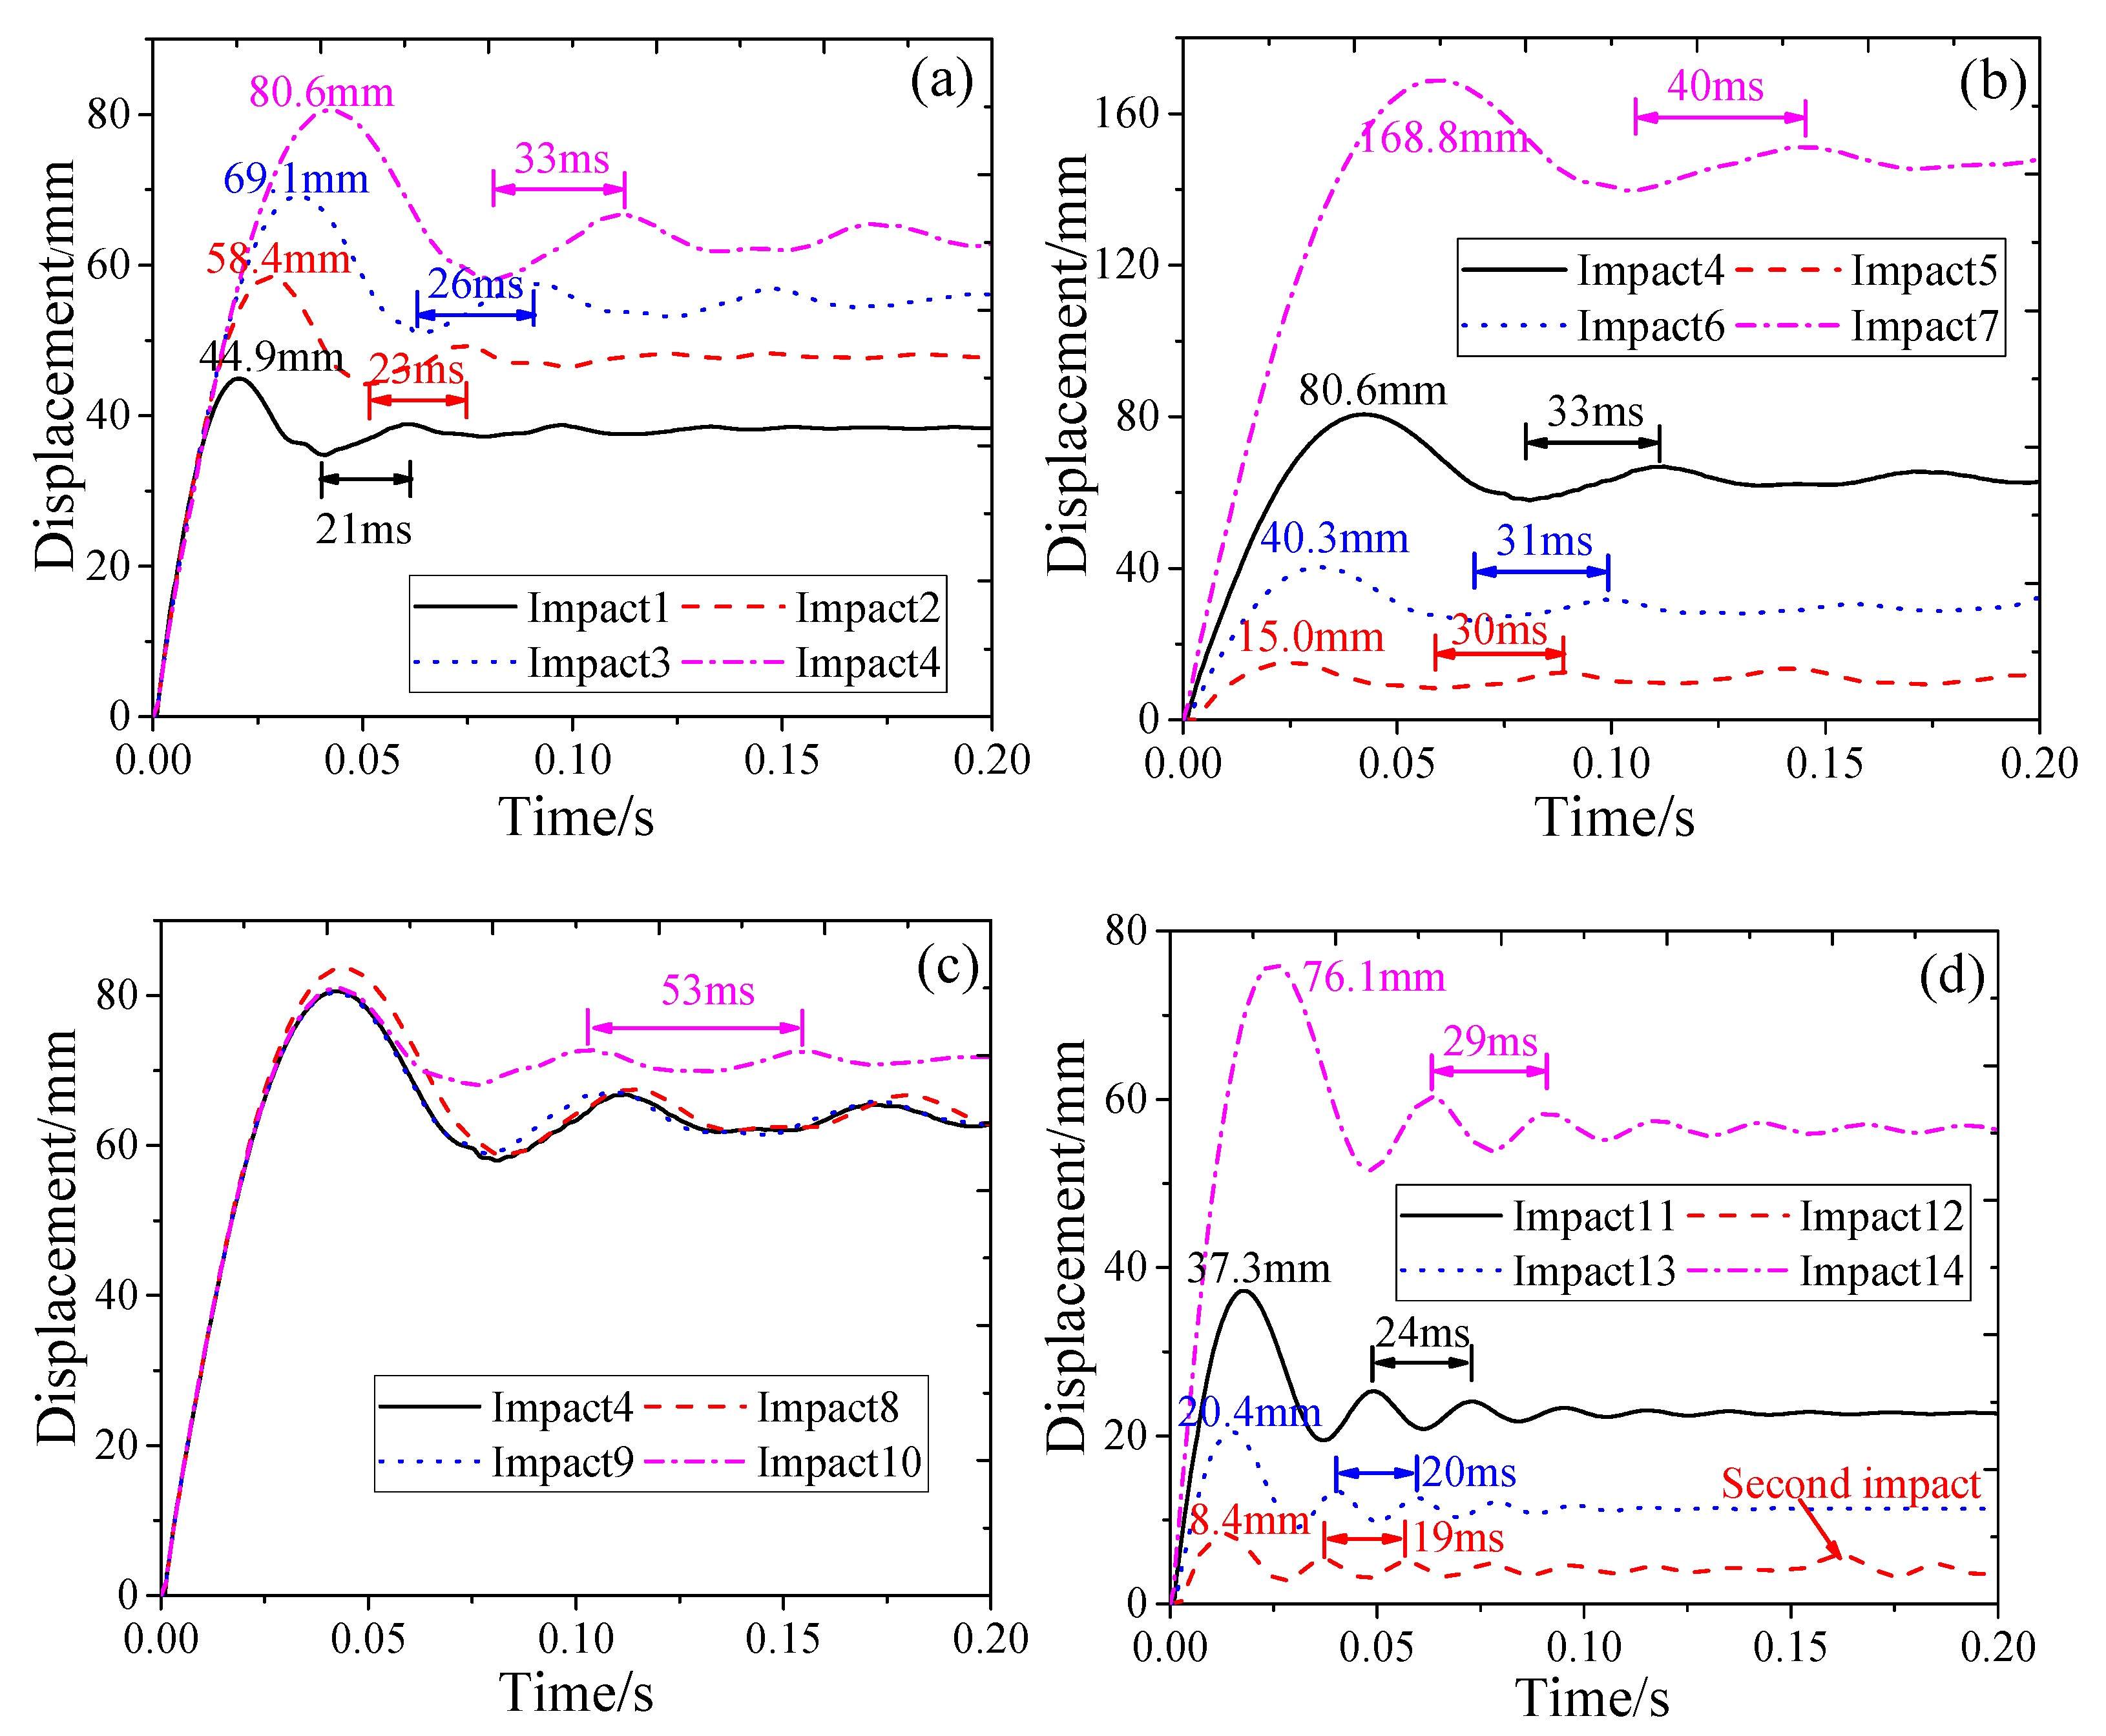
Figure 11 illustrates the impact force of RC beams under various clear spans, impact velocities, and concrete strengths. As plotted in Figure 11a, the maximum value of the impact force is the same when the impact velocity of the drop hammer is constant. Because the overall stiffness of the beam decreases gradually with the increase in the shear–span ratio, the curve of the impact force over time is slightly different after the end of the maximum impact stage. The impact of velocity has a considerable influence on the peak value of the first pulse. The maximum impact forces of impact 4, impact 5, impact 6, and impact 7 are 461 kN, 879 kN, 1226 kN, and 1505 kN, respectively, as depicted in Figure 11b. In addition, increasing the concrete strength leads to an increase in the local stiffness of the RC beams, and the peak value of the impact force increases slightly, as presented in Figure 11c.
After the RC beam is subjected to an impact load, the maximum mid-span displacement occurs in the stage of free vibration, which is primarily influenced by the overall stiffness of the beams [17]. Increasing the shear–span ratio decreases the global stiffness of the simply supported RC beams. Therefore, under the same impact energy, the mid-span displacement and free vibration period of the beams increase gradually with the increase in the clear span, as shown in Figure 12a. With the increase in the impact energy, the peak mid-span displacement of the beam significantly increases, and the free vibration period of simply supported beam increases gradually. The free vibration period of the simply supported beams is 60 ms when the impact speed is 2 m/s, while the correspond value of the beam with an impact velocity of 9 m/s is 80 ms, as described in Figure 12b. With the increase in impact energy, the peak mid-span displacement of the beam significantly increases, and the free vibration period of the simply supported beam increases gradually. Figure 12c depicts the mid-span displacement of RC beams with different concrete strengths. As mentioned above, the maximum mid-span displacement occurs in the free vibration stage of the beam, and the global stiffness of the beam is not significantly improved by increasing the concrete strength. Therefore, the maximum displacement of the beam in the mid-span does not change significantly. When the concrete strength of the RC beam is 90 MPa, the residual displacement increases obviously, and the free vibration period shortens slightly. Compared with simply supported beams, the mid-span displacement and vibration period of RC beams with a fixed boundary are markedly reduced; the peak mid-span displacement and free vibration period of impact 7 is 168.8 mm and 40 ms, while the corresponding results of impact 14 are 76.1 mm and 29 ms, respectively. The primary reason is that the fixed- boundary beams exhibit a larger global stiffness compared to the simply supported beams. In addition, compared with the simply supported beams, the residual displacement is also obviously decreased, as plotted in Figure 12b,d.

3.3. Shear Response

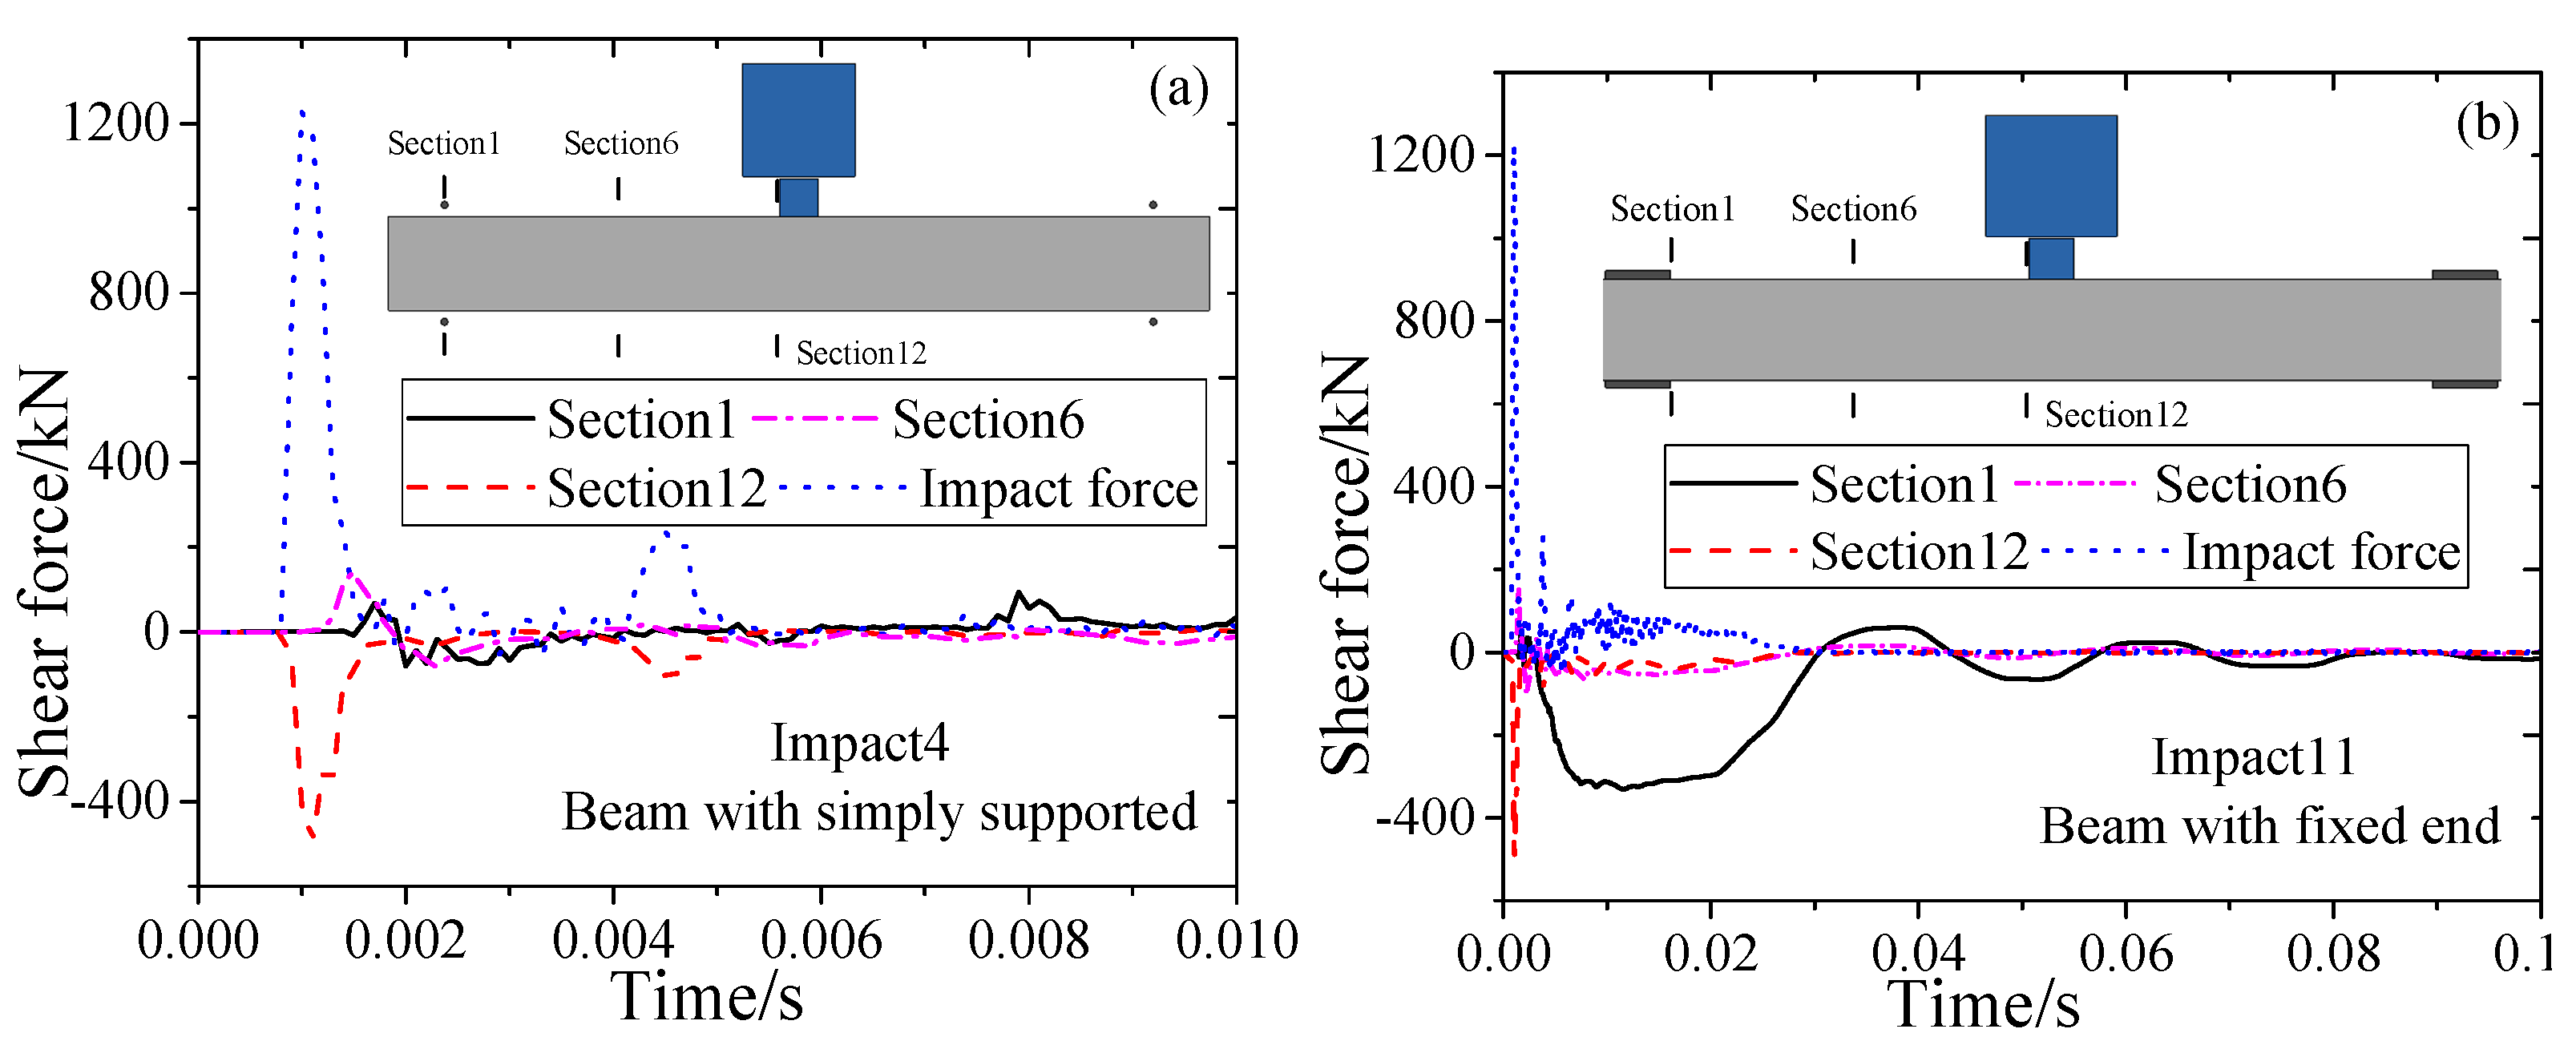
Figure 13 shows the sectional shear force time history curve of RC beams subjected to impact loads. In this research, the internal shear forces at sections 1, 6, and 12 are investigated, respectively. As plotted in Figure 13a, the shear force of section 12 reaches the peak value of −493 kN at 1.1ms, and the corresponding impact force is 1227 kN, so the shear force is less than the impact force. The main reason for this phenomenon is that the inertial force makes a positive contribution to the balance of forces during that period. With the increase in the distance from the impact location, the time when the shear force reaches its peak value increases gradually.
The primary cause is that the impact force’s vertical acceleration at the mid-span spreads out with time, and the distribution of inertial forces decreases over time as well towards both ends of the beam, which is reported by previous studies [13].
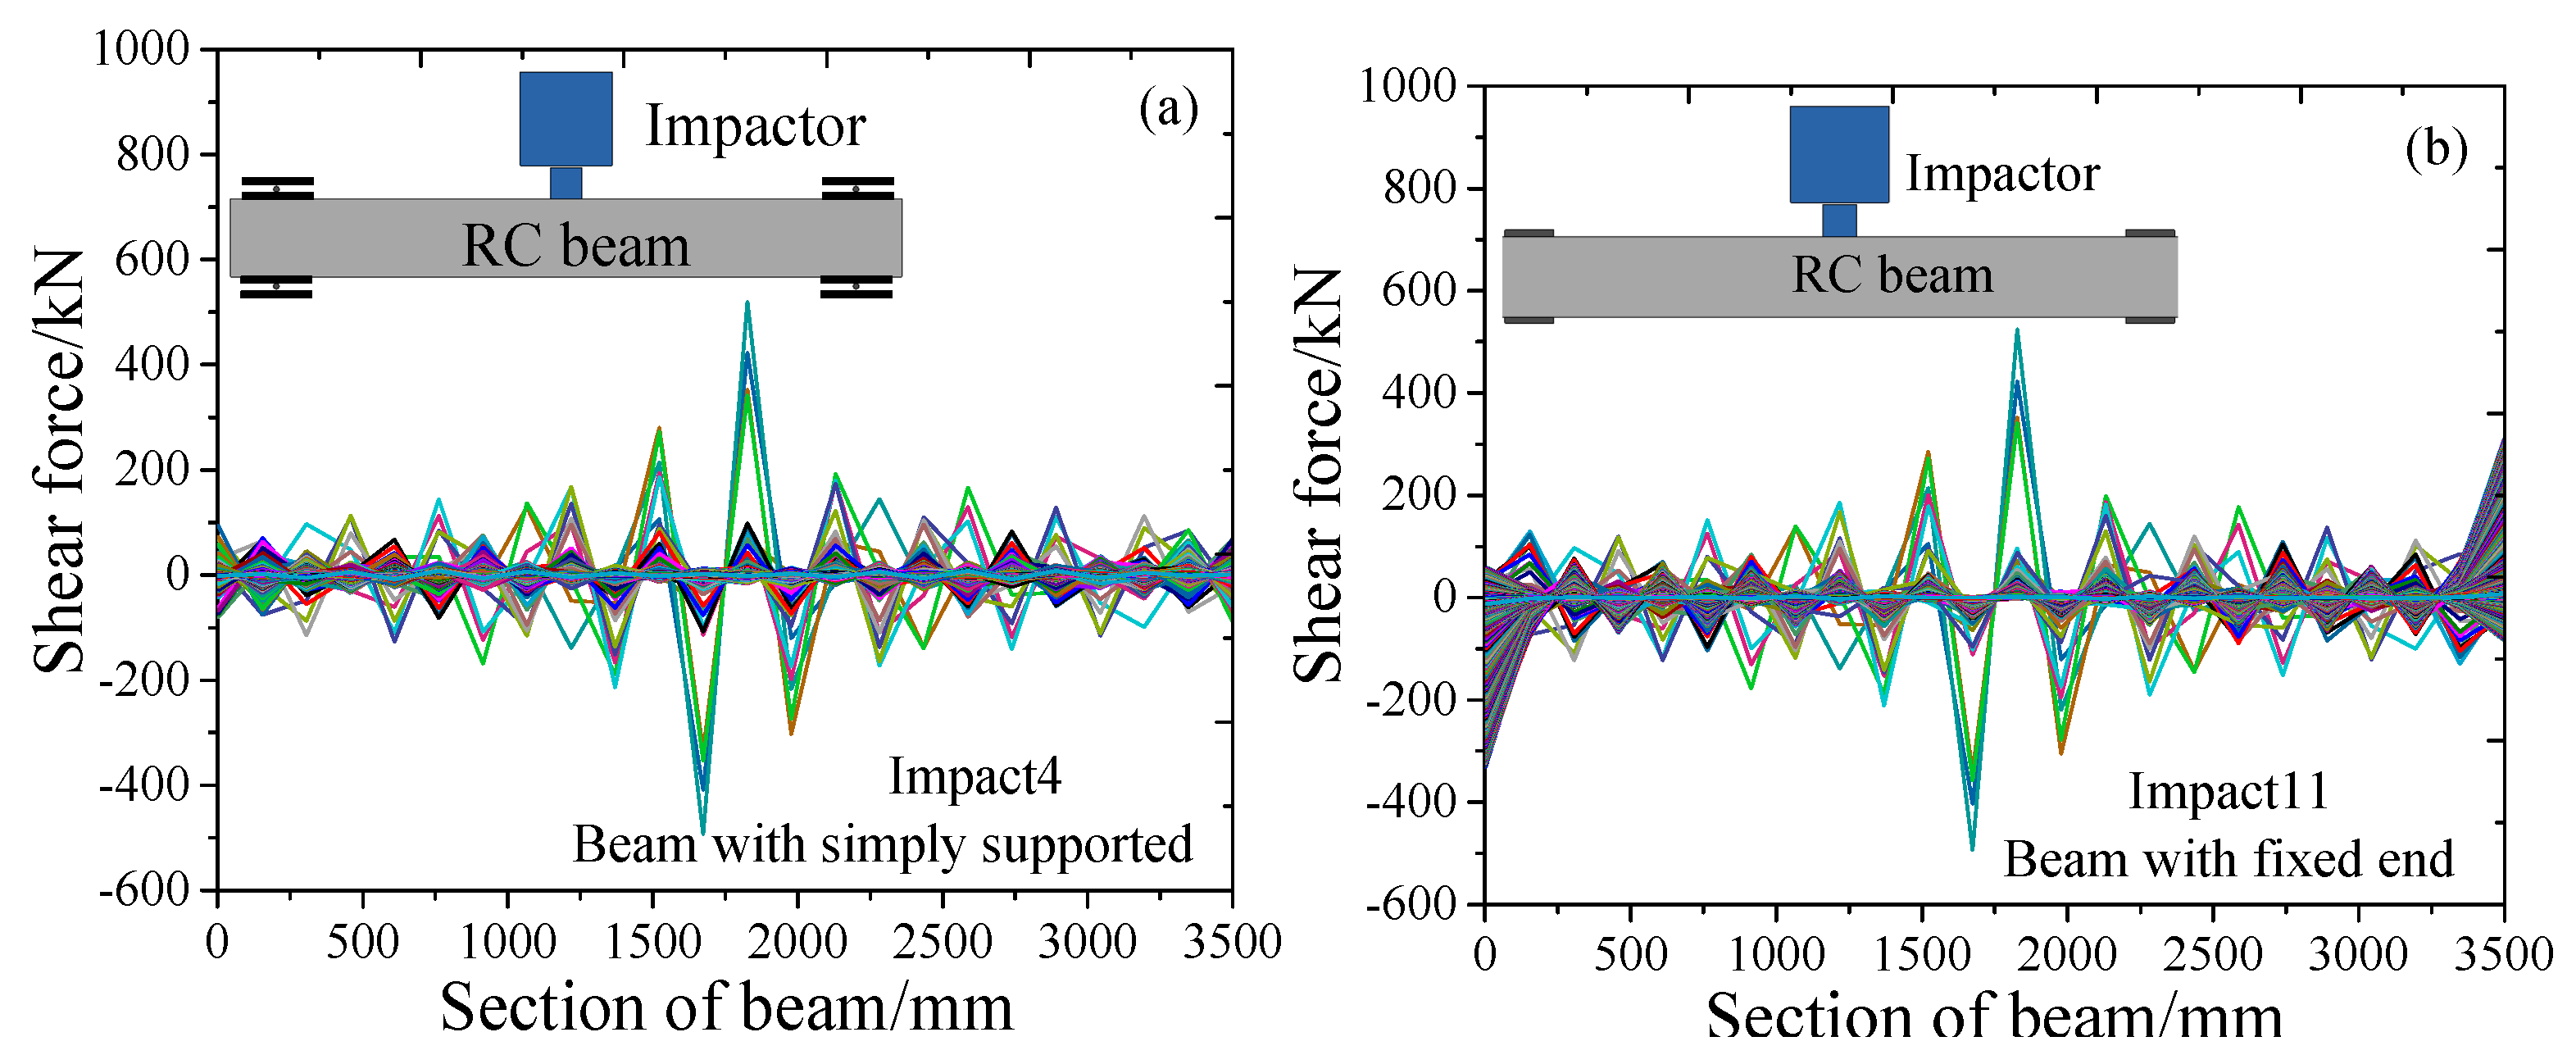
Unlike the simply supported beam, the peak shear force of the fixed- boundary beam at section 1 is obviously larger than the corresponding value of the simply supported beam, and the peak shear force of section 1 under impact 11 is −331 kN at 11.6 ms. The RC beam with the fixed- boundary conditions vibrates after being impacted, while the end freedom of the beam is limited, so the shear force of section 1 has a longer duration, and the value of the shear force of section 1 is far greater than that of the beam with simply supported conditions. Hence, the shear force response of the beams is affected by the parameters of the impact force, the distribution of inertia forces, and the different boundary conditions. Figure 14 shows the shear force response of the whole beam section under various boundary conditions. The shear force of the beam is antisymmetric along the length direction, and a high shear force is formed in the impact zone. In addition, as previously revealed, the beam with a fixed boundary forms a high shear force at the end, resulting in shear cracks at the end.
Figure 15 illustrates the envelope curve of shear force under various impact conditions. As shown in Figure 15a,b, the sheer force of the beams increases with the increase in impact energy. It is noteworthy that the end shear force of the fixed- boundary beam with an impact velocity of 6.26 m/s is almost equal to that with an impact velocity of 9 m/s; the main reason for this is that when the speed of the impactor is 6.26 m/s, through- cracks occur on the end of the fixed- boundary beam, so the beam cannot continue to bear more load after the impact energy continues to increase. Except for the difference in shear force at the end position, the shear force envelopes of the fixed- boundary beams and simply supported beams are constant. Figure 15c, and d show the shear force envelopes of different concrete strengths. The shear value of the impact zone has no apparent influence when the concrete strength of the beams is greater than 52 MPa. Except for the impact position, the change in concrete strength has a trivial effect on the shear force distribution.

3.4. Bending Moment

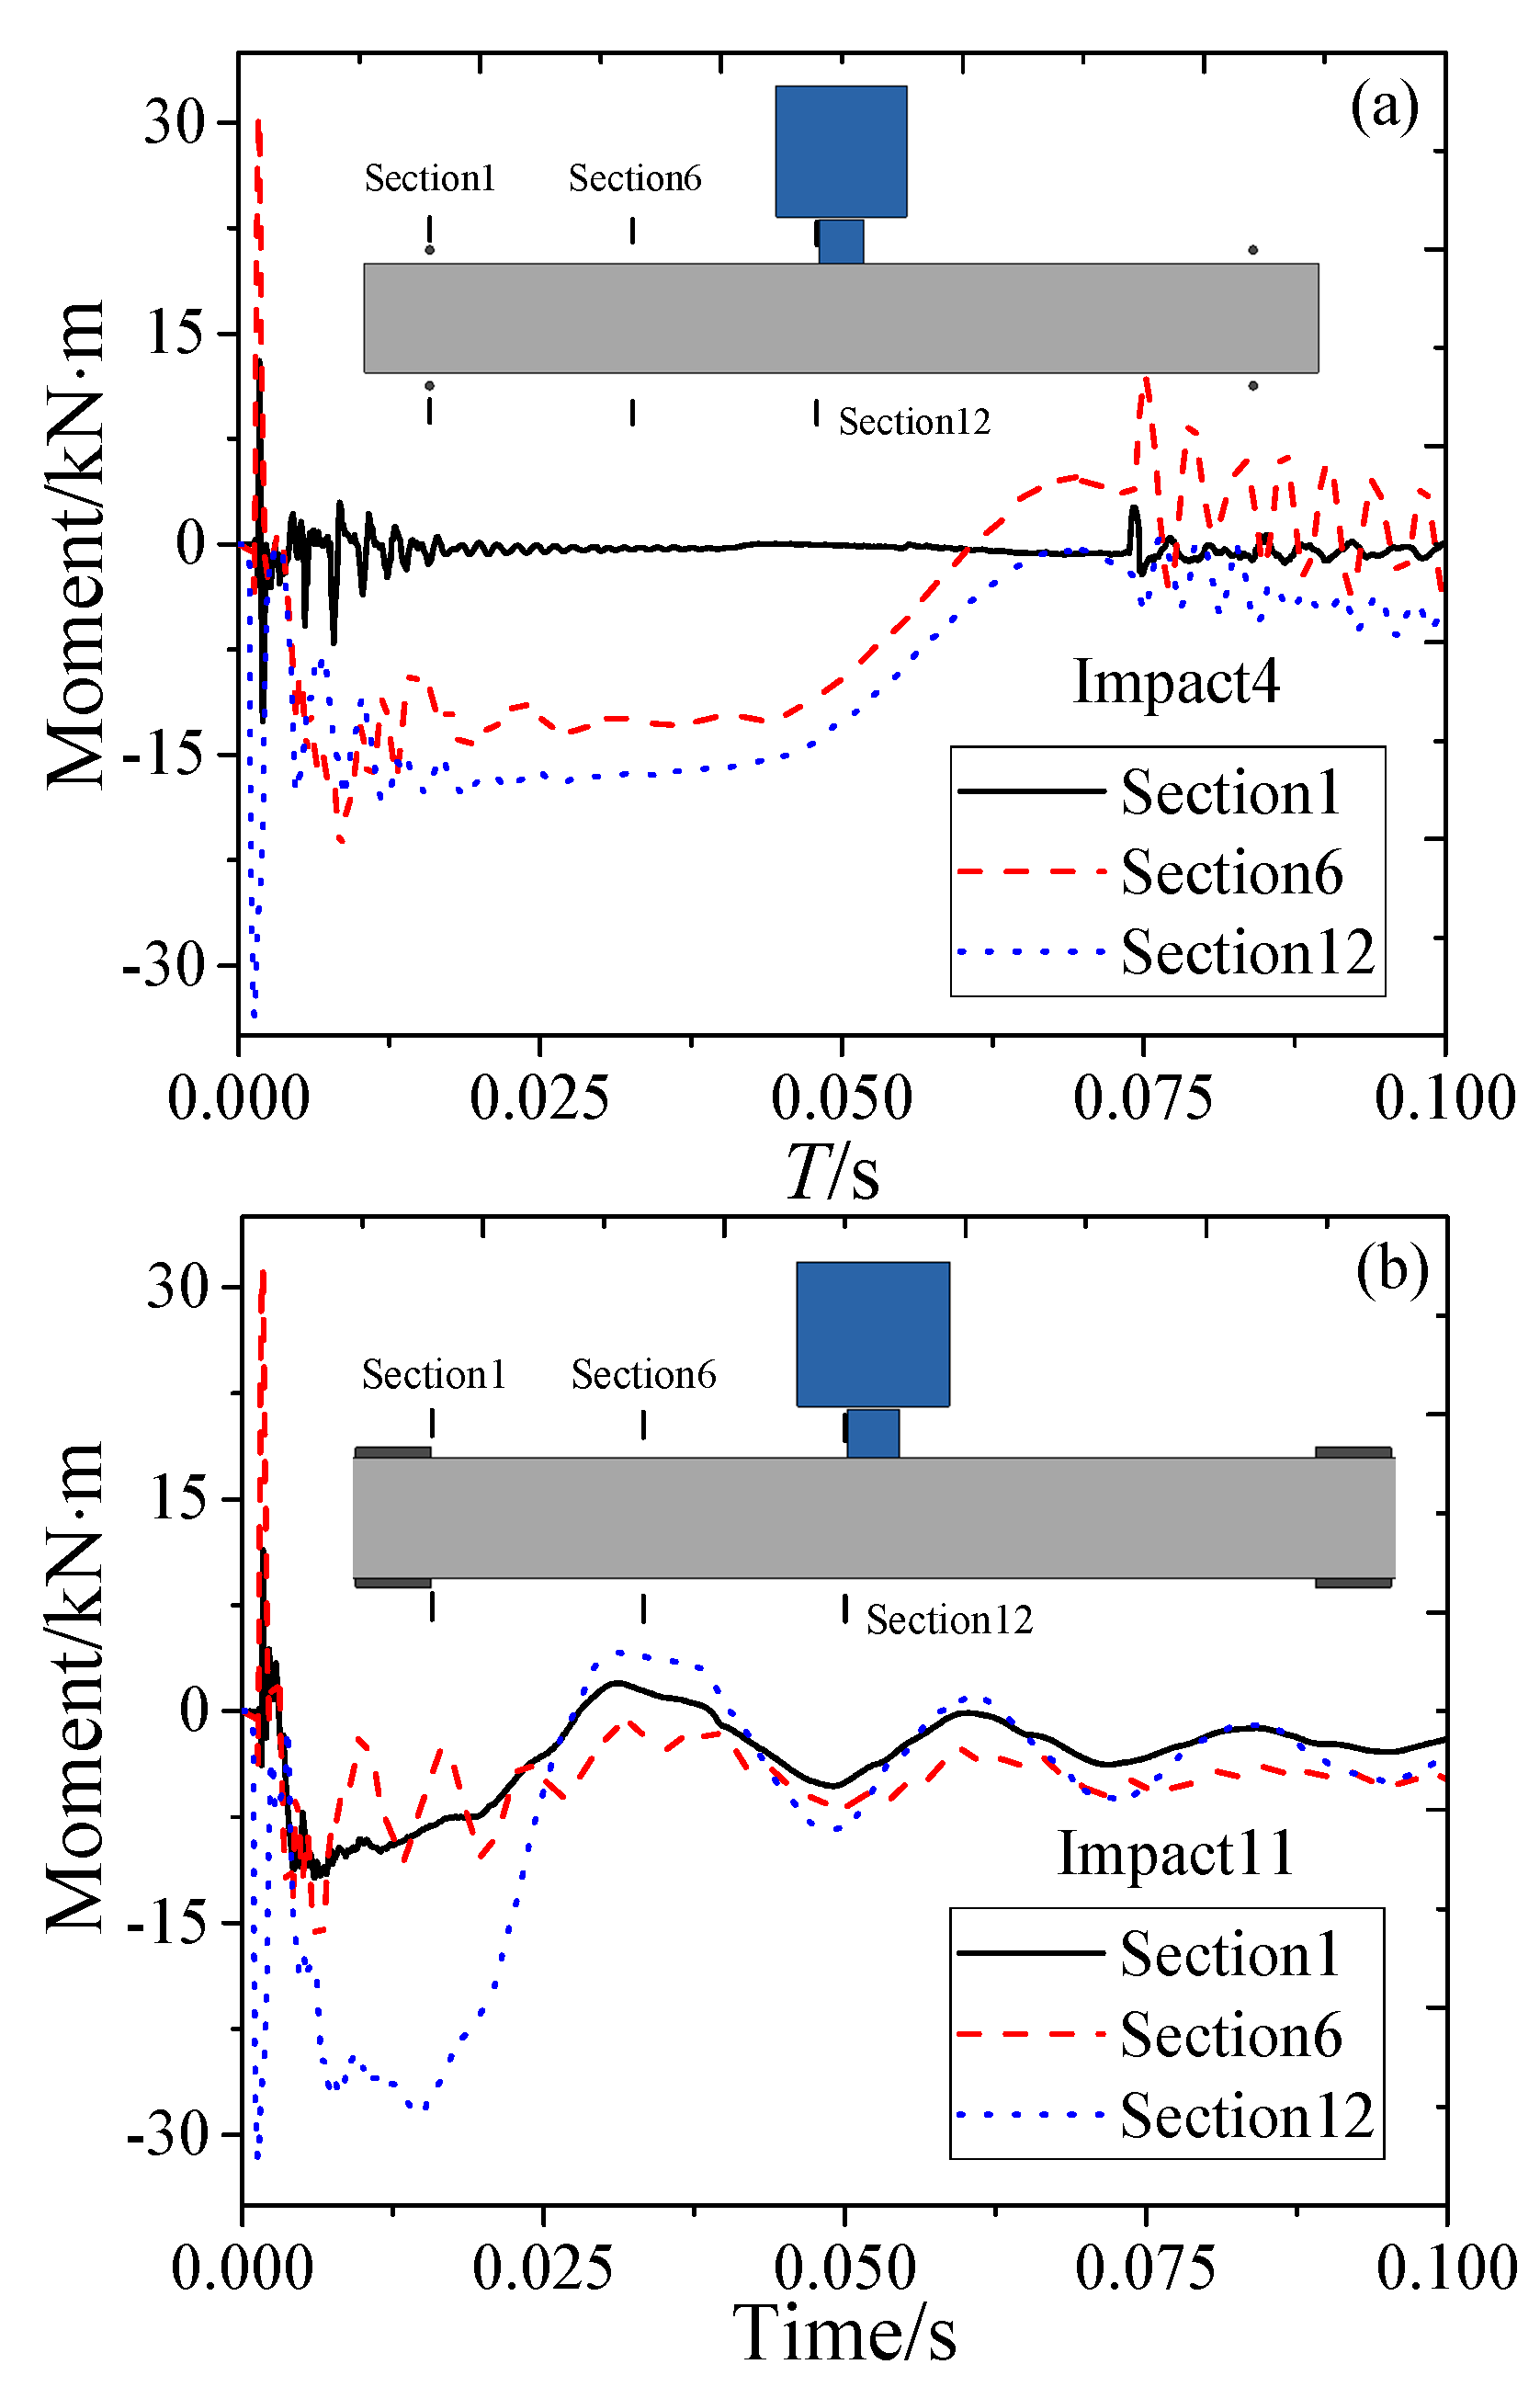
Figure 16 depicts the sectional bending moment time history curve of RC beams subjected to impact loading. The peak moment of each section of the beams with different boundaries does not change significantly. The peak bending moments at section 1, section 6, and section 12 of the RC beam with simply supported conditions are 13.0 kN·m, 30.6 kN·m, and −33.7 kN·m, respectively. The corresponding the bending moments of the RC beam with fixed- boundary conditions are 11.4 kN·m, 31.4 kN·m, and −31.9 kN·m. In addition, after the peak moment is over, the bending moments are obviously different due to the difference in the overall response of the beams. It is noteworthy that the time history curve of the cross-section of the fixed- boundary beam changes with a fixed period after 50 ms, and the period is similar to the free vibration period of the beam. This is because of the effect of the inertia caused by the freedom vibration.
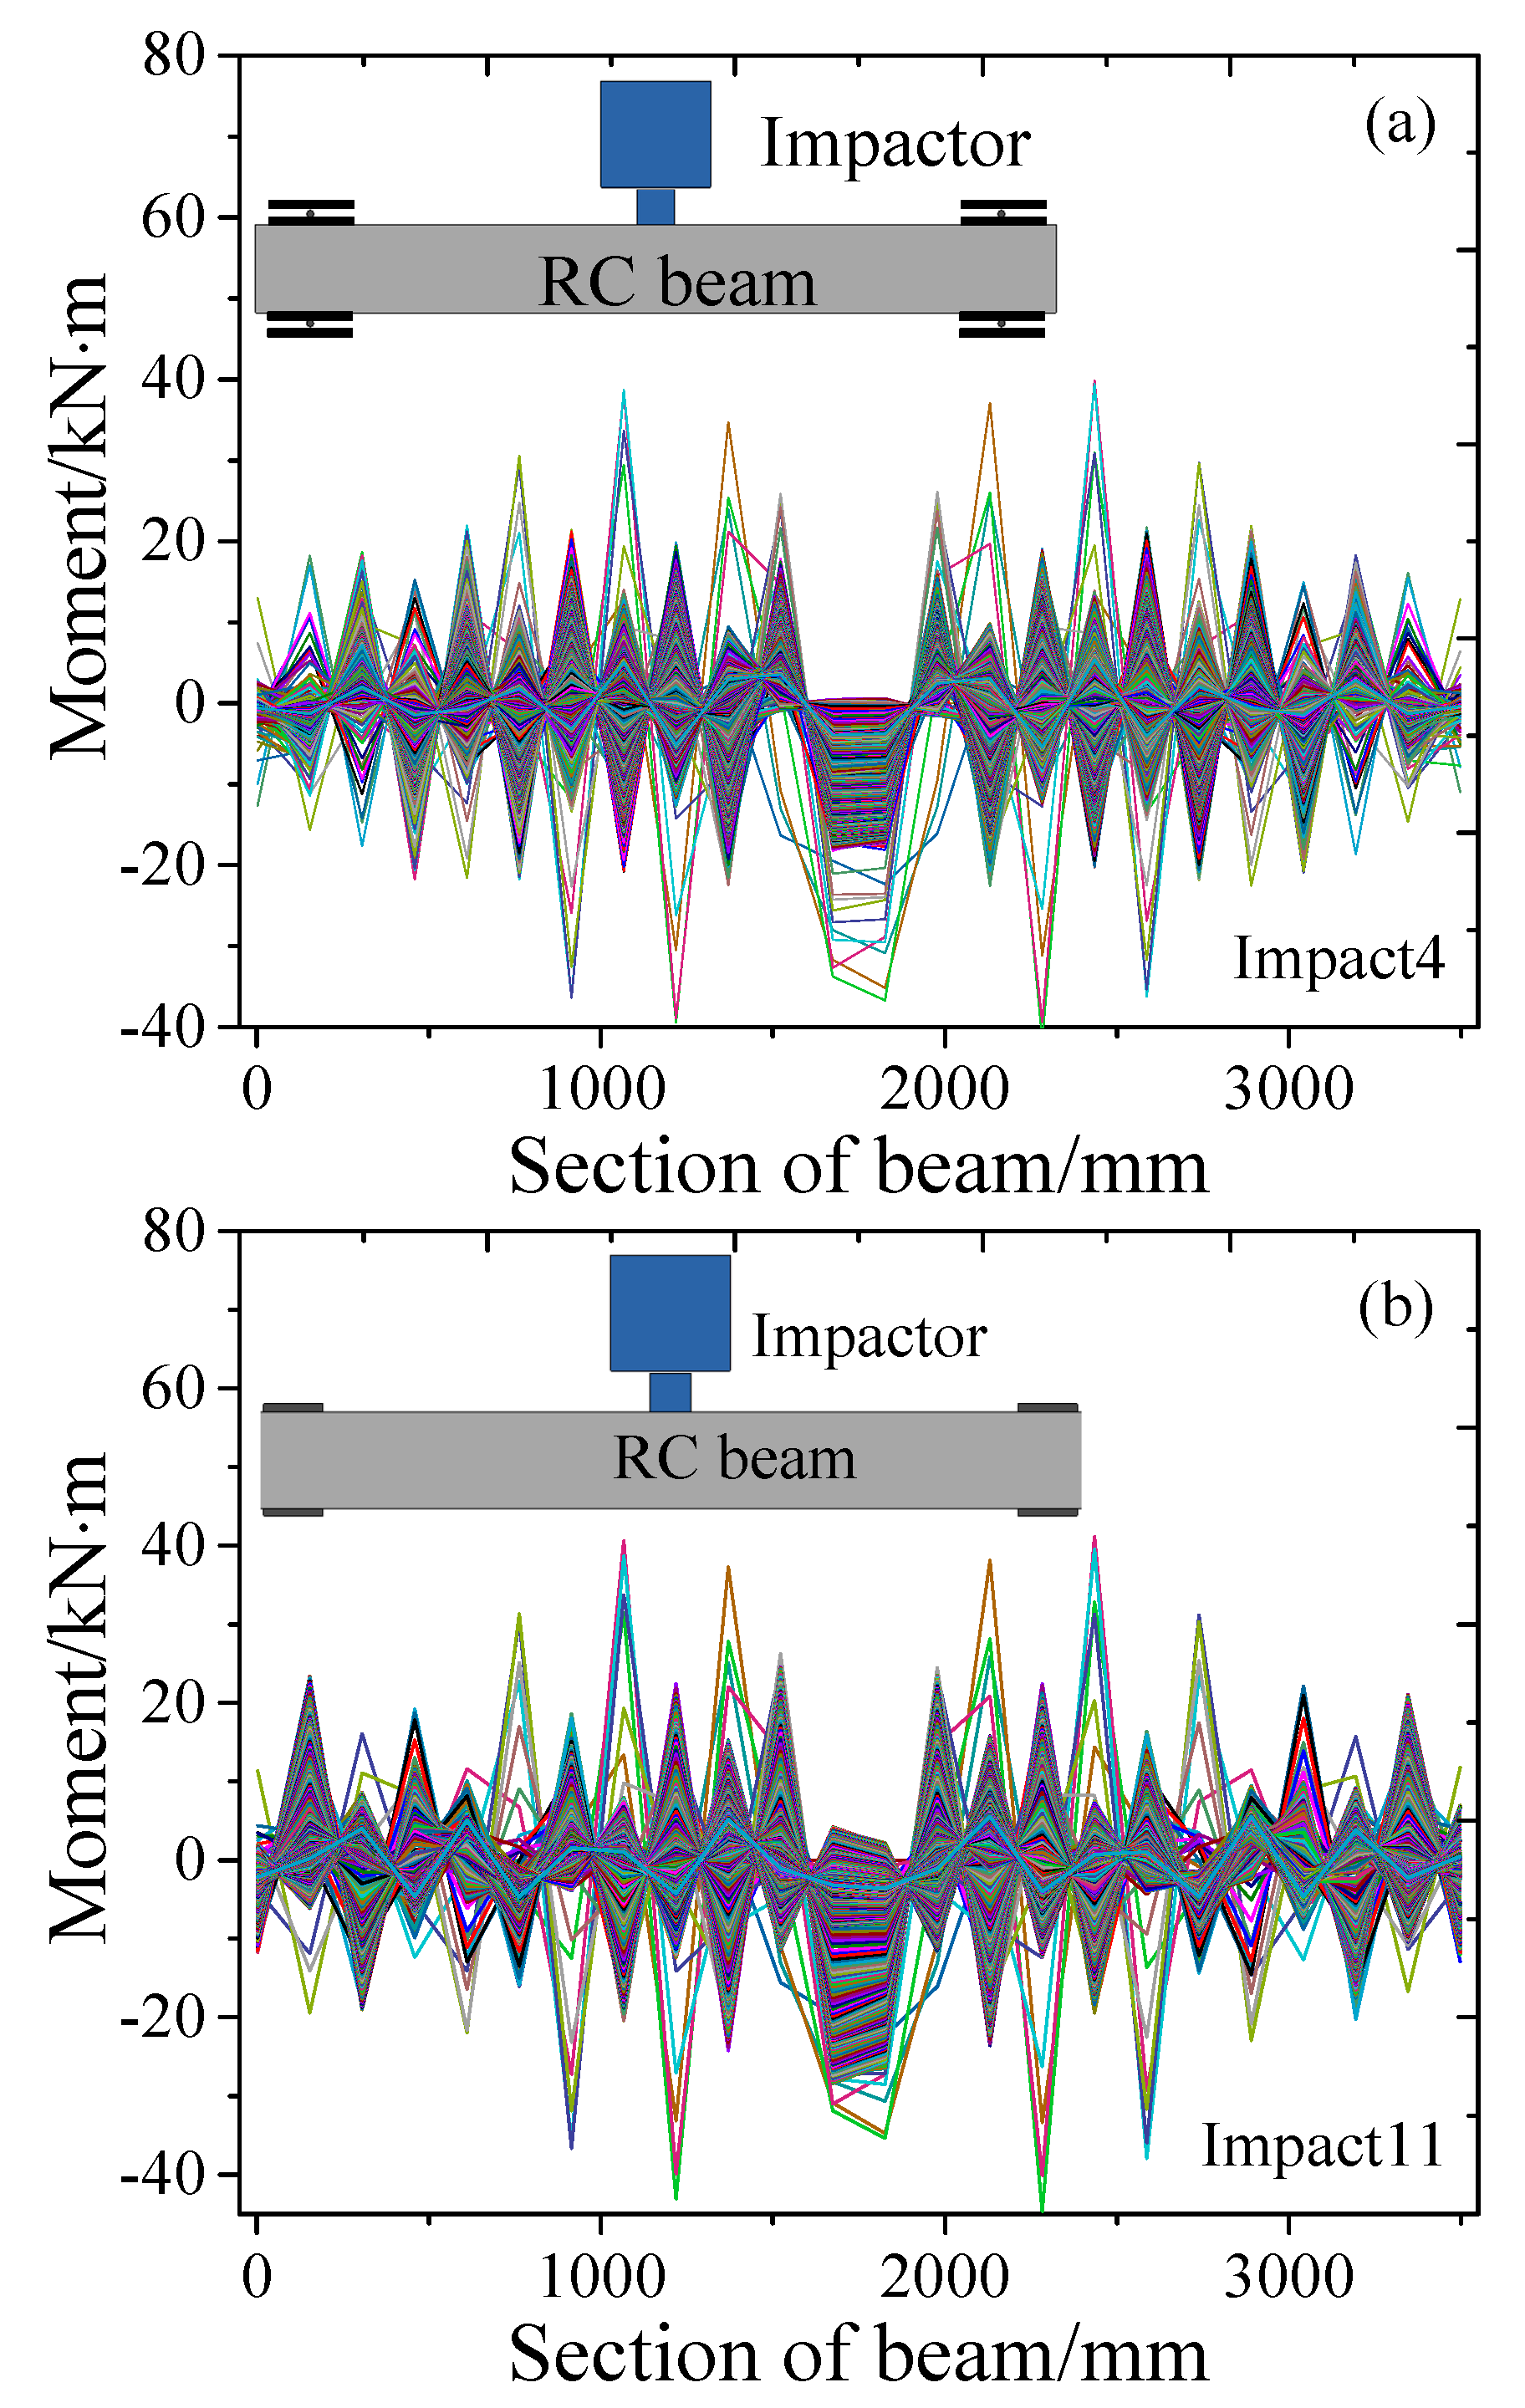
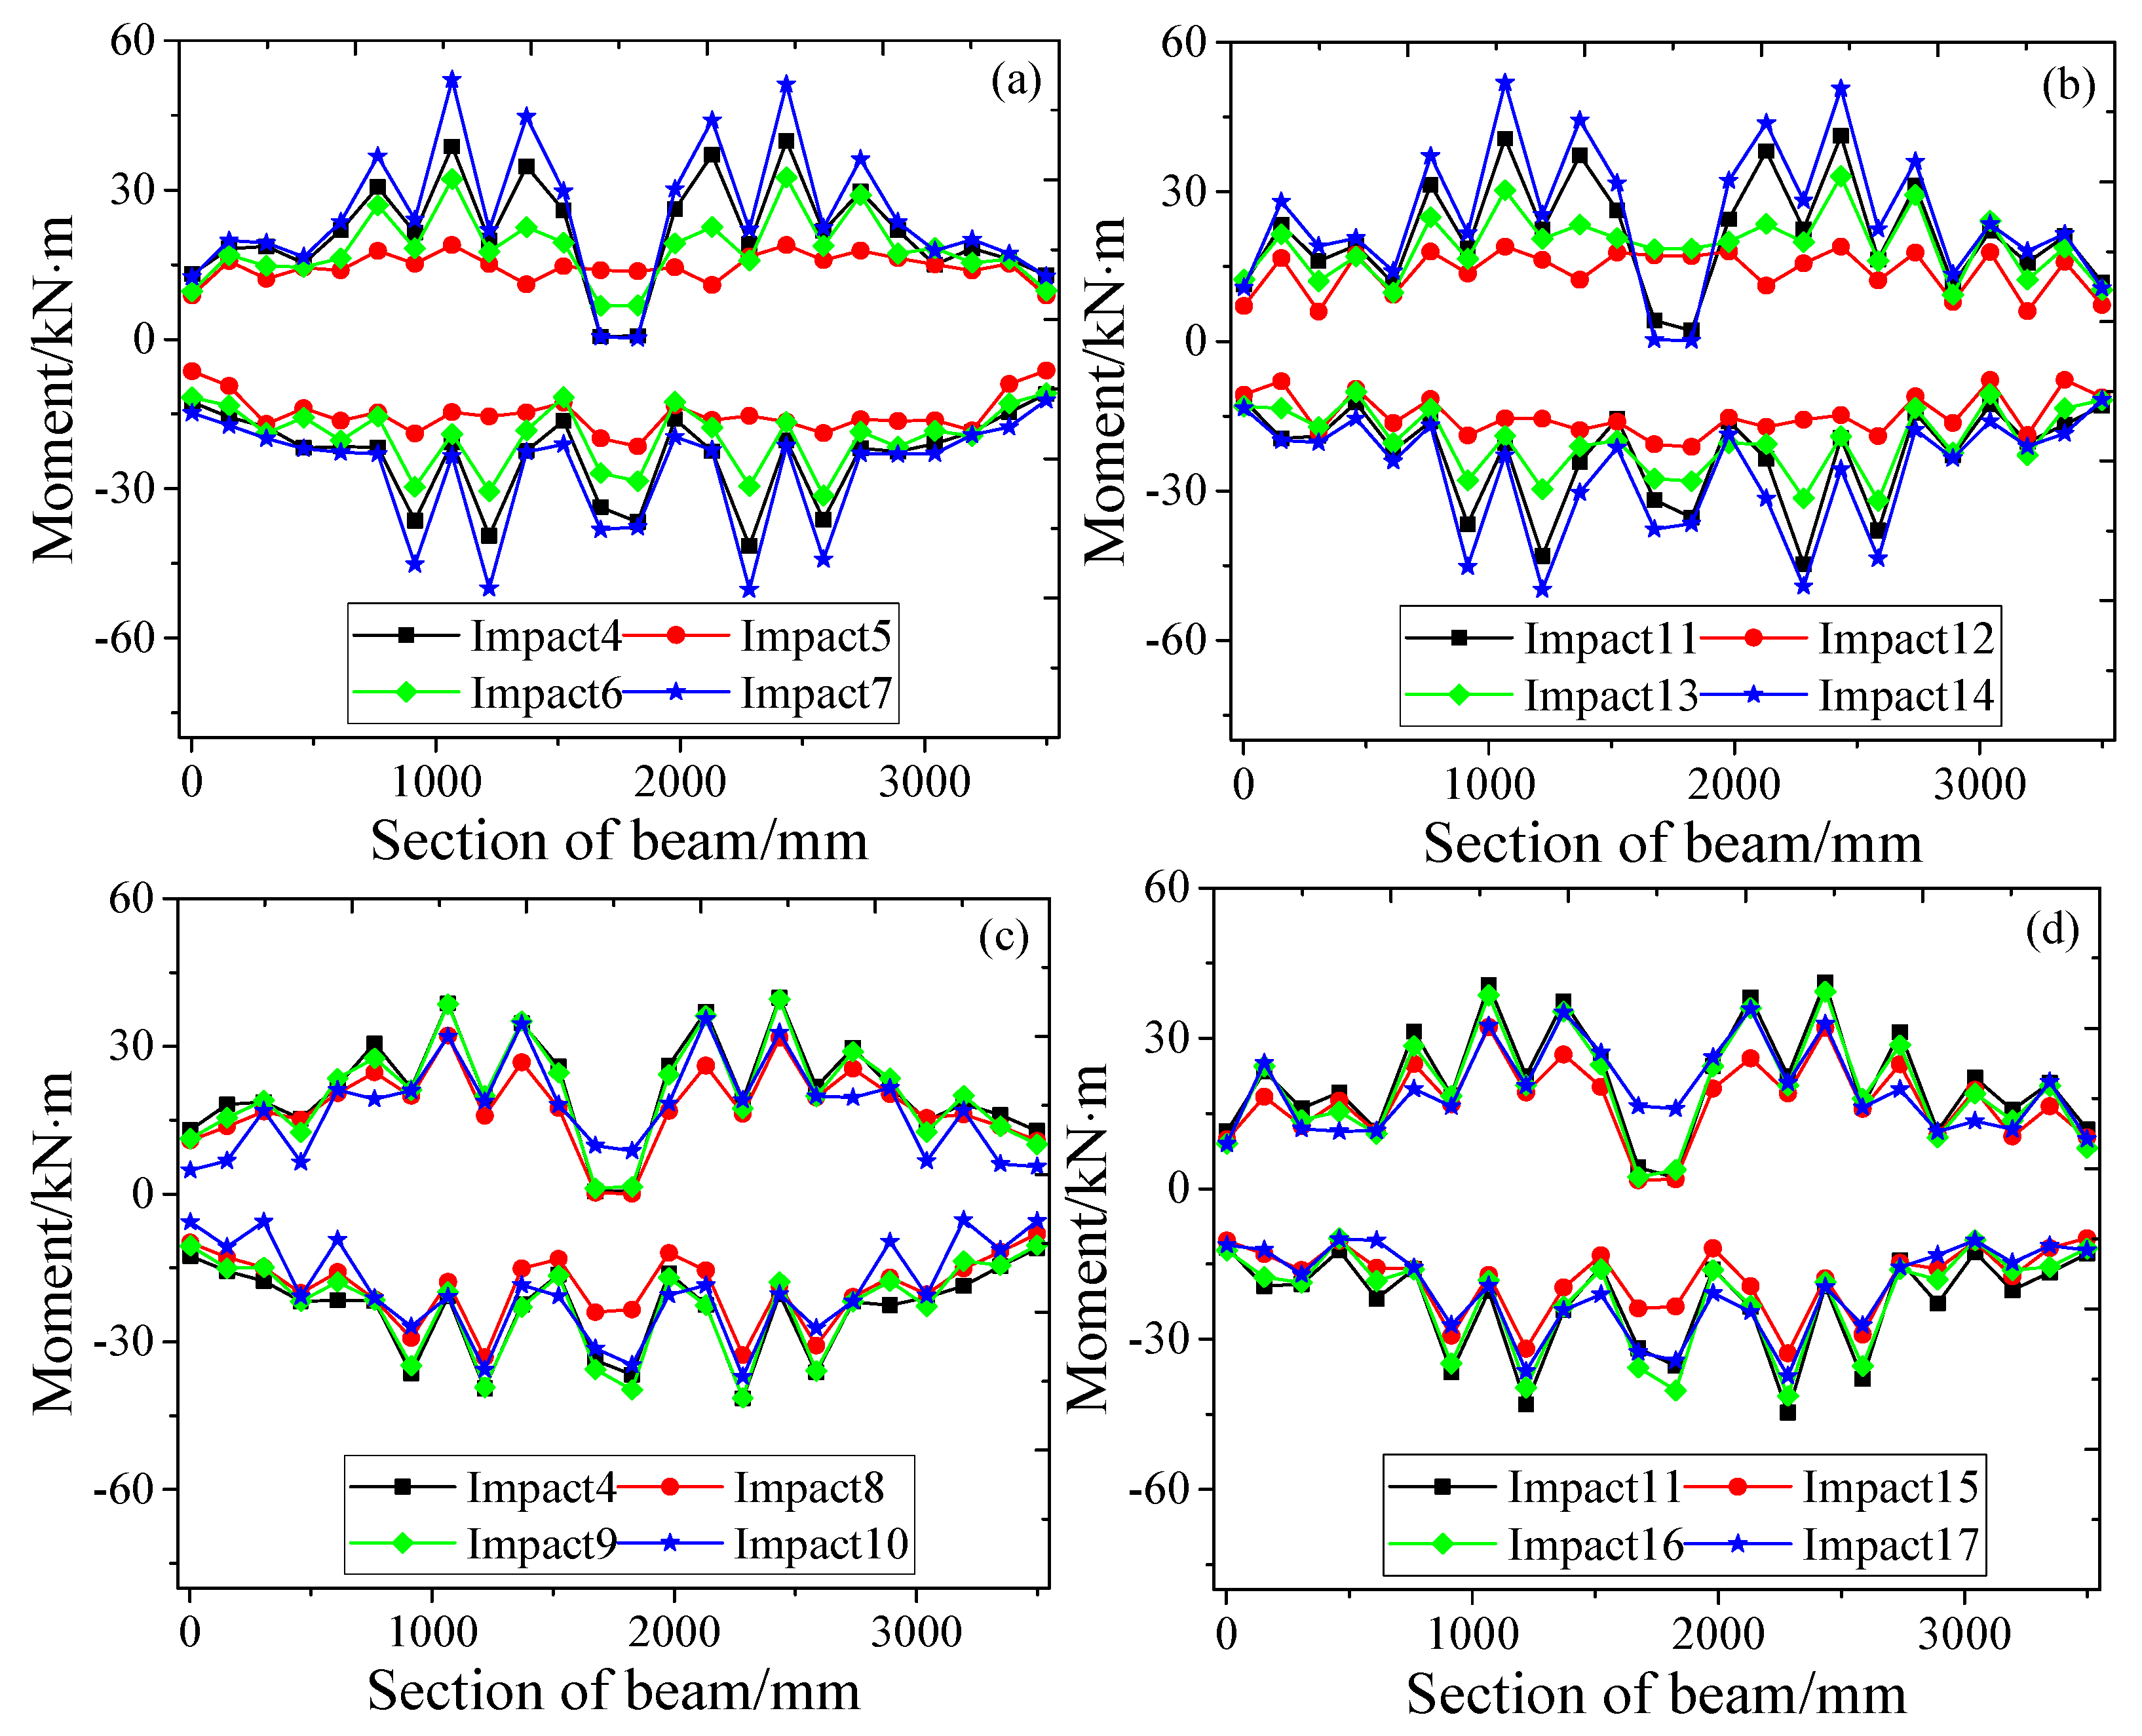
Figure 17 shows the moment response of the whole beam section under different boundary conditions. The graph reveals that the beam’s moment response under impact load aligns symmetrically with the centerline. High bending moments are formed in the mid-span region and on both sides of the impact zone; these high bending moments include both positive and negative moments, which are formed due to vibration. It is noteworthy that the bending moments along the length direction have no obvious effect on the boundary conditions under impact loads. The main reason is that the end plate and roller are not ideal; they are not in the simply supported conditions. To some extent, the end plate restricts the free rotation of the beam, so the bending moment effect also occurs at the end of the simply supported beam. Moreover, the peak bending moment is controlled by the impact force, as in the previous analysis. As shown in Figure 18a,b, except for the impact zone, the bending moment of the beam increases gradually as the impact energy increases. Increasing the concrete strength of the RC beams does not significantly affect the distribution trend of the bending moments, so the influence of the concrete strength on the moment distribution can be neglected, as shown in Figure 18c,d.

4. Conclusions

In this study, numerical impact models of RC beams are established, and the effects of the shear–span ratio, impact speed, concrete strength, and boundary conditions on the impact resistance are considered. The results are shown as follows:
(1)
Increasing the concrete strength decreases the damage degree of RC beams and changes the failure mode from bending–shear failure to bending failure under impact loading.
(2)
The boundary conditions of RC beams have no remarkable effect on the impact force of RC beams but have a noticeable effect on the peak displacement and residual displacement. The vibration period of fixed- boundary RC beams is significantly shorter than that of simply supported beams.
(3)
Under impact loads, the failure mode of the beams is subjected to a negative bending moment, and for fixed- boundary conditions, significant end shear leads to the formation of vertical cracks.
(4)
The bending moments of RC beams with simply supported and fixed- boundary conditions are similar, and the bending moment in the impact position is much greater than that in other areas.

Author Contributions

Conceptualization, J.L. and A.F. and G.Y.; methodology, G.Y. and M.W.; validation, J.L. and G.Y.; data curation, Z.K. and C.K.; writing—original draft preparation, J.L. and M.W.; writing—review and editing, G.Y., A.F., and C.K.; supervision, S.W., L.B., and Z.K.; project administration, G.Y. and L.B.; funding acquisition, J.L., S.W., and G.Y. All authors have read and agreed to the published version of the manuscript.

Funding

This paper is supported by the project of Hubei Key Laboratory of Basin Water Security, project number QTKS0034W2581, the Independent Innovation Research Program of Changjiang Survey, Planning, Design and Research Co., Ltd., project number CX2024Z01-9, CX2023Z02-4, the Key Project of the Science and Technology Research Program of the Hubei Provincial Department of Education, project number D20231504, and the Hunan Provincial Department of Education Fund, project number 23C0146.

Data Availability Statement

The datasets used and/or analyzed during the current study are available from the corresponding author on reasonable request.

Conflicts of Interest

Author Jianhe Li was employed by the company Changjiang Survey Planning Design and Research Co., Ltd. Author Lei Bu was employed by the company China Coal Technology & Engineering Group, Nanjing Design & Research Institute Co., Ltd. The remaining authors declare that the research was conducted in the absence of any commercial or financial relationships that could be construed as a potential conflict of interest.

References

  1. Wardhana, K.; Hadipriono, F. Analysis of recent bridge failures in the United States. J. Perform. Constr. Fac. 2003, 17, 144–150. [Google Scholar] [CrossRef]
  2. Harik, I.; Shaaban, A.; Gesund, H.; Valli, G.; Wang, S. United States Bridge Failures. J. Perform. Constr. Fac. 1990, 4, 272–277. [Google Scholar] [CrossRef]
  3. Pham, T.M.; Hao, H. Effect of the plastic hinge and boundary conditions on impact behavior of reinforced concrete beams. Int. J. Impact Eng. 2017, 102, 74–85. [Google Scholar] [CrossRef]
  4. Kishi, N.; Mikami, H.; Matsuoka, K.G. Impact behavior of shear failure type RC beams without shear rebar. Int. J. Impact Eng. 2002, 27, 955–968. [Google Scholar] [CrossRef]
  5. Kishi, N.; Mikami, H.; Ando, T. Impact resistant behavior of shear failure type RC beams under falling-weight impact loading. In Structures Under Shock and Impact VII; Jones, N., Brebbia, C.A., Rajendran, A.M., Eds.; WIT Press: Ashurst Lodge, UK, 2002; pp. 499–508. [Google Scholar]
  6. Mylrea, T.D. Effect of impact on reinforced concrete beams. ACI J. Proc. 1940, 36, 581–594. [Google Scholar] [CrossRef]
  7. Saatci, S.; Vecchio, F.J. Effects of shear mechanisms on impact behavior of rein-forced concrete beams. ACI Struct. J. 2009, 106, 78–86. [Google Scholar]
  8. Li, H.W.; Chen, W.S.; Hao, H. Influence of drop weight geometry and inter layer on impact behavior of RC beams. Int. J. Impact Eng. 2019, 131, 222–237. [Google Scholar] [CrossRef]
  9. Fan, W.; Liu, B.; Huang, X.; Sun, Y. Efficient modeling of flexural and shear behaviors in reinforced concrete beams and columns subjected to low-velocity impact loading. Eng. Struct. 2019, 195, 22–50. [Google Scholar] [CrossRef]
  10. Jones, N. Structural Impact; Cambridge University Press: Cambridge, UK, 2011. [Google Scholar]
  11. Banthia, N.; Mindess, S.; Bentur, A.; Pigeon, M. Impact testing of concrete using a drop-weight impact machine. Exp. Mech. 1989, 29, 63–69. [Google Scholar] [CrossRef]
  12. Pham, T.M.; Hao, H. Plastic hinges and intertia force in RC beams under impact loads. Int. J. Impact Eng. 2017, 103, 1–11. [Google Scholar] [CrossRef]
  13. Cotsovos, D.; Stathopoulos, N.; Zeris, C. Behavior of RC beams subjected to high rates of concentrated loading. J. Struct. Eng. 2008, 134, 1839–1851. [Google Scholar] [CrossRef]
  14. Cotsovos, D. A simplified approach for assessing the load carrying capacity of reinforced concrete beams under concentrated load applied at high rates. Int. J. Impact Eng. 2010, 37, 907–917. [Google Scholar] [CrossRef]
  15. Gholipour, G.; Zhang, C.W.; Mousavi, A.A. Effects of axial load on nonlinear response of RC columns subjected to lateral impact load: Ship-pier collision. Eng. Fail. Anal. 2018, 91, 397–418. [Google Scholar] [CrossRef]
  16. Issac, P.; Darby, D.; Ibell, T.; Evernden, M. experimental investigation into the force propagation velocity due to hard impacts on reinforced concrete members. Int. J. Impact Eng. 2017, 100, 131–138. [Google Scholar] [CrossRef]
  17. Do, T.V.; Pham, T.M.; Hao, H. Dynamic responses and failure modes of bridge columns under vehicle collision. Eng Struct. 2018, 156, 243–259. [Google Scholar] [CrossRef]
  18. Pham, T.M.; Hao, Y.F.; Hao, H. Sensitivity of impact behavior of RC beams to contact stiffness. Int. J. Impact Eng. 2018, 112, 155–164. [Google Scholar] [CrossRef]
  19. Han, L.H.; Hou, C.C.; Zhao, X.L.; Rasmussen, K.J.R. Behaviour of high-strength concrete filled steel tubes under transverse impact loading. J. Constr. Steel Res. 2014, 92, 25–39. [Google Scholar] [CrossRef]
  20. Kishi, N.; Khasraghy, S.G.; Kon-No, H. Numerical simulation of reinforced concrete beams under consecutive impact loading. ACI Struct. J. 2011, 108, 444–452. [Google Scholar] [CrossRef]
  21. Jiang, H.; Wang, X.; He, S.H. Numerical simulation of impact tests on reinforced concrete beams. Mater. Des. 2012, 39, 111–120. [Google Scholar] [CrossRef]
  22. Liao, W.Z.; Li, M.; Zhang, W.; Tian, Z.M. Experiment studies and numerical simulation of behavior of RC beams retrofitted with HSSWM-HPM under impact loading. Eng. Struct. 2017, 149, 131–146. [Google Scholar] [CrossRef]
  23. Liu, B.; Fan, W.; Guo, W.; Chen, B.; Liu, R. Experiment investigation and improved FE modeling of axially-loaded circular RC colums under lateral impact loading. Eng. Struct. 2017, 152, 619–642. [Google Scholar] [CrossRef]
  24. Aghdamy, S.; Thambiratnam, D.P.; Dhanasekar, M.; Saiedi, S. Effects of load-related parameters on the response of concrete-filled double-skin steel tube columns subjected to lateral impact. J. Constr. Steel Res. 2017, 138, 642–662. [Google Scholar] [CrossRef]
  25. Dogan, F.; Hadavinia, H.; Donchev, T.; Bhonge, P.S. Delamination of impacted composite structures by cohesive zone interface elements and tiebreak contact. Gentral Euro. J. Eng. 2012, 2, 612–626. [Google Scholar] [CrossRef]
  26. Sha, Y.; Hao, H. Laboratory tests and numerical simulations of barge impact on circular reinforced concrete piers. Eng. Struct. 2013, 46, 593–605. [Google Scholar] [CrossRef]
  27. Qian, K.; Weng, Y.H.; Li, B. Impact of two columns missing in dynamic response of RC flat slab structures. Eng. Struct. 2018, 177, 598–615. [Google Scholar] [CrossRef]
  28. Fan, W.; Xu, X.; Zhang, Z.Y.; Shao, X.D. Performance and sensitivity analysis of UHPFRC-strengthened bridge columns subjected to vehicle collisions. Eng. Struct. 2018, 173, 251–268. [Google Scholar] [CrossRef]
  29. Murray, Y.D.; Abu-Odeh, R.; Bligh, A. Evaluation of LS-DYNA concrete material model 159. In Report No. FHWA-HRT-05-063; Federal Highway Administration: Mclean, VA, USA, 2007. [Google Scholar]
  30. Meng, Y. Experiment and Numerical Simulation Study on Reinforced Concrete Beam Under Impact Loading; Hunan University: Changsha, China, 2012. [Google Scholar]
  31. Mosallam, A.; Elsanadedy, H.M.; Almusallam, T.H. Structural evaluation of reinforced concrete beams strengthened with innovative bolted/bonded advanced FRP composites sandwich panels. Compos. Struct. 2015, 124, 421–440. [Google Scholar] [CrossRef]
  32. Hao, H.; Hao, Y.; Li, J.; Chen, W. Review of the current practices in blast-resistant analysis and design of concrete structrures. Adv. Struct. Eng. 2016, 19, 1193–1223. [Google Scholar] [CrossRef]
  33. Malvar, L.J.; Ross, C.A. Review of strain rate effects for concrete in tension. ACI Mater. J. 1998, 95, 735–739. [Google Scholar] [CrossRef]
  34. Hao, Y.; Hao, H. Numerical evaluation of the influence of aggregates on concrete compressive strength at high strain rate. Int. J. Prot. Struct. 2011, 2, 177–206. [Google Scholar] [CrossRef]
  35. Hao, Y.; Hao, H.; Jiang, G.P.; Zhou, Y. Experimental confirmation of some factors influencing dynamic concrete compressive strength in high-speed impact tests. Cement Concr. Res. 2013, 52, 63–70. [Google Scholar] [CrossRef]
  36. Chen, W.; Hao, H.; Chen, S. Numerical analysis of prestressed reinforced concrete beam subjected to blast loading. Mater. Des. 2015, 65, 662–674. [Google Scholar] [CrossRef]
  37. Hao, Y.; Hao, H. Influence of the concrete DIF model on the numerical predictions of RC wall responses to blast loadings. Eng. Struct. 2014, 73, 24–38. [Google Scholar] [CrossRef]
  38. Comite Euro-International du Beton. CEB-FIB Model Code 1990; Redwood Book: Trowbridge, Wiltshire, UK, 1993. [Google Scholar]
  39. Malvar, L.J. Review of static and dynamic properties of steel reinforcing bars. ACI Mater. J. 1998, 95, 609–614. [Google Scholar] [CrossRef] [PubMed]
  40. Ditommaso, R.; Ponzo, F.C. Identifying Damage in Structures: Definition of Thresholds to Minimize False Alarms in SHM Systems. Buildings 2024, 14, 821. [Google Scholar] [CrossRef]
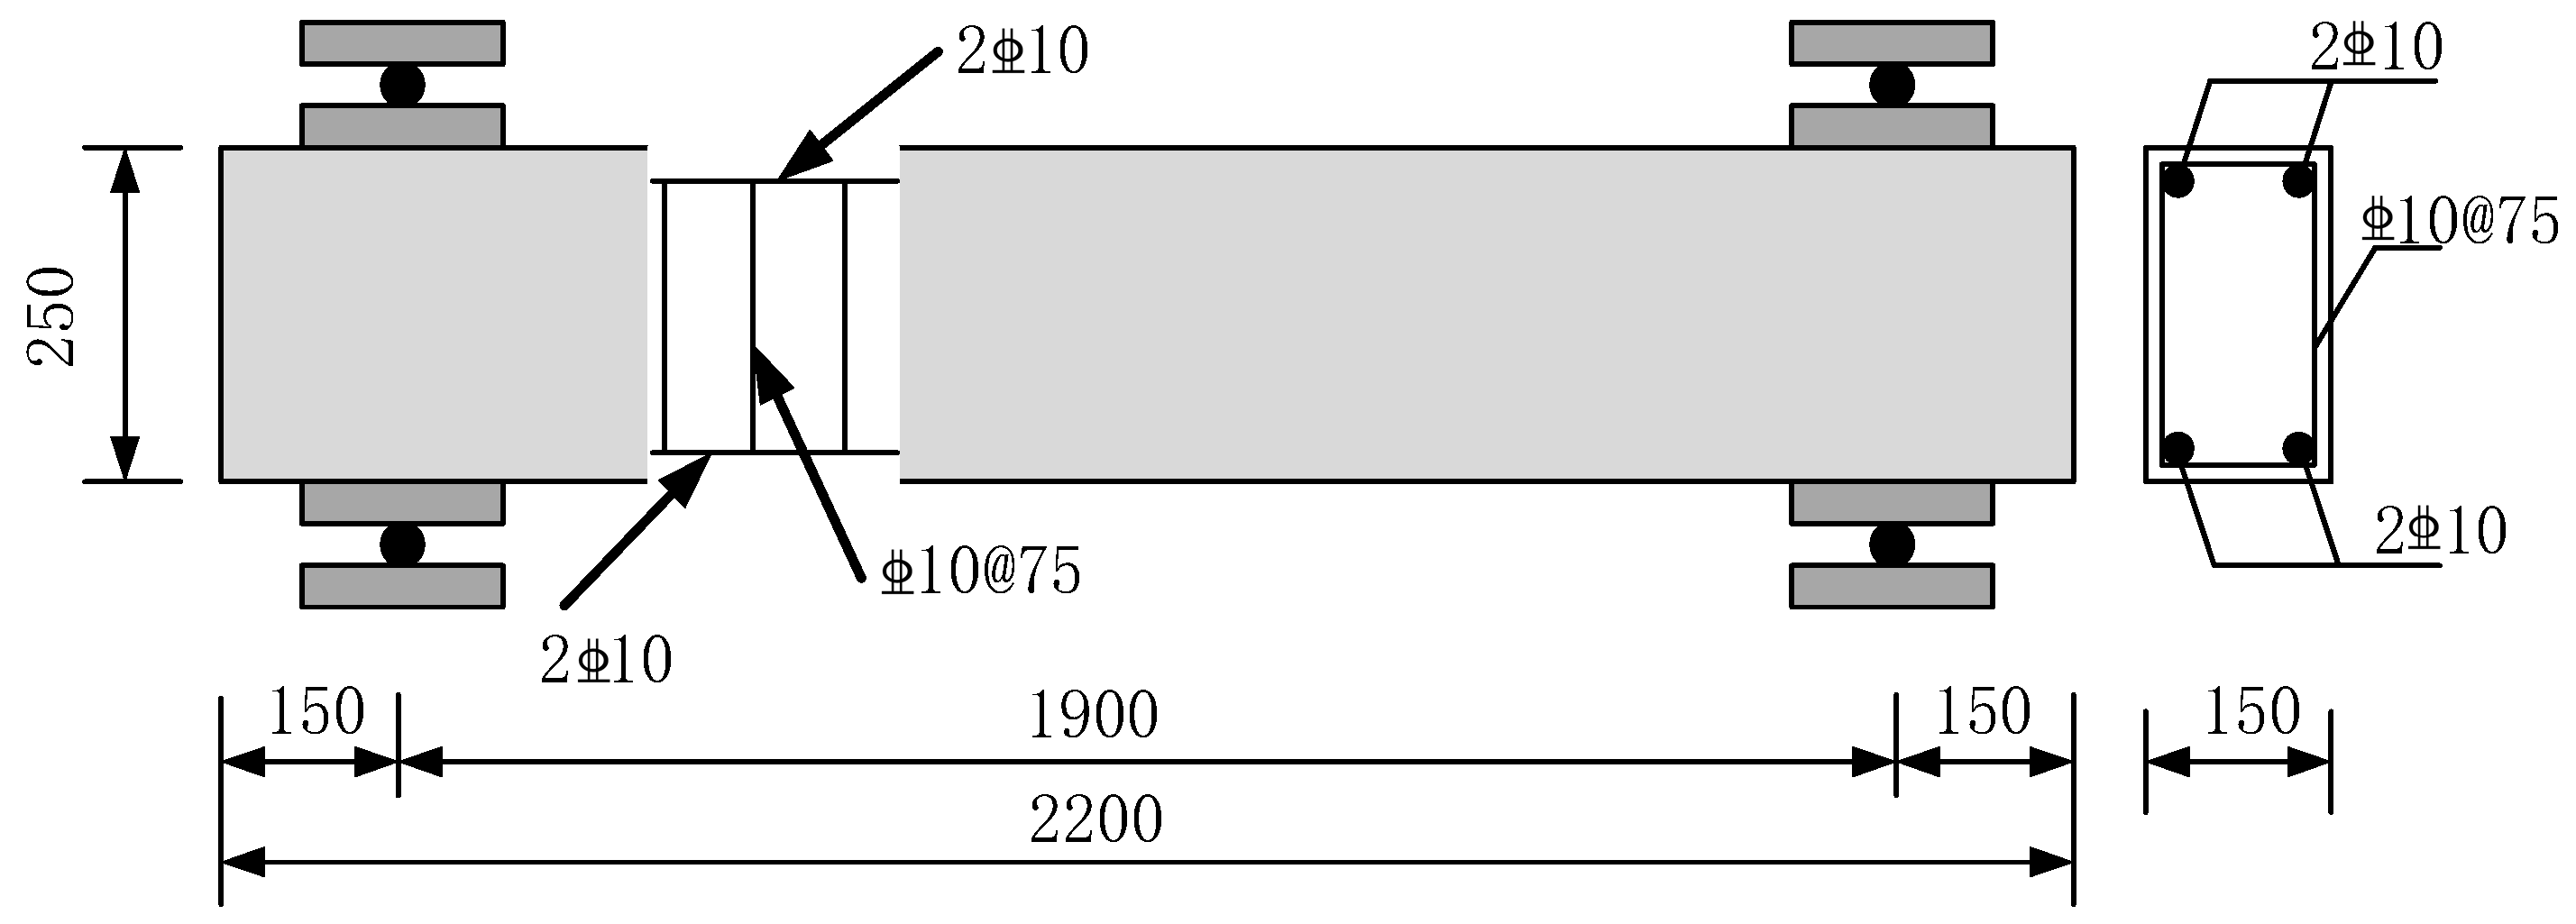
Figure 1. Specific size and reinforcement of Beam 2.
Buildings 15 03250 g001
Figure 2. Detailed drawing of finite element model of RC beam.
Buildings 15 03250 g002
Figure 3. General shape of the concrete model yield surface in two dimensions [30].
Buildings 15 03250 g003
Figure 4. Shape of two-part isotropic hardening cap.
Buildings 15 03250 g004
Figure 5. Plastic strain of simulation and failure model of experiment.
Buildings 15 03250 g005
Figure 6. Comparison between the results of simulation and experiment: (a) impact force; (b) displacement.
Buildings 15 03250 g006
Figure 7. Plastic strain of beams with different shear–span ratios.
Buildings 15 03250 g007
Figure 8. Plastic strain of beams with different impact velocities.
Buildings 15 03250 g008
Figure 9. Plastic strain of beams with different concrete strengths.
Buildings 15 03250 g009
Figure 10. The time history curve of the impact force and mid-span displacement of beams with different boundary conditions: (a) impact force; (b) displacement.
Buildings 15 03250 g010
Figure 11. Impact force time history curve of simply supported beam: (a) the effect of different spans; (b) the effect of different impact energies, and (c) the effect of different concrete strengths.
Buildings 15 03250 g011
Figure 12. Time history curve of beam mid-span displacement: (a) the effect of different spans under simply supported conditions; (b) the effect of different impact energies under simply supported conditions; (c) the effect of different concrete strengths under simply supported conditions, and (d) the effect of different impact energies under fixed-boundary conditions.
Buildings 15 03250 g012
Figure 13. Shear force time history curve of beam sections: (a) RC beam with simply supported conditions, and (b) RC beam with fixed-boundary conditions.
Buildings 15 03250 g013
Figure 14. (a) The shear force response of the beam under impact 4; (b) the shear force response of the beam under impact 11.
Buildings 15 03250 g014
Figure 15. The envelope curve of shear force: (a) the effect of different impact energies under simply supported conditions, (b) the effect of different impact energies under fixed-boundary conditions, (c) the effect of different concrete strengths under simply supported conditions, and (d) the effect of different concrete strengths under fixed-boundary conditions.
Buildings 15 03250 g015
Figure 16. Time history curve of RC beam sections: (a) RC beam with simply supported conditions and (b) RC beam with fixed-boundary conditions.
Buildings 15 03250 g016
Figure 17. The moment response of the beam section along the length direction: (a) impact 4 and (b) impact 11.
Buildings 15 03250 g017
Figure 18. The envelope curve of the bending moment: (a) the effect of different impact energies under simply supported conditions, (b) the effect of different impact energies under fixed-boundary conditions, (c) the effect of different concrete strengths under simply supported conditions, and (d) the effect of different concrete strengths under fixed-boundary conditions.
Buildings 15 03250 g018
Table 1. Design case of impact beam specimens.
SimulationClear Span (mm)Impact
Velocity (mm/s)
Boundary ConditionConcrete Strength
(MPa)
Shear–Span Ratio
Impact 119006260Simply supported524.4
Impact 225006260Simply supported525.8
Impact 330006260Simply supported527.0
Impact 435006260Simply supported528.1
Impact 535002000Simply supported528.1
Impact 635004000Simply supported528.1
Impact 735009000Simply supported528.1
Impact 835006260Simply supported308.1
Impact 935006260Simply supported708.1
Impact 1035006260Simply supported908.1
Impact 1135006260Fixed end528.1
Impact 1235002000Fixed end528.1
Impact 1335004000Fixed end528.1
Impact 1435009000Fixed end528.1
Impact 1535006260Fixed end308.1
Impact 1635006260Fixed end708.1
Impact 1735006260Fixed end908.1
Note: shear–span ratio is the ratio of the half clear span to the effective depth, which is 215 mm in this work.
Table 2. User-specified properties of *MAT_CSCM.
MidRoNplotIncreIrateErodeRecoverIretrac
1592.4 × 10−910.00011.10.0000
pred
0.0
gkalphathetalambdabetanalphacalpha
301515.90.3810.51.929 × 10−20.00.0
alpha1theta1lambda1beta1alpha2theta2lambda2beta2
0.747354.25 × 10−40.170.0360.664.61 × 10−40.160.032
The unit system is MPa, mm, seconds, ton per mm3, and N.
Table 3. Parameters of models.
MaterialMaterial ModelParameterValue
Concrete*MAT_159
(Mat_CSCM_CONCRETE)
Density2400 kg/m3
Compressive strength52 MPa
Poisson’s ratio0.2
Steel reinforcement*MAT_024
(MAT_PIECEWISE_LINEAR_PLASTICITY)
Density7800 kg/m3
Elastic modulus200 GPa
Yield strength550 MPa
Poisson’s ratio0.3
Failure strain0.15
Steel impactor,
steel block,
steel plates,
and steel rollers
*MAT_001(ELASTIC)Density7800 kg/m3
Elastic modulus200 GPa
Poisson’s ratio0.3
Disclaimer/Publisher’s Note: The statements, opinions and data contained in all publications are solely those of the individual author(s) and contributor(s) and not of MDPI and/or the editor(s). MDPI and/or the editor(s) disclaim responsibility for any injury to people or property resulting from any ideas, methods, instructions or products referred to in the content.