Article

Integrated Hydrogen in Buildings: Energy Performance Comparisons of Green Hydrogen Solutions in the Built Environment

1
Department of Architecture, Engineering, and Technology, Delft University of Technology, Mekelweg 5, 2628 CD Delft, The Netherlands
2
MNEXT, Avans University of Applied Sciences, Building LD, Lovensdijkstraat 63, 4818 AJ Breda, and HZ University of Applied Sciences, Het Groene Woud 1, 4331 NB Middelburg, The Netherlands; Tel.: +31-(0)-6-24969861
*
Author to whom correspondence should be addressed.
Buildings 2025, 15(17), 3232; https://doi.org/10.3390/buildings15173232
Submission received: 20 March 2025 / Revised: 12 May 2025 / Accepted: 16 May 2025 / Published: 8 September 2025
(This article belongs to the Special Issue Potential Use of Green Hydrogen in the Built Environment)

Abstract

This study investigates the integration of green hydrogen into building energy systems using local solar power, with the electricity grid serving as a backup plan. A comprehensive bottom-up analysis compares six energy system configurations: the natural gas grid boiler system, all-electric heat pump system, natural gas and hydrogen blended system, hydrogen microgrid boiler system, cogeneration hydrogen fuel cell system, and hybrid hydrogen heat pump system. Energy efficiency evaluations were conducted for 25 homes within one block in a neighborhood across five typological house stocks located in Stoke-on-Trent, UK. This research was modeled using a spreadsheet-based approach. The results highlight that while the all-electric heat pump system still demonstrates the highest energy efficiency with the lowest consumption, the hybrid hydrogen heat pump system emerges as the most efficient hydrogen-based solution. Further optimization, through the implementation of a peak-shaving strategy, shows promise in enhancing system performance. In this approach, hybrid hydrogen serves as a heating source during peak demand hours (evenings and cold seasons), complemented by a solar energy powered heat pump during summer and daytime. An hourly operational configuration is recommended to ensure consistent performance and sustainability. This study focuses on energy performance, excluding cost-effectiveness analysis. Therefore, the cost of the energy is not taken into consideration, requiring further development for future research in these areas.

1. Introduction

1.1. Background and Motivations

Renewable energy in the United Kingdom has grown by ten times since 2004, demonstrating significant progress toward its target of renewable energy contributing 42.8% to the nation’s total electricity generation. The United Kingdom is committed to reducing national greenhouse gas emissions by at least 68% by 2030 [1]. However, 85% of homes and 40% of the electricity used across the nation still rely on gas [2]. To meet its Net Zero commitments, the UK government introduced the Net Zero Strategy in 2021, outlining a transition toward low-carbon technologies, including hydrogen [3]. Natural gas combustion produces around 117 pounds of CO2 per Million British Thermal Units (MMBtu), while coal and diesel fuel oil create more than 200 and 160 pounds CO2 per MMBtu, compared to more than 200 for coal and 160 for diesel. Methane, a potent greenhouse gas, is also released across the natural gas value chain [4,5].
Solar energy, despite its growth, suffers from a mismatch between supply and demand—excess generation in summer and shortfalls in winter. This imbalance threatens grid stability and calls for long-term energy storage solutions. Hydrogen has emerged as a promising candidate to address this challenge, offering seasonal storage potential and grid backup during peak demand.
Hydrogen is currently used primarily in industrial sectors such as high-temperature processes, shipping, and large-scale electricity storage [6]. Its role in residential heating, however, remains debated. A study from Fraunhover IEE mentions that hydrogen is not a viable option when it comes to heating buildings [7]. David Cebon similarly noted that heating hydrogen would require 5 to 6 times more renewable electricity than a highly efficient heat pump [8]. On the contrary, other studies also describe how injecting hydrogen into buildings is possible; hydrogen could be blended into existing system natural gas networks, including a direct use of boilers and fuel cells [9], while pilot initiatives, such as by Northern Gas Networks near Gateshead in the UK, have successfully demonstrated the transitional steps of running exclusively on hydrogen [10].
Despite these developments, multiple studies have highlighted significant challenges in using hydrogen for building heating. Cost is a major barrier, particularly when hydrogen is produced from methane (grey hydrogen), which also results in high CO2 emissions [11]. Moreover, distribution infrastructure for hydrogen remains underdeveloped and would require major investment [12]. Jan Rosenow further emphasized that hydrogen should be reserved for sectors that are difficult to electrify, given the existence of more efficient and lower-carbon options like heat pumps.
Hydrogen presents several advantages for building energy systems, including its ability to store renewable energy seasonally, compatibility with existing gas infrastructure (in blends), and zero on-site emissions when used in fuel cells or boilers. However, these benefits are offset by critical drawbacks: hydrogen production is often energy-intensive and expensive, especially when derived from fossil fuels; distribution infrastructure is not yet widespread; and overall system efficiency is generally lower than alternatives like electric heat pumps. These trade-offs highlight the need for comparative studies to evaluate the actual performance and feasibility of hydrogen-based systems in residential settings.
In summary, although hydrogen offers strong potential for long-term energy storage and decarbonization, particularly when produced from renewable sources, its use in the building sector is still debated due to concerns about efficiency, cost, and system complexity. This study aims to compare the energy performance of hydrogen-based systems with conventional solutions such as electric heat pumps and natural gas boilers. Focusing on residential building typologies in the UK, the goal is to evaluate which systems offer the most energy-efficient and practical pathways for sustainable heating in the built environment.

1.2. Theoretical Frameworks

The need for improving energy efficiency is crucial in energy performance criteria. Calculated energy needs can be converted into primary energy by applying the relevant primary energy factors. These factors were responsible for any system losses and inefficiencies caused by energy systems utilized in buildings [13]. Total energy consumption is calculated for heating, hot tap water, ventilators, lighting, and cooling [14]. Ir. M. Kuijpers Van Gaalen described the energy used for heating is determined by the following aspects:
  • The demand for heating in a house. The amount of heat to keep the temperature at the required level;
  • The efficiency of the system. This represents the energy losses that occur between the demand side (the amount of heat required in a room) and the generating side of the distribution system;
  • Building construction material including the heat transport mechanism; insulation material, heat transport through conduction, radiation, and convection. Solar gain and infiltration.
Net heat demand is the difference between the amount of heat lost via transmission and ventilation and the amount of heat generated by the sun and human and mechanical sources [14]. A system will achieve thermal equilibrium if the sum of all heat transfers is sufficient to cause the desired change in temperature. The energy performance assessment in this study is grounded in the principle of thermal equilibrium, which governs the balance between energy supply and demand buildings.
Q out = Q in
Q out   = Q transmission   + Q ventilation + Q infiltration   Q in   = Q solar   + Q internal  
Q 0 = Q transmission   + Q ventilation + Q infiltration   Q solar   Q internal  
where Q 0 is a heat balance; Q infiltration is heat flow of infiltration, through uncontrolled air leakage losses; Q solar is a heat flow of solar load; Q internal is the internal heating in the buildings; and Q transmission is a heat loss through transmission occurs through physical layers of the buildings; the outer walls and roofs, windows, doors and glazing, and via the floor at ground [14]. The heat accumulated within the material construction processed to the temperature progression, adapting with the new situation depending on the mass of the construction. All materials are taken into consideration, including building insulations within the material layers. This is beneficial when accompanied by favorable U-values since it enhances and functions as a thermal bridge, which will slow down the heat transfer.
Q transmission   = U · A · Δ T
U = 1 R
Defined with Q transmission   is the heat flow of transmission; U is U-Value of the window glazing; A is the total area of a transmission; Δ T is the temperature difference between the high and the low temperature [15]. The indoor temperature is assumed to be constant at 20 °C throughout the year, in line with typical comfort standards. However, the outdoor temperature varies hourly and is obtained from a weather dataset representing Stoke-on-Trent’s climate conditions. Heat loss through ventilation and infiltration is the total amount of energy consumption that is required to heat air supplied from the outside up to the temperature in the room. The equation of Q infiltration is simplified as follows:
Q infiltration   =   ρ · C p · n · V 3600 · Δ T
This includes air that finds the way out via cracks and gaps, or even ventilation systems caused by the occupants opening doors and windows [14]. In this research, the ventilation uses heat recovery, as the homes will be renovated whether in light or ambitious renovation.
Where the rate of airflow is defined as follows:
m   =   ρ · n · V 3600
The equation for Q ventilation with heat recovery is followed.
Q ventilation = ( 1 η ) · m v e n t ·   C p · Δ T
where C p is a specific heat capacity of air (1000 J/kg·K); ρ described as the air density; η is the efficiency of the heat recovery system; n illustrates the air change rate (per hour); V is the volume of the room; and ΔT is temperature difference [15].
Additionally, the second major energy performance characteristic in a building is the ability to control solar heat gain through the glazing. The total solar energy that enters the room is determined by the total area of the window, and g-value, defined as the coefficient difference used to measure the transmittance of solar gain through glazing. The heat flow of solar gain is formulated as follows:
Q Solar   =   g   · A w i n d o w   · E s u n l o a d
where Q Solar is the heat flow of solar, of which g is value of solar transmittance; A is the total area of window; and E is a solar load, where the solar load values follow the dynamic changes throughout the year.
Q internal = Q int , people +   Q int , lighting +   Q int ,   appliance
Q internal represents the internal heat gains generated within the building from occupants, appliances, and lighting. These internal gains influence the overall energy demand profile and form part of the baseline for the building’s energy performance assessment. As previously mentioned, the final energy performance also depends on the efficiency of the selected energy system, which affects how much input energy is required to meet the heating demand.
η = Energy output Energy input   ·   100 %
Energy efficiency is defined as the ratio between the output and the input of energy conversion process. Then, energy consumption or primary energy can be calculated. The greater the reduction in primary energy input, the more efficient the system becomes. In the end, less energy consumption increases the resilience and reliability of environmental and community benefits, saving money for future comfort and a healthier living environment.

1.3. Basic Hydrogen Properties and Hydrogen Pilot Projects

1.3.1. Basic Hydrogen Properties

Hydrogen used in energy systems is primarily in the form of dihydrogen gas (H2). It is a colorless, odorless, and non-toxic gas with a high energy content by weight—around 120 MJ/kg for low heating value (LHV) and 142 MJ/kg for high heating value (HHV) [16]. However, its volumetric energy density is significantly lower than other fuels, making its storage and transportation challenging, especially for building-scale application [17].
To manage this, hydrogen can be stored as compressed gas, liquid hydrogen, or in solid-state carriers. Compressed hydrogen at 700 bar has an energy density of 1.5 kWh/L, while liquid hydrogen reaches up to 2.8 kWh/L, but at the cost of substantial energy required for liquefaction [18].
Hydrogen has a higher flame temperature, with a peak of 4000 °F (2204.4 °C), compared to the flame temperature natural gas, which is about 3600 °F (1982.2 °C) [16]. Hydrogen also exhibits a wide flammability range (4–75% in air) and a low ignition energy, requiring careful integration in buildings. Safety measures such as ventilation, leak detection, and compliance with hydrogen-ready infrastructure standards are essential to mitigate risks.
The physical and energy-related characteristics of hydrogen relevant to system design and efficiency in buildings are summarized in Table 1, adapted from Mazloomi and Gomes (2012) [18].
Hydrogen is a highly promising energy carrier, owing to its remarkable gravimetric energy density. However, its volumetric energy density is notably lower and varies significantly depending on the method of storage. As illustrated in Table 2, the energy content of hydrogen per unit mass far exceeds more than natural gas by three times, yet its lower volumetric density at ambient pressure presents challenges for its storage, particularly in building applications. However, the best way of transporting hydrogen in terms of energy density is liquid hydrogen, while compression or liquefaction is needed [19]. Consequently, hydrogen is most advantageous in applications where weight is a critical factor, such as in transportation, or in scenarios where spatial constraints are less stringent, such as district heating systems or seasonal energy storage.

1.3.2. Hydrogen Pilot Projects

It is a debatable question whether hydrogen will be applied in buildings for power or heating appliances. There are many current potential end-uses for hydrogen on a big scale. Hydrogen is often used within the industry cluster as a feedstock for high-temperature processes, shipping, and long-term energy storage for electricity production [20,21,22]. By 2050, it is projected that approximately 50% of global energy consumption will be supplied by electricity, reflecting a significant shift toward electrification [23]. In new-build neighborhoods with highly insulated homes (low heat demand), all-electric solutions seem to be the most logical solution, since an electric heat pump offers a very efficient form of heat supply [24].
Hydrogen integration within the built environment may be effectively combined with other renewable energy sources, such as solar photovoltaic systems and battery storage, particularly for newly constructed dwellings where summer energy production can be optimized. In contrast, existing building stock—especially in historic urban neighborhoods with access to centralized infrastructure—presents opportunities for hydrogen incorporation into heating systems through grid-based solutions. In alignment with national hydrogen strategies, government support has catalyzed research and technological development in this domain. Numerous pilot projects have emerged, led by both academic and industry actors, to explore the technical feasibility and system integration of hydrogen-based energy solutions. These initiatives facilitate the identification of synergies between various technologies and operational models. Table 3 presents a comparative overview of four hydrogen system configurations implemented at different spatial scales, ranging from individual apartments to neighborhood-level applications. The four different systems are as follows:
  • HyNet UK
The HyNet project, as shown in Figure 1, is a pioneering large-scale initiative integrating hydrogen. The HyNet project in the UK is considered one of the first large-scale initiatives aiming to distribute hydrogen energy to urban and industrial clusters. The HyNet project in the UK is considered one of the first large-scale initiatives that is aiming to distribute hydrogen energy to urban and industrial clusters.
The current hydrogen blend contained 10 ppm, and it would be possible to guarantee that it is within the HSE guidance level. Assuming a blend level of 20% vol means that the hydrogen contains up to 50 ppmv CO. This project will use a conservative limit of 50 ppmv. However, the plan of distributing 100% hydrogen is still on the rise, since the project that achieved 50 ppmv was promising and succeeded.
2.
Power-to-Gas Project Rozenburg Rotterdam, The Netherlands
The power-to-gas production chain consists of two technologies, namely: electrolysis and methanation. Electrolysis refers to the conversion of electricity into hydrogen, whereas methanation is the synthetic conversion of hydrogen and carbon dioxide into methane, which is explained further in Figure 2.
Methane is needed to mix with a small flow of carbon dioxide in order to comply with the gas-quality parameters before it can be injected into the gas grid. In the gas grid, the specified parameters of the gas composition must be measured continuously, in order to prevent exceeding the maximum pressure in the pipes of the network.
The conversion of the electricity to hydrogen and oxygen was performed with an efficiency of 47%. The energy efficiency of this methanation process was set at 73%. However, it has been found that the energy balance of the entire system of a power-to-gas system was very low, at only 35% [25].
3.
Hy4Heat UK
Hy4Heat is a program that has been designed to assess whether hydrogen could safely replace natural gas for heating and cooking in homes and small businesses. The program was led by the Department of BEIS (Business, Energy, and Industrial Strategy) and a collaboration between some companies in the UK, including Arup, Kiwa Gastec, and Yo Energy. It is focused on several technical, safety, and public acceptance aspects of using hydrogen in the existing gas infrastructure, including the development and testing of hydrogen-ready appliances, such as boilers, cookers, and fires, as well as safety assessments related to hydrogen use inside buildings.
One of the key outcomes was the demonstration that hydrogen appliances could be made to perform similarly to their natural gas counterparts, and that safety risks could be managed with appropriate modifications and standards. The program also produced valuable data on the public perception of hydrogen, which showed cautious but growing acceptance, especially when safety and environmental benefits were communicated clearly.
Table 3. Data collection for pilot projects of the existing hydrogen-use in buildings.
Hydrogen Distribution and Pipelines (HyNet UK)Hydrogen Blend
(Rozenburg, Rotterdam)
Hydrogen Grid
(Hy4Heat UK)
Hydrogen Electricity
(24/7 Green Village)
Ref.[26][25][27][28]
Hydrogen EnergySourceSolar Generator and Wind
(Green Hydrogen)
Methane (Grey Hydrogen)Not definedGreen Hydrogen
Design SystemDesalination Seawater → Power Plant (Electrolyzer) → Pipelines DistributionElectricity Supply → Electrolysis → Methanation → Gas grid InjectionHydrogen pipelines
distribution → Hydrogen boilers →
Hydrogen appliances → Heating
Hydrogen Pipelines Distribution →
Electrolyser → Compressor → Hydrogen Storage → Fuel Cell → Battery → Households
Energy Conversion
Efficiency
Not Defined35% (Total System Efficiency)90–95% (boiler efficiency)60% (fuel cell efficiency)
SuitabilityCluster and CityApartment and old grid pipelinesDeprived neighborhoodsIndependent housings or neighborhoods
Advantages
-
Low cost and high efficiency
-
Low carbon bulk hydrogen production
-
Safeguards for existing industry
-
Can use the old pipelines
-
Hydrogen can be easily blended to the natural gas unless not exceeding the hydrogen percentage limit
-
High efficiency of energy production
-
Hydrogen can be easily blended to the natural gas
-
Highly scalable for long term energy storage to meet the seasonal balance
-
Hydrogen is used only when it is needed
-
Using electricity to power the house
-
Has a year of complete independent energy source
Disadvantages
-
Suitable for a big cluster
-
Dependent on hydrogen supply
-
A large energy loss during the production process
-
Releasing carbon emission of methanation
-
Long production process which caused less efficiency
-
Risk of methanation is higher
-
Dependent on the hydrogen supply
-
Dependent on the price range of hydrogen, since hydrogen is supplied from the central (in this case are private companies)
-
High costs for hydrogen equipment
-
Long process to produce energy
-
A system scheme should have been further simplified
4.
24/7 Energy Lab, Green Village, TU Delft, The Netherlands
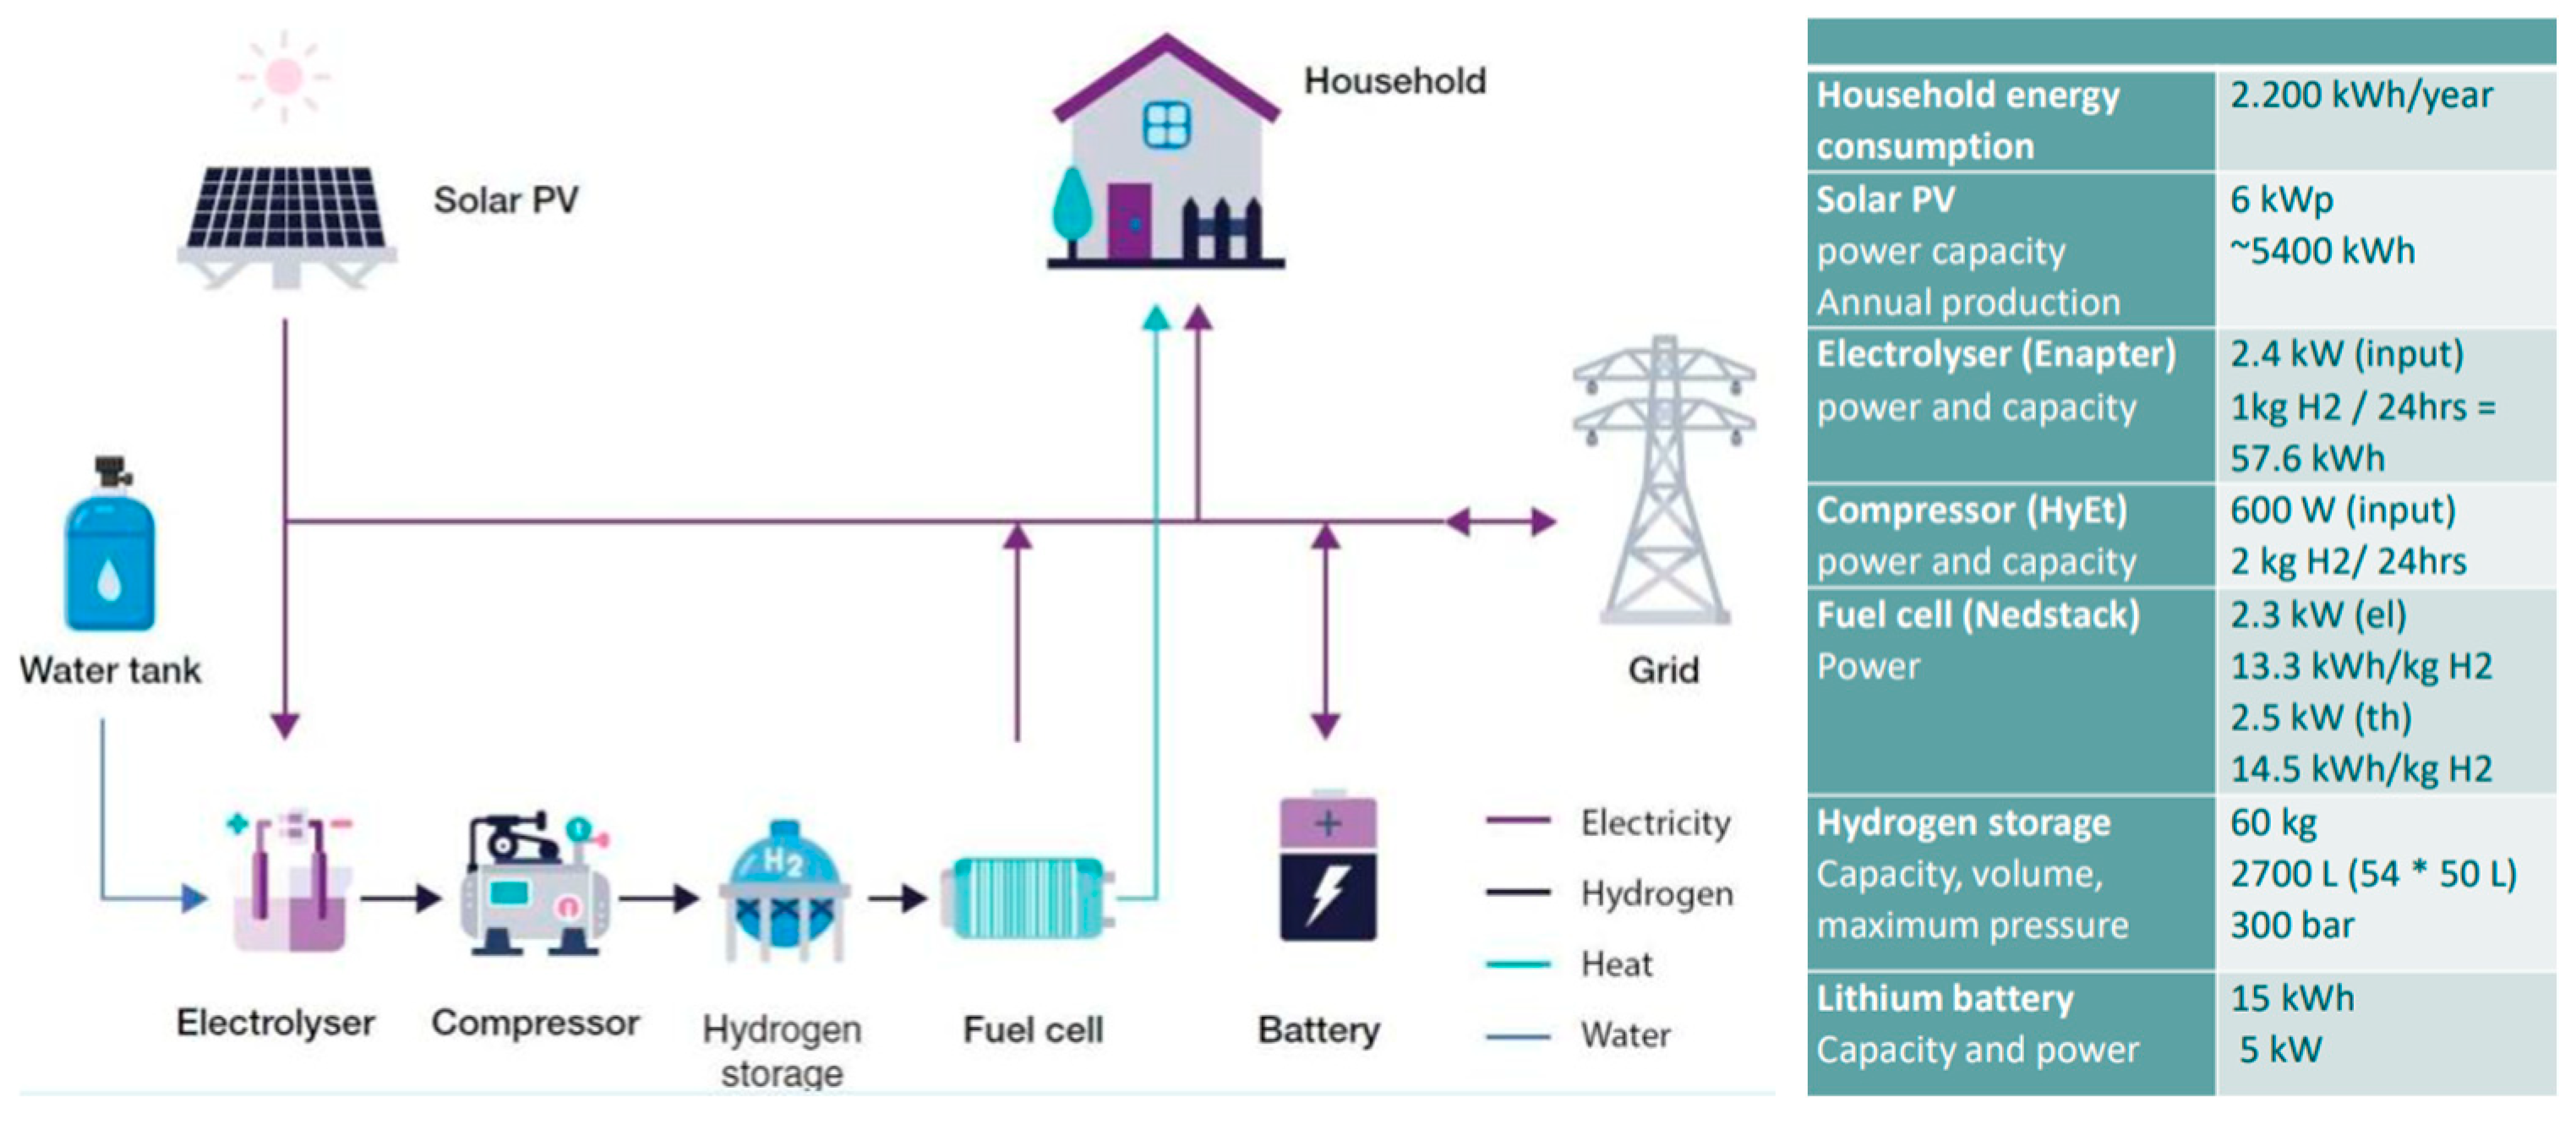
The 24/7 Energy Lab at TU Delft’s Green Village is an innovative pilot project aimed at creating a fully autonomous CO2-free energy system in the built environment. The system, as shown in Figure 3, integrates solar panels, batteries, and hydrogen technologies to balance energy supply and demand throughout the year. During periods of excess solar generation, electricity is stored in batteries for short-term use and converted into green hydrogen via electrolysis for long-term storage. In times of low renewable generation during winter, the stored hydrogen is reconverted into electricity using fuel cells, ensuring a continuous energy supply.
This system shows the feasibility of year-round energy independence and serves as a testbed for the technical, economic, and social aspects of decentralized renewable energy solutions in the built environment.

2. Materials and Methods

2.1. Materials Development

The data are gathered and four different systems were collected. This was narrowed down to two hydrogen systems: microgrid hydrogen boilers and hydrogen fuel cells. Then, this was later expanded to include other alternative systems in order to conduct more research. Although hydrogen offers promising advantages in terms of its emissions, there are other two additional energy systems that are frequently used compared to the hydrogen energy system: heat pumps and natural gas, which are widely utilized in the market. Table 4 presents an overview of key data points that are considered for the development of energy systems.

2.2. Case Study and Building Typology

The neighborhood is conveniently located at Ashbourne Grove, west of Central Forest Park, Stoke-on-Trent, in the United Kingdom, as shown in a Figure 4. This area was considered a yellow belt neighborhood with high heating demand, resulting in elevated levels of carbon emissions of approximately 49 kg CO2 [29].
With strong ambitions to implement the UK Hydrogen Strategy, Stoke-on-Trent City Council and private sector stakeholders are working together to achieve the goal of a hydrogen economy. The United Kingdom is one of 30 countries and regions to include hydrogen in its government’s decarbonization plans. According to the UK government analysis, 20–35% of the UK’s energy consumption will be hydrogen-based by 2050. Further support from the UK government contributes to various hydrogen projects, including the GBP 240 million Net Zero Hydrogen Fund, with Stoke-on-Trent involved to develop pilot projects within the city area.
Hanley is selected for this case study due to its parameters as one of the neighborhoods requiring advanced development to reduce heating demand. Several case studies were conducted on different housing typologies in the UK. Parameters for a set of typical buildings in the United Kingdom used to represent wider housing stock in Hanley, Stoke-on-Trent, were derived from the comprehensive TABULA database, last updated in 2014. The dataset from Tabula was compiled through a combination of household interviews and inspections carried out by surveyors, ensuring an accurate representation of the surveyed properties. Then, five distinct typical buildings with varying building ages and construction materials were identified. With these data, the selection was narrowed down to a total of 25 houses within a single block in the structured region.
The location depicted in Figure 5 serves as a foundational reference point of dwelling characteristics in the United Kingdom. TABULA data are utilized to encompass crucial information on the dwellings’ age and material conditions, insulation types, and heating devices. Subsequently, this data were processed to models, calculating the energy demands for each dwelling in order to determine energy consumption patterns for space heating, domestic hot water, and electricity usage.
The energy efficient characteristics of these building typologies are defined in relation to examples of unmodernized properties in the UK, i.e., those that have not undergone any renovations since the year of their initial construction. Light renovations, often entailing insulation improvements, were carried out in most English houses by 2012, although some dwellings still lack comprehensive insulation. Therefore, renovation recommendations, both light and ambitious ones, can be a valuable tool for estimating the potential for improved energy performance after appropriate restorations.
The thermal performance mentioned in the building elements is based upon the age of the dwellings. This reflects unimproved and inefficient systems in relatively unmodernized dwellings, as shown in Table 5, assuming that the oldest versions are on the verge of being replaced by more efficient systems in both light and ambitious renovations, taking into account condensing boilers in the heating system.

2.3. Renovation Recommendation

To decrease the energy demand of the buildings, combinations of measures are used for the renovation scenarios, which include improving the insulation by using low U-values in the building components. As mentioned earlier, although light renovations were predicted to occur in 2012 and beyond, it is possible that not all houses have undergone complete renovations. On the other hand, ambitious renovations are expected to play a crucial role in the future scenario of highly energy-efficient buildings from now to 2030.
In the light renovation scenario, insulation is added to the walls and roof of the dwellings. Meanwhile, the modification of the window frames and glazing is part of the ambitious renovation scenario. Recommendations for possible renovations for each building type and improvements of each material can be seen in Table 6.

2.4. Energy Demand Modeling

In this study, the energy consumption is simulated for space heating demand, electricity use, and domestic hot water (DHW) demand. DHW is calculated based on the number of occupants in each building, which does not have any influence on different renovations, using a fixed water usage assumption per person. The results were cross verified with TABULA reference data to ensure realistic estimations.
This study adopted a specific approach involving energy demand modeling to achieve a full comprehension of the cumulative energy used within the observed neighborhood. To obtain a precise estimation of energy consumption, it is essential to conduct a comparative analysis of various existing energy systems. Furthermore, the adjustment for weather data in the UK is highly needed for energy demand modeling computations as the United Kingdom has notable climate variations throughout the annual cycle. Therefore, this aspect becomes critical for the accurate determination of the building climate used for the calculation of each hour of energy simulation. Based on the UK’s hourly static energy balance, and by employing the model obtained from the Climate Design Course, each recommendation provides a different value depending on the level of renovation. Significant differences may stand out in several key parameters, such as total square meter per area, U-values of each material construction, Air Changes per Hour (ACH) rate, heat recovery efficiency, and solar gain from window facades. Total energy for domestic hot water is generated based on the total number of occupants in one house, which typically differs for each house. Table 7 shows the input parameters of the ambitious renovation in every building type and their respective values. These inputs are based on the upgraded insulation values discussed in previous chapter. It is crucial to note that the values vary from one renovation case to another, depending on the level of renovation. For instance, regarding the Air Changes per Hour (ACH) rate, the Base Case for English dwellings has 0.8 exchanges per hour, while the ACH rates for light and ambitious renovation scenarios have 0.7 exchanges per hour and 0.5 exchanges per hour, respectively. According to ASHRAE 62.2, a minimum ventilation rate of 0.35–0.5 exchanges per hour is recommended for residential buildings in order to ensure acceptable indoor air quality [30].
As mentioned previously, the calculation of energy demand modeling was performed by utilizing a building model in Excel, with data collected on an hourly basis for a period of 8760 h a year. This hourly data were then added up yearly to obtain the energy demand per year. However, this modeling does not consider the dynamic effects of building mass and the dynamic control per hour, including controls for the cases of summer or winter. Table 8 shows one of the calculation profiles of how the energy demand is observed, along with the explanation of the calculations.
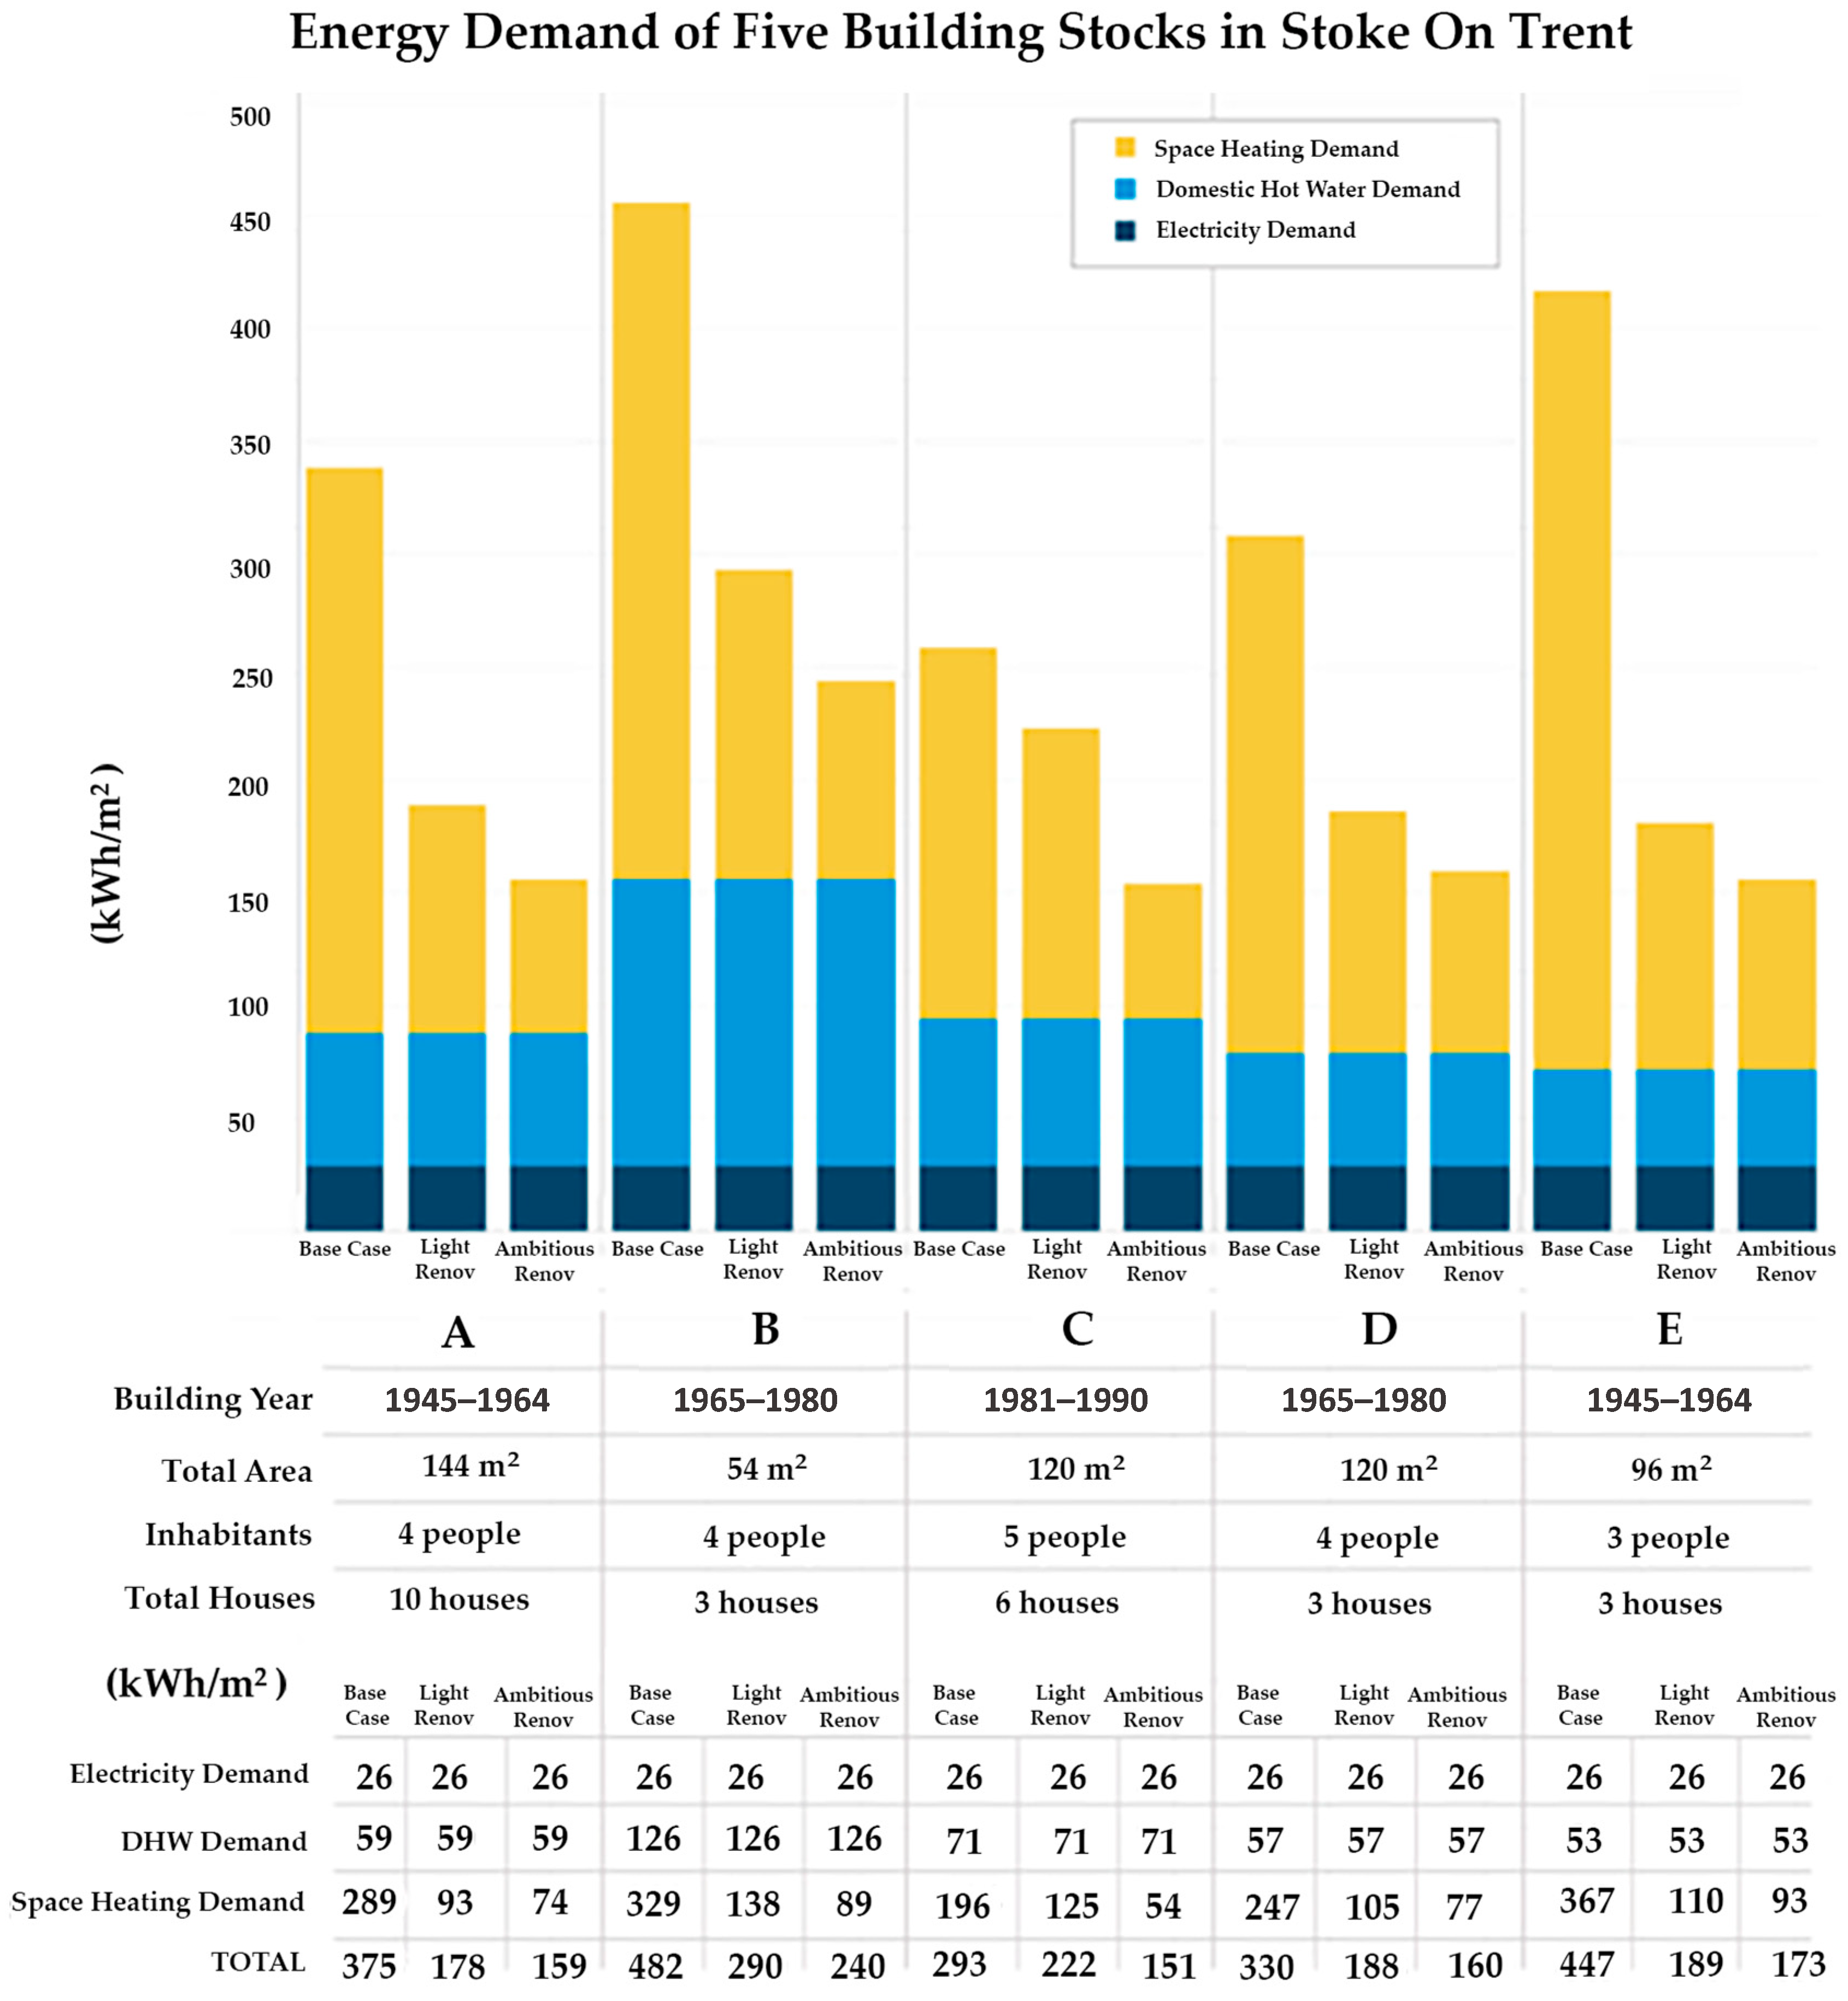
The results of energy demand calculations for the five typical buildings are presented in Table 9 containing specific data from three cases, namely: non-renovation (Base Case), light renovation, and ambitious renovation. Each case has three energy demand calculations for space heating, domestic hot water, and electricity. In this regard, the amount of space heating demand varies depending on the levels of insulation, whereas that of domestic hot water shows a consistent pattern across different renovation cases, depending on the number of occupants in the buildings. Meanwhile, the electricity demand has similar outcomes across different levels because the calculation model does not clearly specify which appliances are used in each dwelling. Then, to verify the accuracy of the modeling outcomes, the final values were cross-referenced with the data presented in the Tabula database. However, due to its limited data provision, only the values of space heating demand are available in this database. Therefore, only this comparison can be used to validate the data.
From the data validation above, the similarity between the values from the modeling and the Tabula database is less than 30%, indicating that the calculations can be processed further. A total of 25 houses within the five typical buildings were examined in this study. The representative data of these 25 houses were further used in each energy system scenario by comparing three different criteria, i.e., energy consumption, cost effectiveness, and carbon emissions. The collective data are shown in the next graph in Figure 6.
The energy demand for domestic hot water varies upon the total number of occupants per house; as the number of individuals residing in one house increases, it is anticipated that there will be a corresponding increase in the energy demand for domestic hot water. Meanwhile, electricity demand is not the main focus of this study because there is no detailed data regarding specific equipment or appliances used in the given scenario. Overall, there is a significant increase in energy demand from the Base Case scenarios to the completion of the renovation process, both light and ambitious renovations, with the total values for ambitious renovation scenarios on the five typical houses ranging from 150 to 200 kWh per square meter.

2.5. Hydrogen Production System

In this research, the hydrogen used in building energy scenarios is assumed to be green hydrogen powered by solar photovoltaic (PV) system produced via electrolysis. This approach is selected to align with the study’s focus on decarbonized, localized energy systems.
Hydrogen is generated using a Proton Exchange Membrane (PEM) electrolyzer, with a production capacity of up to 30 Nm3/h. The hydrogen is subsequently compressed to a storage pressure of 350 bar. Assuming an efficiency of 70% for both the electrolyzer and the compressor, the hydrogen is stored in pressurized tanks. It is then utilized in each scenario, including for space heating with hydrogen boilers operating at up to 95% efficiency, blending the hydrogen with natural gas at a maximum content of 30%, and as a fuel for a cogeneration fuel cell system.

3. Results

Energy Efficiency Comparison

The development of energy performance in the building sector should proceed in parallel with energy production and energy consumption, primarily due to the constraints imposed by the finite nature of the energy resources [31]. Numerous studies have been conducted to investigate the holistic energy consumption in buildings. Therefore, this practical assessment aims to compare the energy efficiency for various scenarios of building energy systems.
Energy performance refers to the effectiveness of the energy system converting its primary energy source into energy output such as electricity, heat, or cooling; the more energy consumed in the conversion process to the output, the lower the system performance. A system with good energy performance will efficiently convert its primary energy source into valuable and useful energy outputs, resulting in lower energy losses and waste.
Accurate estimation of energy consumption in a building is a vital strategy for reducing energy demand and improving energy efficiency, which plays an important role in controlling energy usage as well as reducing costs and maintaining a comfortable environment in the buildings [32]. The energy in each scenario is produced locally by solar power. Table 10 presents the total values of energy demand in one block comprising 25 dwellings.
Scenario 1. 
Natural Gas Grid Heating System.
Electricity Source: Photovoltaic on rooftop, electricity grid (support)
Heat Source: Natural gas with gas boiler
  • Space Heating: Gas boiler
  • Domestic Hot Water: Gas boiler
Electrical Storage: Batteries
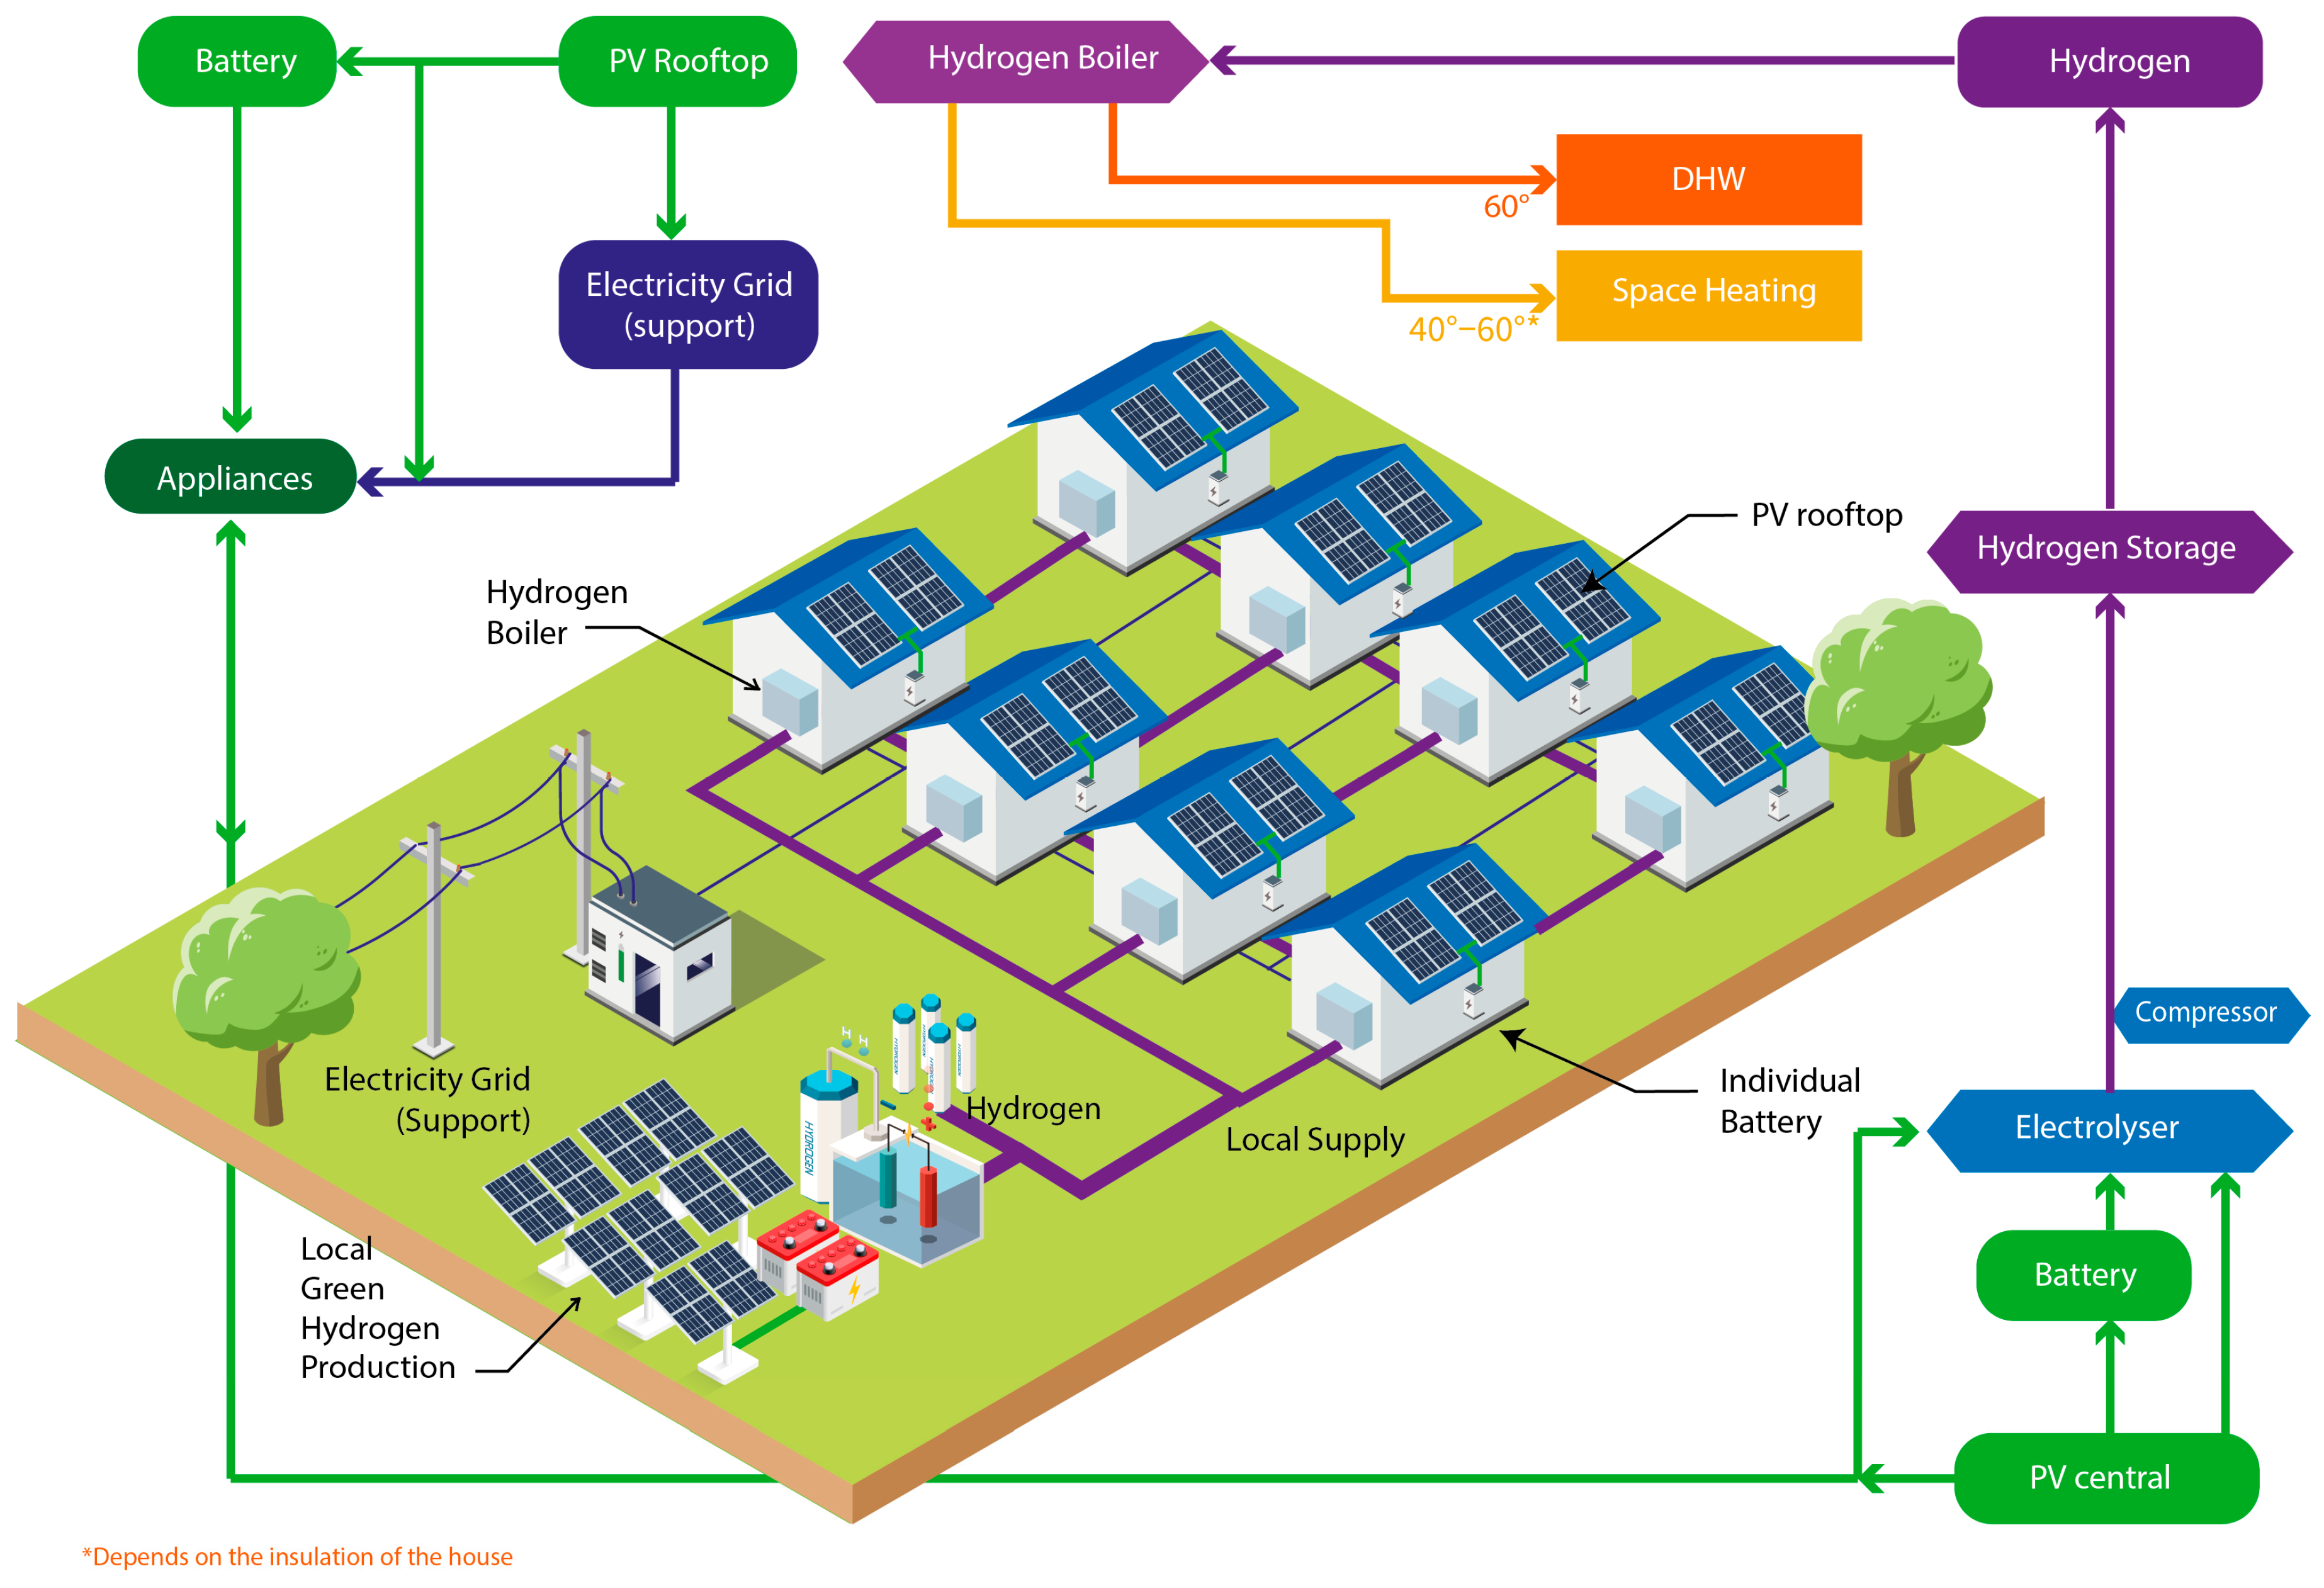
The system is designed to use natural gas supplied through the grid as its main energy input. The photovoltaic rooftop system generates electricity from sunlight and stores it in batteries. The natural gas boiler provides a reliable source of heat, employing an individual condensing combi boiler in each house for both uses of domestic hot water and space heating. Typically, up to 40 to 60 degrees Celsius is utilized for room heating, while higher temperature water, reaching to 60 degrees Celsius, is circulated for hot water needs. Natural gas is supplied to the boiler through pipelines from suppliers; the boiler ignites the natural gas, which heats a heat exchanger. Water circulates through the heat exchanger and is heated by the combustion of the natural gas. Then, the heated water is distributed to the home through pipeline systems.
As shown in Figure 7, the primary focus in this scenario is the utilization of a boiler system fueled by natural gas. In this method, the efficiency of the boiler is the main factor that influences the overall efficiency of the domestic energy system. The heating system operates within a temperature range of 40 to 60 degrees Celsius and caters to domestic hot water demand as it approaches 60 degrees Celsius. To respond to the temperature setpoint, a condensing ‘combi boiler’ is employed, which effectively provides energy for both domestic hot water and space heating in one controlled unit. The thermostatic radiator valves, managed by controllers, optimize start/stop during the cycles.
Conventional boilers account for approximately 85% of energy consumption and contribute to 67% of CO 2 emissions. While energy efficiency of outdated gas-fired boiler systems is estimated at 85% [33,34], condensing boilers can increase this efficiency by about 10%. This model incorporates two heat exchangers, which efficiently capture and recycle heat from exhaust gases before release [33]. Consequently, condensing boilers achieve a thermal efficiency of 95% when utilized for space heating within the temperature range of 40 to 60 degrees Celsius. However, this efficiency decreases slightly to 85% when a higher temperature of 60 degrees Celsius is required. In addition, the technology in this system also results in a 5% reduction in energy loss due to grid transmission. The energy performance of this system can be determined by considering the overall energy demand, as presented in Table 11, which also presents a comprehensive overview of the calculations performed within the system.
In the system shown in Figure 8, approximately 588 MWh of natural gas is consumed to heat 25 dwellings with a total energy demand of around 508 MWh for both space heating and domestic hot water. Therefore, the total efficiency during system operation is calculated to reach 86.4%, with heat loss contributing to this percentage. The efficiency of gas boilers plays a significant role in overall system efficiency, underscoring the importance of having high-performance boilers. Furthermore, other factors such as heat loss during distribution and the quality of the insulation may also have an impact on the efficiency of the overall system. Thus, the commendable 85% efficiency signifies that the system is working well.
In this system, the crucial role of well-insulated houses in optimizing the performance of a heat pump system becomes apparent. The Base Case scenario highlights the inapplicability of this system due to the absence of proper insulation. Insulation is pivotal for efficient building operations, ensuring consistent indoor temperatures, and ultimately reducing energy consumption. For this reason, this system achieves its optimal performance in dwellings with medium to high insulation levels. Table 11 provides a comprehensive overview of the calculations within this system.
Figure 8 presents a diagram illustrating the energy consumption and heat output of the natural gas grid system in a light renovation scenario, which offers an intriguing case for the analysis. This analysis takes into account yearly usage, regardless of weather, by utilizing photovoltaic technology to power various appliances. Additionally, the electrical grid serves as a supplementary power source during periods of insufficient solar yield, with a capacity considered sufficient to meet the energy consumption of 86 MWh annually. However, specific details regarding system coverage during winter or summer are not clearly delineated, causing the seasonal storage in this scenario to not yet be applied. In winter, the electrical grid continues to act as a significant contingency plan, with great potential for backup power supplies, including batteries.
Despite incorporating PV for electrical appliances, this system relies entirely on natural gas for both space heating and domestic hot water (DHW). Natural gas combustion emits approximately 0.184 kg CO2 per kWh of energy used [35]. Therefore, total natural gas use for scenario (Base Case) 1130.91 MWh, with estimated emissions: 1130.91 × 1000 × 0.184 = 208,086 kg CO2 = 208.1 tonnes CO2/year. This makes Scenario 1 the highest-emitting configuration, contributing significantly to carbon emissions despite modest gains in efficiency through condensing boilers.
Scenario 2. 
All Electric Heat Pump System
In this system, the neighborhood is operating a centralized energy system, accommodating appliances such as the following:
Electricity Source: Photovoltaic rooftop and electricity grid (support)
Heating Source: Electricity from PV central (through heat pump central + booster (additional)
  • Space Heating: Heat pump
  • Domestic Hot Water: Heat pump
Electrical Storage: Batteries
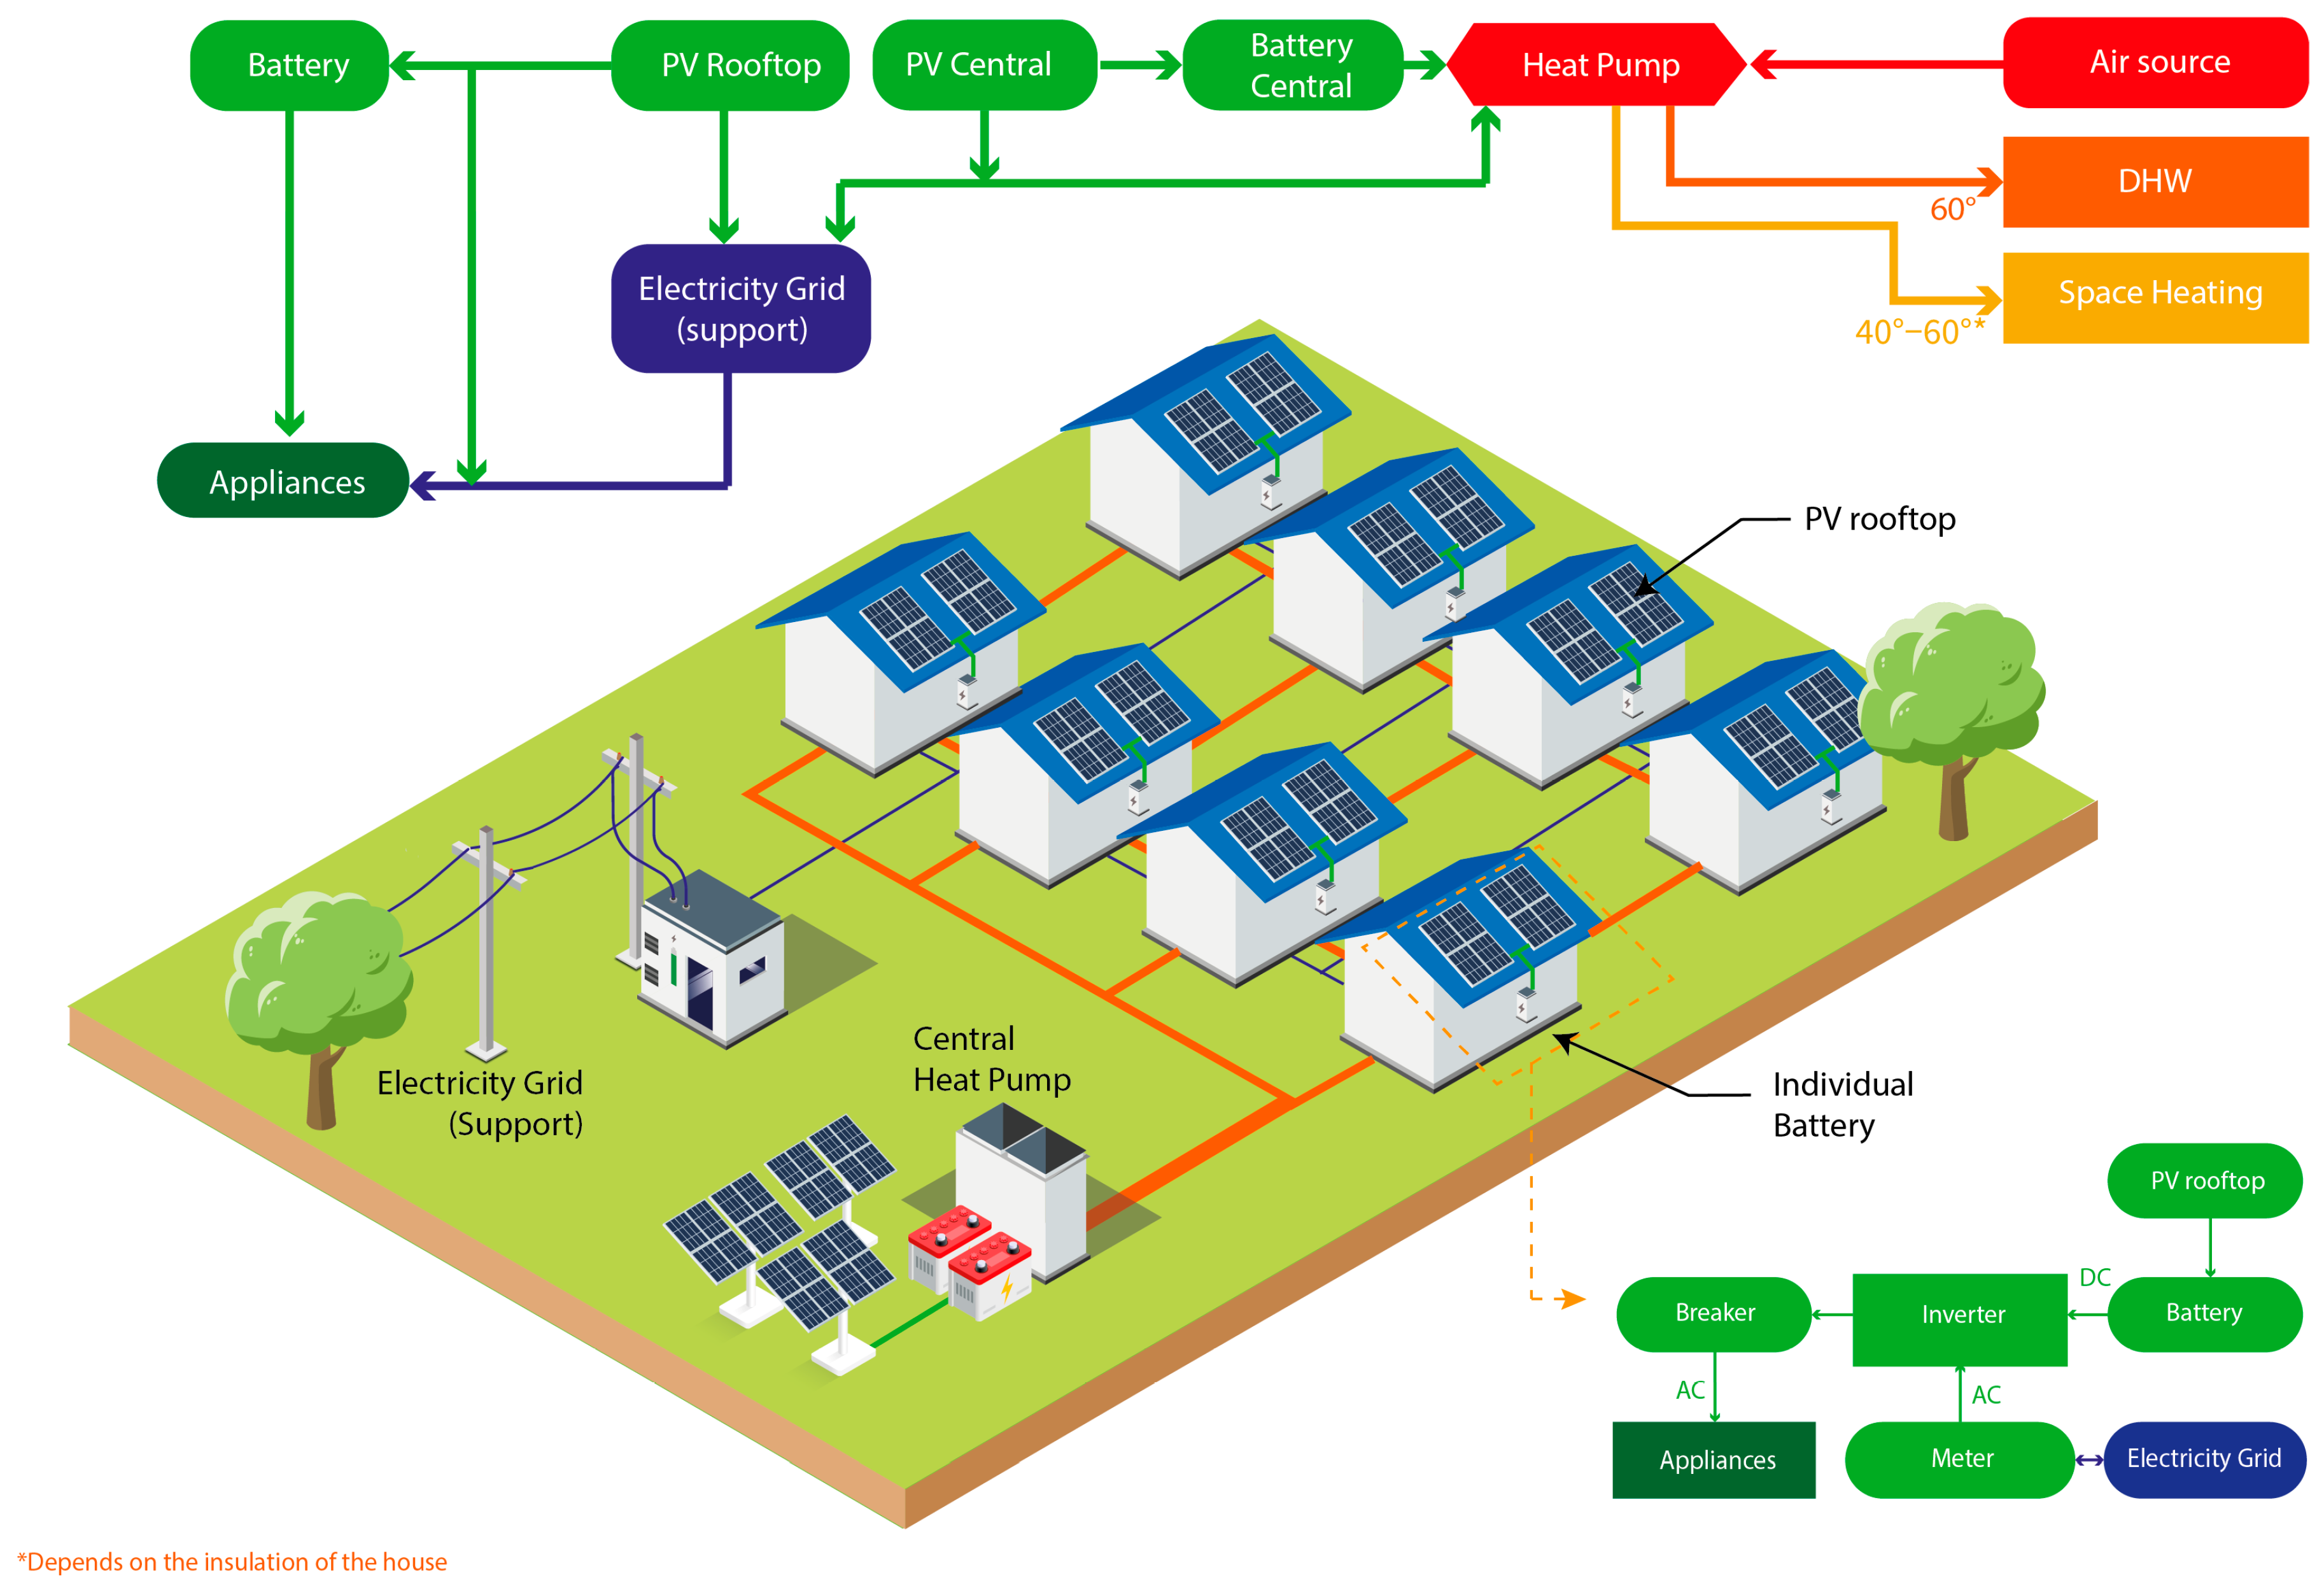
In this scenario, as shown in Figure 9, the neighborhood relies entirely on its electrical application. An air source heat pump is utilized in the neighborhood to provide heating and cooling. The selection of an air-based heat pump has been encouraged by its lower energy consumption in comparison with ground-based heat pumps. Air source heat pumps are more frequently used and easier to install, generally cost effective, and have lower operational costs than ground source heat pump systems. In this system, a centralized heat pump is applied, as it is more efficient and costs less whether in operational or in capital costs. Moreover, the community sense of the area is visible regarding its maintenance and operation in the community.
The production of domestic hot water is facilitated by heat pumps, which may be supplemented by an additional booster in cases where the desired temperature cannot be achieved. The system also incorporates batteries, which offer an advantage in terms of electricity storage when buildings experience power depletion.
Furthermore, in this system, the crucial role of well-insulated houses in optimizing the performance of a heat pump system becomes apparent. The Base Case scenario highlights the inapplicability of this system due to the absence of proper insulation. Insulation is pivotal for efficient building operations, ensuring consistent indoor temperatures, and ultimately reducing energy consumption. For this reason, this system achieves its optimal performance in dwellings with medium to high insulation levels. Table 12 provides a comprehensive overview of the calculations within this system.
It is evident that an outstanding level of energy efficiency can be achieved with this system. As a result, a substantially lower energy source is achieved with the same level of energy demand. The energy consumption in this scenario is only one fourth of the energy demand. As clearly illustrated in Table 12, only 135 MWh of electricity is needed to meet the total heating demand of 508 MWh in the light renovation scenario. Compared to the natural gas grid system in the previous scenario that produces an energy source of 588 MWh, it becomes apparent that this system can achieve approximately five times more energy efficiency with a system efficiency of more than 350%, demonstrating its remarkable potential for resource conservation.
Furthermore, energy production is distinguished based on its usage. The electricity generated by individual PV rooftops is utilized to cover the electricity demand for appliances. As for the heating system, the electricity produced by the central PV is used to operate the centralized heat pump system, which not only serves multiple building units to facilitate large-scale development but also provides easy access and scalability of transitioning into local renewable energy sources. This eventually leads to more streamlined maintenance and more affordable service costs. In addition, synergy between the centralized energy production and the central PV can enhance the independence of the electrical grid. However, it should be noted that additional investment costs for discrete PV production may be incurred due to the need for more equipment and installations. The complete scenario is shown in Figure 10.
This system operates entirely on electricity, which is assumed to be sourced from local PV systems. Given the high efficiency of heat pumps (COP ≈ 4.3), the actual energy input required is relatively low. Total electricity use (Light Renovation): 135.13 MWh. If sourced entirely from PV, then net zero carbon emission is achieved. However, if it is partially connected to the grid, when the grid is not totally green sourced, it will be 135.13 × 1000 × 0.233 = 31.5 tonnes CO2. Where 0.233 kg CO2 per kWh is the number where the grid emission is counted [35]. Under full PV coverage, Scenario 2 achieves zero emissions during operation, representing the cleanest non-hydrogen option in this study.
Scenario 3. 
Natural Gas and hydrogen blended System
Electricity source: Photovoltaic, electricity grid (support)
Heating source: Hydrogen gas 30% and natural gas 70% (blended)
  • Space heating: Regular boiler
  • Domestic hot water: Regular boiler
Electrical Storage: Batteries
Energy Storage: Local hydrogen storage
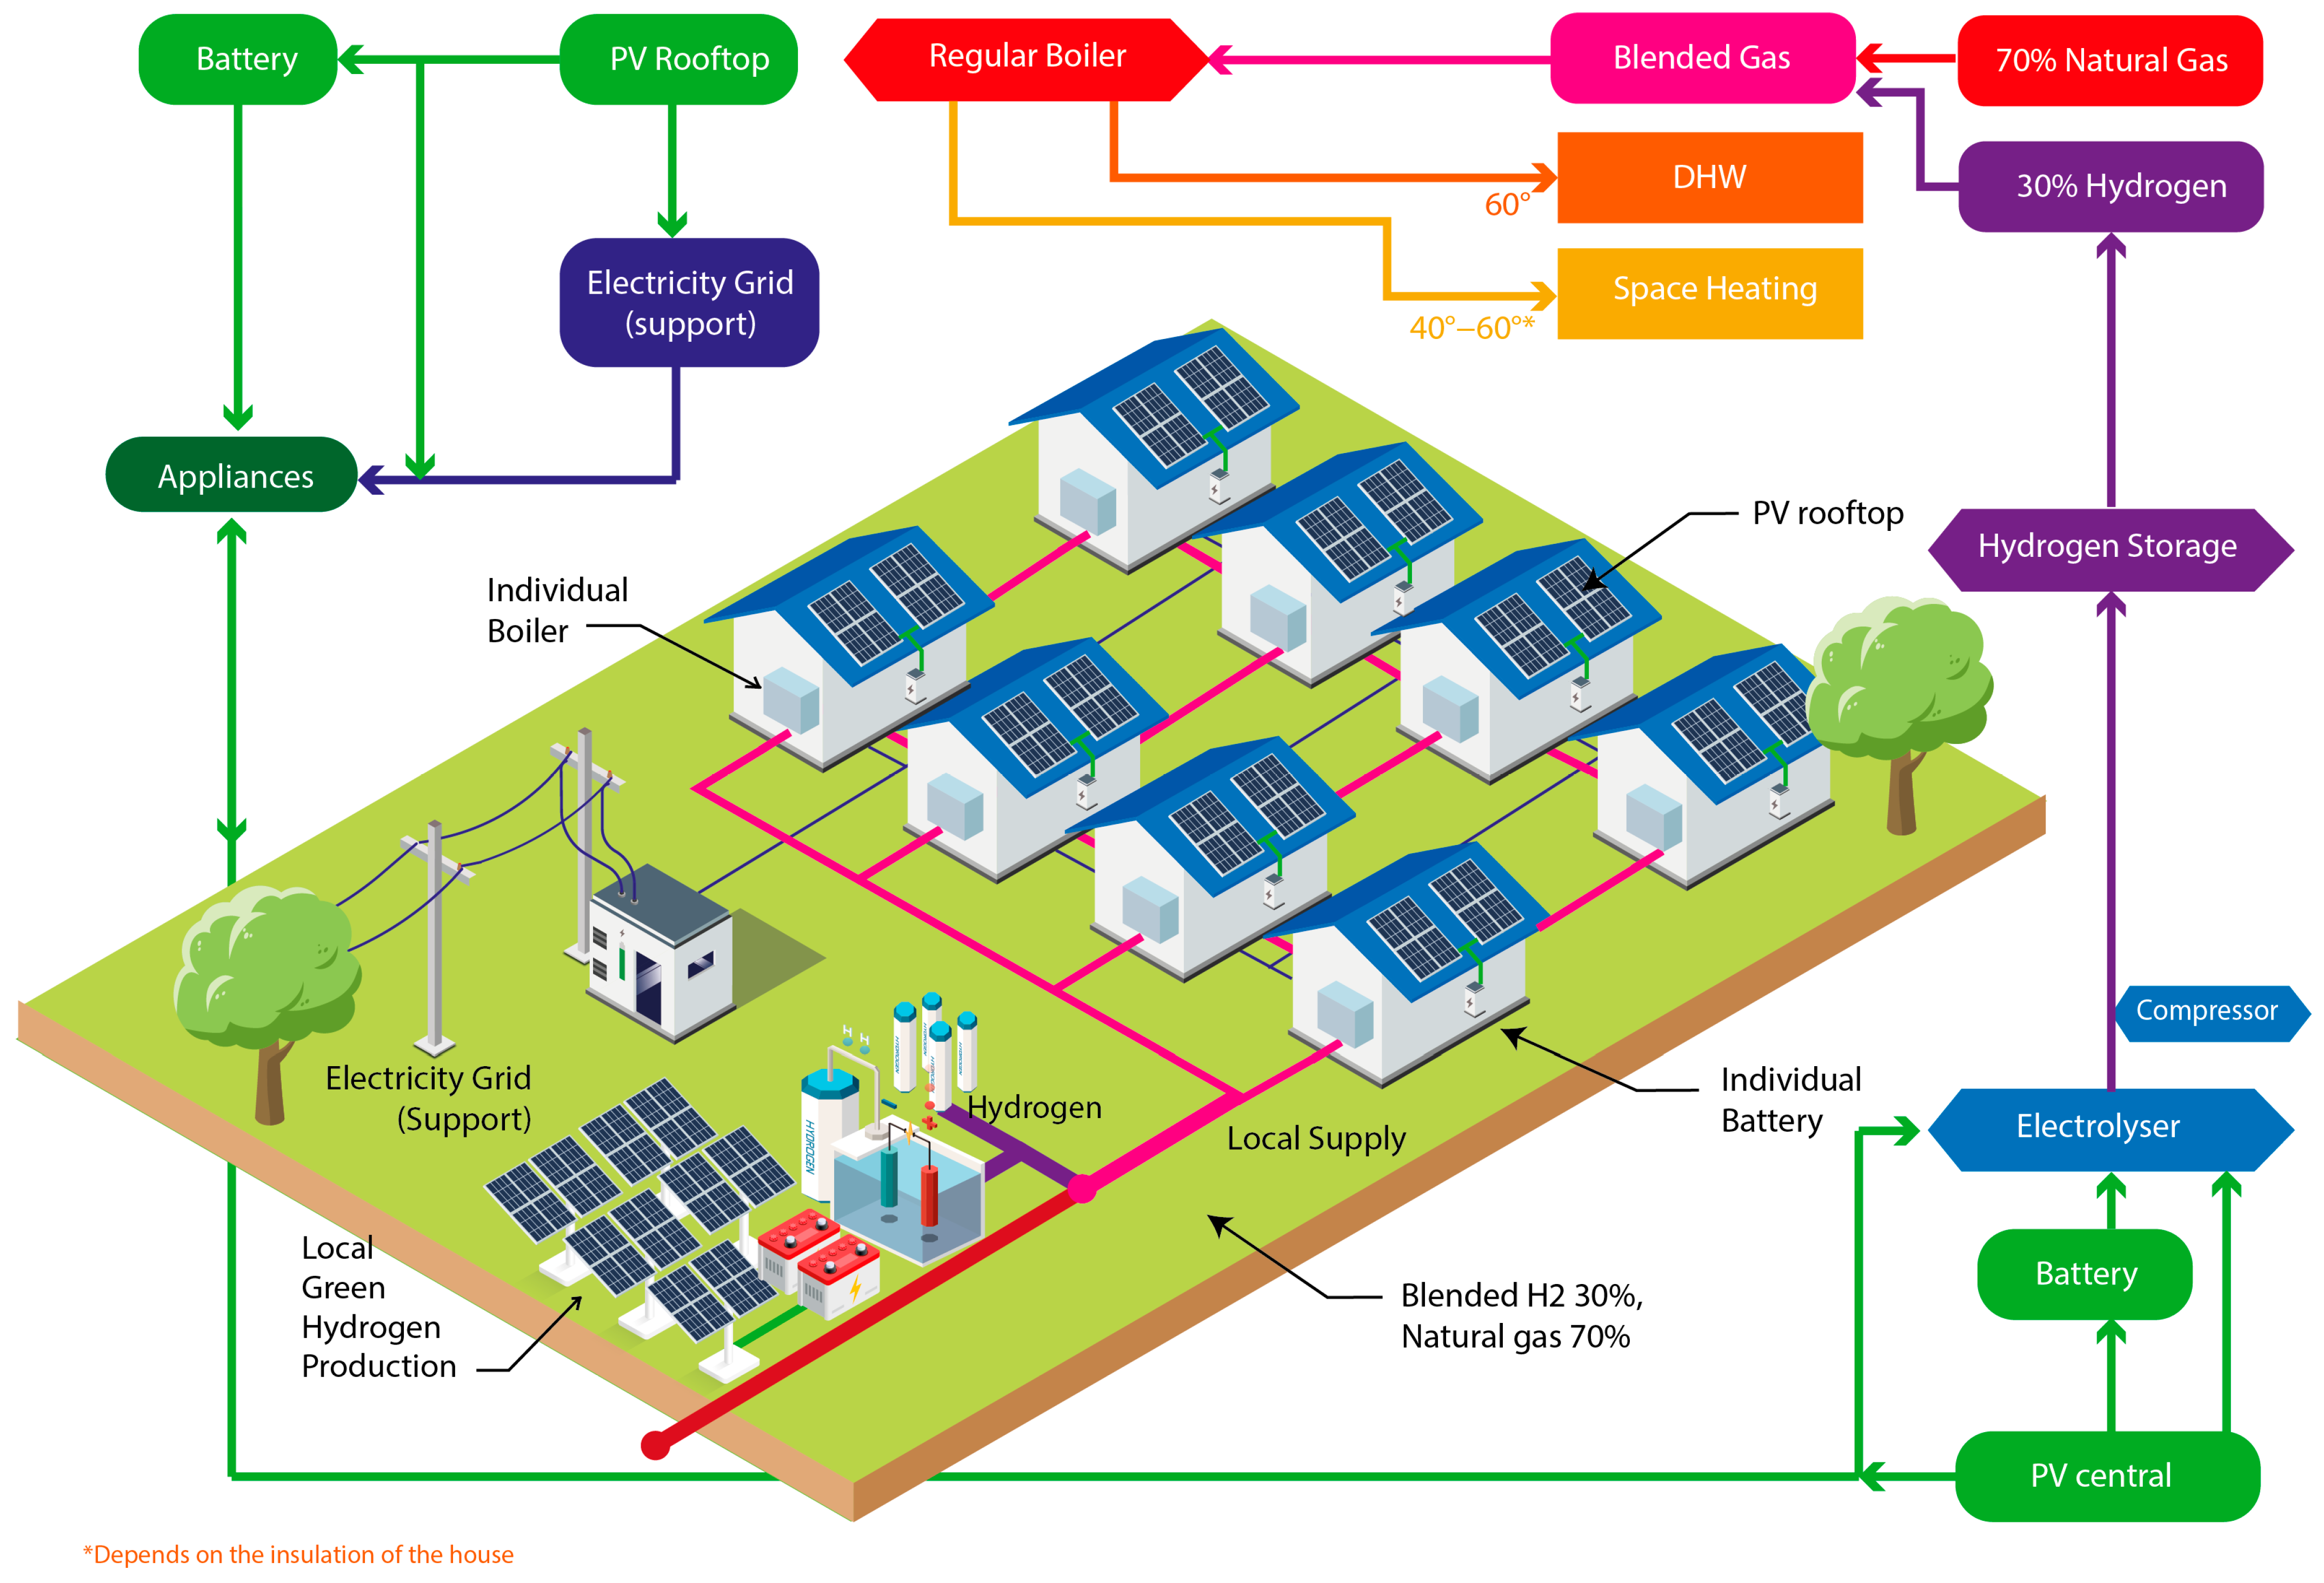
This proposed alternative, as illustrated in Figure 11, involves the combination of two energy sources: natural gas comprising 70% and hydrogen comprising 30%. This particular blend does not differ significantly from other common variants. The proposed approach involves the blending of hydrogen natural gas within the existing pipes located in the surrounding area where the production of hydrogen in the area is significantly supplied or initially supplied within the neighborhood. Green solar-powered hydrogen utilizing photovoltaics and batteries within a centralized system is implemented within the production of green hydrogen. However, the energy efficiency of this system does not differ significantly from the first scenario, where a conventional boiler is employed in a system that uses 100% natural gas. In addition, it is essential to note that the incorporation of additional appliances in the hydrogen production process necessitates greater investment and electricity expenditure.
This proposed alternative, involves the combination of two energy sources: 70% natural gas and 30% hydrogen. Table 13 provides a comprehensive analysis of total resources is needed in the system.
Despite the additional costs, the significant reduction in carbon emissions is a noteworthy advantage achieved through the utilization of 30% hydrogen blended into the natural gas system. Figure 12 presents a comprehensive illustration of this system and reveals that approximately 508 MWh of heating demand consumes about 666.14 MWh of energy, with 411 MWh generated from natural gas and 254 MWh hydrogen from local photovoltaics. This indicates that even though 30% of the energy is covered by hydrogen, a significant amount of energy is still needed, most likely due to the energy-intensive process of electrolysis and other processes in hydrogen production.
In all cases, it is assumed that H 2 gas is initially generated at a pressure of 20 bar (290 psia). A study conducted by Ferreira [35], on modeling electrolysis at different pressures reveals that 1.05 to 1.5 kWh/kg of hydrogen is required to compress from 20 bar to 350 bar. From the model of 10 MW PEM electrolyzes, with a total production of 181.3 kg, about 7149 kW of compressed hydrogen is produced with the resulting pressure output of 20 bar. An additional 202 kW of electricity is needed to increase the pressure by 200 bar and 273 kW to 350 bar. Therefore, with 7149 kW of compressed hydrogen and 10.000 kW + 273 kW of input electricity, the efficiency of 350 bar compression is 69.59%, which is rounded to 70%. It should be noted that this process is a combination of electrolysis and compressing processes.
On the other hand, the system’s total efficiency of 76%, accounting for a total energy consumption of 666 MWh and the output or heating demand of 406 MWh, is still commendable. Furthermore, by taking into account 411 MWh of natural gas resource and approximately 10.6 kWh/kg of its energy content, the annual energy production from natural gas is 57,110 cubic meter per year for one block or 25 houses.
This hybrid system uses a 70:30 mix of natural gas and hydrogen. Hydrogen is assumed to be green (PV-electrolyzed). Natural gas (70% of total 508 MWh heating demand): 356 MWh CO2 emissions, 356 × 1000 × 0.184 = 65,504 kg CO2 = 65.5 tonnes CO2/year. This scenario achieves a moderate carbon reduction (up to 30% compared to Scenario 1). However, it still relies on fossil fuels, and its benefit depends on maximizing hydrogen integration.
Scenario 4. 
Hydrogen Microgrid Boiler System
In this particular variant, the system operates exclusively on 100% hydrogen, which is collectively stored within the neighborhood. The local electricity supply is sourced primarily from photovoltaic panels, with the electricity grid serving as a backup support.
Electricity Source: Photovoltaic, electricity grid (support)
Heating Source: Hydrogen gas
  • Space Heating: Hydrogen boiler
  • Domestic Hot Water: Hydrogen boiler
Electrical Storage: Batteries
Energy Storage: Hydrogen storage
In this system, as presented in Figure 13, a localized energy infrastructure using 100% hydrogen as the primary fuel source is built within the neighborhood. A self-production of hydrogen with photovoltaic-based is utilized. The generated hydrogen gas is then distributed into a small-scale grid designed to provide heating to the neighborhood in Stoke-on-Trent. As it fully disperses hydrogen, the pipeline network requires upgrades to ensure the safety of hydrogen distribution. Nevertheless, the use of hydrogen boilers to replace the regular boilers also needs to be taken into consideration to achieve a complete and good performance system. While the new technology in hydrogen boilers does have an effect on increasing capital costs, this scenario excludes the projection of hydrogen demand, which specifies the decrease in the total cost of hydrogen production.
Table 14 provides a comprehensive overview of the energy consumption calculations within the system. To fulfill the heating demand of 508 MWh for both space heating and domestic hot water, hydrogen consumption of up to 848.6 MWh is needed. As a result, the total efficiency of this system is found to reach almost 60%, encompassing the entire process from the initial stages to the hydrogen production phase.
The production of hydrogen at a high pressure of 350 bar requires a substantial amount of electricity. The more energy needed to cover the hydrogen conversion process the more photovoltaics required to accommodate this need. Thus, to enhance further utilization, a photovoltaic system generating direct currents (DC) will adapt to the current electrolyzer rate. An electrolyzer may have such a high direct current (DC) that it requires another DC/DC conversion, which is calculated with 95% effectiveness in the system. The configuration system is shown in Figure 14.
This system runs entirely on hydrogen for heating and DHW. The hydrogen is produced via on-site electrolysis powered by PV. Hydrogen energy demand: ~848.6 MWh. Due to its source-used PV electrolysis, the result is a carbon-free heating system in terms of direct emissions, although system efficiency is lower (60%). Importantly, this assumes no fossil backup or grid power is used during hydrogen production or distribution.
Scenario 5. 
Cogeneration Hydrogen Fuel Cell System
Power source: Photovoltaic, electricity grid (support), and electricity surplus from fuel cells.
Energy Source: Hydrogen gas
  • Space Heating: Waste heat from fuel cells
  • Domestic Hot Water: Waste heat from fuel cells
Storage: Hydrogen storage and batteries
The system configuration is shown clearly in Figure 15.
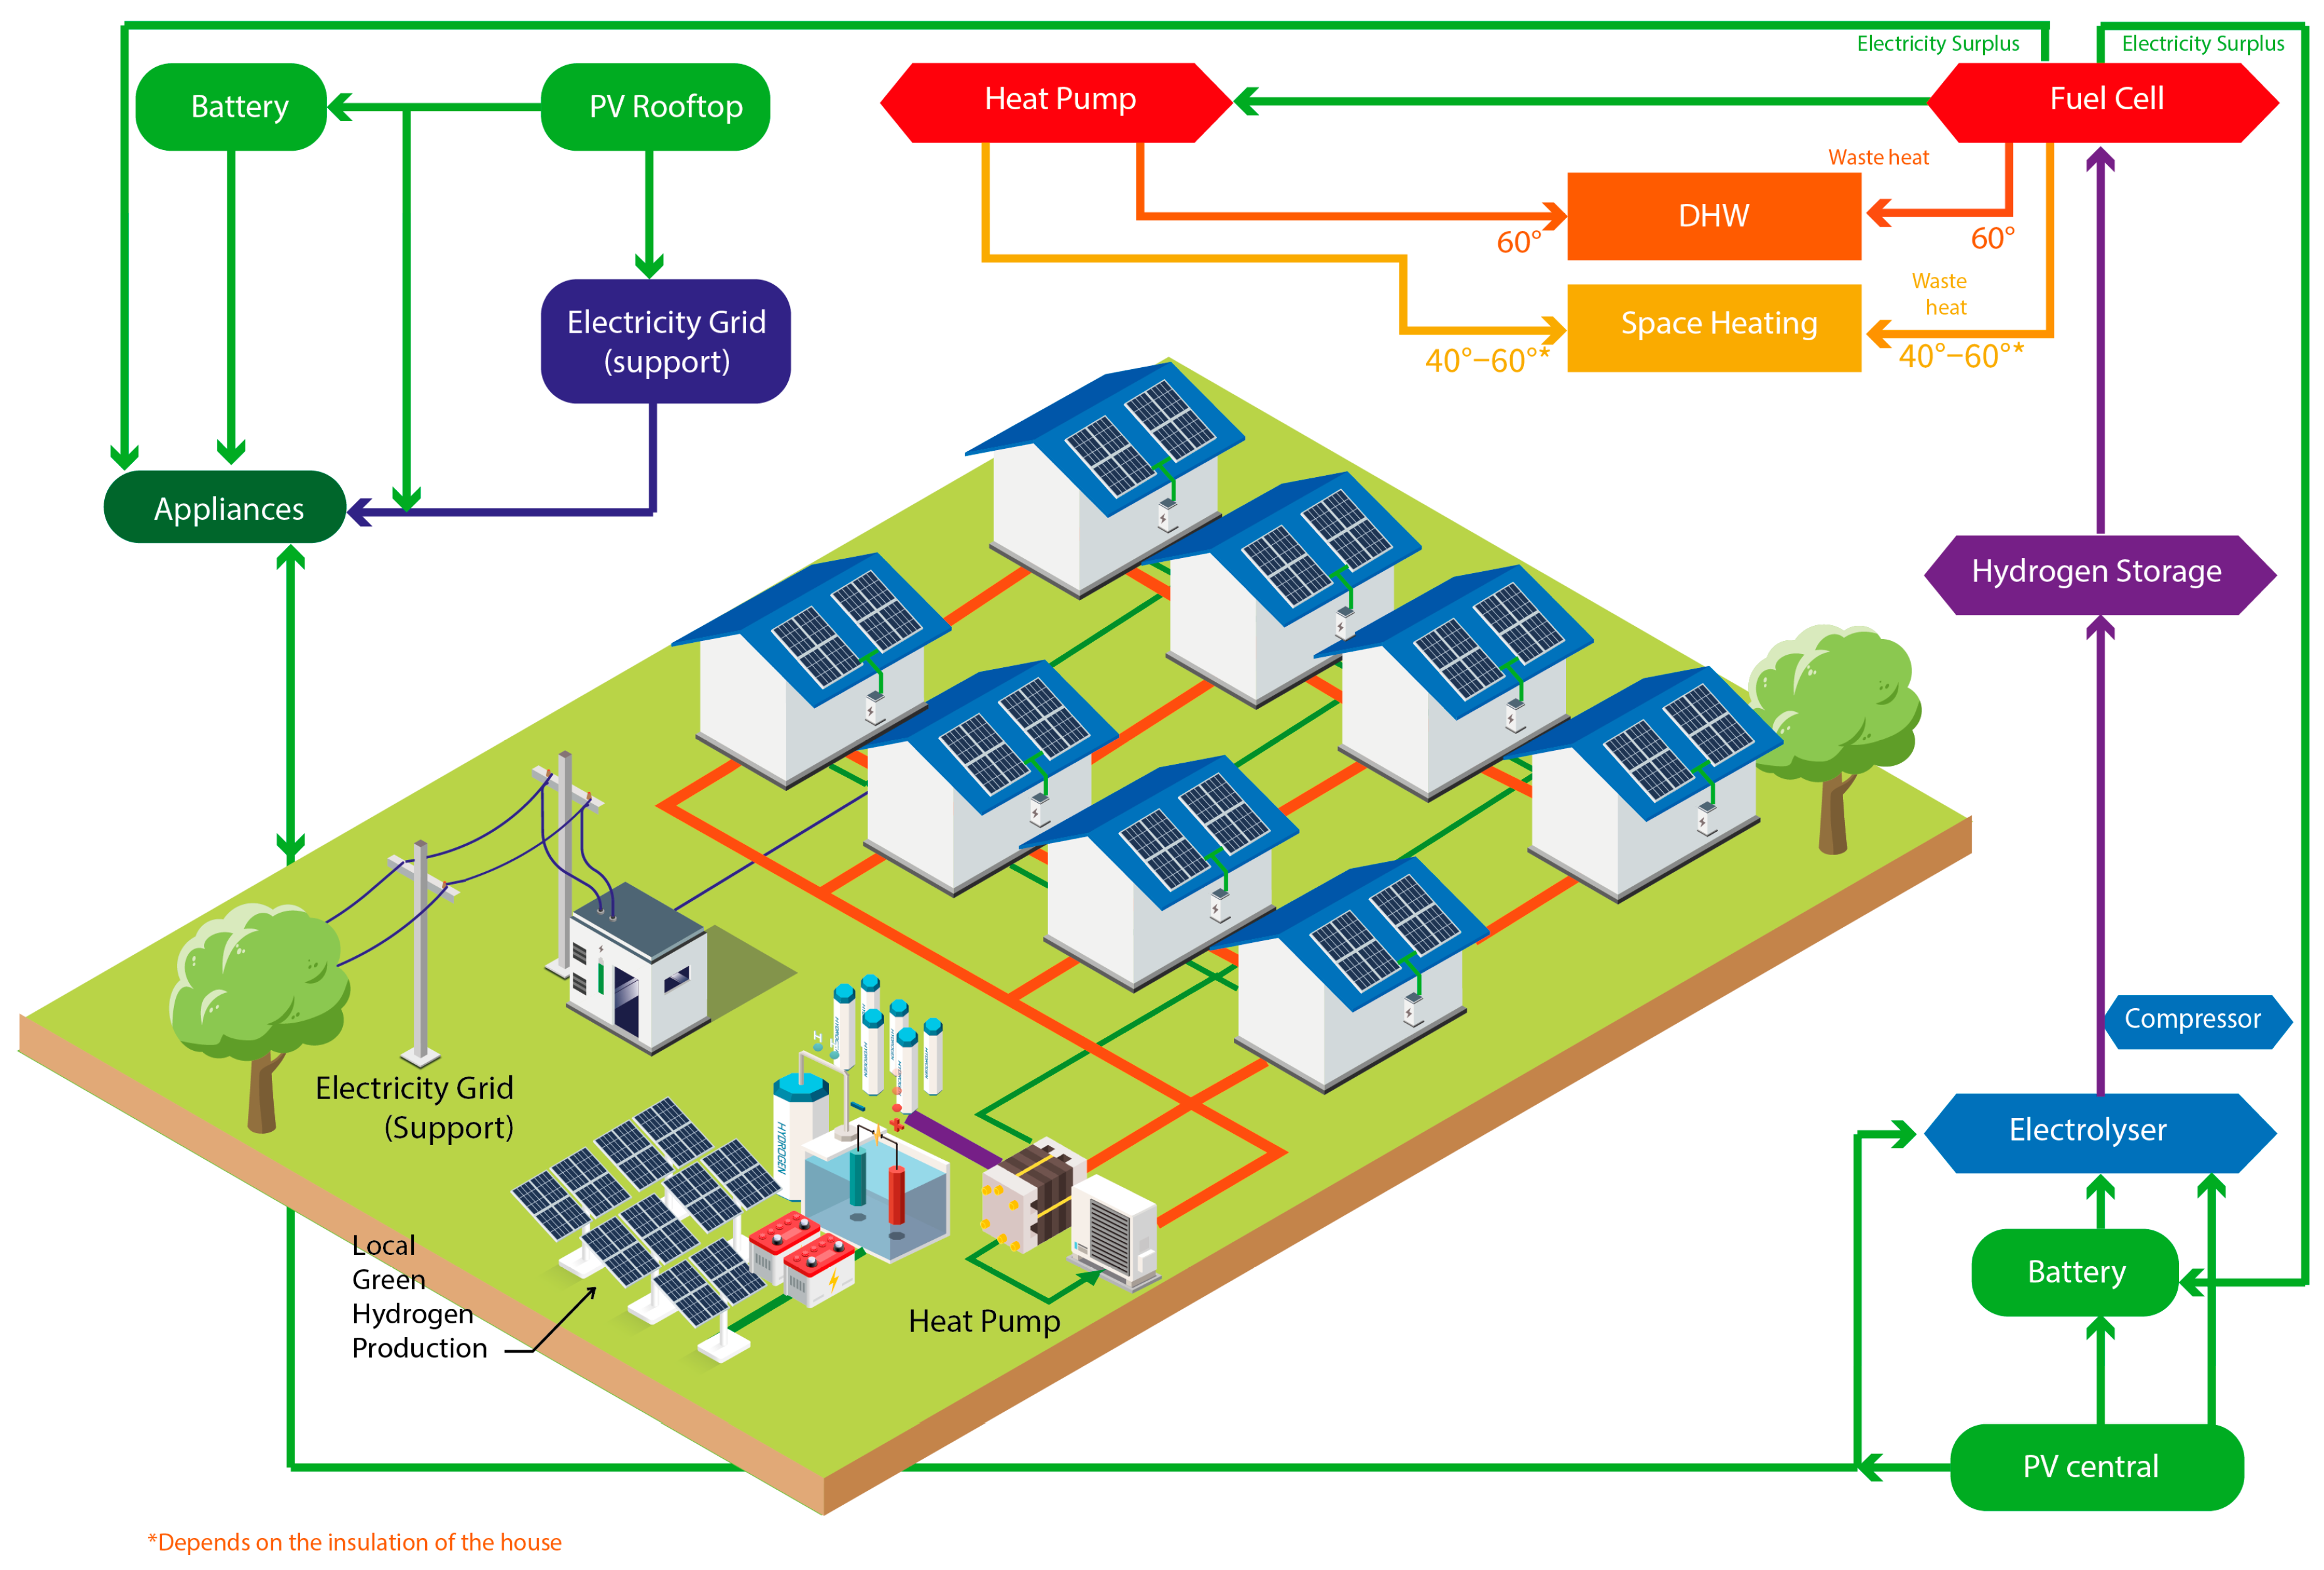
In this scenario, waste heat from the fuel cell plays a pivotal role in the system. In addition to the electricity generated by the system, the waste heat, which can reach a temperature range of 40 to 60 degrees Celsius, is utilized for fulfilling the heating demand for both space heating and domestic hot water. However, in reality, this system is categorized as an inefficient system, falling below the classification of an energy-efficient system. It provides a complex setup, which utilizes only waste heat from the fuel cell; however, in reality, it requires more heat to cover the demands. Therefore, more energy is needed, and the system becomes inefficient. However, despite producing waste heat, the fuel cell also produces electricity, which has an efficiency of almost 60%. Its production of electricity surpasses the demand and allows the surplus electricity to be reused in the production of green hydrogen. Consequently, with electricity generated through fuel cells, installations of photovoltaic rooftops are no longer needed, as the electricity produced can aptly satisfy the energy demand for various appliances.
However, there is room for improvement, considering the high energy consumption of approximately 2086 MWh required for green hydrogen production, far exceeding the heating demand of 406 MWh. Consistent operation of the fuel cells to meet the heating demand results in an overall system efficiency of only 24%, highlighting the need for further enhancements, as elucidated in Table 15.
This innovative system harnesses the potential of waste heat as a valuable energy source. By efficiently repurposing the waste heat from the fuel cells to meet the heating demand, this system is committed to sustainable energy solutions. Nevertheless, the inherent complexity of this setup underlines the need for strategic improvements, particularly in light of the high energy consumption required for green hydrogen production. Figure 16 depicts a visual representation of the energy system’s cyclical process, emphasizing the pivotal role of fuel cells in this multifaceted energy ecosystem.
This setup produces both electricity and heat using hydrogen fuel cells, powered by green hydrogen from PV electrolysis, where the hydrogen demand is about 526.22 MWh with an estimated operational CO2 emission of zero due to its energy source. However, to consider that the system efficiency in this scenario is low, the long-term strategy must be improved, including adding energy storage and grid independence.
Scenario 6. 
Hydrogen Hybrid Heat Pump System
Power Source: Photovoltaic, Electricity Grid
Energy Source: Hydrogen gas grid with Hydrogen boiler, and fuel cell
  • Space Heating: Heat Pump, Fuel Cell
  • Domestic Hot Water: Hydrogen gas grid with hydrogen boiler
Storage: Hydrogen Storage and Battery
This innovative system needs a reduced amount of hydrogen to fulfill the heating demand. The hydrogen is green, as it is generated from a solar-powered energy source. In this scenario, as shown in Figure 17, an air-source heat pump is used to complement the utilization of hydrogen fuel cells. This heat pump will further optimize system efficiency by recovering heat from the air source for heating purposes. This scenario does have promising outcomes, with the heat pump contributing 248.8 MWh of the total heating demand of 406 MWh. This reflects a relatively efficient system, boasting an impressive overall efficiency of 163%. Nonetheless, this system can still be further improved, since the heat pump operates continuously and relies heavily on electricity from the fuel cells. To maximize energy efficiency, it is highly advised to implement a control system that enables the heat pump to work directly from the solar panels, especially during sunny weather. This enhancement can lead to reduced energy consumption, thereby improving system sustainability.
In this context, the heat pump contributes significantly to reducing the heating demand, as it works synergistically with the fuel cells to produce electricity. The electricity demand for the heat pump is not only channeled through direct solar power source. This means that this renewable energy source can minimize the system’s dependency on fuel or the electrical grid. Additionally, seasonal storage for peak demand can also be achieved by utilizing this hydrogen source. This explains how this system has an outstanding efficiency of 163%. However, there is compelling potential for further improvements to this system to address the heat pump’s continuous operation and refining its control system to prioritize solar-generated electricity during sunny periods. This strategic adjustment not only benefits its energy efficiency but also strengthens the resilience and sustainability of this system, aligning it closely with environmentally conscious goals.
In this system, a hybrid hydrogen heat pump configuration is used, incorporating a peak-shaving strategy during winter months. Assuming a 50/50 energy split between hydrogen and electricity—both sourced from local photovoltaic systems—the system can operate with zero direct carbon emissions. However, it is important to note that any grid electricity used as a backup for the heat pump could introduce additional emissions of 0.233 kg CO2 per kWh [36]. Overall, this hybrid approach combines the high efficiency of heat pumps with the seasonal flexibility of hydrogen storage, making it a resilient and low-emission solution for fluctuating energy demand. Figure 18 depicts a visual representation of the energy system’s cyclical process, emphasizing the pivotal role of fuel cells in the scenario 6.

4. Discussion

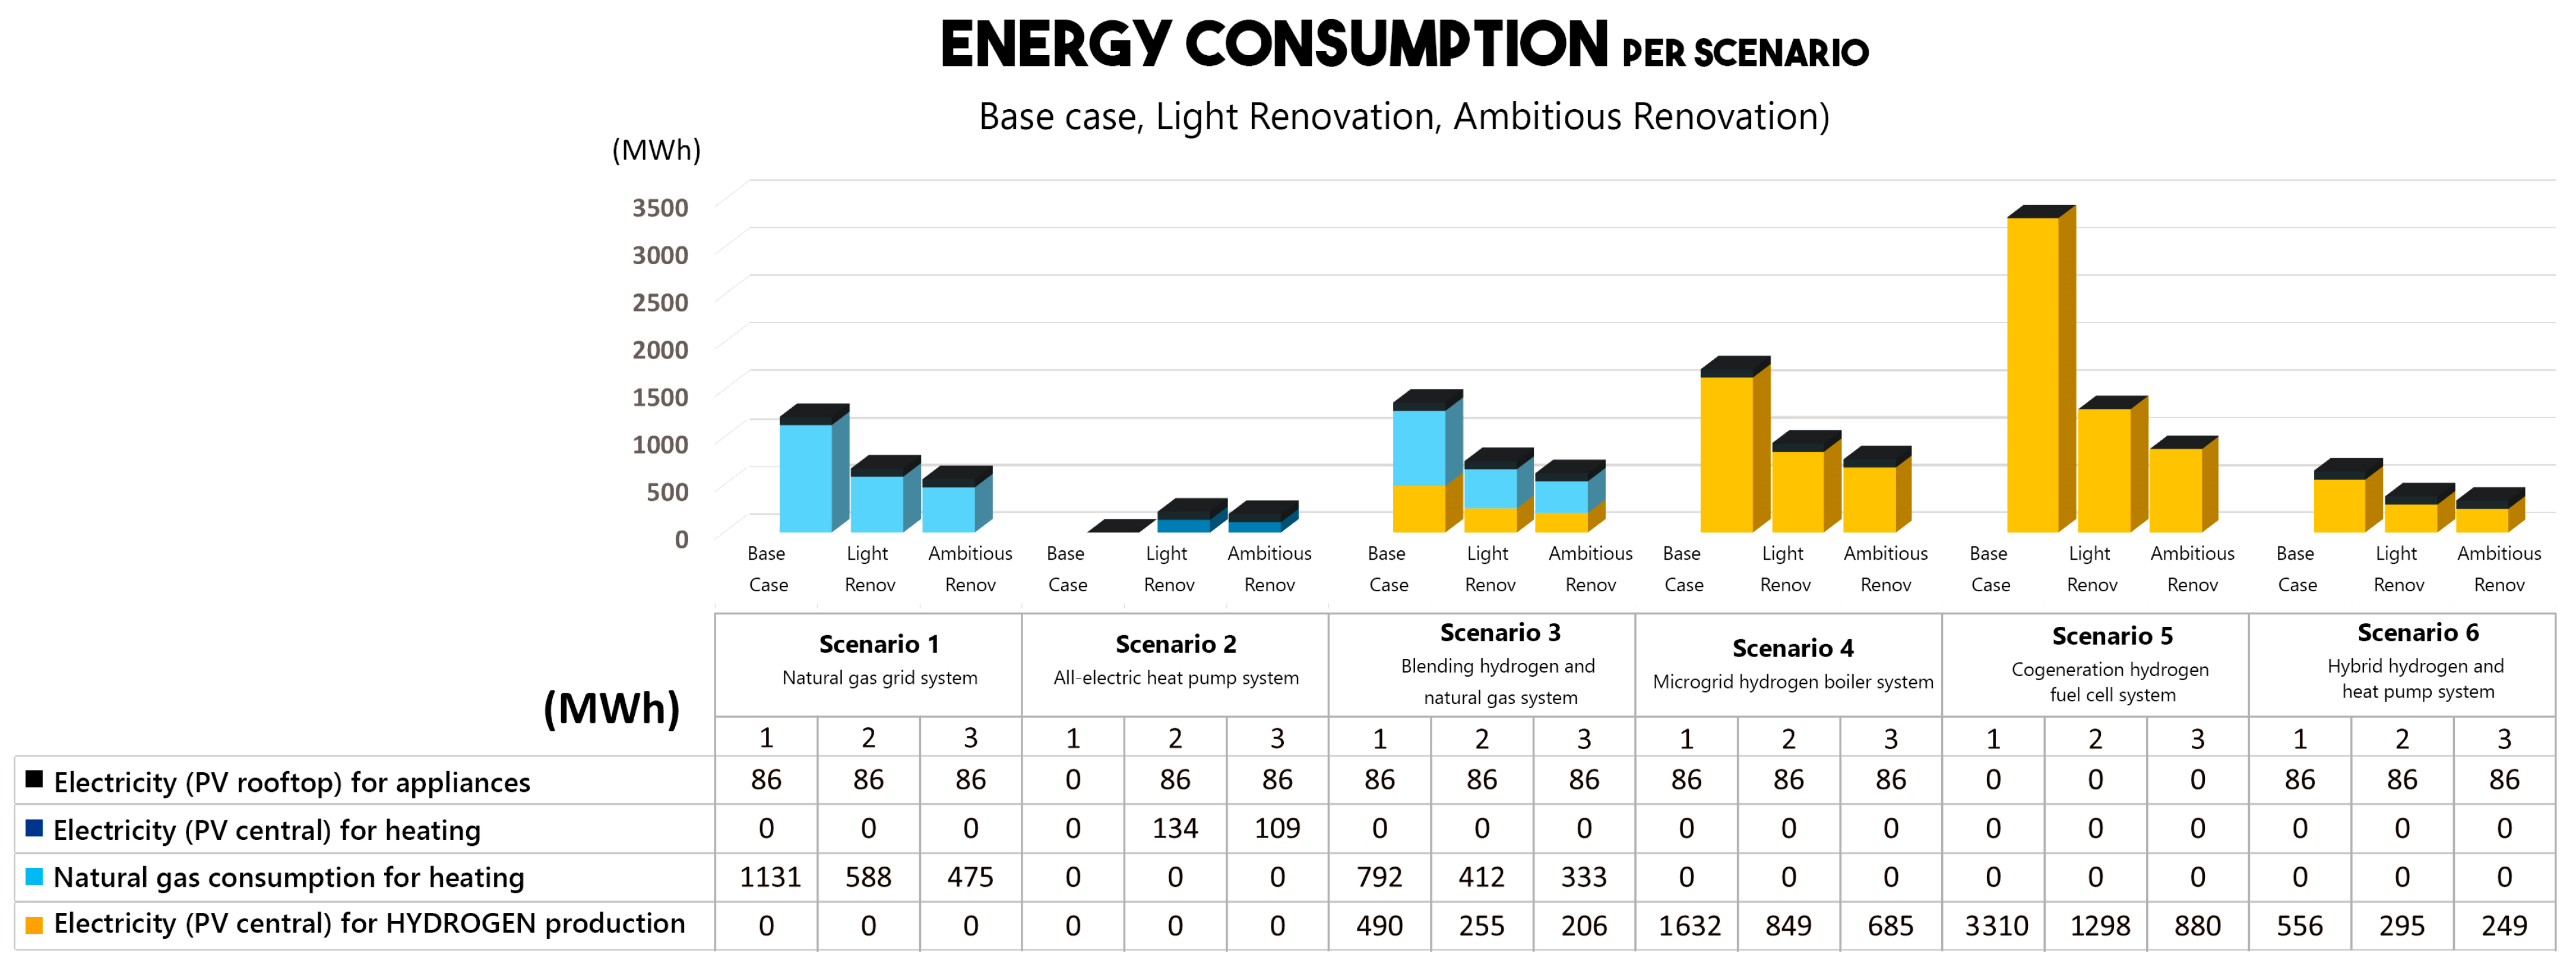
This study sets out a comparison of promising prospects of various integrated hydrogen systems for buildings within the area of the Stoke-on-Trent neighborhood, as demonstrated in Figure 19. The Electric Heat Pump System in Scenario 2 is considered the most efficient system with the lowest energy consumption, compared to the other alternatives. However, among other hydrogen solutions, the Hydrogen Hybrid Heat Pump System in Scenario 6 exhibits an outstanding result as the most efficient system, with the outcome of nearly half that of the Base Case scenario (Scenario 1: Natural Gas Grid System), with the effective use of fuel cell products due to its complete functionality. The waste heat generated by the fuel cells can still be utilized to meet the low temperature heating demand for space heating purposes. Therefore, the electricity produced is intended for domestic appliances. Eventually, there is no unused waste produced by the fuel cells, and the heat pump can help reduce the energy consumption in this system. As a result, the overall efficiency of this system reaches 163%. Nevertheless, Scenario 2, which relies solely on a heat pump still produces twice the system efficiency, at about 360%.
The lowest performance is demonstrated in Scenario 5, the Cogeneration Hydrogen Fuel Cell System, which is considered inefficient because it only contributes 24% of the overall system efficiency. This may be because the energy used in this system is generated solely by the waste heat from fuel cells, which may not be able to meet the heating demand of the buildings, thus requiring more energy to be generated to fulfil the heating demand in this system.
The other hydrogen system scenarios, e.g., Scenario 4 (Hydrogen Microgrid Boiler System) and Scenario 3 (Natural Gas and Hydrogen Blended System), have moderate energy consumption, with total efficiencies reaching 60% and 76%, respectively. However, it cannot be concluded that these specific systems lead to other hydrogen systems. So, it is crucial to consider how hydrogen is utilized and/or prioritized. This always depends on the context, region, and possible availability of hydrogen sources. If the city has a sufficient supply of hydrogen, the use of a hydrogen grid in the system is preferable. From these findings of system efficiency, Scenario 5, which relies solely on fuel cells, may not be feasible for application in buildings due to the limited effectiveness and complexity of the system. These limitations lead to a high primary energy demand, which results in increased energy consumption and low energy performance. Hence, an increase in capital costs may also occur. Furthermore, it is important to note that the conventional natural gas infrastructure in Scenario 3 will be phased out over several years as a result of current governmental policies. Therefore, Scenario 3 can only be implemented during the transition period and will be replaced gradually by Scenario 4.

4.1. Long-Term Heating Strategies and Hydrogen Forecast in 2030

The momentum behind hydrogen is strong. Nine countries, including the UK—accounting for around 30% of emissions in the global energy sector today—have released their national strategies in 2021–2022 [33]. The announcements of new projects and pilot projects for hydrogen in domestic applications are in abundance; however, only 5% of them have taken firm investment decisions due to uncertainties around the future evolution of demand. There is a lack of clarity about regulations and infrastructure available to deliver hydrogen to end users. Despite these uncertainties of hydrogen deployment plans, the future availability of hydrogen by 2030 needs to be addressed. Clear policy targets are strongly needed to send out appropriate signals to consumers and market actors.
The projection of the Net Zero Energy scenario requires the sales of fossil fuel to be shifted gradually along with the improvement of hydrogen deployments in the UK, especially within the neighborhood in Stoke-on-Trent. Strategies related to the specific utilization of hydrogen for domestic needs may consider how it should be prioritized, regarding the high investment costs the market demands. This condition may not be applied in scenarios where there is an increase in hydrogen supply as a result of a decrease in hydrogen production costs and a simultaneous rise in demand.
Since heat pumps are found to occupy the highest performance and obtain support from the government, the production of heat pumps is expected to increase from 55,000 in 2021 to 600,000 by 2028. This proves that an all-electric heat pump system is still regarded as an excellent option and has the potential to be developed further, as it has been found to be more efficient than the other heating systems. Therefore, the government is advised to prioritize removing significant barriers to its implementation, including significant high upfront costs compared to gas boilers. Expansion of the use of heat pumps throughout the UK, along with clear training and reskilling strategies, are also necessary to support the transition to low-carbon heating.
Despite various advancements of hydrogen technologies, the window of opportunity for a rapid transition to adjusting to a net zero-emission energy system is narrowing. Numerous studies are currently assuming that the next step will be taken due to the substantial growth of hydrogen, although it is still considered inefficient and full of complexity. However, hydrogen will not play a big role in the heating systems of buildings and neighborhoods before 2030 [5]. In the meantime, the government may push the transition of blending hydrogen into the existing system and making it available to support the transition before it is fully deployed into hydrogen boilers by also considering grid installment upgrades. It is predicted that by 2030 onwards, green hydrogen will be produced in larger scales due to increasing industrial and transportation applications, and it will then become more cost-effective in the built environment. The use of hydrogen boilers is beneficial when low-temperature heating is not available or when all-electric heating is not possible. Yet, when low-temperature heating is available, the all-electric heating system, which covers the largest heating demand in domestic environments is still more preferrable.
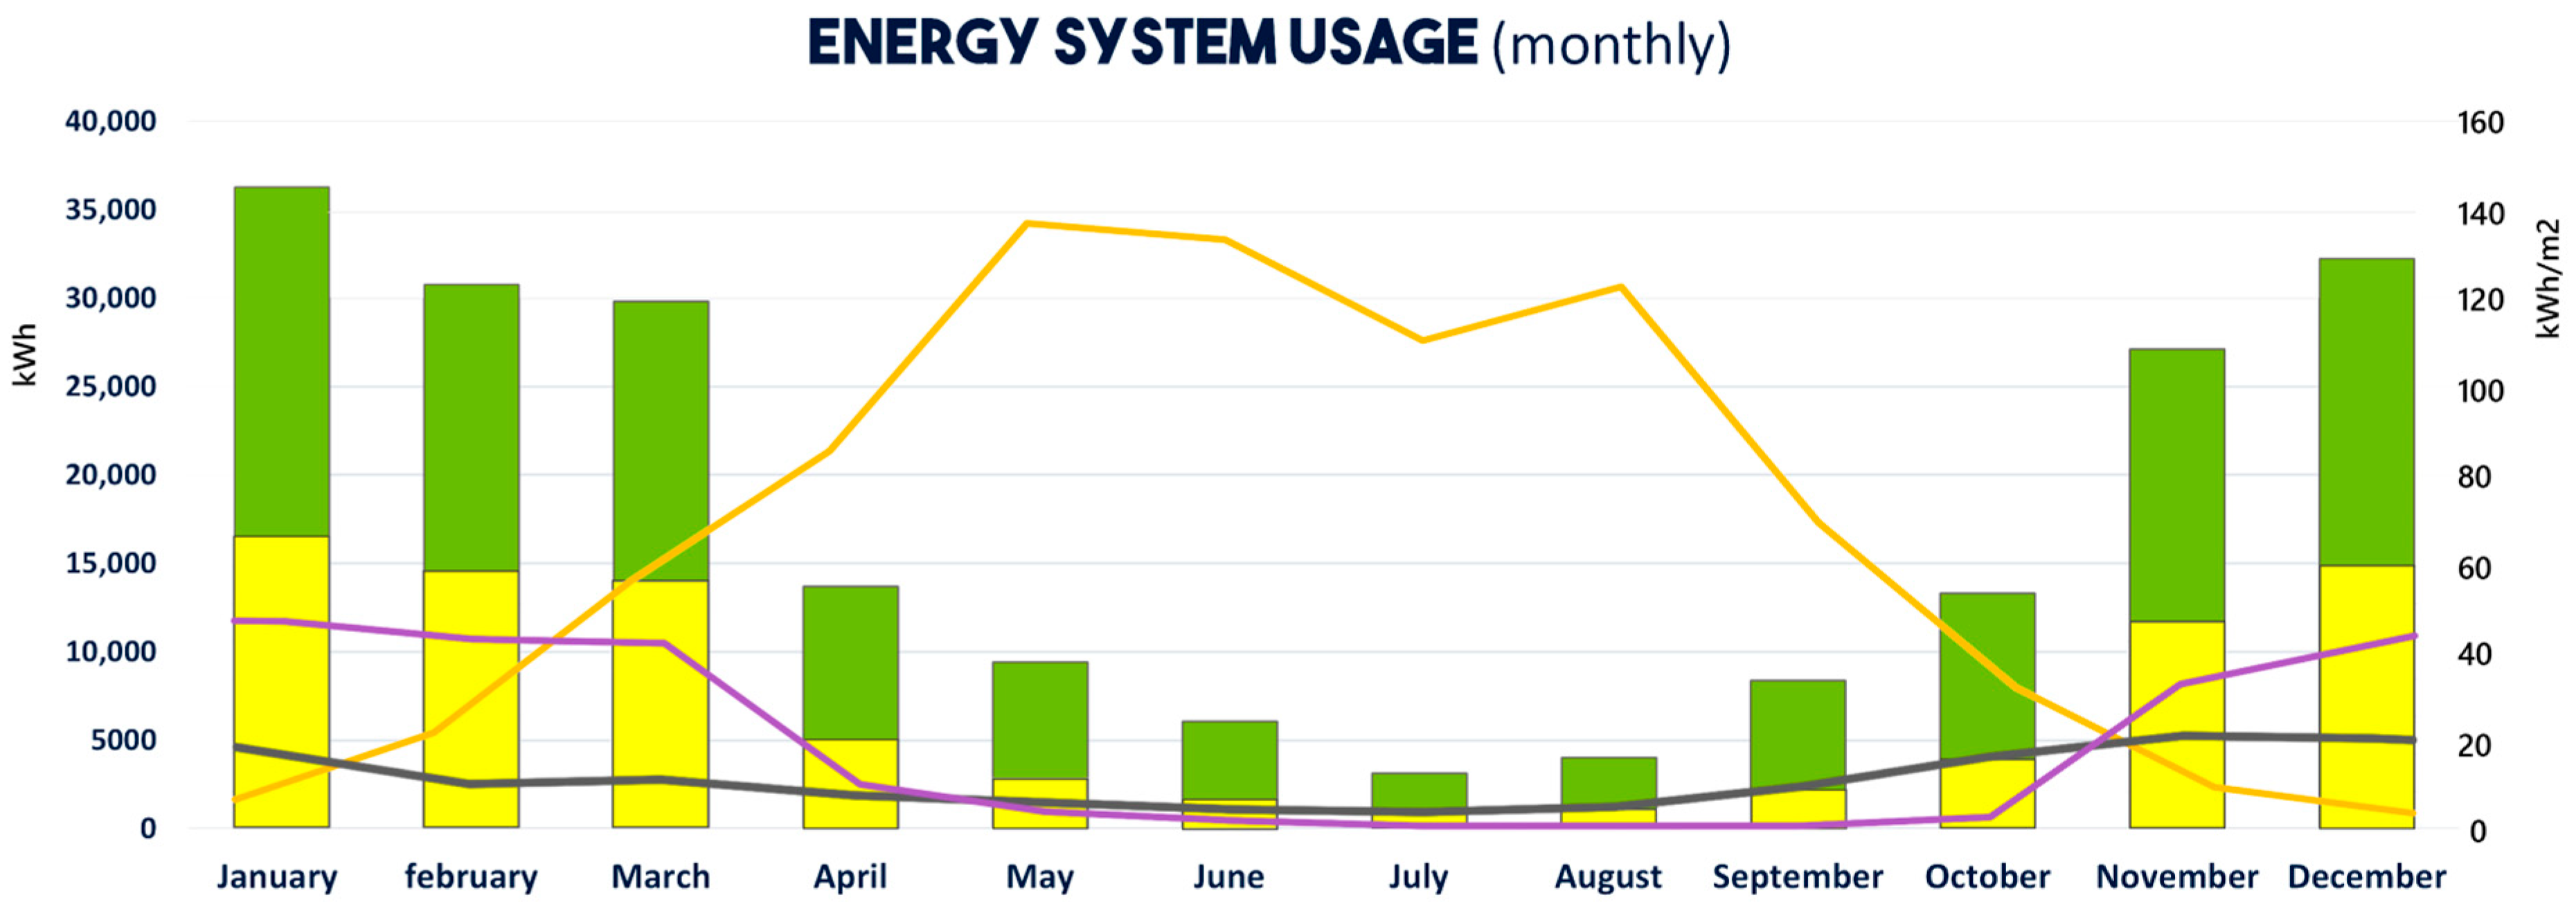
Integrating Combined Heat and Power (CHP) in the heating system for buildings is particularly interesting. While fuel cells only produce a sixth of the total energy, with the addition of heat pumps they will be able to meet larger heating demand with low energy consumption. This may be efficient if hydrogen production is not limited. However, the fact is that the solar yield in Stoke-on-Trent is extremely low during winter. In December, for instance, with 950 square meters of PV panels, there is a mismatch between the heating demand and the energy production; PV panels only produce 5645 kWh, whereas the heating demand reaches 29,072 kWh. This is where hydrogen can play a part. As long as the heat pumps are still potentially applicable while electricity is supplied, they can be prioritized as the heating system. When the energy demand reaches its peak, hydrogen fuel cells will play a role in meeting the demand, ultimately saving the use of hydrogen and the production of energy. This system will also be especially useful in areas with a considerable distance from the electrical grid. This can also be seen from the utilization of hydrogen in new neighborhoods that have the potential for a local green hydrogen production.

4.2. Safety Considerations in Hydrogen Integration for Buildings

The integration of hydrogen into residential energy systems presents a distinct set of safety challenges that must be addressed to ensure both public acceptance and technical viability. Unlike conventional fuels, hydrogen possesses unique properties that can elevate safety risks if not properly managed. Its wide flammability range (4–75% in air), low ignition energy, high flame speed, and small molecular size make it more prone to leakage and ignition compared to natural gas [37,38]. Furthermore, hydrogen is colorless, odorless, and non-toxic, complicating leak detection in indoor environments.
These risks vary in degree across the six energy system scenarios examined in this study:
  • In Scenario 1 (Natural Gas Grid) and Scenario 2 (All-Electric Heat Pump),
    hydrogen is not used directly; therefore, safety concerns are limited to conventional gas and electrical standards.
  • In Scenario 3 (Natural Gas and Hydrogen Blend),
    hydrogen is introduced into the existing gas network up to safe limits (typically <20% by volume). While this approach reduces carbon emissions with minimal infrastructure change, it still necessitates upgraded sensors, pressure regulators, and blend control systems.
  • In Scenario 4 (Hydrogen Microgrid Boiler) and Scenario 5 (Hydrogen Fuel Cell System),
    hydrogen is used at higher concentrations or in pure form. These systems require upgraded pipe materials resistant to hydrogen embrittlement, the integration of flame arrestors, and continuous leak monitoring with automatic shut-off mechanisms.
  • In Scenario 6 (Hybrid Hydrogen Heat Pump),
    operational complexity is introduced, but it allows for modular risk control, using hydrogen only during peak demand and reducing the need for constant high-pressure storage.
    To mitigate these risks, a combination of technical measures, building design adaptations, and regulatory frameworks is required [37,38]. Recent pilot programs based on standardization, such as Hy4Heat and HyDeploy in the UK, have demonstrated that domestic hydrogen systems can be operated safely with the following:
    • Advanced hydrogen leak detectors;
    • Proper ventilation design;
    • Use of explosion-proof materials and fittings;
    • Safety shut-off valves integrated into smart control systems;
    • Updated appliances certified for hydrogen operation (e.g., hydrogen-ready boilers).
At the regulatory level, adherence to international standards such as ISO/TR 15916:2015 [37], NFPA 2 (Hydrogen Technologies Code), and evolving British gas safety guidelines is essential. These codes provide frameworks for installation, operation, and maintenance to reduce the likelihood and impact of hydrogen-related incidents.
Finally, public awareness and professional training will be key to widespread adoption. Safety concerns—real or perceived—must be proactively addressed through education, transparent risk assessments, and performance benchmarking against conventional systems.
By incorporating safety considerations into the energy system planning and scenario evaluation, this study highlights that hydrogen can be deployed in buildings safely and responsibly, provided that proper standards and technologies are in place. This strengthens the feasibility of hydrogen as a low-carbon alternative in residential heating and energy systems and adds a critical dimension to evaluating its overall sustainability.

4.3. Hydrogen as a Peak Shaver (System Optimized in Hybrid Hydrogen and Heat Pump)

Hydrogen, when utilized as a peak shaver, offers significant value in improving the overall efficiency of energy systems, particularly in addressing seasonal variations in energy production and demand. This configuration proves advantageous in maximizing the utilization of the heat pump, known for its ability to minimize energy consumption. In the context of this hybrid hydrogen and heat pump system, the utilization of a controller is essential for establishing a schedule that not only preserves the existing workflow but also leverages the advantages of a smart integrated building system. This ensures that energy resources are optimally managed and that the system operates efficiently while adapting to changing environmental conditions and demands.
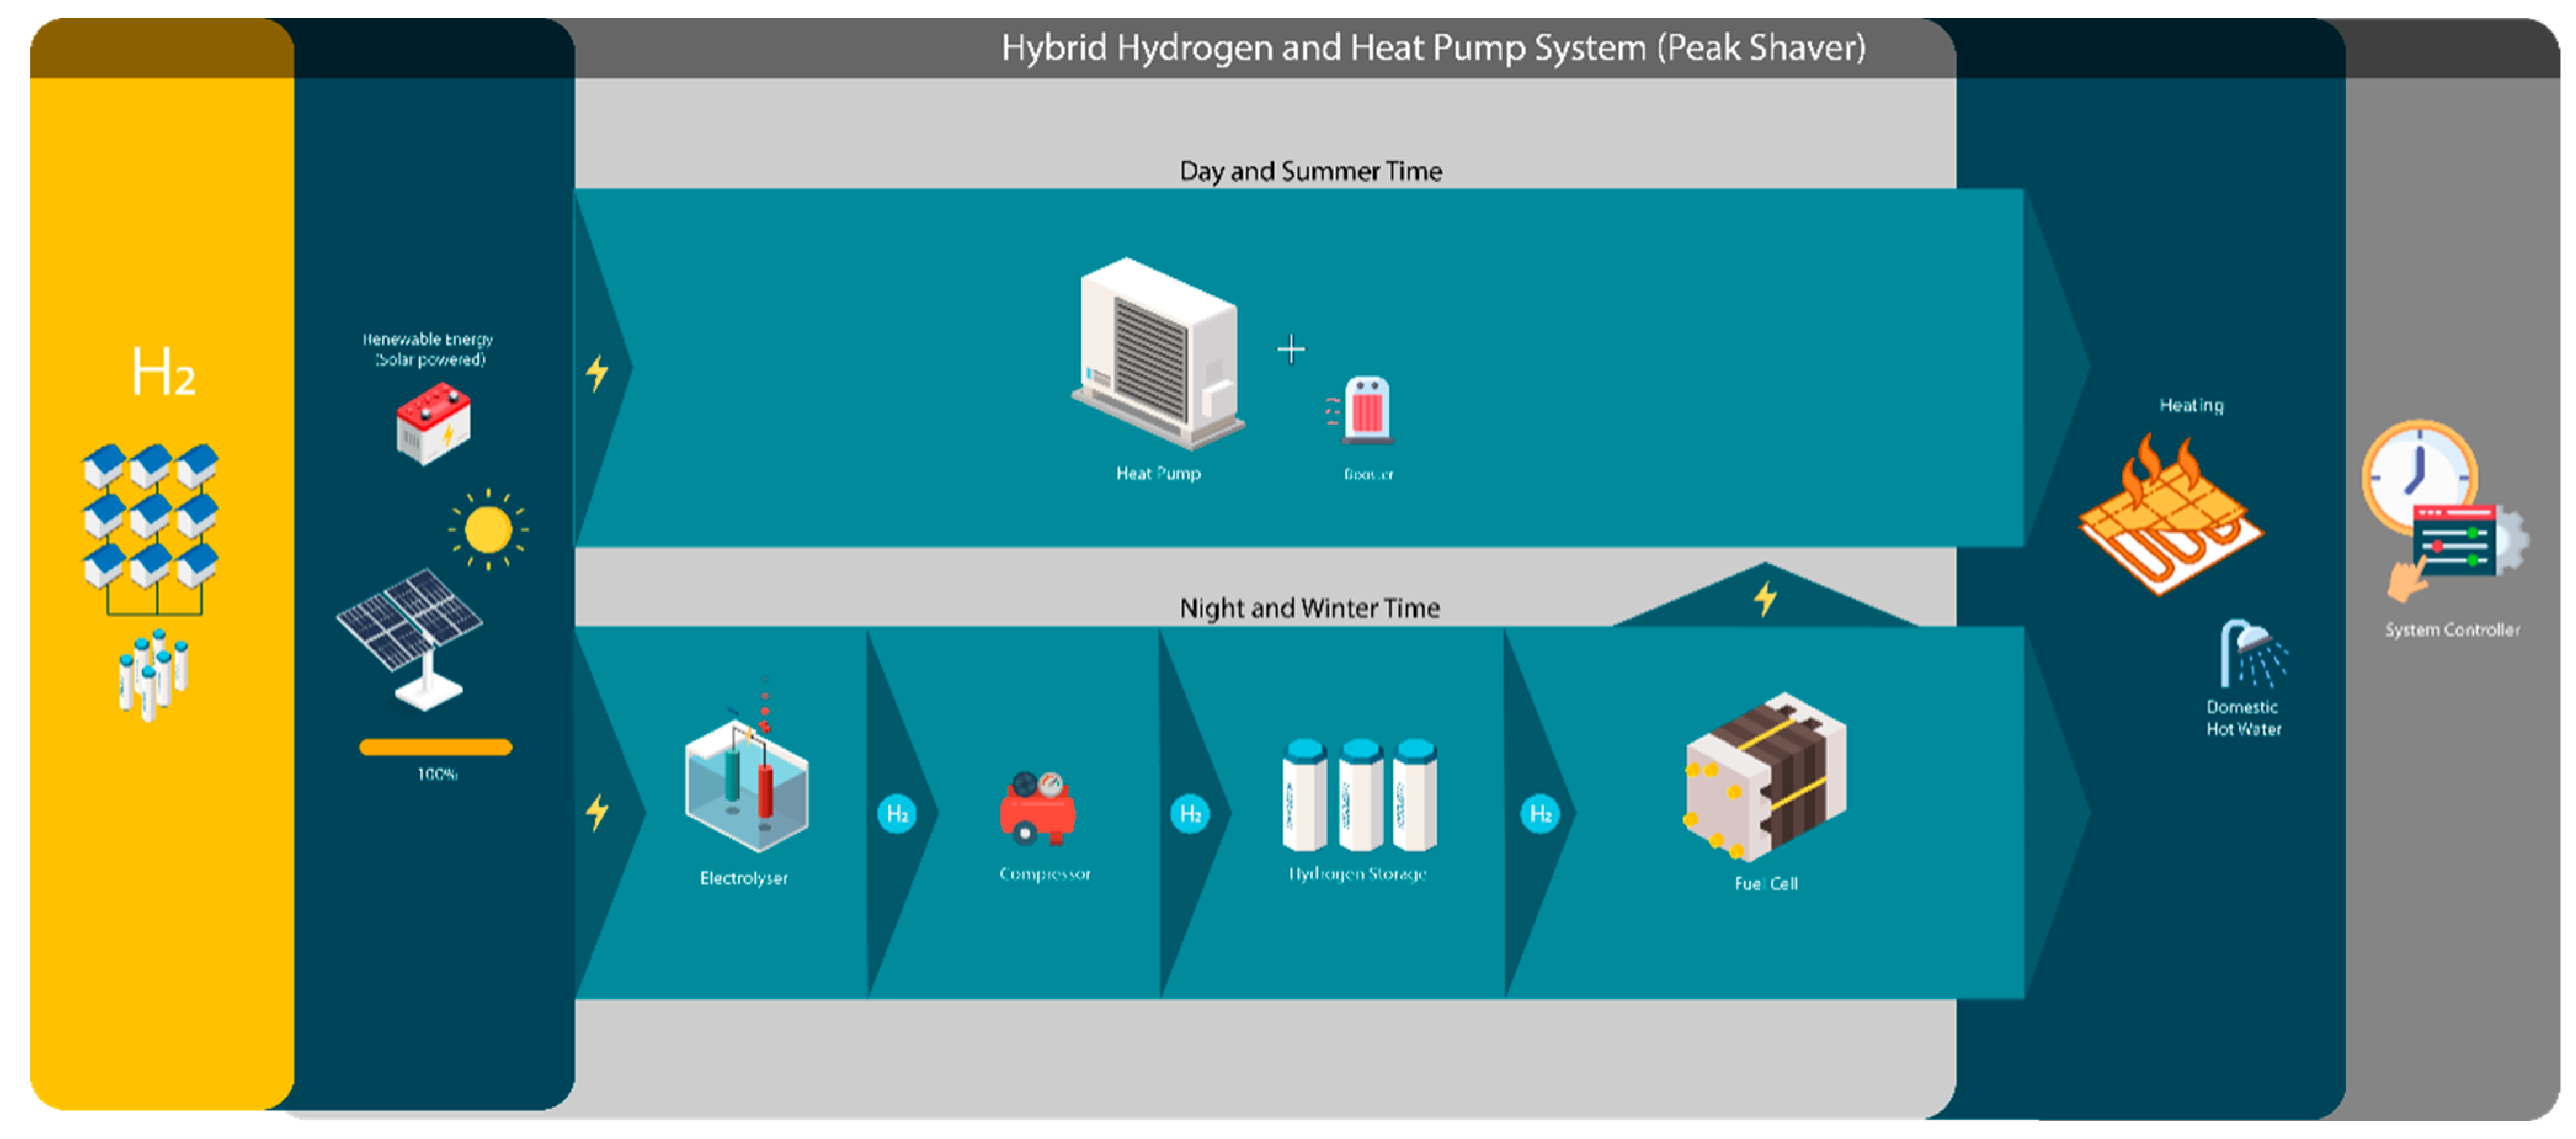
Figure 20 outlines how this system works, including the conditions where each appliance is activated and operated efficiently. A heat pump is an energy-efficient device that transfers heat from lower-temperature sources to higher-temperature space. In this study, an air source heat pump, which can provide both heating and cooling by reversing its operation, is utilized. Additionally, hydrogen is used in this system as an energy carrier and storage. During periods of low energy demand, surplus electricity is used to electrolyze water and produce hydrogen, which is then stored for later use. Meanwhile, fuel cells function to produce electricity with a certain amount of waste heat produced. When the electricity is produced, the heat pump will convert it to heating for efficient energy consumption. In this system, however, the heat pump is activated regularly with the hydrogen energy. This will consume a high amount of hydrogen, thus requiring more storage. The following is how the peak shaver scenario works. During low heating demand, the heat pump operates directly using electricity from the grid or other renewable sources. This is the most energy-efficient mode of this system. Surplus electricity generated from renewable sources (solar power) can be used to electrolyze water to produce hydrogen, which will later be stored to serve as an energy reservoir.
When there is an increased load in energy demand or during peak periods, the system switches to stored hydrogen as the primary energy source. The stored hydrogen is converted back to electricity through a fuel cell. This electricity is then used to power the heat pump to meet the increased heating demand. This will allow the system to avoid drawing additional power from the grid during peak demand, thereby reducing the strain on the grid and potentially avoiding higher electricity costs during peak hours. This peak shaver can be used to control the flow of energy between the heat pump, the hydrogen fuel cell, and the thermal storage system, ensuring that the system is operating efficiently and that the peak demand of electricity is reduced. The use of a peak shaver in a hybrid hydrogen and heat pump system can be beneficial for both the grid and the environment. Some benefits of this system are as follows:
  • Decreased peak demand for electricity. This can help to reduce the need for new power plants or solar panels and decrease the capital costs of the system.
  • Increased system efficiency. The heat pump can operate more efficiently when the demand is lower.
Overall, the use of a peak shaver in a hybrid hydrogen and heat pump system can be a way to improve the efficiency and sustainability of the domestic energy system.

4.4. Annual Set up of Hybrid Hydrogen and Heat Pump System

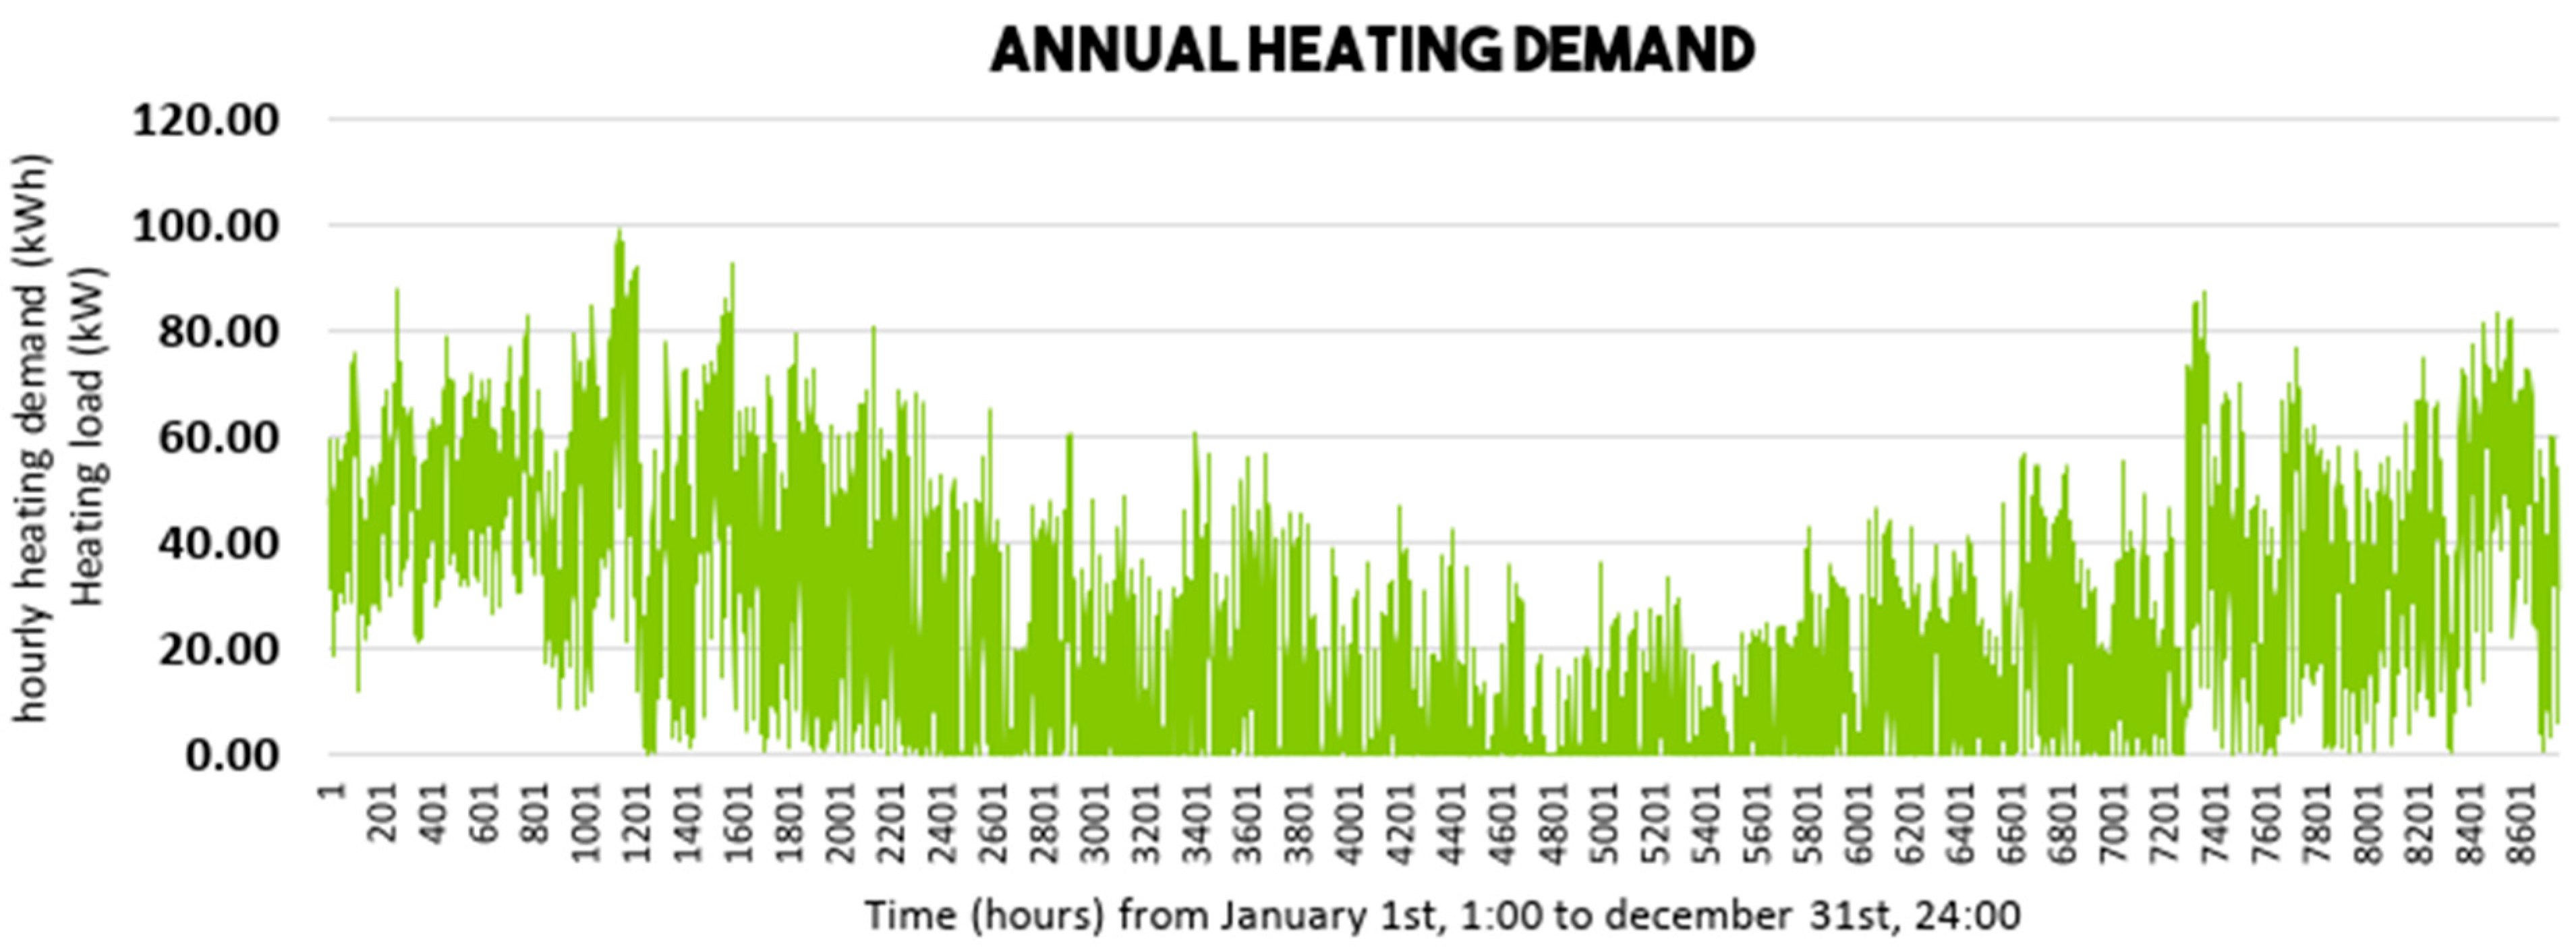
Understanding the hourly energy demand enables the system to allocate energy resources effectively. Analyzing these data, also provides insights into specific hours or seasons that peak or fall, guiding the selection of the most suitable energy source of heating, whether from hydrogen or a heat pump. Figure 21 presents the energy demand model for 25 houses, revealing that during the period between hour 3800 and 6400, roughly spanning mid-May to mid-September, the energy demand remains relatively low. Interestingly, the result of some heating demands during that period still exist, although in the summer days. Upon closer examination of the model, the excel model is apparently in simplified simulation where the result appears overestimated.
In this study, the system is controlled to respond to the specific environmental conditions, including temperature, solar radiation, and peak hours. These factors are critical in determining an optimal operational schedule that ensures its performance and efficiency. Solar radiation data, in particular, play a central role in determining the availability of sunlight. Figure 22 provides a visual representation of solar radiation. Indicating that sun consistently rises throughout the year by various amounts from 20 to 1000 during its peak in warm days. Data are retrieved from PVGIS, even though specific weather variations are shown, which may cause different results in the graphic. It is explained that during the day in winter, the solar radiation is relatively low and during summer it reaches its higher amounts.
With the implementation of this control system, the overall system efficiency has been greatly improved, resulting in a remarkable 191% of energy consumption. Figure 23 illustrates the annual energy consumption for both configuration of a heat pump and hydrogen. It is evident that, despite the high energy demand demonstrated in Figure 21, even during summer or winter the control system effectively curbs energy usage, preventing the excess use of energy.
Figure 24 corresponds the hourly use of a heat pump, which reaches a static capacity of 12 kW, but is maintained at a lower demand level. Furthermore, this usage remains consistent daily, except during the summer season when it is intelligently controlled to minimize energy use. The detail explains the monthly set up of the control system.
As a versatile component of the system, hydrogen bridges the gap in energy supply during adverse conditions, ensuring a reliable and uninterrupted operation. It serves as a backup solution when other utilities or sources may fall short. In the subsequent explanation of how the system control operates, we will delve into the specific details of how smart integration of hydrogen and a heat pump optimizes energy efficiency and enhance overall performances.

4.5. Monthly Set up of Hybrid Hydrogen and Heat Pump System

The operational control has undergone trial and error to identify and refine the parameters that contribute to the most efficient energy consumption. As a result, the optimization eventually relies on three parameters, including air temperature, solar radiation, and peak capacity for every hour. These variables will then be adjusted and applied to the control setting. Table 16 describes the parameters that guide the control operation in a hybrid hydrogen and heat pump system.
The following steps outline how the system dynamically responds to environmental conditions and the energy demand. The system works as follows:
  • High Temperature. Firstly, when the temperature falls within the range of 18–28. 22 degrees Celsius or exceeds this range, the system ensures that the heating is completely turned off. This prevents unnecessary heating when the temperature is completely excessively hot. However, an advanced dynamic control, when the temperature exceeds this range, can also be switched to a cooling system.
  • Low-Temperature solar heating. In conditions where there is sunlight, but the temperature is relatively low, the system activates the heat pump to provide heating, along with solar energy with availability to be stored as hydrogen. This ensures energy efficiency by harnessing solar energy directly when maintaining comfort.
  • Lowest Temperature. Additionally, when there is sunlight, but the temperature is at its lowest, the system prioritizes heating via hydrogen. This method utilizes a hydrogen source to provide effective heating during extremely cold conditions.
  • Low to Average Capacity. When the heating demand ranges from zero to average heating capacity, the heat pump is activated to generate the required heating.
  • Average to Maximum Capacity. In cases where the heating demand exceeds the average capacity but remains within the maximum capacity, the system activates the hydrogen source.
  • Excess Capacity. If the energy demand exceeds the maximum average heating capacity of the system, it automatically switches to hydrogen to meet the increased demand. This prevents overloading the heat pump.
The control system dynamically adjusts between the heat pump and hydrogen sources, optimizing energy utilization. It ensures that heating demands are consistently met while minimizing energy consumption. As demonstrated in Figure 25, this adaptability showcases the system’s responsiveness to varying conditions, reinforcing its efficiency and optimization.

4.6. Daily Set up of Hybrid Hydrogen and Heat Pump System

To provide a detailed breakdown of the hourly settings for the hybrid and heat pump system, Figure 26 offers an insight into the daily configuration on 1 January. The graph illustrates the highest heating demand occurring during the early morning and evening hours. In January, with temperatures ranging from 3.02 to 9.35 degrees Celsius, heating remains active throughout the day to maintain comfort.
Furthermore, the graphic indicates that even during the winter season, solar radiation is present, as in this calculation, it is started between 12 and 3 PM, with an intensity range from 55 to 177 watts per square meter. During these hours, a low-temperature heating system, operated by the heat pump, is the most effective. However, in the peak hours of the early morning and evening, hydrogen takes over to meet the heightened demand. The more detailed setting is explained as follows:
  • Hours 0–6: Hydrogen is fully utilized as there is no solar yield during this period.
  • Hours 7–12: Increased activity during these hours results in higher hydrogen consumption, which subsequently decreases as solar radiation begins to rise.
  • Hours 13–18: Solar yield reaches its peak during this timeframe, allowing the heat pump to take the lead. Consequently, hydrogen consumption is minimized.
  • Hours 19–24: As solar yield diminishes, hydrogen is reactivated to meet the demand.
Overall, this dynamic control strategy, which alternates between heat pumps and hydrogen, proves to be cost-efficient and energy-saving. However, continued research into scheduling and other parameters remains crucial for further system improvement.

5. Conclusions

This study examined six residential energy system scenarios to assess the potential role of green hydrogen in decarbonizing building operations. While the efficiency of energy systems varies, the primary aim is not to favor a single solution but rather to explore how hydrogen can be integrated into decarbonization efforts in flexible and practical ways.
Among the hydrogen-based systems, the hybrid hydrogen heat pump configuration (Scenario 6) emerges as the most promising, which combines the high efficiency of heat pumps with the storage flexibility of hydrogen. This setup is especially effective for managing seasonal peak heating demands and offers strong potential performance throughout the year. It offers fully net zero emissions if both electricity and hydrogen energy are derived from renewable sources. However, in these cases, backup reliance on the electricity grid, which, depending on the energy mix, can lead to indirect emissions.
Although Scenario 2 is the most efficient system. By comparison, hydrogen systems can serve as a strategic complement to electrification, especially in cases where grid upgrades are not feasible or where energy storage and seasonal reliability are critical.
Regarding the long-term feasibility, hydrogen in buildings will depend on future progress in infrastructure, cost reductions, storage technologies, and the development of reliable hydrogen supply chains. In parallel with safety concerns, hydrogen’s flammability, low ignition energy, and leak risks require stringent design, detection, and compliance measures. It remains critical and there is a requirement to follow international standards.
In conclusion, hydrogen should be viewed not as a competitor to electrification, but as a strategic complement—capable of enhancing system flexibility, enabling carbon neutrality, and addressing specific gaps in the energy transition.

Author Contributions

Conceptualization, H.K.; methodology, H.K.; software, H.K.; validation, H.K., S.B. and L.I.; formal analysis, H.K.; investigation, H.K.; resources, H.K.; data curation, H.K.; writing—original draft preparation, H.K.; writing—review and editing, H.K.; visualization, H.K.; supervision, S.B., L.I. and S.M.; project administration, H.K.; funding acquisition, L.I. All authors have read and agreed to the published version of the manuscript.

Funding

This research received no external funding.

Data Availability Statement

The data supporting the findings of this study are available from the corresponding author upon reasonable request.

Conflicts of Interest

The authors declare no conflict of interest.

References

  1. Secretary of State for Business, Energy, and Industrial Strategy; UK’s Nationally Determined Contribution (NDC), ICTU. 2022. Available online: https://unfccc.int/sites/default/files/NDC/2022-09/UK%20NDC%20ICTU%202022.pdf (accessed on 3 November 2022).
  2. Holland, L. Fuel of the Future? Inside the UK’s First Hydrogen-Powered Homes. 2022. Available online: https://news.sky.com/story/fuel-of-the-future-inside-the-uks-first-hydrogen-powered-homes-12287892 (accessed on 7 December 2022).
  3. Department for Energy Security and Net Zero, HM Government. UK Hydrogen Strategy. 2021. Available online: https://assets.publishing.service.gov.uk/media/64c7e8bad8b1a70011b05e38/UK-Hydrogen-Strategy_web.pdf (accessed on 9 December 2022).
  4. Environmental and Energy Study Institute. EESI. Fossil Fuels. 2022. Available online: https://www.eesi.org/topics/fossil-fuels/description (accessed on 3 January 2023).
  5. Rongé, J.; François, I. Use of Hydrogen in Buildings; BatHyBuild Study; WaterstofNet: Turnhout, Belgium, 2021. [Google Scholar]
  6. IEA. The Future of Heat Pumps; IEA: Paris, France, 2022; Available online: https://www.iea.org/reports/the-future-of-heat-pumps (accessed on 9 December 2022).
  7. Gerhardt, N.; Bard, J.; Schmitz, R.; Beil, M.; Pfennig, M.; Kneiske, T. Hydrogen in the Energy System of the Future: Focus on Heat in Buildings; Technical Report; Fraunhofer Institute for Energy Economics and Energy System Technology (IEE): Hannover, Germany, 2020. [Google Scholar]
  8. Cebon, D. Hydrogen for Heating. 2020. Available online: https://www.csrf.ac.uk/blog/hydrogen-for-heating/ (accessed on 18 December 2022).
  9. IEA. The Future of Hydrogen; IEA: Paris, France, 2019; Available online: https://www.iea.org/reports/the-future-of-hydrogen (accessed on 19 December 2022).
  10. Northern Gas Network. 2017. Available online: https://www.northerngasnetworks.co.uk/wp-content/uploads/2017/04/H21-Executive-Summary-Interactive-PDF-July-2016-V2.pdf (accessed on 20 January 2023).
  11. Winter, C.-J. Hydrogen energy—Abundant, efficient, clean: A debate over the energy-system-of-change. Int. J. Hydrogen Energy 2009, 34, S1–S52. [Google Scholar] [CrossRef]
  12. Rosenow, J. Is heating homes with hydrogen all but a pipe dream? An evidence review. Joule 2022, 6, 2225–2228. [Google Scholar] [CrossRef]
  13. Dodd, N.; Donatello, S.; Cordella, M. Level(s) Indicator 1.1: Use Stage Energy Performance. 2021. Available online: https://susproc.jrc.ec.europa.eu/product-bureau//sites/default/files/2021-01/UM3_Indicator_1.1_v1.1_25pp.pdf (accessed on 23 January 2023).
  14. Van Gaalen, I.M.K.; Van der Linden, A.C. Building Physics, 2nd ed.; ThiemeMeulenhoff: Amersfoort, The Netherlands, 2018. [Google Scholar]
  15. Bokel, R. Building Physics Energy 01. 2021. Available online: https://www.studeersnel.nl/nl/document/technische-universiteit-delft/bucky-lab-seminars-building-physics/building-physics-lecture-notes-01-april-2016/1002329 (accessed on 25 January 2023).
  16. ARUP. Five Minutes Guide Hydrogen. Available online: https://www.arup.com/globalassets/downloads/insights/five-minute-guide-to-hydrogen.pdf (accessed on 8 March 2023).
  17. Verhelst, S.; Wallner, T. Hydrogen-fueled internal combustion engine. Prog. Energy Combust. Sci. 2009, 25, 490–527. [Google Scholar] [CrossRef]
  18. Mazloomi, K.; Gomes, C. Hydrogen as an energy carrier, prospects and challenges. Renew. Sustain. Energy Rev. 2012, 16, 3024–3033. [Google Scholar] [CrossRef]
  19. Shell Global Solutions International BV. Integrated Design for Efficient Advanced Liquefaction of Hydrogen (Idealhy). 2013. Available online: https://idealhy.eu/ (accessed on 9 June 2023).
  20. Vick, B.D. Adding concentrated solar power plants to wind farms to achieve a good quality electrical load match. Sol. Energy 2013, 92, 298–312. [Google Scholar] [CrossRef]
  21. Ananthachar, V.; Duffy, J. Efficiencies of hydrogen storage systems onboard fuel cell vehicle. Solar Energy 2005, 78, 687–694. [Google Scholar] [CrossRef]
  22. Zhou, L. Progress and problems in hydrogen storage methods. Renew. Sustain. Energy Rev. 2005, 9, 395–408. [Google Scholar] [CrossRef]
  23. International Energy Agency (IEA). Global Hydrogen Review. 2021. Available online: https://www.iea.org/reports/global-hydrogen-review-2021 (accessed on 10 June 2023).
  24. Roben, F.; Kicherer, L.; Jurgens, S.; Decher, H.; Schafers, H.; Von Dusterlho, J.E. Decarbonization of the heating sector in hamburg grid constraints, efficiency, and costs of green hydrogen vs heat pump. In Proceedings of the International Conference on the European Energy Market, EEM, IEEE Computer Society, Ljubljana, Slovenia, 13–15 September 2022; pp. 1–6. [Google Scholar] [CrossRef]
  25. Vlap, H.; Van der Steen, A. DNV GL Oil and Gas. Power-to-Gas project in Rozenburg, The Netherlands. 2015. Available online: https://projecten.topsectorenergie.nl/storage/app/uploads/public/5b7/54a/624/5b754a624582f744864490.pdf (accessed on 12 June 2023).
  26. HyNet. Cadent UK. HyNet North West Infrastructure and Technology. Available online: https://hynet.co.uk/ (accessed on 12 June 2023).
  27. Hy4heatUK. Department for Business, Energy and Industrial Strategy, BEIS. 2021. Available online: https://www.hy4heat.info/reports (accessed on 12 June 2023).
  28. 24/7 Energy Hub. TU Delft 2023. Available online: https://www.thegreenvillage.org/24-7-energy-hub/ (accessed on 12 June 2023).
  29. Stoke-on-Trent city council. Energy Master Planning Report. Energy Strategy 2023–2033. Available online: https://www.stoke.gov.uk/download/downloads/id/2440/energy_strategy_202333.pdf (accessed on 13 June 2023).
  30. Wai, C.W.; Mohammed, A.H.; Ting, L.S. Energy Management Key Practices: A proposed list for Malaysian Universities. Int. J. Energy Environ. 2011, 2, 749–760. [Google Scholar]
  31. Parameshwaran, R.; Kalaiselvam, S.; Harikrishnan, S.; Elayaperumal, A. Sustainable thermal energy storage technologies for buildings: A review. Renew. Sustain. Energy 2012, 16, 2394–2433. [Google Scholar] [CrossRef]
  32. International Energy Agency, IEA. Hydrogen. Available online: https://www.iea.org/energy-system/low-emission-fuels/hydrogen. (accessed on 2 August 2023).
  33. Energystar. Energy Star Building Manual, Heating and Cooling System Upgrades; Energy Star: Washington, DC, USA, 2001; p. 32.
  34. Hall, A.J. Domestic Heating by Gas: Boiler System Guidance for Installers and Specifiers; Energy Saving Trust: London, UK, 2008. [Google Scholar]
  35. Ferreira, A.P.R.A.; Oliveira, R.C.P.; Mateus, M.M.; Santos, D.M.F. A Review of the Use of Electrolytic Cells for Energy and Environmental Applications. Energies 2023, 16, 1593. [Google Scholar] [CrossRef]
  36. Department for Energy Security and Net Zero, HM Government. GHG Conversion Factors for Company Reporting. 2023. Available online: https://www.gov.uk/government/collections/government-conversion-factors-for-company-reporting (accessed on 3 August 2023).
  37. ISO/TR 15916:2015; Basic Considerations for the Safety of Hydrogen Systems. International Organization for Standardization: Geneva, Switzerland, 2015. Available online: https://www.iso.org/obp/ui/en/#iso:std:iso:tr:15916:ed-2:v1:en (accessed on 2 May 2025).
  38. National Fire Protection Association. NFPA 2: Hydrogen Technologies Code; NFPA: Quincy, MA, USA, 2023; Available online: https://www.nfpa.org/codes-and-standards/all-codes-and-standards/list-of-codes-and-standards/detail?code=2 (accessed on 5 May 2025).
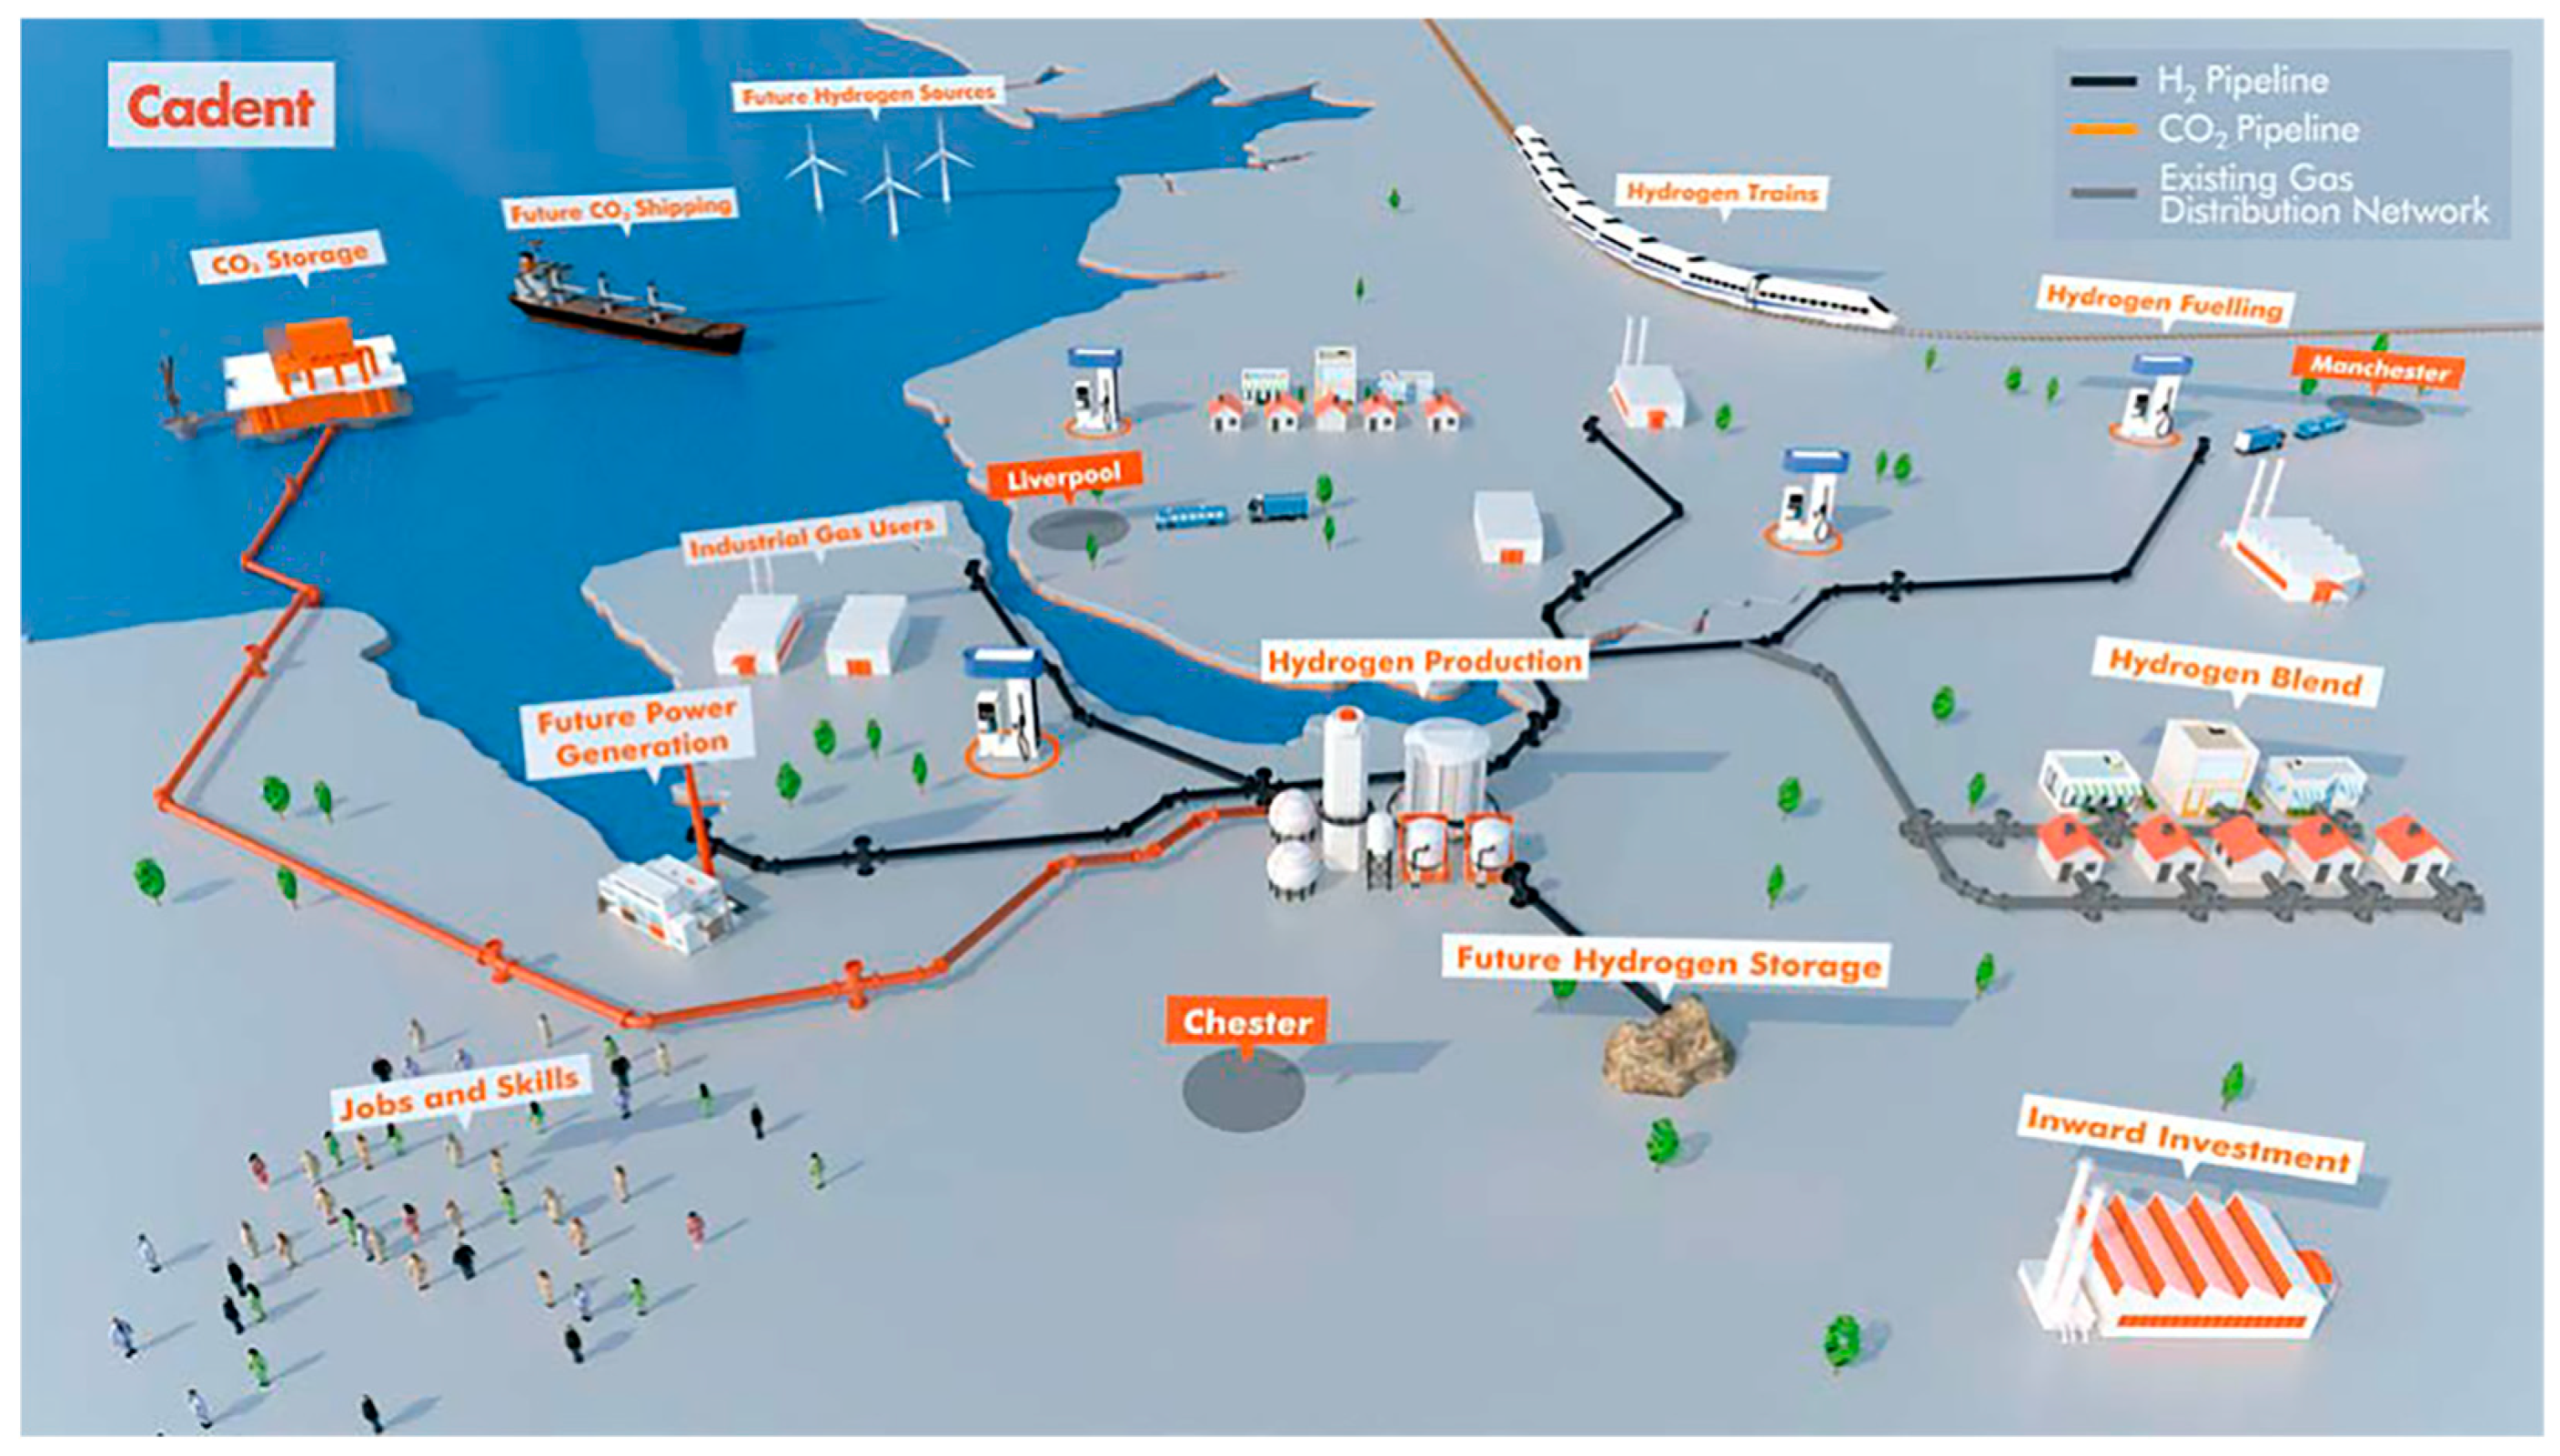
Figure 1. HyNet infographic of pipeline distribution planning in the UK. Retrieved from Cadent, HyNet. 2023.
Buildings 15 03232 g001
Figure 2. Power-to-gas production chain. Retrieved from DNV GL, Power-to-Gas project in Rozenburg, The Netherlands 2015 [25].
Buildings 15 03232 g002
Figure 3. Hydrogen energy system in a 24/7 energy lab. Retrieved from Green Village documentary (interviewed with Lidewij van Trigt).
Buildings 15 03232 g003
Figure 4. Location of the case study site in Hanley, Stoke-on-Trent, United Kingdom. The red marks indicates the selected housings were analyzed. Source: maps.google.com.
Buildings 15 03232 g004
Figure 5. Building typology classification in the neighborhood, retrieved from maps.google.com. The letters in the figures are explained on the Table 5.
Buildings 15 03232 g005
Figure 6. Total heating demand for five dwellings in Stoke-on-Trent’s building stock across three different levels of renovation with different surfaces.
Buildings 15 03232 g006
Figure 7. An illustration of the energy system design in Scenario 1: natural gas grid system (Author illustration).
Buildings 15 03232 g007
Figure 8. Energy consumption diagram of Scenario 1: natural gas grid system, utilizing light renovation (graphic illustrated by author).
Buildings 15 03232 g008
Figure 9. An illustration of the energy system design in Scenario 2: all electric heat pump system (Author illustration).
Buildings 15 03232 g009
Figure 10. Energy consumption diagram of Scenario 2: all-electric heat pump system, utilizing ambitious renovation (graphic illustrated by author).
Buildings 15 03232 g010
Figure 11. An illustration of energy system design in Scenario 3: natural gas and hydrogen blended system.
Buildings 15 03232 g011
Figure 12. Energy consumption diagram of Scenario 3: natural gas and hydrogen blended system, utilizing light renovation (graphic illustrated by Author).
Buildings 15 03232 g012
Figure 13. An illustration of energy system design in Scenario 4: microgrid hydrogen boiler system (Author illustration).
Buildings 15 03232 g013
Figure 14. Energy consumption diagram of Scenario 4: microgrid hydrogen boiler system, utilizing light renovation.
Buildings 15 03232 g014
Figure 15. An illustration of energy system design in Scenario 5: cogeneration hydrogen fuel cell system (Author illustration).
Buildings 15 03232 g015
Figure 16. Energy consumption diagram of Scenario 5: cogeneration hydrogen fuel cell system, utilizing light renovation.
Buildings 15 03232 g016
Figure 17. An illustration of energy system design for Scenario 6: hydrogen hybrid heat pump system (Author illustration).
Buildings 15 03232 g017
Figure 18. Energy consumption diagram of Scenario 6: hybrid hydrogen and heat pump system, utilizing ambitious renovation.
Buildings 15 03232 g018
Figure 19. Analysis of energy consumption in six different scenarios of energy systems (illustrated by the author).
Buildings 15 03232 g019
Figure 20. An illustration of how hybrid hydrogen and a heat pump are used as a peak shaver (illustrated by the Author).
Buildings 15 03232 g020
Figure 21. Hourly energy demand of 25 houses (one block) in 8760 h.
Buildings 15 03232 g021
Figure 22. Solar radiation throughout the year of 2021 for Hanley, Stoke-on-Trent. Data are retrieved from PVGIS.
Buildings 15 03232 g022
Figure 23. Annual energy consumption in a hybrid hydrogen and heat pump system within 25 households.
Buildings 15 03232 g023
Figure 24. Heating consumption through heat pump application in hybrid hydrogen and heat pump systems in 25 households.
Buildings 15 03232 g024
Figure 25. Hybrid hydrogen heat pump as peak shaver (graphic is illustrated by Author).
Buildings 15 03232 g025
Figure 26. Daily setup of a hybrid and heat pump system within 25 houses on 1st January.
Buildings 15 03232 g026
Table 1. Basic properties of hydrogen, retrieved from K. Mazloomi, C. Gomes, 2012 [19].
FormStorage
Condition
Gravimetric
Energy Density
Volumetric Energy DensityTypical Storage Pressure
Compressed Gas (CGH2)Room temperature, high pressure120 MJ/kg1.5–2.0 kWh/L350–700 bar
Liquid Hydrogen (LH2)Cyrigenic liquid at −253 °C120 MJ/kg2.8 kWh/L1 atm
Atmospheric H2Ambient temperature and pressure120 MJ/kg0.01 kWh/L1 atm
Metal HydridesAbsorbed in solid material1.5–10 MJ/kg (varies)1–1.5 kWh/L10–1000 bar
Table 2. Energy density of hydrogen compared to the frequently used fuels. Retrieved from Mazloomi and Gomes, 2012 [18].
MaterialEnergy per kgEnergy per LiterEnergy per m3
(MJ/kg)(kWh/kg)(MJ/L)(kWh/L)(kWh/Nm3)
Hydrogen (liquid)14333.310.12.82800
Hydrogen (compressed, 700 bar)14333.35.61.51500
Hydrogen (atm. pressure)14333.30.01070.0033
Methane (atm. pressure)55.610.6–13.10.03780.010510.6
Natural gas (liquid)53.610.6–13.122.26.166160
Natural gas (compressed 250 bar)53.610.6–13.192.52500
Natural gas (atm. pressure)53.610.6–13.10.03640.010110.1
Table 4. Design formulation of energy systems alternatives derived from the pilot projects.
Pilot ProjectsAppliancesSystemScaleName of the System
Basic energy system (Base case)Natural gas boiler system
Frequently used alternativeAll-electric heat pump system
PurifHy Projects (Methanation)Hydrogen blendApartmentNatural gas and hydrogen blended system
(Rozenburg, Rotterdam)Power-to-Gas
HyNet UK BoilersHydrogen gridCity orMicrogrid hydrogen boiler system
Hy4Heat UKBoilersNeighborhood
24/7 Energy LabFuel cell + Heat pumpHydrogen hybridBuildingHybrid hydrogen heat pump system
Cogeneration hydrogen fuel cell system;
to understand the basic fuel cell production system without any intervention with other heating system (waste-heat deployment)
Cogeneration hydrogen fuel cell system
Table 5. Building typologies employed in the research within the Stoke-on-Trent and TABULA database.
Building Models in Real-life (Stoke-on-Trent)
Buildings 15 03232 i001Buildings 15 03232 i002Buildings 15 03232 i003Buildings 15 03232 i004Buildings 15 03232 i005
Building Models in Tabula (English Houses Database)
Buildings 15 03232 i006Buildings 15 03232 i007Buildings 15 03232 i008Buildings 15 03232 i009Buildings 15 03232 i010
TypeABCDE
Built year1945–19641965–19801981–19901965–19801945–1964
Occupants4 people4 people5 people 4 people3 people
Total Floor2 floors1 floors2 floors2 floors1 floors
Total unit10 units3 units6 units3 units3 units
Window area26.9 m26.7 m29.0 m222.4 m29.0 m2
Total house25 houses|1 block
Table 6. Improved U-values of building materials under light and ambitious renovation scenarios.
Refurbishment MeasureType AType BType CType DType E
InsulationU-ValueInsulationU-ValueInsulationU-ValueInsulationU-ValueInsulationU-Value
Light Renovation (W/m2 K)
Window changeYes2.2No4.8No3.1No3.1No2.2
Wall insulationYes0.6Yes0.6Yes0.6Yes0.6Yes0.6
Roof insulationYes0.13Yes0.13No0.4Yes0.13Yes0.13
Floor insulationNo0.59No0.72No0.5No0.59Yes0.72
Ambitious Renovation (W/m2 K)
Window changeYes1.6Yes1.6Yes1.6Yes1.6Yes1.6
Wall insulationNo0.6No0.6No0.6No0.6No0.6
Roof insulationNo0.13No0.13No0.13No0.13No0.13
Floor insulationNo0.59No0.59No0.59No0.59No0.72
Table 7. Input parameters for energy demand modeling in the context of an ambitious renovation.
Building Input ParametersType AType BType CType DType E
Dimension
Width 6 m 6 m 7.5 m 6 m 8 m
Length 9.5 m 9 m 8 m 10 m 12 m
Floor height 3 m 3 m 3 m 3 m 3 m
Total floors 2 1 2 2 1
Total facade area (incl. glass) North 33.6 m2 25.2 m2 42 m2 33.6 m2 33.6 m2
Total facade area (incl. glass) East 67.2 m2 16.8 m2 22.4 m2 56 m2 22.4 m2
Total facade area (incl. glass) South 33.6 m2 25.2 m2 21.0 m2 33.6 m2 33.6 m2
Total facade area (incl. glass) West 67.2 m2 16.8 m2 22.40 m2 56 m222.4 m2
Total roof area (incl. glass) 72 m254 m2 60 m2 60 m2 96 m2
Total ground floor area 72 m2 54 m2 60 m2 60 m2 96 m2
Total floor surface area 114 m2 54 m2 120 m2 120 m2 96 m2
Transmissions
Rc window 0.45 m2 K/W 0.45 m2 K/W 0.45 m2 K/W 0.45 m2 K/W 0.45 m2 K/W
Rc facade walls 1.49 m2 K/W 1.49 m2 K/W 1.49 m2 K/W 1.49 m2 K/W 1.49 m2 K/W
Rc roof 7.52 m2 K/W 7.52 m2 K/W 2.33 m2 K/W 7.52 m2 K/W 7.52 m2 K/W
Rc floor 1.52 m2 K/W 1.22 m2 K/W 1.83 m2 K/W 1.52 m2 K/W 1.22 m2 K/W
U-value window 1.6 W/m2 K 1.6 W/m2 K 1.6 W/m2 K 1.6 W/m2 K 1.6 W/m2 K
U-value facade wall 0.6 W/m2 K 0.6 W/m2 K 0.6 W/m2 K 0.6 W/m2 K 0.6 W/m2 K
U-value roof 0.13 W/m2 K 0.13 W/m2 K 0.4 W/m2 K 0.13 W/m2 K 0.13 W/m2 K
U-value floor 0.59 W/m2 K 0.72 W/m2 K 0.5 W/m2 K 0.59 W/m2 K 0.72 W/m2 K
Infiltration
Air Change Hour (ACH) 0.50/h 0.50/h 0.50/h 0.50/h 0.50/h
Flow rate infiltration 171 m3/h 81 m3/h 81 m3/h 168 m3/h 134.4 m3/h
Ventilation
Heat Recovery Efficiency 0.9 0.9 0.9 0.9 0.9
Ventilation Flow Rate per person 25 m3/h/person25 m3/h/person25 m3/h/person 25 m3/h/person 25 m3/h/person
Total Surface of Windows
Window area (East) 20.16 m25.04 m26.72 m216.8 m26.72 m2
Window area (West) 6.72 m21.68 m22.24 m25.6 m22.24 m2
Internal heat gain
Heat gain per person 117 W/person117 W/person 117 W/person 117 W/person 117 W/person
Light power per square meter 3 W/m23 W/m23 W/m2 3 W/m23 W/m2
Appliances per power per m23 W/m23 W/m2 3 W/m23 W/m2 3 W/m2
Table 8. Heating demand modeling profile for hour 10 in a Type A dwelling.
DescriptionFormulaValues
Transmission Q transmission   = U · A · Δ T 2323.7 Wh
Infiltration Q infiltration = ρ · C p · n · V 3600 · Δ T 829.9 Wh
Ventilation Q ventilation = ( 1 η ) · m v e n t ·   C p · T 41.2 Wh
Solar Gain Q Solar = g   · A w i n d o w   · E s u n l o a d 229.8 Wh
Internal Gain Q internal = Q int , people +   Q int , lighting +   Q int ,   appliance 1332.0 Wh
Total Heat Demand Q 0 = Q transmission   + Q ventilation + Q infiltration   Q solar   Q internal   1633.0 Wh
Table 9. Energy demand calculations for five representative dwellings in the Hanley neighborhood.
Square
Meter (m2)
Total
Houses
A (Base Case)B (Light Renovation)C (Ambitious Renovation)
TABULACalculation/Modeling TABULACalculation/Modeling TABULA Calculation/Modeling
Space heating (kWh)Space heating (kWh)DHW (kWh)Electricity (kWh)Space heating (kWh)Space heating (kWh)DHW (kWh)Electricity (kWh)Space heating (kWh)Space heating (kWh)DHW (kWh)Electricity (kWh)
A
(144 m2)
1040,493 kWh41,687 kWh8490 kWh3781 kWh15,538 kWh13,412 kWh8490 kWh3781 kWh13,810 kWh10,642 kWh8490 kWh3781 kWh
B
(54 m2)
312,312 kWh17,791 kWh6792 kWh1418 kWh7479 kWh7450 kWh6792 kWh1418 kWh5060 kWh4736 kWh6792 kWh1418 kWh
C
(120 m2)
6-23,557 kWh 8790 kWh3151 kWh12,432 kWh15,052 kWh8490 kWh3151 kWh9948 kWh6792 kWh8490 kWh3151 kWh
D
(120 m2)
324,941 kWh29,609 kWh 6792 kWh3150 kWh13,740 kWh12,596 kWh6792 kWh2521 kWh11,280 kWh9275 kWh6792 kWh3150 kWh
E
(96 m2)
324,941 kWh35,261 kWh5094 kWh2521 kWh9888 kWh10,572 kWh5094 kWh 2521 kWh8832 kWh8954 kWh5094
kWh
2521 kWh
Table 10. Annual energy demand in one block of 25 dwellings in the neighborhood.
Annual Energy Demand for
One Block (25 Houses)
Base CaseLight RenovAmbitious Renov
Space heating demand806.19 MWh316.28 MWh214.25 MWh
Domestic hot water demand191.88 MWh191.88 MWh191.88 MWh
Electricity demand77.98 MWh77.98 MWh77.98 MWh
Total energy demand1075.05 MWh586.14 MWh484.11 MWh
Table 11. The estimation of energy consumption for Scenario 1: natural gas grid system. Light renovation is highlighted to link the data reference on the Figure 8.
Energy ConsumptionUnitBase CaseLight RenovAmbitious Renov
Space heating demandMWh806.19316.28214.25
Efficiency (40–60 °C) of boiler%959595
Energy consumption for boilerMWh848.82332.93225.53
Efficiency of grid transmission%959595
Total natural gas for space heatingMWh893.29350.45237.40
Domestic Hot Water (DHW) demandMWh191.88191.88191.88
Efficiency (≥60 °C) of boiler n%858585
Energy consumption for boilerMWh225.74225.74225.74
Efficiency grid transmission%959595
Total natural gas for DHWMWh237.62237.62237.62
Electricity demand for appliances MWh77.9877.9877.98
Efficiency of local grid transmission %959595
Energy consumption for grid transmission MWh82.0882.0882.08
Efficiency of DC/AC conversion%959595
Total electricity (PV rooftop) for appliancesMWh86.4086.4086.40
Total natural gas consumption
(space heating + DHW)
MWh
MWh
893.29 +237.62
1130.91
350.45 + 237.62
588.07
237.40 + 237.62
475.02
Table 12. The estimation of energy consumption for Scenario 2: all electric heat pump system. Ambitious renovation is highlighted to link the data reference on the Figure 10.
Energy ConsumptionUnitBase CaseLight RenovAmbitious Renov
Space heating demandMWh-316.28214.25
Efficiency (40–60 °C) of heat pump%-430430
Energy consumption for heat pumpMWh-73.5549.83
Efficiency of grid transmission%-9595
Total natural gas for space heatingMWh-77.4252.45
Domestic Hot Water (DHW) demandMWh-191.88191.88
Efficiency (≥60 °C) of heat pump%-350350
Energy consumption for heat pump MWh-54.8254.82
Efficiency grid transmission%-9595
Total natural gas for DHWMWh-57.7057.70
Electricity demand for appliancesMWh-77.9877.98
Efficiency of DC/AC conversion%-9595
Energy consumption for grid transmissionMWh-82.0882.08
Efficiency of local grid transmission %-9595
Total electricity (PV rooftop) for appliancesMWh-86.4086.40
Total electricity (PV central) for heatingMWh
MWh
-
-
77.42 + 57.70
135.134
52.45 + 57.70
110.157
Table 13. The estimation of energy consumption for Scenario 3: natural gas and hydrogen blended system. Light renovation is highlighted to link the data reference on the Figure 12.
Energy ConsumptionUnitBase CaseLight RenovAmbitious Renov
Space heating demandMWh806.19316.28214.25
Efficiency (40–60 °C) of boiler%95430430
Energy consumption for boilerMWh848.6273.5549.83
Efficiency of grid transmission%959595
Heating demand for 70% natural gasMWh594.03233.05157.86
Efficiency of grid transmission%959595
Total natural gas for space heatingMWh625.30245.32166.17
Heating demand for 30% hydrogen MWh254.5999.8867.66
Efficiency of Hydrogen storage%999999
Energy consumption for hydrogen storageMWh257.15100.8968.34
Efficiency of (electrolyser + compressor) **%707070
Energy consumption (electrolyser + compressor)MWh367.37144.1297.63
Efficiency of DC/DC conversion%959595
PV Central to produce hydrogen (DHW)MWh386.70151.71102.867
Domestic Hot Water (DHW) demandMWh191.88191.88191.88
Efficiency (≥60 °C) of boiler%85350350
Energy consumption for boilerMWh225.74254.8254.82
70% natural gas consumptionMWh158.02158.02158.02
Efficiency of grid transmission%959595
Total natural gas for DHWMWh166.336166.336166.336
30% hydrogen MWh67.7267.7267.72
Efficiency of hydrogen storage%999999
Energy consumption for hydrogen storageMWh68.468.468.4
Efficiency of (electrolyser + compressor) **%707070
Energy of (electrolyser + compressor)MWh97.7297.7297.72
Efficiency of DC/DC conversion%959595
PV central to produce hydrogen (for DHW)MWh102.867102.867102.867
Electricity demand for appliances MWh77.9877.9877.98
Efficiency of local grid transmission %959595
Energy consumption for grid transmissionMWh82.0882.0882.08
Efficiency of DC/AC conversion%959595
Total electricity (PV rooftop) for appliancesMWh86.4086.4086.40
Total natural gas consumption
(space heating + DHW)
MWh625.30 + 166.34
791.64
245.32 + 166.34
411.66
166.17 + 166.34
332.51
Total Electricity (PV Central) for hydrogen productionMWh
MWh
386.70 + 102.87
489.57
151.71+102.87
254.58
102.77 + 102.87
205.64
** Compressor efficiency is explained in the following paragraph.
Table 14. The estimation of energy consumption for Scenario 4: microgrid hydrogen boiler system. Light renovation is highlighted to link the data reference on the Figure 14.
Energy ConsumptionUnitBase CaseLight RenovAmbitious Renov
Space heating demandMWh806.19316.28214.25
Efficiency (40–60 °C) of hydrogen boiler%959595
Energy consumption for hydrogen boilerMWh848.82332.93225.53
Efficiency of hydrogen storage%999999
Energy consumption of hydrogen storageMWh857.39336.29227.80
Efficiency of electrolyser + compressor%7070350
Energy consumption electrolyser + compressorMWh1224.84480.42325.43
Efficiency of DC/DC conversion%959595
PV central to produce hydrogen (for space heating)MWh1289505.70342.56
Domestic Hot Water (DHW) demandMWh191.88191.88191.88
Efficiency (≥60 °C) of hydrogen boiler%858585
Energy consumption for hydrogen boilerMWh225.74225.74225.74
Efficiency of hydrogen storage%999999
Hydrogen storage consumptionMWh228.02228.02228.02
Efficiency of electrolyser + compressor%707070
Energy consumption electrolyser + compressorMWh325.74325.74325.74
Efficiency of DC/DC conversion%959595
PV central to produce hydrogen (for DHW)MWh342.89342.89342.89
Electricity demand for appliancesMWh77.9877.9877.98
Efficiency of local grid transmission %959595
Energy consumption for grid transmission MWh82.0882.0882.08
Efficiency of DC/AC conversion%959595
Total electricity (PV rooftop) for appliancesMWh86.4086.4086.40
Total electricity (PV central) for hydrogen productionMWh
MWh
1289 + 342.89
1631.89
505.69 + 342.89
848.59
342.56 + 342.89
685.45
Table 15. The estimation of energy consumption for Scenario 5: cogeneration hydrogen fuel cell system. Light renovation is highlighted to link the data reference on the Figure 16.
Energy ConsumptionUnitBase CaseLight RenovAmbitious Renov
Space heating demandMWh806.19316.28214.25
Efficiency (40–60 °C) of fuel cell%373737
Energy consumption for fuel cellMWh2178.90854.82579.06
Efficiency of hydrogen storage%999999
Energy consumption of hydrogen storageMWh2200863.45548.91
Efficiency of electrolyser + compressor%707070
Energy consumption electrolyser + compressorMWh31441233835.58
Efficiency of DC/DC conversion%959595
PV central to produce hydrogen (for space heating)MWh33091298879.6
Domestic Hot Water (DHW) demandMWh191.88191.88191.88
Efficiency (≥60 °C) of fuel cell%373737
Energy consumption for fuel cellMWh518.6518.6518.6
Efficiency of hydrogen storage%999999
Hydrogen storage consumptionMWh523.83523.83523.83
Efficiency of electrolyser + compressor%707070
Energy consumption electrolyser + compressorMWh748.34748.34748.34
Efficiency of DC/DC conversion %959595
PV central to produce hydrogen (for DHW)MWh787.72787.72787.32
Electricity generated by fuel cell (Space Heating)MWh2015.47790.7535.625
Efficiency of Fuel cell (electricity)%575757
Electricity surplus by fuel cellMWh114.82114.82114.82
Electricity generated by fuel cell (DHW)MWh518.6518.6518.6
Efficiency of Fuel cell (electricity)%575757
Electricity surplus by fuel cellMWh295.60295.60295.60
Electricity demand for appliancesMWh77.9877.9877.98
Efficiency of local grid transmission %959595
Energy consumption for grid transmissionMWh82.0882.0882.08
Total electricity surplus (deviation) MWh1361.5 (+)664.22 (+)518.82 (+)
Total electricity (PV central) for hydrogen productionMWh
MWh
3309 + 787.72
4097.36
1298 + 787.72
2085.72
879.6 + 787.72
1667.32
Table 16. Parameters of a control setup in a hybrid hydrogen and heat pump system.
No.Parameters123
Bare MinimumRemarkAverageRemarkLimit MaxRemark
ATemperature<9.84 °CA19.84 °C
(to 18 °C)
A218 °CA3
BSolar Radiation0 W/m2B1750 W/m2B2>750 W/m2B3
CHeat Load hour (25 household)<48.9 kWhC148.9 kWh (to 98.99 kWh)C2>98.99 kWh
(Max amount in data)
C3
No.Heating with Hydrogen sourceHeating by Heat PumpHeating turn off
1.A1A2A3
2.B1, B2B1, B2B3
3.C2, C3C1
Disclaimer/Publisher’s Note: The statements, opinions and data contained in all publications are solely those of the individual author(s) and contributor(s) and not of MDPI and/or the editor(s). MDPI and/or the editor(s) disclaim responsibility for any injury to people or property resulting from any ideas, methods, instructions or products referred to in the content.