1. Introduction
The size of a site exerts a substantial impact on the extent of daylight access available to buildings, primarily through its relationship with open spaces, plot coverage, and setbacks. Site dimensions also affect the spatial layout of buildings and determine their proximity to adjacent structures. In smaller plots, the limited availability of open space often necessitates placing buildings in closer proximity, which in turn results in mutual shading and a reduction in daylight ingress into the interior spaces. Cheng et al. [
1] through a parametric study, demonstrated that urban form influences daylight availability more than density. Their findings suggest that layouts incorporating variations in building height and non-uniform, scattered footprints provide superior daylight access compared to rigid, uniform grid patterns, even within high-density urban contexts.
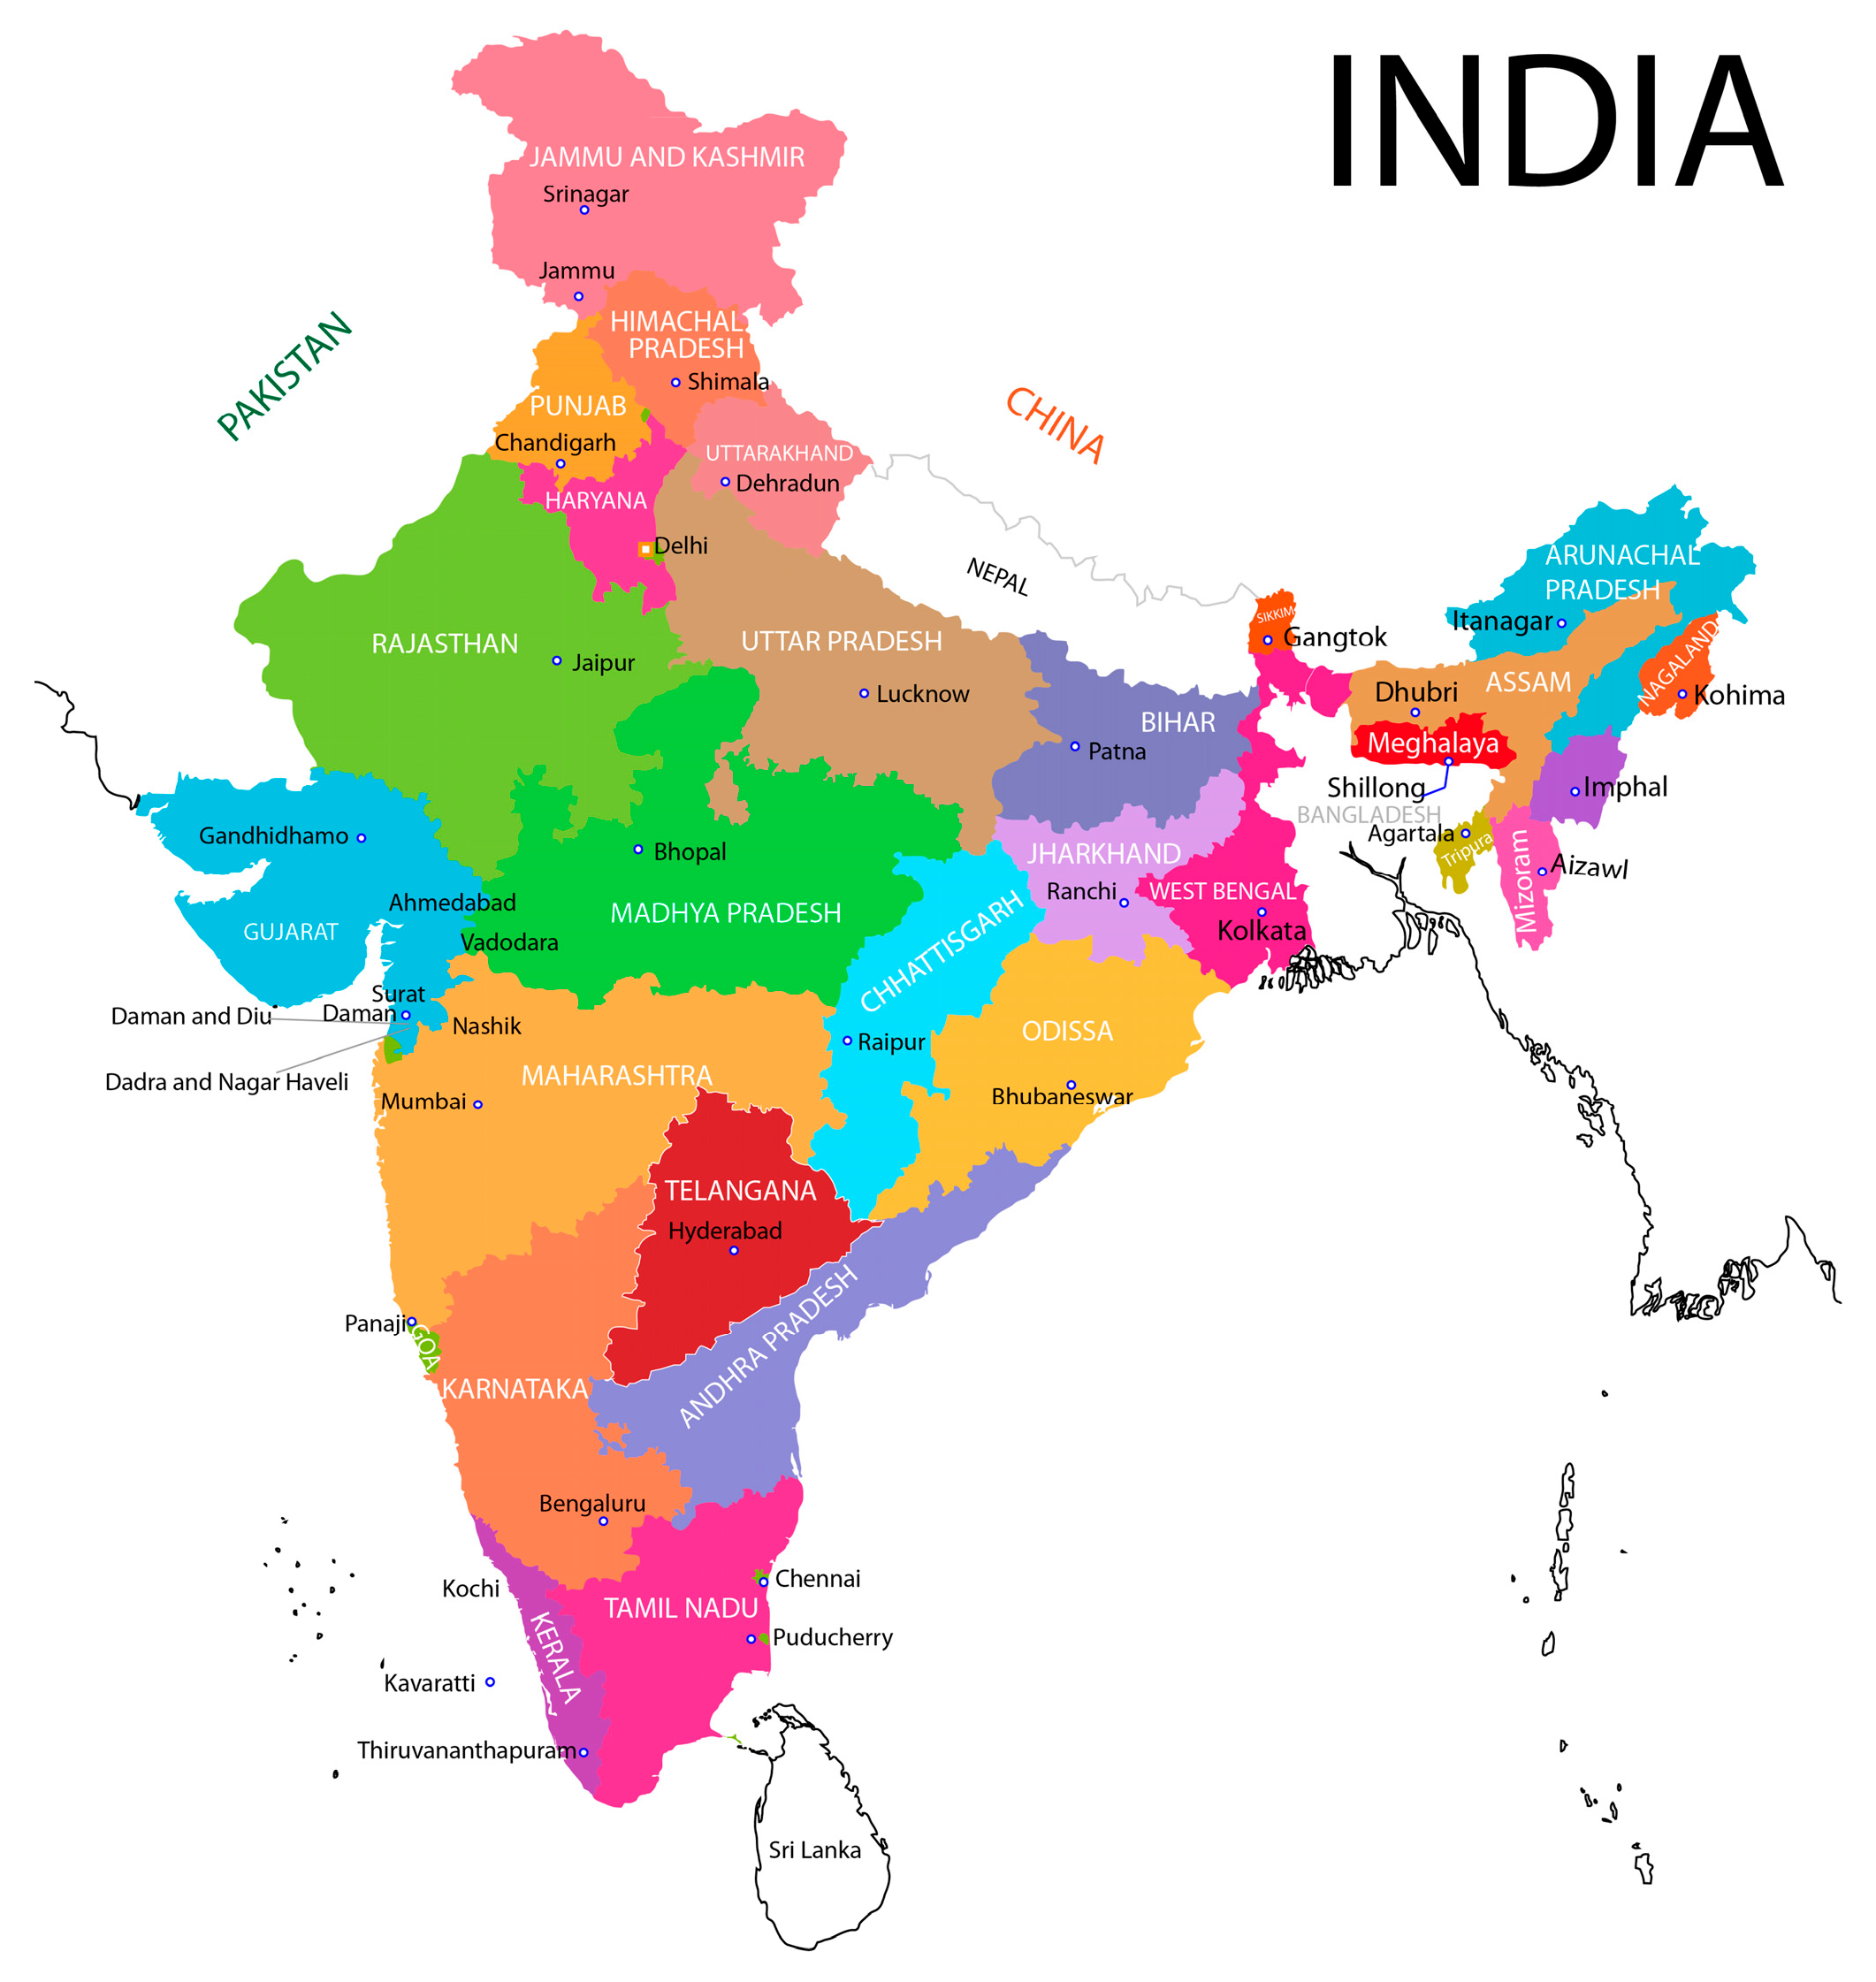
Although plot size does not directly dictate the levels of indoor illumination, larger or well-planned sites provide greater flexibility for optimizing building orientation, spacing, and landscape design, thereby enhancing natural daylight penetration. For instance, in Tamil Nadu (
Figure 1), school plot sizes range from approximately 4047 m
2 to more than 20,000 m
2 (
Table A1), offering varying opportunities for daylight access depending on their configuration. Hong et al. [
2] in their investigation of high-density residential districts in Guangzhou, China, observed that building form and spacing exerted the strongest influence on daylight access, particularly for lower and middle floors where obstruction from neighbouring structures was greatest. Building orientation was found to profoundly affect daylight availability for the upper floors; however, its effect was less pronounced for the lower levels dominated by diffuse light. Similarly, Nasrollahi and Rostami [
3] reported limited daylight performance in their study area, with only 8% of the 62 surveyed buildings achieving adequate spatial daylight autonomy (sDA > 50%), a shortfall primarily attributable to physical obstructions.
1.1. Study Context: Chennai, India
Chennai, the capital of Tamil Nadu, is a metropolitan city situated on India’s southeastern coastline along the Coromandel Coast, facing the Bay of Bengal. Its coastal location strongly influences the city’s climate, terrain, and environmental conditions. As one of India’s most densely populated urban centres, Chennai contends with the dual pressures of rapid urbanization and increasing climate-related risks, including the urban heat island (UHI) effect, recurrent flooding, and a decline in green cover. In response, the city has initiated measures to achieve the 33% green cover target outlined in the State Forest Policy (2018), a critical intervention for mitigating UHI effects, improving stormwater management, and enhancing air quality [
4]. The trajectory of Chennai’s green cover policy since 2017 reflects a gradual institutionalization of ecological governance. The 2017–18 phase was predominantly restorative, emphasizing mass afforestation and urban forestry in the aftermath of Cyclone Vardah. By 2018–19 [
5], the Tamil Nadu Biodiversity Conservation and Greening Project reframed policy through climate-adaptive planning and GIS-based monitoring. Integrated wetland conservation at Pallikaranai further underscored a systemic approach to urban ecological resilience. The 2024–2025 policy [
6] note advances this trajectory by prioritizing the structural protection of extant green assets against urban encroachment. Collectively, these stages signify a progression from reactive ecological recovery to resilience-oriented planning and institutionalized urban environmental safeguarding.
Within this context, school campuses present a dispersed yet underutilized opportunity. Owing to their comparatively large plot sizes and distribution across residential, commercial, and industrial neighbourhoods, school sites possess significant potential to contribute to the improvement of local microclimates. Through conscious site planning and strategic landscaping, these campuses can be transformed into nodes of enhanced urban green cover. Such interventions not only improve thermal and environmental comfort within the campuses themselves but extend these benefits to the surrounding neighbourhoods, thereby supporting the city’s broader climate resilience goals.
Climate of Chennai
Chennai’s geographical location near the equator, at approximately 13° N latitude, results in distinctive solar exposure patterns throughout the year. Within the city’s hot and humid climatic context [
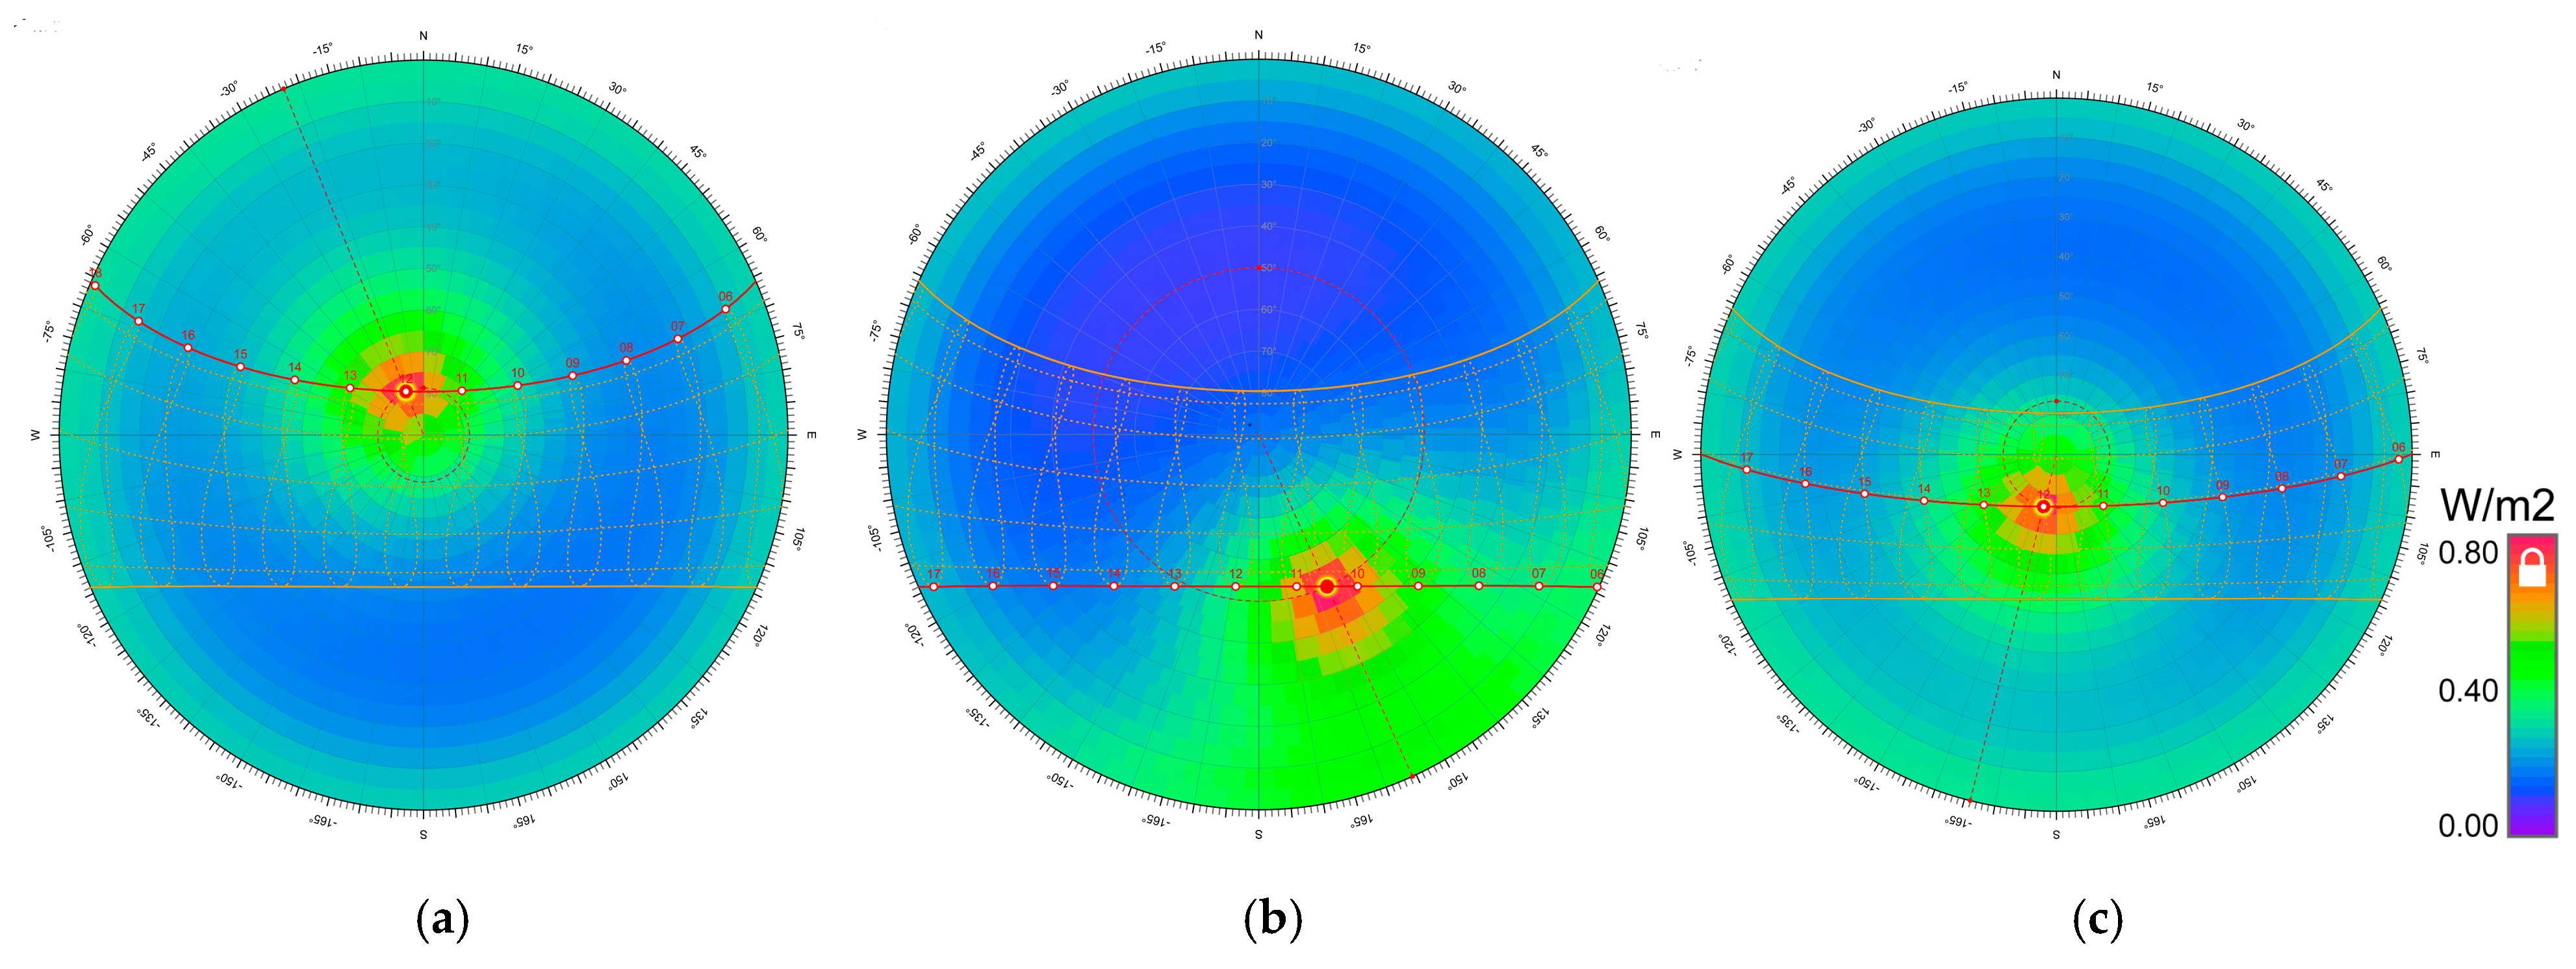
7], solar geometry plays a pivotal role in shaping both thermal gain and daylight availability in buildings. The consistently high solar altitude during midday reduces the risk of excessive heat gain and glare, conditions that can be effectively managed through the application of simple horizontal shading devices. The sun path diagram for Chennai (
Figure 2a–c) reveal that the most significant challenge arises from low-angle solar radiation. During morning and late afternoon hours, the sun’s altitude frequently falls below 30°, particularly on the eastern and western façades. At these angles, sunlight bypasses horizontal overhangs, resulting in deep interior penetration, visual discomfort, and considerable heat gain. Seasonal variation in the solar path further compounds these effects. Between September and March, the sun remains predominantly in the southern sky, extending exposure for south-facing façades. Conversely, from April to August, the sun shifts northward, subjecting even north-facing façades to direct solar radiation during early and late hours. Afternoon radiation from the west and northwest is especially problematic, as it combines high thermal intensity with low angles that are difficult to shield effectively.
Chennai’s tropical climate brings year-round high solar irradiance, subjecting buildings to intense visible light and significant thermal loads. East- and west-facing façades are particularly vulnerable, receiving intense solar radiation during morning and afternoon hours. On the summer solstice, Chennai experiences approximately 12 hours and 48 minutes of daylight, while on the winter solstice, daylight duration is reduced to about 11 hours and 23 minutes. During the equinoxes (20 March and 22 September), day and night are nearly equal, each lasting close to 12 hours. These solar characteristics necessitate a holistic design approach that integrates optimal building orientation, multi-layered shading systems, and strategic landscaping to mitigate glare and to reduce heat gain, while ensuring sufficient daylight penetration. In hot, glare-prone climates, landscape-led planning provides a cost-effective way to improve thermal comfort, to boost sustainability, and to enhance school environments. The interrelationship between daylight and irradiance is particularly critical in Chennai. While daylight reduces the need for artificial lighting and improves comfort, excessive sun exposure can lead to overheating, making it essential to balance daylight use with glare and heat control.
1.2. Need and Significance of This Study
Urban Green Cover in Chennai
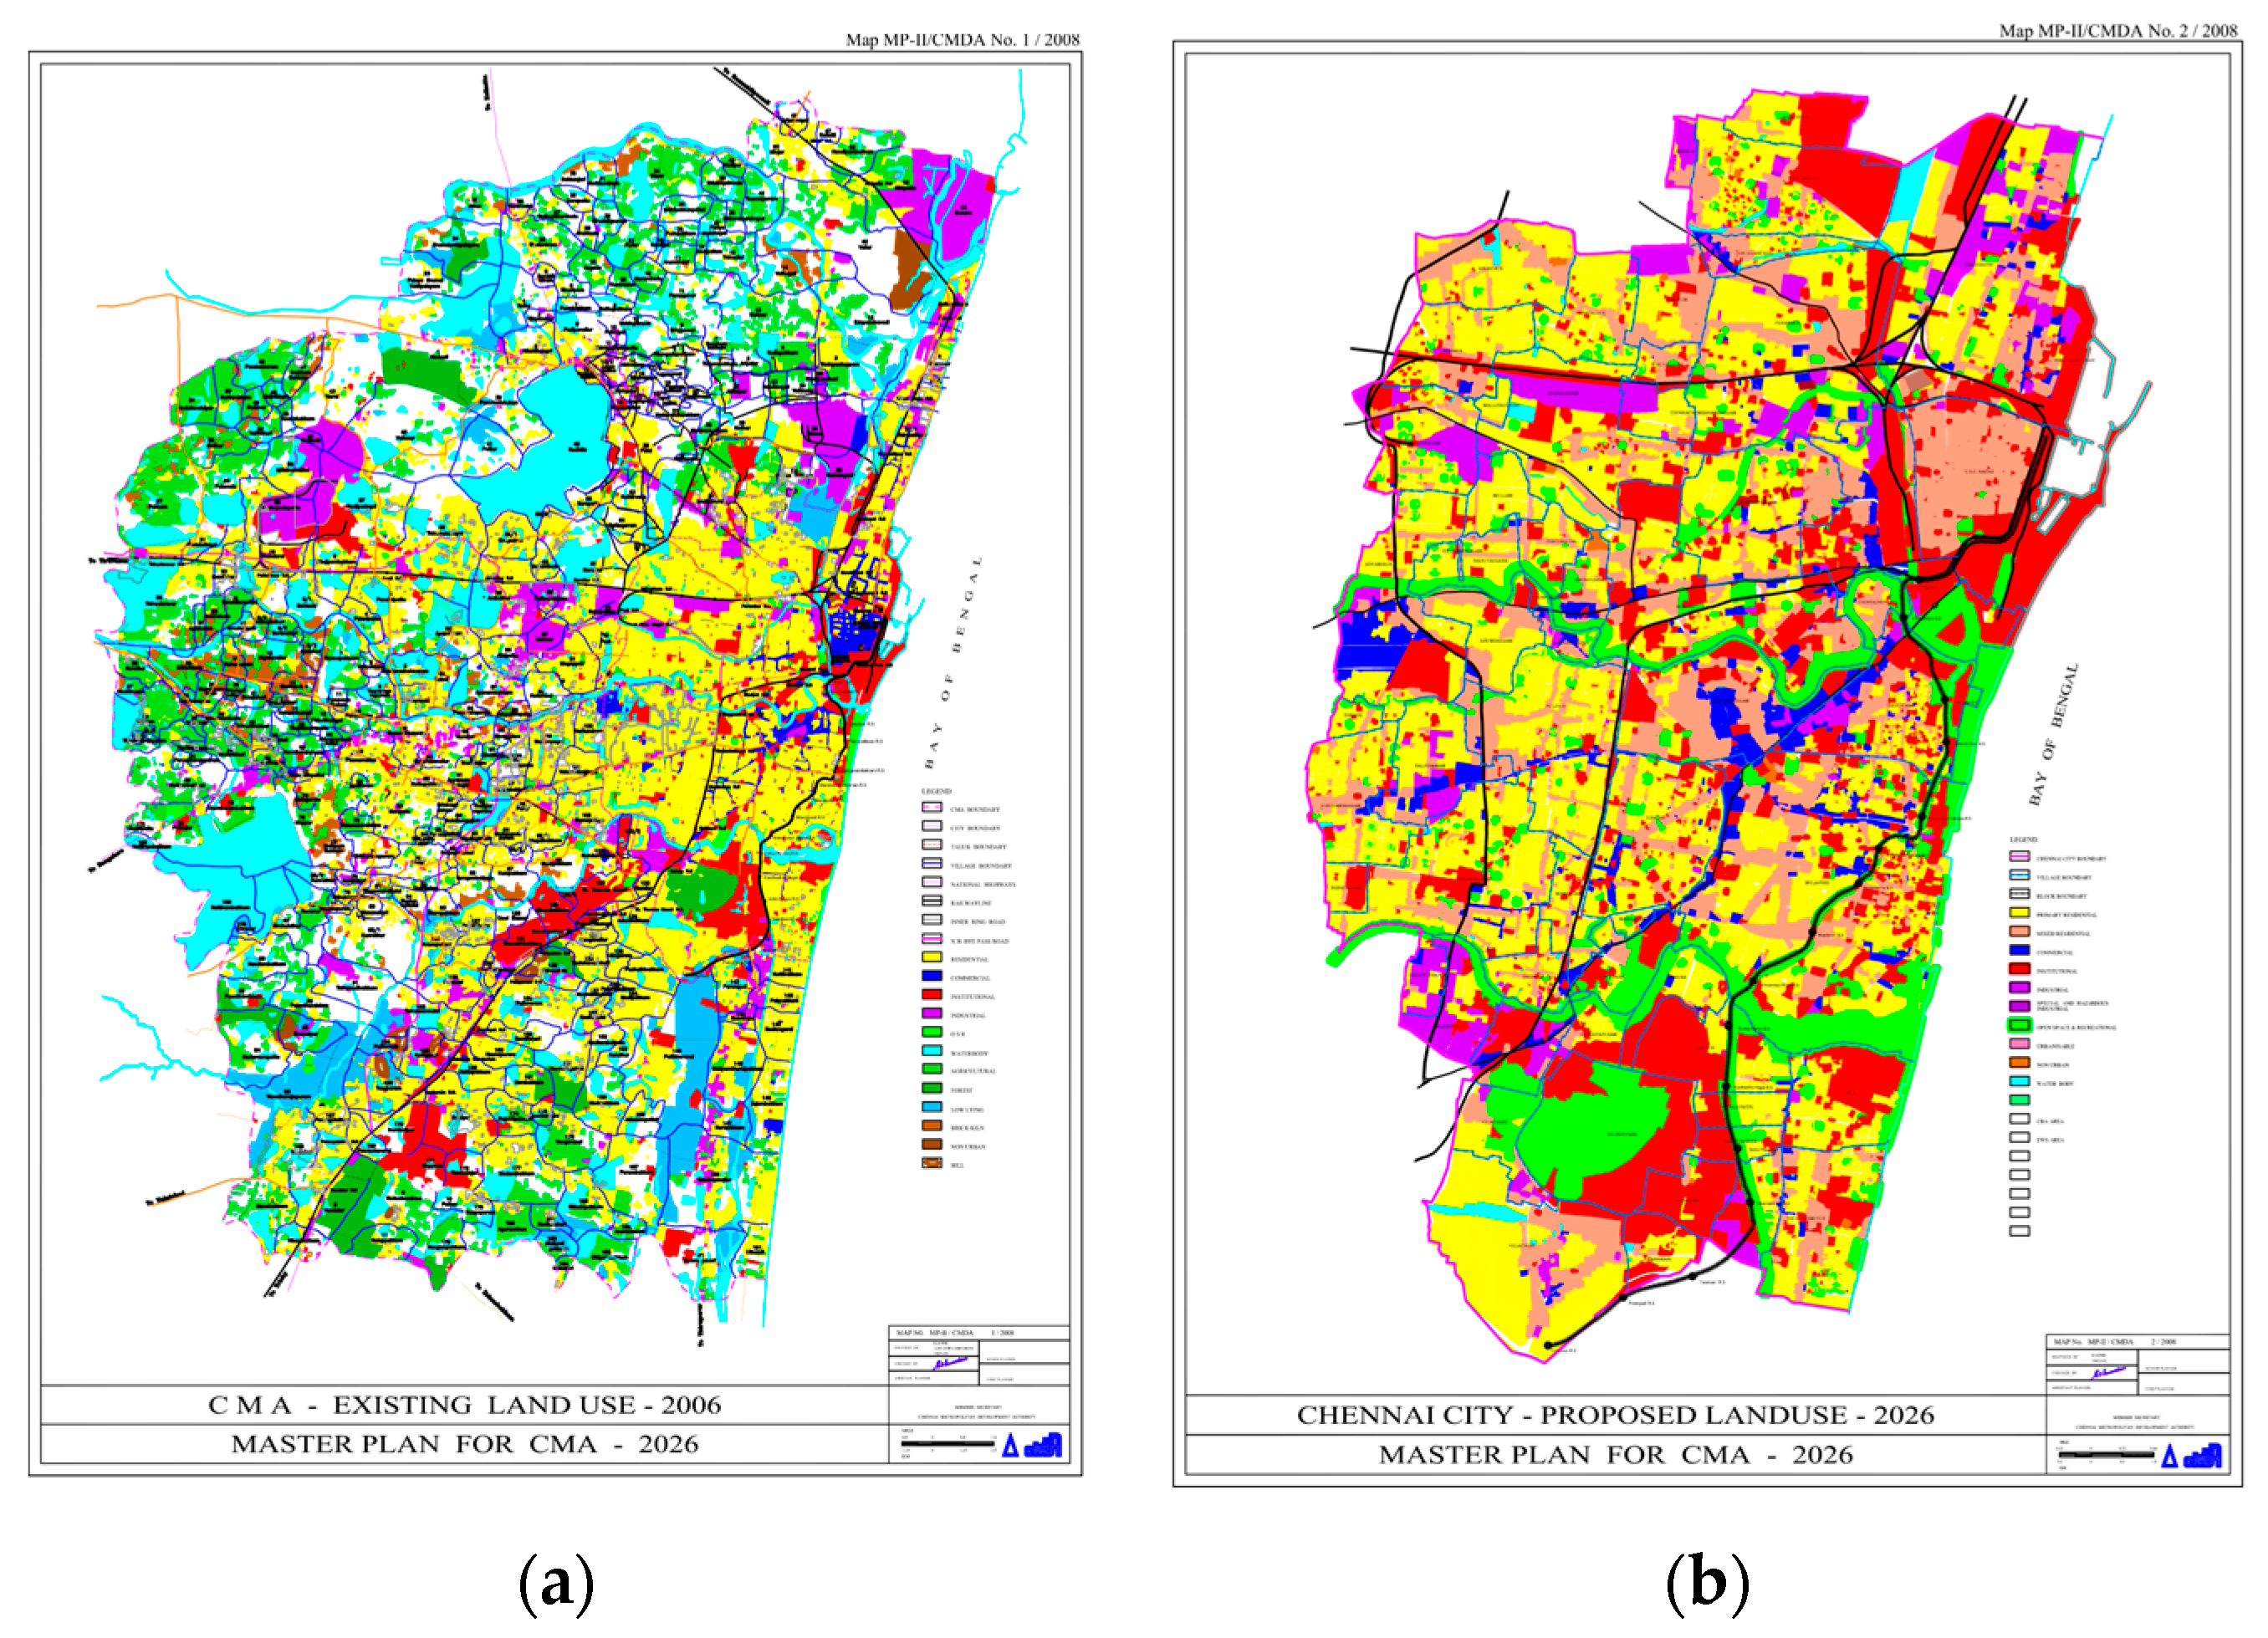
Green cover within the Chennai Metropolitan Area (CMA) is most prominent in the western and southern regions, where expansive stretches of vegetation and agricultural land still persist (
Figure 3a,b). By contrast, the eastern coastal belt along the Bay of Bengal reveals a starkly different pattern, with dense urban development and mixed land uses leaving little room for greenery. The central metropolitan core presents an even more fragmented picture, where green spaces survive in scattered pockets—parks, institutional grounds, and small reserves that punctuate an otherwise built-up landscape. A quantitative analysis illustrates a troubling trend: green cover, which comprised roughly 9.2% of the CMA in 2006, is projected to decline to just 7.3% by 2026. This nearly 20% reduction over two decades not only reflects the pressures of rapid urbanization but raises critical questions about long-term ecological balance and the quality of life for residents. The projected decline in green cover within the Chennai Metropolitan Area, nearly 20% over two decades, signals an urgent need to balance urban growth with ecological preservation. Preserving and thoughtfully integrating green space is thus not simply an environmental necessity, but a social one, vital to sustaining healthier, more liveable urban futures. To address this, the Chennai metropolitan development authority has proposed land use in 2026 (
Figure 3b) aiming to increase the urban green cover.
Chennai currently provides only 18.05 square meters of green space per capita (TNUIFSL, 2021), a figure substantially lower than the World Health Organization’s recommended minimum of 50 square meters per capita [
8]. Urban green spaces are vital not only for enhancing public health but for mitigating critical environmental challenges, such as the urban heat island (UHI) effect, stormwater management, and flood control. However, over the past decade, Chennai has witnessed a 13.33% decline in green cover, coinciding with a 6.53 °C increase in the land surface temperature between 2013 and 2022 [
9].
In response to these challenges, the Government of Tamil Nadu launched the Green Schools initiative in 2024, designating 25 schools as pilot sites for tree planting and climate risk mitigation [
10]. Complementing this effort, the State Planning Commission has advocated for strategic tree placement and the development of continuous green canopies to strengthen urban resilience through the integration of vegetation into buildings, streets, and public spaces [
11]. Despite these initiatives, the existing design regulations often rely on generalized standards that inadequately reflect local climatic and environmental conditions.
Educational campuses, by virtue of their comparatively extensive plots and dispersed distribution across the city, represent significant opportunities for landscape integration. Beyond their environmental value, such interventions support student well-being by fostering interaction, recreation, and improved thermal comfort. As such, school campuses emerge as critical sites for advancing both environmental sustainability and social resilience in Chennai.
In India, school infrastructure is primarily guided by the National Building Code (NBC)2016 and associated Indian Standards, such as IS 3646-1992 [
12].
These regulations establish the functional requirements for classrooms, sanitation facilities, laboratories, and recreational spaces, while also providing quantitative specifications for furnishings and utilities. However, they contain few provisions that specifically address natural daylight or the integration of landscape elements in school design. Typical classroom layouts rely on ceiling fans and artificial lighting systems. Yet, the number and placement of fixtures frequently fail to align with recommended illuminance levels of 300–500 lux for reading tasks as given in NBC 2016. As a result, artificial lighting in schools tends to emphasize basic visibility rather than supporting visual comfort, health, or circadian well-being. Likewise, landscape planning seldom considers daylight needs, particularly for outdoor or semi-open learning spaces, limiting the potential for creating environmentally responsive and health-supportive educational environments.
1.3. Research Methodology
The research methodology (
Figure 4) was developed subsequent to the formulation of the research objectives, thereby ensuring a coherent alignment between the aims of this study and the strategies employed to achieve them. Establishing the objectives at the outset provided a structured foundation for selecting suitable methodological approaches, which included field measurements, climate-based daylight modelling (CBDM), and statistical analyses. The research aimed to develop an evidence-based understanding of how trees, window-to-wall ratio (WWR), building orientation, and classroom floor level influence daylight performance in schools, with the broader objective of informing climate-resilient and visually comfortable learning environments. A literature review highlighted the growing role of climate-based daylight modelling (CBDM) in building design but revealed a gap in the research addressing the combined effects of WWR, vegetation shading, and classroom positioning in tropical climates like Chennai. To bridge this gap, school field measurements were conducted to document solar data, on-site vegetation, building parameters, and indoor illuminance levels, providing a basis for calibration and validation. Climate-based daylight modelling (CBDM) simulations were then performed using DesignBuilder 7.4 software (Private Limited-UK, Solar Decathlon competition as free software for students 2024–2025, India) with RADIANCE plugins, enabling a detailed assessment of daylight distribution under dynamic sky conditions. The simulations incorporated WWR variations (20%, 30%, 40%), two orientations, three tree shading scenarios, and four floor levels. In addition, the simulations evaluated three key daylight metrics, including useful daylight illuminance (UDI), spatial daylight autonomy (sDA), and annual sunlight exposure (ASE).
Useful daylight illuminance (UDI): UDI measures the percentage of time daylight alone maintains illuminance levels within the target range of 100–2000 lux at a specific point. At the zone level, it reflects the proportion of the work plane that satisfies this criterion for more than 50% of the occupied hours, excluding periods of under-illumination or excessive daylight.
Spatial daylight autonomy (sDA): sDA represents the percentage of occupied hours during which a space achieves a minimum daylight illuminance—commonly 300 lux—across the work plane. It serves as an indicator of overall daylight sufficiency.
Annual sunlight exposure (ASE): ASE quantifies the potential for visual discomfort by identifying the percentage of the work plane that receives more than 1000 lux of direct sunlight for over 250 occupied hours per year. High ASE values signal an increased risk of glare and overheating.
Tree modelling in DesignBuilder: In the DesignBuilder simulations, trees were modelled with a transmittance value of 0.0 to represent the dense canopy effect, thereby minimizing solar penetration into adjacent buildings. The trees were strategically positioned along the external walls containing windows, rather than along the singly loaded corridors, as the corridor ceilings already function as effective shading devices. By situating the trees adjacent to glazed facades, the design emphasizes their role in further reducing daylight penetration, complementing the shading effect inherently provided by the architectural configuration.
Finally, a statistical analysis integrated the field and simulation data to validate the results and to establish design insights.
1.3.1. Research Objectives
To investigate the role of vegetation in enhancing indoor daylight performance in school buildings;
To evaluate the impact of classroom orientation, floor level, and the window-to-wall ratio (WWR) on key daylight performance metrics.
1.3.2. Literature Review
A comprehensive review of the existing literature was undertaken to explore the relationship between the daylight performance in buildings and the design parameters, such as vegetation, window configuration, orientation, and floor levels. The review also examined the implications of these factors for occupant health, cognitive performance, and visual comfort, providing the foundation for this study’s methodological approach. Owing to the limited body of research specifically addressing tree shading in classroom settings, relevant studies from other building types—particularly office environments—were incorporated to broaden the scope of the analysis.
Among the recurring findings, the window-to-wall ratio (WWR) emerged as a critical determinant of daylight availability and distribution. Alwetaishi and Taki [
13] demonstrated that orientation substantially influenced thermal and daylight performance, with recommended WWRs below 20% and 25% for southwest- and southeast-facing classrooms, respectively, and up to 35% for northwest-facing rooms due to reduced solar gain. This highlights WWR adjustment as a cost-effective passive design strategy in hot and dry climates, such as Taif. Similarly, Daei Parizi et al. emphasized that window geometry and sill height further modulate daylight performance: higher sill levels lower peak illuminance and improve distribution uniformity, though often at the expense of views and ventilation potential [
14].
Orientation effects were also evident in the study by Kaminska (2020), who reported that north-facing classrooms provided uniform illumination with minimal glare, whereas south-facing spaces, while benefiting from strong daylight penetration, required supplementary shading devices [
15]. Michael and Heracleous observed that east-facing classrooms achieved the highest daylight autonomy (97%), while north-facing classrooms recorded the highest useful daylight illuminance (UDI) at 94.5%. However, east-facing rooms were more prone to excessive illumination (sDA max > 3000 lx), indicating elevated glare risk [
16]. Dahlan and Eissa further associated southern exposure with improved academic performance, attributing this to more stable daylight conditions [
17].
Beyond fenestration and orientation, access to vegetation and views of nature have also emerged as influential. Li and Sullivan (2016) and Ulrich (1979) demonstrated that students with views of greenery exhibited better attention spans and faster stress recovery compared to those without such views [
18,
19]. Similarly, Kweon et al. reported that schools with a greater density of trees achieved higher student performance in Mathematics and Reading; however, not all landscapes were equally beneficial—open lawns and athletic fields without structured landscape features were linked to lower academic outcomes [
20]. Oberst et al. reinforced these findings, observing that students in naturally lit classrooms outperformed their peers by 10–20% in academic assessments, underscoring the synergistic benefits of daylight access and natural views within educational environments [
21].
Tree characteristics, such as height, canopy shape, leaf density, and their proximity to buildings, significantly influence indoor daylight levels. Mashaly et al. demonstrated that dense, round canopies near south-facing windows effectively reduce overexposure and glare [
22]. Dicka et al. quantified that tree shading reduced the daylight factor by up to 64.8% in summer and by 57.3% in winter, with illuminance dropping from over 500 lx to as low as 150 lx in shaded areas [
23]. Similarly, Kim et al. found that planting medium-height trees (5–10 m) along with grass is more effective in reducing heat than densely packed smaller trees. While trees help cool the surroundings through evapotranspiration, too many in one area can reflect heat and raise temperatures. This shows that tree planting can have both cooling and warming effects depending on how it is implemented [
24]. These findings highlight the need for integrated architectural and landscape strategies to optimize indoor daylight performance.
1.3.3. Research Gap
Although numerous studies have examined the contribution of vegetation to the thermal regulation and energy performance of buildings, limited attention has been given to its influence on daylight availability—particularly within hot and humid climatic contexts. This study seeks to address this gap by evaluating the role of vegetation in shaping daylight performance in school buildings. The findings are intended to inform climate-responsive design strategies and to provide evidence-based guidance for architects, educators, and policymakers on effectively integrating vegetation into site planning practices.
2. Materials and Methods
2.1. Research Design
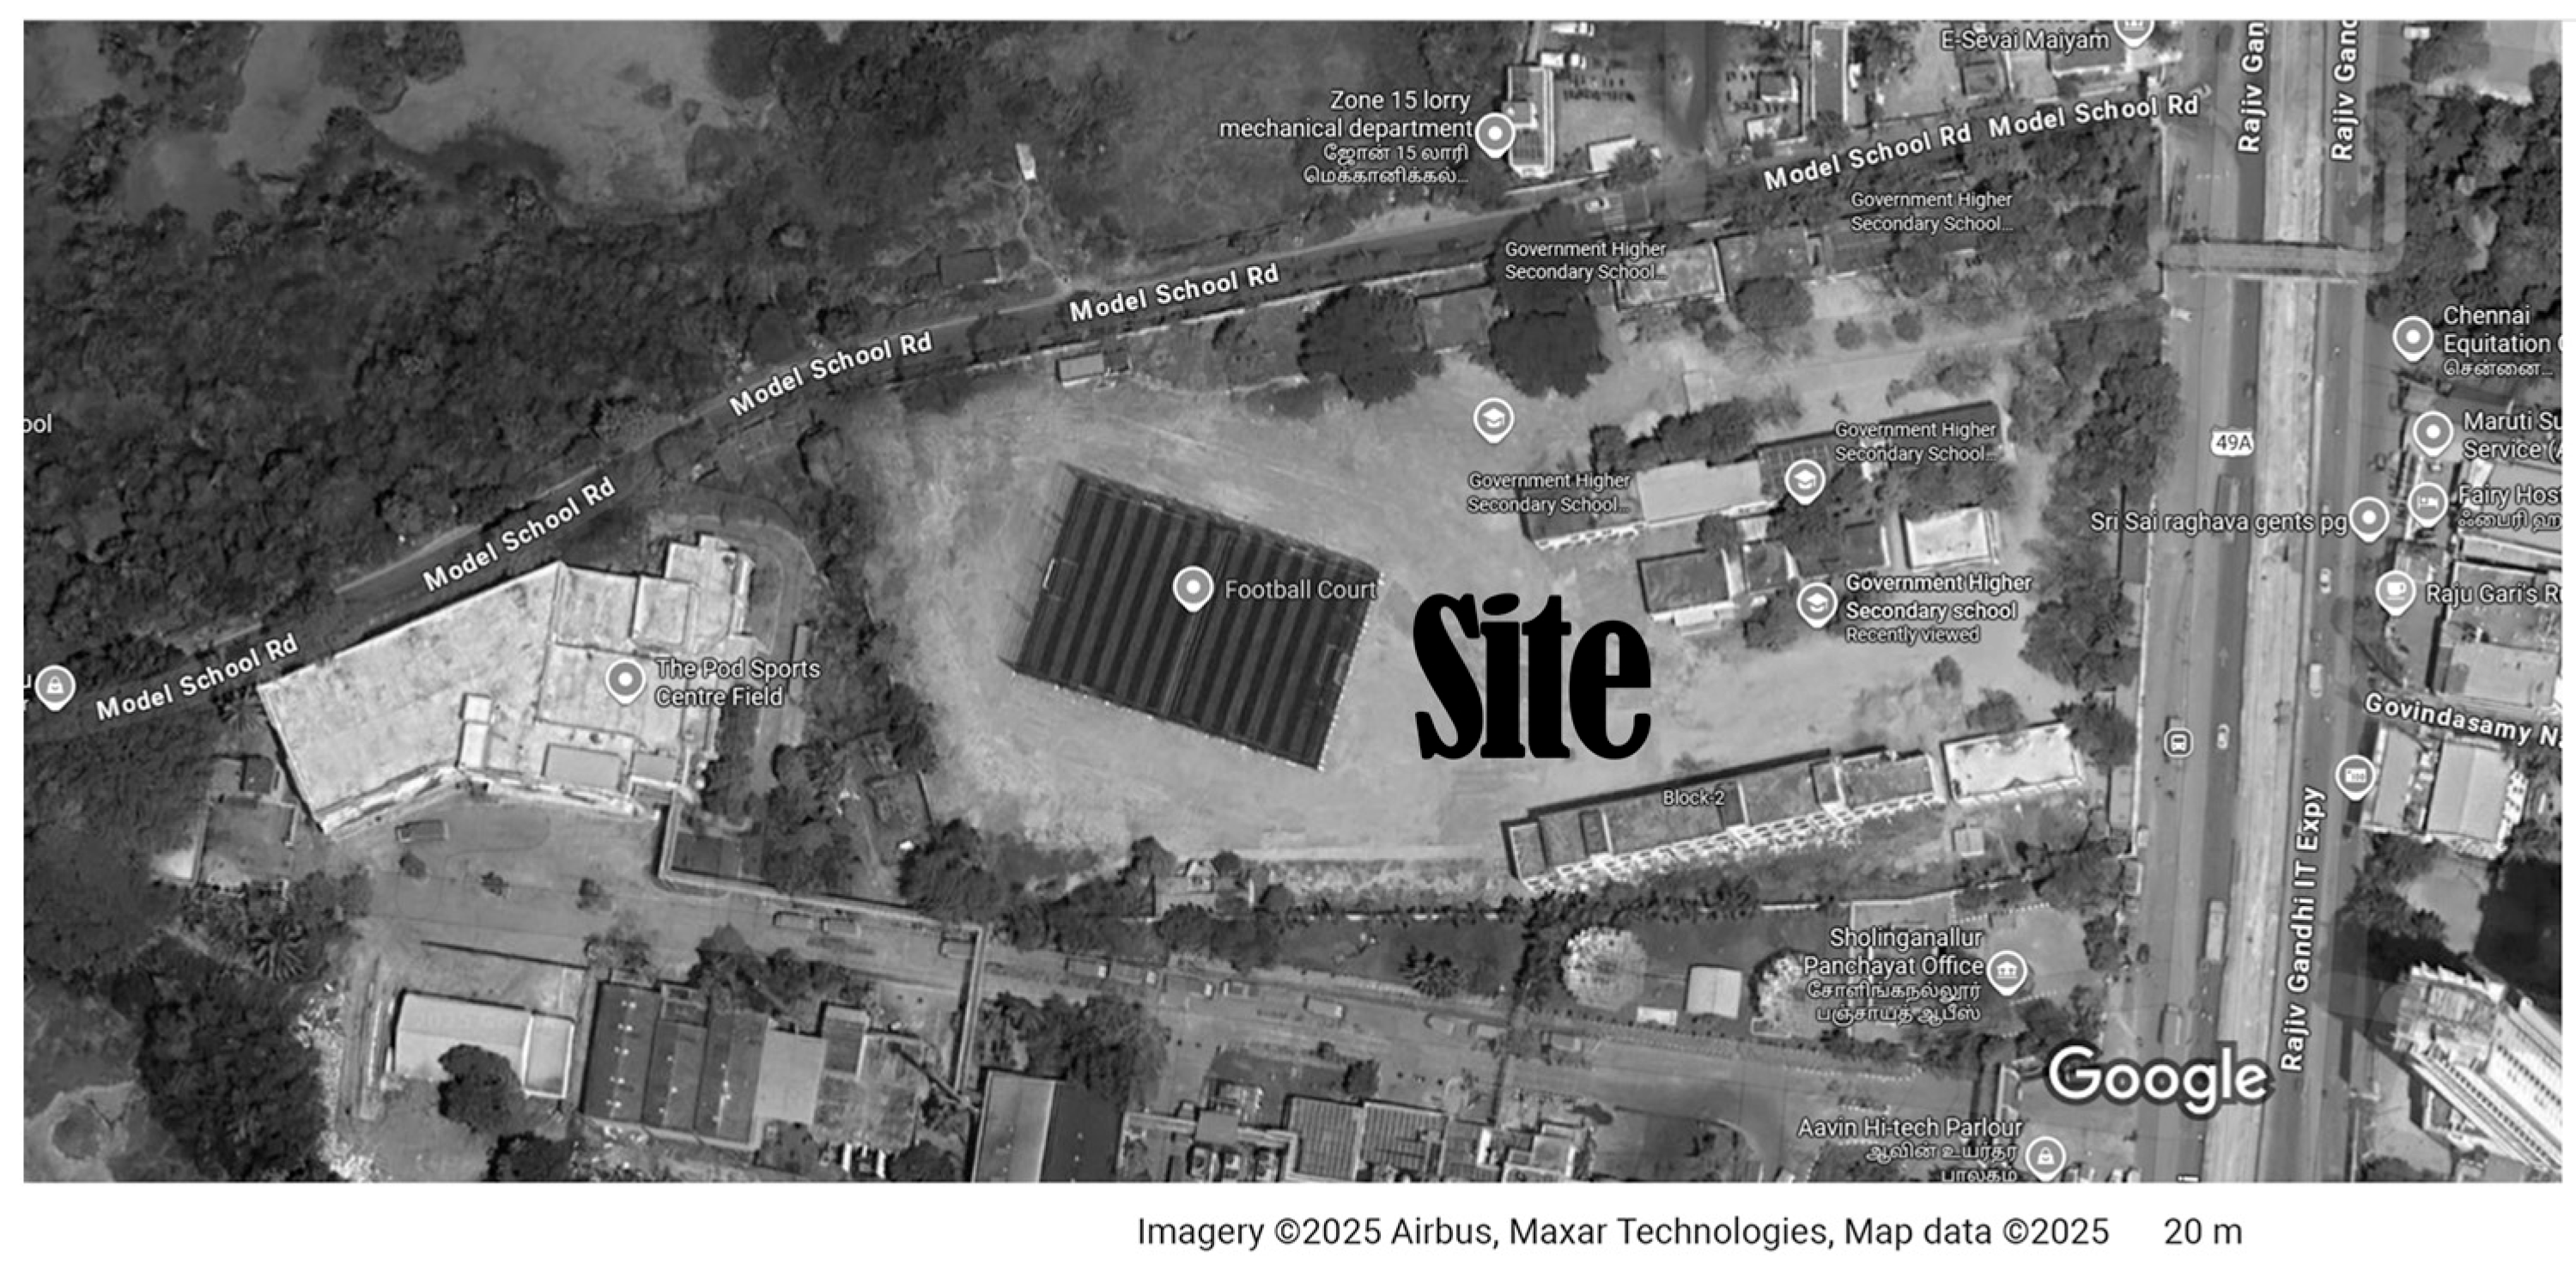
The Government Higher Secondary School campus, located in Sholinganallur, South Chennai (
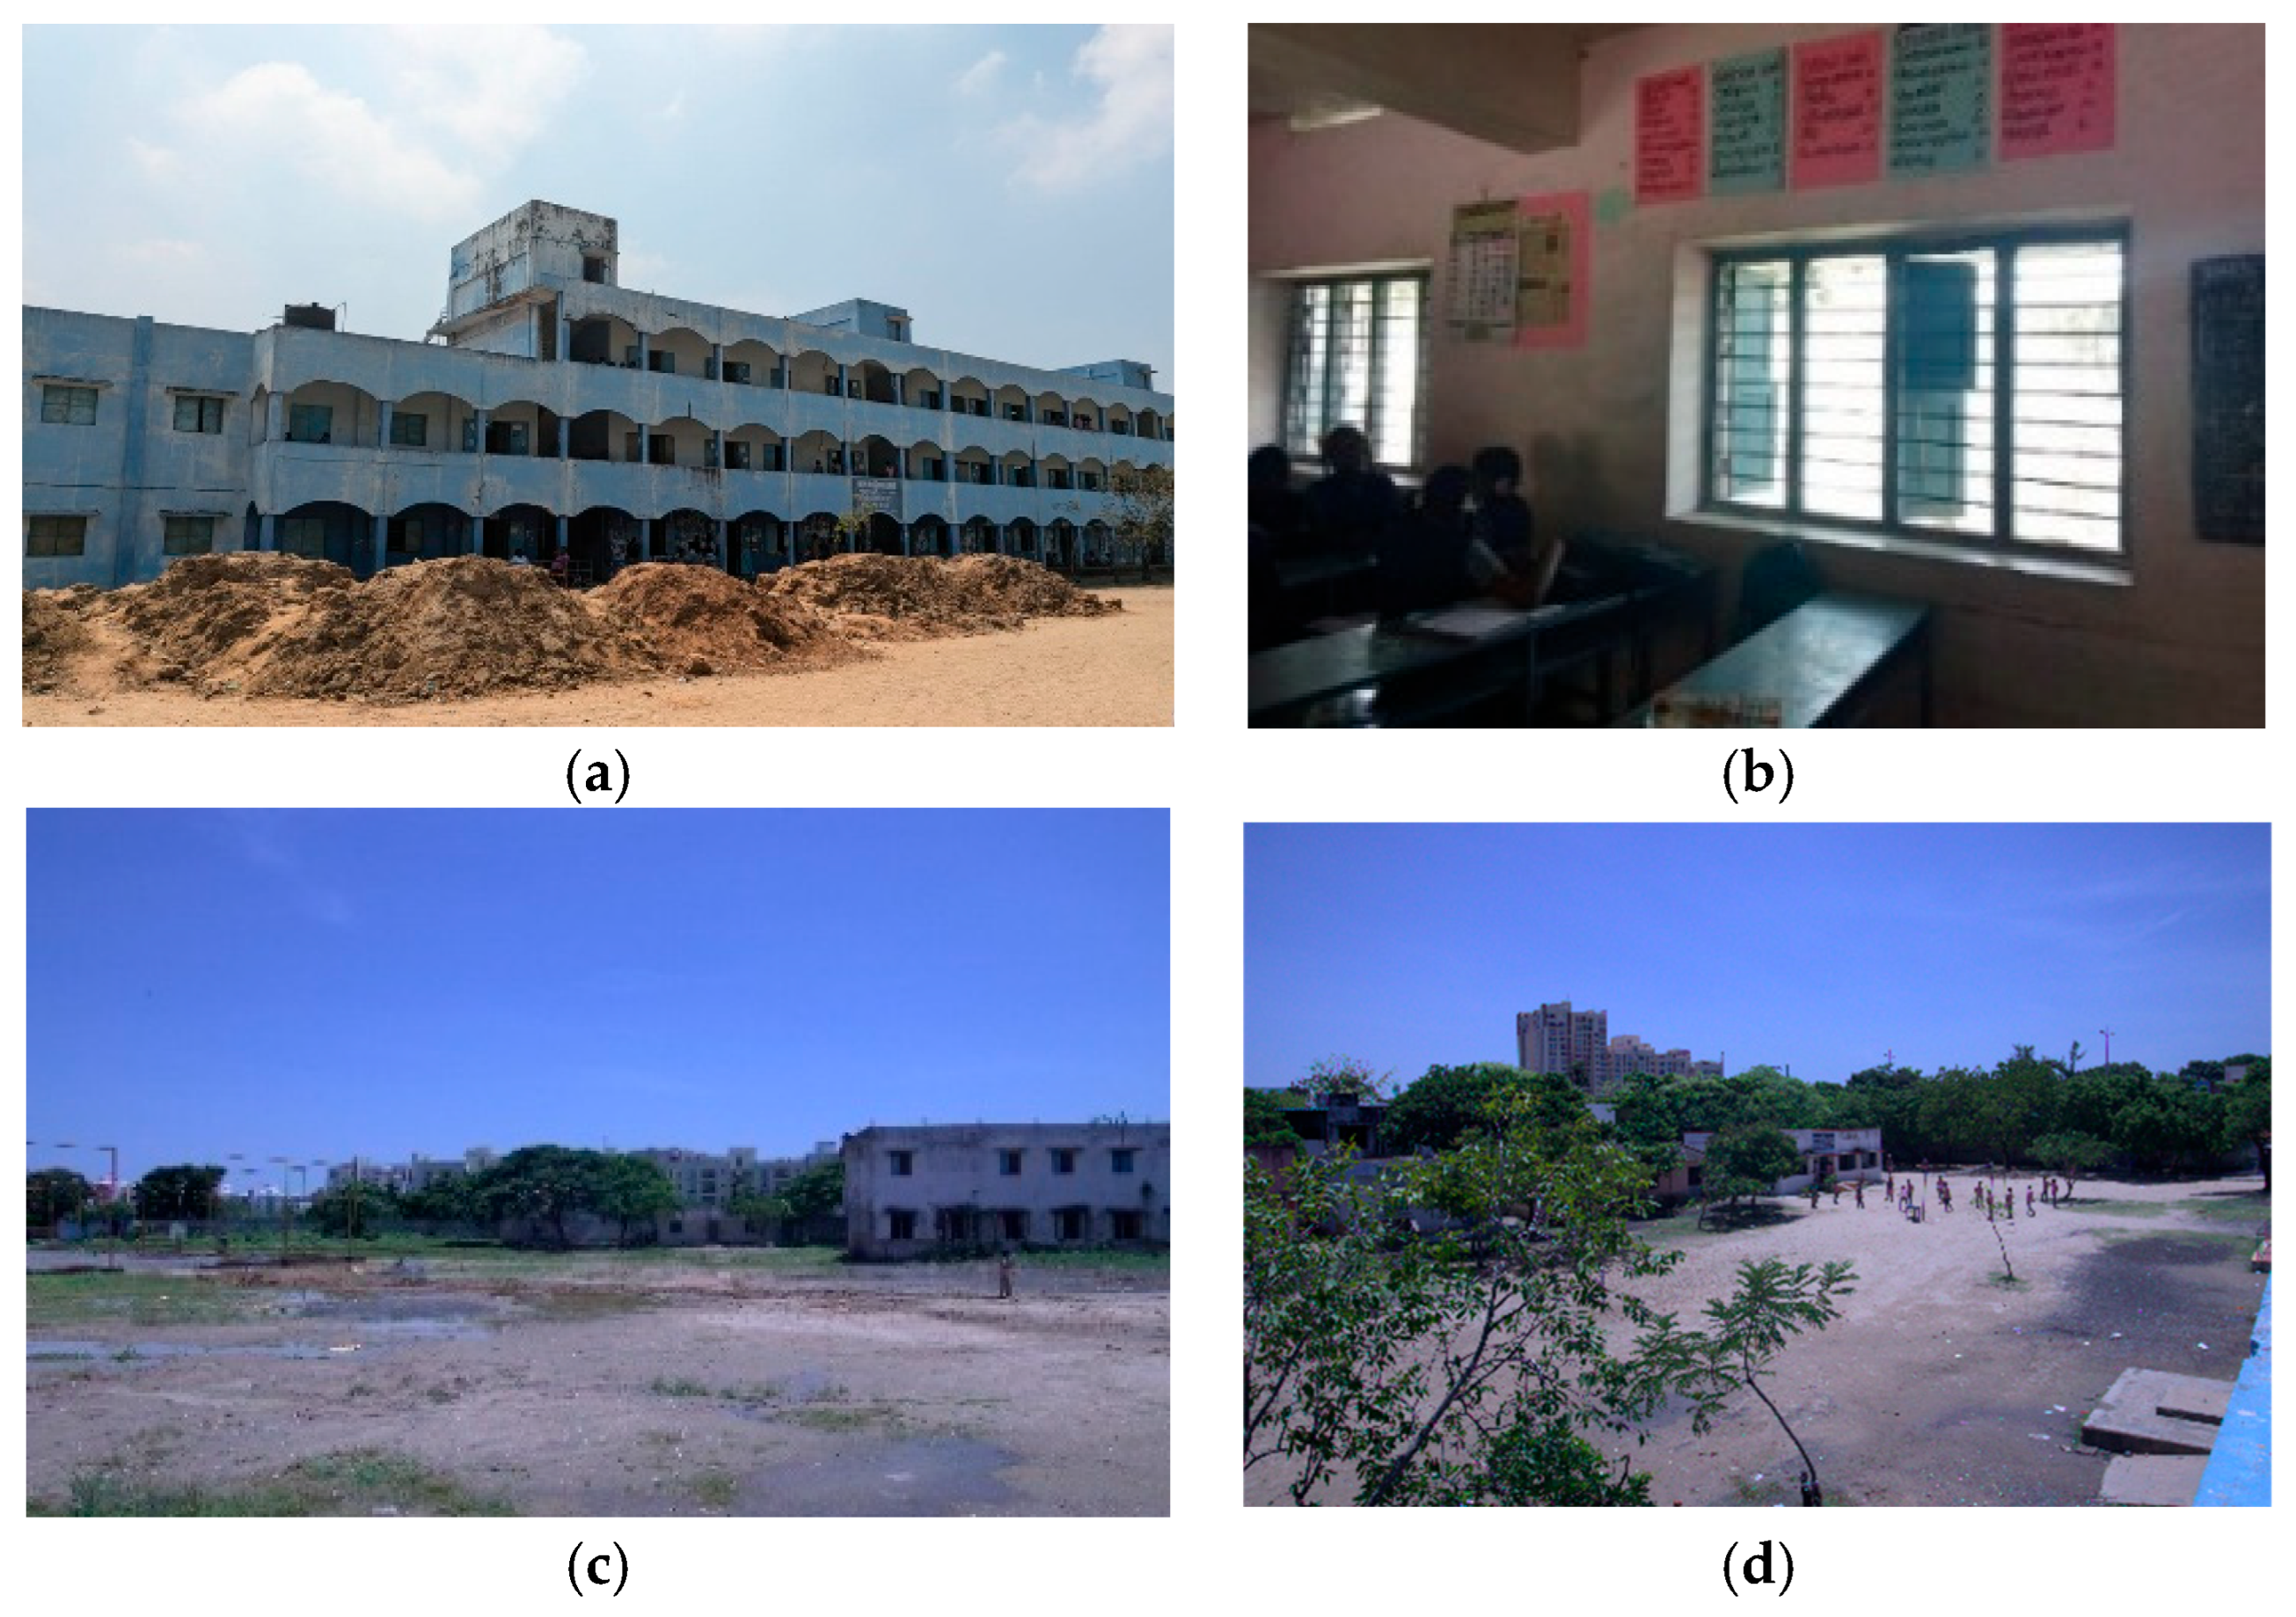
Figure 5), was selected as the case study to assess the extent to which building orientation, block placement, and landscaping strategies contribute to optimizing daylight performance in classrooms. The campus spans a total site area of 24,281 square meters, of which 8093 square meters is built-up, while 12,140 square meters is allocated to playgrounds. This yields a built-up-to-open space ratio of 1:3, suggesting significant potential for facilitating daylight access, integrating landscape features, and supporting outdoor physical activity. The school is situated along the 18-m-wide Old Mahabalipuram Road (OMR). The surrounding context includes a milk factory on one side and a mix of residential, commercial, and office developments on the opposite side. Within the site, the building blocks are organized linearly along a northwest–southeast axis, reflecting the natural orientation of the site. However, the rationale for the placement and spacing of these blocks is unclear, as the campus appears to have evolved incrementally and without a comprehensive master plan.
Figure 6a–d show the existing conditions of the school.
2.2. Field Measurement
In the selected school, the doors and windows serve as the primary sources of daylight for the interior spaces. Accordingly, details regarding the window dimensions and placement, the presence of sunshades, corridor widths, and the positioning of trees within the site were systematically documented. The school is equipped with either steel or timber windows, typically without glazing, owing to concerns related to durability and maintenance. However, when these windows are closed, they obstruct natural daylight, resulting in a complete reliance on artificial lighting and mechanical ventilation. This condition not only elevates energy consumption but contributes to reduced thermal comfort for the occupants.
Spatial Configuration and Layout of Classrooms
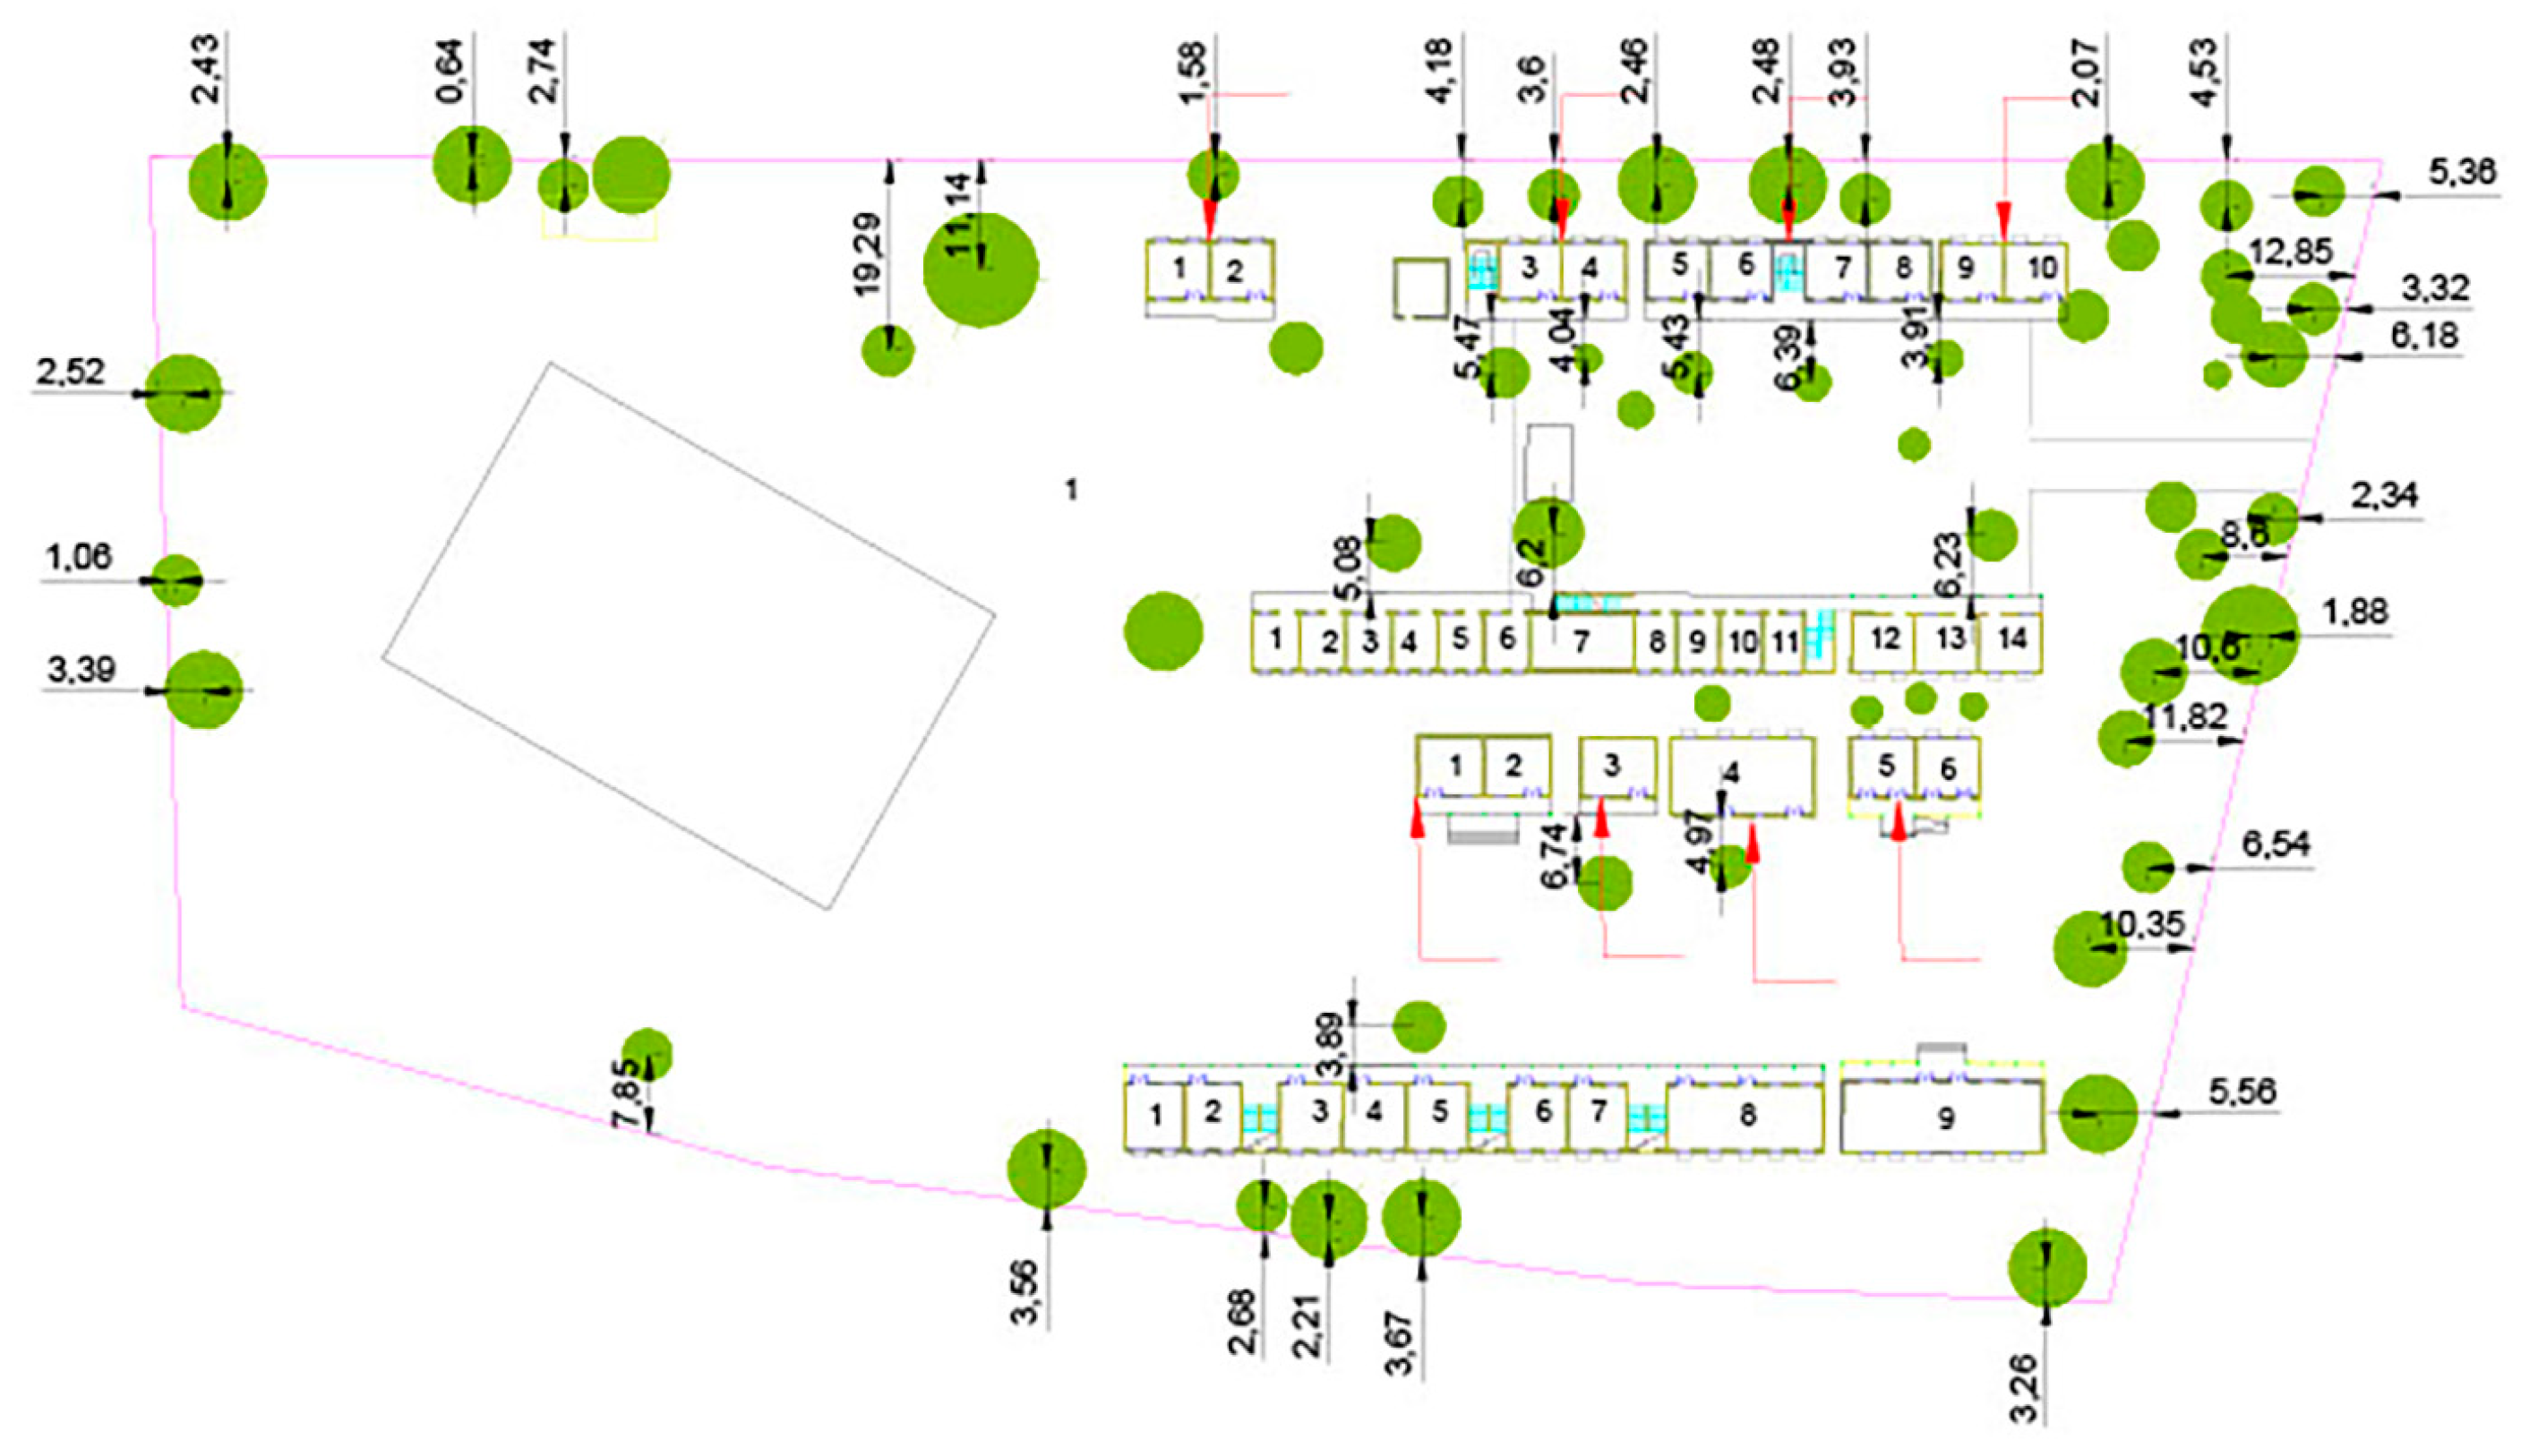
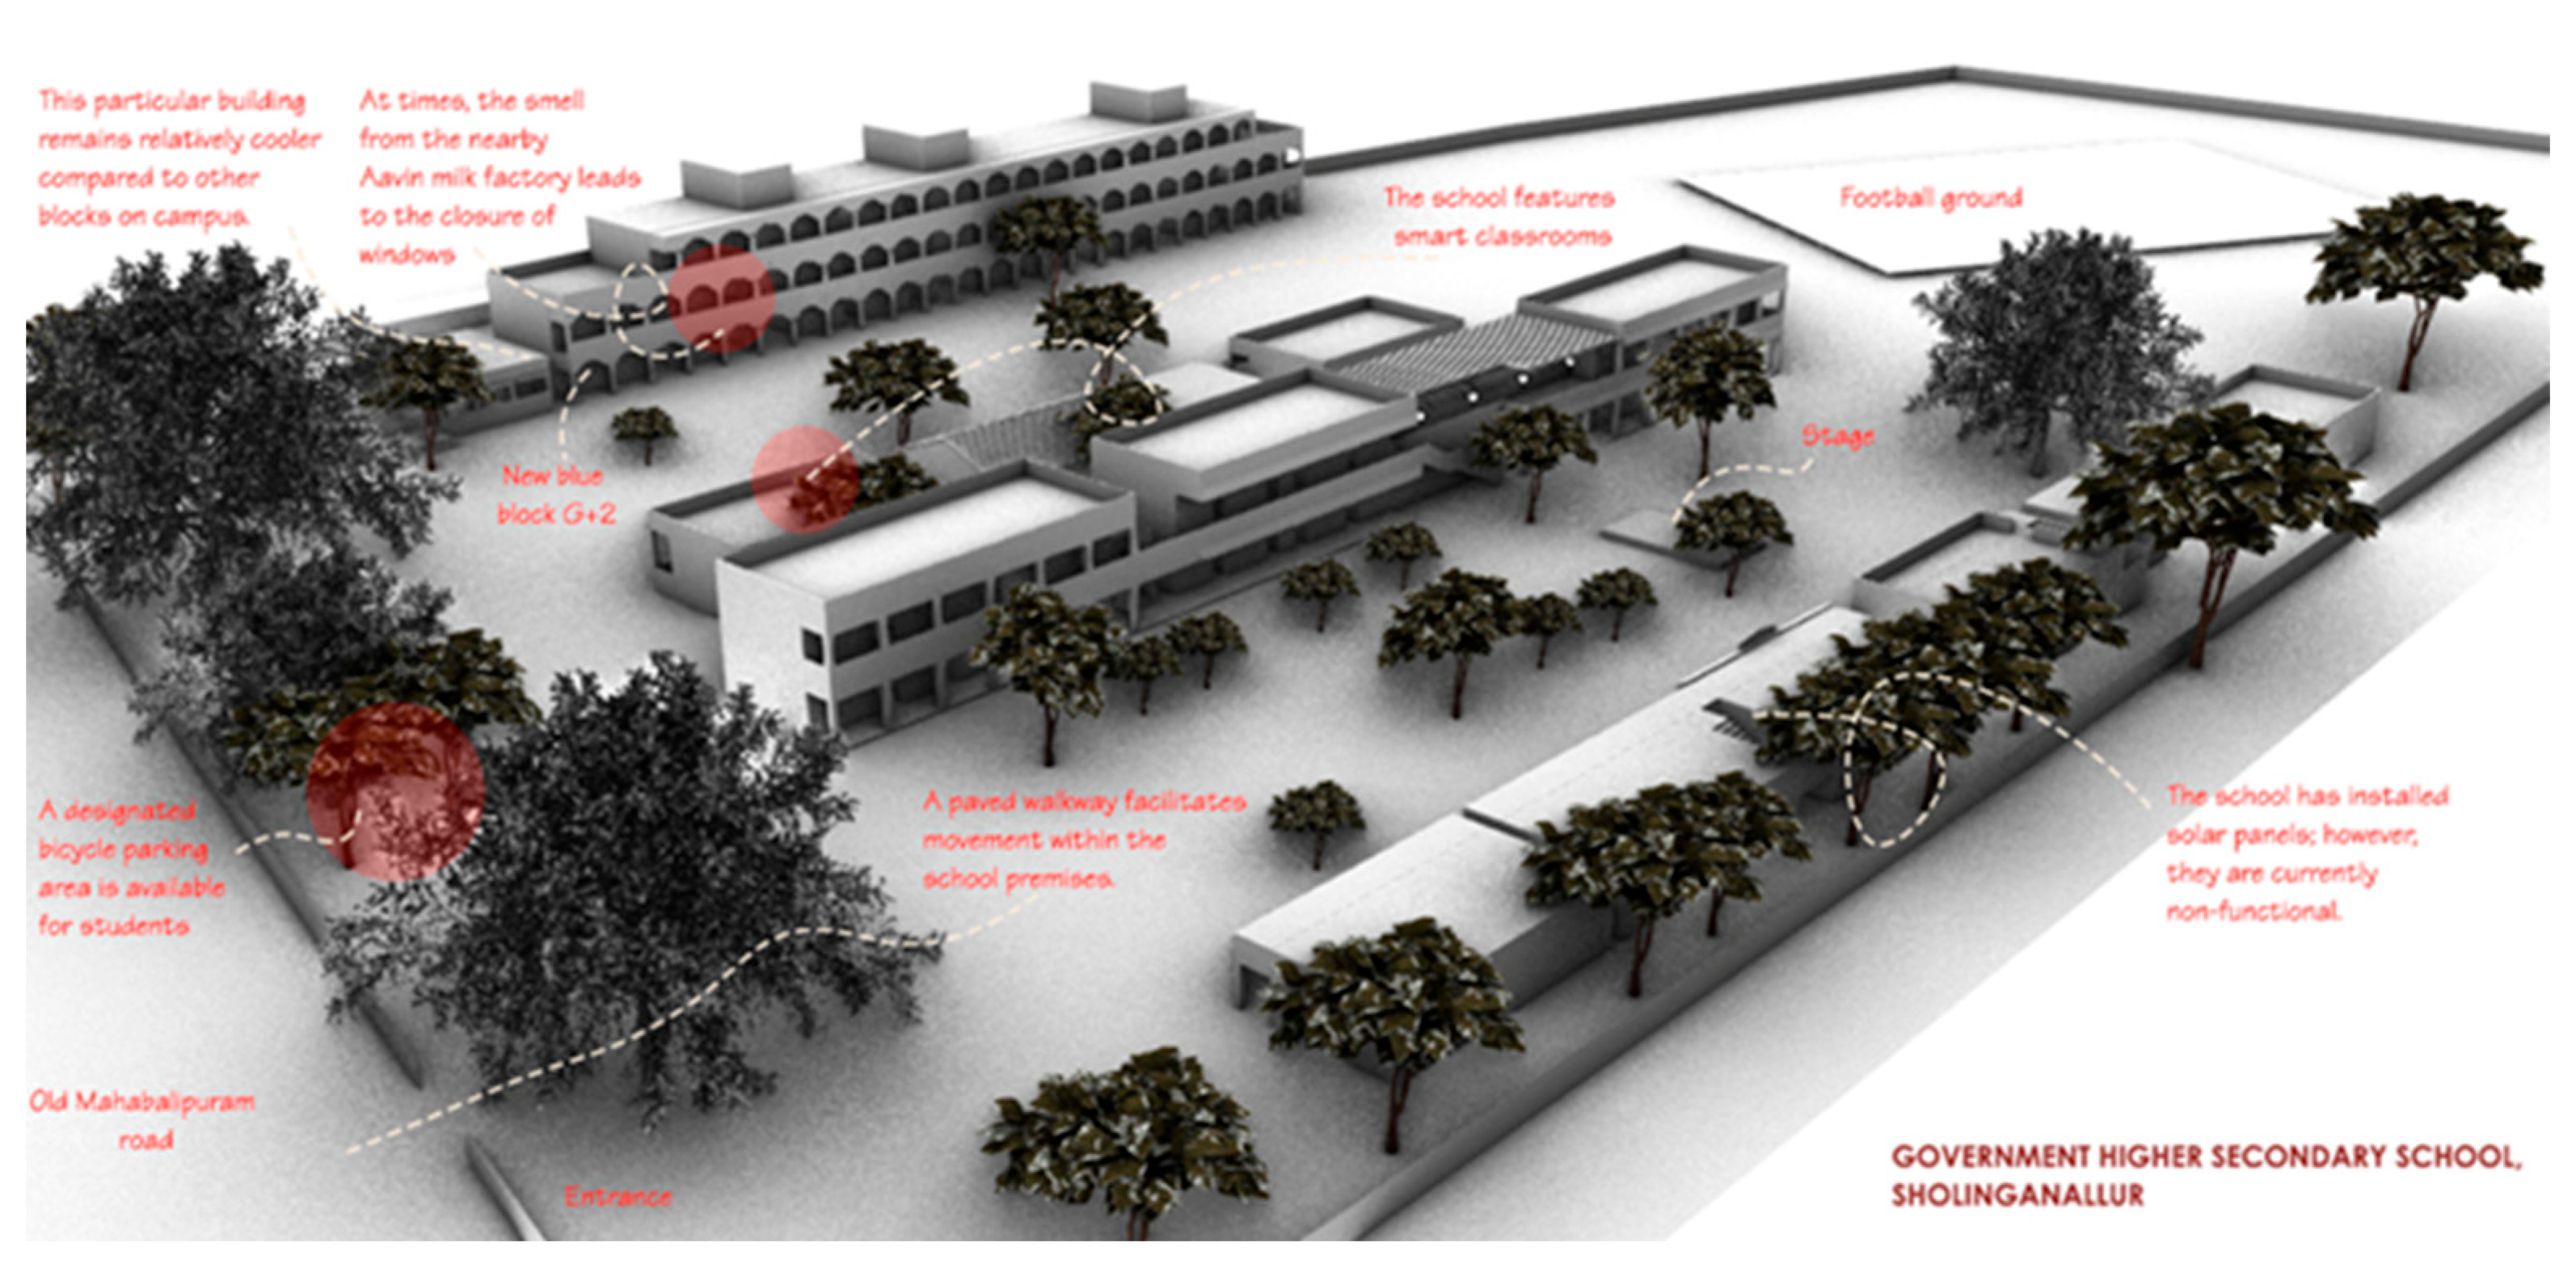
The school consists of ten blocks arranged linearly, accommodating classrooms, laboratories, libraries, and staff rooms. Corridors of varying widths connect these blocks, while trees are positioned irregularly across the campus (
Figure 7). The uneven distribution of vegetation indicates the absence of deliberate landscape planning, resulting in inconsistent shading patterns and daylight access. This uncoordinated layout, when combined with the site’s solar geometry and the relatively narrow 8-m spacing between central blocks, creates distinct microclimatic conditions.
Although not all blocks within the school have four storeys, they were modelled as such in order to evaluate their daylight performance under potential future vertical expansion scenarios. This approach was informed by the recent revision of building height regulations, which now permit construction up to 18.30 m, in accordance with the Tamil Nadu Combined Development and Building Rules (TNCD&BR, 2019).
Lighting performance was assessed using established benchmarks, such as IS 3646:1992, which recommends illuminance levels for classrooms in educational settings that range from 200 to 300–500 lx and LEED v4.1 visual comfort standards.
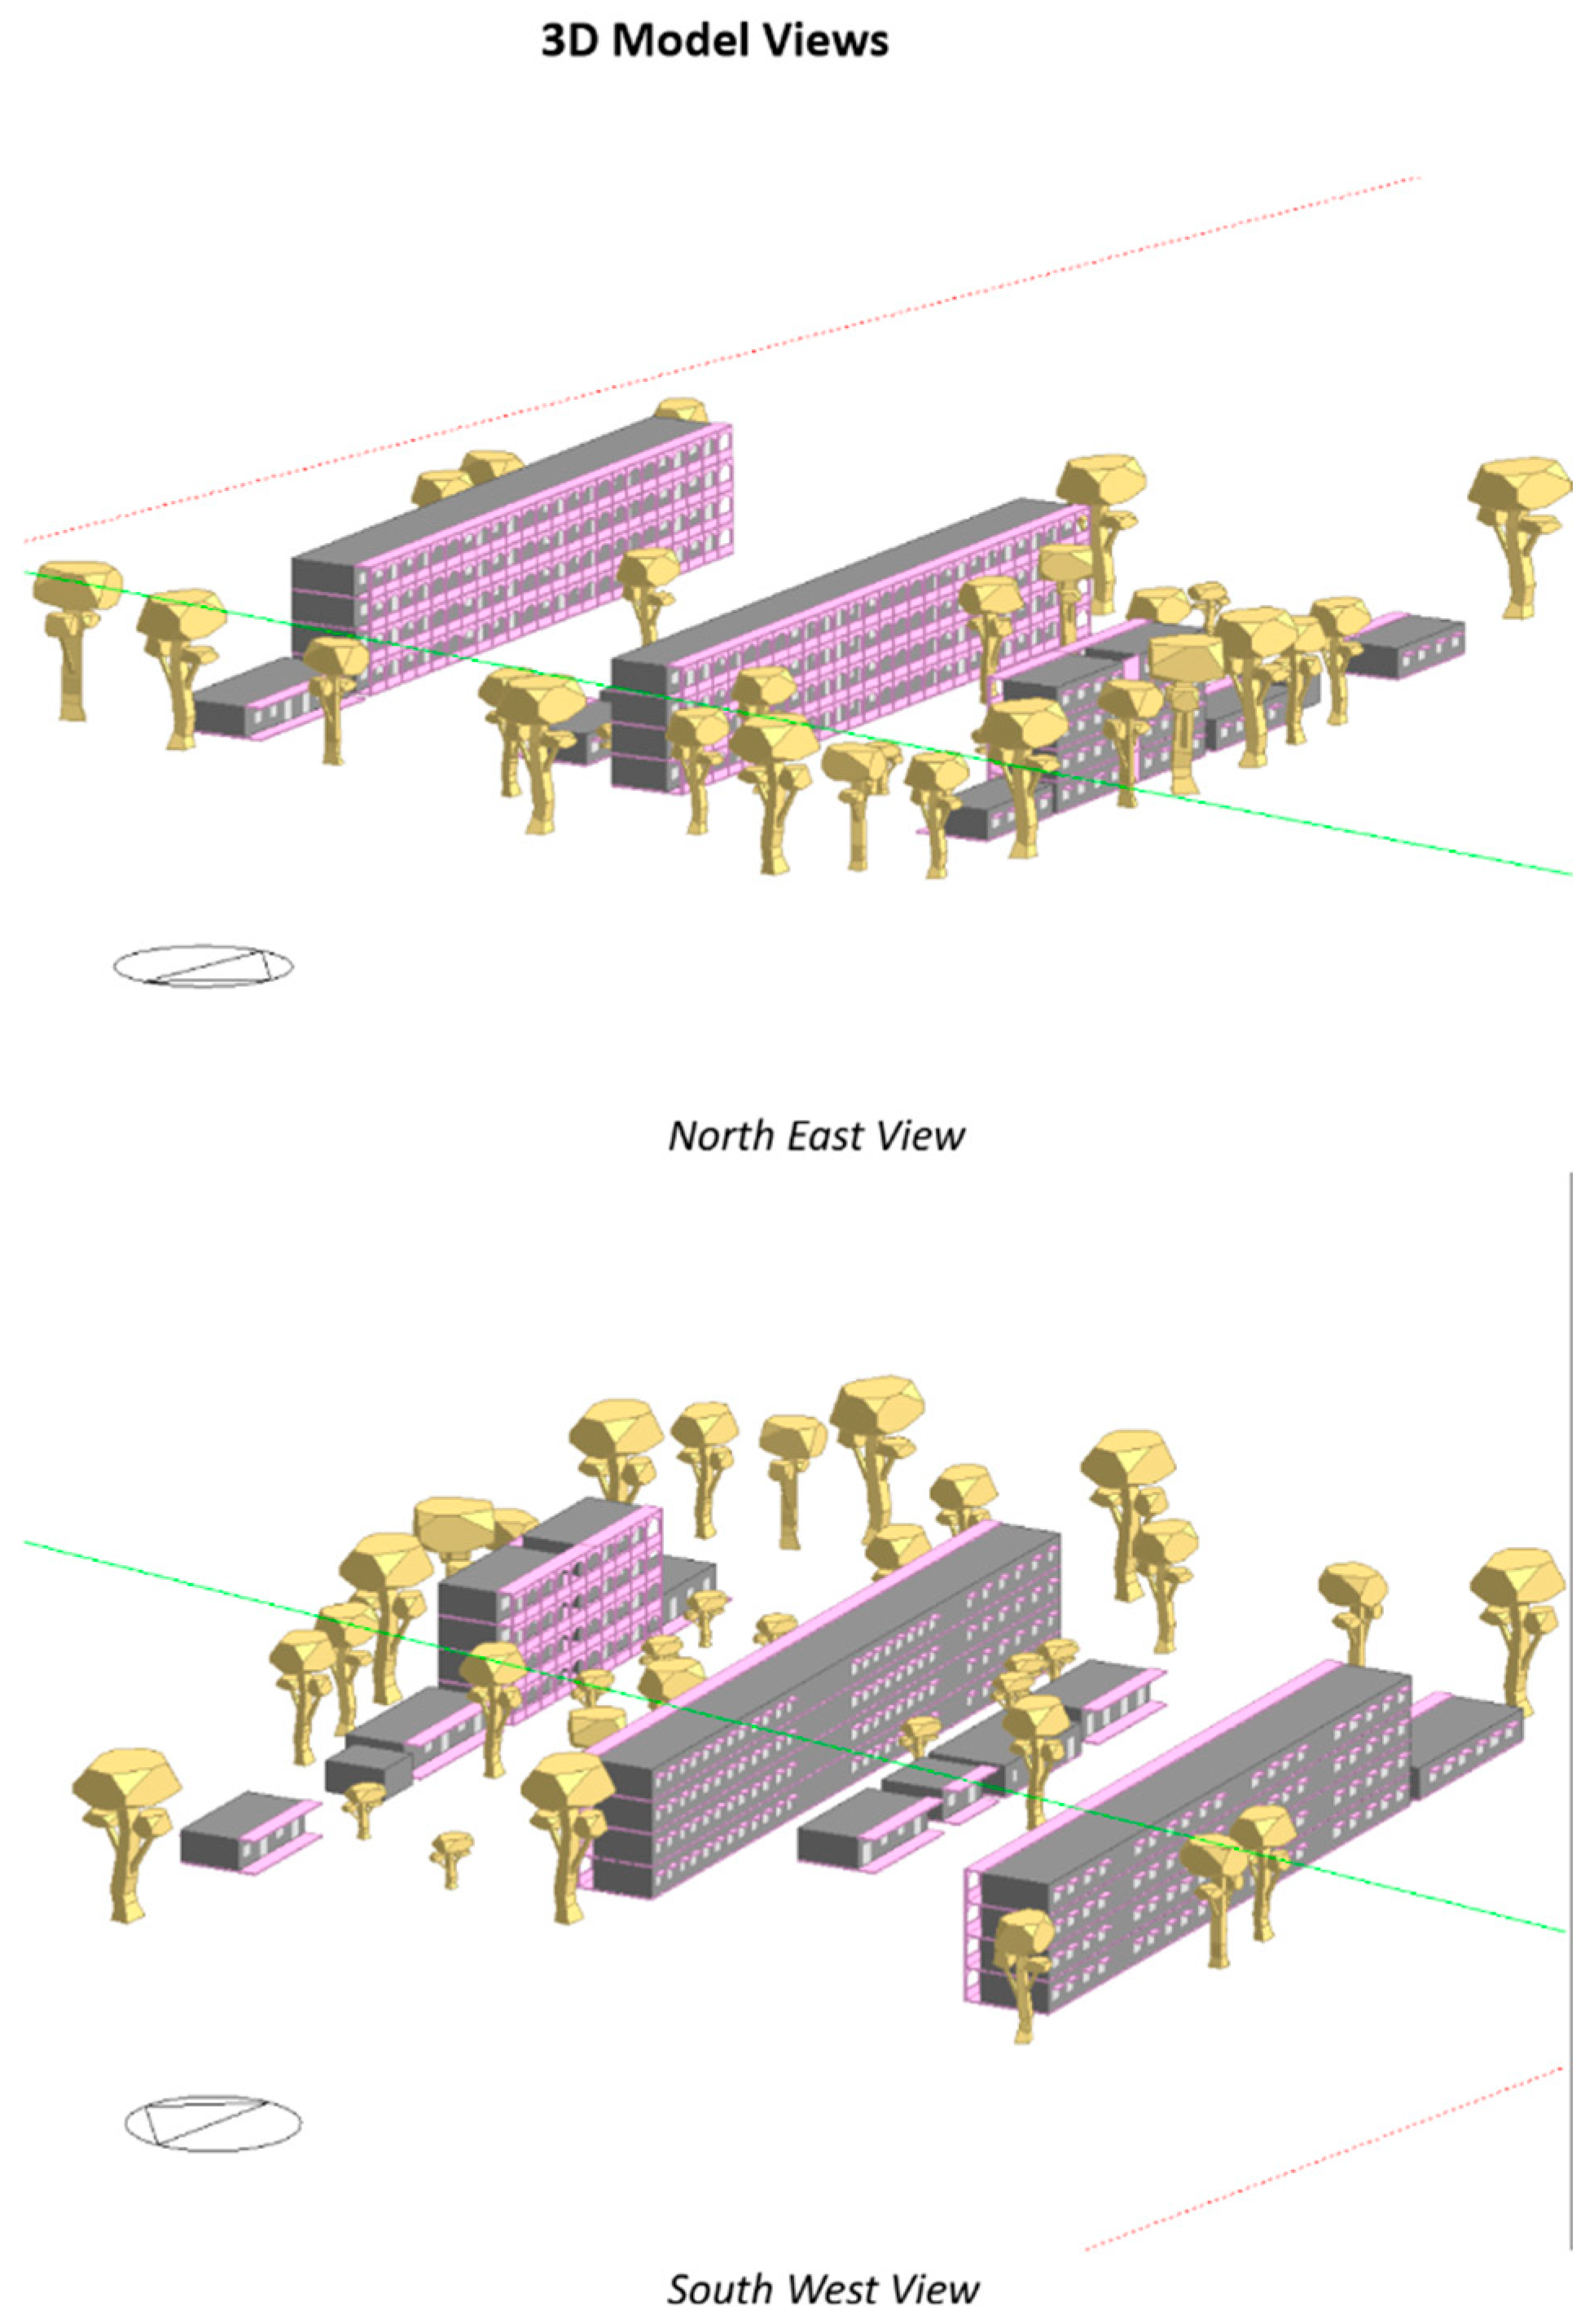
For simulation, DesignBuilder 7.4 with RADIANCE plug-ins were employed to model the school blocks (
Figure A1). A base case model (
Figure A2) was first established to serve as the reference configuration against which all subsequent design variations were evaluated. The material reflectance properties used in the simulation are presented in
Table A2. This baseline model enabled the assessment of daylight performance indicators—useful daylight illuminance (UDI), spatial daylight autonomy (sDA), and annual sunlight exposure (ASE)—under conditions of minimal obstruction and without vegetation shading. Subsequent scenarios introduced incremental modifications, including variations in vegetation presence (
Figure 8a–c) and floor levels, in order to systematically evaluate their influence on daylight performance. In these scenarios, additional trees were positioned along external window-facing façades rather than corridor-facing sides, to maximize their potential impact on daylight distribution. A series of simulations was conducted to test these variations, and the resulting data were analysed using statistical methods to identify trends and correlations among the key parameters. This systematic approach facilitated an evidence-based assessment of the interaction between vegetation, building orientation, WWR, and floor level on daylight performance.
3. Results
3.1. Simulation Results
The simulation results show that WWR, orientation, tree shading, and floor levels influence daylight performance in schools. The daylight performance is strongly influenced by vegetation, floor level, and orientation. Moderate vegetation creates a balanced outcome with good UDI (19.42–99.13%) and reduced glare (ASE ≤ 12.45%), while denser tree cover further lowers glare (ASE ≤ 5.66%) but reduces the daylight autonomy (sDA as low as 0.00%) due to excessive shading.
A floor level analysis shows that the upper floors generally benefit from better daylight access, though the performance is variable. The second floor demonstrates a low glare risk (ASE < 10%) but also records the lowest sDA (0.00%), likely from external obstructions. The ground floor performs moderately (sDA 4.05–93.58%) but is vulnerable to shading from its surroundings.
In terms of orientation, southeast-facing spaces achieve the highest daylight potential (sDA up to 100%, UDI up to 100%) but are more susceptible to glare (ASE up to 16.06%), whereas northwest-facing spaces provide steadier daylight conditions with lower glare risk (ASE ≤ 12.45%), though with slightly lower daylight autonomy (sDA up to 95.47%).
Table 1,
Table 2 and
Table 3 show the factors influencing ASE, UDI and sDA.
Among the simulation results meeting the criteria of sDA > 75%, UDI > 75%, and ASE < 10%, 11 out of 13 successful scenarios included either Existing Site Trees or Additional Trees, highlighting the essential role of external shading in ensuring balanced daylight performance. The analysis shows that the best daylight performance was achieved on the ground and third floors, where orientation and vegetation played key roles. Southeast-facing rooms delivered very high daylight availability (sDA up to 97.9%, UDI up to 90.1%) but also experienced higher risks of glare (ASE up to 7.2%) at larger window ratios, underscoring the importance of glare control. By contrast, northwest-facing rooms offered more balanced conditions, with lower ASE (3.8–5.7%) while still maintaining strong sDA and UDI values. Moderate vegetation density was particularly effective in limiting excessive sunlight while preserving daylight quality. Overall, upper floors—especially the third floor—performed consistently well due to increased sky exposure, while ground-floor spaces achieved good results when glazing, orientation, and tree cover were carefully coordinated.
3.2. Statistical Tests
This study also employed a multiple regression framework to evaluate how various architectural and contextual factors influence key daylight performance metrics. The independent variables included the following factors:
WWR (window-to-wall ratio): A continuous variable representing the proportion of glazing, tested at 20%, 30%, 40%;
Orientation: A categorical variable coded as 0 for southeast-facing façades and 1 for northwest-facing façades;
Trees: A binary categorical variable where 0 indicates the absence of nearby trees, 1 indicates existing site trees, and 2 indicates additional trees. After placing trees strategically next to the buildings, the percentage of trees on the site is 6.46%.
Floor: A categorical variable representing the vertical position in the building (Ground Floor = 0, First Floor = 1, Second Floor = 2, Third Floor = 3), with the Ground Floor serving as the baseline.
The dependent variables assessed in this analysis were as follows:
Spatial daylight autonomy (sDA Area in Range in %);
Annual sunlight exposure (ASE Area in Range in %);
Useful daylight illuminance (UDI Area in Range in %)
The simulation results indicated that the 30% window-to-wall ratio (WWR) condition yielded the most favourable outcomes across the ASE, UDI, and sDA metrics. Consequently, subsequent simulations incorporating additional trees were conducted using the 30% WWR configuration.
Results from Statistical Tests
The regression model used a ground-floor classroom with additional trees, baseline orientation, and a 30% WWR as the reference scenario. The results showed excellent predictive accuracy for daylight performance, with a UDI of 97.7%, indicating that nearly all occupied hours met desirable daylight conditions under this setup. This highlights the effectiveness of moderate window sizing combined with strong external shading. Notably, floor level and orientation were not statistically significant, suggesting that once the WWR and tree coverage are considered, these factors do not independently influence the UDI. The findings emphasize that façade design and vegetation integration are the primary drivers of daylight quality.
The Pareto diagram (
Figure 9) demonstrates that the window-to-wall ratio (WWR) and tree coverage are the primary, statistically significant predictors of useful daylight illuminance (UDI). Their standardized effects (
Table A3) exceed the threshold line for significance (1.97), confirming their strong influence on daylight performance. By contrast, floor level and orientation fall below this threshold, indicating that their effects are not statistically meaningful once the dominant influences of the WWR and vegetation are taken into account.
The correlation analysis (
Table 4) shows trade-offs among daylight performance metrics. The values for sDA and ASE are moderately positively correlated, meaning that increasing daylight autonomy can also raise the risk of excessive sunlight and glare. The ASE and UDI, however, are strongly negatively correlated, indicating that higher direct sunlight exposure reduces the amount of daylight within the comfortable range. A mild negative relationship between sDA and UDI further suggests that greater daylight autonomy does not necessarily improve the overall daylight quality, as periods of over-illumination may compromise visual comfort.
The “Additional Trees” scenario was chosen as the baseline because it delivered the best daylight performance of the three shading strategies. Tree coverage had a clear impact on all metrics; although the Additional Trees scenario reduced the sDA on both the southeast and northwest façades, they greatly improved both the daylight quality (UDI) and the glare control (ASE). By contrast, the No Trees and Existing Site Trees scenarios led to significant declines in the UDI and increases in glare. Overall, dense and well-placed vegetation emerged as a critical factor for improving visual comfort by limiting glare while still maintaining good daylight quality.
4. Findings and Discussion
On the ground floor, a window-to-wall ratio (WWR) of either 30% or 40% is recommended. A 30% WWR is the most secure and consistent option, performing well under all arboreal conditions. By contrast, a 40% WWR allows more natural daylight into the space while still controlling glare effectively, particularly when the Site Trees scenario provides shading.
For the first floor, the optimal choice is a 40% WWR. This option delivers excellent daylight performance, achieving sDA values above 90%, but it does depend heavily on the presence of trees. A 30% WWR is available as a more conservative alternative, offering reduced brightness but greater independence from site conditions.
The second floor can also support either a 30% or 40% WWR. Both perform well, provided that trees are present to balance the incoming daylight. However, introducing a greater density of additional trees may block excessive amounts of light, which makes the performance of higher WWRs less reliable.
On the third floor, the best-performing and most flexible solution is a 30% WWR. This ratio works consistently well across orientations and regardless of whether trees are present. A 40% WWR is also viable and can improve natural light levels, though it carries slightly more risk of glare.
For the fourth floor, only a 30% WWR is considered suitable. Larger WWRs allow too much direct sunlight, causing useful daylight illuminance (UDI) to fall below the 50% threshold. Even at 30%, success is dependent on the presence of dense shading from the “Additional Trees” scenario, which filters excessive sunlight and maintains balanced daylight.
This analysis ranked trees as the most influential factor for daylight metrics (ASE, sDA, UDI), followed by WWR, while orientation and floor level had minimal impact. The optimal WWR was found to be between 30% and 40%, consistent with Alkhatatbeh et al., who reported that a 38% WWR performed best for south-facing classrooms in Miami’s hot–humid climate, though northeast-facing designs offered better overall daylight and energy balance [
25]. Tree coverage strongly shaped daylight outcomes, aligning with Rostami et al., who confirmed its dominant role in reducing daylight autonomy in green canyons [
26]. Kumar et al. further emphasized that the cooling performance of urban trees depends on local climate, urban morphology, and species characteristics [
27].
5. Conclusions and Recommendations
Beyond enhancing daylight quality and thermal comfort, the integration of green infrastructure offers multiple co-benefits, including biodiversity support, stormwater regulation, and the creation of outdoor learning environments. Embedding landscape provisions into school infrastructure codes—particularly with requirements for native green cover—can help establish climate-resilient, low-energy, and student-centred learning environments. Such interventions not only improve indoor environmental quality but advance broader sustainability objectives within rapidly urbanizing Indian cities.
For Chennai, suitable species include the following: Neem (
Azadirachta indica), valued for dappled light, drought resistance, and pest-repellent properties [
28,
29]; Indian Beech (
Millettia pinnata), which provides dense shade and nitrogen fixation; Rain Tree (
Samanea saman), offering expansive canopies for large campuses; and Punnai (
Calophyllum inophyllum), a coastal evergreen tolerant of salt spray. Orientation alone does not guarantee effective daylight: unshaded south-facing façades may still perform poorly, while west-facing façades can be improved with mitigation strategies, such as deciduous tree cover or vertical shading devices. Exceeding the 30–40% WWR range without external shading risks excessive ASE and thermal discomfort. The WWR should therefore be assessed in conjunction with orientation and shading.
At the floor level, daylight performance (sDA and UDI) was broadly consistent between the upper and lower floors, though the latter are more prone to glare from ground-reflected light, especially when adjacent to high-albedo surfaces. Mitigation strategies include using low-reflectance ground treatments, such as grass, mulch, or dark paving, combined with low shrubs to scatter the reflected light.
A summary of the key findings and architectural recommendations is presented in
Table 5.
6. Limitations and Scope for Future Research
In this study, tree components were modelled with a canopy transmittance value of 0.0, representing fully opaque conditions. This assumption was adopted to examine the extreme scenario of maximum shading potential on daylight performance. While this approach provides useful insights into maximum shading potential, it does not capture the variability in light transmission associated with different tree species and canopy densities. Future research could address this by incorporating varying leaf transmittance values, thereby reflecting the daylight conditions created by semi-transparent or seasonal canopies. Additionally, the influence of trees on the thermal performance of buildings was beyond the scope of this study. Expanding the analysis to include indigenous tree species would enable an assessment of their combined effects on daylight availability, energy efficiency, and visual comfort. Such investigations could also explore the role of vegetation in enhancing the urban green infrastructure, thereby linking building-level design strategies with broader sustainability and climate resilience objectives.
Author Contributions
Conceptualization and methodology, L.S. and J.J.; validation, formal analysis, investigation, data curation, writing—original draft preparation, J.J.; writing—review and editing, L.S. and J.J.; supervision, L.S. All authors have read and agreed to the published version of the manuscript.
Funding
This research did not receive any external funding.
Data Availability Statement
The data sets generated cannot be published now due to privacy and ongoing research.
Acknowledgments
The authors wish to acknowledge the support provided by the Tamil Nadu Department of School Education for granting permission to undertake this study.
Conflicts of Interest
The authors declare no conflicts of interest.
Abbreviations
The following abbreviations are used in this manuscript:
| sDA | Spatial Daylight Autonomy |
| ASE | Annual Sunlight Exposure |
| UDI | Useful Daylight Illuminance |
| TNCD&BR | Tamil Nadu Combined Development and Building Rules, 2019 |
| WWR | Window-to-Wall Ratio |
| lx | Lux |
| CBDM | Climate-based Daylight Modelling |
| W/m2 | Watt per square meter |
Appendix A
Table A1.
Minimum land requirement for school as one contiguous land in Tamil Nadu.
Table A1.
Minimum land requirement for school as one contiguous land in Tamil Nadu.
| S. No | Location | Minimum Land
Requirement | Minimum Land
Requirement (sqm) |
|---|
| 1 | Metropolitan Development
Authority Area | 5 grounds | 1114.84 |
| 2 | Corporation (other than Metropolitan Development Authority Area) | 6 grounds | 1337.8 |
| 3 | District Head Quarters | 7 grounds | 1560.77 |
| 4 | Municipality | 8 grounds | 1783.74 |
| 5 | Town Panchayat | 10 grounds | 2229.67 |
| 6 | Village Panchayat | 2 acres | 8093.72 |
Table A2.
Reflectance properties assigned in simulation in DesignBuilder 7.4.
Table A2.
Reflectance properties assigned in simulation in DesignBuilder 7.4.
| Reflectance Properties |
|---|
| | Floor and roof properties | Wall properties |
| Thermal absorptance | 0.9 | 0.9 |
| Solar absorptance | 0.7 | 0.6 |
| Visible absorptance | 0.7 | 0.6 |
| Texture | Brushed flat concrete | Brushed flat concrete |
| | Radiance Daylight |
| Floor and roof properties | Wall properties |
| Material class | 1-plastic | 1-plastic |
| Reflectance | 0.7 | 0.7 |
| Specularity | 0 | 0 |
| Roughness | 0 | 0 |
Table A3.
Standardized regression coefficients.
Table A3.
Standardized regression coefficients.
| | Unstandardized
Coefficients | Standardized
Coefficients | | | | 95% Confidence Interval for B |
|---|
| Model | B | Beta | Standard error | t | p | Lower Bound | Upper Bound |
|---|
| Constant | 116.88 | | 4.25 | 27.52 | <0.001 | 108.53 | 125.23 |
| WWR | −0.62 | −0.25 | 0.08 | −7.51 | <0.001 | −0.79 | −0.46 |
| Orientation 1 | −1.75 | −0.03 | 2.3 | −0.76 | 0.448 | −6.28 | 2.78 |
| Floor | −0.12 | −0.01 | 0.82 | −0.15 | 0.883 | −1.74 | 1.49 |
| Trees 1 | −28.93 | −0.46 | 2.61 | −11.09 | <0.001 | −34.06 | −23.8 |
| Trees 0 | −58.15 | −0.77 | 3.08 | −18.9 | <0.001 | −64.2 | −52.11 |
Figure A1.
Views in digital modelling.
Figure A1.
Views in digital modelling.
Figure A2.
Site plan with zoning of blocks for simulation.
Figure A2.
Site plan with zoning of blocks for simulation.
References
- Cheng, V.; Steemers, K.; Montavon, M.; Compagnon, R. Urban Form, Density and Solar Potential. In Proceedings of the PLEA2006—The 23rd Conference on Passive and Low Energy Architecture, Geneva, Switzerland, 6–8 September 2006. [Google Scholar]
- Hong, L.; Zhang, X.; Du, J. A Benchmarking Analysis of Sunlight and Daylight Availability in a Highly Dense Urban Area in Southern China. Energy Build. 2024, 323, 114847. [Google Scholar] [CrossRef]
- Nasrollahi, N.; Rostami, E. The Impacts of Urban Canyons Morphology on Daylight Availability and Energy Consumption of Buildings in a Hot-Summer Mediterranean Climate. Sol. Energy 2023, 266, 112181. [Google Scholar] [CrossRef]
- Government of Tamil Nadu. Policy Note 2017–2018: Forest Department, Demand No. 54; Environment and Forests Department: Chennai, India, 2017. [Google Scholar]
- Government of Tamil Nadu. Policy Note 2018–2019: Forest Department, Demand No. 54; Environment and Forests Department: Chennai, India, 2018. [Google Scholar]
- Government of Tamil Nadu. Policy Note 2024–2025: Forest Department, Demand No. 54; Environment and Forests Department: Chennai, India, 2024. [Google Scholar]
- Rose, A.L.; Monsingh, D. Assessing the intensity of urban heat island effect in the hot humid city of Chennai. Theor. Appl. Climatol. 2016, 125, 831–843. [Google Scholar] [CrossRef][Green Version]
- Tamil Nadu Urban Infrastructure Financial Services Ltd. Green and Liveable Cities in Tamil Nadu—Coimbatore: A Study on 2025; TNUIFSL: Chennai, India, 2021. [Google Scholar]
- Priya, U.K.; Senthil, R. Influence of Balcony Greenery on Indoor Temperature Reduction in Tropical Urban Residential Buildings. Energy Build. 2025, 343, 115915. [Google Scholar] [CrossRef]
- Tamil Nadu Green Climate Company. Tamil Nadu Climate Change Mission Document; Tamil Nadu Green Climate Company: Chennai, India, 2022. Available online: https://www.tngcc.tn.gov.in/wp-content/uploads/2023/07/TN-Climate-Change-Mission-Document.pdf (accessed on 2 July 2025).
- Department of Environment, Climate Change and Forests, Government of Tamil Nadu. Coastal Ecosystem Climate Risk Assessment and Adaptation Plan for Tamil Nadu; Department of Environment, Climate Change and Forests: Chennai, India, 2024. [Google Scholar]
- IS 3646 (Part 1): 1992; Code of Practice for Interior Illumination, Part 1: General Requirements and Recommendations for Lighting. Bureau of Indian Standards: New Delhi, India, 1992.
- Alwetaishi, M.; Taki, A. Investigation into energy performance of a school building in a hot climate: Optimum of window-to-wall ratio. Indoor Built Environ. 2019, 29, 24–39. [Google Scholar] [CrossRef]
- Daei-parizi, E.; Karimi, M.; Norouzian-Maleki, S. The effects of green roofs on thermal and energy performance of buildings in a semi-arid climate. J. Build. Eng. 2022, 52, 104445. [Google Scholar]
- Kamińska, J.A. The influence of a green roof on the thermal performance of a building in a temperate climate. Energies 2020, 13, 4208. [Google Scholar]
- Michael, A.; Heracleous, C. Assessment of the green roof thermal properties: A case study in a Mediterranean climate. Energy Build. 2017, 151, 1–9. [Google Scholar]
- Dahlan, N.D.; Eissa, E.A. The effect of green roofs on thermal performance and energy consumption of educational buildings in hot arid climates. J. Build. Eng. 2021, 44, 103328. [Google Scholar]
- Li, D.; Sullivan, W.C. Impact of green roof on building energy consumption: A case study of a commercial building in Denver. Procedia Eng. 2016, 145, 272–279. [Google Scholar]
- Ulrich, R.S. Visual Landscapes and Psychological Well-Being. Landsc. Res. 1979, 4, 17–23. [Google Scholar] [CrossRef]
- Kweon, B.S.; Ulrich, R.S.; Walker, V.D.; Tassinary, L.G. Anger and stress: The role of landscape and art in a hospital setting. J. Environ. Psychol. 1998, 18, 203–218. [Google Scholar]
- Oberst, U.; Wegner, E.; Stobrawe, M. Effects of a view of nature on stress and creativity. Front. Psychol. 2017, 8, 786. [Google Scholar]
- Mashaly, A.F.M.; Al-qadi, M.; Al-shorman, F.F.; Al-smadi, A.K.; Al-shwawra, A.A. Investigating the thermal performance and the cooling/heating energy saving of an extensive green roof in a hot arid climate. J. Build. Eng. 2021, 43, 102905. [Google Scholar]
- Dicka, A.A.; At-taqiy, A.; Rachman, A. The effect of a green roof on the thermal performance and energy consumption of a residential building in a tropical climate. J. Build. Eng. 2024, 85, 108625. [Google Scholar]
- Kim, G.Y.; Lim, H.J.; Lim, T.H.; Kim, J.H. The effects of medium-sized shade trees on the building energy savings in Seoul, South Korea. Urban For. Urban Green. 2018, 30, 137–146. [Google Scholar]
- Alkhatatbeh, B.J.; Kurdi, Y.; Asadi, S. Multi-objective optimization of classrooms’ daylight performance and energy use in U.S. Climate Zones. Energy Build. 2023, 297, 113468. [Google Scholar] [CrossRef]
- Rostami, E.; Nasrollahi, N.; Khodakarami, J. A comprehensive study of how urban morphological parameters impact the solar potential, energy consumption and daylight autonomy in canyons and buildings. Energy Build. 2024, 305, 113904. [Google Scholar] [CrossRef]
- Kumar, V.S.; Navaratnam, V. Neem (Azadirachta indica): Prehistory to contemporary products and applications. Phytother. Res. 2013, 27, 705–712. [Google Scholar]
- Li, H.; Zhao, Y.; Wang, C.; Ürge-Vorsatz, D.; Carmeliet, J.; Bardhan, R. Cooling Efficacy of Trees across Cities Is Determined by Background Climate, Urban Morphology, and Tree Trait. Commun. Earth Environ. 2024, 5, 754. [Google Scholar] [CrossRef]
- National Research Council. Neem: A Tree for Solving Global Problems; National Academies Press: Washington, DC, USA, 1992. [Google Scholar]
| Disclaimer/Publisher’s Note: The statements, opinions and data contained in all publications are solely those of the individual author(s) and contributor(s) and not of MDPI and/or the editor(s). MDPI and/or the editor(s) disclaim responsibility for any injury to people or property resulting from any ideas, methods, instructions or products referred to in the content. |
© 2025 by the authors. Licensee MDPI, Basel, Switzerland. This article is an open access article distributed under the terms and conditions of the Creative Commons Attribution (CC BY) license (https://creativecommons.org/licenses/by/4.0/).
