Article

Long-Term Monitoring of Mechanical Ventilation and Window Airing in Classrooms: A Controlled Observational Study

by
Susanna Bordin
1,2,*,
Renate Weisböck-Erdheim
2,
Sebastian Hummel
1,
Jonathan Griener
1,
Arnulf Josef Hartl
2 and
Arno Dentel
1
1
Institute for Energy and Building (ieg), Technische Hochschule Nürnberg Georg Simon Ohm, Keßlerplatz 12, 90489 Nuremberg, Germany
2
Institute of Ecomedicine, Paracelsus Medical University, Strubergasse 21, 5020 Salzburg, Austria
*
Author to whom correspondence should be addressed.
Buildings 2025, 15(17), 3181; https://doi.org/10.3390/buildings15173181
Submission received: 29 July 2025 / Revised: 26 August 2025 / Accepted: 28 August 2025 / Published: 4 September 2025

Abstract

Indoor environmental quality is essential for pupils‘ health, comfort, and academic performance. However, recent studies indicate that indoor air quality (IAQ) in classrooms is often inadequate. This observational study examines the impact of three ventilation concepts on IAQ and thermal comfort under real-life school conditions: manual window airing combined with CO2 traffic lights, decentralized mechanical ventilation, and centralized mechanical ventilation. Eight classrooms in three elementary schools were monitored from October 2023 to April 2024. Continuous long-term measurements covered CO2, PM2.5, VOCs, indoor air temperature, relative humidity and window opening states in the classrooms, and ambient data including PM2.5 at each school. Significant differences were found in all five indoor parameters across the three ventilation concepts. The decentralized ventilation group achieved the lowest CO2 concentrations (18–22% lower), while the window airing group showed the highest PM2.5 levels (mean of 6 µg/m3) and the lowest temperatures (21% of the time below 20 °C). Relative humidity tended to be too low for all concepts, particularly with mechanical ventilation (medians below 40%). Windows in the window airing group were opened approximately twice as long. The findings highlight the benefits of well-operated mechanical ventilation systems and underscore the importance of user awareness and system management.

1. Introduction

In Central Europe people spend most of their time indoors, on average about 80–90% of the day [1]. In Germany, pupils and teachers typically spend between six and eight hours per day in school, depending on the grade level and whether the school operates on a full-day schedule. Indoor environmental quality (IEQ), including thermal comfort and indoor air quality (IAQ), has a significant influence on the well-being and health of occupants [2]. One important and common IAQ indicator is carbon dioxide (CO2) concentration. CO2 concentrations of up to 1000 ppm are classified as hygienically safe, whereas concentrations above 2000 ppm are stated as unacceptable [3,4]. The CO2 concentration can also give an indication of the relative risk of airborne infections [5], at least if there is no air purifier in the room. Especially in an educational context, the CO2 level plays a decisive role in the cognitive performance of pupils [6,7,8]. However, IAQ is insufficient in many classrooms, as a review of 30 studies concluded [9]. Nine studies in schools were summarized by [10], considering the CO2 concentration in occupied classrooms. In 38% of the school hours in classrooms with mechanical ventilation systems, the average CO2 concentrations were below a threshold of 1000 ppm. In classrooms with window airing, only 16% of the time the threshold could be complied. Furthermore, the use of CO2 traffic lights (CO2 measuring devices with a visual feedback) is advised in classrooms with window airing only [10]. Duill et al. investigated the effect of window ventilation in classrooms, with and without an air purifier, on the IAQ in the cold and warm season [11]. For assessment they used CO2 measurements, window ventilation patterns documented by the teachers, as well as particle experiments. The average CO2 concentration during a school hour in winter (1822 ppm) was twice as high as in summer (927 ppm), exceeding a concentration of 2000 ppm one-third of school hours during winter conditions. Schilling et al. conducted a six-month study in 50 German schools and day nurseries (329 rooms), where a combined CO2 traffic light and measuring device for indoor CO2, temperature, relative humidity and noise level was installed in each room [12]. The compliance with the CO2 signal transmitter was high, and window ventilation was sufficient in nearly all situations, regardless of season or outdoor temperature [12]. In response to the coronavirus disease 2019 (COVID-19) pandemic, ventilation strategies to reduce airborne transmission were extensively studied, with sufficient air dilution and appropriate distribution identified as critical parameters [1,13,14,15,16]. Consequently, recommended outdoor air exchange rates were increased to approx. 50 m3/h/person [17]. This is particularly important in rooms with a high occupancy rate, such as classrooms. In Germany, regular shock ventilation via the windows during school hours was recommended and the “20-5-20” principal (window airing for 5 min every 20 min) was introduced for classrooms without mechanical ventilation [18,19].
However, besides the challenge of consistently applying these guidelines, manual window airing can significantly compromise thermal comfort, if the outdoor temperatures differ greatly from the perceived comfort range. In addition to comfort and health aspects, ventilation systems should also be operated with a focus on energy efficiency [15]. Mechanical ventilation systems, which are commonly equipped with heat recovery, can be used to increase the exchange rate of outdoor air and to control its temperature. In 2021, it was recommended by the German Environment Agency that in terms of indoor air hygiene and sustainability “classrooms in Germany should be successively equipped with ventilation and air conditioning systems” [20]. There are around 32,000 general schools in Germany [21]. However, in 2021, it was assumed that less than 10% of school buildings are equipped with mechanical ventilation systems [22]. Some schools were retrofitted with decentralized air handling units (AHU) during and after the COVID-19 pandemic. Some newer schools are equipped with central ventilation systems. However, most of the schools are still airing via windows only.
Against this background a prospective, controlled observational study in three elementary schools in Germany ran during the winter infection season 2023/24. The main objective was to investigate the influence of three different ventilation concepts under real-life school conditions regarding the IEQ. The study consisted of two parts: (1) an assessment of pupils’ thermal comfort and health using questionnaires and saliva samples, and (2) continuous long-term monitoring of IEQ parameters in classrooms. This work focuses on the second part. It analyzes the impact of the ventilation concepts on IAQ and thermal comfort based on objective measurements. Continuous long-term monitoring of multiple IEQ parameters in classrooms was carried out the entire study period—including indoor CO2, particulate matter PM2.5, volatile organic compounds (VOCs), air temperature, and relative humidity. The opening state of all windows in each classroom was monitored by window contact switches. By integrating these measurements with outdoor meteorological data and particulate matter concentrations (PM2.5), this research offers a comprehensive assessment of classroom environments under real-life conditions, contributing to a deeper understanding of factors influencing the IEQ in classrooms.
This study demonstrates that decentralized mechanical ventilation significantly improves indoor air quality by reducing CO2 and PM2.5 concentrations compared to pure window airing. It also contributes to more comfortable indoor temperatures. However, mechanical ventilation may lead to lower relative humidity, often falling below the recommended level of 40%. The findings further emphasize the importance of proper operation of mechanical ventilation systems and user awareness of essential control settings.

2. Materials and Methods

2.1. Overall Study Design

The long-term monitoring was part of a prospective, controlled observational study in three elementary schools in Middle Franconia, Germany. The study “Schule, Luft und Gesundheit” was approved by the Joint Ethics Committee of the Universities of Applied Sciences of Bavaria (GEHBa) (ID GEHBa-202307-V-119-R), by the government of Middle Franconia and by the school authorities and principals of the three elementary schools. The monitoring lasted from October 2023 to April 2024 during the winter infection season. In the study, window airing and mechanical ventilation were compared to investigate the influence of different ventilation concepts for classrooms. A total of eight classrooms in grades 2–4 were examined. Three different ventilation concepts (so called groups) were compared:
  • Window Airing (WA):
    Four classrooms, manual window airing only, additional CO2 traffic lights;
  • Decentralized (mechanical) Ventilation (DV):
    Two classrooms, one decentralized AHU each;
  • Central (mechanical) Ventilation (CV):
    Two classrooms, ventilated by a central ventilation system.
It should be noted that manual window airing was possible in all of the eight classrooms.

2.2. Ventilation Concepts and Classrooms

All four classrooms in group WA can be ventilated manually by opening three large south-facing sliding windows (Figure 1a). Each classroom is equipped with a CO2 traffic light. It has a measuring range between 400 and 5000 ppm and provides visual feedback depending on the CO2 concentration (CO2 level < 1000 ppm: green; CO2 level ≥ 2000 ppm: red; yellow in between) [23].
In group DV, each classroom is supplied with fresh outside air via a decentralized AHU at the rear wall (Figure 1b). The supply air of the AHU enters the room via a ceiling-mounted pipe, with four air outlets (76 mm × 800 mm) at a height of approx. 2.7 m. The maximum supply airflow rate is 1000 m3/h. The AHU is equipped with a preheating register to prevent icing and a reheating register to regulate the temperature of the supply air. A counterflow plate heat exchanger is used for heat recovery, which transfers heat, but not humidity. The AHU has a supply air filter to ISO 16890 ePM1 55% (F7) and an extract air filter to ISO 16890 ePM10 60% (M5). The maximum total electrical power consumption is 2650 W [24]. Ventilation can also be achieved by opening the east-facing windows manually or, in one of the classrooms, by opening a balcony door. A time schedule for the AHUs had been set by the school’s facility manager. Daytime operation should run from Monday to Friday from 7:45 a.m. to 1 p.m. During day mode, the fan motor operates at a constant setpoint of 65% and the supply air temperature is regulated to a setpoint of 20 °C. After day mode, the device switches to backup mode (an energy saving mode). At the beginning of the study, none of the devices had a CO2 sensor installed. In February 2024, in the middle of the study, one AHU was equipped with a CO2 sensor in the extract air to enable a CO2-based control (see Section 3.7). This varies the volume flow of the supply air with a motor speed of 30–70% depending on the CO2 concentration in the extract air. The CO2-based control is also used during daytime operation (Mon–Fri, 7:45 a.m. to 1 p.m.). Afterwards, the AHU switches to back-up mode.
In group CV, a centralized ventilation and air conditioning system is located in the basement of the school building. The air conditioning system has a rotary heat exchanger, anti-icing protection for heat recovery, a heating register, and filters in the outside and extract air. There is no additional humidification or dehumidification of the supply air. The ventilation system is integrated into a building management system (BMS). It supplies the classrooms with fresh outside air. The supply air is blown into the room tangentially to the ceiling via four air outlets (300 mm × 150 mm), located evenly distributed at a height of approx. 2.7 m opposite the window front (Figure 1c). The extract air is removed through a continuous, narrow ventilation grille below the cassette. Ventilation can also be provided by opening the north-northeast-facing windows manually. There is also a recirculating air purifier in each classroom. The air purifier reduces particles and aerosol concentrations in the indoor air with a prefilter (ePM1 ≥ 80%) and a main filter (HEPA H13) [25]. The operation of the air purifier depends on the individual behavior of classroom users. Neither the school’s BMS nor the long-term monitoring records the operating times. Each classroom is equipped with a ceiling-mounted presence sensor, window contact switches, and a multi-sensor (CO2 concentration, temperature, relative humidity). The supply airflow rate is controlled individually for each classroom by the BMS based on occupancy and CO2 concentration. When a CO2 setpoint of 900 ppm is exceeded, the air volume is continuously increased from a minimum to the nominal value using electronic volume flow controllers. However, analysis of the measurement data revealed an additional regulation depending on the window state. The central ventilation system is pressure-controlled. The setpoint of the room temperature is 21 °C, with control achieved through a combination of supply and extract air temperatures and the underfloor heating system.
Table 1 gives an overview of the characteristics of all eight classrooms. The individual classrooms are labelled with the respective abbreviation of the ventilation concept and a consecutive number from 1 to 4 or 1 to 2. The four classrooms in group WA are equal in the listed properties. The two classrooms in group DV are equal in the floor areas, but the height is different. Room DV-1 has a typical classroom height of 3 m. Room DV-2 has a gable roof, starting at a height of 3 m to a maximum of 4.65 m, resulting in an additional volume of 50 m3. In addition to the casement windows, DV-2 has an openable balcony door. The two classrooms in group CV have the same characteristics apart from a slight difference in length and the resulting room volume. In contrast to the other two schools, the rooms are heated by a centrally controlled underfloor heating system. All eight classrooms are equipped with solar shading. Group WA represents the oldest school building with the lowest insulation level in this study, whereas group CV corresponds to the newest building with the highest insulation quality.
Table 2 provides an overview of the number of occupants (pupils + 1 teacher), the specific area, the specific air volume per person and the required total outdoor air ventilation rate qtot based on the perceived air quality according to DIN EN 16798-1 for a room of category IEQII [26]. The number of pupils varies from 19 to 25. All classrooms fulfil the requirements of the Bavarian school building regulations for a floor area of at least 2 m2/pupil and an air space of at least 6 m3/pupil [27]. The specific area per person ranges from 2.3 m2/person (DV-2) to 3.6 m2/person (WA-2) (on average 2.9 m2/person). The specific volume per person ranges from 7.7 m3/person (CV-1) to 11.3 m3/person (WA-2). Due to its low occupancy, classroom WA-2 provides the highest space per person in terms of both floor area and room volume. The required ventilation rates qtot already vary within the three ventilation groups, as the classrooms are occupied differently. The classrooms DV-2 and WA-3 with the highest number of persons require the largest fresh air volume flows of 805 to 811 m3/h.

2.3. Monitoring Concept and Data Acquisition

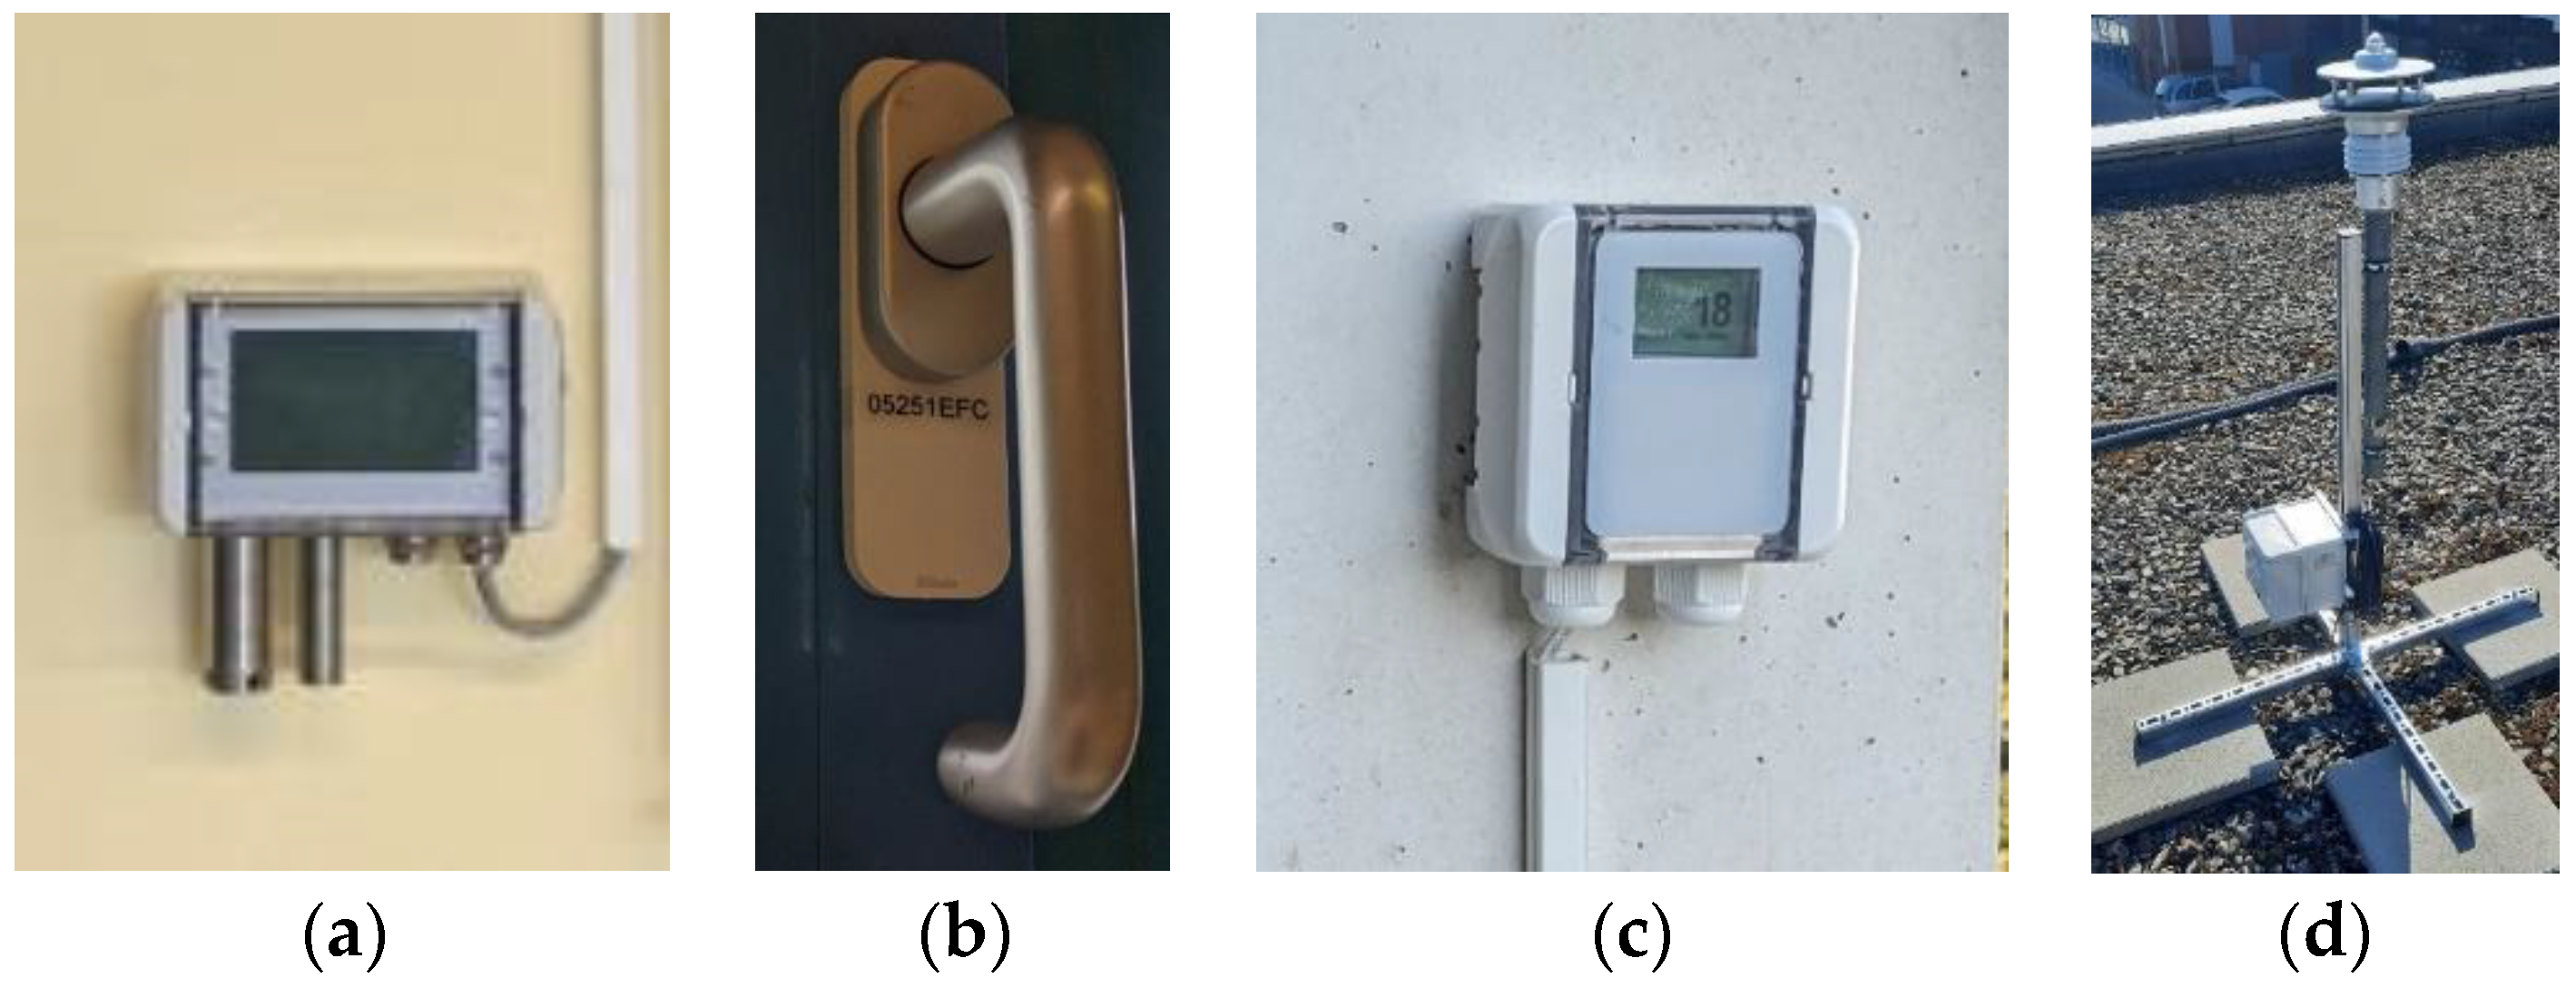
The monitoring concept includes the measurement of IAQ and thermal comfort parameters in each of the eight classrooms, while meteorological data and ambient air conditions are measured at each school site. The IEQ (air temperature, relative humidity (r.h.), CO2 concentration, VOCs and PM2.5) is monitored by a compact, surface-mounted multi-sensor (Figure 2a) that cannot be easily deactivated or manipulated by children. To prevent distraction during lessons and avoid influencing ventilation behavior, the displays are programmatically switched off. Each sensor is installed on the wall opposite the windows, at a height of 1.1 m and a minimum distance of 1.9 m from the door. Window contact switches (WCS, Figure 2b) detect the present position of each window separately. In group DV and CV, WCS at the window handles are installed (closed, tilted or open window state). The opening state of all sliding windows in group WA are detected by mechanical WCS (open or closed). Current transformers in classrooms DV-1 and DV-2 measure the electrical current and thus, the electrical power consumption, of the two decentralized AHUs. In addition, for both rooms in group CV logging data from the school’s BMS are available (see Section 2.2). The PM2.5 concentration of the ambient air is measured by a PM measuring device (Figure 2c) on the façade of each school. Meteorological data (ambient air temperature, relative humidity, air pressure, global solar radiation, wind speed and wind direction) are recorded by a weather station installed on the rooftop of each school (Figure 2d). The installed sensors, along with their respective measurement parameters, ranges and accuracies, are listed in Table 3.
A single-board computer (Raspberry Pi) manages data acquisition, signal transmission and data storage. Both wired (Modbus RTU and TCP) and wireless (EnOcean) communication interfaces are implemented. Except the signals of the WCS, all measurement data are recorded every minute. The WCS signals are typically recorded at 15 min intervals. Mechanically driven WCS sensors send their state on an event basis only. An additional data backup is provided by an automated regular data transfer into a secure cloud storage. Remote access is granted via a secure virtual private network (VPN) tunnel to control the setup. In addition, daily status reports are sent by e-mail, reporting the overall functionality of the system and data availability.

2.4. Study Period, Evaluation Period, and School-Wide Mean

The study period lasted seven months, from 1 October 2023, to 30 April 2024. This corresponds to 213 days or 5112 h in total. The occupancy period includes 120 school days or 720 school hours (excluding weekends, vacations or public holidays in Bavaria, 93 days in total), with lessons taking place from 8 a.m. to 1 p.m. This corresponds to the 1st to 6th school hour (45 min each). Due to user-induced malfunctions of the decentralized AHUs in group DV, 134 school hours cannot be evaluated, resulting in an evaluation period of 586 school hours. This malfunctioning is analyzed in Section 3.7 in detail.
The analysis includes both time trends and averaged data. As recommended in [4,32], the school hour average is calculated over the duration of a 45 min lesson without regarding the breaks, resulting in the school hour mean. For an overall comparison of the three ventilation concepts, the school hour means for each classroom of one group are summarized to a school-wide mean. Therefore, the arithmetic mean is calculated over all classrooms of each group/ventilation concept. Unless otherwise stated, school-wide mean values are presented in any further evaluation.

2.5. Data Pre-Processing and Data Availability

Prior to evaluation, the raw measurement data were preprocessed to remove unrealistic values (spikes), outliers and fallback-values. Spikes and outliers frequently observed in the indoor multi-sensor device (IEQ data), such as sudden temperature changes exceeding 40 °C. Fallback values were assigned by default in the event of communication errors. Irregularities and faulty state sequences were particularly evident in the WCS event records, primarily caused by the non-cyclically transmitting contact sensors. These sensors send their current state only when mechanically triggered. If a communication error occurs, the corresponding record is lost and cannot be reconstructed. Consequently, only valid state sequences were considered, defined as those containing exactly one complete “open–closed” event cycle.
IEQ data for groups WA and DV are complete and available for all 586 school hours. Group CV is missing 38 h of measurement data, starting from 29 April 2024, 10 a.m., due to a power outage, resulting in 577 recorded school hours. WCS event records have the same overall availability as the IEQ data, as both are captured via the same data acquisition system. For WCS that transmit periodically at regular intervals (minimum of 96 events per day), most WCS show data availabilities above 99%, except three WCS in group DV (93.4–98.2%). As the mechanical WCS only send their current state on an event basis, no overall data availability can be specified. Meteorological data are available at one-minute intervals without gaps, ensuring 100% availability. BMS data for group CV are available for the entire evaluation period, except from 1 April to 14 April 2024. Signals from presence detectors and window state sensors are available only from 20 November 2023, and for room CV-1 only until 23 February 2024.

2.6. Data Analysis and Statistical Inference

The entire data analysis, visualization and statistical analysis were done using Matlab R2023b and R2024b [33,34]. Statistical analysis was done using the Statistics and Machine Learning Toolbox version 23.2 (R2023b) [35]. For all tests, resulting p-values less than 10−16 were set to 0.
To assess potential differences in the five indoor parameters across the three ventilation concepts, a significance level of α = 0.05 was established. The normality of the distribution of each parameter within groups was assessed using the Jarque–Bera test, while homogeneity of variances was evaluated via Levene’s test. As the assumption of normality was not met for all variables and Levene’s test indicated a violation of homogeneity of variances (p < 0.05), the non-parametric Kruskal–Wallis test was employed. In cases where the Kruskal–Wallis test indicated statistically significant differences, post hoc analyses were performed using the Tukey–Kramer procedure on ranked data to identify specific group differences.
To assess potential differences in the five indoor parameters across the two operating states of the decentralized AHUs (DV-on and DV-off), a significance level of α = 0.05 was established. As the assumption of normality was not met for all variables (Jarque–Bera test) and Levene’s test indicated a violation of homogeneity of variances (p < 0.05), the Mann–Whitney U test was used.

2.7. Acceptable Threshold Values of IEQ

The IEQ describes how well indoor conditions meet recommended design parameters. Comfort limits are defined in various national and international standards as well as in national guidelines. The standard DIN EN 16798-1 specifies design values for classrooms and generally defines four categories of comfort requirements in buildings [26]. In this study, a normal level of expectation (IEQ category II, IEQII) is assumed, as recommended for classrooms in VDI 6040 Part 1 [4].
Since outdoor CO2 concentrations are not measured in this study, absolute indoor CO2 thresholds are applied instead of differential values relative to outdoor air. CO2 concentrations up to 1000 ppm are considered hygienically safe, whereas concentrations above 2000 ppm are regarded as unacceptable [3,4].
Particulate matter (PM) refers to very small solid or liquid particles suspended in the air. PM2.5 refers to particles with a diameter of up to 2.5 µm. Depending on their size, the particles can enter the respiratory tract (PM10) or the alveoli (PM2.5) and even the lung tissue and bloodstream (ultrafine particles) [36]. In Germany, there are no legal limits for PM2.5 in indoor air. The WHO’s 2021 global air quality guidelines define stricter requirements than those established by the European Union and Germany. For PM2.5, a maximum annual average of 5 µg/m3 is defined alongside a daily average of 15 µg/m3, which must not be exceeded on more than 3–4 days per year [37]. These thresholds can be applied to both outdoor and indoor air assessments [37].
VOCs comprise a group of organic substances that can easily vaporize at room temperature and enter the air. They include hydrocarbons, alcohols, and aldehydes [38]. In this study, VOC concentration in indoor air is measured as a cumulative signal (in percent) of all volatile organic compounds, excluding CO2, and does not permit differentiation between individual substances.
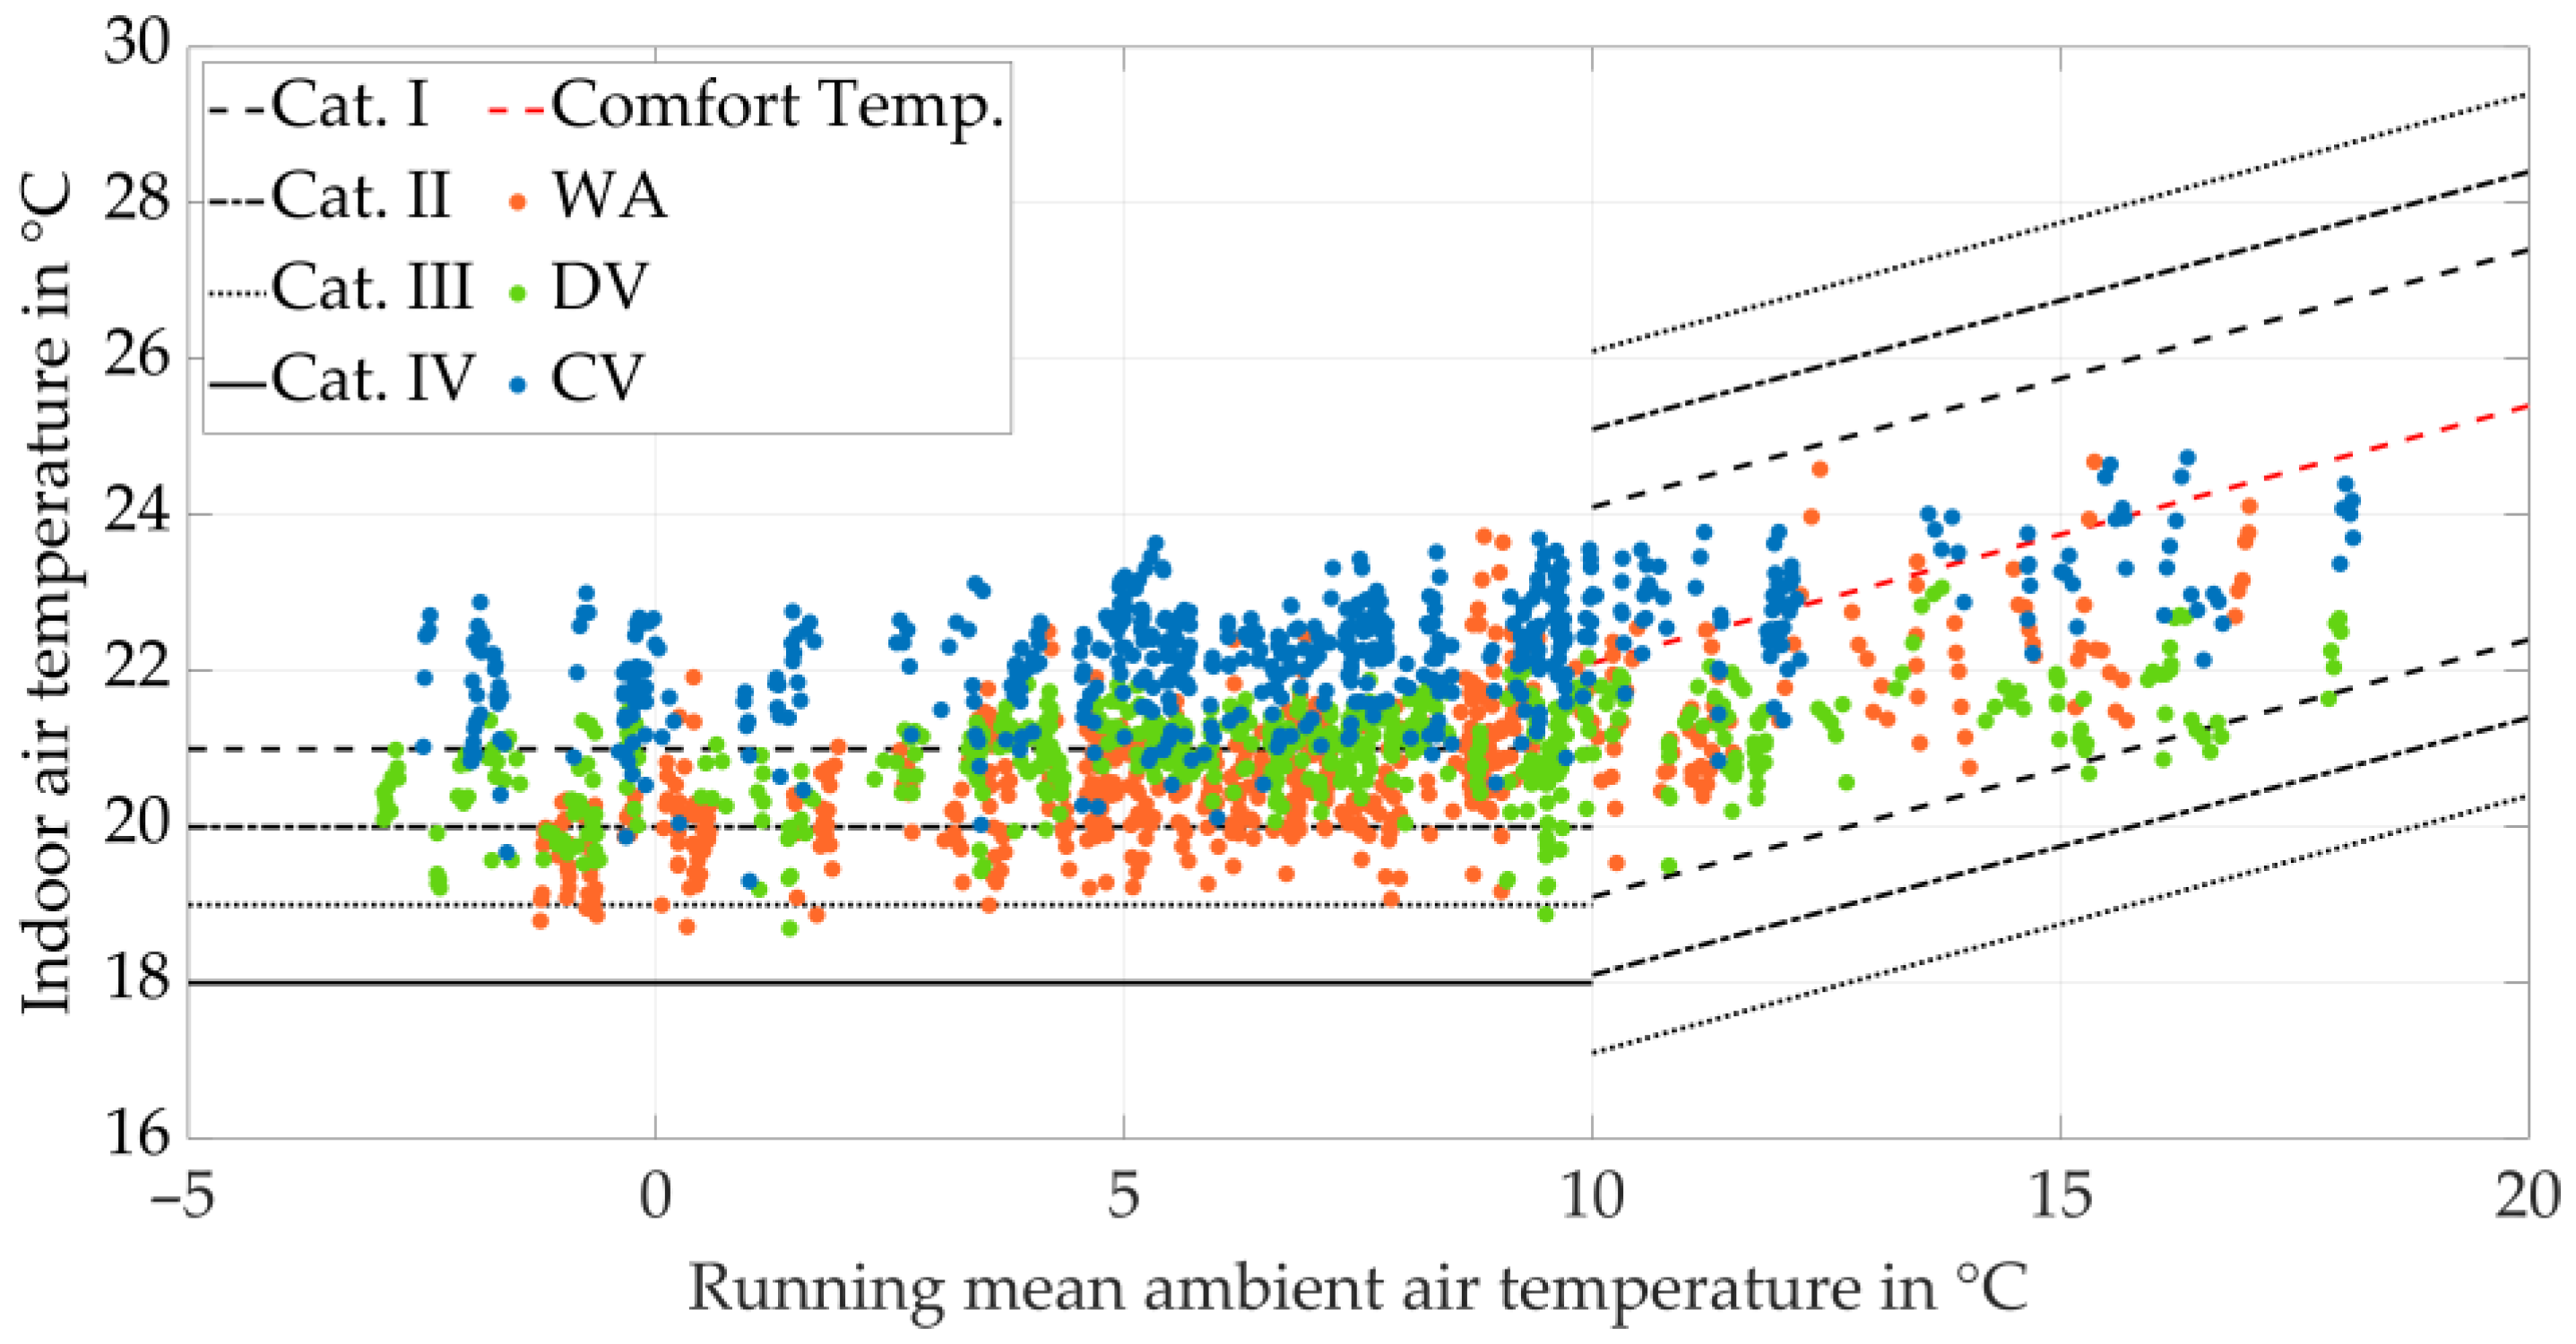
The operative temperature is used to describe thermal sensation in a room and, in addition to the indoor air temperature, also considers the influence of radiant heat from surrounding surfaces (e.g., walls, windows, or radiators). For air velocities below 0.2 m/s, the operative temperature is calculated as the arithmetic mean of the air temperature and the mean radiation temperature [39]. In this study, radiant heat is not measured explicitly. Typically, the operative temperature during the heating period is slightly (by a few 0.1 K) lower than the indoor air temperature. Therefore, the operative temperature is assumed to be approximately the indoor air temperature for further analysis. According to DIN EN 16798-1, a minimum operative temperature of 20 °C in winter and a maximum of 26 °C in summer is specified for IEQII, based on sedentary activity levels (met = 1.2) and seasonally appropriate clothing [26]. In the statistical analysis of indoor air temperature (Section 3.2) and in the assessment of IEQ (Section 3.6), the 26 °C threshold—formally defined for mechanically cooled buildings during summer—is applied to uncooled buildings and winter conditions for the sake of simplification. Additionally, comfort diagrams are used, which show a more dynamic acceptance range of the rooms’ climate, based partly on empirical studies [40]. For buildings without mechanical cooling, DIN EN 16798-1 describes in Sections 6.2.2 and B.2.2 a method that considers adaptive opportunities (such as clothing adjustments and window opening, for predominantly sedentary activity) [26]. During the winter period, the same temperature limit of 20 °C is applied. In contrast, during the summer and transitional periods (spring and autumn), upper and lower temperature thresholds are used, depending on the running mean ambient air temperature, calculated using an approximation equation according to DIN EN 16798-1 from the daily averages of the preceding seven days. This method is also applied in Section 3.6 to analyze indoor air temperature.
DIN EN 16798-1 indicates that humidification or dehumidification is typically not necessary in school environments. In the National Annex to DIN EN 16798-1, a relative humidity of 30–60% r.h. is recommended for IEQII, if humidification or dehumidification systems are installed [26]. In 2022, however, the FGK-Status-Report 58 defined requirements for indoor air humidity, considering its influence on potential disease transmission via the respiratory tract. Overall, the report recommends a relative indoor air humidity of at least 40% r.h. during the heating period to reduce infection risk in combination with appropriate ventilation measures [41].
The threshold values applied for the evaluation of IEQ are summarized in Table 4.

3. Results

3.1. General Overview of Meteorological and Indoor Parameters

To provide a general overview of the measurement data during the entire study period, school-wide daily averages are used. First, meteorological conditions are examined to characterize the outdoor boundary conditions. Subsequently, two indoor parameters are analyzed to describe their temporal progression during the study period.
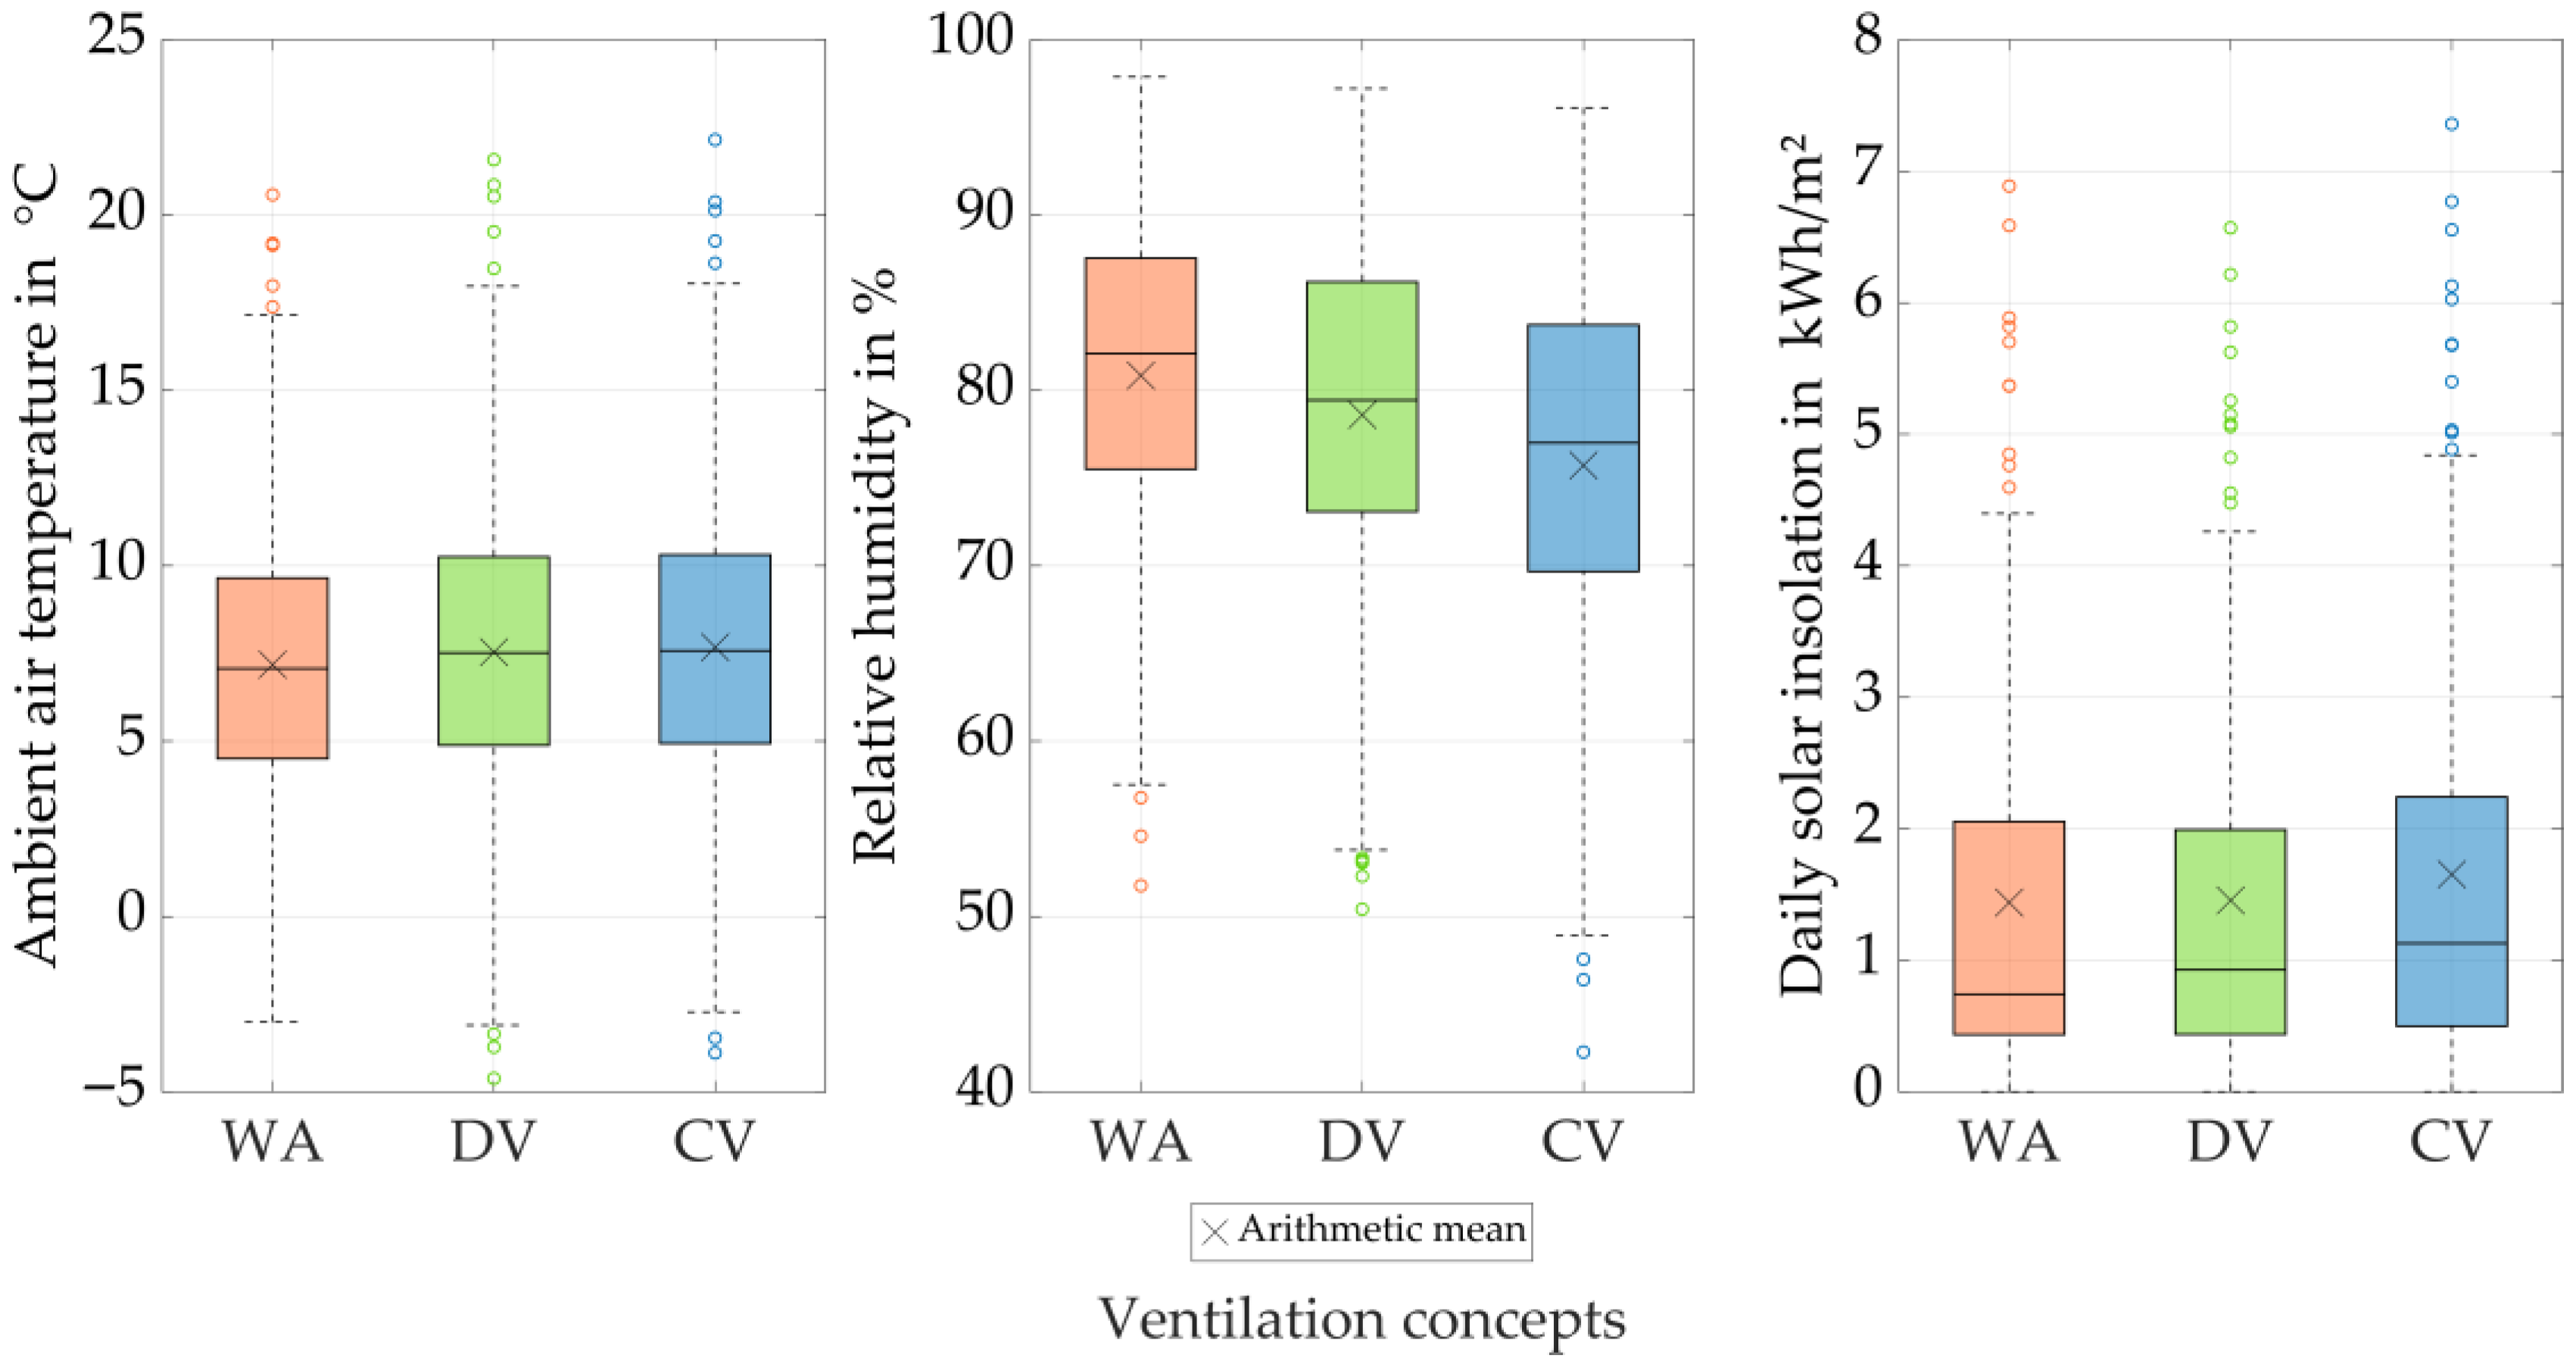
In general, weather data exhibit a high variance, resulting in large standard deviations—particularly over an extended observation period, as in this study. The dataset covers three seasons (fall and winter 2023, and spring 2024), which tend to differ markedly in their average weather conditions. Figure 3 presents the statistical evaluation of three meteorological parameters for all three measurement locations, visualized in boxplots with the arithmetic mean indicated. Despite similar overall mean ambient air temperatures of 7.4 °C (WA), 7.7 °C (DV) and 7.9 °C (CV), the corresponding standard deviations are high (±4.7 K, ±5.3 K and ±5.2 K). The overall mean values for relative humidity are 80.4%, 78.3%, and 75.3%, and those for the average daily solar insolation 1.61 kWh/m2, 1.63 kWh/m2 and 1.86 kWh/m2 for group WA, DV, and CV, respectively.
Figure 4 presents wind direction and speed, based on the school-wide daily averages, in a wind rose diagram. The average wind speeds differ markedly at the three locations. These are 1.06 m/s (WA), 1.57 m/s (DV), and 1.90 m/s (CV). The standard deviations are ±0.35 m/s, ±1.07 m/s, and ±0.73 m/s. Across all three measurement locations, wind direction is predominantly within the range of 180° (south) to 270° (west). The mean wind directions are 217°, 209°, and 225°, with corresponding standard deviations of 36°, 42°, and 41° for groups WA, DV, and CV, respectively.
In general, the three locations exhibit comparable meteorological conditions during the study period.
The temporal progressions of the school-wide daily averages of indoor CO2 concentration and indoor air temperature are shown in Figure 5. The dataset covers the entire study period, including weekends, school holidays and unoccupied periods. Weekends and holidays are highlighted in grey and are excluded from further analysis. Especially CO2 concentration patterns clearly distinguish between school vacations, regular school weeks, and weekends. Plateaus at approx. 420 ppm (equals the outdoor concentration) refer to school vacations, whereas alternating “humps” and “valleys” in between identify the five-day school week and weekends, respectively. Over the study period, mean CO2 concentrations are 554 ppm (WA), 554 ppm (DV) and 561 ppm (CV), with significantly higher concentrations during regular school operation. The occurrence of CO2 peaks in relation to the operation of the mechanical ventilation systems is examined in Section 3.7 and Section 3.8. Indoor air temperatures remain relatively constant over the heating season and slightly increase in the transition period due to rising ambient air temperature and the absence of cooling units. Mean indoor air temperatures are 20.3 °C (WA), 19.8 °C (DV) and 21.8 °C (CV).

3.2. Statistical Analysis of Indoor Air Parameters

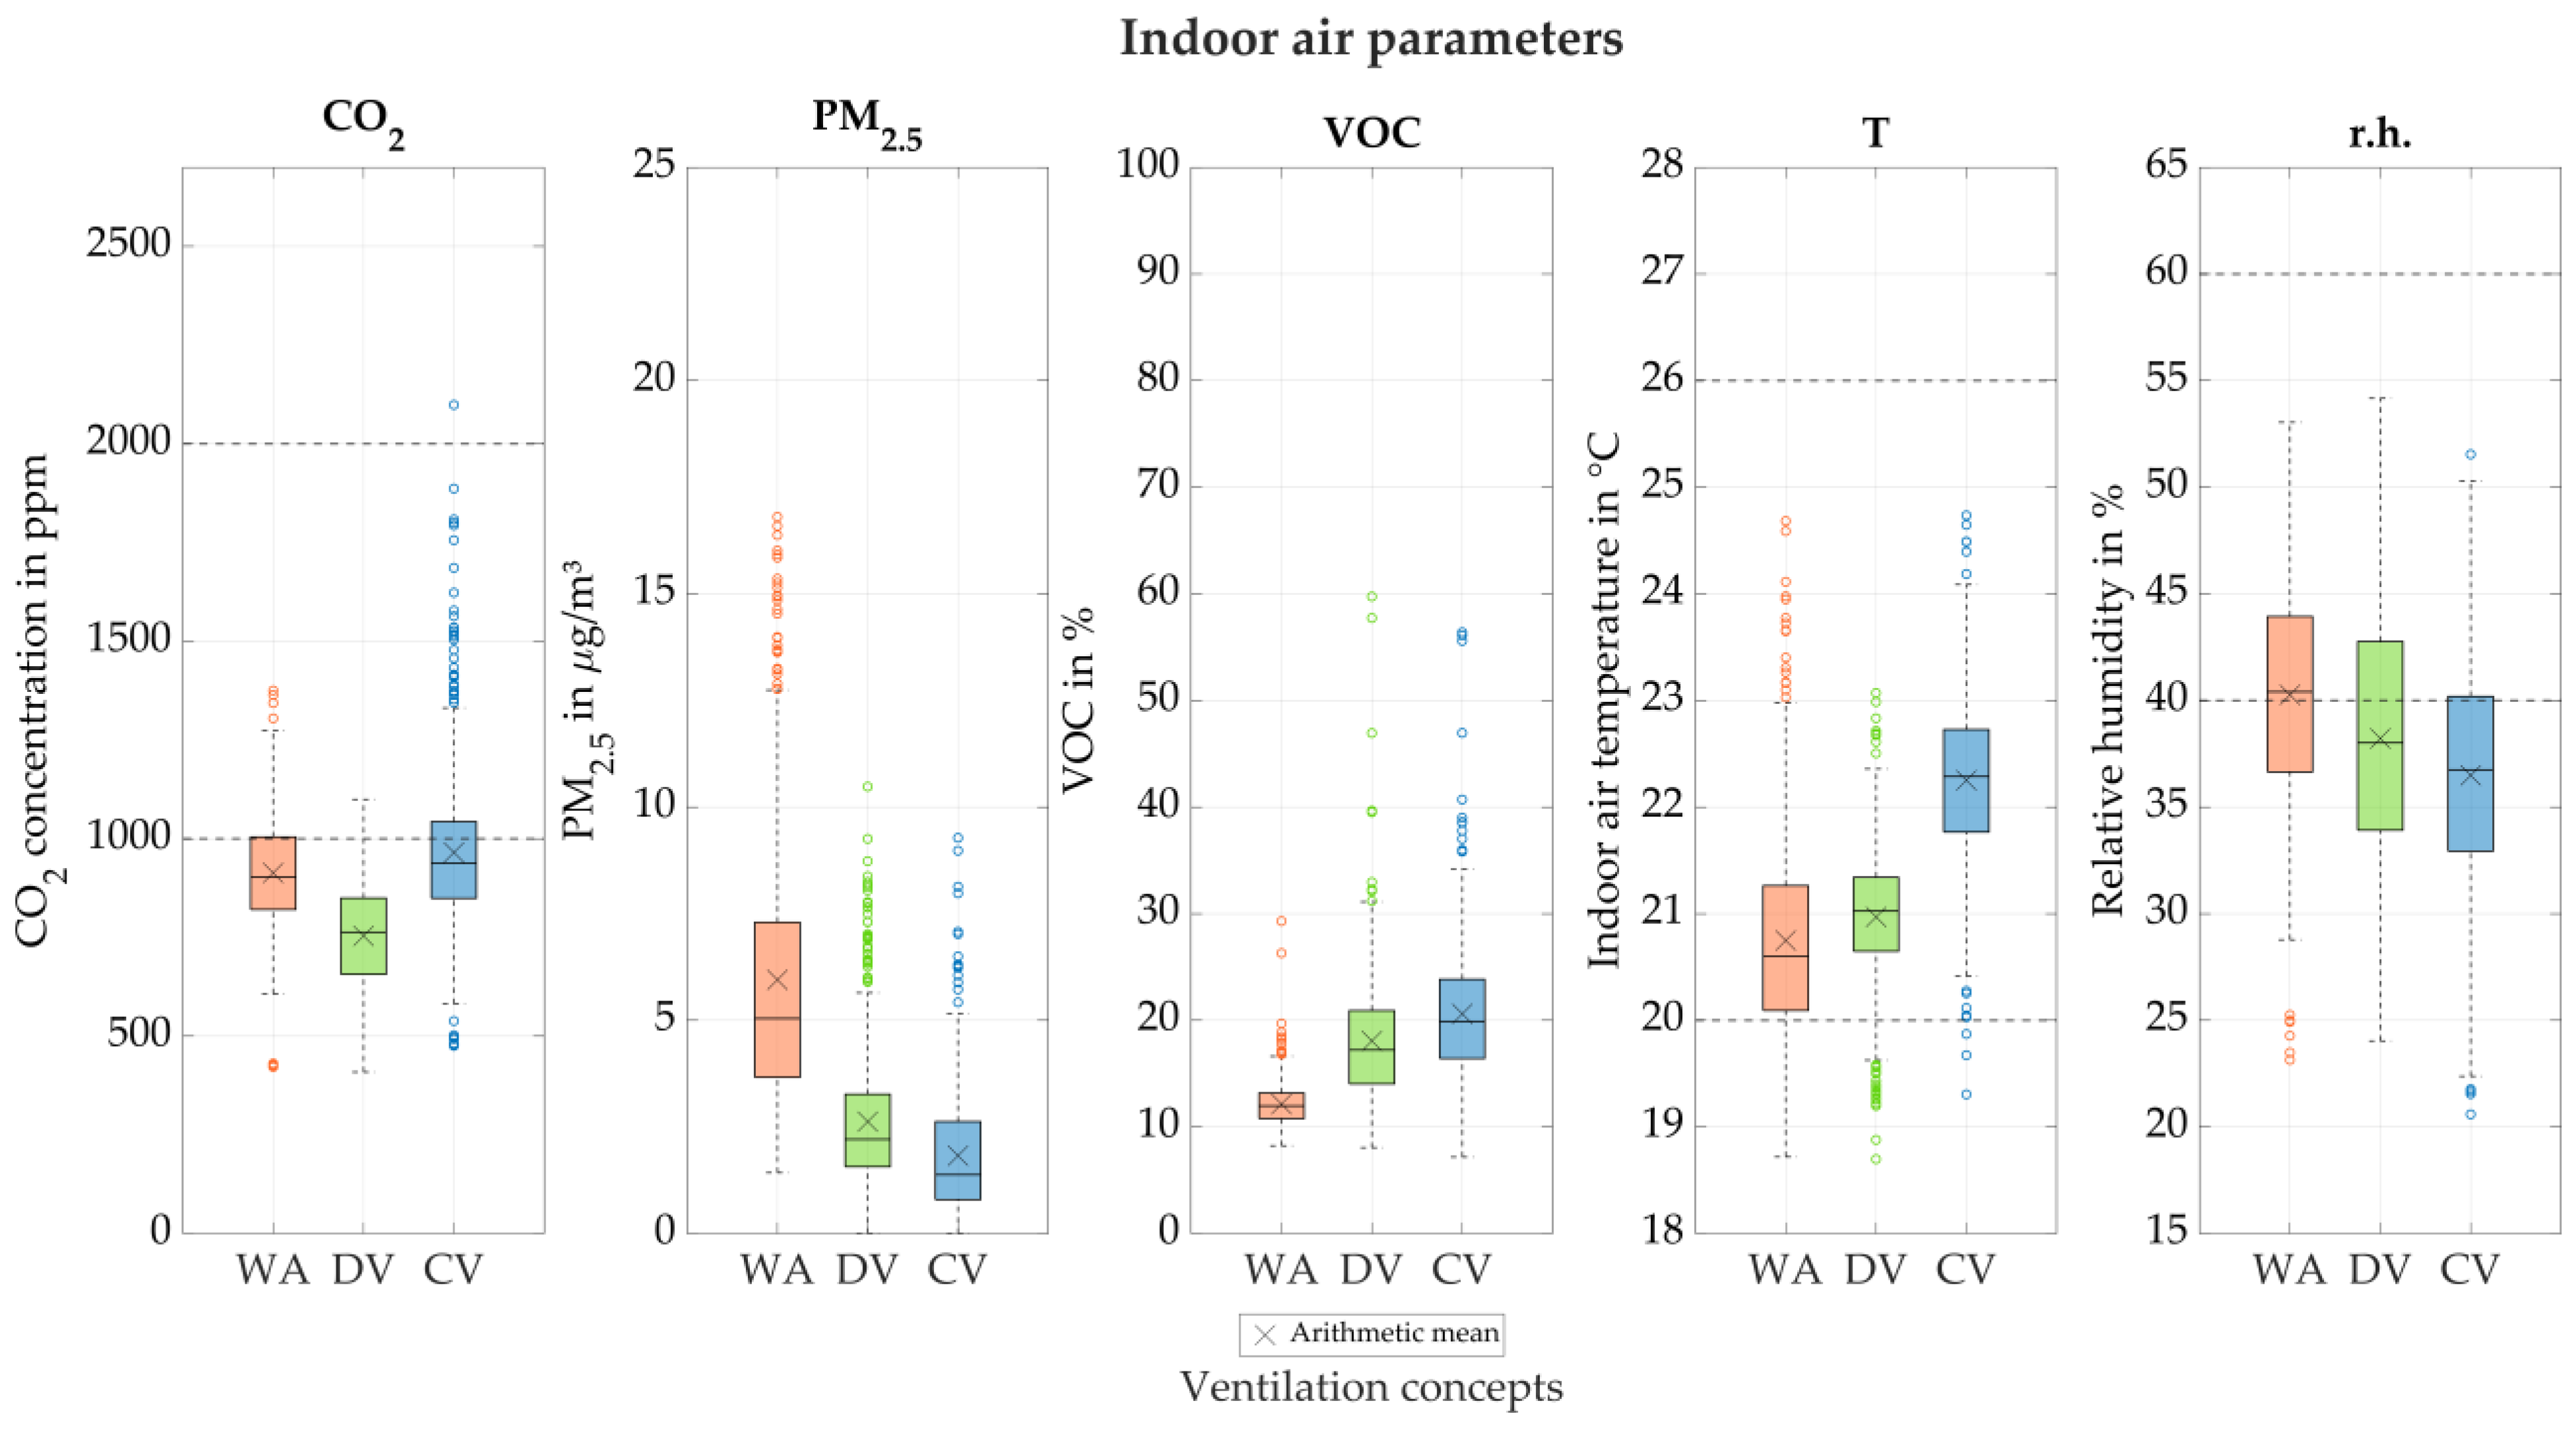
To compare the three ventilation concepts, the five indoor air parameters are statistically analyzed over the evaluation period using school-wide mean values. Figure 6 presents boxplots of the mean CO2 concentration, PM2.5, VOC, indoor air temperature (T) and relative humidity (r.h.). For CO2 concentration, indoor air temperature and relative humidity, threshold values (see Section 2.7) are indicated as dashed lines. Table 5 summarizes the corresponding descriptive statistics, with “Range” denoting the difference between the maximum and minimum values.
In group WA, CO2 concentration exceeds 1000 ppm during 156 school hours (26.6% of the evaluation period), with a maximum school-wide mean of 1375 ppm; values above 2000 ppm do not occur. The median is 902 ppm. Group DV exhibits 17–22% lower CO2 concentrations than WA and CV, with a median of 763 ppm. Exceedances of 1000 ppm occur in only 10 school hours (1.7%), peaking at 1100 ppm. Group CV has the highest overall mean (965 ppm), exceeding 1000 ppm in 205 school hours (35.5%), with a maximum of 2099 ppm and a median of 937 ppm.
A clear difference in PM2.5 levels is observed between group WA and the mechanical ventilation concepts. WA has a median of 5.0 µg/m3. In contrast, DV records a median of 2.2 µg/m3, with CV recording the lowest at 1.4 µg/m3. Compared to group WA, this implies a 56.2% (DV) and 72.7% (CV) lower PM2.5 concentration. The maximum school-wide school hour mean is 16.8 µg/m3 in WA, 10.5 µg/m3 in DV and 9.3 µg/m3 in CV.
A clear difference in the VOC levels is also observed between the manual and the mechanical ventilation groups. WA records the lowest VOC levels, with a median of 12.0% and a maximum of 29.3%, as well as the smallest variability (range: 21.1%; interquartile range: 2.4%). The medians for DV and CV are 17.2% and 19.9%, respectively.
Indoor air temperature does not exceed 26 °C in any group, as the study period is during the heating season. Hence, a minimum indoor air temperature of 20 °C is recommended (Section 2.7). This threshold value is not met in 124 school hours (21.2%) in group WA, 48 school hours (8.2%) in DV and 3 school hours (0.5%) in CV. Groups WA and DV have similar mean temperatures of 20.7 °C and 21.0 °C, respectively, while CV is 1.3 K higher. Overall, CV exhibits both the highest mean and median at 22.3 °C. WA shows the largest temperature range at 6.0 K.
Mean relative humidity is 40.3% r.h. (WA), 38.2% r.h. (DV) and 36.5% r.h (CV). This indicates generally dry indoor air compared to the recommended minimum value of 40% r.h. (Section 2.7). Median values are similar to the means. Overall, relative humidity varies between 20.6% r.h. and 54.2% r.h., with a similar range of approx. 30% r.h. across all groups. WA shows the lowest number of underruns, with 270 school hours (46.1%) falling below 40% r.h. This occurs in 364 school hours (62.1%) in DV, while CV has the lowest relative humidity with 423 school hours (73.3%) below 40% r.h. None of the ventilation concepts exceeds a relative humidity of 60% r.h.
The Kruskal–Wallis test reveals statistically significant differences among at least two of the three ventilation concepts for all five indoor air parameters (all parameters exhibit p-values of 0, so all p < 0.05). Subsequent post hoc pairwise comparisons using the Tukey–Kramer procedure on ranks indicate that all five indoor parameters differ significantly between each pair of ventilation concepts (all p < 0.05) (see Table 6).

3.3. CO2 Concentrations During School Hours

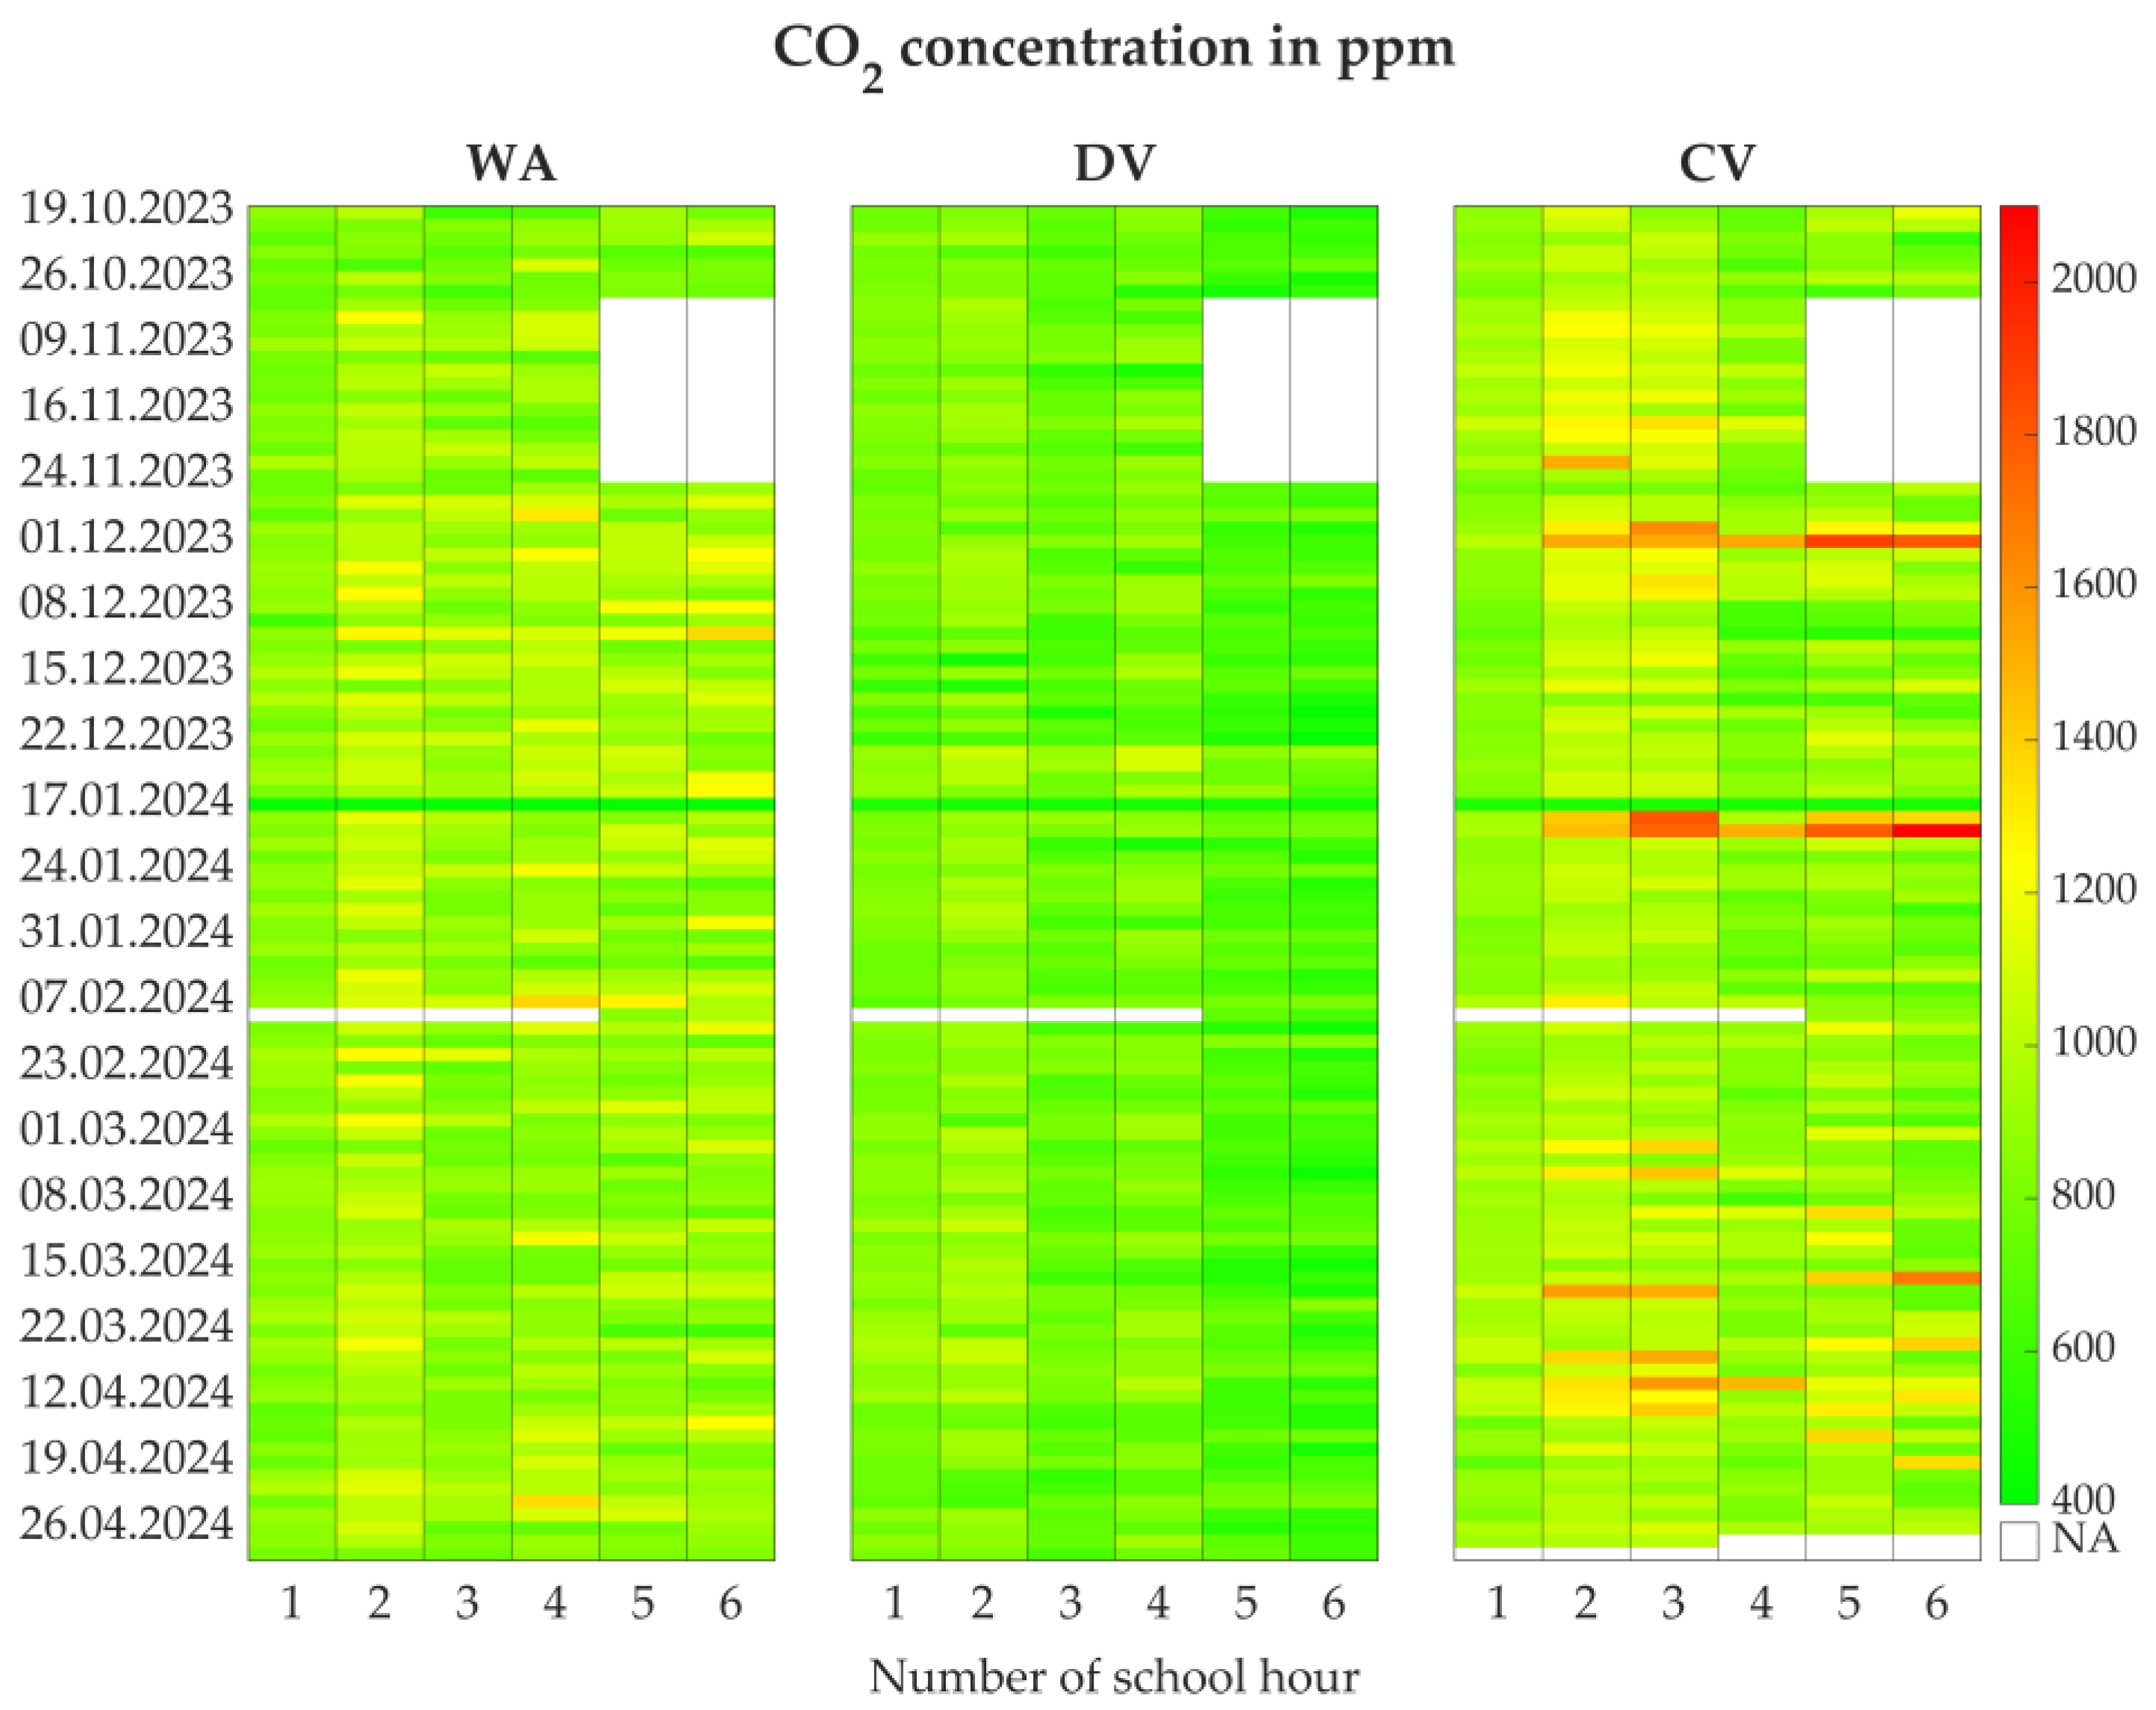
The temporal progression of the school-wide CO2 concentration during school hours for all three groups is shown in heat maps in Figure 7. Blank spots represent school hours, which were excluded from the evaluation period (see Section 2.4). Qualitatively, group DV exhibits the lowest and CV the highest school-wide CO2 concentrations. Increases in CO2 concentration in the school hours before a break (i.e., in continuous blocks) are clearly visible. Groups WA and DV have two breaks (after the 2nd and 4th lesson), whereas group CV has only one break (after the 3rd lesson). Considering the mean school-wide CO2 concentration of each school hour (1st to 6th) in the evaluation period, it increases by approximately 10–20% before the first break. During school breaks, CO2 concentration drops markedly (due to window airing, natural infiltration or absence of occupants), but remains above the day’s starting values. This pattern repeats for each consecutive block of school hours. For example, in group WA, the mean school-wide CO2 concentration increases by 18% from the 1st to the 2nd lesson (843 to 995 ppm), by 8% from the 3rd to the 4th lesson (867 to 939 ppm), and by 2% from the 5th to the 6th lesson (908 to 929 ppm). Comparable trends are observed in the other two groups. Notably, the 2nd school hour exhibits the highest mean school-wide CO2 concentration in all groups (995 ppm in WA, 868 ppm in DV, 1072 ppm in CV).

3.4. Window Airing Times

The influence of manual window airing can be distinguished from that of mechanical ventilation by analyzing the window opening profile recorded by the WCS at each window in each classroom. The opening states of all windows in a specific classroom are represented in a room-wise window opening profile. Each window state is assigned a numerical value (open: 1.0, tilted: 0.1, closed: 0.0). The values sum up accordingly when multiple windows are open simultaneously (e.g., a value of 3.2 corresponds to three open and two tilted windows at the same time). This profile can be expressed in absolute values or in relative terms (0–100%), based on the total number of windows per room. Extensive manual window airing in most classrooms typically occurs in the morning (from 7:00 a.m. to approx. 7:45 a.m.). Short “shock” ventilation events of 5–10 min are frequently observed during school breaks.
The school-wide window opening profile provides information about the opening frequencies and total manual window airing times for the different ventilation concepts. An average window airing time per school hour (á 45 min) of 28 min (62.0%) is observed in group WA, 13 min (29.2%) in DV and 9 min (21.1%) in CV. Thus, in group WA, the windows are open two to three times longer than in the mechanically ventilated groups.
The relative frequencies of school-wide window opening states are shown in Figure 8. In group WA, manual window airing during a lesson is mainly achieved by opening only a single window (65% of all manual ventilation events). In 26% and 9% of the ventilation events two or three windows are opened, respectively. As group WA only features sliding windows, a tilted window state is not possible. A similar distribution is observed in group DV for fully opened windows. In 72% of all manual ventilation events, only a single window is opened, while two or three windows are opened in 17% and 5% of the events, respectively. In only 6% of all ventilation events, one or more windows are tilted. In group CV, window airing is primarily performed via only one tilted (45%) or one open window (26%).

3.5. Indoor and Ambient Air PM2.5 Concentrations

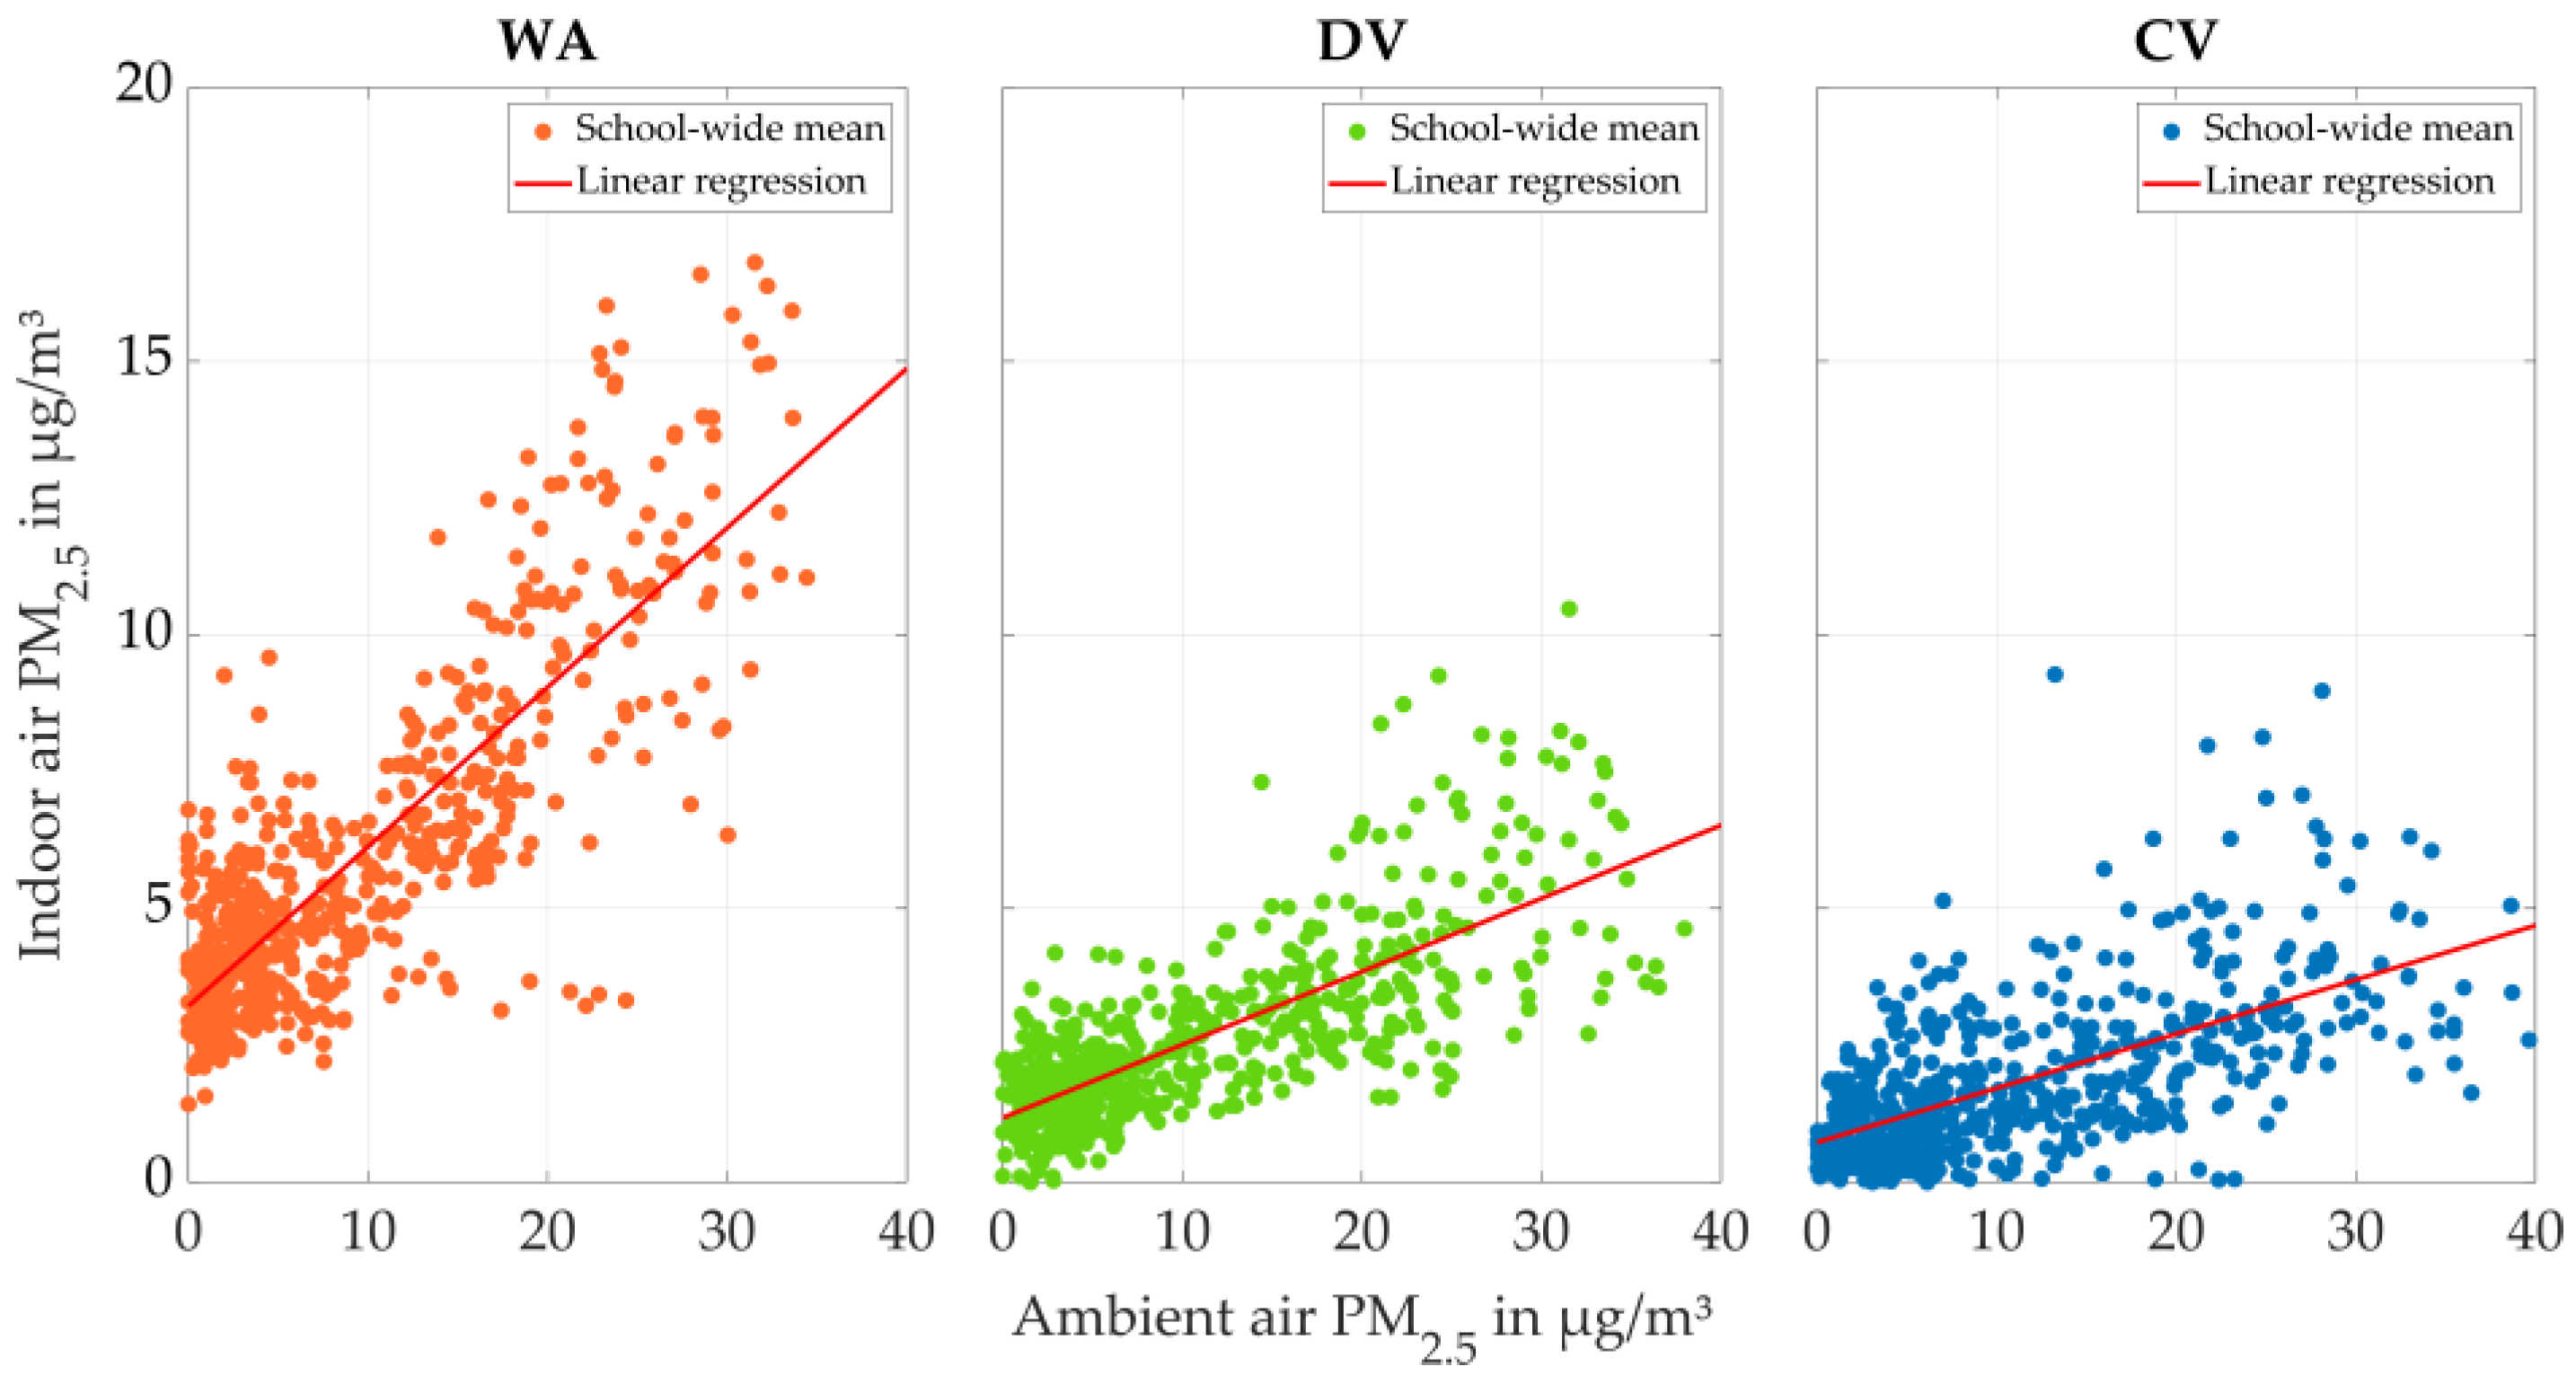
PM2.5 concentrations in the classrooms can considerably increase due to internal sources (e.g., swirled-up dust) or external sources (e.g., emissions from road traffic). Internal sources would result in a certain level of background concentration in an occupied classroom. PM from external sources can enter the room via the outside air during window airing or through the AHU. As ambient and indoor air PM2.5 concentrations were measured, both sources of PM can be evaluated separately and a potential impact of the ventilation concept on indoor PM2.5 can be derived. Figure 9 shows the school-wide means of indoor PM2.5 over ambient PM2.5.
In all three groups, a background concentration is present, even when the ambient PM2.5 concentration is 0 µg/m3. In group WA the background concentration is 3.2 µg/m3, which is considerably higher than in DV (1.2 µg/m3) and CV (0.7 µg/m3). The slope of a linear regression over all school-wide means of one group can be interpreted as the dependency of the indoor air PM2.5 on the ambient air PM2.5. Group WA features the steepest slope at 0.29, whereas the slopes of groups DV and CV are 0.13 and 0.10, respectively. Considering the school-wide means in general, maximum indoor air PM2.5 values of 16.8 µg/m3 (WA), 10.5 µg/m3 (DV) and 9.3 µg/m3 (CV) are measured. Thus, PM2.5 concentrations in the mechanically ventilated groups DV and CV are more than 33% lower than in group WA. Assuming 15 µg/m3 as the threshold for acceptable daily average PM2.5 in indoor air (see Section 2.7), only group WA exceeds this value in nine school hours. The actual daily average exposure for pupils is likely to be considerably lower. In contrast, the maximum ambient air PM2.5 concentrations are similar across the groups, ranging from 34.4 µg/m3 (WA) to 39.6 µg/m3 (CV).
Window airing is possible in all three groups and can considerably affect indoor air PM concentrations by increasing air change rates. A more detailed view of this aspect is obtained by comparing PM2.5 concentrations during periods when at least one window is open with those when all windows are closed. Therefore, the PM2.5 data are matched with the room-wise window opening profile on a minute-by-minute basis. Consequently, Figure 10 shows the school-wide minute-based PM2.5 concentrations of indoor and outdoor air divided into these periods as a bubble chart (the bubble size represents the number of measurements). The slope of the linear regression is consistently higher during periods of window airing than when all windows are closed. In group WA the slope increases from 0.19 to 0.36, and in group DV from 0.10 to 0.27. In contrast, in group CV the slope increases only slightly, from 0.10 to 0.11, indicating that it is barely influenced by window airing. Group CV features the shortest window airing times overall (see Section 3.4). For the background concentration (at 0 µg/m3 ambient PM2.5) no clear trend can be determined. In groups WA and DV, background concentrations are higher when there is no window airing—3.6 µg/m3 compared to 3.0 µg/m3 in WA and 1.3 µg/m3 compared to 0.9 µg/m3 in DV. In contrast, group CV features a higher background concentration of 1.4 µg/m3 during periods with active window airing compared to 0.5 µg/m3 when all windows are closed.

3.6. Indoor Environmental Quality

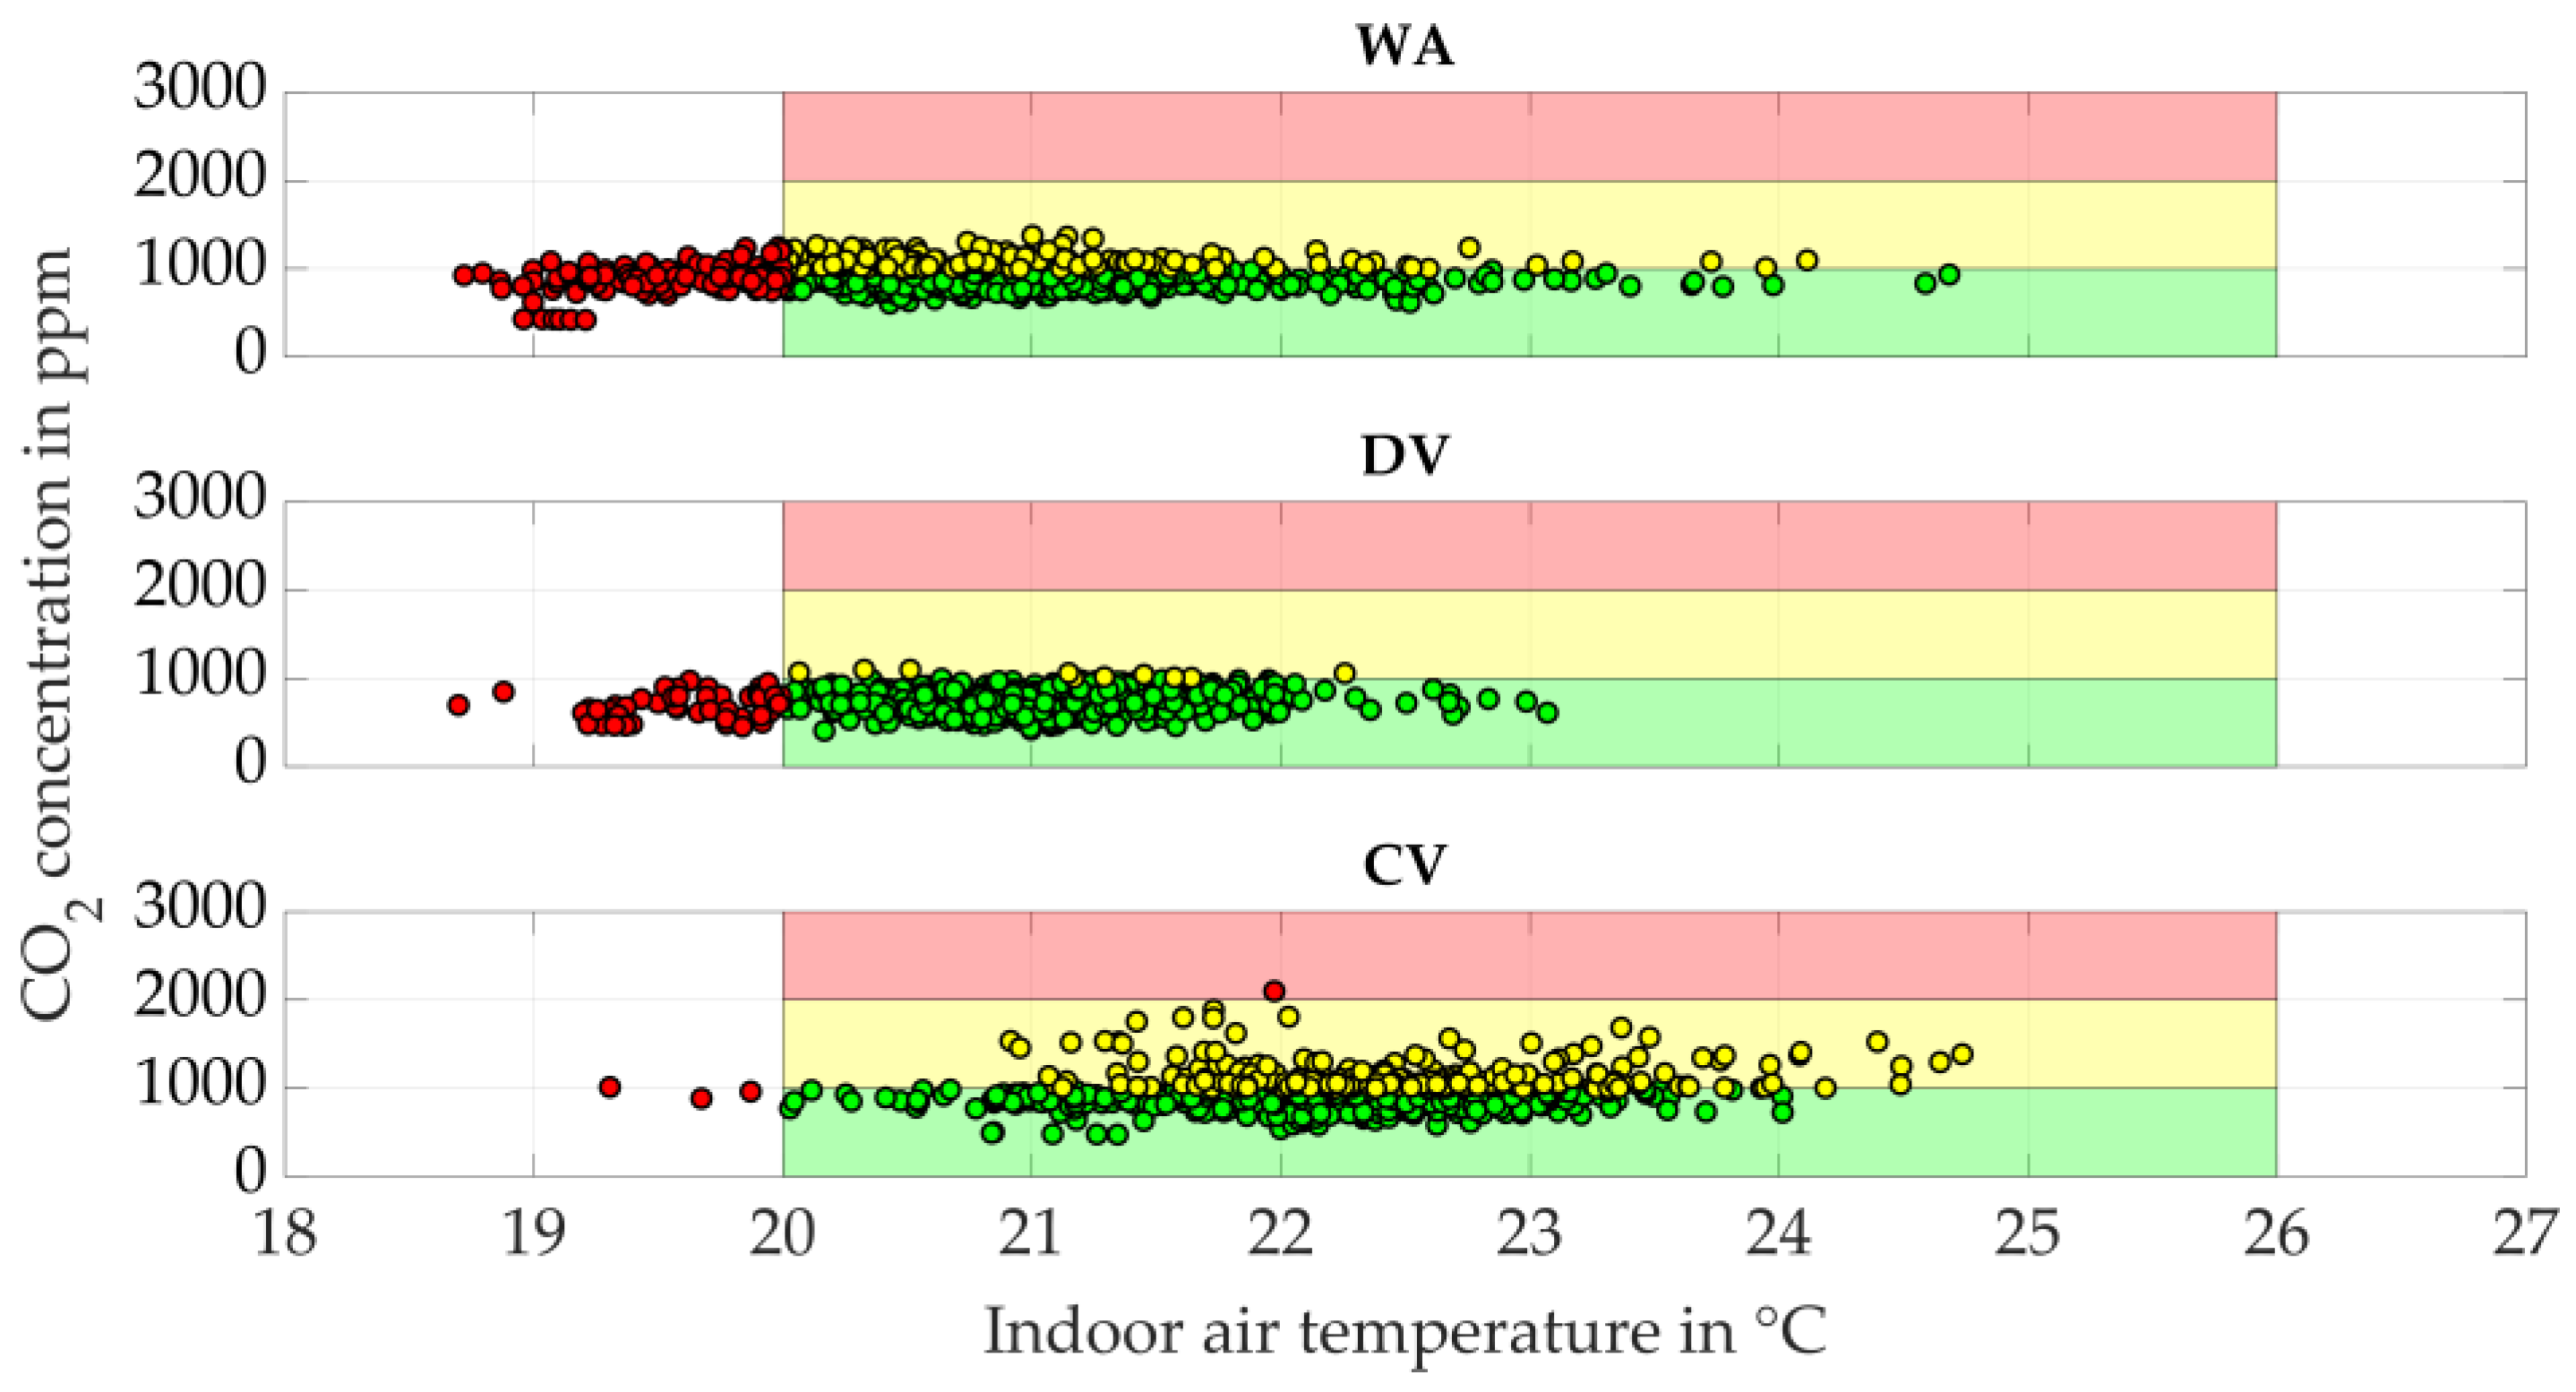
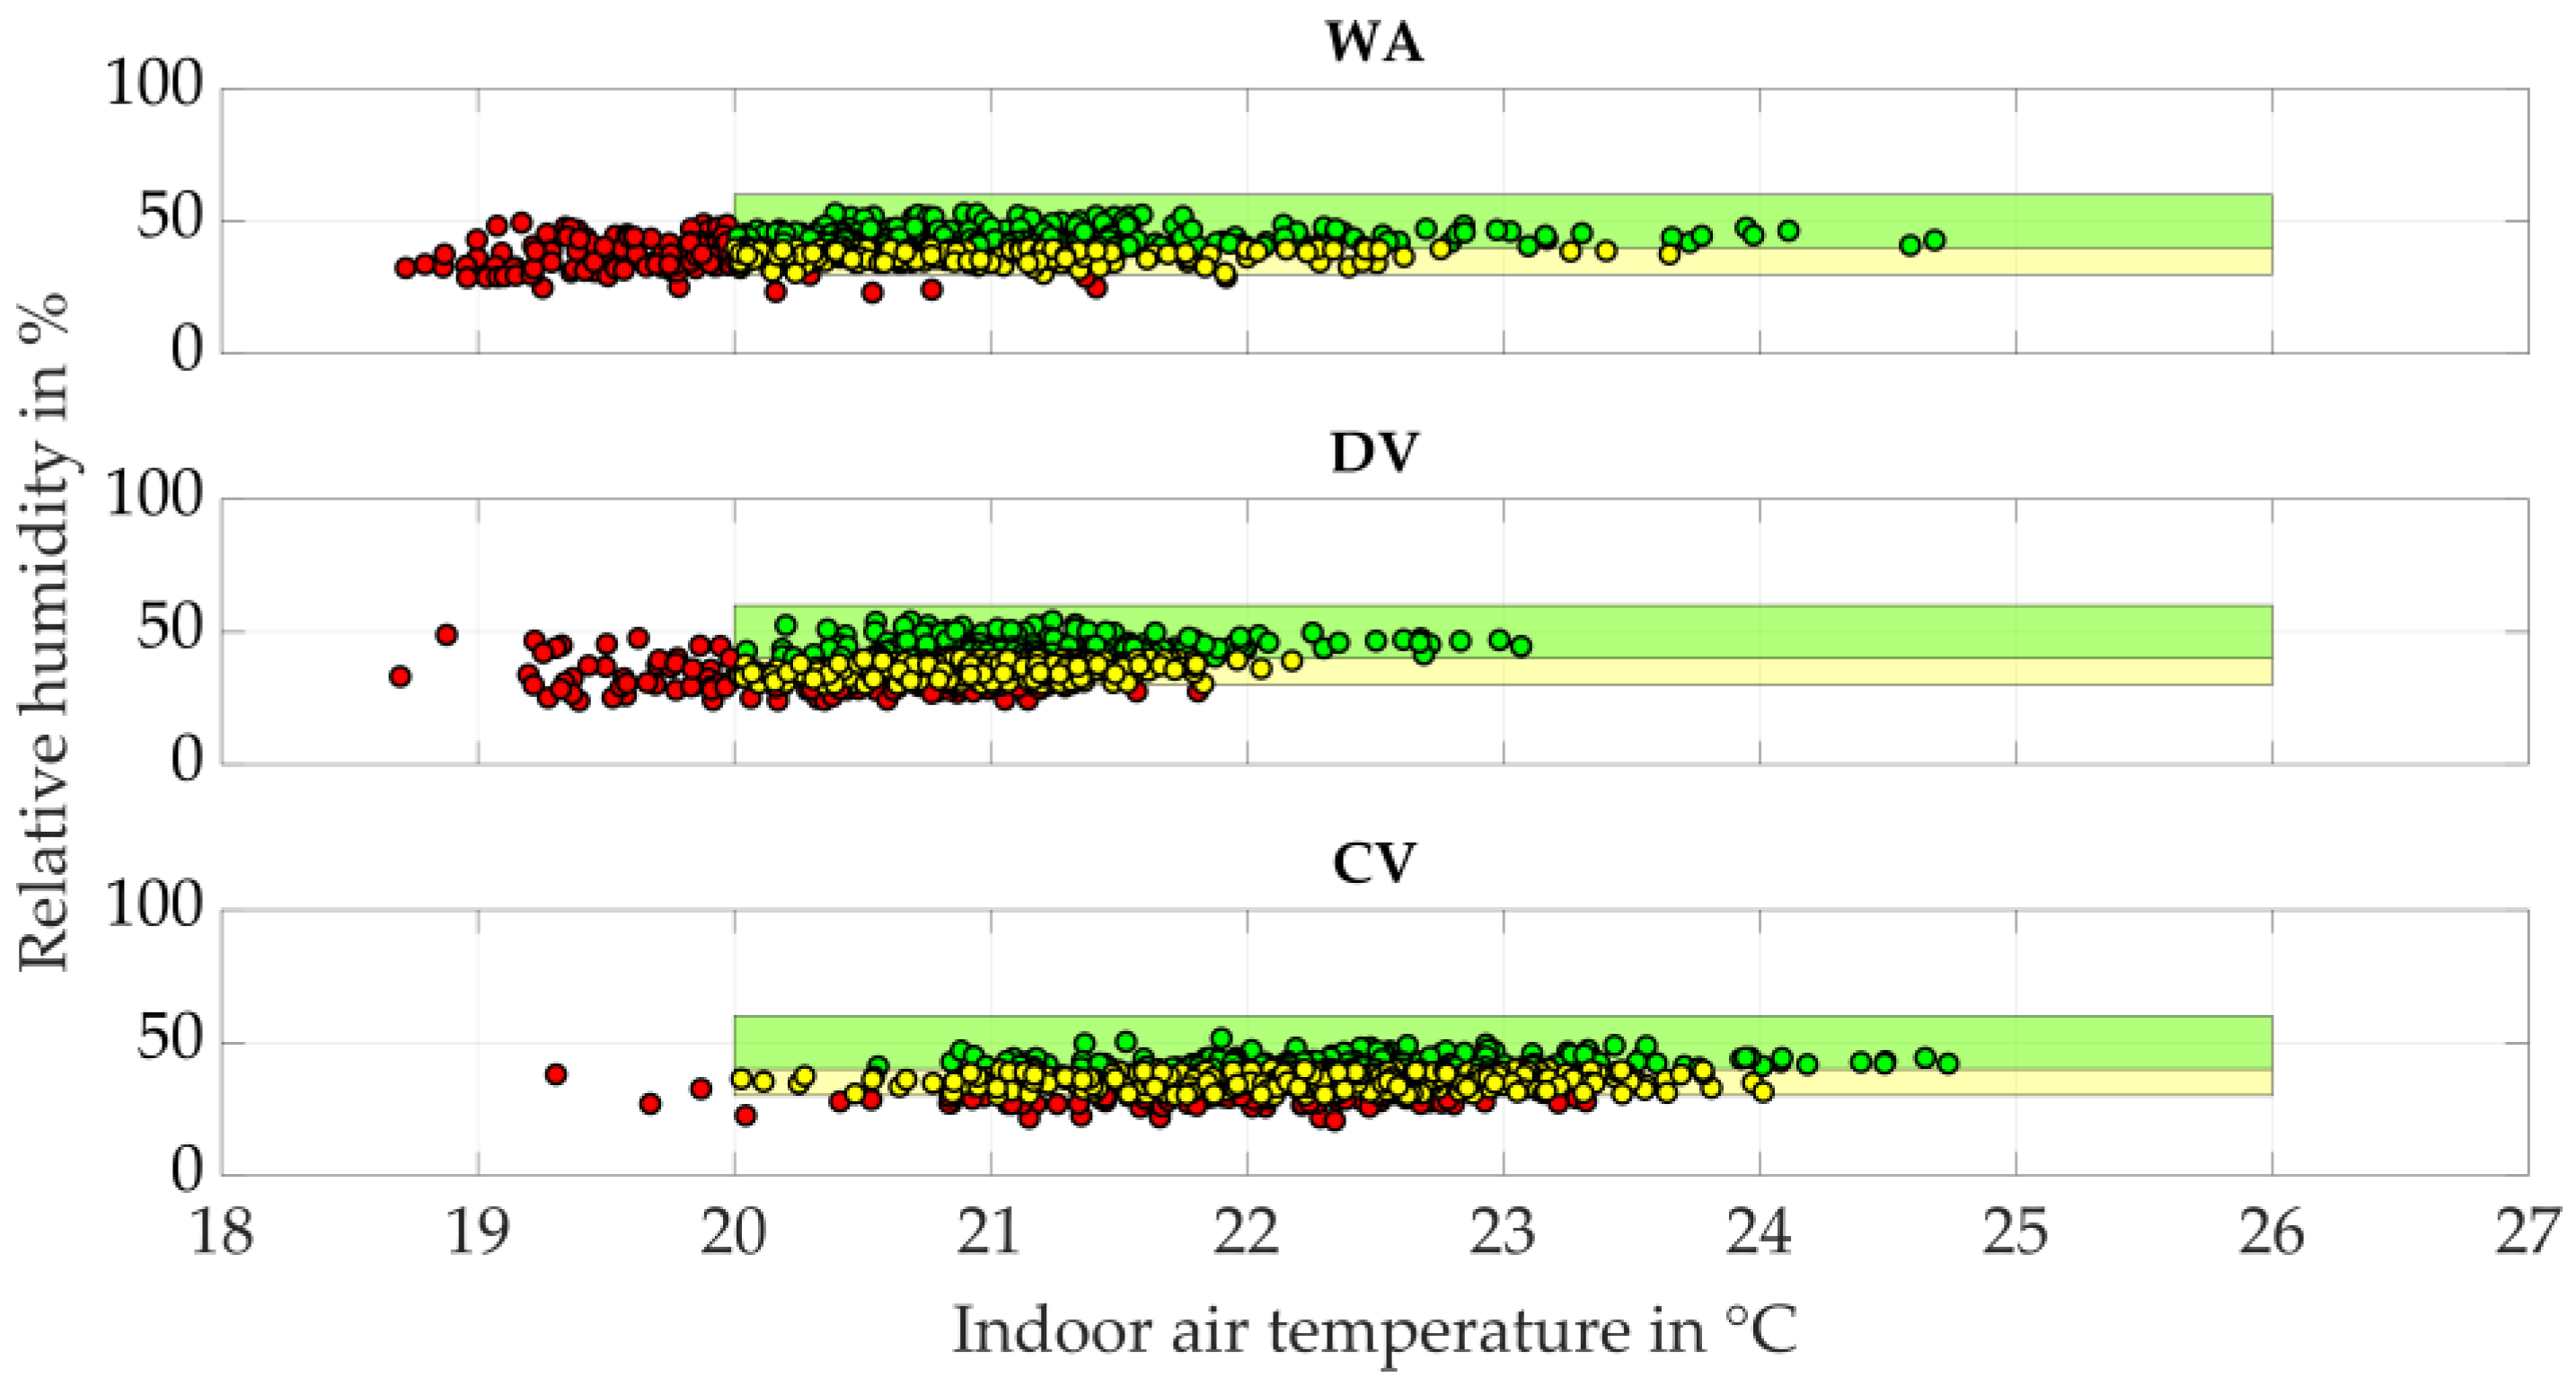
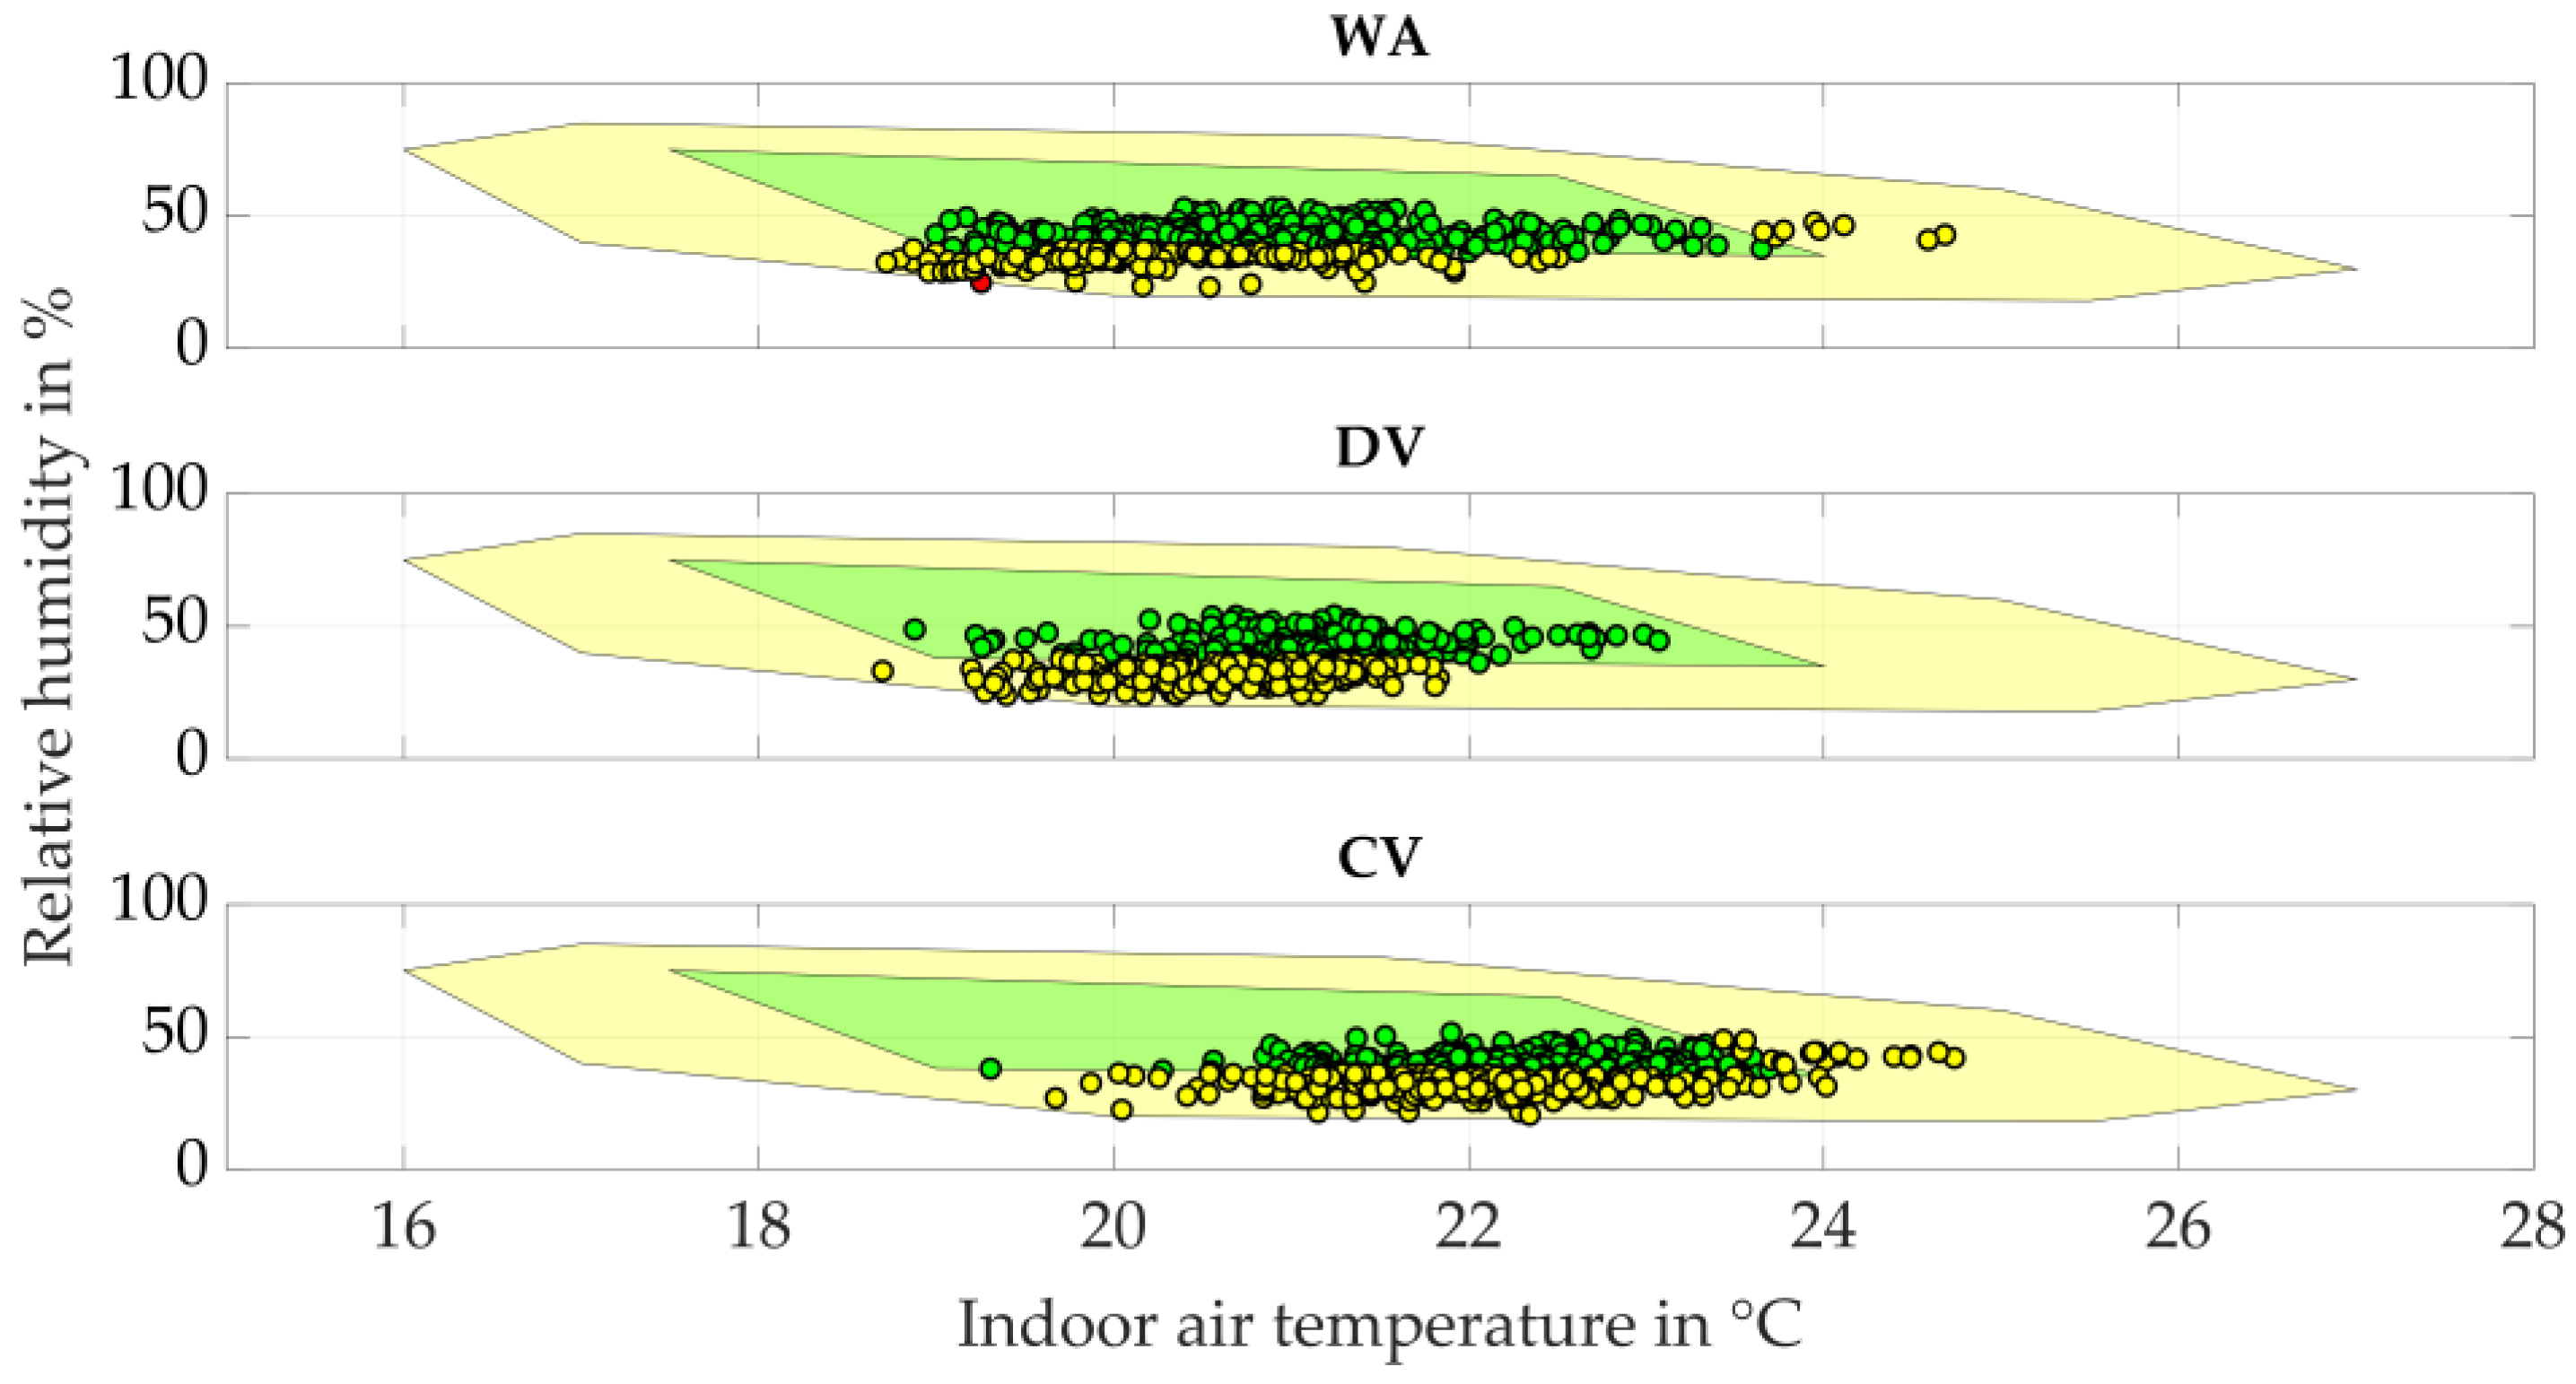
The IEQ of the three ventilation concepts is evaluated based on CO2 concentration, indoor air temperature, relative humidity, and also operative temperature relative to the running mean ambient temperature. Figure 11, Figure 12, Figure 13 and Figure 14 summarize school-wide conditions and highlight hours with acceptable, borderline, and unacceptable IEQ.
Figure 11 shows the school-wide means of CO2 concentration versus indoor air temperature. Recommended design values define comfort bands with good, acceptable, and unacceptable IEQ, highlighted in green, yellow, and red, similar to CO2 traffic lights. An unacceptable IEQ (red dots) occurs in 124 (WA, 21.2%), 48 (DV, 8.2%), and 4 (CV, 0.7%) school hours, mainly due to low temperatures. (Section 3.2 details threshold exceedances.)
Figure 12 shows the school-wide means of relative humidity and indoor air temperature. In addition to the standard DIN EN 16798-1 limits, a stricter lower threshold of 40% r.h. is included (green band). The standard comfort range (20–26 °C, 30–60% r.h.) is not met in 131 (WA, 22%), 94 (DV, 16%), and 77 (CV, 13%) school hours. Considering the stricter 40% r.h. threshold, 309 (WA, 53%), 375 (DV, 64%), and 423 (CV, 72%) school hours are classified as uncomfortable. Overall, the indoor climate tends to be too cold and too dry.
Thermal comfort is further assessed using comfort diagrams, which provide a dynamic, statistical representation of acceptable indoor conditions [40]. The inner area (green) indicates comfortable conditions, the surrounding area (yellow) still acceptable conditions, and values outside are classified as uncomfortable. Figure 13 shows that 415 (WA, 70.8%), 341 (DV, 58.2%), and 302 (CV, 52.3%) school hours are comfortable, with only one school hour in group WA classified as uncomfortable.
An acceptable indoor air climate can further be determined using recommended ranges of operative temperature relative to the running mean ambient air temperature, depending on the expectation level (IEQII) and season. As described in Section 2.7, the indoor air temperature is evaluated instead of the operative temperature. Figure 14 shows that uncomfortable conditions occur in 123 (WA, 21.0%), 47 (DV, 8.0%), and 3 (CV, 0.5%) school hours, due to temperatures below 20 °C, particularly in winter.

3.7. Decentralized Ventilation

This section evaluates the practical performance of the decentralized ventilation concept under real-life conditions. Both user-induced malfunctions and the impact of a demand-based CO2 controller are analyzed.
By examining the temporal progressions of classroom CO2 concentrations in combination with the electrical power consumption of the AHUs, periods of improper AHU operation are identified and their impact on IEQ is analyzed. Peaks in the daily average CO2 concentration (see Figure 5), such as daily means up to 1266 ppm on 8 January 2024, indicate inactive AHUs, as the facility manager switches off the AHUs manually before school vacations. If reactivation is delayed, minute-by-minute CO2 concentrations of up to 3000 ppm are measured (maximum values of 2904 ppm in classroom DV-1 and 3036 ppm in DV-2). In total, six periods can be identified in which the decentralized AHUs do not run properly during the occupancy time: at the beginning of the study the AHUs run at night before lessons until 19 October 2023; the AHUs are switched on too late after school vacations and switched off too early once before vacations; there is no automatic time changeover activated, why the AHUs run a shifted time schedule for 14 school days. This corresponds to 134 school hours or 18.6% of all school hours of the study period.
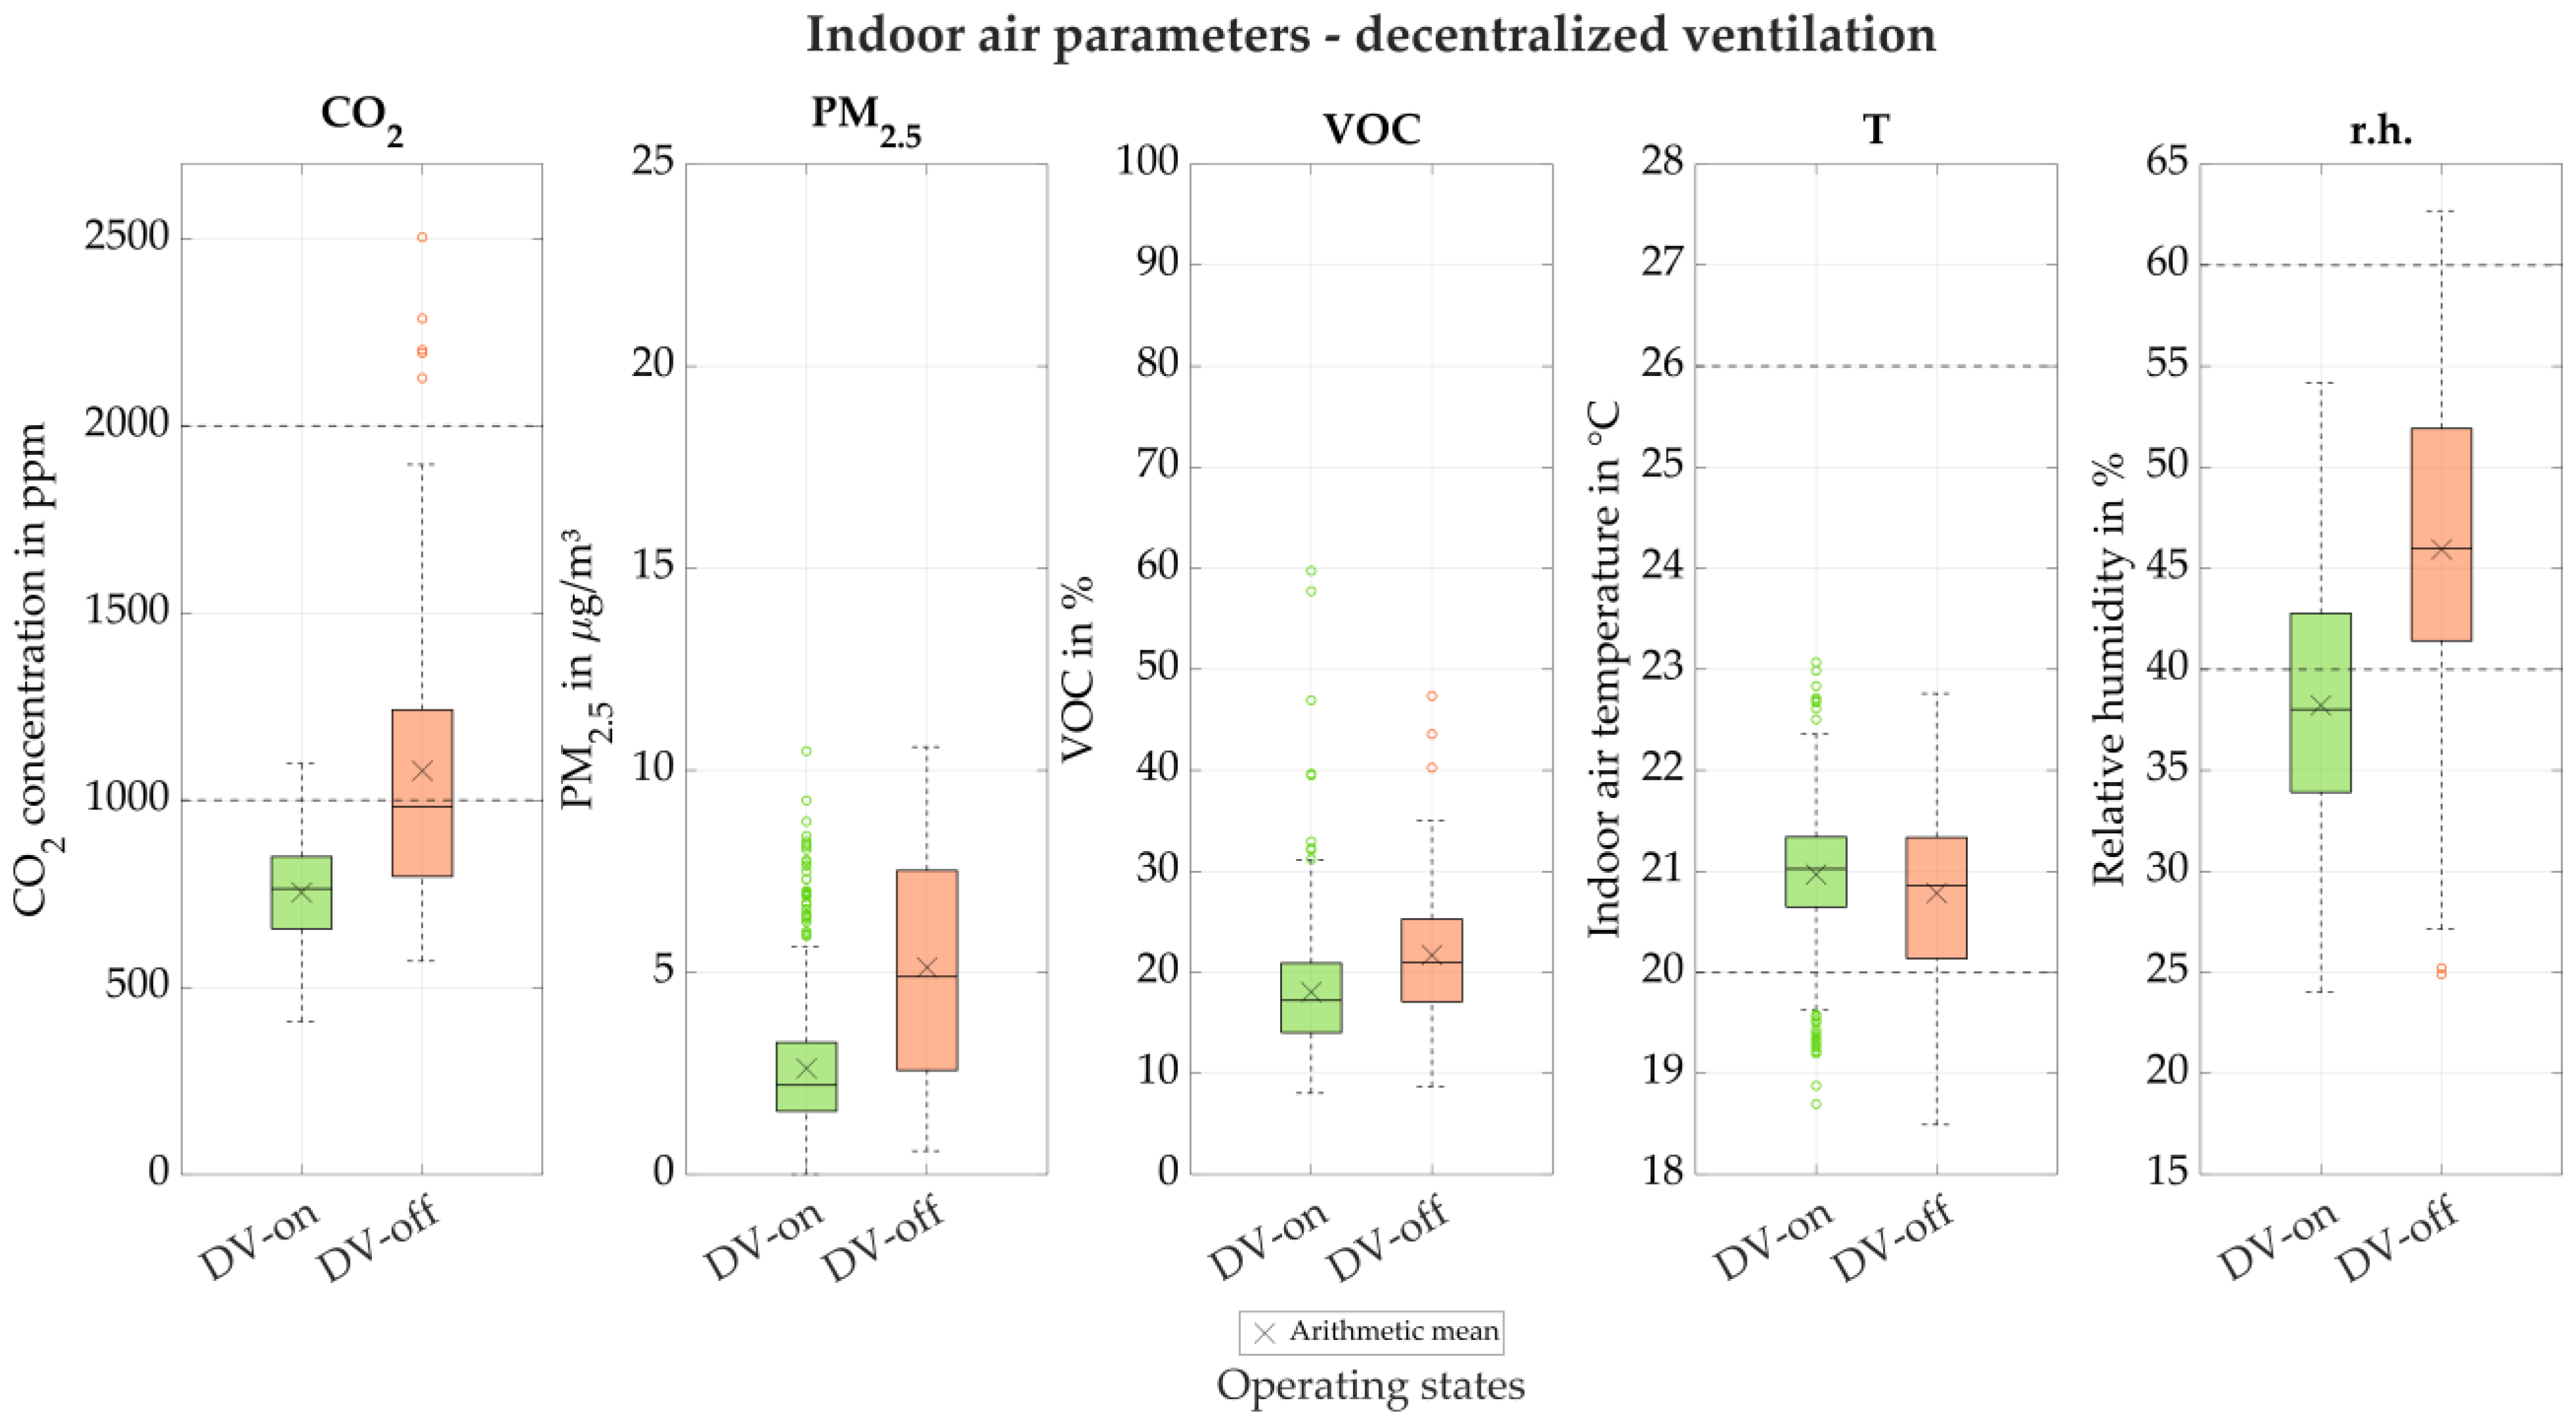
For analysis, the DV data is grouped by the operating state of the AHUs: proper operation according to a time schedule (DV-on, 586 school hours) versus malfunction or deactivation (DV-off, 134 school hours). Figure 15 presents the school-wide means of the five indoor air parameters for both operating states.
The Mann–Whitney U test reveals statistically significant differences (all p < 0.05) in all five indoor air parameters between periods of proper and improper AHU operation.
A substantial difference in CO2 concentrations can be observed. With the decentralized AHUs operating properly (DV-on), no outliers occur and the maximum concentration remains at 1100 ppm, compared to 2505 ppm when the system is off. CO2 levels above 2000 ppm are entirely avoided during DV-on operation, and the 1000 ppm threshold is exceeded in only 1.7% of school hours. In contrast, under DV-off conditions, CO2 concentrations exceed 1000 ppm during 49.3% of school hours and surpass 2000 ppm in 3.7% of the time (5 school hours). Mean CO2 concentrations are 754 ppm (DV-on) versus 1079 ppm (DV-off), and median values are 763 ppm versus 983 ppm—reductions of 30.1% and 22.4% under proper operation. PM2.5 and VOC also show lower values for DV-on. For PM2.5 and VOC, the mean values are 48.8% and 16.8% lower for DV-on, and the median values are 54.8% and 18% lower, respectively. During periods when the AHUs do not operate properly, slightly lower average indoor air temperatures are observed, with mean values of 21.0 °C (DV-on) and 20.8 °C (DV-off). However, temperatures fall below 20 °C in 21.6% of school hours, compared to only 8.2% under DV-on conditions. A more pronounced difference is observed in relative humidity. With DV-off, humidity levels are much higher. The relative humidity drops below 40% r.h. in only 18.7% of school hours, compared to 62.1% with DV-on. For DV-off, relative humidity exceeds a value of 60% r.h. in 3% of the time. Across all indoor air parameters, variability is markedly higher during periods of improper AHU operation. The interquartile range under DV-off conditions is 131% larger for CO2, 191% for PM2.5, 19% for VOC, 73% for indoor air temperature, and 19% for relative humidity compared to DV-on.
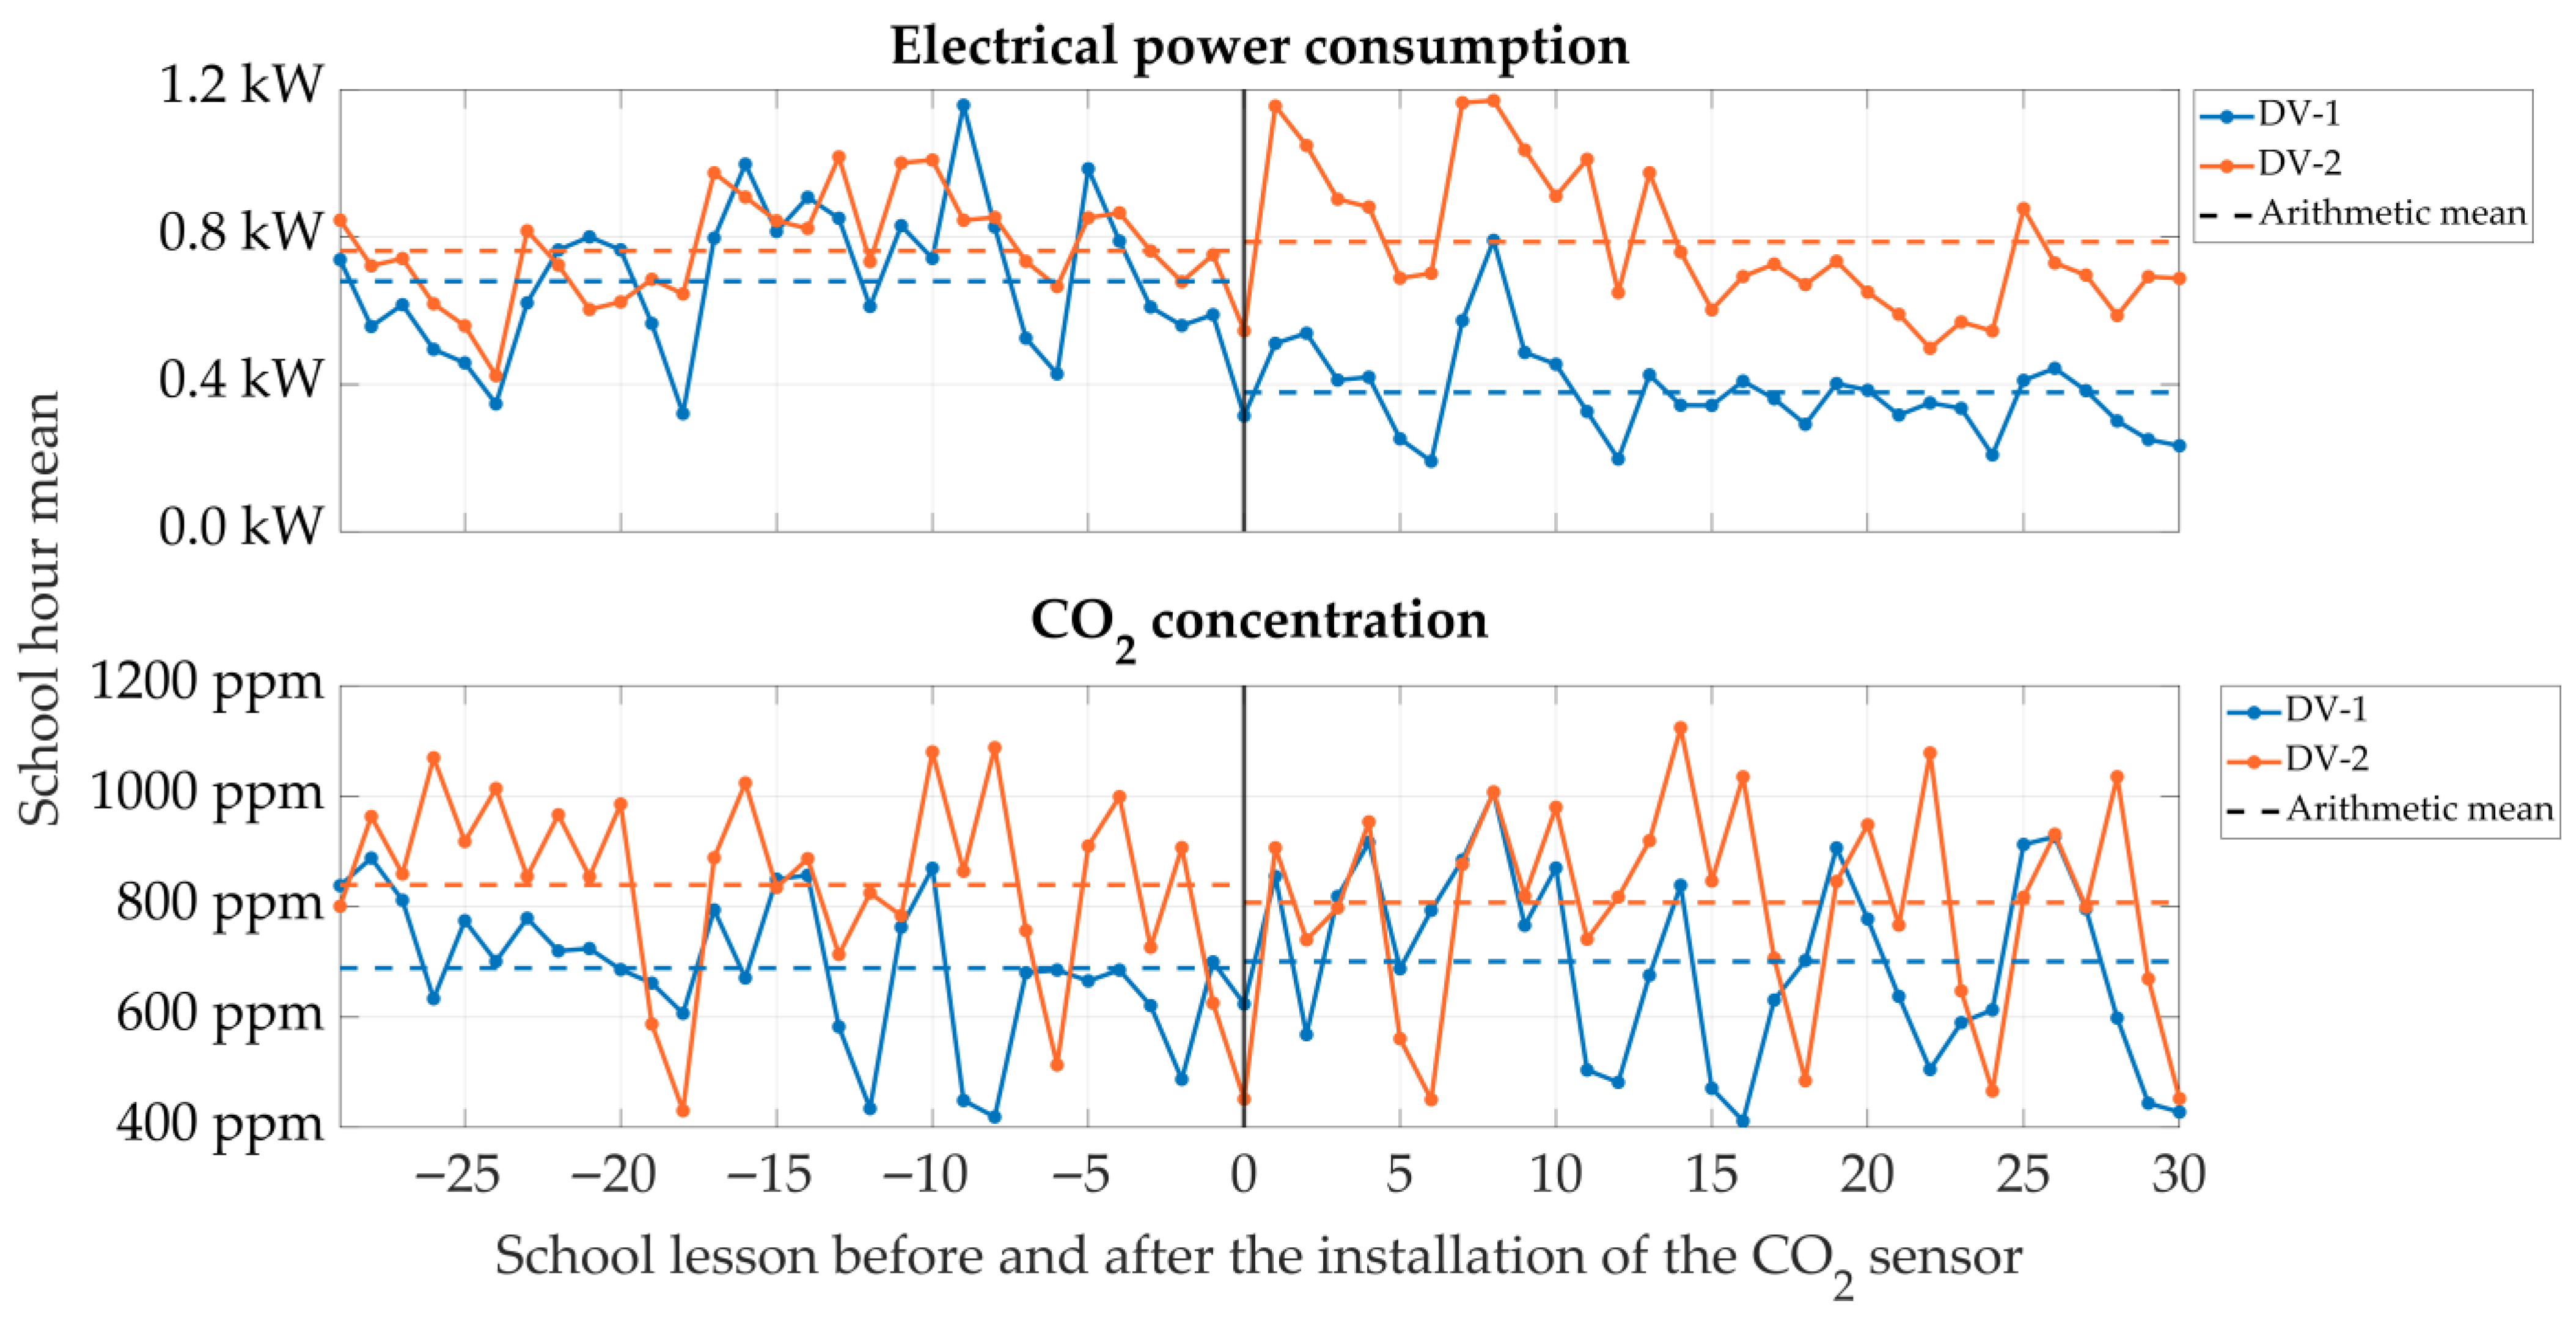
The influence of a demand-based CO2-controller on the electrical power consumption of a decentralized AHU was investigated in group DV. A CO2 sensor was installed in the AHU of classroom DV-1 on 28 February 2024. The internal controller was changed in accordance with the manufacturer’s specifications. The AHU in classroom DV-2 retained a constant fan speed during the entire study period. Figure 16 shows the average electrical power consumption of the two decentralized AHUs as school hour means for 30 lessons before and 30 lessons after the retrofit. Prior the installation, the average electrical power consumption of the AHUs accounts to 0.68 kW (DV-1) and 0.76 kW (DV-2). As the control in DV-2 was not changed, the electrical power consumption during the 30 lessons after the retrofit remains almost unchanged at an average value of 0.79 kW (+4%). On the other hand, the electrical power consumption of the AHU in DV-1 is lowered by 44% to 0.38 kW on average. The average CO2 concentrations in both classrooms are only marginally affected, changing from 689 ppm to 701 ppm (DV-1), and from 839 ppm to 807 ppm (DV-2) before and after the retrofit. During most school hours, both AHUs successfully limit the CO2 concentrations to a maximum of 1000 ppm, with or without the CO2 controller.

3.8. Central Ventilation

During the evaluation period, the classrooms in group CV are often ventilated additionally via window airing despite the centralized AHU. The mean window airing time per school hour is 9 min (see Section 3.4). However, the BMS data shows, that the room-wise ventilation system is deactivated, if a window is open or no occupancy of the room is detected (for reasons of energy saving). Consequently, window airing, even if only one window is tilted, will deactivate the ventilation system of the specific classroom.
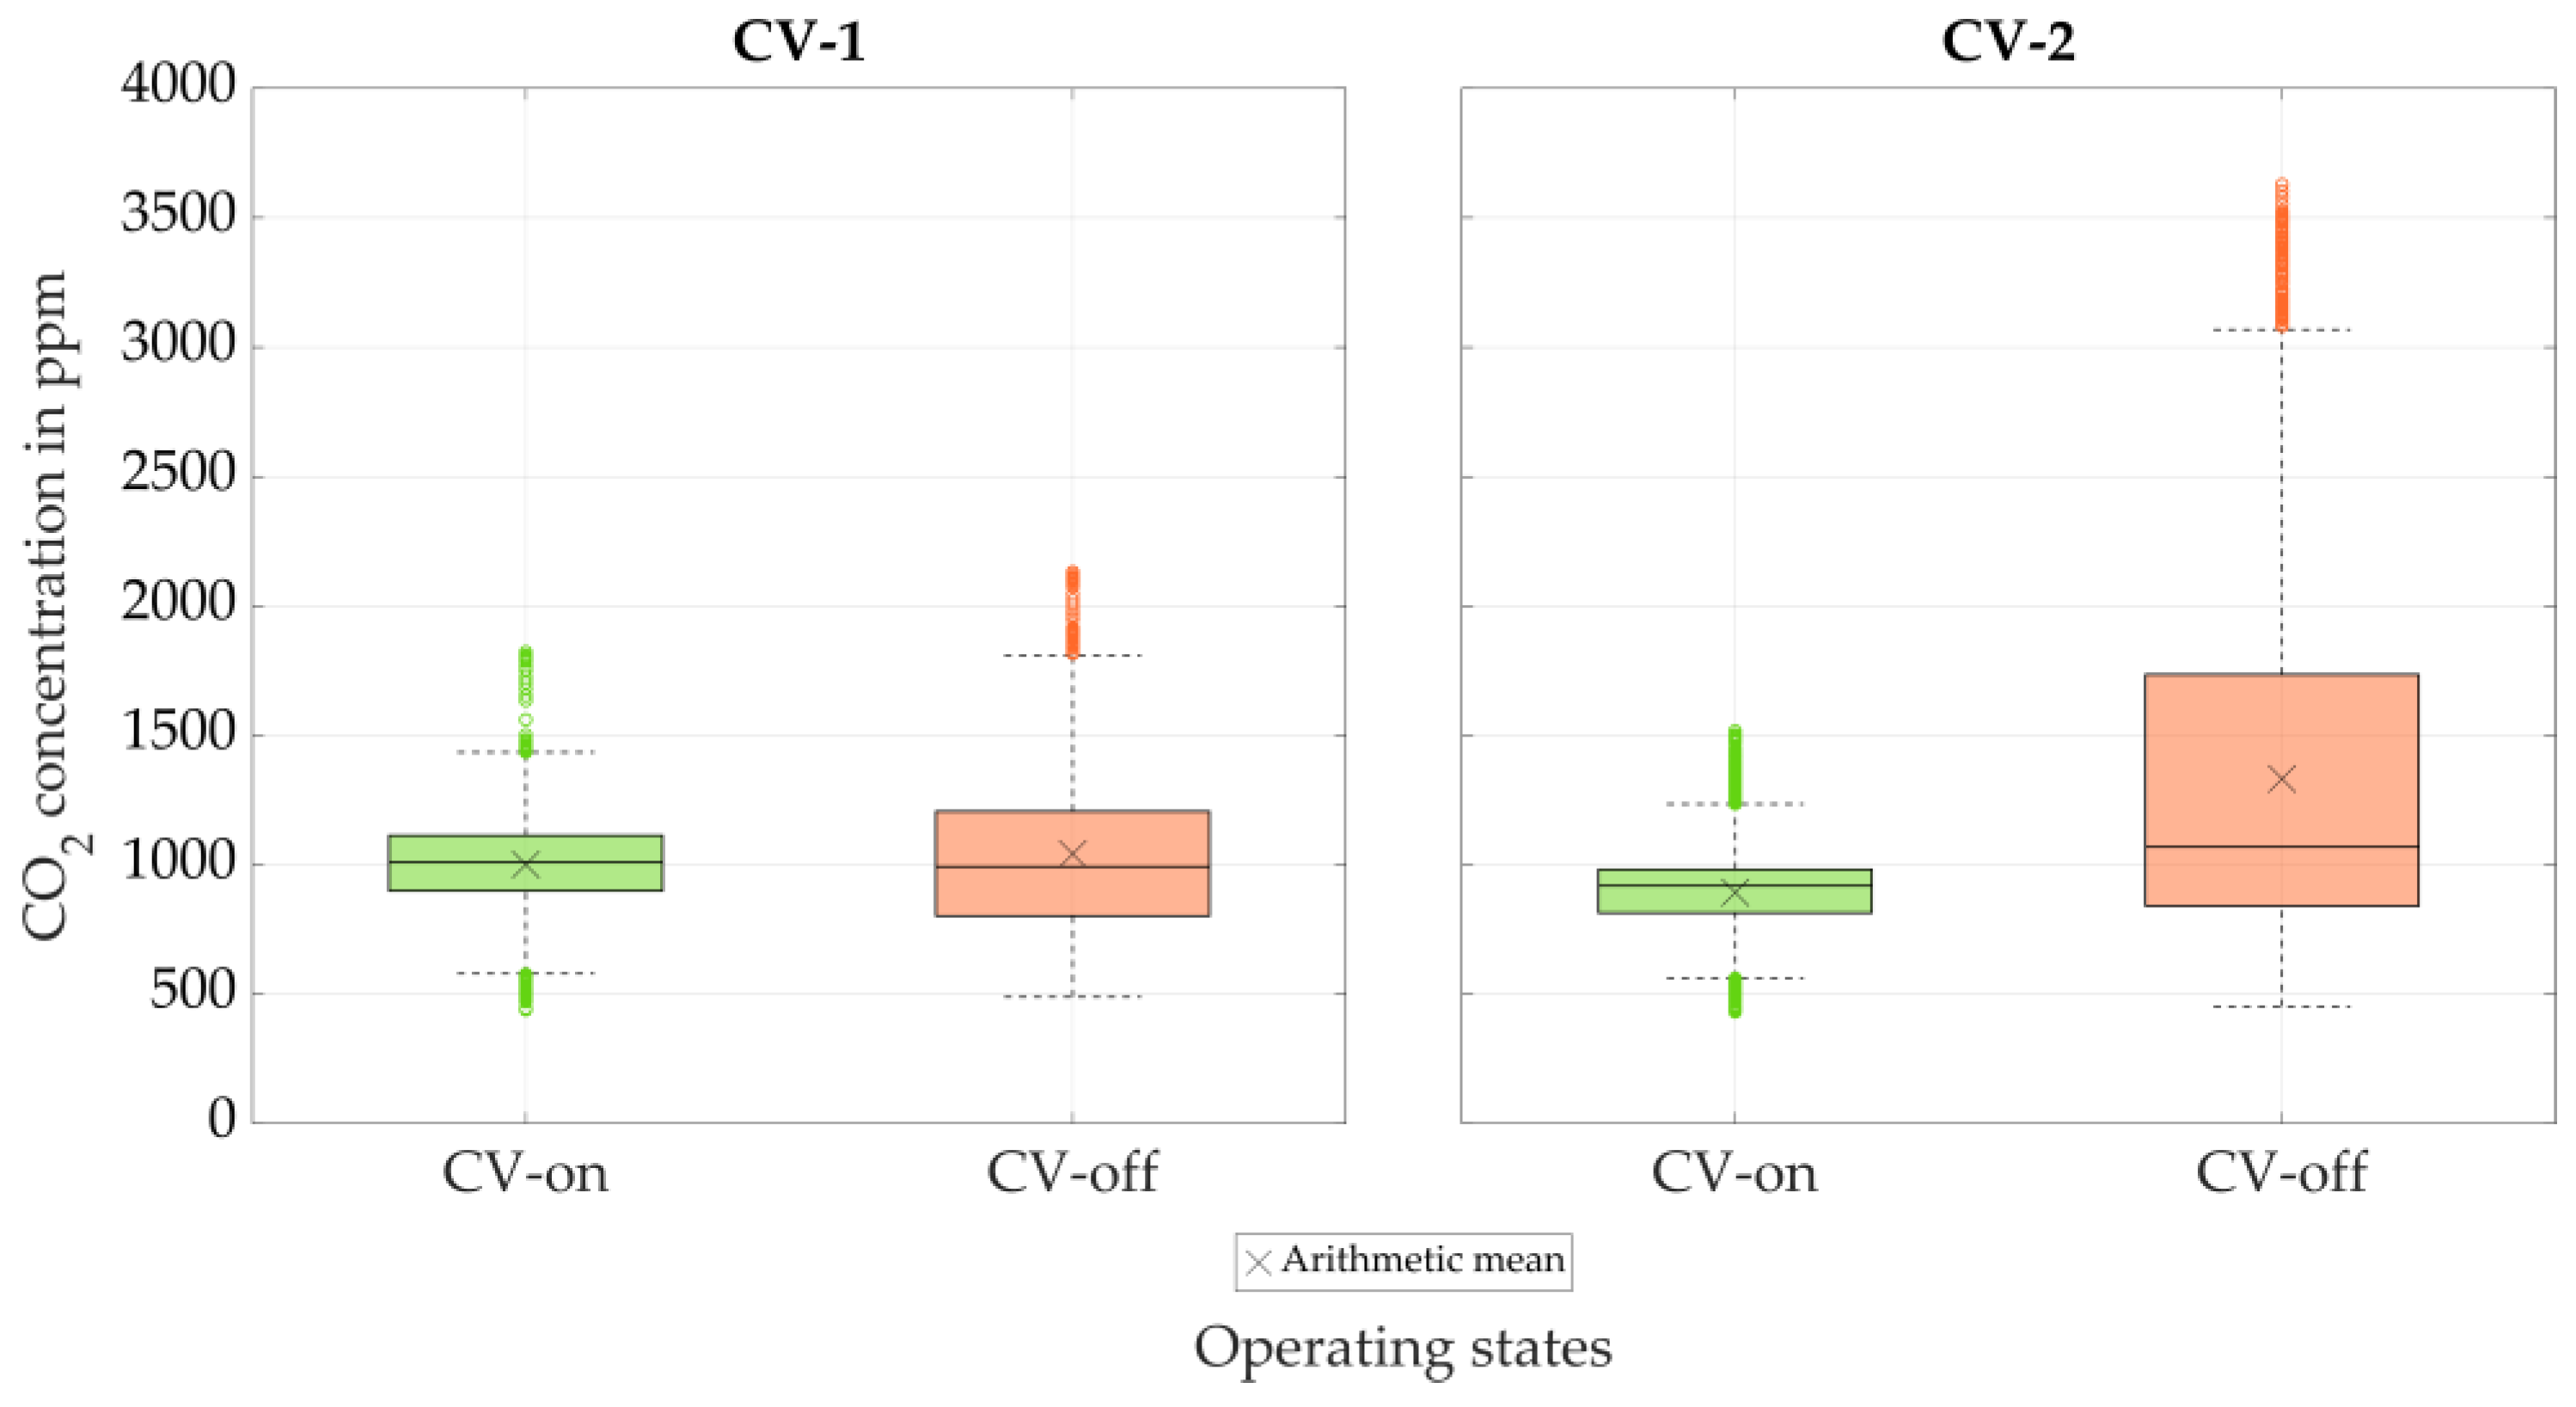
The impact of ventilation deactivation on CO2 concentration is evaluated by combining BMS data with room measurement data. Two operating states are distinguished: CV-on, when all windows are closed and the ventilation system is active, and CV-off, when at least one window is open or tilted and the ventilation system is deactivated. In both cases, only periods with detected occupancy were considered; transitional states were excluded. Figure 17 shows the minute-by-minute CO2 concentrations in classrooms CV-1 and CV-2 for the two operating states.
In regular operation mode (CV-on) classrooms CV-1 and CV-2 show acceptable CO2 concentrations with mean values of 1000 ppm and 892 ppm, respectively. Maximum concentrations reach 1822 ppm and 1517 ppm, but these peaks occur only occasionally. When the ventilation system is deactivated (CV-off), CO2 concentrations clearly increase, with mean values of 1042 ppm (CV-1) and 1332 ppm (CV-2). Maximum values of up to 2131 ppm are observed in CV-1. In particular, in classroom CV-2, CO2 concentrations frequently exceed 2000 ppm, reaching a peak of 3748 ppm.

4. Discussion

The discussion of results focuses mainly on the comparison of the window airing and decentralized ventilation group, as the group with the central ventilation concept has limitations (see Section 4.2).

4.1. Discussion of Results

The five measured indoor air parameters CO2, PM2.5, VOC, indoor air temperature and relative humidity differ significantly (all p < 0.05) between each pair of ventilation concepts over the evaluation period.
Group DV achieves the lowest CO2 concentrations. In only 1.7% of the school hours a value of 1000 ppm is exceeded, in comparison to 26.6% in group WA and 35.0% in group CV. PM2.5 concentrations are significantly lower in group DV than in WA. However nearly all values remain below the daily average threshold of 15 µg/m3, with only a few exceedances observed in group WA (9 school hours). It should be noted that the reported values refer to average concentrations during occupied school hours, not full-day means. For group WA, there is a stronger positive linear correlation between indoor and outdoor PM2.5 concentrations than for the mechanical ventilation groups. If the WCS data are also included in the analysis, there is a stronger linear correlation between indoor and outdoor PM2.5 with open windows than with closed windows. In group WA windows are open two to three times as long as in the mechanically ventilated groups, resulting in higher indoor PM2.5 values, due to the lack of fresh air supply and air filters via mechanical ventilation systems. Group WA shows significantly lower indoor VOC values than the other two groups. As this group features the oldest school building, the emissions from building materials and furniture could be lower than in the other two school buildings. In group WA, indoor air temperatures are significantly lower, falling below 20 °C during 21% of school hours. The four classrooms, unlike those in the other two groups, are south-facing. However, no clear relationship to solar gains can be established, as horizontal solar irradiance was measured on the school building’s roof and shading from surrounding trees likely reduces direct gains on the façade. Likewise, no conclusions can be drawn regarding heating performance, as this parameter was not measured (see Section 4.2). The lower temperatures may be partly explained by the fact that group WA occupies the oldest school building with the poorest building insulation. In addition, the considerably longer window opening times, compared to the mechanically ventilated concepts, likely contribute to the reduced indoor air temperatures.
Both groups with mechanical ventilation systems show a higher proportion of comfortable indoor air conditions during school hours compared to group WA with manual window airing only, primarily due to higher indoor air temperatures. Since group CV includes the newest school building, the high level of thermal insulation may further contribute to maintaining higher indoor air temperatures during winter. However, relative humidity tends to be too low across all three ventilation concepts, indicating a potential limitation for overall indoor environmental quality and for reducing the risk of airborne disease transmission. Especially in the mechanically ventilated concepts relative humidity is below the recommended 40% most of the school hours. The mechanically ventilated classrooms are supplied with fresh outdoor air heated to 20 °C (DV) or 21 °C (CV) by the AHUs. However, the ventilation systems lack humidification. As a result, when cold outdoor air is heated, its low absolute humidity leads to a significant drop in indoor relative humidity.
Table 7 summarizes the temporal exceedances and underruns of CO2 concentration, indoor air temperature and relative humidity for the ventilation concepts, including the operating state DV-off. In addition, the average window airing time is shown for all three concepts.
Furthermore, the operation of the decentralized and centralized ventilation systems was analyzed in detail, with particular emphasis on CO2 concentrations during periods when the mechanical ventilation was inactive. In the decentralized ventilation group, a comparison of the two operating states DV-on and DV-off reveals statistically significant differences in all five indoor air parameters (all p < 0.05). When the decentralized AHUs are active, CO2 concentrations are significantly lower, and both PM2.5 and VOC concentrations are reduced. Indoor air temperature is slightly higher, which may support thermal comfort. In contrast, relative humidity shows less favorable behavior: it is significantly reduced during DV-on periods and remains below 40% for almost two-thirds of the time.
Switching the control of the decentralized AHU from constant fan speed to a demand-based CO2 control shows that the AHU works much more efficiently with the CO2 control (electrical energy reduction of 44%), without compromising IAQ and ventilation requirements.
In the central ventilation group, monitoring and BMS data show that supply air is controlled not only by CO2 concentration and occupancy, but also by a window signal integrated into the BMS. A comparison of the two operating states (CV-on and CV-off) confirms higher CO2 concentrations in both classrooms during window airing than during mechanical ventilation. This is due to the supply air being deactivated as soon as the window contact is active, even if only one window is tilted. The majority of window opening events involve only a single tilted (45%) or opened (26%) window, so air exchange during window airing is often limited, explaining higher CO2 concentrations. This effect is more pronounced in classroom CV-2. The average window opening time per school hour is nearly twice as high in classroom CV-1 (12.5 min) compared to CV-2 (6.9 min), so the supply air system operates less frequently and for shorter durations in CV-1, which also has higher occupancy. Nevertheless, no markedly elevated CO2 concentrations are observed in CV-1 during times with deactivated supply air, for which no clear explanation can be given. It is also noteworthy that CO2 concentrations occasionally exceed 1000 ppm despite active supply air, although the central ventilation system is designed to increase the airflow when a threshold of 900 ppm is reached. This may indicate an insufficiently dimensioned airflow rate, but this cannot be confirmed with certainty at this stage.

4.2. Constraints and Limitations

The results of group CV are difficult to evaluate in relation to the ventilation concept. As the supply air is deactivated for an open window signal by the BMS and commonly only a single window is tilted, the required air exchange rate cannot be achieved and the CO2 concentration can rise sharply. The minute-by-minute CO2 concentration easily exceeds 1000 ppm most of the time, if the supply air is deactivated, and peaks up to 3748 ppm. For the central ventilation concept, this means that there is no continuous mechanical ventilation during lessons, but there is actually mechanical ventilation or (often inadequate) window airing. In addition, the assessment of indoor PM2.5 concentrations in group CV is made more difficult by the fact that recirculating air purifiers are installed in the classrooms and their sporadic manual operation by the users was not recorded by the BMS or the long-term monitoring.
While the measurement concept is already highly comprehensive, certain limitations remain. Due to the structural effort involved, heating energy consumption and system settings were not included in the long-term monitoring. Ideally, room-level heating energy meters should be installed to allow for an evaluation of the impact of different ventilation concepts on heating energy use. Additionally, information on heating system settings would enable a more precise assessment of indoor air temperature dynamics. For the evaluation of thermal comfort, the measured indoor air temperature rather than the operative temperature was used. The actual number of school hours that cannot be classified as comfortable could therefore be slightly higher than described above. A quantification is not possible as the operative temperature depends on the radiant heat from surrounding surfaces, which was not measured. The cumulative measurement of VOC concentrations does not allow for the identification of individual compounds. To enable more precise conclusions regarding specific indoor air pollutants, more advanced analytical instruments would be required, although they entail considerably higher costs.
It is worth noting that despite the window contact switches sending a certain opening state, the real opening state of the window cannot be determined with absolute certainty. The window handle sensors only detect the position of the window handle and not whether the window has actually been opened. With the mechanical window sensors, which are mounted in the window frame, the window must necessarily be opened, but the opening width from which such a contact sensor is triggered is in the range of 2–5 cm. In general, the opening width/opening angle of the window cannot be detected by any of the installed sensors.
Regarding the meteorological data, the average wind speeds vary considerably between the school locations. The measurements were not carried out in accordance with standard recommendations and differing rooftop boundary conditions at the school sites along with local flow disturbances (e.g., parapets or rooftop structures) may have affected the wind speed measurements. However, wind speed can play a decisive role in air exchange, especially when ventilating through windows. Ideally, measurements should be performed directly in front of the windows. To evaluate the impact of window airing on air exchange rates and to interpret its influence on indoor PM2.5 more precisely, wind speed and wind direction relative to the classroom orientation should also be considered.

5. Conclusions

The comprehensive monitoring of indoor and outdoor parameters, especially the recording of the window states, helps to deepen the understanding of relationships between ventilation concepts, window opening times and indoor environmental quality parameters such as CO2 and indoor particulate matter PM2.5.
With decentralized mechanical ventilation, CO2 and PM2.5 concentrations were significantly lower compared to pure window airing. Indoor air temperatures were also more comfortable. However, relative humidity levels were less favorable, particularly in the mechanically ventilated concepts, where they often fell below a recommended level of 40%. The CO2 concentrations in the window airing concept remained below 1000 ppm for 74.4% of the time, which can be considered acceptable. However, it is noteworthy that this group featured large sliding windows and CO2 traffic lights, which probably supported effective ventilation behavior. Window opening times in this group were two to three times longer than in the mechanically ventilated groups, resulting in higher indoor PM2.5 values.
By the analysis of CO2 concentrations, electrical current of the decentralized air handling units, window opening states and data of the building management system in the central ventilation group, periods with deactivated mechanical ventilation during lessons were identified. In the decentralized ventilation group, these were caused by incorrect settings of the AHUs. As this group lacked a BMS, the facility manager had to configure each AHU manually in the respective classrooms. The issues were mainly caused by incorrectly programmed operating schedules, delayed activation or premature deactivation regarding school vacations, or the absence of automatic time changeover. Furthermore, the decentralized AHU demonstrated substantially higher energy-efficiency when operated with a demand-based CO2 control rather than constant fan speed, without any disadvantages regarding indoor air quality. In the central ventilation group, the analysis of the mechanical ventilation revealed the use of a control strategy that depended on a window opening signal as part of an energy-saving measure. However, neither the facility manager nor the building operator was aware of this control setting, which meant that teachers and pupils were also uninformed. As a result, the energy-efficient control strategy led to poor indoor air quality during periods when a window was opened and the supply air was deactivated.
The study highlights the significance of well operated mechanical ventilation systems and the necessity for user awareness of essential control settings. Basic training for teaching and facility staff and the integration of decentralized AHUs into a BMS, where feasible, could help reduce user-induced operating errors and ensure more reliable system performance. This study shows that well-operated mechanical ventilation provides better indoor environmental quality compared to window airing only. Although the focus was on IEQ, potential drawbacks of mechanical ventilation should be noted. Decentralized units may generate classroom noise, while window airing can introduce outdoor noise. Mechanical systems also require maintenance and consume electricity. Nonetheless, they may reduce heating demand through heat recovery and shorter window opening durations.
Alongside the long-term monitoring, which was part of a prospective controlled observational study, questionnaires were administered and saliva samples collected from schoolchildren. Future analyses will focus on evaluating the questionnaire and salivary biomarker data and integrating these findings with the results of the long-term monitoring.

Author Contributions

Conceptualization, S.B., S.H. and R.W.-E.; methodology, S.B. and S.H.; formal analysis, S.B. and S.H.; investigation, S.B., S.H. and J.G.; data curation, S.B. and S.H.; writing—original draft preparation, S.B., S.H. and R.W.-E.; writing—review and editing, S.B., S.H., R.W.-E., A.J.H. and A.D.; visualization, S.B. and S.H.; supervision, A.J.H. and A.D.; project administration, S.B.; funding acquisition, S.B. and A.D., S.B. and R.W.-E. contributed equally to the authorship and to this work. This article is an essential component of the doctoral theses authored by S.B. and R.W.-E. and overseen by A.J.H. and A.D. All authors have read and agreed to the published version of the manuscript.

Funding

This study presents results from the project “MoSimEx-Luft” (10.08.18.7-22.33). The project was funded by the Federal Institute for Research on Building, Urban Affairs and Spatial Development on behalf of the Federal Ministry for Housing, Urban Development and Building with funds from the Future Building Research Funding.

Data Availability Statement

The raw data supporting the conclusions of this article will be made available by the authors on request.

Acknowledgments

The authors would like to thank the elementary schools Michael-Ende-Schule Nürnberg, Adalbert-Stifter-Grundschule Fürth and Grundschule Großenseebach, as well as the cities of Nuremberg and Fürth and the municipality of Großenseebach, for their cooperation and for enabling the implementation of this study. Special thanks go to the school principals, teachers and facility managers for their valuable support. We also gratefully acknowledge our industrial and research partner Wolf GmbH for their essential support and collaboration throughout the research project. During the preparation of this work, the authors utilized DeepL version 25.8.2.17787 and ChatGPT versions GPT–3.5, GPT–4o and GPT–5 to enhance phrasing and text coherence. After using these tools, the authors reviewed and edited the content as needed and took full responsibility for the content of the publication.

Conflicts of Interest

The authors declare no conflicts of interest.

Abbreviations

The following abbreviations are used in this manuscript:
AHUAir handling unit
BMSBuilding management system
CO2Carbon dioxide
CVCentral ventilation
CV-offCentral ventilation with deactivated mechanical ventilation
CV-onCentral ventilation with activated mechanical ventilation
DVDecentralized ventilation
DV-offDecentralized ventilation with deactivated mechanical ventilation
DV-onDecentralized ventilation with activated mechanical ventilation
IAQIndoor air quality
IEQIndoor environmental quality
PMParticulate matter
ppmParts per million
r.h.Relative humidity
TIndoor air temperature
VOCVolatile organic compounds
VPNVirtual private network
WAWindow airing
WCSWindow contact switch

References

  1. Birmili, W.; Brinkmann, M.M.; de Graaf, D.; Herr, C.; Moriske, H.-J.; Neisel, F.; Plehn, W.; Selinka, H.-C.; Scherer, C.; Straff, W.; et al. Das Risiko einer Übertragung von SARS-CoV-2 in Innenräumen lässt sich Durch Geeignete Lüftungsmaßnahmen Reduzieren: Stellungnahme der Kommission Innenraumlufthygiene am Umweltbundesamt (Stand: 12 August 2020); Umweltbundesamt: Dessau-Roßlau, Germany, 2020. [Google Scholar]
  2. Al horr, Y.; Arif, M.; Katafygiotou, M.; Mazroei, A.; Kaushik, A.; Elsarrag, E. Impact of indoor environmental quality on occupant well-being and comfort: A review of the literature. Int. J. Sustain. Built Environ. 2016, 5, 1–11. [Google Scholar] [CrossRef]
  3. German Environment Agency. Gesundheitliche Bewertung von Kohlendioxid in der Innenraumluft: Mitteilungen der Ad-hoc-Arbeitsgruppe Innenraumrichtwerte der Innenraumlufthygiene-Kommission des Umweltbundesamtes und der Obersten Landesgesundheitsbehörden. Bundesgesundheitsblatt 2008, 51, 1358–1369. [Google Scholar] [CrossRef] [PubMed]
  4. VDI 6040 Part 1 (2011-06-00); Air-Conditioning—Schools—Requirements (VDI Ventilation Code of Practice, VDI Code of Practice for School Buildings). VDI-Gesellschaft Bauen und Gebäudetechnik: Düsseldorf, Germany, 2011.
  5. Hartmann, A.; Cetin, Y.E.; Gastmeier, P.; Kriegel, M. Praktische Bedeutung von CO2 als Indikator für die Innenraumluftqualität und die relative inhalierte Dosis virenbeladener Partikel. Epid. Bull. 2024, 8, 3–7. [Google Scholar] [CrossRef]
  6. Wargocki, P.; Porras-Salazar, J.A.; Contreras-Espinoza, S.; Bahnfleth, W. The relationships between classroom air quality and children’s performance in school. Build. Environ. 2020, 173, 106749. [Google Scholar] [CrossRef]
  7. Wargocki, P.; Wyon, D.P. Providing better thermal and air quality conditions in school classrooms would be cost-effective. Build. Environ. 2013, 59, 581–589. [Google Scholar] [CrossRef]
  8. König, J. Lüftungskonzepte in Bildungsstätten—Einfluss der Luftqualität auf die Leistungsfähigkeit von Schülern. Sep. 2015. Available online: https://www.semanticscholar.org/paper/L%C3%BCftungskonzepte-in-Bildungsst%C3%A4tten-Einfluss-der-K%C3%B6nig/cdcb6250f23b08998044dc21bfc51ff189b6fee5 (accessed on 9 April 2025).
  9. Jendrossek, S.N.; Jurk, L.A.; Remmers, K.; Cetin, Y.E.; Sunder, W.; Kriegel, M.; Gastmeier, P. The Influence of Ventilation Measures on the Airborne Risk of Infection in Schools: A Scoping Review. Int. J. Environ. Res. Public Health 2023, 20, 3746. [Google Scholar] [CrossRef] [PubMed]
  10. Knaus, C.; Hartmann, T.; Spitzner, M.H. Grundlagen- und Konzeptentwicklung für die Analyse von Praxisgerechten Lüftungskonzepten bei Mechanischer oder Fensterlüftung. Zukunft Bau Final Report 10.08.17.7-16.33; im Auftrag des Bundesinstitutes für Bau, Stadt- und Raumforschung (BBSR): Bonn, Germany, 2017. [Google Scholar]
  11. Duill, F.F.; Schulz, F.; Jain, A.; Paucke, N.; Van Wachem, B.; Beyrau, F. Analysis of IAQ in classrooms during COVID-19 pandemic and the effect of window ventilation and air cleaners depending on season. Build. Environ. 2025, 270, 112484. [Google Scholar] [CrossRef]
  12. Schilling, M.; Pelster, S.; Jelden, T.; Schlegel, E.; Mumme, J.; Ciric, D. Air quality monitoring survey in german school classrooms during the COVID-19 pandemic 2021. arXiv 2022, arXiv:2203.13500. [Google Scholar]
  13. Azuma, K.; Yanagi, U.; Kagi, N.; Kim, H.; Ogata, M.; Hayashi, M. Environmental factors involved in SARS-CoV-2 transmission: Effect and role of indoor environmental quality in the strategy for COVID-19 infection control. Environ. Health Prev. Med. 2020, 25, 66. [Google Scholar] [CrossRef] [PubMed]
  14. REHVA. REHVA COVID-19 Guidance Document, August 3, 2020: How to Operate HVAC and Other Building Service Systems to Prevent the Spread of the Coronavirus (SARS-CoV-2) Disease (COVID-19) in Workplaces; Federation of European Heating, Ventilation and Air Conditioning Associations: Brussels, Belgium, 2020. [Google Scholar]
  15. Morawska, L.; Allen, J.; Bahnfleth, W.; Bluyssen, P.M.; Boerstra, A.; Buonanno, G.; Cao, J.; Dancer, S.J.; Floto, A.; Franchimon, F.; et al. A paradigm shift to combat indoor respiratory infection. Science 2021, 372, 689–691. [Google Scholar] [CrossRef] [PubMed]
  16. BTGA. BTGA Praxisleitfaden: Planung und Betrieb von RLT-Anlagen bei Erhöhten Infektionsschutzanforderungen; BTGA—Bundesindustrieverband Technische Gebäudeausrüstung e. V.: Bonn, Germany, 2021. [Google Scholar]
  17. FGK. FGK-Status-Report 52: Anforderungen an Lüftung und Luftreinigung zur Reduktion des Infektionsrisikos über den Luftweg—AHA + Lüftung; Fachverband Gebäude-Klima e. V.: Bietigheim-Bissingen, Germany, 2021. [Google Scholar]
  18. German Environment Agency. Lüften in Schulen: Empfehlungen des Umweltbundesamtes zu Luftaustausch und effizientem Lüften zur Reduzierung des Infektionsrisikos durch Virushaltige Aerosole in Schulen; Umweltbundesamt: Dessau-Roßlau, Germany, 2020. [Google Scholar]
  19. German Environment Agency. Richtig Lüften in Schulen. Umweltbundesamt. Available online: https://www.umweltbundesamt.de/richtig-lueften-in-schulen (accessed on 21 October 2024).
  20. German Environment Agency. Lüftung, Lüftungsanlagen und Mobile Luftreiniger an Schulen. Umweltbundesamt. Available online: https://www.umweltbundesamt.de/themen/lueftung-lueftungsanlagen-mobile-luftreiniger-an (accessed on 29 July 2025).
  21. Themenseite: Allgemeinbildende Schulen. Statista. Available online: https://de.statista.com/themen/250/schule/ (accessed on 9 April 2025).
  22. FGK e. V.—Pressemitteilungen. Available online: https://updates.fgk.de/presseverwaltung/pm-ausgabe-mit-rahmen.php?index=237 (accessed on 9 April 2025).
  23. OL0119-G2 CO2 Ampel Datasheet v4; OPTO4L GmbH: Schönecken, Germany, 2021.
  24. Betriebsanleitung Comfort Grossraum Lüftung CGL edu. Wolf GmbH. Available online: https://www.wolf.eu/de-de/professional/downloads/downloadcenter?selection=CGL%7Ctype_instruction%7Ctag_%23CGL (accessed on 29 April 2025).
  25. TROX AIR PURIFIERS, TAP-L, TAP-M, Operating Instructions, GB/en. TROX GmbH. Available online: https://cdn.trox.de/f62a9db3117ae2de/16f12913feb3/TAP_OM_V4_A00000083746_2020_11_GB_en.pdf (accessed on 29 April 2025).
  26. EN 16798-1:2019; Energy Performance of Buildings—Ventilation for Buildings—Part 1: Indoor Environmental Input Parameters for Design and Assessment of Energy Performance of Buildings Addressing Indoor Air Quality, Thermal Environment, Lighting and Acoustics—Module M1-6. Beuth Verlag GmbH: Berlin, Germany, 2022. [CrossRef]
  27. SchulbauV: Schulbauverordnung (SchulbauV) Vom 30. Dezember 1994 (GVBl 1995 S. 61) BayRS 2230-1-1-3-K (§§ 1–7)—Bürgerservice. Available online: https://www.gesetze-bayern.de/Content/Document/BaySchulBauV (accessed on 6 December 2024).
  28. Datasheet of Multi Sensor Measurement Device FS1600. FuehlerSysteme eNET International GmbH. Available online: https://www.fuehlersysteme.de/mediafiles/DataSheets/Datasheet_EN_FS1600.pdf?srsltid=AfmBOoo4gqVbKqIvf0S2TAJTi8xPUOXAN9dxO7ItWM7HLj_J2L-7zAMg (accessed on 8 April 2025).
  29. Datasheet of Particulate Matter Sensor FS1308. FuehlerSysteme eNET International GmbH. Available online: https://snuevo.de/mediafiles/DataSheets/Datasheet_EN_FS1308.pdf (accessed on 8 April 2025).
  30. Datasheet of Multi Weather Sensor u[sonic]WS7. LAMBRECHT Meteo GmbH. Available online: https://www.lambrecht.net/upload/productDocuments/u[sonic]WS7_Multi%20parameter%20sensor_Datasheet_2.pdf (accessed on 8 April 2025).
  31. Datasheet of Electrical Current Transformer AT 10 B5. LEM International SA. Available online: https://www.lem.com/sites/default/files/products_datasheets/at-b10.pdf (accessed on 8 April 2025).
  32. Umweltbundesamt. Anforderungen an Lüftungskonzeptionen in Gebäuden—Teil I: Bildungseinrichtungen. Empfehlungen des Arbeitskreis Lüftung (AK Lüftung) am Umweltbundesamt; Umweltbundesamt: Dessau-Roßlau, Germany, 2017. [Google Scholar]
  33. The MathWorks Inc. MATLAB, Version: 23.2.0 (R2023b); The MathWorks Inc: Natick, MA, USA, 2023; Available online: https://www.mathworks.com (accessed on 29 July 2025).
  34. The MathWorks Inc. MATLAB, Version: 24.2.0 (R2024b); The MathWorks Inc: Natick, MA, USA, 2024; Available online: https://www.mathworks.com (accessed on 29 July 2025).
  35. The MathWorks Inc. Statistics and Machine Learning Toolbox, Version: 23.2 (R2023b); The MathWorks Inc: Natick, MA, USA, 2023; Available online: https://de.mathworks.com/products/statistics.html (accessed on 2 September 2025).
  36. German Environment Agency. Feinstaub. Umweltbundesamt. Available online: https://www.umweltbundesamt.de/themen/luft/luftschadstoffe-im-ueberblick/feinstaub (accessed on 30 October 2024).
  37. World Health Organization. WHO Global Air Quality Guidelines. Particulate Matter (PM2.5 and PM10), Ozone, Nitrogen Dioxide, Sulfur Dioxide and Carbon Monoxide. Executive Summary; World Health Organization: Geneva, Switzerland, 2021. [Google Scholar]
  38. German Environment Agency. Flüchtige Organische Verbindungen. Umweltbundesamt. Available online: https://www.umweltbundesamt.de/themen/gesundheit/umwelteinfluesse-auf-den-menschen/chemische-stoffe/fluechtige-organische-verbindungen (accessed on 28 October 2024).
  39. Albers, K.-J.; Recknagel, H.; Sprenger, E. Taschenbuch für Heizung und Klimatechnik 2019/2020: Einschließlich Trinkwasser- und Kältetechnik sowie Energiekonzepte, 79th ed.; ITM InnoTech Medien GmbH: Augsburg, Germany, 2019; Volume 1 + 2. [Google Scholar]
  40. Frank, W. Raumklima und Thermische Behaglichkeit Berichte aus der Bauforschung; Berlin-München-Düsseldorf; Wilhelm Ernst & Sohn KG: Berlin, Germany, 1975. [Google Scholar]
  41. FGK. FGK-Status-Report 58—Anforderungen an die Raumluftfeuchtigkeit zur Reduktion des Infektionsrisikos über den Luftweg AHA + L + Feuchte; Fachverband Gebäude-Klima e. V.: Bietigheim-Bissingen, Germany, 2022. [Google Scholar]
Figure 1. Exemplary classrooms illustrating the ventilation concepts. (a) WA, CO2 traffic light marked in red; (b) DV, air outlets marked in red; (c) CV, air outlets marked in red.
Buildings 15 03181 g001
Figure 2. (a) Indoor multi-sensor measuring device; (b) Window contact switch installed on window handle; (c) Outdoor particulate matter measuring device; (d) Rooftop weather station.
Buildings 15 03181 g002
Figure 3. Boxplots of school-wide daily averages of three meteorological parameters for each measurement location over the study period.
Buildings 15 03181 g003
Figure 4. Wind rose diagram of school-wide daily averages of wind direction and speed for each measurement location over the study period.
Buildings 15 03181 g004
Figure 5. Temporal progressions of school-wide daily averages of CO2 concentration (top) and indoor air temperature (bottom) over the study period. Weekends and school holidays are highlighted in grey.
Buildings 15 03181 g005
Figure 6. Boxplots of school-wide means of the five indoor air parameters over the evaluation period.
Buildings 15 03181 g006
Figure 7. Temporal progression of the school-wide means of CO2 concentrations during school hours over the evaluation period.
Buildings 15 03181 g007
Figure 8. School-wide relative frequencies of the window opening states (open: 1.0, tilted: 0.1, closed: 0.0).
Buildings 15 03181 g008
Figure 9. Correlation diagram of the school-wide means of indoor air over ambient air PM2.5 concentrations over the evaluation period.
Buildings 15 03181 g009
Figure 10. Correlation diagram (bubble chart) of the school-wide minute-based measured data of indoor air over ambient air PM2.5 concentrations, divided into periods, when at least one window is open (upper three diagrams) and all windows are closed (lower three diagrams).
Buildings 15 03181 g010
Figure 11. School-wide means of CO2 concentration over indoor air temperature.
Buildings 15 03181 g011
Figure 12. School-wide means of relative humidity over indoor air temperature.
Buildings 15 03181 g012
Figure 13. School-wide means of relative humidity over indoor air temperature in a thermal comfort diagram.
Buildings 15 03181 g013
Figure 14. School-wide means of indoor air temperature over the running mean ambient air temperature within the seasonal recommendations in accordance with DIN EN 16798-1.
Buildings 15 03181 g014
Figure 15. Decentralized ventilation—boxplots of school-wide means of the five indoor air parameters for the two operating states (DV-on, DV-off) of the decentralized AHUs.
Buildings 15 03181 g015
Figure 16. Mean electrical power consumption of the decentralized AHUs (top) and mean CO2 concentration (bottom) of classrooms DV-1 and DV-2. The graph shows 30 school lessons before and 30 lessons after the installation of a demand-based CO2 controller in the AHU of DV-1 (blue graphs).
Buildings 15 03181 g016
Figure 17. Central ventilation—boxplots of classroom CO2 concentrations for the two operating states (CV-on, CV-off) of the centralized AHU based on minute-by-minute data.
Buildings 15 03181 g017
Table 1. Classroom characteristics (t-t: tilt-turn window, mc: manually controlled, cc: centrally controlled, WA: Window Airing, DV: Decentralized Ventilation, CV: Central Ventilation).
Classroom
PropertiesWA-1WA-2WA-3WA-4DV-1DV-2CV-1CV-2
Length (m)10.78.508.89.1
Width (m)6.77.07.0
Height (m)3.23.03.0–4.65 3.0
Floor area (m2)71.759.561.663.7
Volume (m3)225.8178.5228.8177.5188.3
Number of openable windows 365/14
Window typesliding windowst-tt-t/doort-t
Orientationsouth (180°)east (90°)north–northeast (15°)
Solar shadingfixed structuraloperable external/fixed structuraloperable external
Heating systemwall mounted radiators (mc)wall mounted radiators (mc)underfloor heating (cc)
Year of construction197419942016
Table 2. Classroom occupancy, specific area and volume, and design ventilation rate.
Classroom
PropertiesWA-1WA-2WA-3WA-4DV-1DV-2CV-1CV-2
Occupants2320252322262320
Specific area (m2/person)3.13.62.93.12.72.32.73.2
Specific volume (m3/person)9.811.39.09.88.18.87.79.4
qtot (perceived air quality) (m3/h)760685811760704805735665
Table 3. Installed sensors and their measurement parameters, ranges, and accuracies.
Sensor TypeLocationMeasurement
Parameter
Measurement RangeAccuracySource
Multi-sensor deviceIndoorAir temperature−20–+50 °C±0.5 K[28]
Relative humidity0–100% r.h.±3% r.h.
CO2 concentration0–10,000 ppm±50 ppm
PM2.50–1000 µg/m3±5 µg/m3
VOC0–100%<10%
Particulate matter sensorOutdoorPM2.50–1000 µg/m3±5 µg/m3[29]
Weather stationOutdoorAmbient air temperature−40–+70 °C±0.1 K[30]
Relative humidity0–100% r.h.±1.5% r.h.
Ambient air pressure300–1100 hPa±0.5 hPa
Solar irradiance0–2000 W/m2<20 W/m2
Wind speed0–65 m/s±0.2 m/s
Wind direction0–360°<2°
Current transformerIndoorElectrical current0–10 A<0.15 A[31]
Table 4. Threshold values for the evaluation of IEQ.
ParameterLower ThresholdUpper ThresholdLiterature Source
CO2 concentration-1000 ppm/2000 ppm[3,4]
PM2.5-15 µg/m3/d[37]
Indoor air temperature20 °C26 °C[26]
Relative humidity (r.h.)30% r.h./40% r.h.60% r.h.[26,41]
Table 5. Ventilation concepts—descriptive statistics of the school-wide means of the five indoor air parameters over the evaluation period.
DescriptiveCO2PM2.5VOCTar.h.
Statistics[ppm][µg/m3][%][°C][% r.h.]
Window airing (WA)
Mean9136.012.120.740.3
Standard deviation1413.12.11.05.4
Median9025.012.020.640.4
Minimum4221.48.218.723.1
Maximum137516.829.324.753.0
Range (xMax–xMin)95315.421.16.029.9
Decentralized ventilation (DV)
Mean7542.618.121.038.2
Standard deviation1311.65.60.66.2
Median7632.217.221.038.0
Minimum4090.08.118.724.0
Maximum110010.559.723.154.2
Range (xMax–xMin)69110.551.74.430.1
Central ventilation (CV)
Mean9651.820.622.336.5
Standard deviation2041.56.40.85.4
Median9371.419.922.336.7
Minimum4750.07.219.320.6
Maximum20999.356.424.751.5
Range (xMax–xMin)16239.349.25.431.0
Table 6. Results of post hoc Tukey–Kramer test, pairwise comparison of the five indoor air parameters across the three ventilation concepts.
ParameterGroup AGroup Bp-Value
CO2WADV0
CO2WACV0.0017
CO2DVCV0
PM2.5WADV0
PM2.5WACV0
PM2.5DVCV6.8867 × 10−15
VOCWADV0
VOCWACV0
VOCDVCV1.6941 × 10−9
TWADV4.0411 × 10−5
TWACV0
TDVCV0
r.h.WADV2.0752 × 10−9
r.h.WACV0
r.h.DVCV5.1166 × 10−6
Table 7. Ventilation concepts (including DV-off)—temporal proportion of threshold exceedances and underruns for CO2 concentration, indoor air temperature and relative humidity, and window airing times.
Ventilation
Concept
Number of
Analyzed
School Hours
Temporal Proportion in % ofAverage
Window Airing Time
in min/School Hour
CO2
>1000 ppm
T
<20 °C
r.h.
<40%
WA58626.621.246.128
DV (DV-on)5861.78.262.113
DV-off13449.321.618.7-
CV57735.50.573.39
Disclaimer/Publisher’s Note: The statements, opinions and data contained in all publications are solely those of the individual author(s) and contributor(s) and not of MDPI and/or the editor(s). MDPI and/or the editor(s) disclaim responsibility for any injury to people or property resulting from any ideas, methods, instructions or products referred to in the content.