Article

Experimental Study on Seismic Performance of Steel-Reinforced Concrete Columns Under Different Loading Protocols

1
School of Civil Engineering and Architecture, Suqian University, Suqian 223800, China
2
Jiangsu Province Engineering Research Center of Prefabricated Building and Intelligent Construction, Suqian 223800, China
3
School of Mechanics and Civil Engineering, China University of Mining and Technology, Xuzhou 221008, China
4
Building Materials Engineering Laboratory, Department of Architecture, Graduate School of Engineering, The University of Tokyo, Tokyo 113-8654, Japan
*
Author to whom correspondence should be addressed.
Buildings 2025, 15(17), 3180; https://doi.org/10.3390/buildings15173180
Submission received: 21 July 2025 / Revised: 14 August 2025 / Accepted: 2 September 2025 / Published: 4 September 2025

Abstract

Traditional pseudo-static loading tests fail to capture the unique characteristics of special ground motions, limiting their ability to accurately evaluate the seismic performance of steel-reinforced concrete (SRC) columns. In this study, eight SRC columns were subjected to pseudo-static tests using far-field, near-field, and traditional loading protocols to investigate their structural response under different seismic scenarios. The results show that far-field loading, characterized by repeated large displacement cycles, leads to increased damage accumulation, reduced hysteresis curve fullness, greater bearing capacity loss, significant stiffness degradation, and diminished ductility and energy dissipation. In contrast, near-field loading—dominated by an initial extreme displacement—results in fewer but less developed cracks and a larger concrete crushed zone at failure. The severe initial damage under near-field loading causes a noticeable decline in stiffness and strength during subsequent cycles. During the second loading stage, both the peak load and post-peak deformation capacity are further reduced, significantly impairing the columns’ ability to resist additional seismic demands. These findings highlight the critical role of loading history in shaping the seismic behavior of SRC composite columns.

1. Introduction

Far-field and near-field ground motions are two types of special ground motions. Far-field ground motions are characterized by smaller amplitudes and longer durations, with multiple long-period pulses in the later stages of vibration, leading to repeated large-displacement cycles and prolonged vibrations in high-rise structures [1,2,3,4]. In contrast, near-field ground motions exhibit larger amplitudes and shorter durations, featuring intense high-speed long-period pulses that cause significant displacement pulses in high-rise structures early in the earthquake, resulting in severe impact and substantial damage. Subsequently, the displacement response diminishes rapidly [1,5,6]. These characteristics reflect distinct action properties different from those of ordinary ground motions. Ngamkhanong et al. [7] analyzed the influence of five far-field ground motions of overhead line equipment with magnitudes between 6.5 and 8 Mw by using the finite element method, and the results showed that the bearing stiffness played an important role in its dynamic response. Ren Q et al. [8] analyzed the impact of strong near-field ground motions on the dynamic stability and collapse analysis of onshore wind turbine towers; it was found that the tower is more prone to collapse under near-field ground motion with velocity pulses, which will collapse in a very short period of time after the formation of the full-section plastic hinge.
Steel-reinforced concrete (SRC) columns, known for high bearing capacity, stiffness, ductility, and energy dissipation capacity, are crucial structural components in high-rise buildings. Extensive research has been conducted on the seismic performance of SRC columns. Finite element (FE) modeling is pivotal for parametric studies of steel-reinforced concrete composite column seismic behavior. Key parameters significantly influencing predictive accuracy include mesh sensitivity, contact interactions, and material modeling strategies. Mesh convergence studies, exemplified by optimizing element sizes (e.g., 90 mm for columns and 50 mm for joint cores), are essential to balance computational cost and result fidelity [9]. The characterization of steel–concrete interface behavior, often modeled using surface-to-surface contact with “hard contact” normal behavior and Coulomb friction, critically governs bond–slip and energy dissipation [10]. The researchers also conducted extensive studies on the beam–column joints by using the finite element method. Balineni [11] employed ABAQUS to reveal how connection detailing enhances off-site seismic resistance; Aninthaneni et al. [12] experimentally and numerically validated a novel off-site joint suitable for modular buildings and heavy plants; and Parastesh et al. [13] demonstrated that prefabricated rigid joints with reinforced cores deliver high shear capacity, making them ideal for earthquake-prone regions, collectively guiding safer, faster, and more resilient construction practices worldwide.
The action characteristics of ground motions can be reflected through pseudo-static loading test protocols. Currently, many studies on the seismic performance of SRC columns are based on traditional pseudo-static loading tests with three cycles of horizontal displacement per level after yielding [14,15], which cannot account for the effects of special ground motion characteristics and thus cannot reasonably reflect the seismic performance of SRC columns under special ground motions. Based on the displacement response characteristics of high-rise structures under special ground motions, scholars, domestically and internationally, have adopted loading methods that increase the cycle number of horizontal displacement per level to simulate the impact of far-field ground motions on the seismic performance of RC beams, RC columns, concrete-filled steel tubular composite columns, and bridge piers [16,17,18,19,20,21]. They have also used loading methods that initially load to the ultimate displacement and subsequently gradually reduce the loading displacement to simulate the impact of near-field ground motions on the seismic performance of RC columns and shear walls [22,23,24]. However, there is still a lack of research on the seismic performance of SRC columns, considering the effects of special ground motions.
In view of this, this paper drew on the aforementioned loading methods to design far-field loading protocols and near-field loading protocols that simulate the action characteristics of far-field and near-field ground motions, respectively. Pseudo-static tests were conducted on eight SRC columns under different loading protocols, and seismic performance indicators of the SRC columns were compared and analyzed to provide a reference for establishing a seismic design method for SRC columns, considering the effects of special ground motions.

2. Overview of the Experiment

2.1. Specimen Design

In this study, according to the “Code for Design of Composite Structures” [25] and previous research results [26], eight 1/3 SRC column specimens with identical geometric dimensions were designed. The specimen concrete was made of C40 fine aggregate concrete. The design parameters of the specimens are shown in Table 1, and the dimensions and cross-sectional reinforcement of the specimens are illustrated in Figure 1. The loading protocols adopted include the far-field loading protocol, near-field loading protocol, and traditional loading protocol, which are described in detail in Section 2.2. Among them, specimens SRC1, SRC3, and SRC7 had the same parameters as specimens SRC2, SRC4, and SRC8, except for the loading protocol.

2.2. Loading Device and Loading Protocol

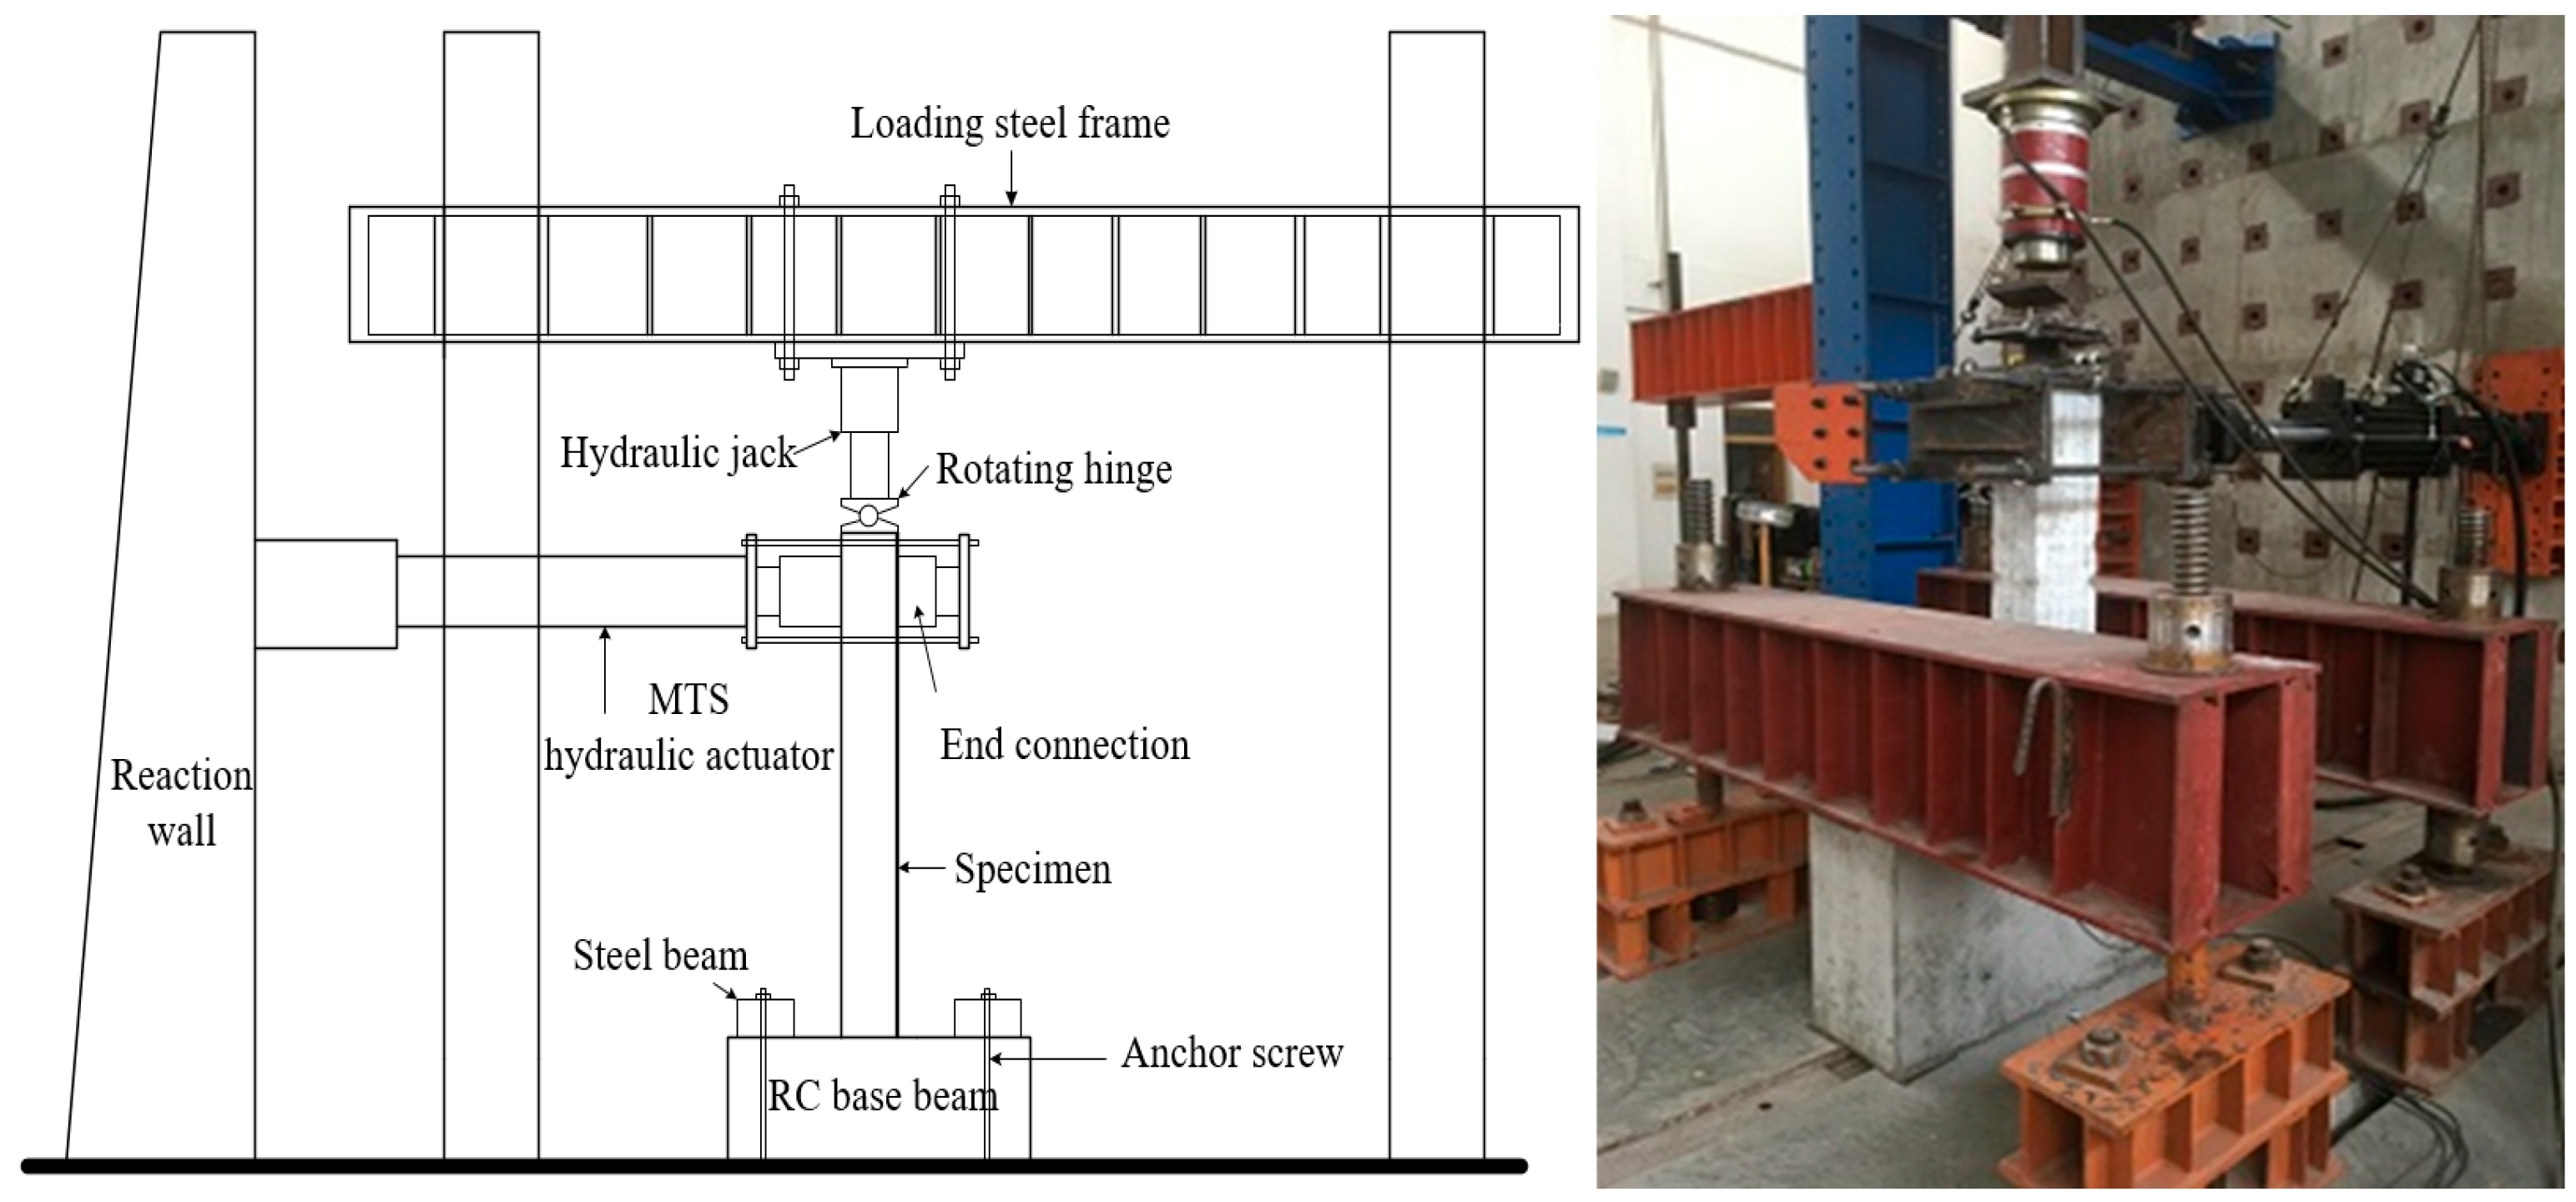
Loading was carried out according to the “Specification for Seismic Test of Buildings” [27]. The test loading device is shown in Figure 2. The reinforced concrete base beam was secured to the ground using steel beams and anchor bolts to prevent horizontal sliding during the loading process. The vertical load was determined based on the designed axial compression ratio and was applied to the top of the column through a 1000 kN hydraulic jack, remaining constant during the test. A horizontal load was applied through an MTS (MTS Systems Corporation, Eden Prairie, MN, USA) electro-hydraulic servo actuator. The horizontal load and displacement at the top of the column were collected in real time by an MTS electro-hydraulic servo actuator, and the horizontal displacement of the base beam was monitored by displacement meters arranged on both sides of the base beam, with the loading point located approximately 1100 mm from the bottom section of the column.
During the test, MTS equipment with displacement control was used for horizontal loading. The specific descriptions of each loading protocol are as follows:
(1)
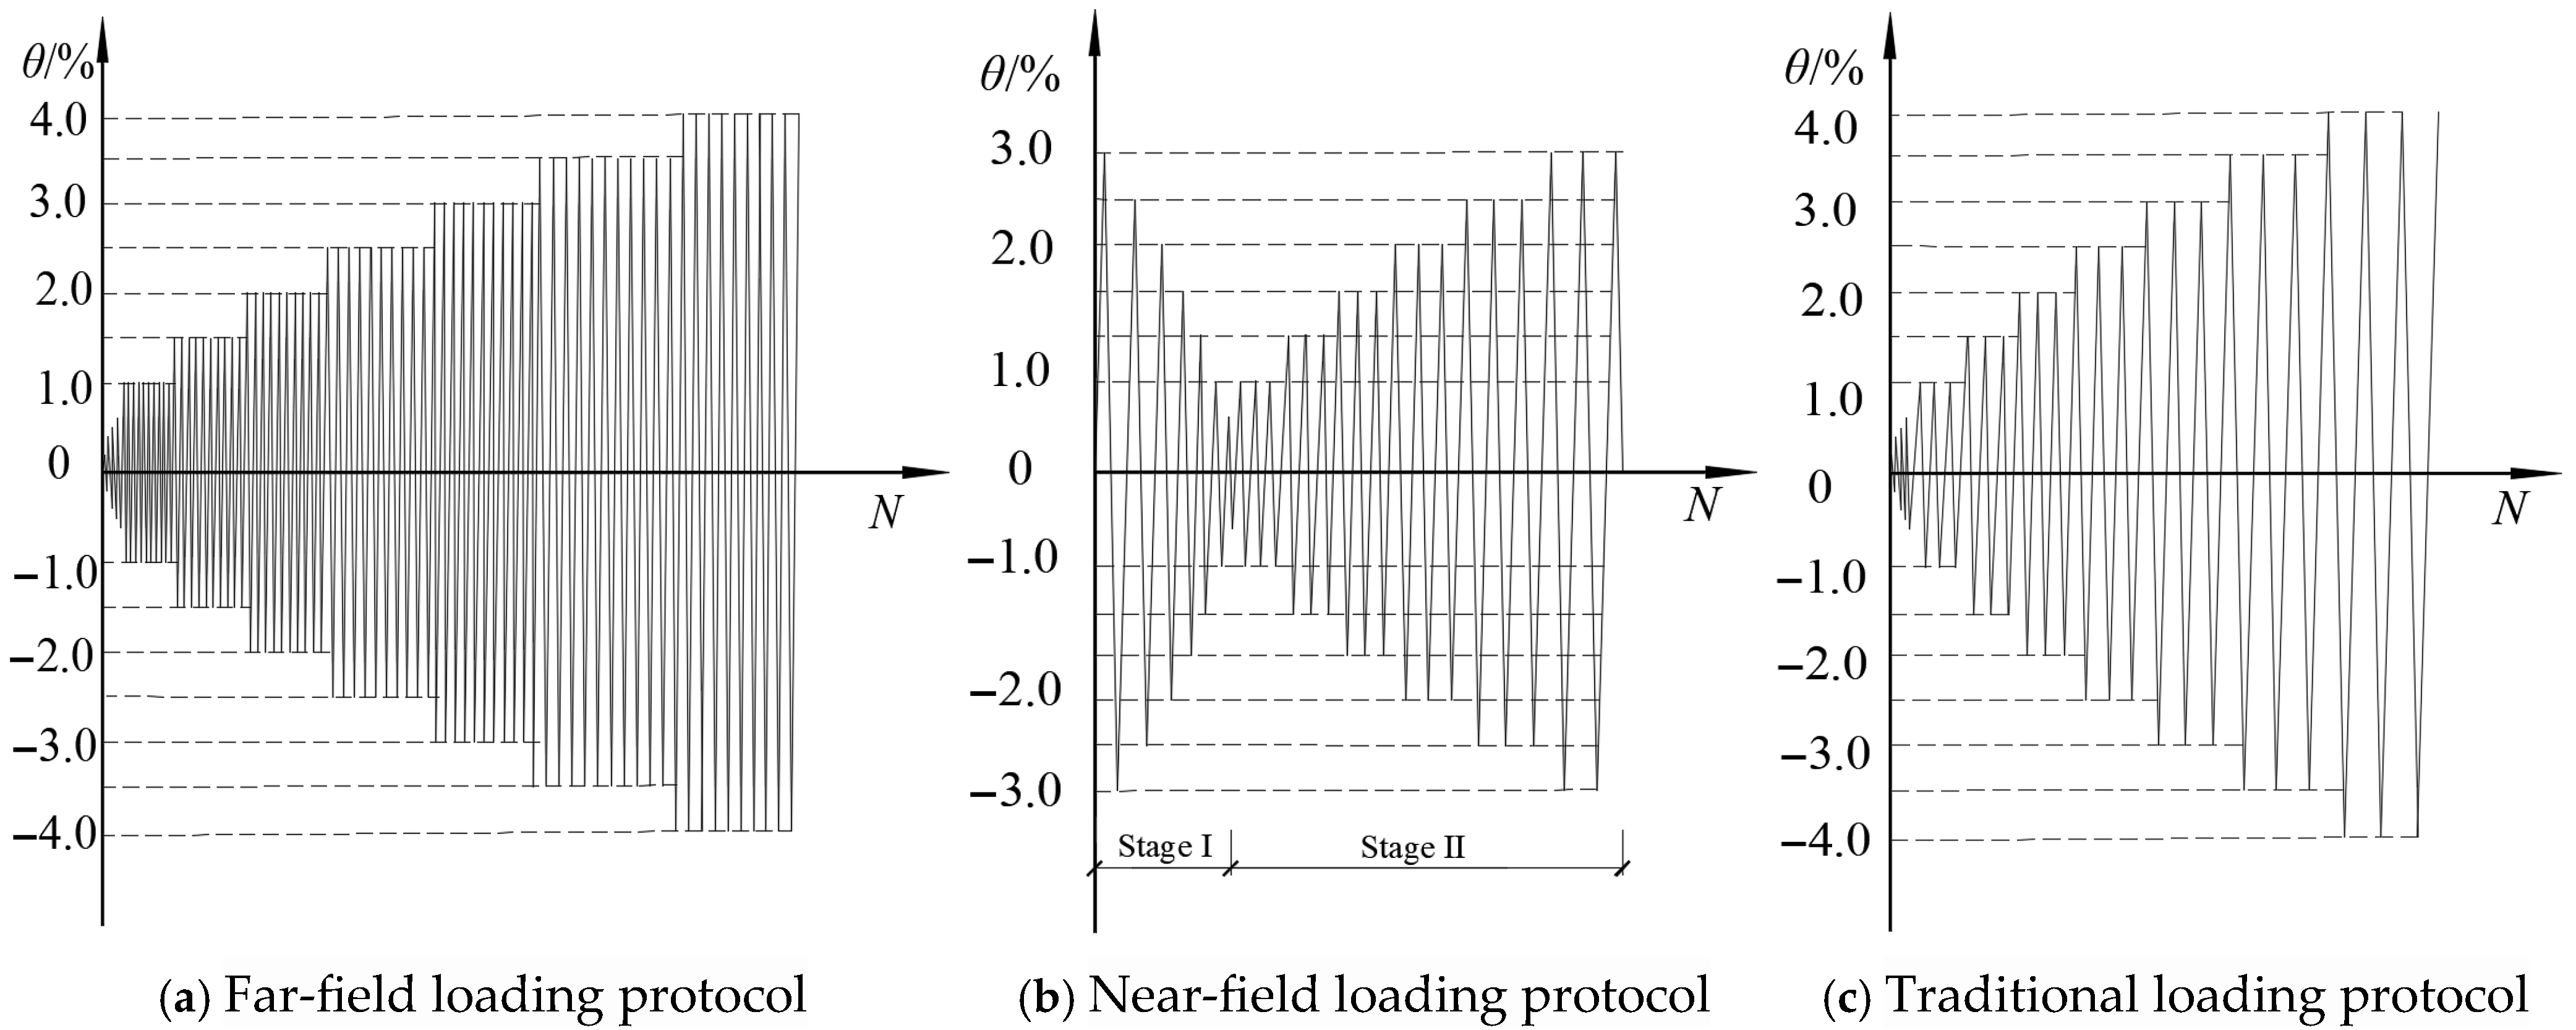
Far-field loading protocol: Horizontal displacement was cycled 10 times per level after yielding, as shown in Figure 3a. The horizontal displacement shall be incrementally applied based on the column-top horizontal displacement angles θ of 0.09%, 0.18%, 0.23%, 0.3%, 0.36%, 0.45%, 0.6%, 0.73%, and 0.9%, with each displacement level being cycled once. Subsequently, the horizontal displacement was incrementally applied based on θ values of 1.0%, 1.5%, 2.0%, 2.5%, 3.0%, 3.5%, and 4.0%, with ten cycles conducted at each displacement level. The test was terminated when the applied load diminished to less than 85% of the peak load.
(2)
Near-field loading protocol: The loading process was divided into two stages, as shown in Figure 3b. In the first stage, the loading displacement was initially applied to the ultimate horizontal displacement ∆u (obtained through traditional loading tests on corresponding specimens), and then the loading displacement was gradually reduced by 5 mm per level until the horizontal displacement decreased to 5 mm, with each level of displacement cycled once, to reveal the impact of near-field ground motions (a strong displacement impulse followed by rapid displacement decay) on the seismic performance of SRC columns. In the second stage, the loading displacement was gradually increased. For specimens SRC5 and SRC6, the horizontal displacements were applied step by step according to the column-top horizontal displacement angles θ = 1.0%, 1.5%, 2.0%, 2.5%, …, with each level of displacement cycled 3 times, to reveal the capacity of already damaged SRC columns to resist subsequent seismic actions. The test was stopped when the applied load started to decrease compared to the load corresponding to the previous level of displacement.
(3)
Traditional loading protocol: The horizontal displacements per loading level were the same as those in the “far-field loading protocol”, but after yielding, the horizontal displacements per level were cycled 3 times, as shown in Figure 3c.

3. Failure Process

3.1. Failure Process Description of Specimens

In order to ensure the accuracy of the test data, the loading rates under the three loading modes are the same. The axial pressure is applied through the top servo Jack to ensure that the axial pressure remains unchanged during the loading process and conforms to the actual stress state of the component.
(1)
Far-field Loading Specimens (SRC1~SRC2)
The failure processes of the far-field loading specimens are similar. Specimen SRC1 is taken as a representative for the description.
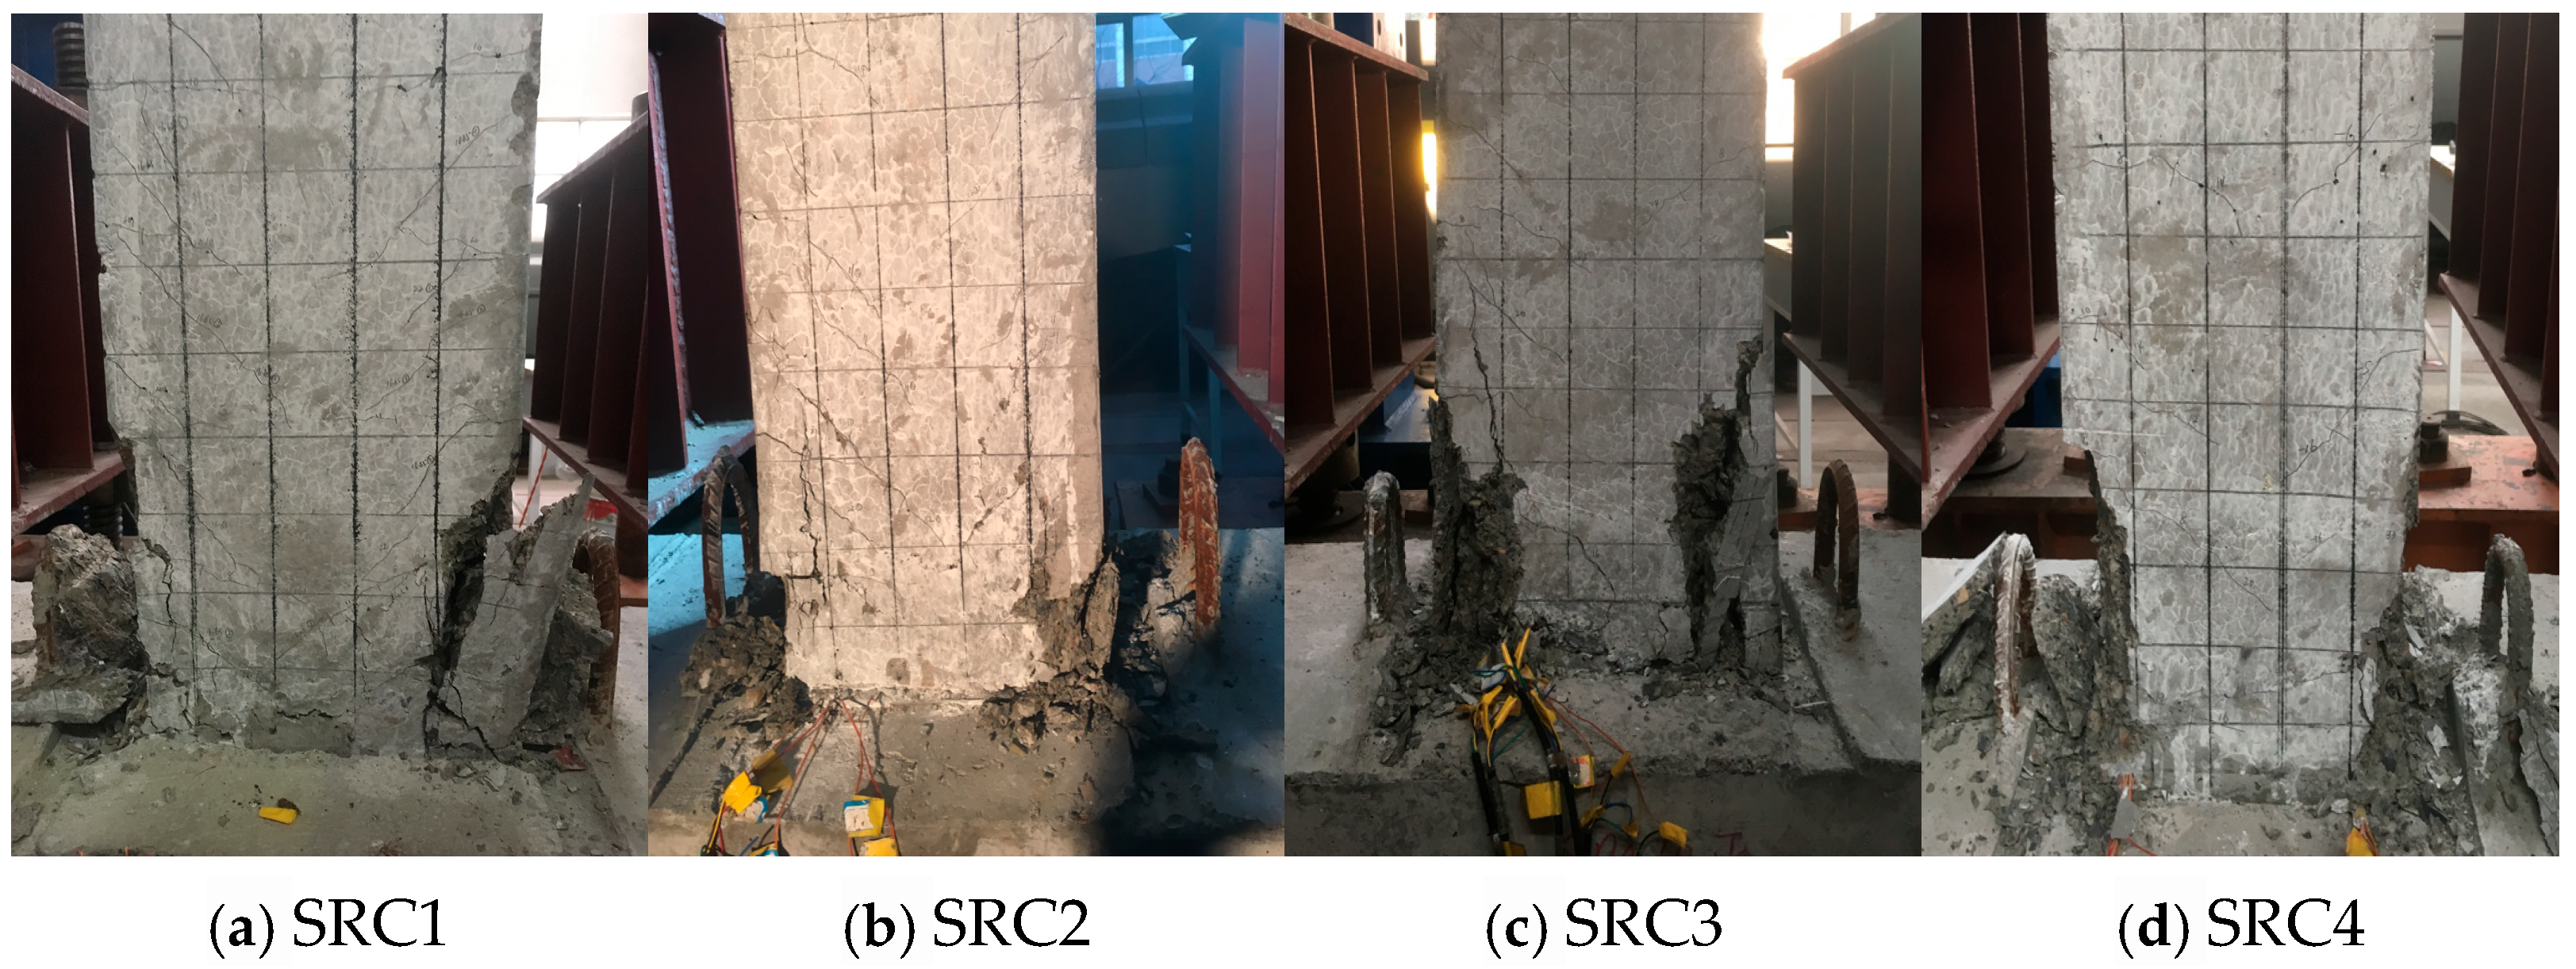
When the displacement angle θ is 0.3%, the specimen cracks, and a fine horizontal crack of about 50 mm long appears at the bottom of the column. As the displacement angle increases, the horizontal cracks of the specimen continue to increase and extend, and multiple horizontal cracks develop into through-cracks. When the displacement angle is 1.0%, no new horizontal cracks appear, and inclined cracks begin to appear, and the reinforcement in the column begins to yield. When the displacement angle is 1.5%, the vertical cracks on the surface of the specimen begin to appear, the original horizontal cracks and inclined cracks develop slowly, and the damage to the specimen is slight. When the displacement angle is 2.0%, the bearing capacity of the specimen reaches the maximum value, the vertical cracks on four sides gradually increase and widen, the corner concrete slightly peels off, the horizontal crack width at the bottom of the column develops to 0.5 mm, and the degree of damage to the specimen begins to increase. When the displacement angle is 2.5%, the width of the horizontal crack at the bottom of the column increases continuously during the cyclic loading process, reaching 0.9 mm, 1.2 mm, 1.5 mm, and 2.0 mm in the 1st, 3rd, 6th, and 10th cycles, respectively. The development of vertical cracks also shows the same situation, reaching 1.0 mm, 1.7 mm, 2.5 mm, and 3.5 mm, respectively, in the 1st, 3rd, 6th, and 10th cycles, accompanied by the spalling of a concrete protective layer. The damage to the specimen increases rapidly due to the large displacement and multiple cycles. When the displacement angle is 3.0%, a significant portion of the concrete protective layer at the base of the column peels off, exposing the reinforcement. Simultaneously, the longitudinal reinforcement buckles and bulges, and localized buckling occurs in the steel sections. The damage to the specimen progresses rapidly, leading to a sharp decline in its bearing capacity. The final failure mode is shown in Figure 4a,b.
(2)
Near-field Loading Specimens (SRC3~SRC6)
The failure processes of the near-field loading specimens are similar. Specimen SRC3 is taken as a representative for the description. Through the pseudo-static test of specimen SRC7, the ultimate displacement ∆u = 38.9 mm of SRC7 is obtained. According to the near-field loading method described in Section 2.2, specimen SRC3 is first cyclically loaded with the ultimate displacement ∆u = 40 mm and then loaded with a displacement reduction of 5 mm per level.
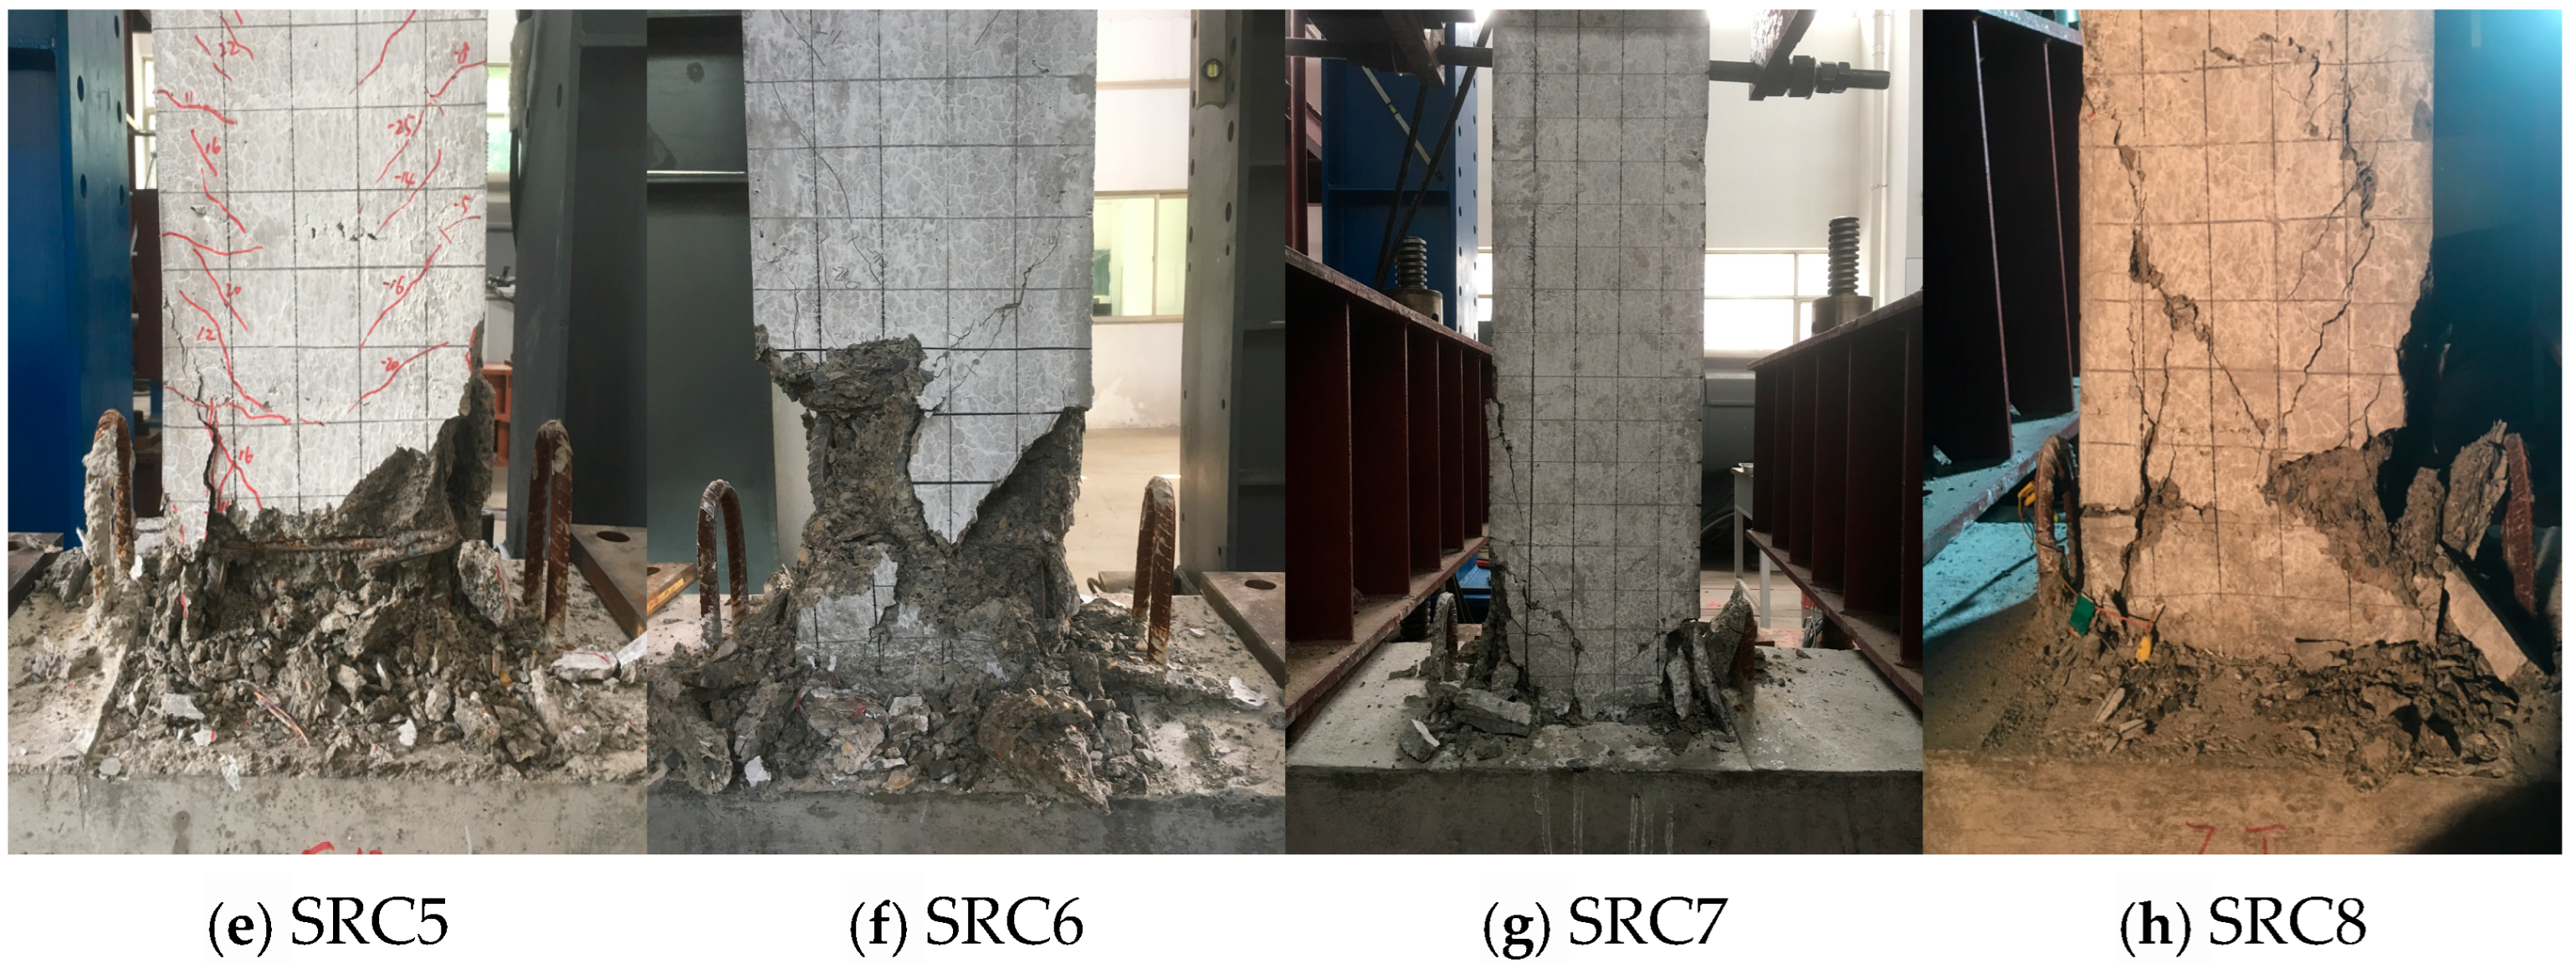
When loaded with a displacement of 40 mm, the crack development of the specimen is similar to that of SRC7, but the damage to the specimen after loading is less severe than that of SRC7. Subsequently, the loading displacement is gradually reduced. When loaded with a displacement of 35 mm, a small number of horizontal and diagonal cracks still form in the specimen, and the vertical cracks at the corners continue to widen and extend. When loaded with displacements of 30 mm, 25 mm, and 20 mm, the horizontal and diagonal cracks hardly expand further, but the width of the vertical cracks at the corners increases significantly, exceeding 3.0 mm, and the concrete cover peels off extensively. The damage to the specimen continues to develop. Thereafter, there is little change in the specimen. Finally, the displacement loading is gradually increased. When the displacement angle θ is set to 1.0% and 1.5%, the specimen exhibits minimal changes. However, at a displacement angle of 2.0%, the concrete protective layer within a 300 mm height range at the column base spalls off extensively, and both the longitudinal reinforcement and section steel undergo severe buckling. When the displacement angle reaches 2.5%, the specimen’s bearing capacity drops to 68% of its peak load, prompting the test to be halted. The final failure mode is shown in Figure 4c–f.
(3)
Traditional Loading Specimens (SRC7~SRC8)
The failure processes of the traditional loading specimens are similar. Specimen SRC7 is taken as a representative for the description.
Before the displacement angle reaches 2.0%, the crack development in the test specimen is essentially identical to that in SRC1. At a displacement angle of 2.0%, the specimen reaches its peak load, with both horizontal and inclined cracks fully developed, albeit without significant progression. Simultaneously, fine vertical cracks begin to emerge at the four corners of the specimen, extending upwards, while the overall damage remains relatively minor. When the displacement angle increases to 2.5%, horizontal and vertical cracks within a 200 mm radius of the column base widen noticeably to 1.0 mm. Concrete spalling at the corners becomes evident, progressively worsening the specimen’s damage. At displacement angles of 3.0% and 3.5%, vertical cracks at the specimen’s corners continue to widen and extend upwards, with continuous concrete crushing and spalling. Ultimately, a significant portion of the concrete protective layer within a range equivalent to the column’s cross-sectional height at the base falls off. The longitudinal reinforcement bulges outward, the steel section locally buckles, and the damage to the specimen escalates rapidly, leading to failure. The ultimate failure mode is depicted in Figure 4g,h.

3.2. Influence of Loading Protocol on the Failure Process of Specimens

All specimens exhibited typical bending failure; yet, the loading protocols significantly influenced their cumulative damage and failure process.
By comparing the far-field loading specimen SRC1 and the traditional loading specimen SRC7, it can be observed that:
(1)
After the specimen is loaded to the peak load, when cyclically loaded with the same displacement angle, the crack width of the far-field loading specimen increases, and the degree of damage worsens. For example, when the displacement angle is 2.5%, the maximum width of the horizontal cracks in SRC7 is 1.0 mm, while that of SRC1 reaches 2.0 mm.
(2)
The displacement angle corresponding to the same failure characteristics decreases for the far-field loading specimen. For example, when the displacement angle of SRC7 is 3%, a large area of spalling appears on the surface of the concrete protective layer, while the displacement angle of the SRC1 specimen is 2.5%; at ultimate failure, the limit displacement angle of SRC7 is 3.5%, while that of SRC1 is 3.0%.
By comparing the near-field loading specimen SRC3 to specimens SRC1 and SRC7, it can be seen that as the loading displacement increases, the number of cracks in both the far-field loading specimens and the traditional loading specimens gradually increases and fully develops, and the plastic damage deepens continuously during the cyclic loading process. However, the near-field loading specimen enters a strong plastic phase immediately upon initial loading, the cracks basically develop fully but are fewer in number, and plastic damage does not accumulate fully. When the loading displacement gradually reduces, the vertical cracks of the specimen mainly develop, and the degree of damage gradually increases, with a larger crushed area of concrete at failure. Finally, when the loading displacement gradually increases, larger amplitude displacement cycles further aggravate the degree of damage to the specimen.

4. Results and Discussion

4.1. Hysteresis Curves

Figure 5 presents the hysteresis curves of the horizontal load versus the displacement angle of some specimens. Comparative analysis reveals the following:
(1)
Before reaching the peak load, when loaded with the same displacement, both the far-field loading specimens and the traditional loading specimens exhibit a relatively small reduction in bearing capacity and minimal changes in stiffness. After the peak load, compared to the traditional loading specimens, as the number of cycles at the same displacement level increases, the hysteresis curves of the far-field loading specimens undergo significant changes, the bearing capacity decreases more pronouncedly, stiffness degradation increases markedly, and deformation capacity diminishes, indicating that the cumulative damage to the far-field loading specimens is more severe under the influence of large displacements with multiple cyclic loading.
(2)
The near-field loading specimens enter the elastic–plastic descending phase after reaching the peak load during initial loading, with a gradual reduction in bearing capacity and significant residual deformation after unloading, and the hysteresis curves are full. As the loading displacement gradually reduces, the area of the hysteresis loops of the specimens continuously decreases, and the bearing capacity gradually declines. It is also observed that during the second stage, when the loading displacement gradually increases, the hysteresis curves of the specimens before the peak load closely coincide with those of the first stage at the same loading displacement. Subsequently, as the loading displacement increases, the bearing capacity of the specimens decreases, the residual deformation increases significantly, and the damage to the specimens progresses rapidly.
(3)
Compared to the far-field loading specimens and the traditional loading specimens, the hysteresis curves of the near-field loading specimens are fuller, indicating stronger energy dissipation capacity. However, due to the damage caused by the initial ultimate displacement, when the loading displacement reduces step by step, the bearing capacity and stiffness of the near-field loading specimens are almost always lower than those of the other specimens with the same loading displacement.

4.2. Bearing Capacity

4.2.1. Comparative Analysis of Peak Load

The peak displacement θmax and peak load Pmax of specimens SRC1, SRC3, and SRC7 are listed in Table 2. It is found that the peak loads of the three specimens do not differ significantly, with a maximum difference of 3.8% to 8.6%. This indicates that the loading protocol has a minor impact on the peak load of the specimens. The analysis suggests that, prior to reaching the peak load of the specimen, the damage to specimens under various loading protocols is minor and does not significantly affect their bearing capacity.

4.2.2. Effect of Far-Field Loading on Bearing Capacity

After the specimen is loaded to its peak load, as the number of cycles increases, it continuously experiences damage, resulting in a gradual decrease in its load-bearing capacity. The ratio Pi/P1 is used to measure the influence of the same-level displacement cyclic loading on the bearing capacity of the specimen. The smaller the ratio, the greater the damage to the bearing capacity of the specimen, where Pi represents the maximum value of the horizontal load during the i-th cycle of the same-level displacement loading. The results for P3/P1 and P10/P1 of far-field loading specimens and traditional loading specimens at different loading displacement angles are shown in Table 3 and described as follows:
(1)
At the same displacement angle, the P10/P1 of the far-field loading specimens are all smaller than the P3/P1 of the traditional loading specimens under the same conditions, indicating that multiple cycles of the same displacement cause more severe damage to the far-field loaded specimens and a greater reduction in bearing capacity. The bearing capacity indicators measured through three cycles of traditional loading tests are significantly overestimated.
(2)
The influence of the number of cycles at the same displacement on the bearing capacity of far-field loading specimens increases with higher displacement amplitudes. Prior to reaching the peak load, the cumulative damage from small displacement cyclic loading is minimal, resulting in only a slight decrease in bearing capacity. For instance, in specimen SRC1, when the displacement angle is below 2.0%, the ratio P10/P1 ranges from 0.924 to 0.95, which is slightly lower than P3/P1, indicating a minor reduction in bearing capacity. Post-peak load, as the number of displacement cycles increases, the reduction in bearing capacity becomes more pronounced. For example, in specimen SRC1, when the displacement angle reaches 2.5%, the ratio P3/P1 is 0.962, showing a reduction of no more than 4.0%. However, after the 10th cycle, the bearing capacity drops by 11.5%, demonstrating that multiple large displacement cycles after the peak load lead to rapid damage progression and significantly diminish the bearing capacity of the specimens.

4.2.3. Effect of Near-Field Loading on Bearing Capacity

(1)
Effect of the First Stage of Near-Field Loading on the Bearing Capacity
Near-field loading specimens experience extreme displacement cycles at the initial loading stage, resulting in significant damage. To investigate the impact of the damage caused by extreme displacement loading on the bearing capacity of specimens during subsequent decreasing displacement loading stages and to eliminate the influence of different peak loads Pmax in the comparative analysis, the ratio P1/Pmax, where P1 is the bearing capacity of the specimen during the first cycle at the same displacement, is calculated. The relationship curves between P1/Pmax and the displacement angle of the specimens are shown in Figure 6.
It can be seen that as the loading displacement decreases, the bearing capacity of near-field loading specimens drops rapidly and is lower than that of far-field loading specimens and traditional loading specimens at the same displacement. Taking the far-field loading specimen SRC1, the near-field loading specimen SRC3, and the traditional loading specimen SRC7 as examples, when the displacement angle is 2.5%, the bearing capacities of specimens SRC1 and SRC7 both decrease slightly. Specifically, the bearing capacity of SRC1 decreases by 6%, while that of SRC7 decreases by 3%. However, the bearing capacity of SRC3 decreases by 26%. When the displacement angle reaches 2%, the bearing capacity of specimens SRC1 and SRC7 just reaches its peak load, whereas the bearing capacity of specimen SRC3 has already decreased by 28.7%. When the displacement angle is 1.5%, the bearing capacities of specimens SRC1 and SRC7 approach the peak load, with a difference range of less than 5%, whereas the bearing capacity of specimen SRC3 is only 62%. When the displacement angle reaches 1%, compared to the peak load, the bearing capacity of specimen SRC1 is 80%, that of specimen SRC7 is 76%, and that of specimen SRC3 is only 47%. This indicates that the damage caused by loading at the initial limit displacement of the specimens significantly reduces their bearing capacity.
(2)
Effect of the Second Stage of Near-Field Loading on the Bearing Capacity
The skeleton curves of near-field loading specimens during the second loading stage are shown in Figure 7. Based on the hysteresis curves and skeleton curves of the specimens, it is found that during the second loading stage, the hysteresis curves of the specimens are basically coincident with those of the first loading stage at the same displacement before reaching the peak load, and the bearing capacity is basically equal to that of the first-stage loading at the same displacement. This indicates that the small displacement cyclic in the second stage of near-field loading has little effect on the bearing capacity. Therefore, the bearing capacity of the specimens during the first loading stage can be used to predict the bearing capacity of the specimens experiencing first-stage loading damage and being reloaded at the same displacement.
During the second loading stage, the peak load of the near-field loading specimens decreases significantly. The peak load of specimen SRC5 decreases by 18.9%, and the peak load of specimen SRC6 decreases by 33.6%, indicating that the damage caused during the first loading stage significantly reduces the ultimate bearing capacity of the specimens. It was also found that after reaching the peak load, the specimens quickly enter a failure state and are unable to continue bearing the load. This also demonstrates that after experiencing the first loading stage, the ability of near-field loading specimens to resist subsequent seismic actions is greatly reduced.

4.3. Deformation Capacity

4.3.1. Comparative Analysis of Deformation Capacity

The displacement ductility coefficient μ is used to describe the deformation capacity of the specimens. The displacement ductility coefficient is calculated by the formula u = ∆u/∆y, where ∆u is the ultimate displacement of the specimen, taken as the displacement corresponding to when the horizontal load drops to 85% of the peak load, and ∆y is the yield displacement of the specimen, determined by the energy equivalence method based on the skeleton curve of the specimen. Table 4 presents the yield displacement ∆y, yield displacement angle θy, ultimate displacement ∆u, ultimate displacement angle θu, displacement ductility coefficient μ, and average value μa of the specimens.
It can be seen that under the same conditions, far-field loading specimens have the smallest displacement ductility coefficient and the worst deformation capacity, while near-field loading specimens have the greatest deformation capacity. The displacement ductility coefficient of the far-field loading specimen SRC1 is reduced by 17.6% and 10.3% compared to the near-field loading specimen SRC3 and the traditional loading specimen SRC7, respectively. Similarly, the displacement ductility coefficient of the far-field loading specimen SRC2 is reduced by 13.3% and 7.9% compared to the near-field loading specimen SRC4 and the traditional loading specimen SRC8, respectively. The reason is that after the peak load, the multiple cyclic displacement action causes the cracks of the far-field loading specimens to extend and develop fully, and the concrete cover detaches more severely, resulting in a significant reduction in the ultimate deformation capacity. In contrast, the near-field loading specimens are loaded with the ultimate displacement in the first cycle, resulting in less significant cumulative damage development compared to other components and thus exhibiting the strongest deformation capacity.

4.3.2. Effect of the Second Stage of Near-Field Loading on the Deformation Capacity

The yield displacement angle θy, ultimate displacement angle θu, and displacement ductility coefficient μ of near-field loading specimens during the first and second loading stages are shown in Table 5. It was found that significant damage to near-field loading specimens is accumulated during the first loading stage. When reloaded in the second stage, the displacement ductility coefficients of the specimens SRC5 and SRC6 decrease significantly by 40.4% and 48.2%, respectively, indicating that the deformation capacity of the specimens will be greatly reduced when reloaded after severe damage.

4.4. Stiffness Degradation

4.4.1. Comparative Analysis of Secant Stiffness

The stiffness of the specimen is represented by the secant stiffness K. The secant stiffness Ki of the specimens in each displacement cycle is calculated by the following formula:
K i = + P i + P i + Δ i + Δ i
where +Pi and −Pi represent the peak loads in the positive and negative directions, respectively, during the i-th cycle of the specimen, and +Δi and −Δi represent the maximum displacements in the positive and negative directions, respectively, during the i-th cycle of loading on the test piece.
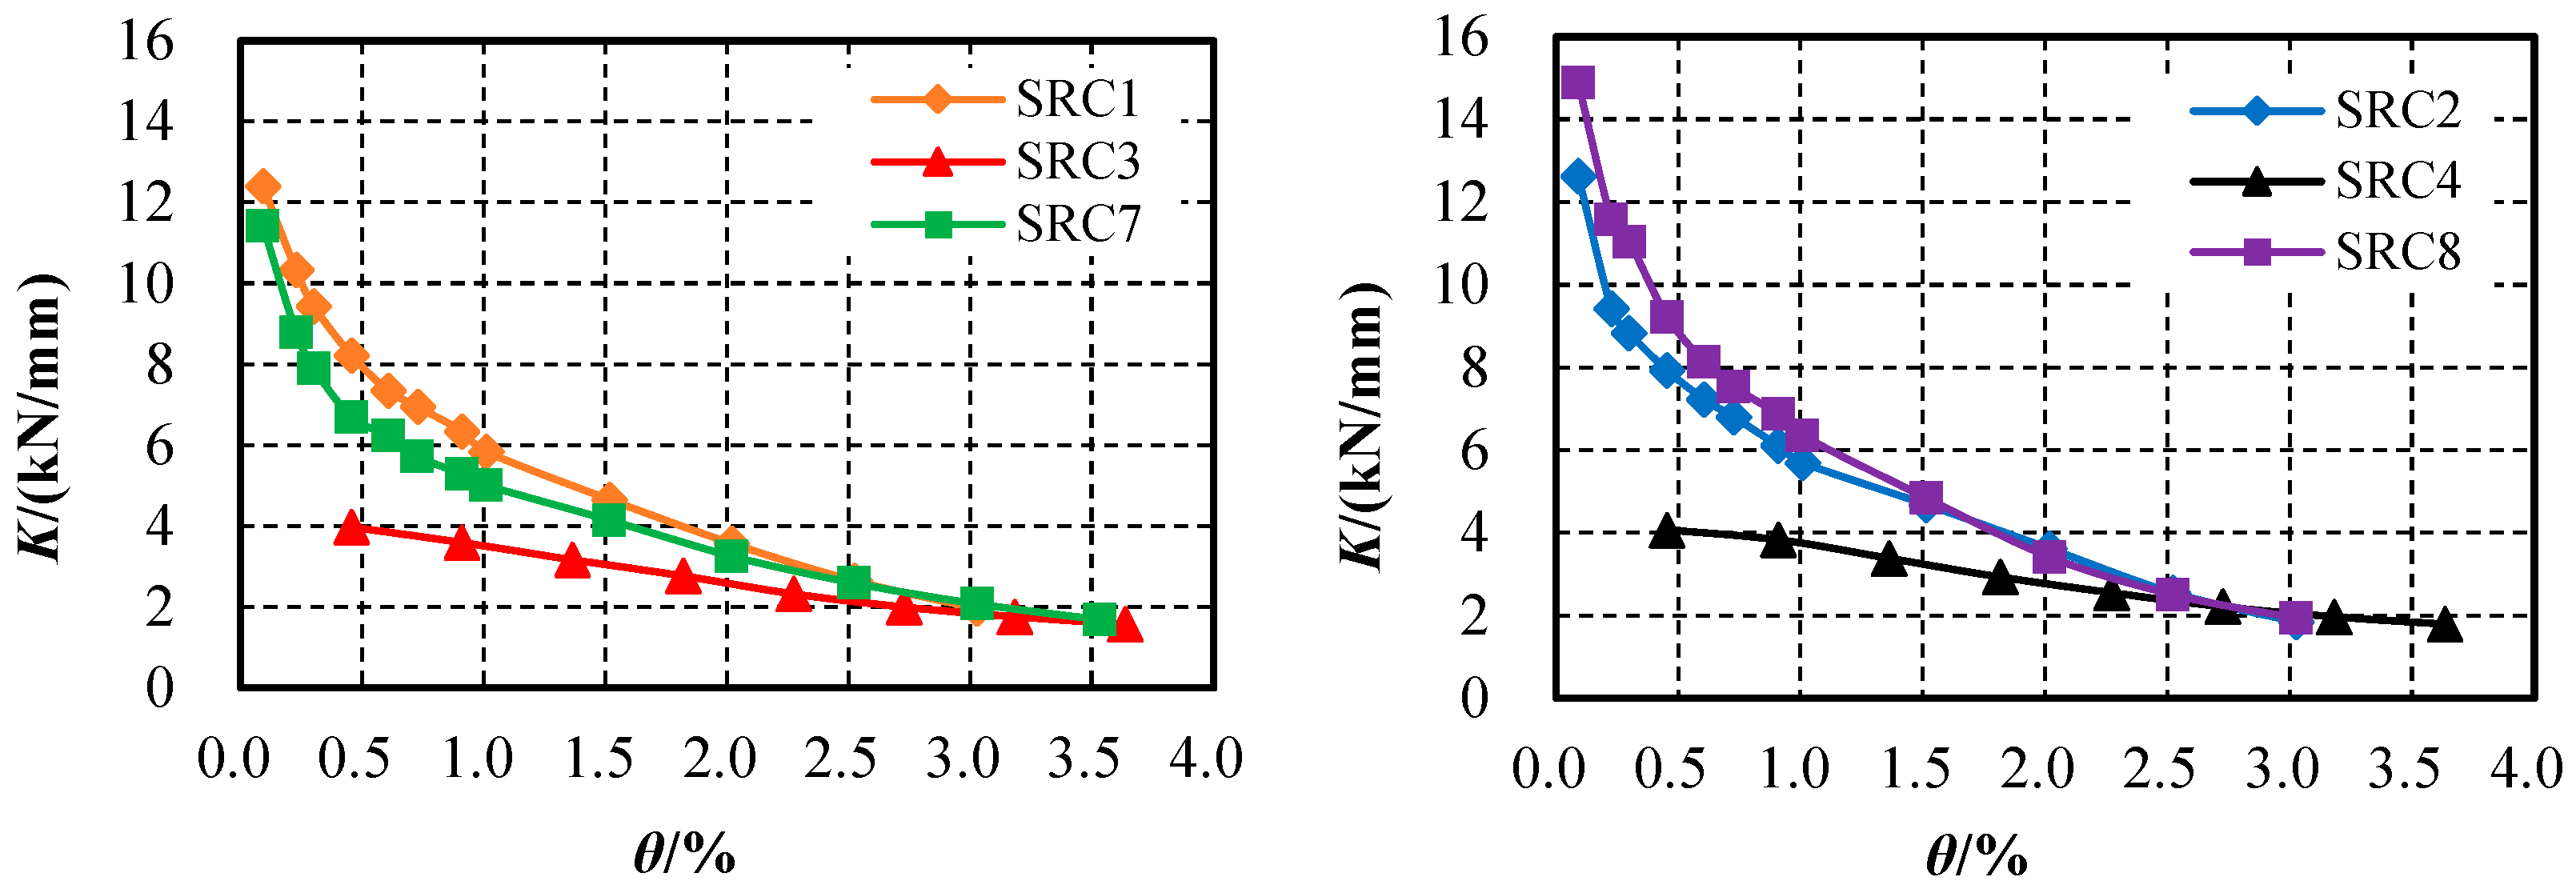
The stiffness degradation of the specimens is shown in Figure 8, which shows that:
(1)
The stiffness of far-field loading specimens and traditional loading specimens initially decreases rapidly and then slows down as the displacement angle increases. When the displacement angle is less than 1.0%, the stiffness degradation rates of far-field loading specimens and traditional loading specimens are basically the same; when the displacement angle is greater than 1.5%, the stiffness degradation of far-field loading specimens is faster than that of traditional loading specimens. This is because, as the loading displacement increases, especially after the peak load, the material property degradation and plastic damage to far-field loading specimens become more severe due to the multiple cyclic loading at the same displacement level.
(2)
Near-field loading specimens suffer significant damage after the initial ultimate loading displacement, resulting in low stiffness. Thereafter, as the loading displacement decreases, the stiffness of the specimens increases slowly. When the displacement angle is greater than 2.5%, all specimens, regardless of the loading protocol, have suffered severe damage, with low stiffness and little difference among them. When the displacement angle is less than 2.5%, the stiffness of near-field loading specimens is lower than that of far-field loading specimens and traditional loading specimens at the same loading displacement, and the smaller the loading displacement, the greater the difference in stiffness. For example, at a displacement angle of 2.0%, the stiffness of near-field loading specimens is approximately 0.74 to 0.81 times that of the other specimens, and at a displacement angle of 0.9%, the stiffness of near-field loading specimens is approximately 0.56 to 0.68 times that of the other specimens.

4.4.2. Effect of Far-Field Loading on Stiffness

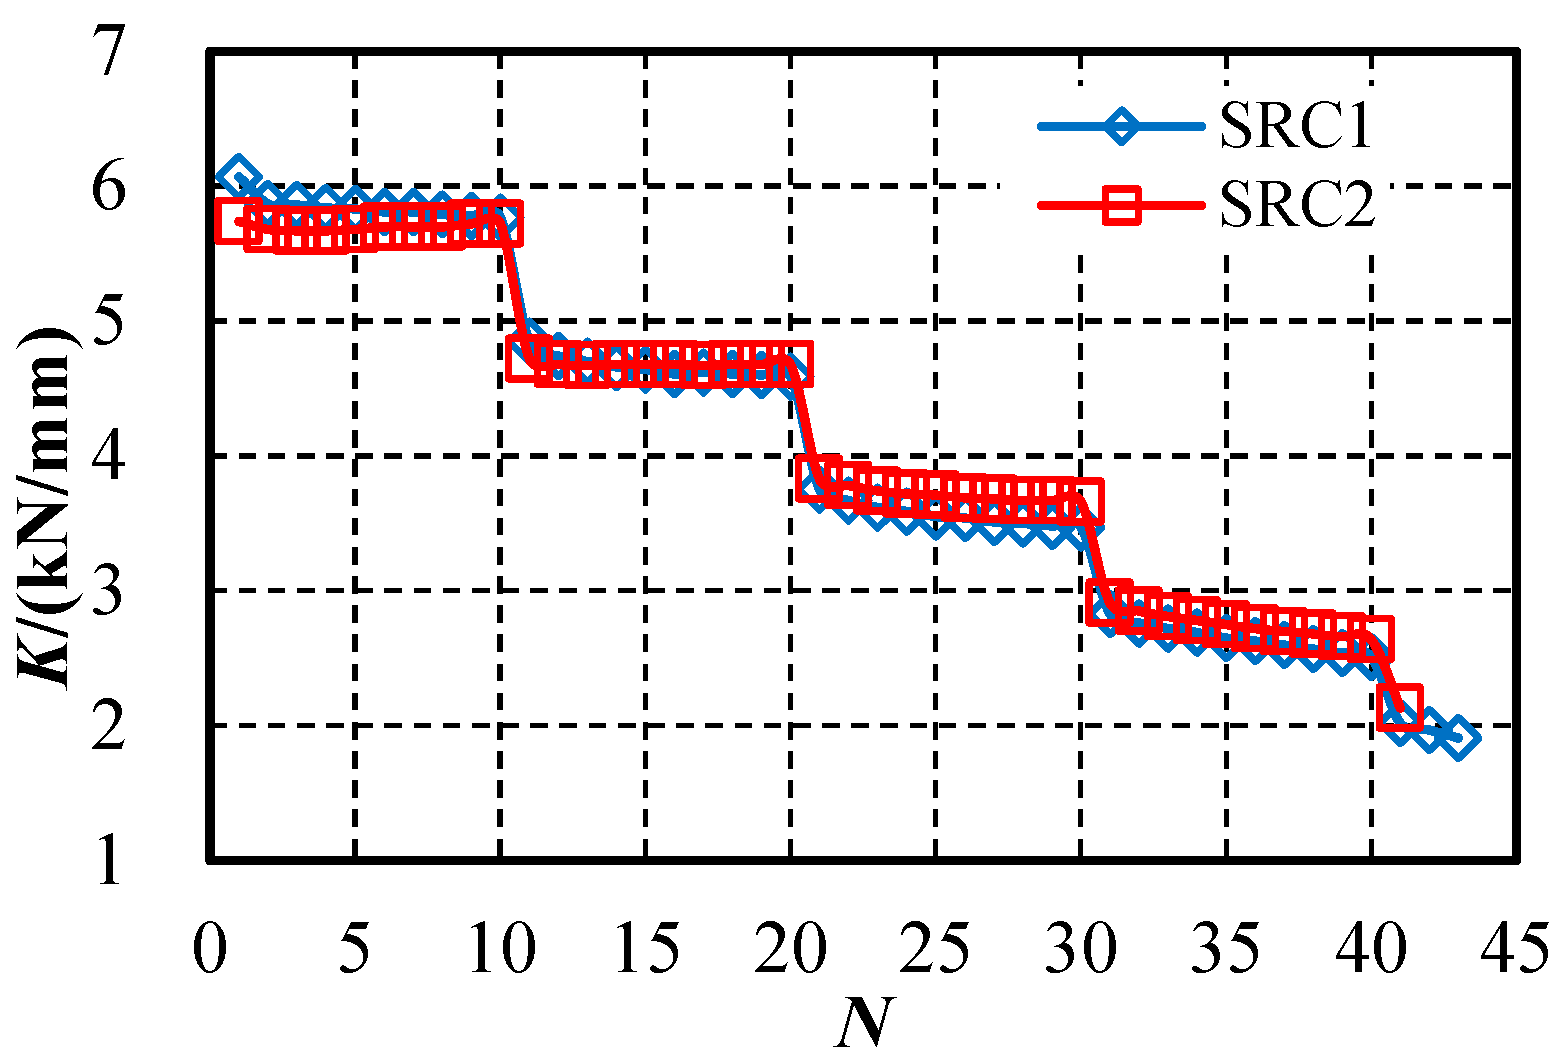
As the number of loading cycles N increases, the stiffness of the specimens continuously decreases, and its variation curve is illustrated in Figure 9.
It is evident that the stiffness of the specimen continuously degrades during the same-level loading process, and the degree of degradation correlates with the displacement amplitude. When the displacement angle is no more than 2.0%, that is, before reaching the peak load, the stiffness change curve of the specimen during the cyclic loading of the same-level displacement is relatively flat, indicating that the stiffness degradation is slow. The stiffness decreases by less than 4.0% in the third cycle and by no more than 7.0% in the tenth cycle, indicating that the cumulative damage to the specimen caused by small displacement cyclic loading is relatively minor, resulting in less stiffness degradation of the specimen. After the peak load, the stiffness degradation of the specimen continues to intensify as the loading progresses, and the stiffness degradation is evident. When the displacement angle is 2.5%, the stiffness decreases by 3.5–4.0% in the third cycle and by 9.2–11.3% in the tenth cycle. When the displacement angle is 3.0%, the K-N curve of the specimen shows unstable development, and the stiffness significantly degrades as the number of displacement cycles increases, indicating that large-displacement cyclic loading causes significant damage to the specimen, leading to a substantial decrease in its stiffness.

4.4.3. Effect of Second-Stage Near-Field Loading on Stiffness

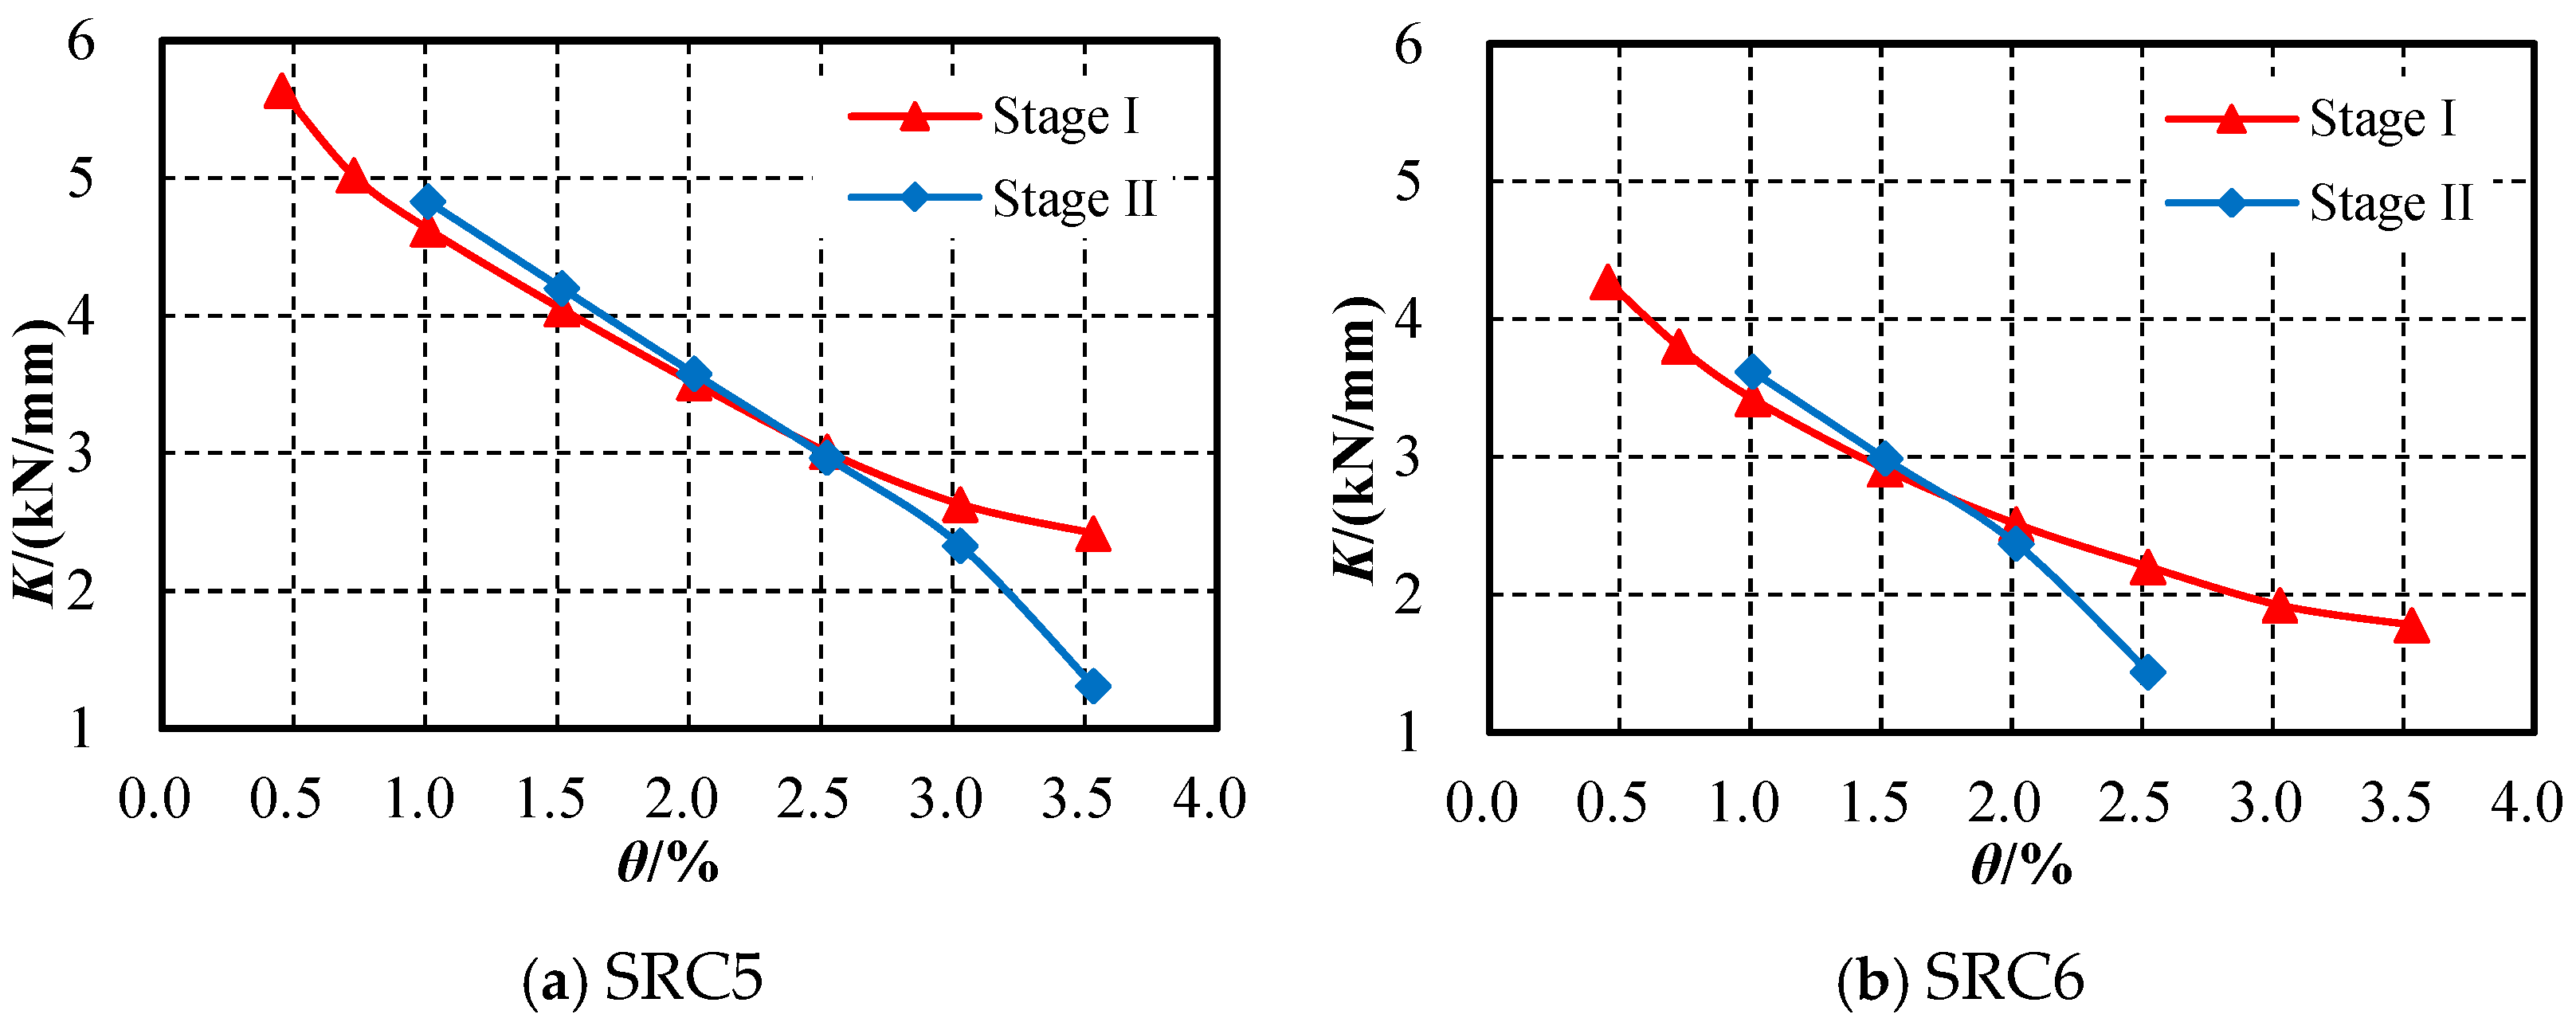
Under the near-field loading protocol, the stiffness degradation curve of the test specimen is depicted in Figure 10. It can be observed that as the loading displacement increases, the stiffness of the specimen exhibits a sharp downward trend. Prior to reaching the peak load (displacement angle is 0–2.0%), when the displacement is the same, the stiffness difference between Stage I and Stage II of the specimen is minimal, indicating that the change in damage to the specimen is not significant and has little effect on the stiffness. After reaching the peak load (displacement angle exceeding 2.0%), the stiffness of the specimens in Stage II decreases at a faster rate, which is notably lower than that in Stage I. For instance, when the displacement angle of specimen SRC5 reaches 3.5%, its stiffness in Stage II decreases by 45.8%; similarly, when the displacement angle of specimen SRC6 is at 2.5%, its stiffness in Stage II drops by 34.7%. This indicates that the damage inflicted on the specimens in Stage I continues to accumulate during subsequent loading, ultimately resulting in the degradation of their stiffness, particularly after reaching the peak load.

4.5. Energy Dissipation Capacity

4.5.1. Comparative Analysis of Energy Dissipation Capacity

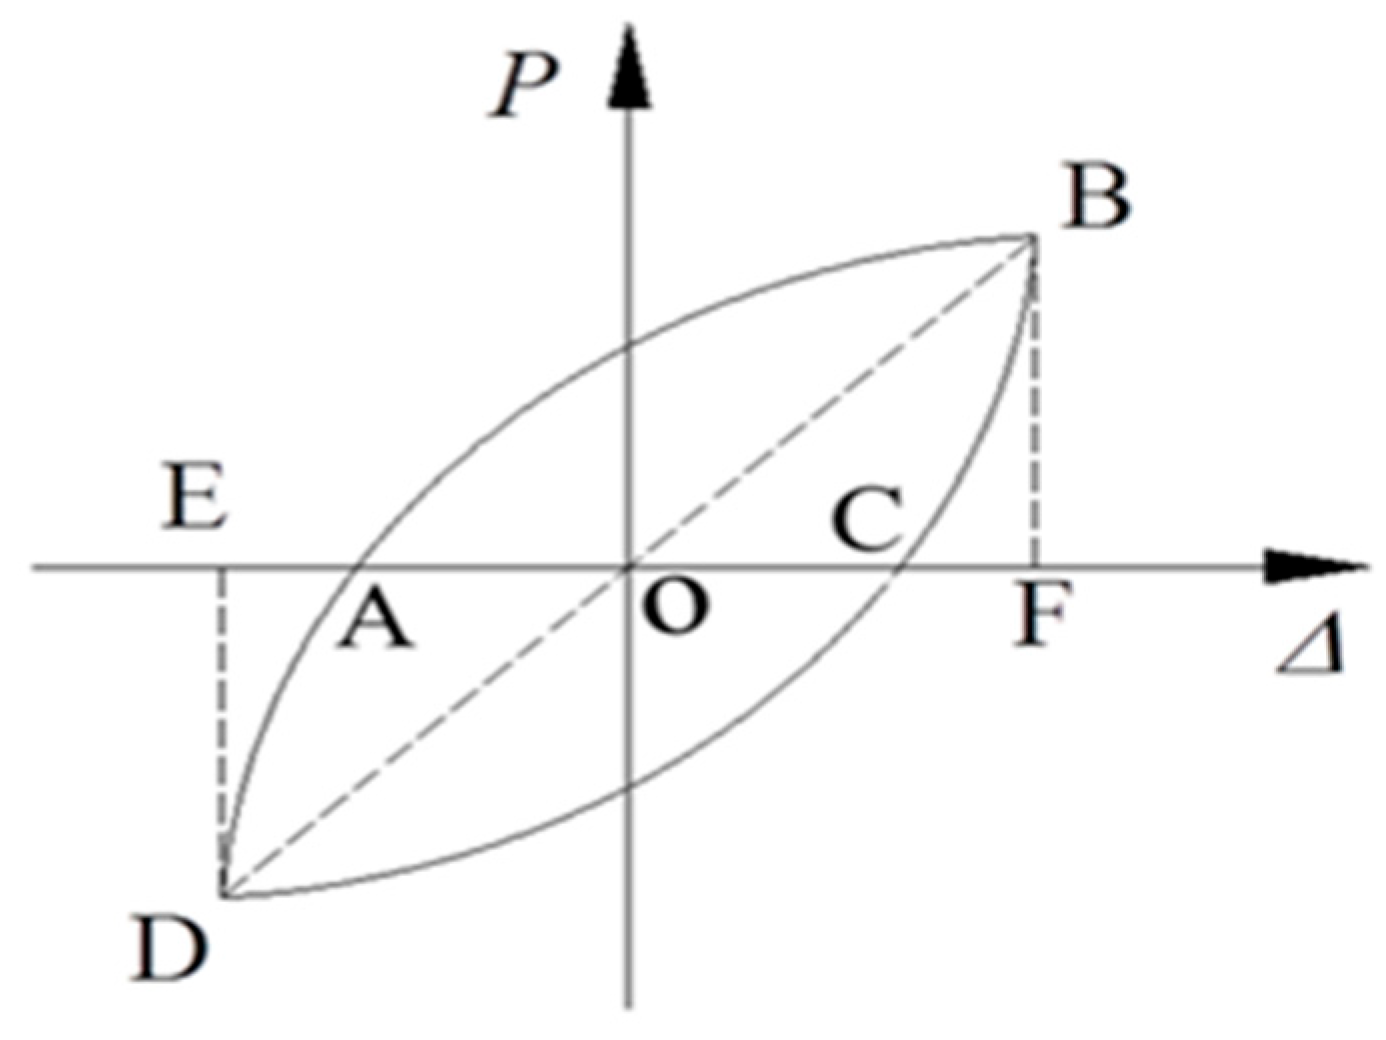
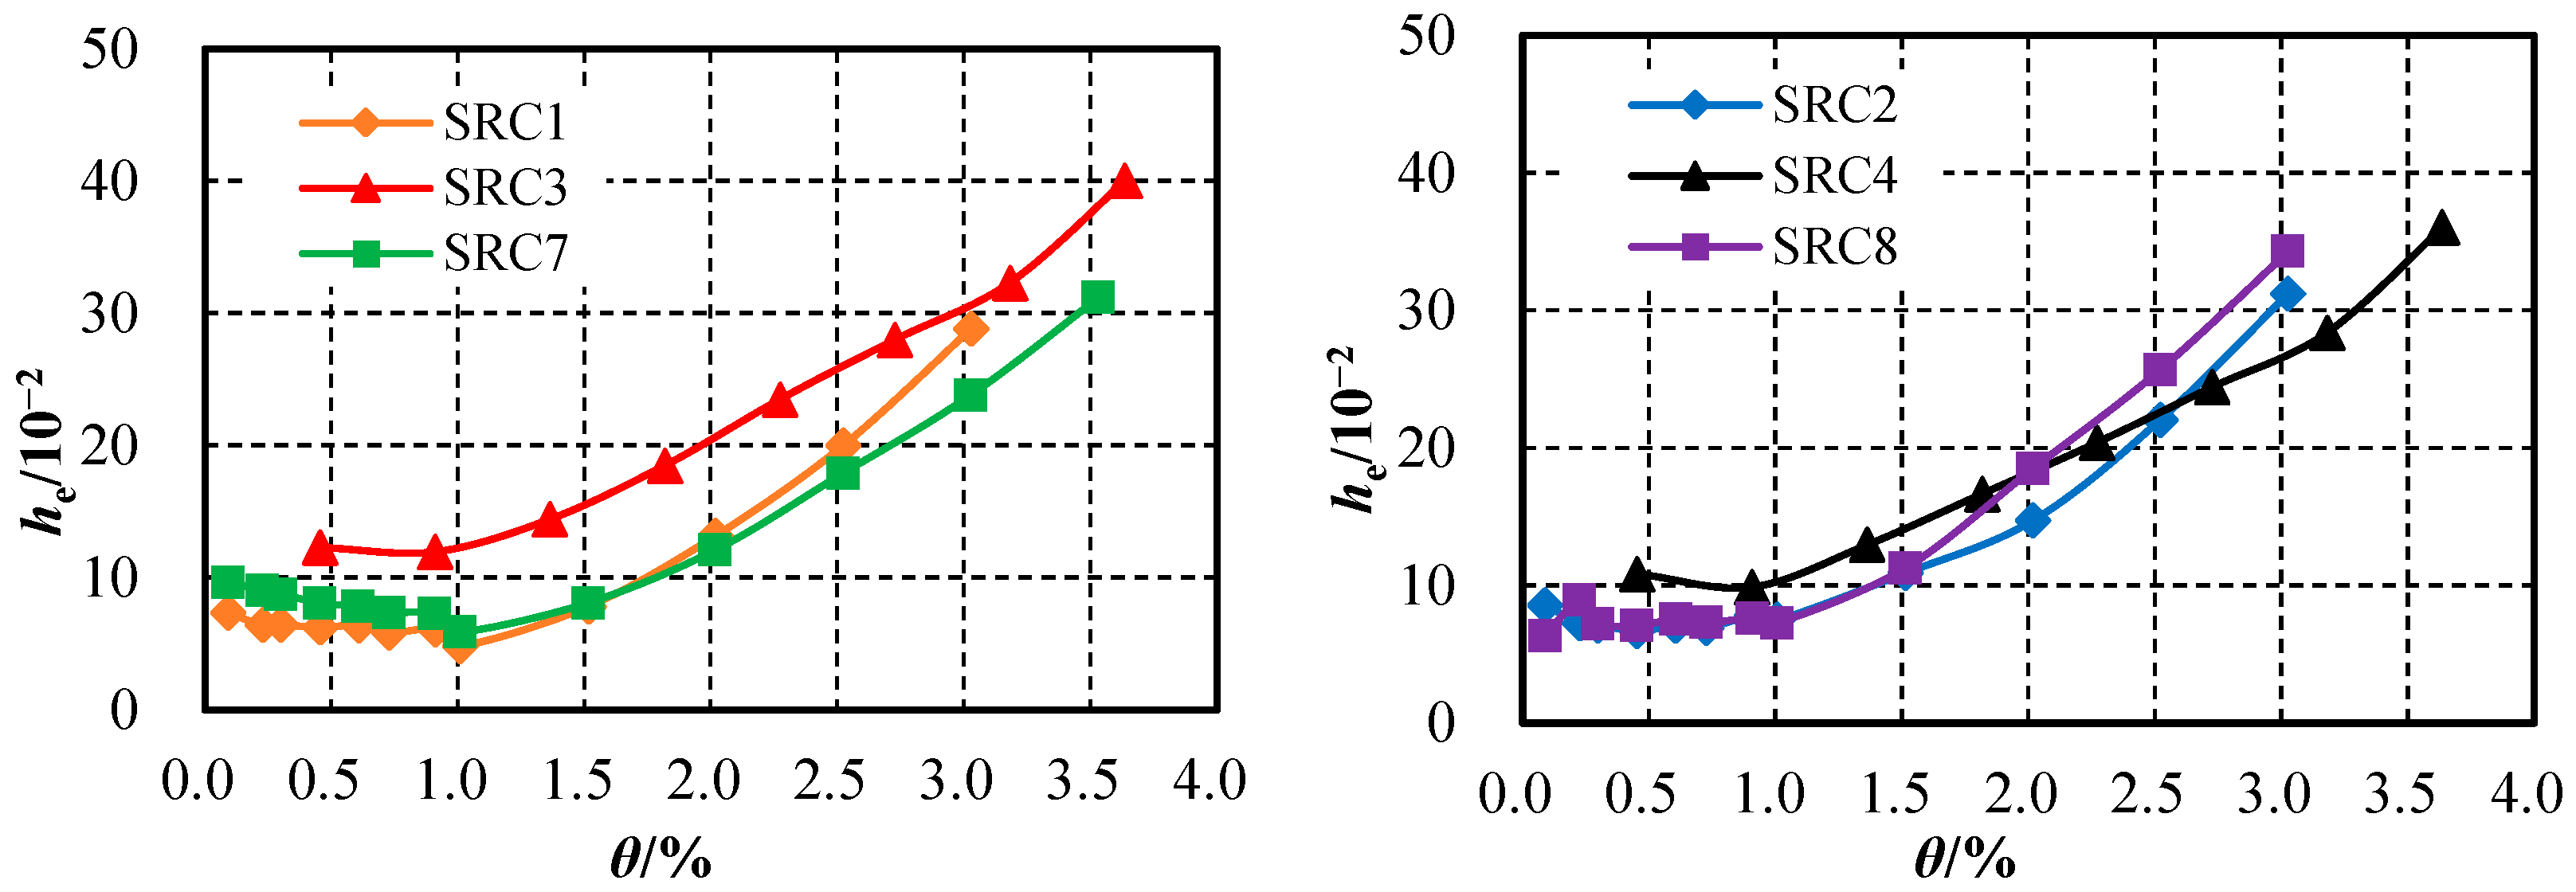
The equivalent viscous damping coefficient he is used to evaluate the energy dissipation capacity of the specimens. Based on Figure 11, the equivalent viscous damping coefficient he is calculated by Equation (2), and the larger the ratio is, the better the hysteresis cyclic energy dissipation capacity of the member is [28].
h e = S A B C D A 2 π ( S O B F + S O D E )
where SABCDA is the area of the hysteresis loop and SOBF is the area of the triangle OBF. SODE is the area of the triangle ODE.
Figure 12 shows the relationship curves between the equivalent viscous damping coefficient he and the displacement angle θ of the specimens, where the equivalent viscous damping coefficient corresponding to each displacement level is calculated by summing the equivalent viscous damping coefficients from multiple cyclic loading at that displacement level and dividing by the number of cycles. The ultimate equivalent viscous damping coefficient heu, corresponding to the failure load, can truly reflect the ultimate energy dissipation capacity of the specimens, with the calculation results listed in Table 6. It can be seen that:
(1)
When the displacement angle is less than 1.0%, the specimens have not yielded yet, and he fluctuates slightly with the increase in the displacement angle but generally remains stable. When the displacement angle is greater than 1.0%, as the displacement angle increases, the he of the specimens gradually increases, indicating that the energy dissipation capacity of the specimens continues to increase with the deepening of damage.
(2)
Before the peak load, the he of the far-field loading specimens is relatively close to that of the traditional loading specimens, showing basically similar energy dissipation capacities. In the failure stage, the heu of the far-field loading specimens SRC1 and SRC2 are reduced by 14.3% and 9.3%, respectively, compared to the traditional loading specimens SRC7 and SRC8, indicating that the cumulative damage caused by multiple large displacement cyclic loading reduces the ultimate energy dissipation capacity of the far-field loading specimens. The near-field loading specimens directly experience ultimate displacement in a single cycle, and their ultimate energy dissipation capacity is significantly greater than that of the far-field loading specimens and traditional loading specimens. The calculations show that the heu of the near-field loading specimens is approximately 1.54 to 1.68 times that of the far-field loading specimens and approximately 1.33 to 1.44 times that of the traditional loading specimens.

4.5.2. Influence of Far-Field Loading on Energy Dissipation Capacity

As the number of cycles at the same displacement level increases, the damage to the far-field loading specimens gradually accumulates and worsens, and the energy dissipation capacity changes accordingly. The relationship curves between the equivalent viscous damping coefficient he and the number of cycles N of the far-field loading specimens are shown in Figure 13. Here, N = 1–10 is the number of cycles of the displacement angle 1.0%, N = 11–20 is the number of cycles of the displacement angle 1.5%, N = 21–30 is the number of cycles of the displacement angle 2.0%, N = 31–40 is the number of cycles of the displacement angle 2.5%, and N = 41–50 is the number of cycles of the displacement angle 3.0%. From Figure 13, it can be seen that:
(1)
Before reaching the peak load (with loading cycles N ranging from 0 to 30), the equivalent viscous damping coefficient (he) of the specimen remains essentially unchanged as the number of cycles N increases under the same loading level. It indicates that multiple cycles of small displacement do not cause sustained damage to the specimen and have no significant impact on its energy dissipation performance.
(2)
After the peak load (when N exceeds 30), the equivalent viscous damping coefficient he of the specimen exhibits a notable increasing trend with the rise in displacement amplitude and the number of cycles for the same-level loading. For example, for the specimen SRC1, during multiple cyclic loading with a displacement angle of 2.5%, the value of he for the specimen increased by 4.3% in the 3rd cycle, and by 12.7% in the 10th cycle. For the SRC2 specimens, the increases were 6.5% and 18.1%, respectively. When the displacement angle exceeds 3.0%, it can be observed that the N-he relationship curve of the specimen rapidly shifts upwards, the coefficient he expands rapidly, and the energy dissipation capacity of the specimen is significantly enhanced. It indicates that large-displacement cyclic loading will continuously exacerbate the damage to the specimen. At this point, the internal steel section of the specimen can effectively restrain the core concrete, facilitating the full utilization of the specimen’s energy dissipation capacity.

4.5.3. Influence of Second-Stage Near-Field Loading on Energy Dissipation Capacity

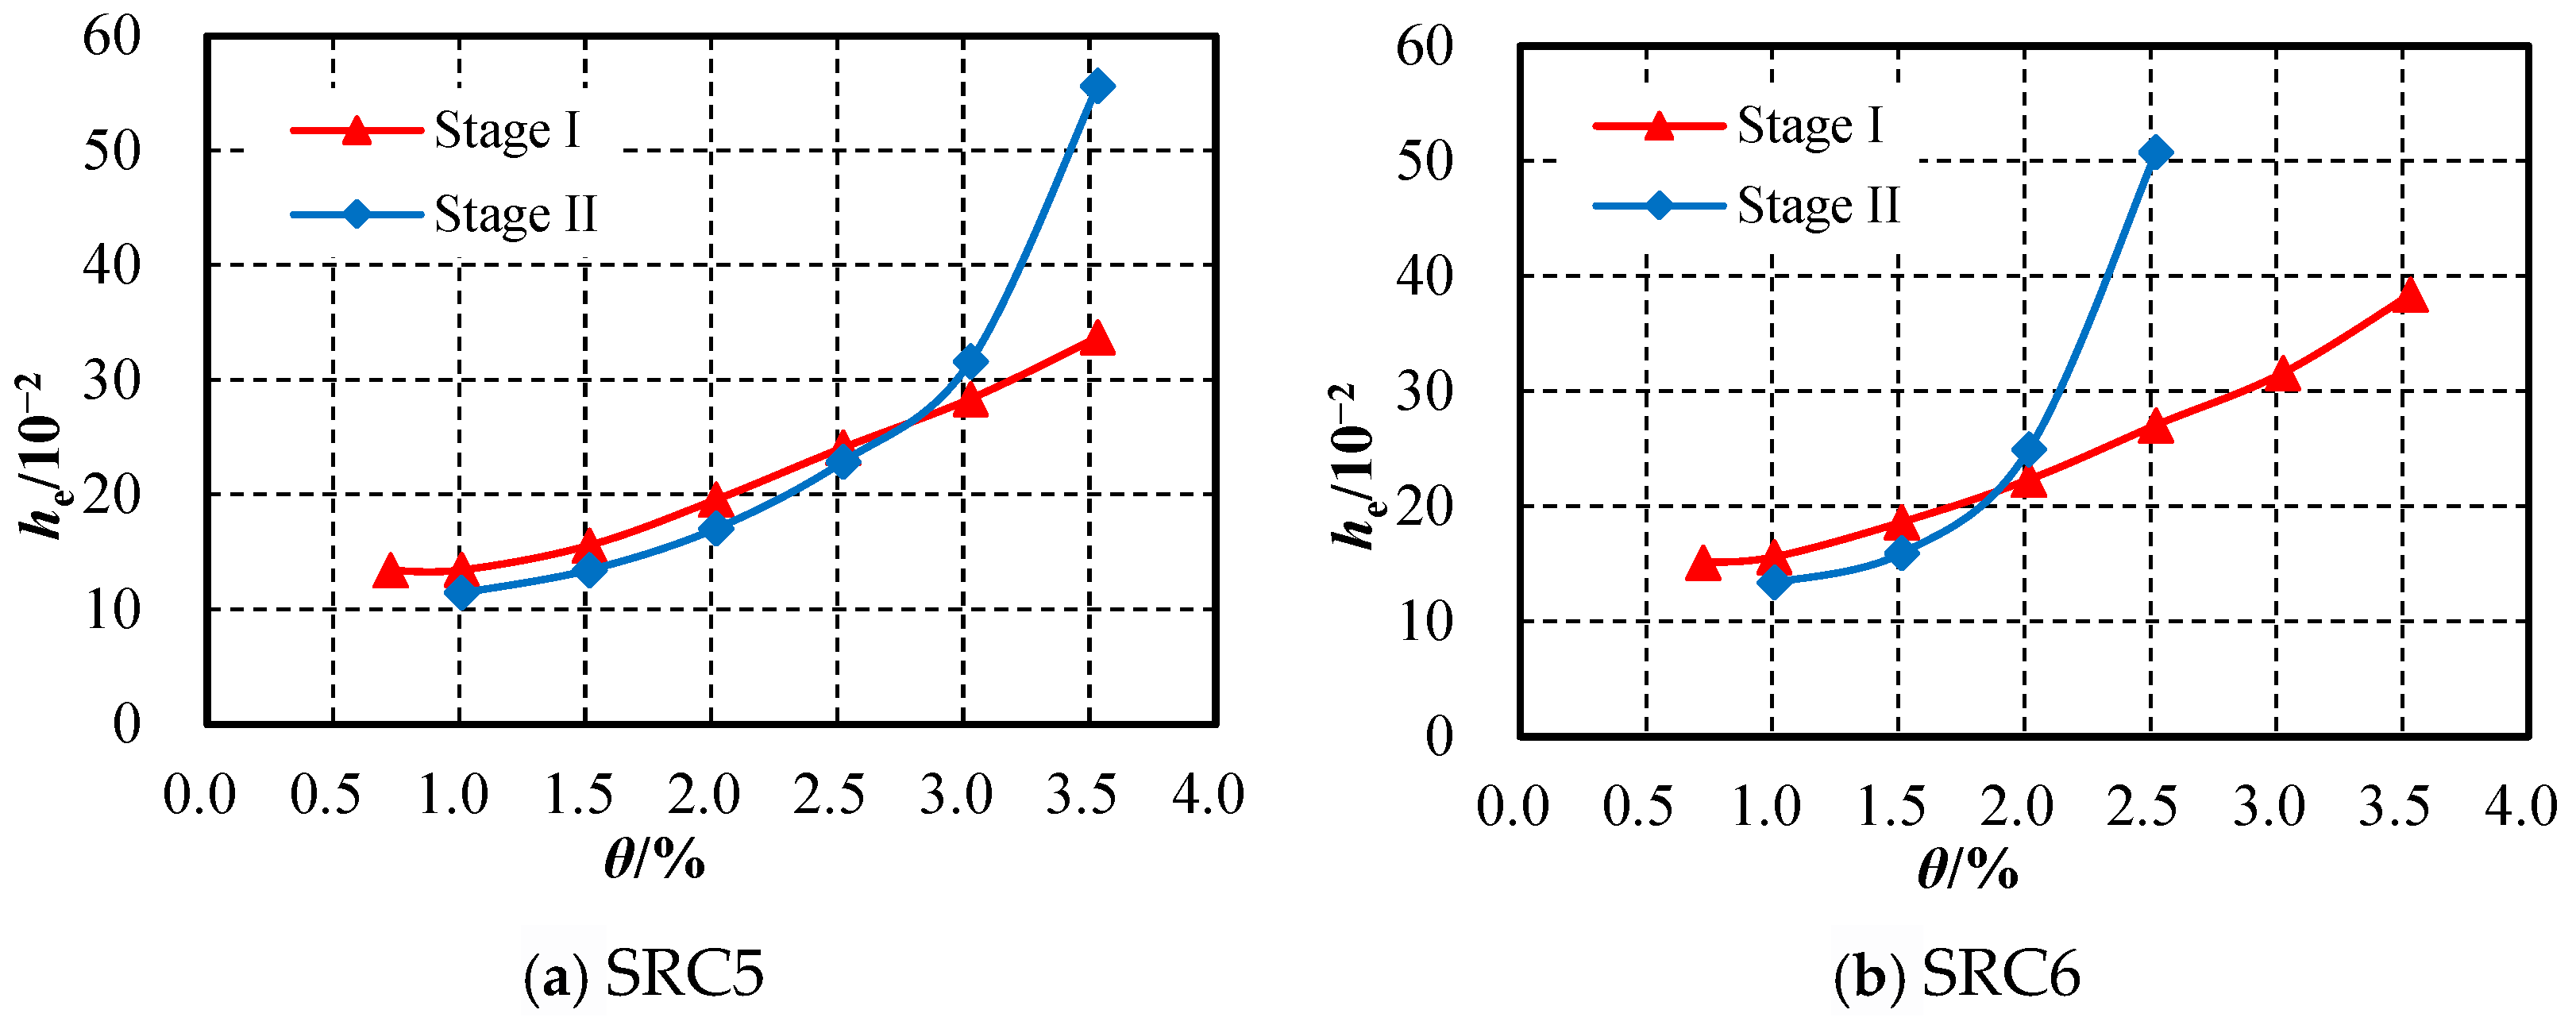
The relationship curves between the equivalent viscous damping coefficient he and displacement angle of the near-field loading specimens during the second loading stage are shown in Figure 14. It can be observed that as the displacement angle increases, the he of the specimens increases slowly at first and then rapidly. Before the peak load, the he of the specimens is slightly smaller than that of the first loading stage at the same displacement, indicating that the damage development of the specimens is not significant and has a small impact on their energy dissipation capacity. After the peak load, the he of the specimens increases rapidly and is significantly greater than that of the first loading stage at the same displacement, indicating that the damage to the specimens is more severe and that energy dissipation capacity is further enhanced.

5. Conclusions

Pseudo-static tests were conducted on eight SRC columns under different loading protocols, and the test phenomena and results were comprehensively analyzed. The following conclusions are drawn:
(1)
Compared to the traditional loading protocol, when loaded at the same displacement, components subjected to far-field loading exhibit larger cracks and increased damage, with a smaller corresponding displacement angle required to reach the same level of failure. The rate of bearing capacity decline accelerates. Therefore, in the case of far-field earthquake action, it is necessary to focus on monitoring the displacement of the structure.
Near-field loading, on the other hand, results in fewer cracks and less extensive crack development. When the specimen fails, the crushing failure zone of the concrete is larger.
(2)
Under the far-field loading protocol, before reaching the peak load, repeated small-displacement cyclic loading does not cause significant damage to the component and has minimal impact on its bearing capacity, stiffness, and energy dissipation capacity. At this stage, the steel-reinforced concrete column still exhibits a certain degree of elasticity. However, after the peak load, the component shows evident damage, with the hysteresis curve becoming less full and stiffness deteriorating significantly.
(3)
For near-field loading specimens, due to the large damage caused by the initial ultimate loading displacement, the bearing capacity and stiffness of the specimens during step-wise decreasing loading displacement are lower than those of far-field loading specimens and traditional loading specimens under the same loading displacement. During the second loading stage, before the peak load, the bearing capacity, stiffness, and energy dissipation capacity of the specimens are similar to those during the first loading stage at the same displacement. However, the peak load of the specimens decreases, and after the peak load, the stiffness and deformation capacity of the specimens are significantly lower than those during the first loading stage at the same displacement, greatly reducing their ability to resist subsequent seismic actions.
(4)
The loading protocol has a minimal impact on the load-bearing capacity (peak load) of components.

Author Contributions

Methodology, L.J. and L.G.; Software, Y.S.; Formal analysis, Q.Z.; Investigation, F.Z.; Writing—original draft, Y.S., G.Y., L.G., Q.Z. and F.Z.; Writing—review & editing, L.J.; Supervision, G.Y. All authors have read and agreed to the published version of the manuscript.

Funding

This study was supported by the Natural Science Foundation of the Jiangsu Higher Education Institutions of China (23KJB410002), the Youth Project of the Natural Science Foundation of Jiangsu Province (BK20241099), the Suqian Sci &Tech Program (Z2023140), and the Youth Program of Suqian Sci &Tech Plan (K202418).

Data Availability Statement

The data used to support the findings of this study are included within the article.

Acknowledgments

The authors would like to acknowledge the support of the organizations for providing photographs and advice.

Conflicts of Interest

The authors declare that they have no conflicts of interest.

References

  1. Xu, L.; Hu, J.; Xie, L. On characteristics of ground motion parameters for special long period ground motions. J. Earthq. Eng. Eng. Vib. 2008, 28, 20–27. [Google Scholar]
  2. Takewaki, I.; Murakami, S.; Fujita, K.; Yoshitomi, S.; Tsuji, M. The 2011 off the Pacific coast of Tohoku earthquake and response of high-rise buildings under long-period ground motions. Soil Dyn. Earthq. Eng. 2011, 31, 1511–1528. [Google Scholar] [CrossRef]
  3. Chung, Y.; Nagae, A.T.; Hitaka, T.; Nakashima, M. Seismic resistance capacity of high-rise buildings subjected to long-period ground motions: E-Defense shaking table test. J. Struct. Eng. ASCE 2010, 136, 637–644. [Google Scholar] [CrossRef]
  4. Ji, X.; Fenves, G.L.; Kajiwara, K.; Nakashima, M. Seismic damage detection of a full-scale shaking table test structure. J. Struct. Eng. ASCE 2011, 137, 14–21. [Google Scholar] [CrossRef]
  5. Liu, Y. Experimental Study on the Seismic Performance of Frame Columns Under Near-Field Earthquakes. Master’s Thesis, Hunan University, Changsha, China, 2010. [Google Scholar]
  6. Yan, X.; Qi, A.; Mao, H.; Zhang, C. Shaking table test of mega-sub isolated structure under near-field earthquake action. Eng. Mech. 2017, 34, 109–115+144. [Google Scholar]
  7. Chayut, N.; Sakdirat, K.; Charalampos, B. Far-Field Earthquake Responses of Overhead Line Equipment (OHLE) Structure Considering Soil-Structure Interaction. Front. Built Environ. 2018, 4, 35. [Google Scholar]
  8. Ren, Q.; Kou, Y.; Xu, Y.; Wei, K. Dynamic stability and collapse analysis of wind tur-bine under near-field ground motion. Structures 2025, 74, 108534. [Google Scholar] [CrossRef]
  9. Zhu, Y.; Wang, W.; Shi, Y.; Li, M.; Wang, S.; Bao, L.; Tian, Y. Experimental and numerical study on seismic behavior of partially steel-reinforced concrete beam-to-steel tube column joint. J. Build. Eng. 2023, 76, 107210. [Google Scholar] [CrossRef]
  10. Tao, Z.; Wang, Z.; Yu, Q. Finite element modelling of concrete-filled steel stub columns under axial compression. J. Constr. Steel Res. 2013, 89, 121–131. [Google Scholar] [CrossRef]
  11. Hemanth, B.; Kumar, C.D.J.; Arunakanthi, E. Analysis of dry and wet connections in precast beam-column joint using ABAQUS software. Mater. Today Proc. 2020, 33, 287–295. [Google Scholar]
  12. Aninthaneni, K.P.; Dhakal, P.R. Analytical and numerical investigation of “dry” jointed precast concrete frame sub-assemblies with steel angle and tube connections. Bull. Earthq. Eng. 2019, 17, 4961–4985. [Google Scholar] [CrossRef]
  13. Parastesh, H.; Hajirasouliha, I.; Ramezani, R. A new ductile moment-resisting connection for precast concrete frames in seismic regions: An experimental investigation. Eng. Struct. 2014, 70, 144–157. [Google Scholar] [CrossRef]
  14. Zhu, W.Q.; Meng, G.; Jia, J.Q. Experimental studies on axial load performance of high-strength concrete short columns. Proc. ICE Struct. Build. 2014, 167, 509–519. [Google Scholar] [CrossRef]
  15. Shi, J.; Bai, G. Restoring force characteristics of hollow steel reinforced concrete frame columns. J. Xi’an Highw. Univ. 2000, 20, 94–97. [Google Scholar]
  16. Acun, B.; Sucuoğu, H. The effect of displacement history on the performance of concrete columns in flexure. In Advance in Performance-Based Earthquake Engineering, Geotechnical, Eeological, and Earthquake Engineering; Springer: Berlin/Heidelberg, Germany, 2010; Volume 13, pp. 373–382. [Google Scholar]
  17. Pujol, S.; Sozen, M.A.; Ramirez, J.A. Displacement history effects on drift capacity of reinforced concrete columns. ACI Struct. J. 2006, 103, 253–262. [Google Scholar] [CrossRef] [PubMed]
  18. Ji, X.; Zhang, M.; Liu, P.; Kang, H.Z.; Qian, J.R.; Zhou, Z.Z.; Hu, H.S. Experimental study on cumulative damage performance of steel-concrete composite columns. J. Build. Struct. 2013, 34, 35–44. [Google Scholar]
  19. Qian, J.; Li, N.; Ji, X.; Zhao, Z. Experimental study on cumulative damage performance of composite steel tube high-strength concrete columns. J. Civ. Eng. 2014, 47, 30–40. [Google Scholar]
  20. Zhu, J.; Gong, J.; Xiong, L.; Qiu, J.; Li, X. Experimental study on seismic performance of RC bridge piers under different cycles. J. Southeast Univ. Nat. Sci. Ed. 2019, 49, 652–663. [Google Scholar]
  21. Qian, J.; Feng, B. Experimental Study on Seismic Performance of Reinforced Concrete Columns with Different Seismic Grades. J. Build. Struct. 2014, 35, 105–114. [Google Scholar]
  22. Liu, L.; Yi, W.; Xie, C. Displacement performance and simulation of flexural-shear critical square columns under near-fault earthquakes. J. Earthq. Eng. Eng. Vib. 2015, 35, 85–93. [Google Scholar]
  23. Yi, W.J.; Zhou, Y.; Liu, Y.; Liu, L. Experimental investigation of circular reinforced concrete columns under different loading histories. J. Earthq. Eng. 2016, 20, 654–675. [Google Scholar] [CrossRef]
  24. Luo, Y. Seismic Performance of Reinforced Concrete Shear Wall Under Near-Field Earthquake. Master’s Thesis, Hunan University, Changsha, China, 2011. [Google Scholar]
  25. JGJ138-2016; China Academy of Building Research, Code for Design of Composite Structures. China Architecture & Building Press: Beijing, China, 2016.
  26. Jiang, L.J.; Bai, G.L. Experimental Study on Cumulative Damage Behavior of Steel-Reinforced Concrete Columns. Adv. Civ. Eng. 2020, 2020, 5281725. [Google Scholar] [CrossRef]
  27. JGJ/T101-2015; China Academy of Building Research, Specification for Seismic Test of Buildings. China Architecture & Building Press: Beijing, China, 2015.
  28. Chen, Z.; Liu, X. Experimental Study on Seismic Performance of Transversely Ribbed Corrugated Steel Plate–Steel Pipe Concrete Shear Wall. Buildings 2024, 14, 2708. [Google Scholar] [CrossRef]
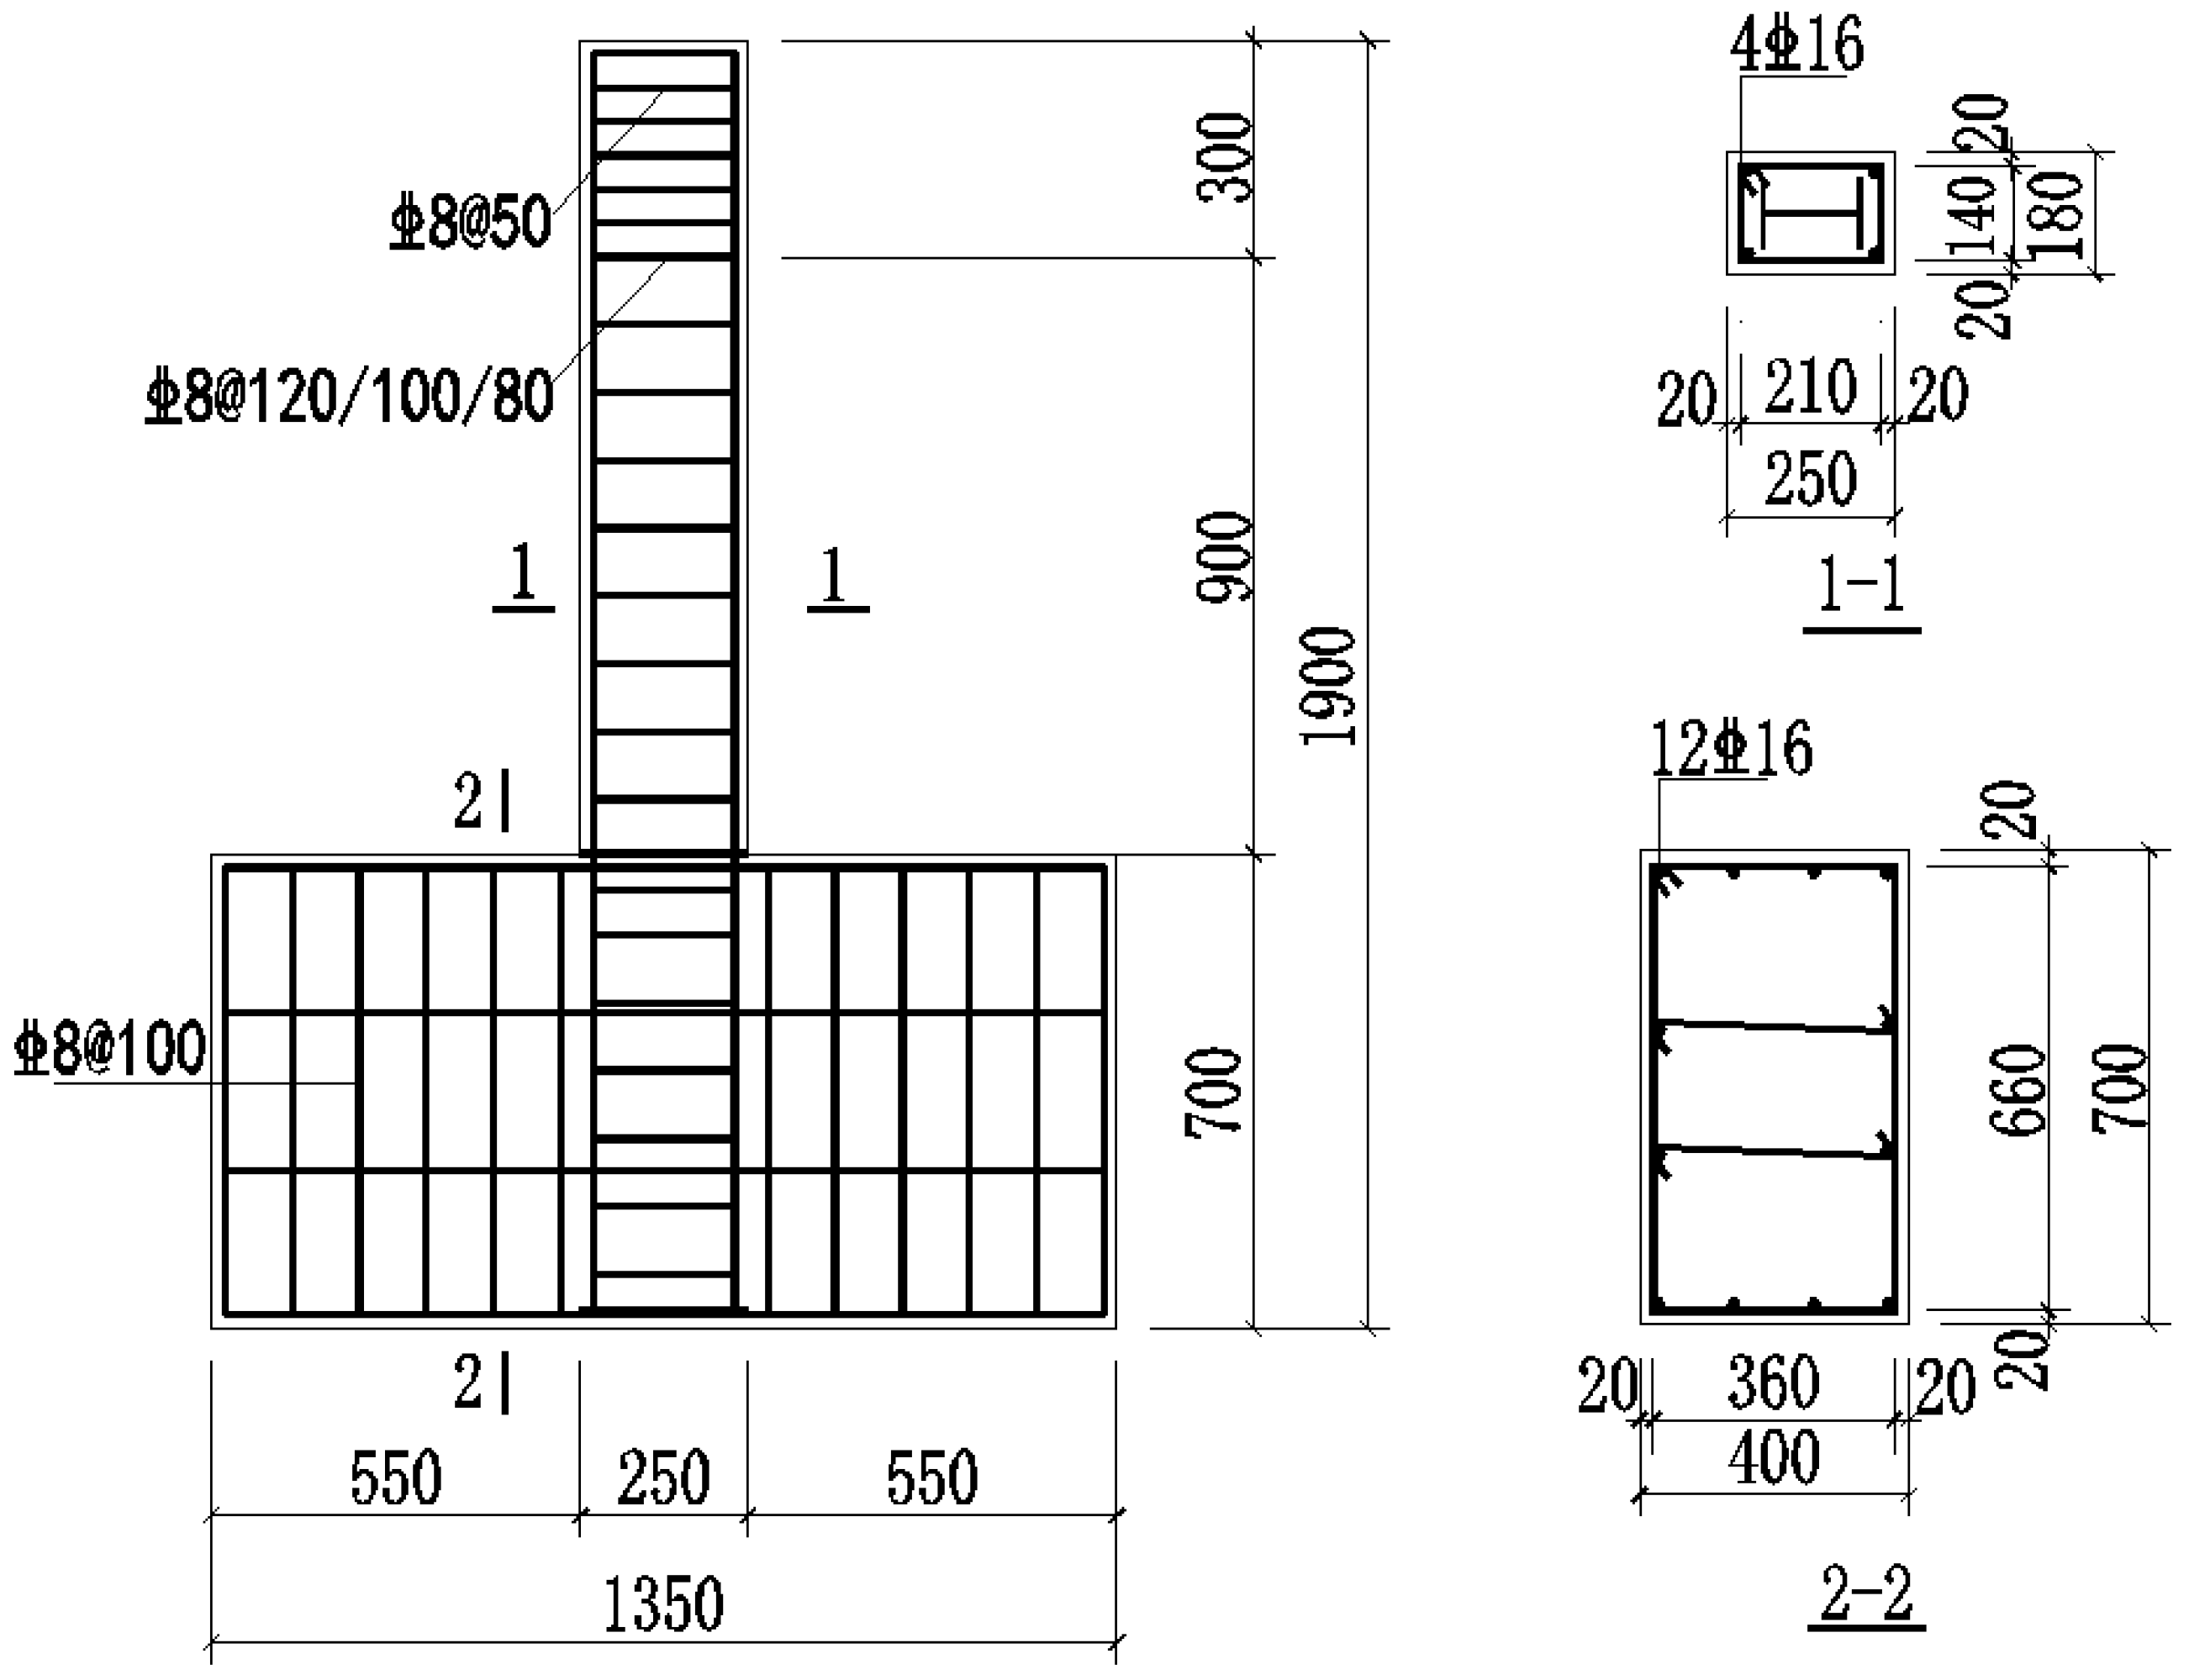
Figure 1. Dimensions and cross-sectional reinforcement of specimen [26].
Buildings 15 03180 g001
Figure 2. Test loading device [26].
Buildings 15 03180 g002
Figure 3. Loading protocol of specimens.
Buildings 15 03180 g003
Figure 4. Failure mode of specimens.
Buildings 15 03180 g004aBuildings 15 03180 g004b
Figure 5. Hysteresis curves of horizontal load versus displacement angle of specimens. (a) SRC1 [26]; (b) SRC2 [26]; (c) SRC3; (d) SRC4; (e) SRC5; (f) SRC6; (g) SRC7 [26]; and (h) SRC8.
Buildings 15 03180 g005
Figure 6. Relationship curves between P1/Pmax and displacement angle θ of specimens.
Buildings 15 03180 g006
Figure 7. Skeleton curves of specimens during the second stage of near-field loading.
Buildings 15 03180 g007
Figure 8. Relationship curves between secant stiffness K and displacement angle θ of specimens.
Buildings 15 03180 g008
Figure 9. Relationship curves between secant stiffness K and number of cycles N of far-field loading specimens.
Buildings 15 03180 g009
Figure 10. Relationship curves between secant stiffness K and number of cycles N of near-field loading specimens during the second loading stage.
Buildings 15 03180 g010
Figure 11. Equivalent viscous damping coefficient calculation.
Buildings 15 03180 g011
Figure 12. Relationship curves between equivalent viscous damping coefficient he and displacement angle θ of specimens.
Buildings 15 03180 g012
Figure 13. Relationship curves between equivalent viscous damping coefficient he and number of cycles N of far-field loading specimens.
Buildings 15 03180 g013
Figure 14. Relationship curves between equivalent viscous damping coefficient he and displacement angle θ of near-field loading specimens during the second loading stage.
Buildings 15 03180 g014
Table 1. Design parameters of specimens.
SpecimenSteel SectionSteel RatioStirrupStirrup RatioDesigned Axial Compression RatioLoading Protocol
SRC1I144.8%C8@1001.2%0.3far-field loading protocol
SRC2I144.8%C8@801.5%
SRC3I144.8%C8@1001.2%0.3near-field loading protocol
SRC4I144.8%C8@801.5%
SRC5I165.8%C8@1001.2%
SRC6I144.8%C8@1201.0%
SRC7I144.8%C8@1001.2%0.3traditional loading protocol
SRC8I144.8%C8@801.5%
Table 2. Peak load of specimens.
SpecimenθmaxPmax (kN)SpecimenθmaxPmax (kN)
SRC12.0%82.3SRC22.0%85.0
SRC31.8%80.4SRC41.8%85.8
SRC52.6%101.7SRC61.9%81.0
SRC72.0%75.2SRC81.5%82.5
Table 3. P3/P1 and P10/P1 of specimens at different loading displacement angles.
SpecimenDisplacement AngleP3/P1P10/P1SpecimenDisplacement AngleP3/P1P10/P1
SRC1 [26]1.0%0.9640.950SRC2 [26]1.0%0.9890.997
1.5%0.9670.9451.5%0.9900.991
2.0%0.9650.9242.0%0.9770.956
2.5%0.9620.8852.5%0.9680.907
3.0%0.9443.0%
SRC7 [26]1.0%0.981SRC81.0%0.973
1.5%0.9641.5%0.955
2.0%0.9542.0%0.950
2.5%0.9512.5%0.967
3.0%0.9623.0%
3.5%0.948
Table 4. Displacement and displacement ductility coefficient of specimens.
SpecimenLoading Directiony/mmθyu/mmθuμμa
SRC1Positive12.921.15%30.452.90%2.362.52
Negative−12.39−33.302.69
SRC3Positive11.971.07%34.533.27%2.883.06
Negative−11.57−37.393.23
SRC7Positive13.761.26%38.903.54%2.832.81
Negative−13.97−38.902.78
SRC2Positive11.431.09%30.422.90%2.662.67
Negative−12.44−33.302.68
SRC4Positive12.471.16%38.243.56%3.073.08
Negative−13.00−40.003.08
SRC8Positive10.760.94%26.362.71%2.452.90
Negative−9.93−33.303.35
Table 5. Displacement angle and displacement ductility coefficient of near-field loading specimens.
SpecimenLoading Stageθyθuμ
SRC511.14%3.53%3.12
21.75%3.21%1.86
SRC611.13%3.43%3.03
21.48%2.32%1.57
Table 6. Ultimate equivalent viscous damping coefficient of specimens.
SpecimenSRC1SRC2SRC3SRC4SRC5SRC6SRC7SRC8
heu0.2390.2610.4010.3750.3500.3840.2790.281
Disclaimer/Publisher’s Note: The statements, opinions and data contained in all publications are solely those of the individual author(s) and contributor(s) and not of MDPI and/or the editor(s). MDPI and/or the editor(s) disclaim responsibility for any injury to people or property resulting from any ideas, methods, instructions or products referred to in the content.