Article

Evaluating and Optimizing Walkability in 15-Min Post-Industrial Community Life Circles

1
School of Architecture and Art, North China University of Technology, Beijing 100144, China
2
School of Computer Science, The Open University of China, Beijing 100039, China
3
Centre for Design Innovation, Swinburne University of Technology, Hawthorn, Victoria 3122, Australia
*
Authors to whom correspondence should be addressed.
Buildings 2025, 15(17), 3143; https://doi.org/10.3390/buildings15173143
Submission received: 30 July 2025 / Revised: 22 August 2025 / Accepted: 28 August 2025 / Published: 2 September 2025

Abstract

With industrial transformation and the rise in the 15 min community life circle, optimizing walkability and preserving industrial heritage are key to revitalizing former industrial areas. This study, focusing on Shijingshan District in Beijing, proposes a walkability evaluation framework integrating multi-source big data and street-level perception. Using Points of Interest (POI) classification, which refers to the categorization of key urban amenities, pedestrian network modeling, and street view image data, a Walkability Friendliness Index is developed across four dimensions: accessibility, convenience, diversity, and safety. POI data provide insights into the spatial distribution of essential services, while pedestrian network data, derived from OpenStreetMap, model the walkable road network. Street view image data, processed through semantic segmentation, are used to assess the quality and safety of pedestrian pathways. Results indicate that core communities exhibit higher Walkability Friendliness Index scores due to better connectivity and land use diversity, while older and newly developed areas face challenges such as street discontinuity and service gaps. Accordingly, targeted optimization strategies are proposed: enhancing accessibility by repairing fragmented alleys and improving network connectivity; promoting functional diversity through infill commercial and service facilities; upgrading lighting, greenery, and barrier-free infrastructure to ensure safety; and delineating priority zones and balanced enhancement zones for differentiated improvement. This study presents a replicable technical framework encompassing data acquisition, model evaluation, and strategy development for enhancing walkability, providing valuable insights for the revitalization of industrial districts worldwide. Future research will incorporate virtual reality and subjective user feedback to further enhance the adaptability of the model to dynamic spatiotemporal changes.

1. Introduction and Literature Review

Amid global urbanization and industrial restructuring, the transformation of industrial districts has become a shared developmental challenge across countries [1,2]. From the textile district regeneration in Manchester to the automobile factory conversion in Detroit, from the revitalization of coal mining sites in Germany’s Ruhr region to the renewal of the Yangshupu industrial area in Shanghai, cities worldwide are confronted with the task of adapting spaces that carry industrial memories to meet the demands of modern livability [3,4,5]. This transformation involves not only efficient land use but also a systematic restructuring of community functions [6]. In this context, the quality of the pedestrian environment—serving as the key interface between production heritage and living space—has become increasingly critical in global urban regeneration practices [7]. Both the World Health Organization (WHO) and the United Nations’ 2030 Agenda for Sustainable Development (SDGs) emphasize the role of walkability in fostering healthy, livable, and sustainable cities. WHO’s Global Action Plan for Physical Activity highlights that improving pedestrian networks and street design can promote active mobility and reduce health risks linked to physical inactivity [8]. Similarly, the Shanghai Declaration on Promoting Health in the 2030 Agenda stresses that cities and communities are key health settings, advocating mixed land use, accessible public transport, and high-quality open spaces to support daily activities [9]. Within the SDGs, Goal 11 (Sustainable Cities and Communities) and Goal 3 (Good Health and Well-being) further call for enhanced accessibility of walkable environments and green spaces through planning and policy innovation [10,11]. Enhancing walkability is thus an important pathway toward building livable cities and achieving sustainable development [12,13,14].
In recent years, the concept of the “15-min community life circle” has emerged as a key principle in urban planning and community development [15,16], aiming to meet residents’ daily needs within a walkable range [17]. The era of big data has further enriched urban research methods by providing new tools and sources. Multi-source spatial data offer more comprehensive and accurate reflections of residents’ behavioral patterns and the distribution of community facilities, providing a solid data foundation and analytical support for walkability research [18,19]. Accurately evaluating walkability using multi-source data and developing optimization strategies holds significant practical value.

1.1. Transformation Challenges of Industrial Districts and Walkability

The regeneration of former industrial neighborhoods has become a pressing issue within global urban renewal processes. These areas have advantages such as strong transportation accessibility and high land concentration [20], but they also face problems such as spatial aging, single functions and lack of living services [21]. Cities worldwide are attempting to convert traditional industrial spaces into diversified urban living environments, with an emphasis on aligning spatial memory with modern functionality [22]. Nevertheless, while some progress has been made in functional renewal, walkability has often been overlooked [23]. Original spatial patterns dominated by factories and vehicular roads lack pedestrian routes, open spaces, and street vitality, resulting in fragmented, unwalkable environments [24]. Studies have shown that introducing high-quality pedestrian networks, improved street interfaces, and slow-traffic systems can significantly enhance spatial vitality, attractiveness, and social integration [25].
In China, during the process of land redevelopment in many old industrial zones, the focus remains primarily on land plot replacement and functional introduction, while the construction of spatial continuity and the experience of daily travel are overlooked [26,27]. Even with new commercial and office uses, resident engagement remains low due to inadequate pedestrian environments [28,29,30]. Unlike ordinary urban residential areas, industrial communities, shaped by distinctive historical evolution, spatial patterns, and demographic composition, often display a production-oriented but life-neglected bias in walkability planning. This results in a structural imbalance, with essential services such as education and healthcare remaining sparse and largely clustered around factory administrative centers, thereby creating an island effect with limited coverage. Meanwhile, some areas undergoing transformation have begun to leverage techniques such as street view image analysis and space syntax to evaluate and optimize walkability, demonstrating the potential of walkability improvements to drive community revitalization [31,32]. A core challenge in industrial district renewal lies in overcoming the scale dilemma and connectivity disruption created by traditional spatial patterns and reconstructing pedestrian-oriented public space networks. This is not only vital for enhancing spatial quality but also for improving urban convenience and social inclusiveness.

1.2. The “15-Min CLC” Concept and Walkability-Oriented Development

As urban planning concepts continue to evolve, the 15 min community life circle (hereafter referred to as 15 min CLC) has become a leading model for sustainable urban development [33]. Originally proposed at the first World Cities Day Forum held in Shanghai, the 15 min CLC advocates compressing essential urban functions—such as housing, employment, education, healthcare, and retail—within a 15 min walking distance, thereby promoting job-housing balance, service accessibility, and daily life convenience while significantly reducing automobile dependence [33,34]. It shares much in common with internationally recognized walkability-oriented planning models, including the 15 min city, the 20 min neighborhood, and Transit-Oriented Development (TOD), all of which emphasize proximity and accessibility [33,35,36]. However, while the 15 min city focuses more on chrono-urbanism and mixed-use development at the metropolitan scale, and TOD centers around high-density development near transit hubs, the 15 min CLC is more grounded in the Chinese planning context, with a stronger focus on equitable service facility distribution and community-level governance integration [37]. These conceptual parallels suggest that the CLC model, while rooted locally, offers a flexible and adaptable framework that can inform walkability-oriented planning practices in diverse global urban contexts.
Walkability is a core indicator for evaluating the implementation of the 15 min CLC [38,39]. In recent years, cities have increasingly employed GIS tools and Walk Score models to quantify travel time and distance to essential facilities, assessing the completeness and equity of urban service networks. For instance, Parma, Italy, used a GIS-based model to evaluate spatial and temporal access to public services from residential locations [21]. In Barcelona’s Sant Marti district, open-source GIS and simulation tools were utilized to assess facility layout rationality, providing refined urban renewal guidance [40]. In Pasay, Manila, scholars developed a 15 min CLC using age-based walking speeds and facility weights, revealing that over 90% of the city achieved medium-to-high service accessibility [41].
In China, the 15 min CLC has been promoted since 2016 as a people-oriented strategy for healthy and livable cities [42], now embedded in land spatial planning and community governance. Taking Suzhou as an example, researchers constructed a walking accessibility evaluation model for living circles from the perspective of the elderly based on semantic segmentation of street view images and deep learning methods, emphasizing the important role of daily service facilities for vulnerable groups [42]. In Baoding, the research team evaluated the layout of service facilities in more than 1000 communities using POI data, found that there was insufficient supply of some types of facilities, and put forward targeted optimization suggestions [43]. In addition, a study in Nanjing introduced the three-step floating catchment area model and combined it with crowd behavior data to build a multi-dimensional supply–demand matching evaluation system, aiming to improve the fairness and service response capacity of living circles [44].

1.3. Walkability Research Driven by Multi-Source Data

With the diversification of urban data sources and the advancement of AI technologies, walkability research based on multi-source data has emerged as a significant direction in urban planning. Traditional evaluation methods rely heavily on field surveys and questionnaires, which are often costly and time-consuming. In contrast, multi-source data significantly improves both the efficiency and precision of assessments [45].
In recent years, scholars have increasingly sought to construct more comprehensive walkability evaluation frameworks by integrating methods such as street-view imagery, GIS-based spatial analysis, POI data, and the Time-weighted Walkability Index (T-WSI). For example, researchers combining street-view images, space syntax, and GIS systematically assessed the walkability of historic districts, revealing that high-walkability areas were concentrated in core tourist zones and closely correlated with the distribution of historic buildings [46]. A review on the application of big data and machine learning in walkability research highlighted that street-view images and POI data are the most widely used sources, while machine learning has enhanced automation and accuracy in evaluation; however, challenges remain regarding data acquisition, model customization, and cross-regional standardization [47]. Furthermore, empirical studies employing T-WSI confirmed its high reliability and reproducibility in cross-temporal comparisons, making it suitable for monitoring changes in community walkability in response to policy interventions [48].
In light of existing scholarship, we identify three primary research gaps. First, the collection and processing of diverse data types still lack standardized protocols, which undermines the comparability of walkability assessments across cities and regions. Second, most existing walkability evaluation tools are designed for conventional urban neighborhoods and remain insufficiently tailored to post-industrial communities. Third, the synergies between the 15 min CLC concept and the renewal of industrial heritage have not yet been systematically explored. Addressing these gaps, this study proposes a multi-source data–driven framework for evaluating walkability in post-industrial communities. The framework integrates both functional accessibility and residents’ perceptual experiences, while exploring how the 15 min CLC approach can be aligned with industrial heritage preservation and community regeneration, thereby providing new theoretical perspectives and practical pathways for sustainable urban transformation.

2. Data and Methods

2.1. Research Area and Analytical Framework

2.1.1. Study Area

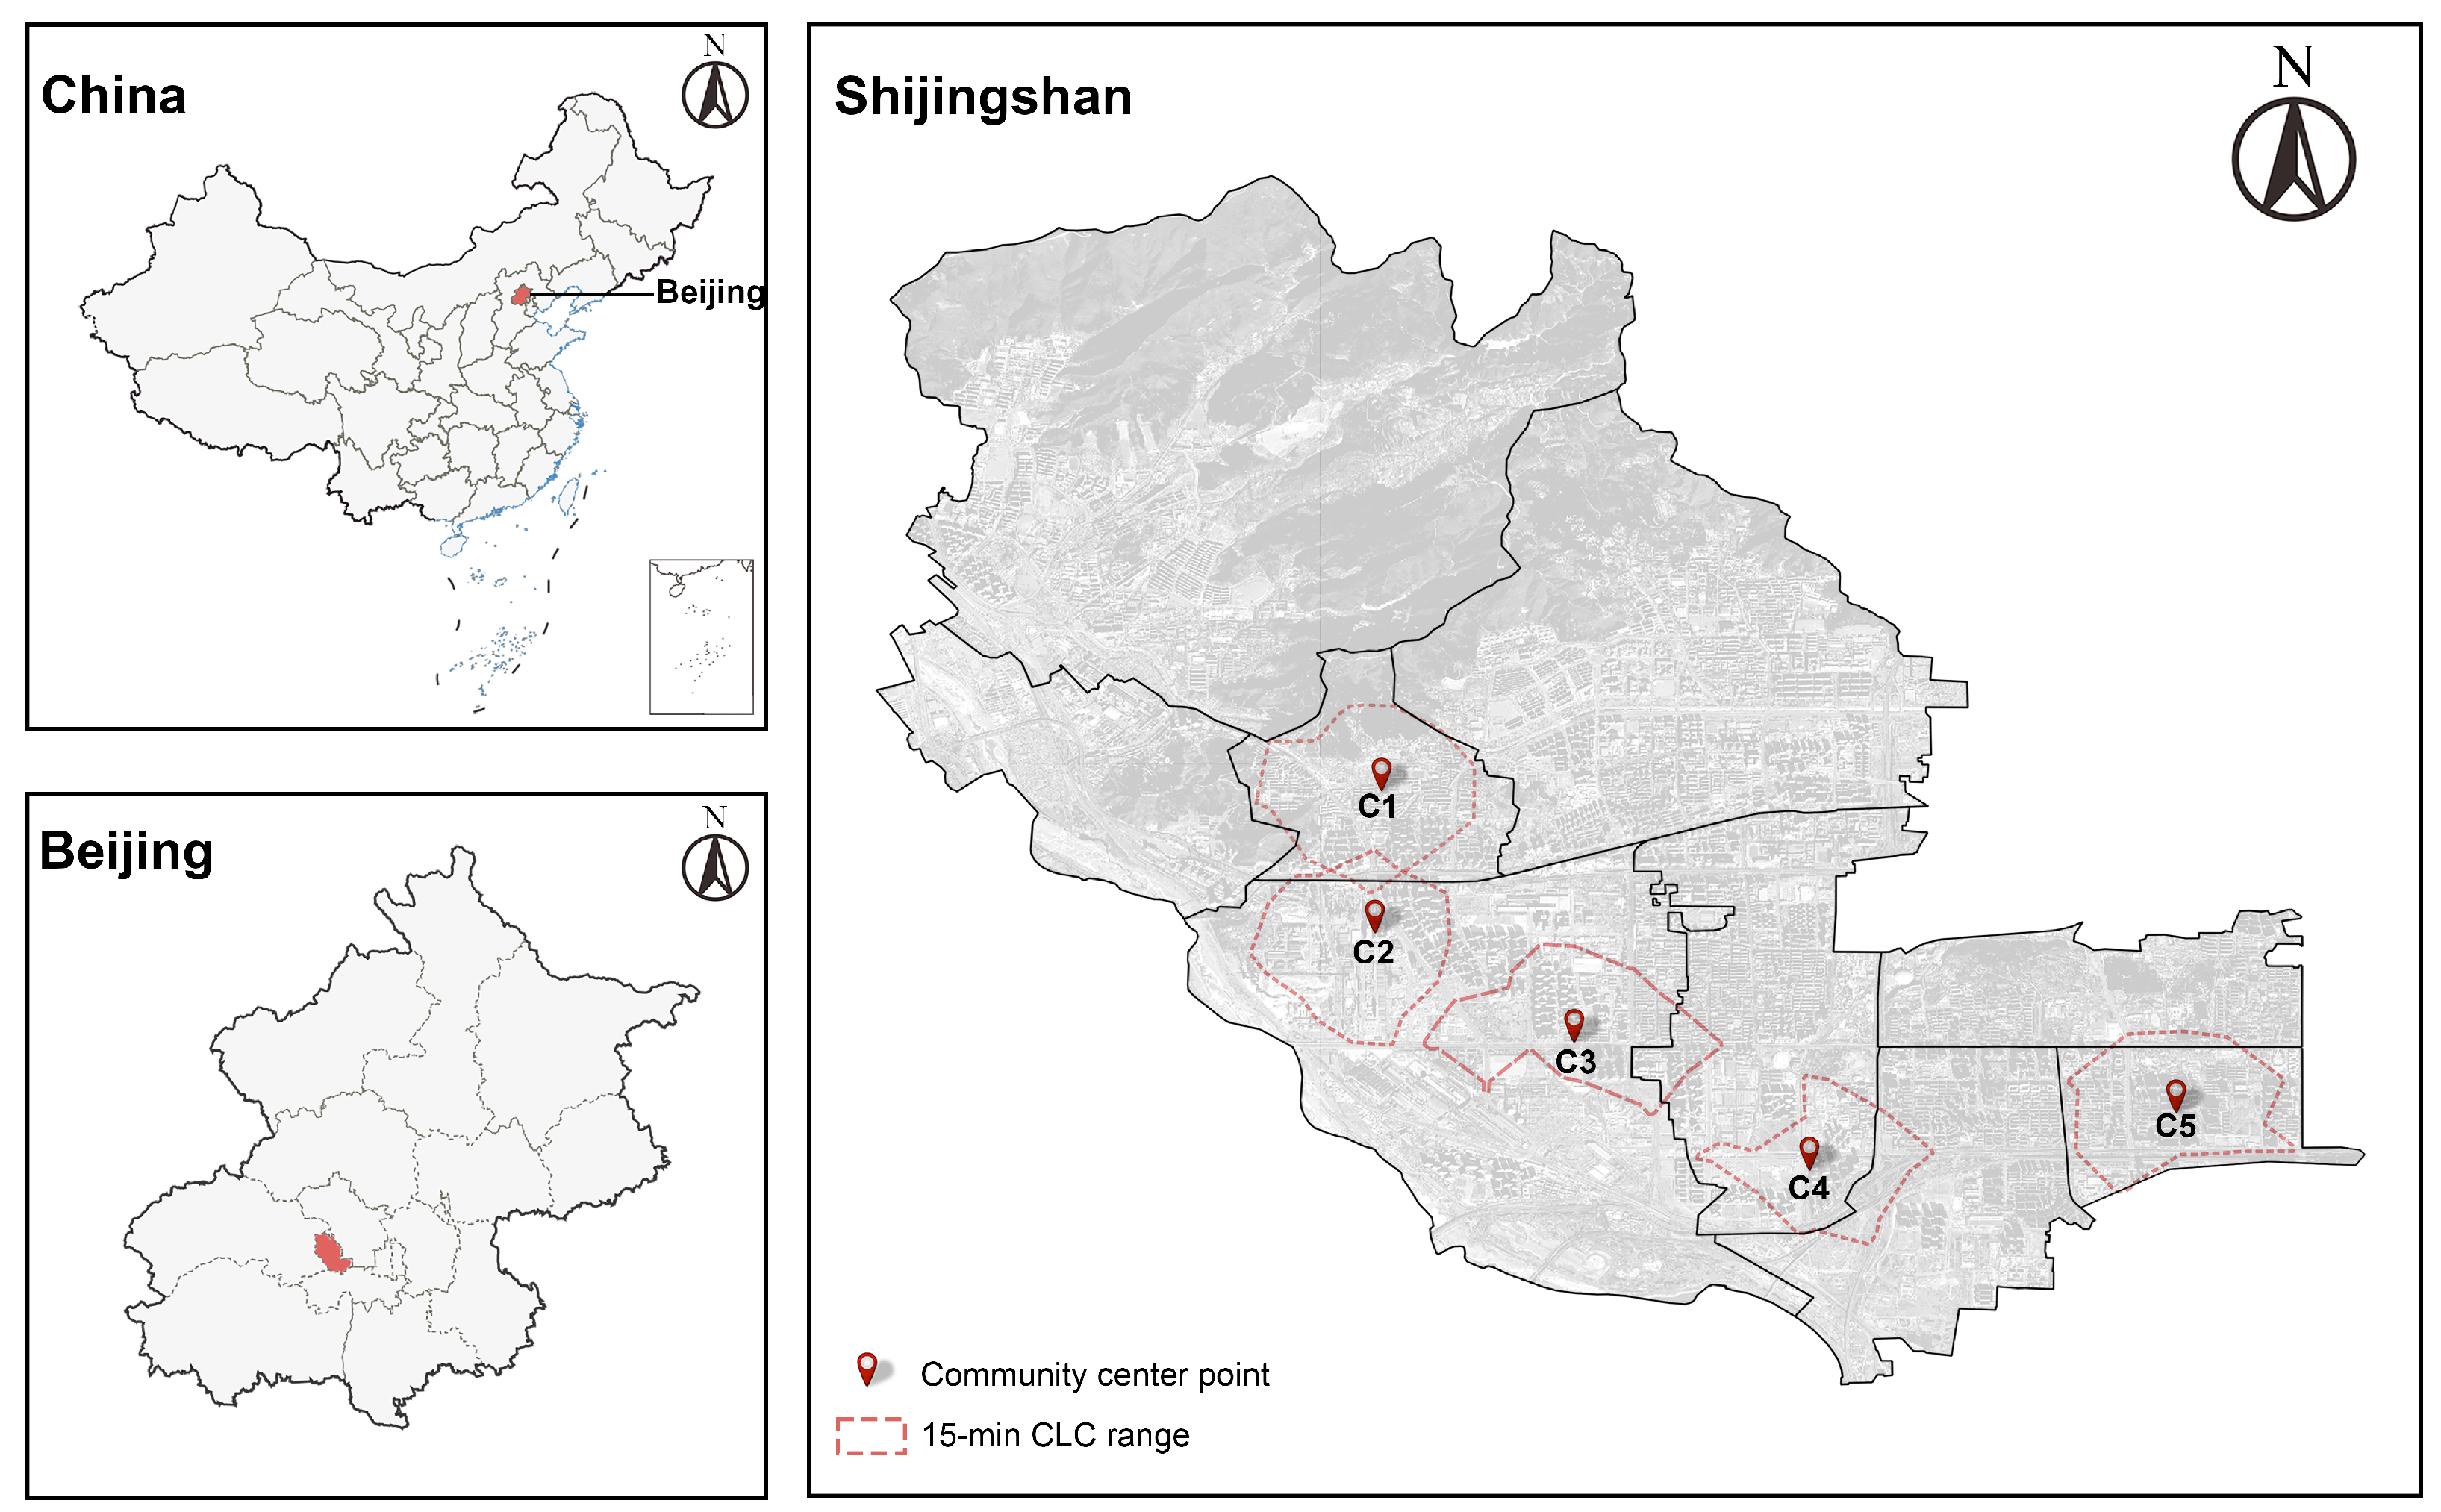
As the key industrial core in Beijing and one of the most famous mega industrial districts in Northern China, Shijingshan once hosted large enterprises such as Shougang and Shijingshan Power Plant [49], resulting in densely distributed industrial communities with a typical factory-residence mix. The district now serves as a benchmark case for large-scale industrial heritage transformation in China. By revitalizing industrial heritage and addressing issues such as spatial enclosure, functional monotony, and environmental legacy, the district aims to enhance residents’ walking experiences and overall community livability. This study selects five typical residential communities as the core study units: Yuanyang Shanshui, Wuli Chunqiu, Laogucheng Courtyard Area, Rongjingcheng Community, and the International Talent Community. These communities reflect diverse spatial types:
  • Yuanyang Shanshui represents a high-density built-up area;
  • Wuli Chunqiu exemplifies a low-density ecological neighborhood;
  • Laogucheng is a sample of an unrenovated, aging courtyard housing area;
  • Rongjingcheng showcases a newly developed high-quality residential compound;
  • International Talent Community represents a newly constructed neighborhood adjacent to an industrial park.
Together, these five communities span a wide spectrum of geographical distribution, morphological features, and functional conflicts, providing a typical and differentiated sample set for analyzing the spatial heterogeneity of walkability.

2.1.2. Analytical Framework

The research framework is illustrated in Figure 1. First, representative communities are selected as research units, and 15 min CLCs are constructed for each community using OSM pedestrian network data and a walking speed of 1.3 m/s through the shortest path algorithm to define the spatial scope. Second, four walkability dimensions are quantified, including accessibility (measuring the distance to key facilities within the CLCs using the shortest path based on cleaned and categorized POI data), diversity (assessed via the entropy index of POI functional mix), convenience (evaluated through road network and intersection density from OSM data), and safety (measured by sidewalk completeness and crossing facility coverage extracted via semantic segmentation of street view images collected at 100 m intervals). Finally, all dimension indicators are normalized to the [0–1] range using min-max normalization, and the Walkability Friendliness Index (WFI) for each community is calculated by weighted summation with weights assigned via the Analytic Hierarchy Process (AHP). The WFI results are then used to classify communities into different walkability levels to identify spatial differences.

2.2. Data Sources and Processing

A key data type for measuring the 15 min CLC is POI data, which reflect the spatial distribution of life-related service facilities in the urban context [47]. The original POI dataset was obtained from Gaode Map, a widely used mapping platform in mainland China. Following existing literature [50,51], we reclassified the raw POI dataset into six major categories based on functionality (i.e., Commercial services, Medical and health services, Educational and cultural facilities, Recreational and entertainment venues, Transportation facilities, Daily convenience services). During preprocessing, duplicate entries, invalid points, and POIs without geographic coordinates were removed to ensure data accuracy. To mitigate potential incompleteness of POI datasets (e.g., update lags or missing facilities), the cleaned data were cross-validated against government statistical yearbooks and official facility lists of Shijingshan District, while key public service facilities were further confirmed through sample field surveys. Table 1 provides details of the POI categories and their corresponding sub-categories.
Pedestrian road network data were sourced from the open platform OSM and extracted using the OSMnx library to generate walkable network maps. These were used to calculate road network density, intersection density, and to construct 15 min isochrone zones. Street view images were collected from the Baidu Street View platform. To ensure systematic and representative coverage, sampling points were set at 100 m intervals along the processed pedestrian road network. A total of 257, 191, 248, 231, and 187 valid street view images were collected for Wuli Chunqiu, International Talent Community, Laogucheng Courtyard Area, Rongjingcheng, and Yuanyang Shanshui, respectively. Using deep learning-based image recognition models, we extracted indicators such as sidewalk continuity and pedestrian crossing coverage to assess the visual safety and comfort of streets. The image sampling points were spatially matched to the road network nodes to ensure logical consistency in spatial analysis, and blurred or outdated scenes were eliminated through manual spot-checking. In total, 1114 valid street view images were collected across the five communities. Government statistics were obtained from the official website of Shijingshan District, including data on population, land use, and administrative boundaries. These were used to validate the spatial datasets and ensure adequate coverage. All data were unified in a GIS environment using consistent spatial projection, spatial matching, and vectorization procedures, laying the foundation for subsequent walkability accessibility analysis and WFI calculation.

2.3. Walkability Evaluation Indicator System

To comprehensively assess the pedestrian environment at the community scale, this study builds on international frameworks such as Walk Score [52,53], NEWS (Neighborhood Environment Walkability Scale) [54], and PERS (Pedestrian Environment Review System) [55,56]. Combined with the availability and quantifiability of big data, a multi-level walkability evaluation indicator system was developed. It consists of four primary dimensions—Accessibility, Convenience, Diversity, and Safety—and corresponding secondary indicators. Accessibility captures the ease with which residents can reach essential urban services, such as education, healthcare, and commercial facilities, within a 15 min walking distance. Diversity reflects the functional richness of the built environment, emphasizing the coexistence of multiple types of facilities that enable residents to satisfy daily needs locally. Convenience emphasizes the efficiency and continuity of the pedestrian network, measured through road and intersection density as proxies for connectivity and route choice. Safety focuses on the presence of pedestrian-supportive infrastructure, such as sidewalks and crossing facilities, that reduce walking risks and support a secure walking environment.
To assign weights, the AHP was adopted. This method allows for the systematic integration of expert knowledge into the weighting process by comparing the relative importance of each indicator in a pairwise fashion. Specifically, a group of 10 experts was invited to participate, including scholars in urban planning, transportation engineering, environmental psychology, and public health. Experts were selected based on two criteria: (1) participants were required to have a solid theoretical understanding of the AHP method and walkability research frameworks; and (2) prioritizing those with direct research or project experience in the study area (to ensure their judgments reflect the case community’s specific characteristics and practical needs) as well as professional or research experience in urban walkability and community planning. Each expert independently conducted pairwise comparisons using Saaty’s 1–9 scale, and their inputs were aggregated via the geometric mean. After passing the consistency check (CR < 0.1), the final weight distribution across each dimension and indicator was determined (Table 2).

2.4. Walkability Accessibility Analysis Method

This study evaluates residents’ walkable accessibility to daily life facilities by constructing 15 min CLCs based on real pedestrian road networks. Pedestrian street network data were extracted from OSM using the OSMnx (v2.0.6) Python library, which allows for detailed representation of walkable paths and intersections. For each of the five selected residential communities, the community centroid was used as the origin point. A walking speed of 1.3 m/s—consistent with prior studies on average adult walking speeds—was applied to set a 15 min time threshold, corresponding to a maximum walking distance of approximately 1170 m. A Dijkstra-based shortest-path algorithm was then used to identify all reachable nodes and edges within the threshold along the street network. The resulting walkable catchment areas provide a realistic simulation of the daily activity range for residents. On average, the radii of these walk zones were between 1.1 and 1.2 km, accounting for the spatial layout and connectivity of the urban street network.
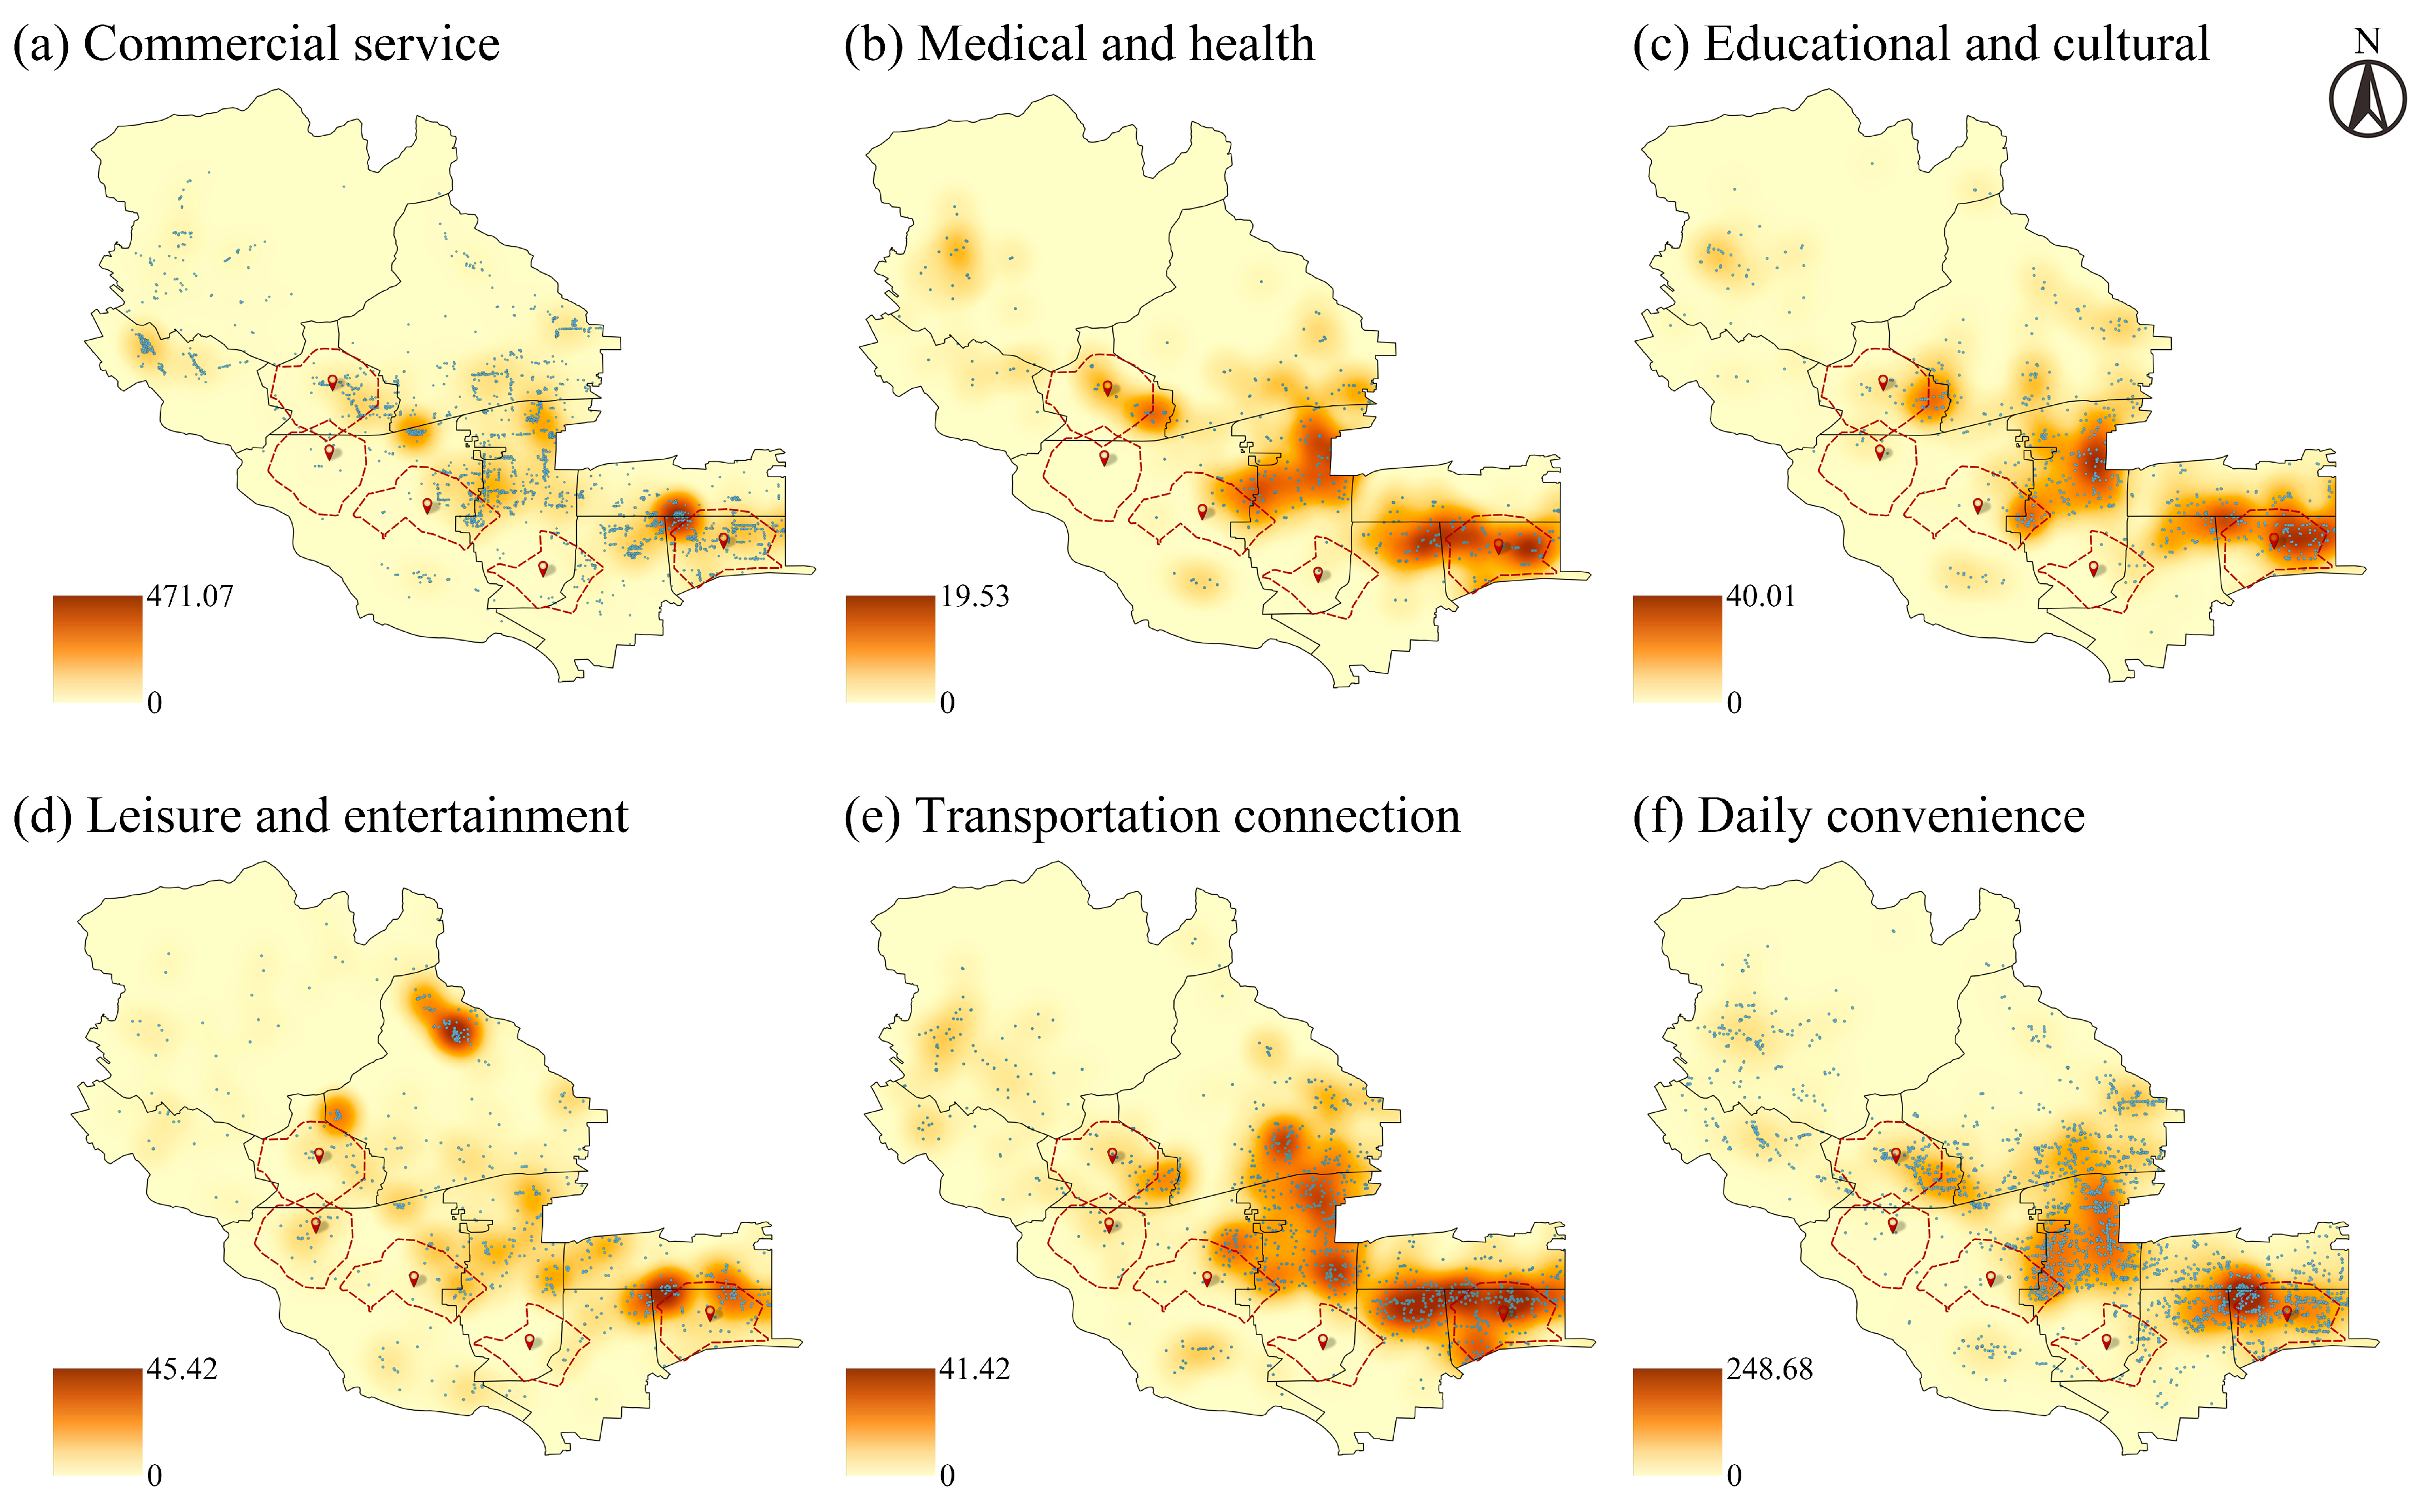
In the accessibility evaluation, the cleaned and functionally categorized POI data were spatially mapped within each isochrone. The number and density of different types of facilities were then calculated for each 15 min life circle. Furthermore, kernel density maps of POI distributions were generated through spatial overlay analysis, allowing for the identification of service blind spots and well-served zones within and along the boundaries of each isochrone.

2.5. Calculation Method of Walkability Friendly Index

To comprehensively reflect the overall quality of the pedestrian environment in each community, this study constructs a WFI by integrating multiple secondary indicators under four primary dimensions: Accessibility, Convenience, Diversity, and Safety. The WFI is a composite index newly proposed in this study, tailored to high-density urban contexts and developed in response to limitations observed in existing walkability measures such as Walk Score, PLOS, and Walk Index. While traditional indices often rely on fixed service categories or overlook localized pedestrian infrastructure, the WFI incorporates both functional accessibility (via POI data) and street-level physical environment features (extracted from semantic analysis of street view images), offering a more granular and context-sensitive representation of walkability. By combining data-driven indicators and expert-informed weighting through AHP, the WFI provides an adaptable framework that reflects actual walking conditions in diverse community settings.
First, all indicators were normalized to a [0–1] range using min–max normalization, ensuring comparability across different units. The normalization formula is as follows:
X i = X i X m i n X m a x X m i n
where X i is the normalized value of indicator i, and X m a x and X m i n are the minimum and maximum values of the indicator. The overall WFI score for each sample unit was then calculated using the weighted linear combination method:
W F I = i = 1 n w i · X i
where w i denotes the weight of indicator i , and X i is the corresponding normalized score. Based on the WFI results, communities were categorized into high, medium, and low walkability levels. This classification was used to identify spatial differentiation and inform targeted improvement strategies.
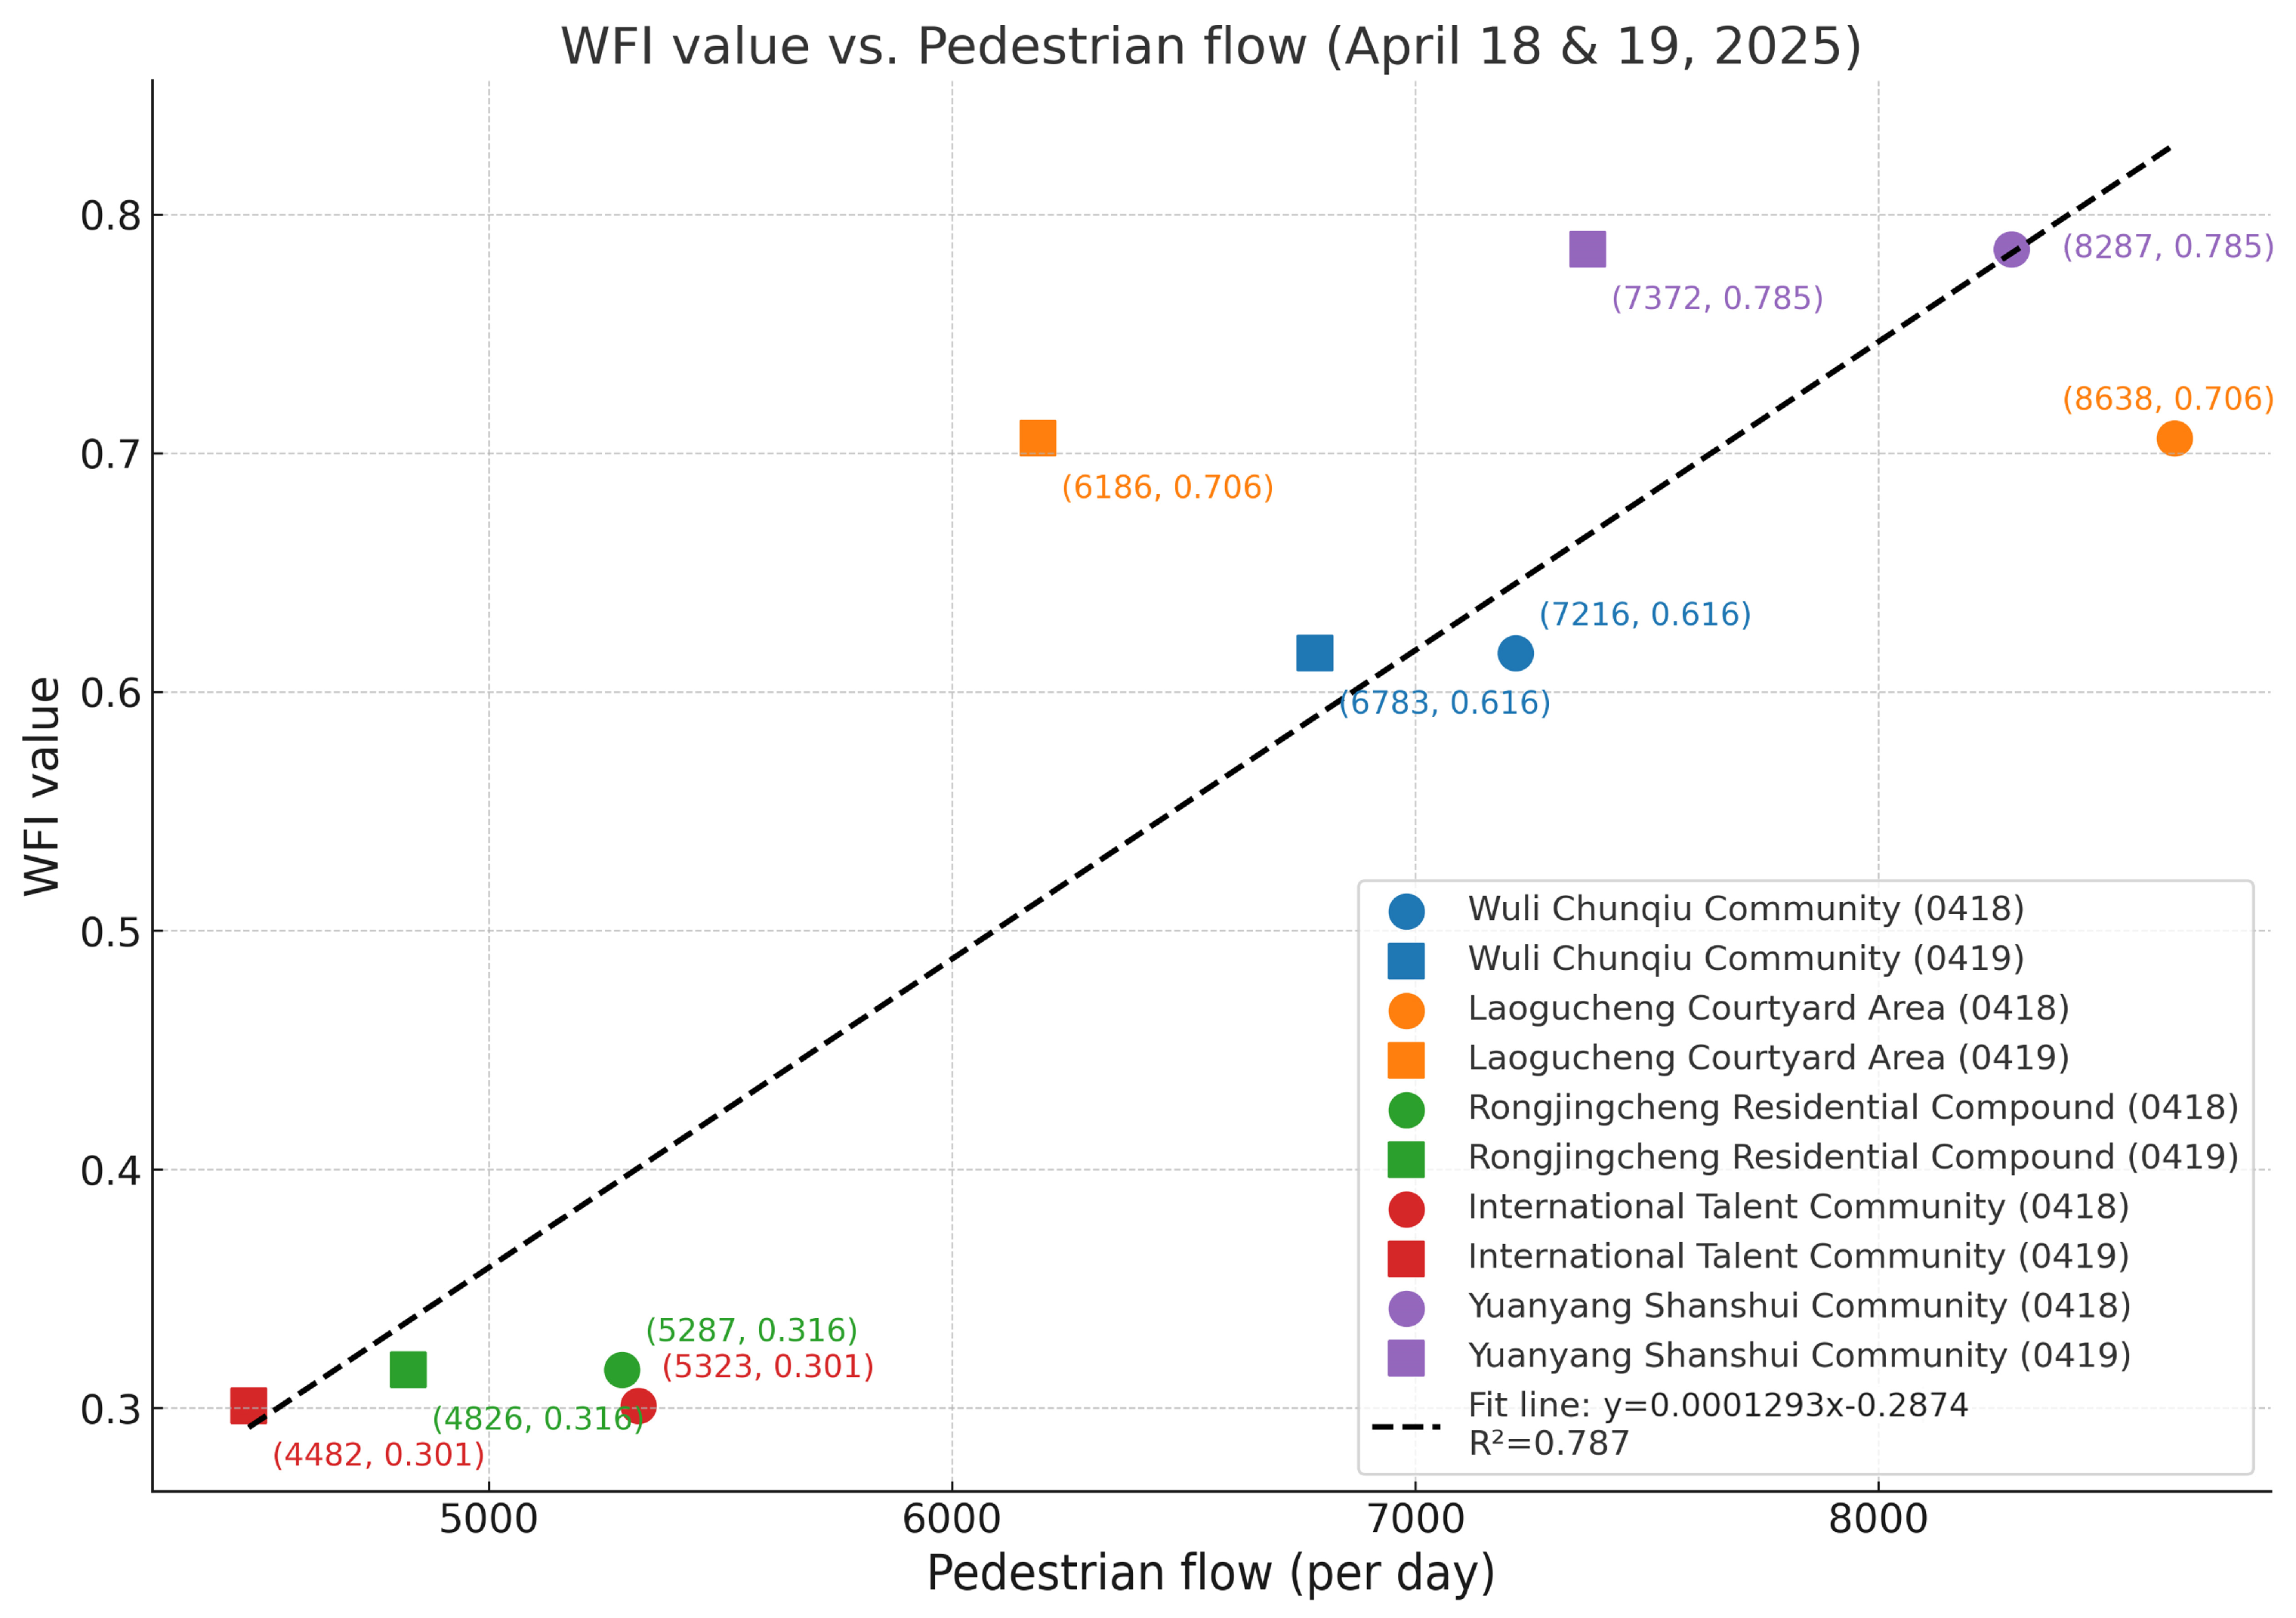
In order to verify the reliability of the proposed walkability evaluation model, we introduced pedestrian flow data derived from Baidu Huiyan heatmap as an external validation source. Specifically, two days were selected: 18 April 2025 (a weekday) and 19 April 2025 (a weekend day). The pedestrian flow totals of the five sample communities were extracted, and their relationship with the calculated WFI values was analyzed. This cross-check provided a basis for testing whether the model’s outputs correspond to actual population activity patterns.

3. Empirical Analysis: Measuring Community Walkability in Shijingshan District

3.1. Spatial Analysis of Walkable Accessibility

This study selects five representative communities in Beijing’s Shijingshan District as the core sample units for analysis: ① Wuli Chunqiu Community; ② International Talent Community; ③ Laogucheng Courtyard Area; ④ Rongjingcheng Residential Compound; ⑤ Yuanyang Shanshui Community. Based on the actual pedestrian road network and a preset average walking speed of 1.3 m/s, 15 min life circles were generated from the centroid of each community, as illustrated in Figure 2. These life circles provide an accurate simulation of residents’ daily walkable access to surrounding facilities and commuting range.
The statistics of POI categories within each life circle (Table 3) demonstrate distinct quantitative differences among communities. Yuanyang Shanshui Community shows the largest number of facilities across all categories, including 458 commercial services, 498 daily convenience services, and 121 educational facilities. Wuli Chunqiu Community records the lowest overall facility count, with particularly small numbers in transportation (26) and medical services (22). Laogucheng Courtyard Area, although centrally located, presents a relatively low facility density, with a modest concentration in education and daily convenience services (16 medical POIs). Rongjingcheng Residential Compound and International Talent Community, both newly developed neighborhoods, contain a comparatively limited range of supporting facilities due to their recency of construction.
From the POI kernel density maps (Figure 3), further spatial patterns can be observed: Yuanyang Shanshui exhibits a “composite core” distribution of service facilities, with high-density clusters located in the center and northern areas of the isochrone, closely associated with metro stations and large commercial complexes. Wuli Chunqiu Community shows overall low facility density, with a localized concentration in its southern residential area. However, the scattered distribution of educational and medical services results in limited practical accessibility. Laogucheng Courtyard Area, constrained by narrow streets, concentrates most facilities in the northeast corner, forming clear service gaps across the rest of the area. Rongjingcheng Residential Compound exhibits fragmented coverage and lacks integrated service clusters. International Talent Community, due to its specialized planning orientation, suffers from a severe shortage of public service facilities and demonstrates the lowest overall accessibility among the samples.
In summary, the comparative analysis indicates that Yuanyang Shanshui currently provides the highest overall walkable accessibility, while Laogucheng retains a moderate level with uneven spatial distribution. Wuli Chunqiu exhibits low accessibility relative to its ecological scale, and both Rongjingcheng and International Talent Community show weak accessibility levels linked to their development stage.

3.2. WFI Results and Analysis

The WFI was calculated across the four dimensions of Accessibility, Diversity, Convenience, and Safety. The results (Table 4) reveal clear inter-community differences. Yuanyang Shanshui achieves the highest total WFI score (0.7853), with particularly strong performance in Accessibility (0.7400) and Diversity (0.8775). Wuli Chunqiu obtains a relatively high Diversity score (0.8303), but its Accessibility (0.5519) and Convenience (0.4520) remain comparatively low. Laogucheng Courtyard Area presents balanced values overall, though its Safety score (0.4500) is notably weaker. Rongjingcheng reports low values across all dimensions, with Safety (0.5400) being its only moderately strong indicator. International Talent Community has the lowest overall score (0.3010), with all four dimensions reflecting limited walkability. These results confirm that Yuanyang Shanshui ranks as the most walkable community among the sample set. Laogucheng maintains a middle-level walkability profile, while Wuli Chunqiu combines relatively strong functional diversity with low accessibility and convenience. Rongjingcheng and International Talent Community, as newly developed or specialized neighborhoods, currently show the weakest walkability performance.
The analysis showed a strong positive correlation between pedestrian flow and WFI values. Pearson correlation results indicated r = 0.887, p < 0.001, with an explained variance of approximately R2 = 0.787. Figure 4 illustrates the scatter plot of WFI values against pedestrian flow for the five sample communities across two days. Each community is represented with distinct colors, and the fitted regression line highlights the positive trend. These results indicate that communities with higher pedestrian flows tend to exhibit higher WFI values, aligning closely with the dimensional analysis. For example, Yuanyang Shanshui, which scored the highest in Accessibility and Diversity, also attracted the largest pedestrian flows, validating its superior walkability. By contrast, International Talent Community and Rongjingcheng, with consistently low WFI values, reported the lowest population flows, confirming the weak walkability of newly developed or specialized neighborhoods. This convergence between modeled WFI scores and empirical pedestrian data supports the reliability and explanatory power of the proposed model.

3.3. Spatial Differentiation Patterns

Communities in Shijingshan District exhibit significant spatial disparities in walkability. Yuanyang Shanshui, located in the urban core, demonstrates a notably higher WFI than the peripheral Wuli Chunqiu community, forming a distinct “center–periphery” gradient that reflects imbalances in spatial resource allocation. Areas characterized by the clustering of facilities—such as commercial complexes and metro stations—show markedly better walkability performance than those with dispersed functions, underscoring the decisive role of functional agglomeration in shaping walking-friendly environments.
Communities developed in different eras exhibit varying limitations. In aging neighborhoods like Laogucheng, although centrally located, narrow alleyways and outdated functions constrain overall walkability. Conversely, newly developed areas such as Rongjingcheng suffer from mismatches between residential development and supporting infrastructure, falling into a “development gap period” where functional monotony prevails due to delayed road and service construction. Specialized communities also face functional segregation; for instance, the International Talent Community, despite offering high-end amenities, provides mostly exclusive public services and lacks open, inclusive pedestrian spaces, thereby diminishing the quality of public walking experiences.
It is worth noting that ecological advantages do not necessarily translate into walkability benefits. Wuli Chunqiu, though abundant in green spaces, suffers from a lack of basic life services, leading to deficiencies in both accessibility and functional diversity. This highlights the need for ecological assets to be synergized with everyday service functions to generate true pedestrian value.
These spatial characteristics provide precise targets for optimization and emphasize that the construction of 15 min CLC must balance functional integration, spatial accessibility, and environmental perception. Moving forward, differentiated strategies should be adopted for different community types: bridging the “growth deficits” of new developments, addressing the “historical debts” of old neighborhoods, and avoiding the “functional isolation traps” of high-end communities. A coordinated enhancement of walkability can be achieved through public resource supplementation and the fine-grained stitching of pedestrian networks.

4. Discussion

Based on the empirical assessment of walkability across five representative communities in Shijingshan District, both the disparities and commonalities in pedestrian environments have become increasingly apparent. By probing the underlying causes, this section systematically identifies the key issues and proposes targeted optimization strategies, providing a scientific foundation for community micro-renewal and policy formulation in the district.

4.1. Existing Problems in the Walking Environment

The current walking environment in Shijingshan’s communities exhibits four major issues:
(1)
Functional Monotony and Service Gaps in Facility Distribution: The Wuli Chunqiu community, although rich in greenery, suffers from a severe shortage of essential service facilities within its 15 min isochrone. Specifically, there are only 32 educational POIs and 22 medical POIs, in stark contrast to Yuanyang Shanshui, which has 121 educational and 65 medical POIs. This reflects a prominent contradiction between “ecological priority and lacking amenities.” Although the Laogucheng courtyard district performs slightly better in terms of educational and convenience facilities, it has only 16 medical POIs and 41 transportation POIs, with most resources concentrated in the northeast, leaving the southwest area nearly as a “service void.” While Yuanyang Shanshui is generally well-equipped, some peripheral buildings are spatially separated from the commercial core, requiring residents to walk significantly longer distances for comparable services. Rongjingcheng presents a highly homogeneous land use pattern, forcing residents to rely on distant services for basic needs such as shopping and medical care, resulting in a fragmented pedestrian life circle.
(2)
Street Network Fragmentation and Poor Connectivity: The bungalow area in Laogucheng follows the traditional hutong pattern [57]. Though it appears to have a regular grid layout, in reality, some hutong entrances are blocked by courtyard walls or have even vanished, forcing pedestrians to detour hundreds of meters to reach adjacent blocks, which significantly reduces travel efficiency. While Wuli Chunqiu’s street layout appears orderly, internal roads lack effective linkage with external arterials. Greenbelts and fences separate the neighborhood from surrounding streets, restricting access to only a few fixed gates and preventing the formation of a truly interconnected pedestrian network. In Rongjingcheng, numerous discontinuities between internal roads and major arterials mean that residents must detour 1.2 km to reach the nearest metro station.
(3)
Inadequate Crosswalk Facilities and Safety Hazards: The lack of pedestrian infrastructure further exacerbates uncertainty in the walking experience. In Laogucheng, many main roads lack crosswalks or pedestrian signals, increasing the risk of traffic collisions—especially at night or during inclement weather—due to poor street lighting and damaged road surfaces. In Wuli Chunqiu, the absence of physical separation between sidewalks and motorways leads to frequent pedestrian–nonmotor vehicle conflicts. Moreover, the lack of anti-slip features causes icy surfaces in winter, increasing the risk of falls. Although pedestrian islands exist along Yuanyang Shanshui’s commercial streets, intersections within the residential area experience serious pedestrian–vehicle mixing, insufficient lighting, and unclear signage. These issues collectively compromise nighttime safety, especially during rush hours or holidays.
(4)
Enclosed Boundaries and Deficiency of Public Spaces in Aging Communities: Rigid spatial enclosures and a lack of public spaces pose significant obstacles to community vibrancy. In both Laogucheng and Wuli Chunqiu, enclosed management systems restrict entry to only one or two fixed gates. Residents must detour around large perimeter walls to access main roads, compressing pedestrian movement within the blocks. Furthermore, the absence of open plazas or pocket parks means that daily social and recreational needs are unmet. Although Yuanyang Shanshui features a central commercial square, it primarily serves shoppers and offers limited benefits to residents in peripheral buildings. As a result, community vibrancy is overly concentrated in the core, leaving the outer zones lacking in appeal.

4.2. Optimization Strategy Recommendations

To address the aforementioned issues, it is essential to advance in a coordinated manner across four key dimensions—enhancing community accessibility, diversifying service provision, improving streetscape safety, and implementing differentiated governance. These efforts aim to achieve both short-term improvements and long-term sustainable development.
Enhancing Accessibility: Improving accessibility is critical to resolving street fragmentation and poor road network connectivity [58]. In the Old City Courtyard Area, basic street lighting and surveillance cameras are proposed to enhance safety during nighttime travel. Wuli Chunqiu Community should add new pedestrian entrances to link the community center with surrounding secondary roads, while installing shared bicycle racks, bulletin boards, and benches at key nodes to create multifunctional “community stations” that integrate people, mobility, and information. In Yuanyang Shanshui Community, pedestrian barriers and zebra crossings have been added at intersections of secondary and arterial roads. Barrier-free upgrades have been implemented for areas with steps or excessive slopes, including flush ramps and tactile paving to ensure safe passage for all users. Rongjingcheng and the International Talent Community should accelerate surrounding road construction and upgrade crossings, signals, and lighting to improve walkability and safety.
Diversifying Services: To enhance service diversity, emphasis is placed on improving basic infrastructure and introducing cultural, recreational, and sports facilities. In the Old City Courtyard Area, a one-stop convenience center integrating clinics, reading and game rooms can be established, while fragmented vacant land can be converted into pocket parks and fitness stations to meet residents’ needs for exercise and social interaction. Rongjingcheng and the International Talent Community should prioritize the rapid introduction of essential life-support services within their 15 min CLC, while repurposing underutilized plots into cultural and recreational facilities, and peripheral squares with illuminated running tracks and mobile stages that can host outdoor performances and nighttime events, thereby enhancing functional diversity, promoting cross-community interaction, and distributing community vitality more evenly.
Improving Streetscape Safety: Streetscape safety is a fundamental prerequisite for creating pedestrian-friendly environments [59,60]. In both the Old City Courtyard Area and Wuli Chunqiu Community, street lighting and pavement safety have been systematically upgraded. Energy-efficient LED streetlights with integrated smart sensors have been installed along major streets and alleyways to automatically adjust brightness based on pedestrian presence. In the Old City area, regular pruning of roadside trees ensures visibility and adequate lighting, while in Wuli Chunqiu, vertical greenery and climbing plants have been introduced along fences and greenbelts to improve aesthetics and mitigate noise. Across all communities, sidewalks have been comprehensively inspected to eliminate cracks, potholes, and drainage issues. Paving has been standardized with permeable and anti-slip materials, and accessibility improvements have been made at curb ramps and pathway junctions to ensure barrier-free movement.
Implementing Differentiated Strategies: Communities are divided into “key optimization zones” and “balanced improvement zones” based on their respective challenges and priorities. Peripheral secondary roads in the Wuli Chunqiu Community and the northeast–southwest fault corridor of the Old City area are identified as key optimization zones. These zones focus on road network reconnection, infrastructure enhancements, and safety facility upgrades. Residents are invited to participate in “walking experience surveys” to provide feedback and refine planning strategies [59]. Meanwhile, the peripheral blocks of Yuanyang Shanshui and the central alleyways of the Old City are designated as balanced improvement zones, where micro-renovation projects will update paving, reintroduce greenery, and install smart lighting and anti-slip materials to incrementally enhance walkability.
At the same time, low-cost and quick-win interventions (such as lighting upgrades, the addition of pedestrian entrances, and pocket parks) should be prioritized for immediate implementation. Medium-cost strategies (such as community farmers’ markets and convenience service centers) require coordination between municipal funding and local committees and are thus more suitable for phased introduction. High-cost strategies (such as large-scale road network reconnection or district-wide LED retrofits) should be incorporated into long-term urban renewal programs. A preliminary cost–benefit assessment suggests prioritizing interventions that yield significant improvements in walkability while imposing relatively low fiscal burdens, thereby ensuring both efficiency and sustainability.
Drawing on international experiences of post-industrial neighborhood regeneration, the proposed strategies exhibit notable commonalities and comparability. In Liverpool and the Ruhr area, for instance, the enhancement of street lighting, pedestrian networks, and public space design has improved both safety and comfort for residents [61]. Similarly, in Japan, regeneration efforts in post-industrial districts have emphasized barrier-free design and pedestrian-oriented principles to safeguard mobility rights across different population groups [62]. In smaller post-industrial American cities such as Lawrence, Massachusetts, and Flint, Michigan, a holistic approach to housing revitalization combined with the introduction of community services has significantly enhanced residents’ quality of life [63]. However, international experiences also demonstrate that an overemphasis on economic growth and land development objectives can lead to social exclusion and the erosion of local cultural identity. In some Central and Eastern European contexts, speculative redevelopment has resulted in large-scale demolitions and the fragmentation of communities [62]. Therefore, in advancing community regeneration, China should avoid repeating the pitfall of focusing solely on economic indicators and instead place greater emphasis on social equity, cultural continuity, and the preservation of community identity.

5. Conclusions

This study developed a multi-source data–driven framework to evaluate walkability within 15 min CLCs and applied it to five representative communities in Beijing’s Shijingshan District. The results highlight significant variations in walkability across different community types: Yuanyang Shanshui ranks as highly walkable, due to its high degree of functional mix, well-connected road network, and strong street-level safety. Old Gucheng Courtyard shows moderate walkability, constrained by aging alleyways and safety risks. Wuli Chunqiu exhibits the contradiction of “ecological advantage but lacking infrastructure,” while Rongjingcheng and the International Talent Community face walkability challenges stemming from either delayed development or functionally exclusive planning.
Methodologically, this study constructs a WFI to comprehensively capture the overall quality of the pedestrian environment in each community by integrating multiple secondary indicators across four primary dimensions: accessibility, convenience, diversity, and safety. Compared with conventional approaches relying on single indicators or subjective surveys, this framework enables a multidimensional evaluation that captures both macro-level spatial structures and micro-level pedestrian experiences. It therefore provides a replicable and visualized paradigm for studying walkability in post-industrial communities. Practically, the findings offer data-driven support and actionable policy insights for urban planning, with particular relevance to the design of 15 min community life circles, the development of green transport systems, and street-level renewal initiatives. By pinpointing context-specific strengths and deficiencies across study areas, this research proposes targeted intervention strategies—ranging from infrastructure supplementation in underserved zones to the replication of successful practices from high-performing communities. Such recommendations not only provide valuable guidance for domestic urban renewal efforts but also hold implications for post-industrial regeneration endeavors in international contexts.
Nevertheless, this study has certain limitations. First, the semantic segmentation of street view images may encounter recognition errors under complex visual conditions. Moreover, safety is also influenced by external factors such as lighting conditions and safety signage, which were not fully captured in this study. Future research should place greater emphasis on subjective experiences—such as perceived comfort and safety—to better account for micro-level differences in pedestrian environments. Furthermore, the current WFI model does not account for dynamic spatiotemporal factors such as holidays, extreme weather, or large-scale events, weakening its responsiveness to environmental changes.
To address these limitations, future studies could expand in several directions. Priority should be given to participatory approaches such as community walking tours and structured interviews, which integrate residents’ subjective perceptions into the analytical framework. Building on this, VR simulations may be introduced to capture immersive evaluations and strengthen the connection between objective indicators and experiential data. Subsequently, incorporating temporal dynamics—such as holidays, construction activities, and weather events—into WFI calculations, together with IoT sensors and big data platforms, could enable real-time monitoring of pedestrian flows and environmental quality, providing fine-grained, time-sensitive evidence to support the continuous optimization of walkable communities.

Author Contributions

Conceptualization, X.X., X.H. and B.Z.; methodology, X.X., X.H. and Y.W.; software, X.X.; validation, X.H., X.X. and Y.W.; formal analysis, X.X.; investigation, R.W. and X.X.; resources, Y.W. and X.H.; data curation, D.L. and X.X.; writing—original draft preparation, X.X.; writing—review and editing, X.H., B.Z., M.W. and Y.W.; visualization, X.X. and R.W.; supervision, X.H., B.Z. and D.L.; project administration, X.H., M.W. and B.Z.; funding acquisition, X.H., M.W. and D.L. All authors have read and agreed to the published version of the manuscript.

Funding

This research is supported by the National Natural Science Foundation of China (52208039), the Beijing Social Science Foundation (No. 23SRC024), and Beijing Urban Governance Research Base Open Funding (2025CSZL13). We also acknowledge the contribution in data collection from students who participated in the College Students’ Innovative Entrepreneurial Training Plan Program.

Data Availability Statement

The original contributions presented in this study are included in the article. Further inquiries can be directed to the corresponding author.

Conflicts of Interest

The authors declare no conflicts of interest.

Abbreviations

The following abbreviations are used in this manuscript:
15 min CLC15-minute community life circle
POIPoint of Interest
WFIWalkability Friendliness Index
TODTransit-Oriented Development
AHPAnalytic Hierarchy Process
OSMOpenStreetMap
WHOWorld Health Organization
SDGsSustainable Development Goals

References

  1. Lai, Y.; Chen, K.; Zhang, J.; Liu, F. Transformation of Industrial Land in Urban Renewal in Shenzhen, China. Land 2020, 9, 371. [Google Scholar] [CrossRef]
  2. Krasuski, S. Development and Revitalization of Industrial Areas. Econ. Reg. Stud. Stud. Ekon. I Reg. 2020, 13, 452–460. [Google Scholar] [CrossRef]
  3. Caignet, A. Reinventing and Promoting Northern Industrial Heritage: Regeneration in the Textile Sites of Ancoats and Saltaire. Rev. Française Civilis. Br. 2020, XXV-2. [Google Scholar] [CrossRef]
  4. Sun, M.; Chen, C. Renovation of Industrial Heritage Sites and Sustainable Urban Regeneration in Post-Industrial Shanghai. J. Urban Aff. 2023, 45, 729–752. [Google Scholar] [CrossRef]
  5. Wu, Y.; Liu, Y. Transforming Industrial Waterfronts into Inclusive Landscapes: A Project Method and Investigation of Landscape as a Medium for Sustainable Revitalization. Sustainability 2023, 15, 5060. [Google Scholar] [CrossRef]
  6. Liu, Y.; Li, J.; Yang, Y. Strategic Adjustment of Land Use Policy under the Economic Transformation. Land Use Policy 2018, 74, 5–14. [Google Scholar] [CrossRef]
  7. Cysek-Pawlak, M.M.; Pabich, M. Walkability—The New Urbanism Principle for Urban Regeneration. J. Urban. Int. Res. Placemaking Urban Sustain. 2021, 14, 409–433. [Google Scholar] [CrossRef]
  8. Giles-Corti, B.; Moudon, A.V.; Lowe, M.; Adlakha, D.; Cerin, E.; Boeing, G.; Higgs, C.; Arundel, J.; Liu, S.; Hinckson, E.; et al. Creating Healthy and Sustainable Cities: What Gets Measured, Gets Done. Lancet Glob. Health 2022, 10, e782–e785. [Google Scholar] [CrossRef]
  9. Giles-Corti, B.; Moudon, A.V.; Lowe, M.; Cerin, E.; Boeing, G.; Frumkin, H.; Salvo, D.; Foster, S.; Kleeman, A.; Bekessy, S.; et al. What next? Expanding Our View of City Planning and Global Health, and Implementing and Monitoring Evidence-Informed Policy. Lancet Glob. Health 2022, 10, e919–e926. [Google Scholar] [CrossRef]
  10. Krellenberg, K.; Bergsträßer, H.; Bykova, D.; Kress, N.; Tyndall, K. Urban Sustainability Strategies Guided by the SDGs—A Tale of Four Cities. Sustainability 2019, 11, 1116. [Google Scholar] [CrossRef]
  11. Glazener, A.; Khreis, H. Transforming Our Cities: Best Practices Towards Clean Air and Active Transportation. Curr. Environ. Health Rep. 2019, 6, 22–37. [Google Scholar] [CrossRef] [PubMed]
  12. Baobeid, A.; Koç, M.; Al-Ghamdi, S.G. Walkability and Its Relationships with Health, Sustainability, and Livability: Elements of Physical Environment and Evaluation Frameworks. Front. Built Environ. 2021, 7, 721218. [Google Scholar] [CrossRef]
  13. Southworth, M. Designing the Walkable City. J. Urban Plan. Dev. 2005, 131, 246–257. [Google Scholar] [CrossRef]
  14. Rafiemanzelat, R.; Emadi, M.I.; Kamali, A.J. City Sustainability: The Influence of Walkability on Built Environments. Transp. Res. Procedia 2017, 24, 97–104. [Google Scholar] [CrossRef]
  15. Bruno, M.; Melo, H.P.M.; Campanelli, B.; Loreto, V. A Universal Framework for Inclusive 15-Minute Cities. Nat. Cities 2024, 1, 633–641. [Google Scholar] [CrossRef]
  16. Zhang, S.; Zhen, F.; Kong, Y.; Lobsang, T.; Zou, S. Towards a 15-Minute City: A Network-Based Evaluation Framework. Environ. Plan. B Urban Anal. City Sci. 2023, 50, 500–514. [Google Scholar] [CrossRef]
  17. Li, C.; Xia, W.; Chai, Y. Delineation of an Urban Community Life Circle Based on a Machine-Learning Estimation of Spatiotemporal Behavioral Demand. Chin. Geogr. Sci. 2021, 31, 27–40. [Google Scholar] [CrossRef]
  18. Huang, J.; Obracht-Prondzynska, H.; Kamrowska-Zaluska, D.; Sun, Y.; Li, L. The Image of the City on Social Media: A Comparative Study Using “Big Data” and “Small Data” Methods in the Tri-City Region in Poland. Landsc. Urban Plan. 2021, 206, 103977. [Google Scholar] [CrossRef]
  19. Zhang, L.; Ye, Y.; Zeng, W.; Chiaradia, A. A Systematic Measurement of Street Quality through Multi-Sourced Urban Data: A Human-Oriented Analysis. Int. J. Environ. Res. Public Health 2019, 16, 1782. [Google Scholar] [CrossRef]
  20. Song, Y.; Lee, K.; Anderson, W.P.; Lakshmanan, T.R. Industrial Agglomeration and Transport Accessibility in Metropolitan Seoul. J. Geogr. Syst. 2012, 14, 299–318. [Google Scholar] [CrossRef]
  21. Caselli, B.; Carra, M.; Rossetti, S.; Zazzi, M. Exploring the 15-Minute Neighbourhoods. An Evaluation Based on the Walkability Performance to Public Facilities. Transp. Res. Procedia 2022, 60, 346–353. [Google Scholar] [CrossRef]
  22. Garofoli, G. Industrial Districts in Europe: Lessons for Industrial Hubs and Industrialization. In The Oxford Handbook of Industrial Hubs and Economic Development; Oxford Academic: Oxford, UK, 2020. [Google Scholar]
  23. Walkable Environment in Increasing the Liveability of a City. Procedia Soc. Behav. Sci. 2012, 50, 167–178. [CrossRef]
  24. Bass, B.J.; Livingston, M. Automotive Retrofits in Historic City Centres and Their Potential Effects on Their Walkability: A Comparison of San Luis Obispo, CA, USA and Bath, England, UK. J. Urban Des. 2019, 24, 290–304. [Google Scholar] [CrossRef]
  25. Huang, Z.; Wang, B.; Luo, S.; Wang, M.; Miao, J.; Jia, Q. Integrating Streetscape Images, Machine Learning, and Space Syntax to Enhance Walkability: A Case Study of Seongbuk District, Seoul. Land 2024, 13, 1591. [Google Scholar] [CrossRef]
  26. Liu, Z.; Huang, Z.; Yin, Z.; Zhang, L. Urban Regeneration under National Land Use Control: Guangdong’s “Three-Old” Redevelopment Programme. China Q. 2024, 258, 441–456. [Google Scholar] [CrossRef]
  27. Gao, J. Spatial Restructuring and the Logic of Industrial Land Redevelopment in Urban China: IV. A Case Study of Jointly Redevelopment by Multi-Actors. Reg. Sustain. 2023, 4, 44–53. [Google Scholar] [CrossRef]
  28. Han, C.; Song, Y.; Zhao, Y. An Evaluation Study on Tourists’ Environmental Satisfaction after Re-Use of Industrial Heritage Buildings. Sustainability 2024, 16, 3032. [Google Scholar] [CrossRef]
  29. Chen, L. Industrial Legacy and Urban Regeneration: Transformation of Industrial Zones into Cultural and Creative Spaces. J. Urban Plan. Dev. 2025, 151, 04025010. [Google Scholar] [CrossRef]
  30. Xia, J.; Wang, S.; Cheng, A. Industrial Heritage and Urban Renewal: A Quantitative Study and Optimization Strategies for Chengdu East Suburb Memory. Front. Environ. Sci. 2025, 13, 1537211. [Google Scholar] [CrossRef]
  31. Wang, L.; Han, X.; He, J.; Jung, T. Measuring Residents’ Perceptions of City Streets to Inform Better Street Planning through Deep Learning and Space Syntax. ISPRS J. Photogramm. Remote Sens. 2022, 190, 215–230. [Google Scholar] [CrossRef]
  32. Zhang, Y.; Zou, Y.; Zhu, Z.; Guo, X.; Feng, X. Evaluating Pedestrian Environment Using DeepLab Models Based on Street Walkability in Small and Medium-Sized Cities: Case Study in Gaoping, China. Sustainability 2022, 14, 15472. [Google Scholar] [CrossRef]
  33. Pozoukidou, G.; Chatziyiannaki, Z. 15-Minute City: Decomposing the New Urban Planning Eutopia. Sustainability 2021, 13, 928. [Google Scholar] [CrossRef]
  34. Zang, Y.; Wang, H.; Huang, J.; Liu, G.; Li, J. Community Disaster Resilience Assessment and External Association Characteristics Analysis Based on Accessibility of Service Facilities: From the Perspective of 15-Minute Life Circle. Sustain. Cities Soc. 2025, 118, 106051. [Google Scholar] [CrossRef]
  35. Moreno, C.; Allam, Z.; Chabaud, D.; Gall, C.; Pratlong, F. Introducing the “15-Minute City”: Sustainability, Resilience and Place Identity in Future Post-Pandemic Cities. Smart Cities 2021, 4, 93–111. [Google Scholar] [CrossRef]
  36. Thornton, L.E.; Schroers, R.-D.; Lamb, K.E.; Daniel, M.; Ball, K.; Chaix, B.; Kestens, Y.; Best, K.; Oostenbach, L.; Coffee, N.T. Operationalising the 20-Minute Neighbourhood. Int. J. Behav. Nutr. Phys. Act. 2022, 19, 15. [Google Scholar] [CrossRef]
  37. Yang, C.; Qian, Z. The New Paradigm of Future Cities? Facilitating Dialogues between the 15-Minute City and the 15-Minute Life Circle in China Based on a Bibliometric Analysis. Trans. Plan. Urban Res. 2024, 3, 294–312. [Google Scholar] [CrossRef]
  38. Jiao, H.; Xiao, M. Delineating Urban Community Life Circles for Large Chinese Cities Based on Mobile Phone Data and POI Data—The Case of Wuhan. ISPRS Int. J. Geo-Inf. 2022, 11, 548. [Google Scholar] [CrossRef]
  39. Tan, R.; Wu, Y.; Zhang, S. Walking in Tandem with the City: Exploring the Influence of Public Art on Encouraging Urban Pedestrianism within the 15-Minute Community Living Circle in Shanghai. Sustainability 2024, 16, 3839. [Google Scholar] [CrossRef]
  40. Ran, S.; Diego, N.; Josep, M.T. Walkability as a Factor in the 15-Minute City: A Comparative Analysis of Barcelona’s Neighborhoods. In Proceedings of the 41st Conference on Education and Research in Computer Aided Architectural Design in Europe (eCAADe 2023), Graz, Austria, 20–22 September 2023. [Google Scholar]
  41. Mañago, C.A.R.; Nasalita, M.G.; Saveron, C.V.; Sunga, Y.A.D.; Claridades, A.R.C. Development of a Fifteen-Minute City Index Using Walkability Scores and Age-Classified Population: The Case of Pasig City, Metro Manila, Philippines. ISPRS Int. J. Geo-Inf. 2025, 14, 78. [Google Scholar] [CrossRef]
  42. Jiang, Z.; Wu, C.; Chung, H. The 15-Minute Community Life Circle for Older People: Walkability Measurement Based on Service Accessibility and Street-Level Built Environment—A Case Study of Suzhou, China. Cities 2025, 157, 105587. [Google Scholar] [CrossRef]
  43. Li, Z.; Zheng, J.; Zhang, Y. Study on the Layout of 15-Minute Community-Life Circle in Third-Tier Cities Based on POI: Baoding City of Hebei Province. Engineering 2019, 11, 592–603. [Google Scholar] [CrossRef]
  44. Song, L.; Kong, X.; Cheng, P. Supply-Demand Matching Assessment of the Public Service Facilities in 15-Minute Community Life Circle Based on Residents’ Behaviors. Cities 2024, 144, 104637. [Google Scholar] [CrossRef]
  45. Yang, S.; Xiang, L.; Yan, Y. Exploration of Strategies for Enhancing the Quality of Urban Space Based on Multi-Source Data Fusion. Buildings 2025, 15, 1258. [Google Scholar] [CrossRef]
  46. She, H.; Sun, J.; Zeng, Y.; Tu, W.; Ao, G.; Shang, W. Walkability Evaluation of Historical and Cultural Districts Based on Multi-Source Data: A Case Study of the Former Russian Concession in Hankou. Buildings 2025, 15, 1603. [Google Scholar] [CrossRef]
  47. Yang, J.; Fricker, P.; Jung, A. From Intangible to Tangible: The Role of Big Data and Machine Learning in Walkability Studies. Comput. Environ. Urban Syst. 2024, 109, 102087. [Google Scholar] [CrossRef]
  48. D’Alessandro, D.; Valeri, D.; Appolloni, L. Reliability of T-WSI to Evaluate Neighborhoods Walkability and Its Changes over Time. Int. J. Environ. Res. Public Health 2020, 17, 7709. [Google Scholar] [CrossRef] [PubMed]
  49. Wang, Z.; Xu, Z. On Transformation from Industrial City to Smart City: A Case Study on Shijingshan District of Beijing. Int. J. Inf. Decis. Sci. 2015, 7, 255. [Google Scholar] [CrossRef]
  50. Wang, Y.; Zhang, H.; Liu, L. Does City Construction Improve Life Quality?-Evidence from POI Data of China. Int. Rev. Econ. Financ. 2022, 80, 643–653. [Google Scholar] [CrossRef]
  51. Liu, D.; Kwan, M.-P.; Wang, J. Developing the 15-Minute City: A Comprehensive Assessment of the Status in Hong Kong. Travel Behav. Soc. 2024, 34, 100666. [Google Scholar] [CrossRef]
  52. Zhang, Z.; Wang, H.; Fisher, T. The Development, Validation, and Application of the Campus Walk Score Measurement System. Transp. Policy 2024, 152, 40–54. [Google Scholar] [CrossRef]
  53. Koohsari, M.J.; Sugiyama, T.; Hanibuchi, T.; Shibata, A.; Ishii, K.; Liao, Y.; Oka, K. Validity of Walk Score® as a Measure of Neighborhood Walkability in Japan. Prev. Med. Rep. 2018, 9, 114–117. [Google Scholar] [CrossRef]
  54. Almeida, D.P.; Alberto, K.C.; Mendes, L.L. Neighborhood Environment Walkability Scale: A Scoping Review. J. Transp. Health 2021, 23, 101261. [Google Scholar] [CrossRef]
  55. Eboli, L.; Forciniti, C.; Mazzulla, G.; Bellizzi, M.G. Establishing Performance Criteria for Evaluating Pedestrian Environments. Sustainability 2023, 15, 3523. [Google Scholar] [CrossRef]
  56. Feng, Y.; Duives, D.; Daamen, W.; Hoogendoorn, S. Data Collection Methods for Studying Pedestrian Behaviour: A Systematic Review. Build. Environ. 2021, 187, 107329. [Google Scholar] [CrossRef]
  57. Acharya, S.K. Urban Development in Post-Reform China: Insights from Beijing. Nor. Geogr. Tidsskr. Nor. J. Geogr. 2005, 59, 228–236. [Google Scholar] [CrossRef]
  58. Stefanidis, R.-M.; Bartzokas-Tsiompras, A. Pedestrian Accessibility Analysis of Sidewalk-Specific Networks: Insights from Three Latin American Central Squares. Sustainability 2024, 16, 9294. [Google Scholar] [CrossRef]
  59. Carlson, J.A.; Grimes, A.; Green, M.; Morefield, T.; Steel, C.; Reddy, A.; Bejarano, C.; Shook, R.P.; Moore, T.; Steele, L.; et al. Impacts of Temporary Pedestrian Streetscape Improvements on Pedestrian and Vehicle Activity and Community Perceptions. J. Transp. Health 2019, 15, 100791. [Google Scholar] [CrossRef]
  60. Ewing, R.; Hajrasouliha, A.; Neckerman, K.M.; Purciel-Hill, M.; Greene, W. Streetscape Features Related to Pedestrian Activity. J. Plan. Educ. Res. 2016, 36, 5–15. [Google Scholar] [CrossRef]
  61. Couch, C.; Fraser, C.; Percy, S. Urban Regeneration in Europe; John Wiley & Sons: Hoboken, NJ, USA, 2008; ISBN 978-0-470-68033-9. [Google Scholar]
  62. Nomakuchi, T. A Study of Entrepreneurial Strategies for Local Industrial Regeneration. In Proceedings of the Third International Conference on Advances in Economics, Social Science and Human Behaviour Study—ESSHBS 2015, Bangkok, Thailand, 28–29 December 2015. [Google Scholar]
  63. Beam, J.; Jeffrey, J. Holistic Revitalization in Small Post-Industrial Cities: Tools for Urban Housing Development. Master’s Thesis, Massachusetts Institute of Technology, Cambridge, MA, USA, 2009. [Google Scholar]
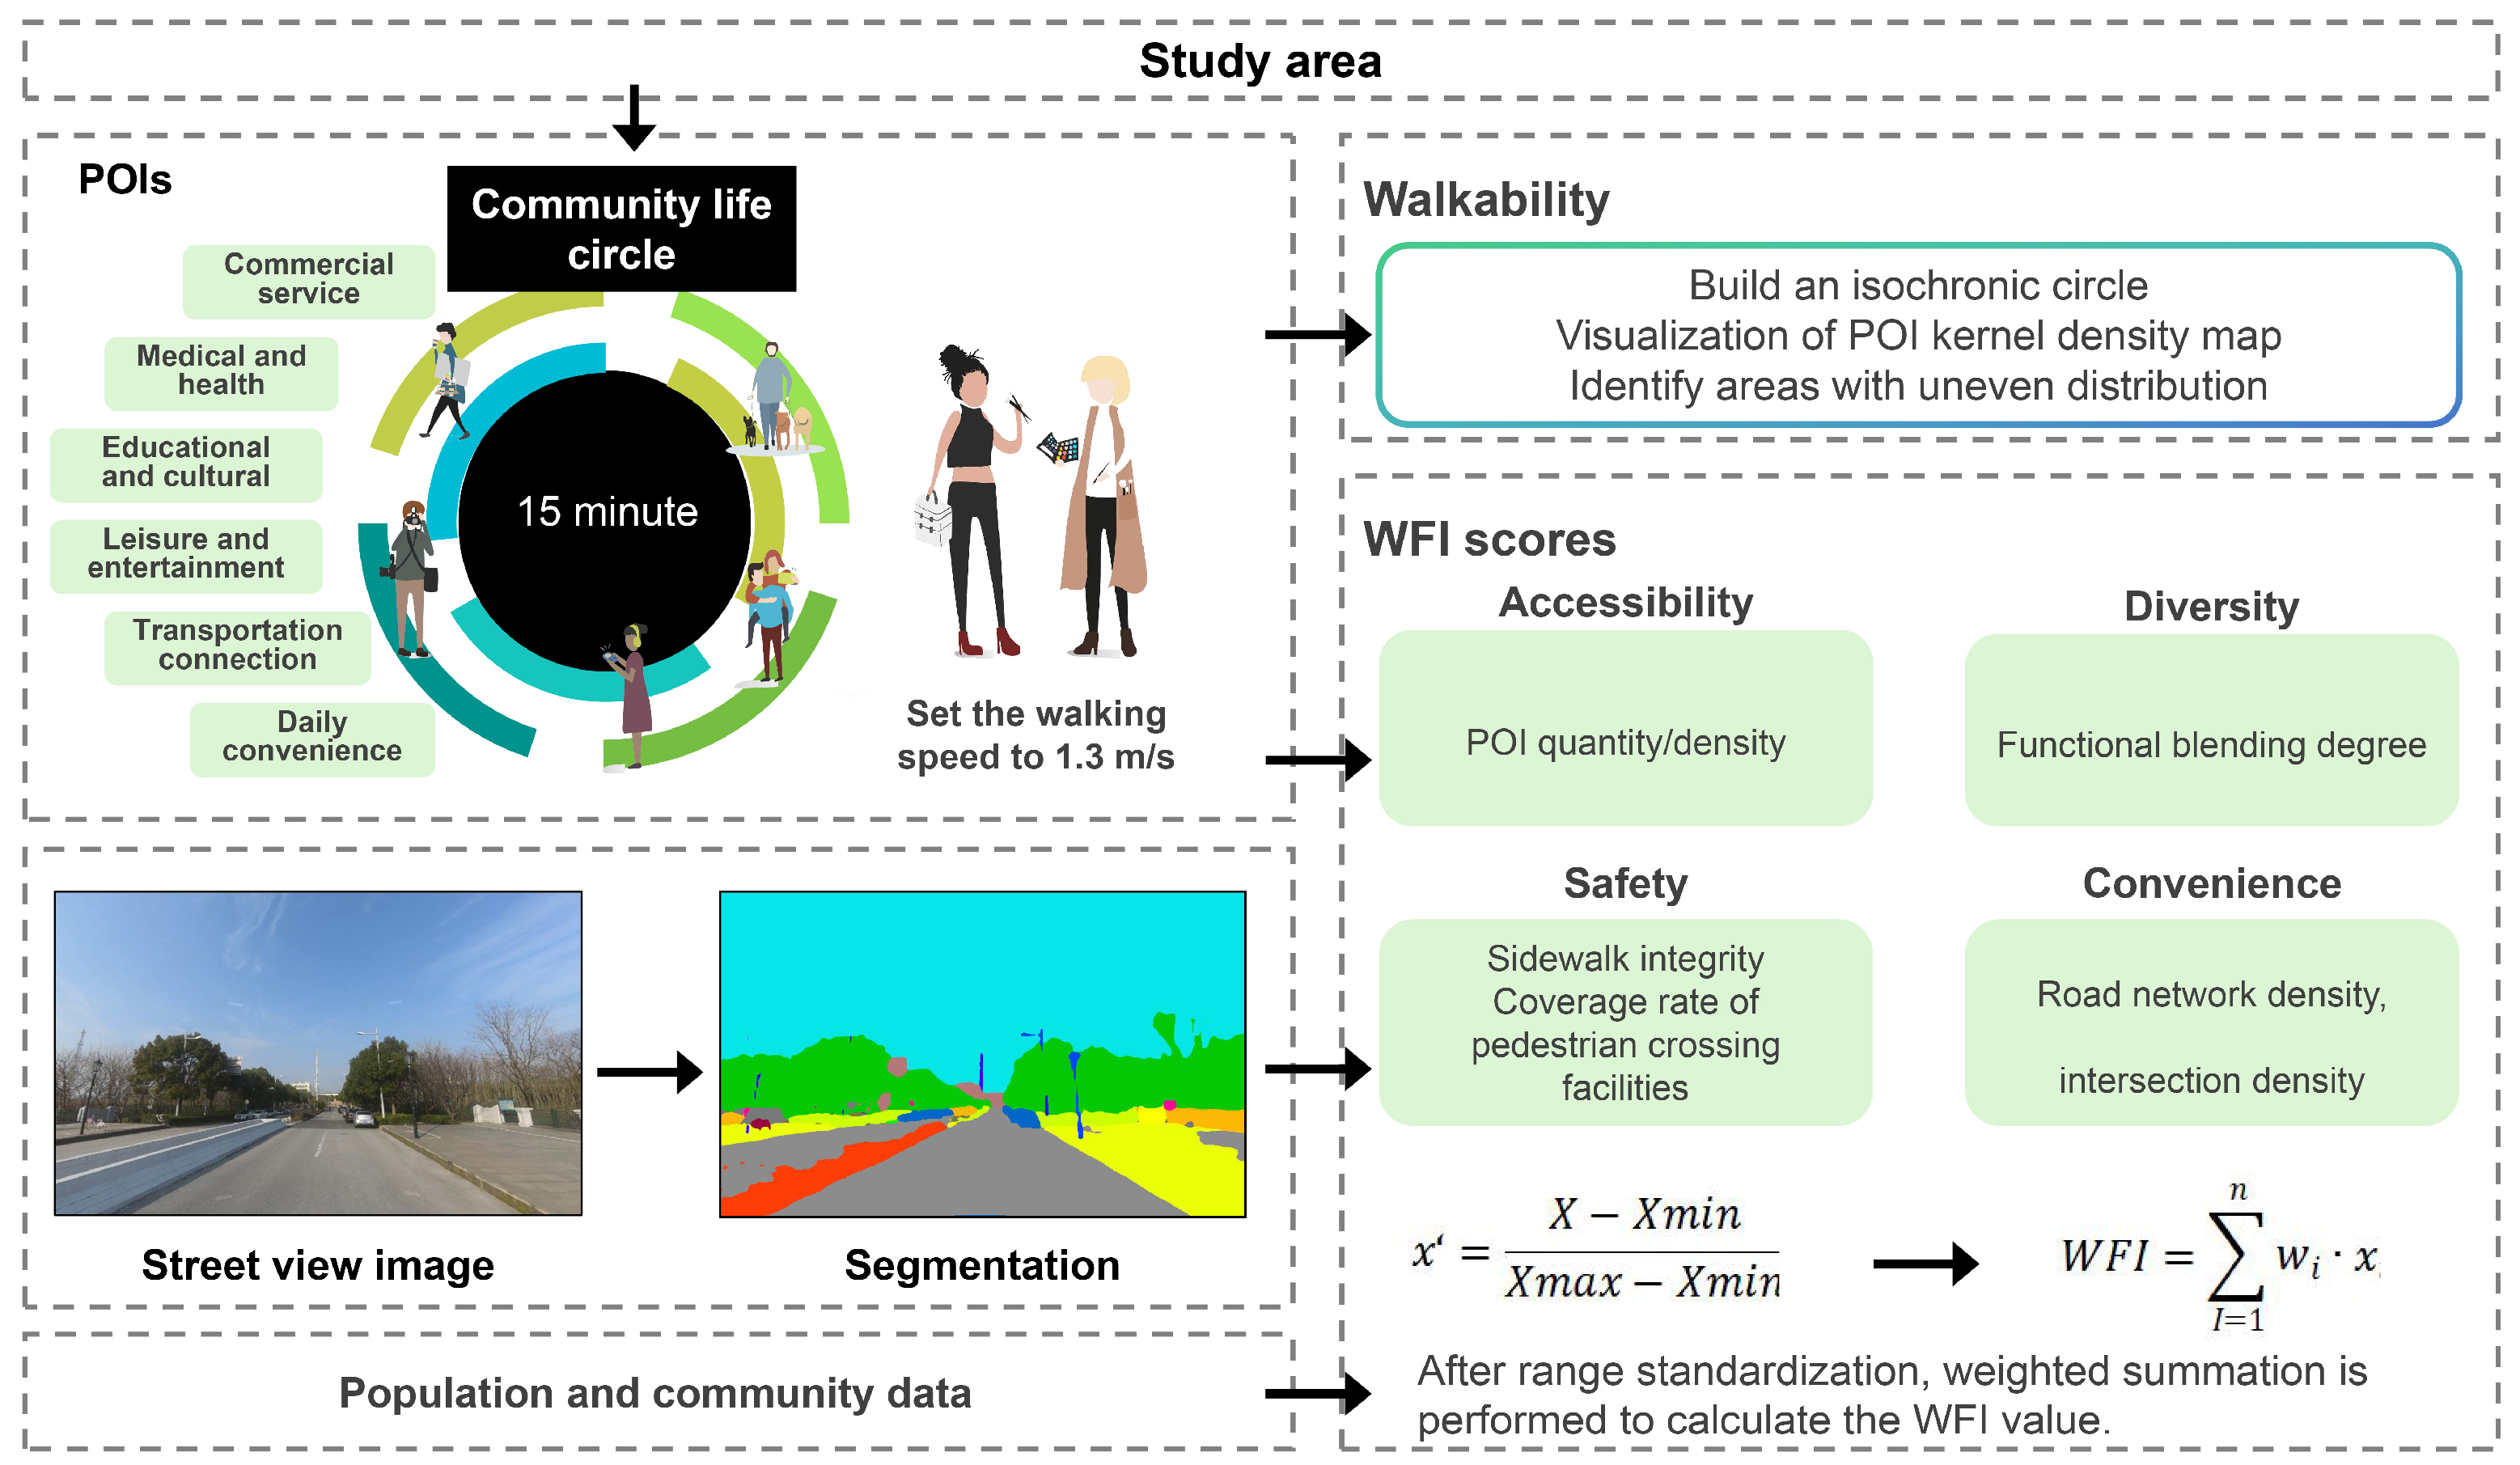
Figure 1. Research framework.
Buildings 15 03143 g001
Figure 2. Study area and boundaries of the 15 min CLC for five selected communities.
Buildings 15 03143 g002
Figure 3. Density maps of various POI cores.
Buildings 15 03143 g003
Figure 4. Scatter plot of WFI values and pedestrian flow with linear fit.
Buildings 15 03143 g004
Table 1. Description of the six POI categories.
POI CategoryPOI Sub-Category Description
Commercial servicesShopping centers, Supermarkets, Restaurants, Cafés, Retail stores, Banks
Medical and health servicesHospitals, Clinics, Pharmacies, Community health centers
Educational and culturalKindergartens, Primary schools, Secondary schools, Universities, Training institutions
Recreational and entertainmentParks, Public squares, Libraries, Museums, Cultural centers, Art galleries, Theaters, Cinemas, Gyms, Stadiums, Children’s playgrounds, KTV
Transportation facilitiesMetro stations, Bus stops, Railway stations, Long-distance bus terminals
Daily convenience servicesConvenience stores, Grocery shops, Barber shops, Post offices, Laundries
Table 2. Walkability Evaluation Indicators and Weight Distribution.
Primary DimensionSecondary IndicatorData SourceCalculation Method and DescriptionWeight
AccessibilityAccessibility to educational, medical, commercial facilitiesPOI + Road Network APICalculate the shortest path to the nearest facility using actual pedestrian network; assess whether it is within a 15 min walk zone0.30
DiversityFunctional mix indexPOI dataUse entropy index to measure the proportion and distribution of various POI types within the area0.25
ConvenienceRoad network density, intersection densityOpen Street Map Calculate total road length and number of intersections per unit area to reflect network connectivity and accessibility0.25
SafetySidewalk completeness, crossing facility coverageStreet view images Use deep learning models to identify pedestrian areas in street view images and measure their proportion0.20
Table 3. Number of POIs by category within each 15 min life circle.
CommunityCommercial ServicesMedical and Health ServicesEducational and Cultural FacilitiesRecreational and Entertainment VenuesTransportation FacilitiesDaily Convenience ServicesTotal POIs
Wuli Chunqiu Community197223214426167588
International Talent Community140721161458
Laogucheng Courtyard Area188164815941170622
Rongjingcheng Residential Compound55397364141
Yuanyang Shanshui Community458651214201334981695
Table 4. WFI Scores of the selected communities.
CommunityAccessibilityDiversityConvenienceSafetyWFI
Wuli Chunqiu Community0.55190.45200.83030.65000.6161
International Talent Community0.16500.32600.25000.53000.3010
Laogucheng Courtyard Area0.67990.79200.85720.45000.7063
Rongjingcheng Residential Compound0.27400.15200.35200.54000.3162
Yuanyang Shanshui Community0.74000.85600.87750.65000.7853
Disclaimer/Publisher’s Note: The statements, opinions and data contained in all publications are solely those of the individual author(s) and contributor(s) and not of MDPI and/or the editor(s). MDPI and/or the editor(s) disclaim responsibility for any injury to people or property resulting from any ideas, methods, instructions or products referred to in the content.