Article

Application of an Automated Parameter Determination Framework to Boundary Value Problems

Institute of Soil Mechanics, Foundation Engineering and Computational Geotechnics, Graz University of Technology, 8010 Graz, Austria
*
Author to whom correspondence should be addressed.
Buildings 2025, 15(17), 3092; https://doi.org/10.3390/buildings15173092
Submission received: 22 July 2025 / Revised: 13 August 2025 / Accepted: 25 August 2025 / Published: 28 August 2025
(This article belongs to the Special Issue Research on Intelligent Geotechnical Engineering)

Abstract

Determining constitutive model parameters from in situ tests offers several advantages, including reduced time, lower cost, and minimal soil disturbance. As part of a research project, an automated framework was developed to derive constitutive model parameters from in situ test results using a graph-based approach. Previous studies primarily focused on validating the framework’s output in terms of soil parameters by comparing them with values interpreted from laboratory tests. This study demonstrates the full capability of the framework, from importing raw in situ measurements and stratifying the soil profile to determining both soil and constitutive model parameters, and ultimately linking the results to numerical modelling. To assess the accuracy of the obtained material sets, two well-documented boundary value problems are modelled: one involving the long-term settlement behaviour of an embankment and the other addressing the failure load of shallow footings. The parameter determination framework proves particularly valuable in the early stages of geotechnical projects, offering enhanced insight and detailed soil characterisation when data is limited. Ongoing research aims to extend the framework by incorporating additional in situ tests and implementing statistical tools to better capture uncertainty and support informed decision-making.

1. Introduction

The accurate determination of constitutive model parameters plays a significant role in the success of numerical analyses. The continuous development of constitutive models over the years has led to several advanced models that are able to capture soil behaviour more accurately than simpler models. However, these advanced models require a greater number of material parameters, which are typically determined through laboratory testing. Nevertheless, such tests are not always available, particularly in the early stages of a project, which makes the process of parameter determination constrained by limited soil data and engineering judgement.
In situ tests offer an alternative approach to assessing soil parameters. Compared to laboratory tests, they are more economical, are faster, involve larger soil volumes, and often cause less disturbance. However, it is generally not possible to determine parameters directly from in situ test results. Their interpretation typically relies on empirical correlations between soil parameters and in situ measurements. This reliance on empirical correlations—while necessary—remains a key limitation of in situ tests, as such relationships are often site-specific and may not be universally applicable to different soil types or geological settings [1]. Applying these correlations without accounting for their limitations will most likely lead to inaccurate parameter estimates. Several established guidelines are available in the literature for interpreting in situ test results. Notable references include those by [2,3] for the cone penetration test (CPT); ref. [4] for the dilatometer test (DMT); and [5,6] for the pressuremeter test (PMT). In parallel, various efforts have been made to estimate constitutive model parameters from limited soil data. For example, ref. [7] proposed a method to derive parameters for the Hardening Soil with small-strain stiffness (HSS) model based solely on relative density. More broadly, recent research has explored data-driven approaches to identify constitutive parameters from field measurements or numerical back-analysis. One such example is the work of [8], who applied a data-driven approach to assess the modified Cam-clay model parameters from limited field observations.
Automated Parameter Determination (APD) is a research project that aims to develop a framework for automatically determining soil parameters from in situ tests using a graph-based approach [9]. This approach inherits some of the properties of graph theory [9], allowing parameters and correlations to be represented as nodes and connections in a directed network. The graph-based approach enables transparent and traceable parameter determination by representing the interdependencies between input measurements, intermediate variables, and target parameters in a structured and visual manner. This allows users to follow the complete calculation path and adjust it according to expert knowledge or site-specific constraints. The tool has been discussed in several publications, primarily focusing on illustrating the framework [10], expanding it by incorporating additional in situ tests [11], and validating its output with respect to soil parameters [10,12,13]. An attempt to validate the constitutive model parameters for the Clay and Sand Model (CASM) [14] was presented in [15], where the parameters obtained from APD for a sand site were assessed by numerically simulating a cone penetration test (CPT) and comparing the simulated results to the actual CPT used for interpretation. In a previous study [16], model parameters for the Hardening Soil (HS) model [17] and the HSS model [18] were determined, and a synthetic shallow footing was analysed. The present study showcases the full capabilities of APD—from stratifying CPT results to the automated linkage with the FE software PLAXIS (version 24.3) [19], including the intermediate step of constitutive model parameters determination. The parameters are evaluated by modelling two boundary value problems (BVPs) covering the serviceability limit state (SLS) as well as the ultimate limit state (ULS).
Section 2 briefly outlines the framework of the tool. The investigated test site is presented in Section 3. The application of APD to the test site is described in Section 4, and the two BVPs are discussed in Section 5. The current status and future developments of APD are addressed in Section 6, while Section 7 provides a summary of the key findings.

2. APD

The framework of APD is based on a graph-based approach to parameter determination. At present, it consists of three main workflows that rely on data obtained from CPT, DMT, and measurements of shear wave velocity ( V s ). The V s -based workflow can be regarded as an add-on to the CPT- and DMT-based workflows.
APD is designed to ensure both transparency and adaptability. Transparency is achieved by explicitly showing how parameters are computed, while adaptability is ensured by allowing users to incorporate their knowledge, experience, and expertise into the system. The different components of the framework are described in detail in [10]. To avoid repetition, only the main aspects of the framework are presented in Section 2.1 and Section 2.2, and interested readers are referred to [10] for further details.

2.1. APD Modules

The framework is developed in a modular structure that links raw in situ measurements to the FE software. An overview of the modules comprising the CPT-based workflow is presented in Figure 1. The same methodology is applied to the DMT-based workflow.
Module 1 imports raw measurements and computes “key” CPT parameters (e.g., friction ratio R f , normalised cone resistance Q t ). Some of these parameters require a preliminary assessment of effective and/or total stresses, which, in turn, necessitates an estimation of the unit weight. At this stage, it is referred to as the initial unit weight, which is used to evaluate the total and effective stresses required for computing stress-dependent CPT parameters.
Module 2 stratifies the raw measurements into distinct soil layers. The stratification procedure is detailed in Section 4.1. Module 3 evaluates the stress state of the identified layers, including the overconsolidation ratio (OCR) and the coefficient of earth pressure at rest ( K 0 ).
Modules 4 and 5 implement the graph-based approach to derive both soil parameters and constitutive model parameters. Finally, a connection to the FE software is established.

2.2. Graph-Based Approach

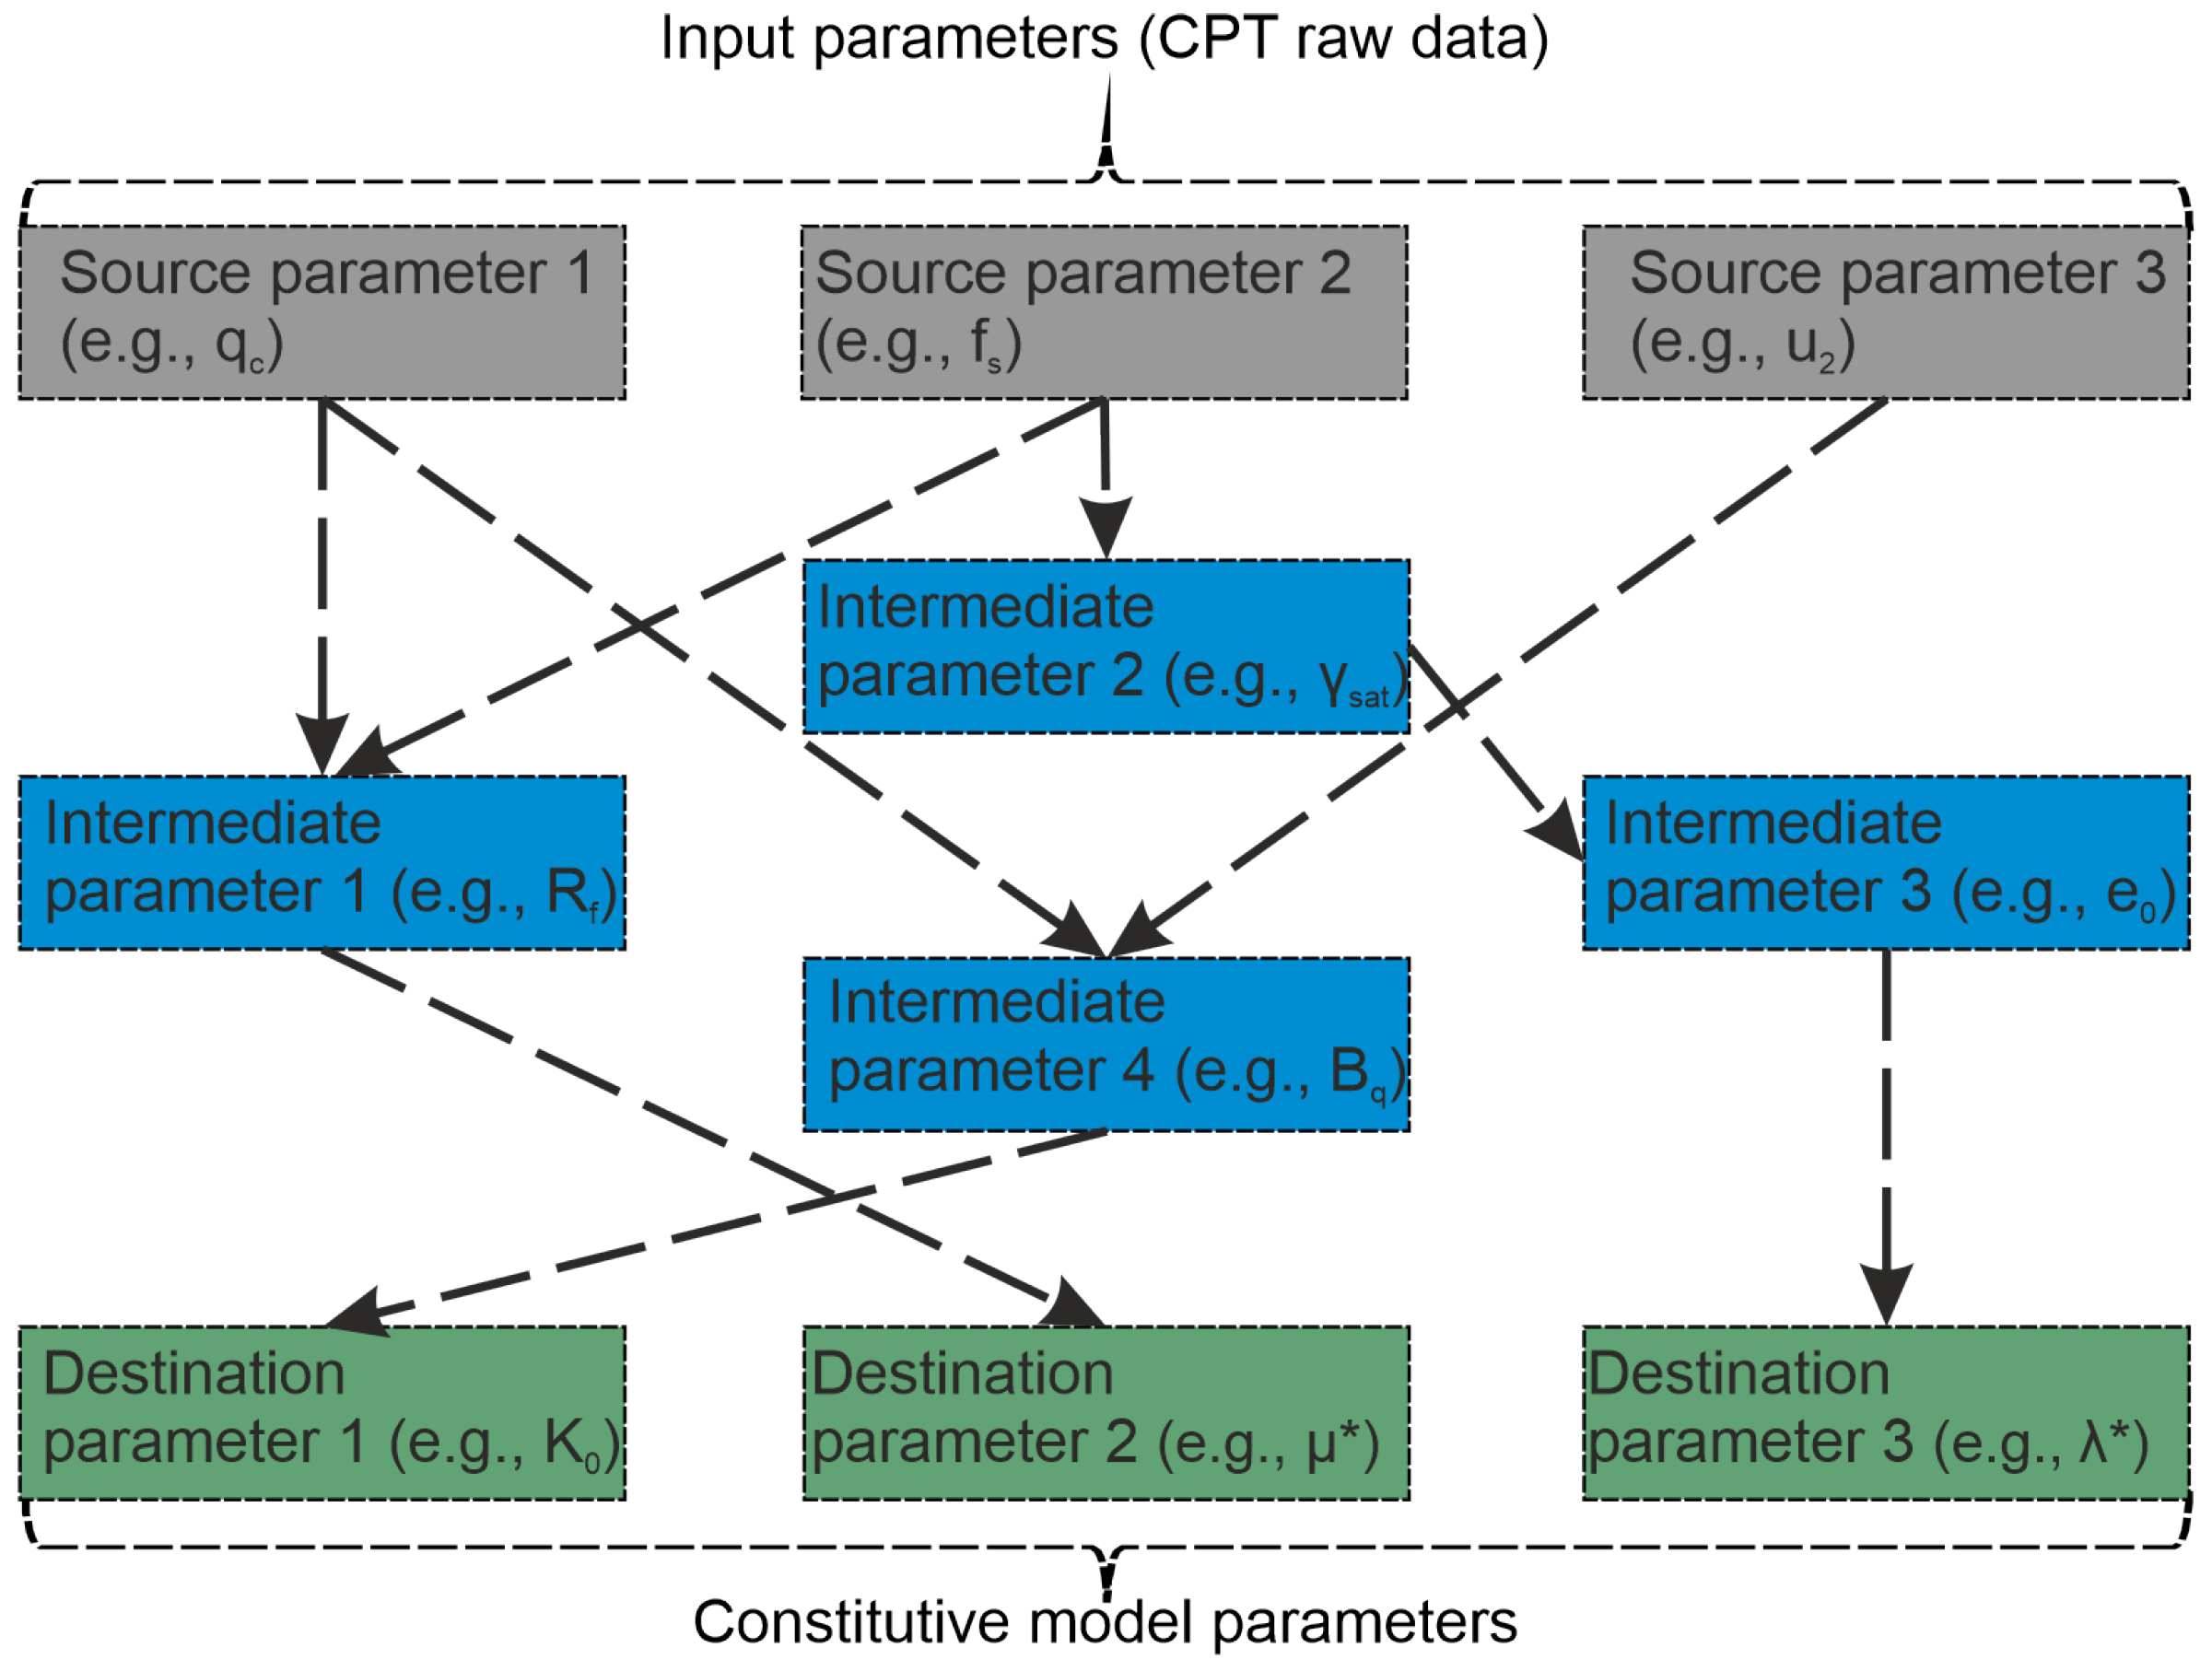
Graph theory is a branch of discrete mathematics concerned with the study of relationships between objects in a network. A graph is defined by a set of nodes, representing individual entities, and edges, which represent the connections or relationships between them. In the context of APD, nodes represent soil parameters or empirical methods, and edges define the relationships between them. The graph-based approach implemented in APD is illustrated in Figure 2. Source parameters—such as cone tip resistance ( q c ), sleeve friction ( f s ), and porewater pressure ( u 2 ) in the case of CPT—are used to compute a set of intermediate parameters. These intermediate parameters are subsequently used to derive the destination parameters, which, in this context, are the constitutive model parameters. The connection between source and destination parameters is established through a set of predefined correlations. The system automatically identifies all possible paths (i.e., chains of correlations) linking source parameters to destination parameters and computes the corresponding values for both intermediate and destination parameters. More details related to the graph-based approach can be found in [9,10].
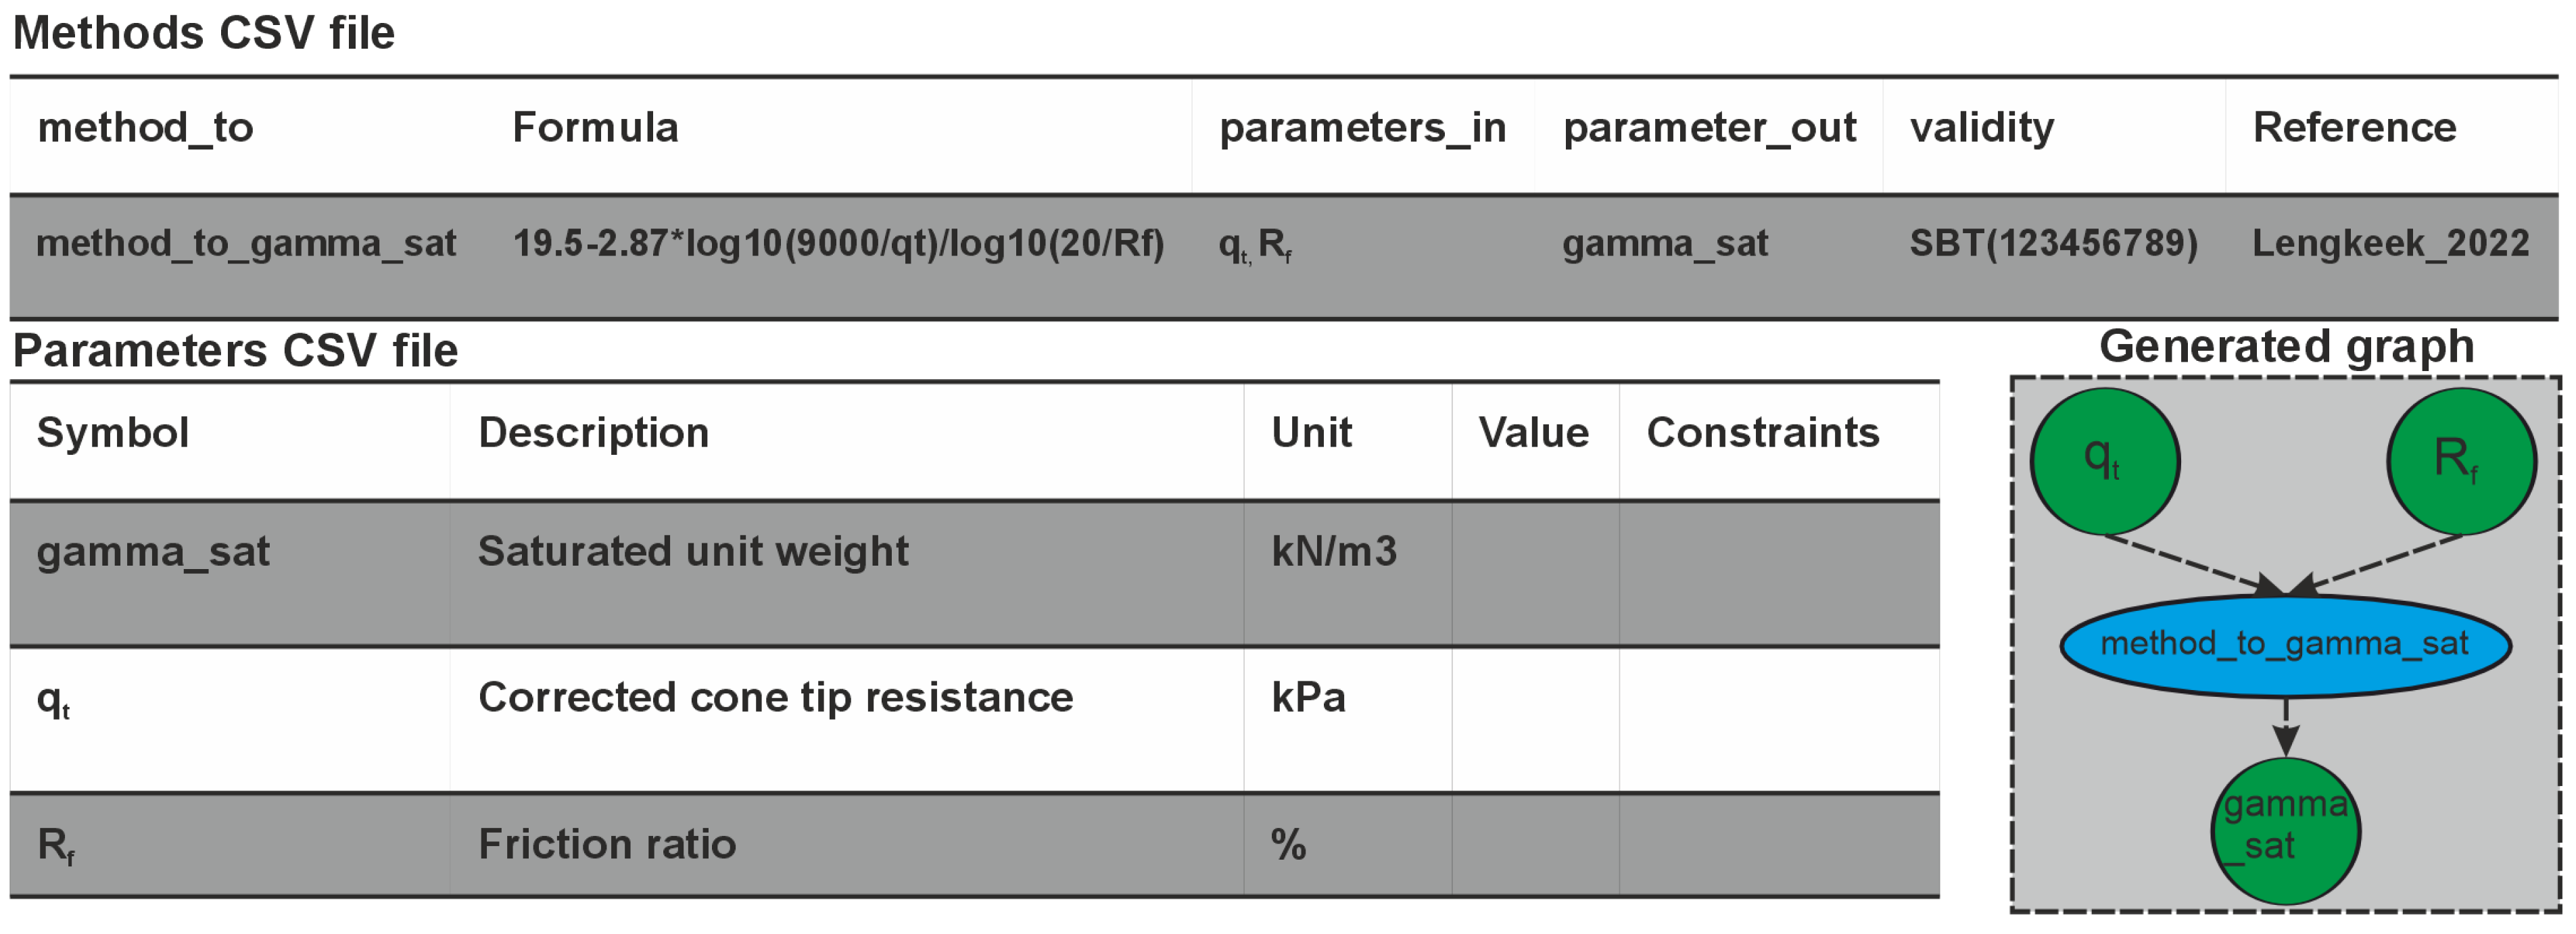
Graphs are generated using two CSV files: one defining the methods (i.e., correlations) and the other defining the parameters. An example is shown in Figure 3, where a method for determining the saturated unit weight ( γ s a t ) is implemented, along with the corresponding generated graph. The methods CSV file includes fields such as parameters_in and parameters_out to define the required input and resulting output parameters, Formula for the correlation, and fields such as validity (to limit application by soil type or other constraints) and Reference (optional for citing the source). The parameters CSV file defines each parameter using fields like Symbol, Unit, Value (optional for manually defined constants), and Constraints (to enforce upper and lower bounds). The resulting graph contains two types of nodes: parameter nodes (green) and method nodes (blue). Connections between nodes are formed based on the defined relationships in the methods CSV file. The system automatically generates all valid paths from source to destination parameters based on the entries in the methods CSV file. For each path, it sequentially applies the corresponding equations to compute the intermediate and final parameter values.
The framework was developed in Python (version 3.8), with graph generation carried out via the graphviz library [21]. In its present form, APD contains a verified database of over 200 methods, where methods for determining soil properties and constitutive model parameters are stored together in a single database (methods CSV file).

3. Test Site

The investigation is centred on the Ballina soft soil National Field Testing Facility (NFTF), situated close to the town of Ballina in New South Wales, Australia, and established by the ARC Centre of Excellence for Geotechnical Science and Engineering (CGSE). The site was used for an international prediction symposium organised by the CGSE in 2016, which aimed to predict the behaviour of embankments constructed on soft soils [22].
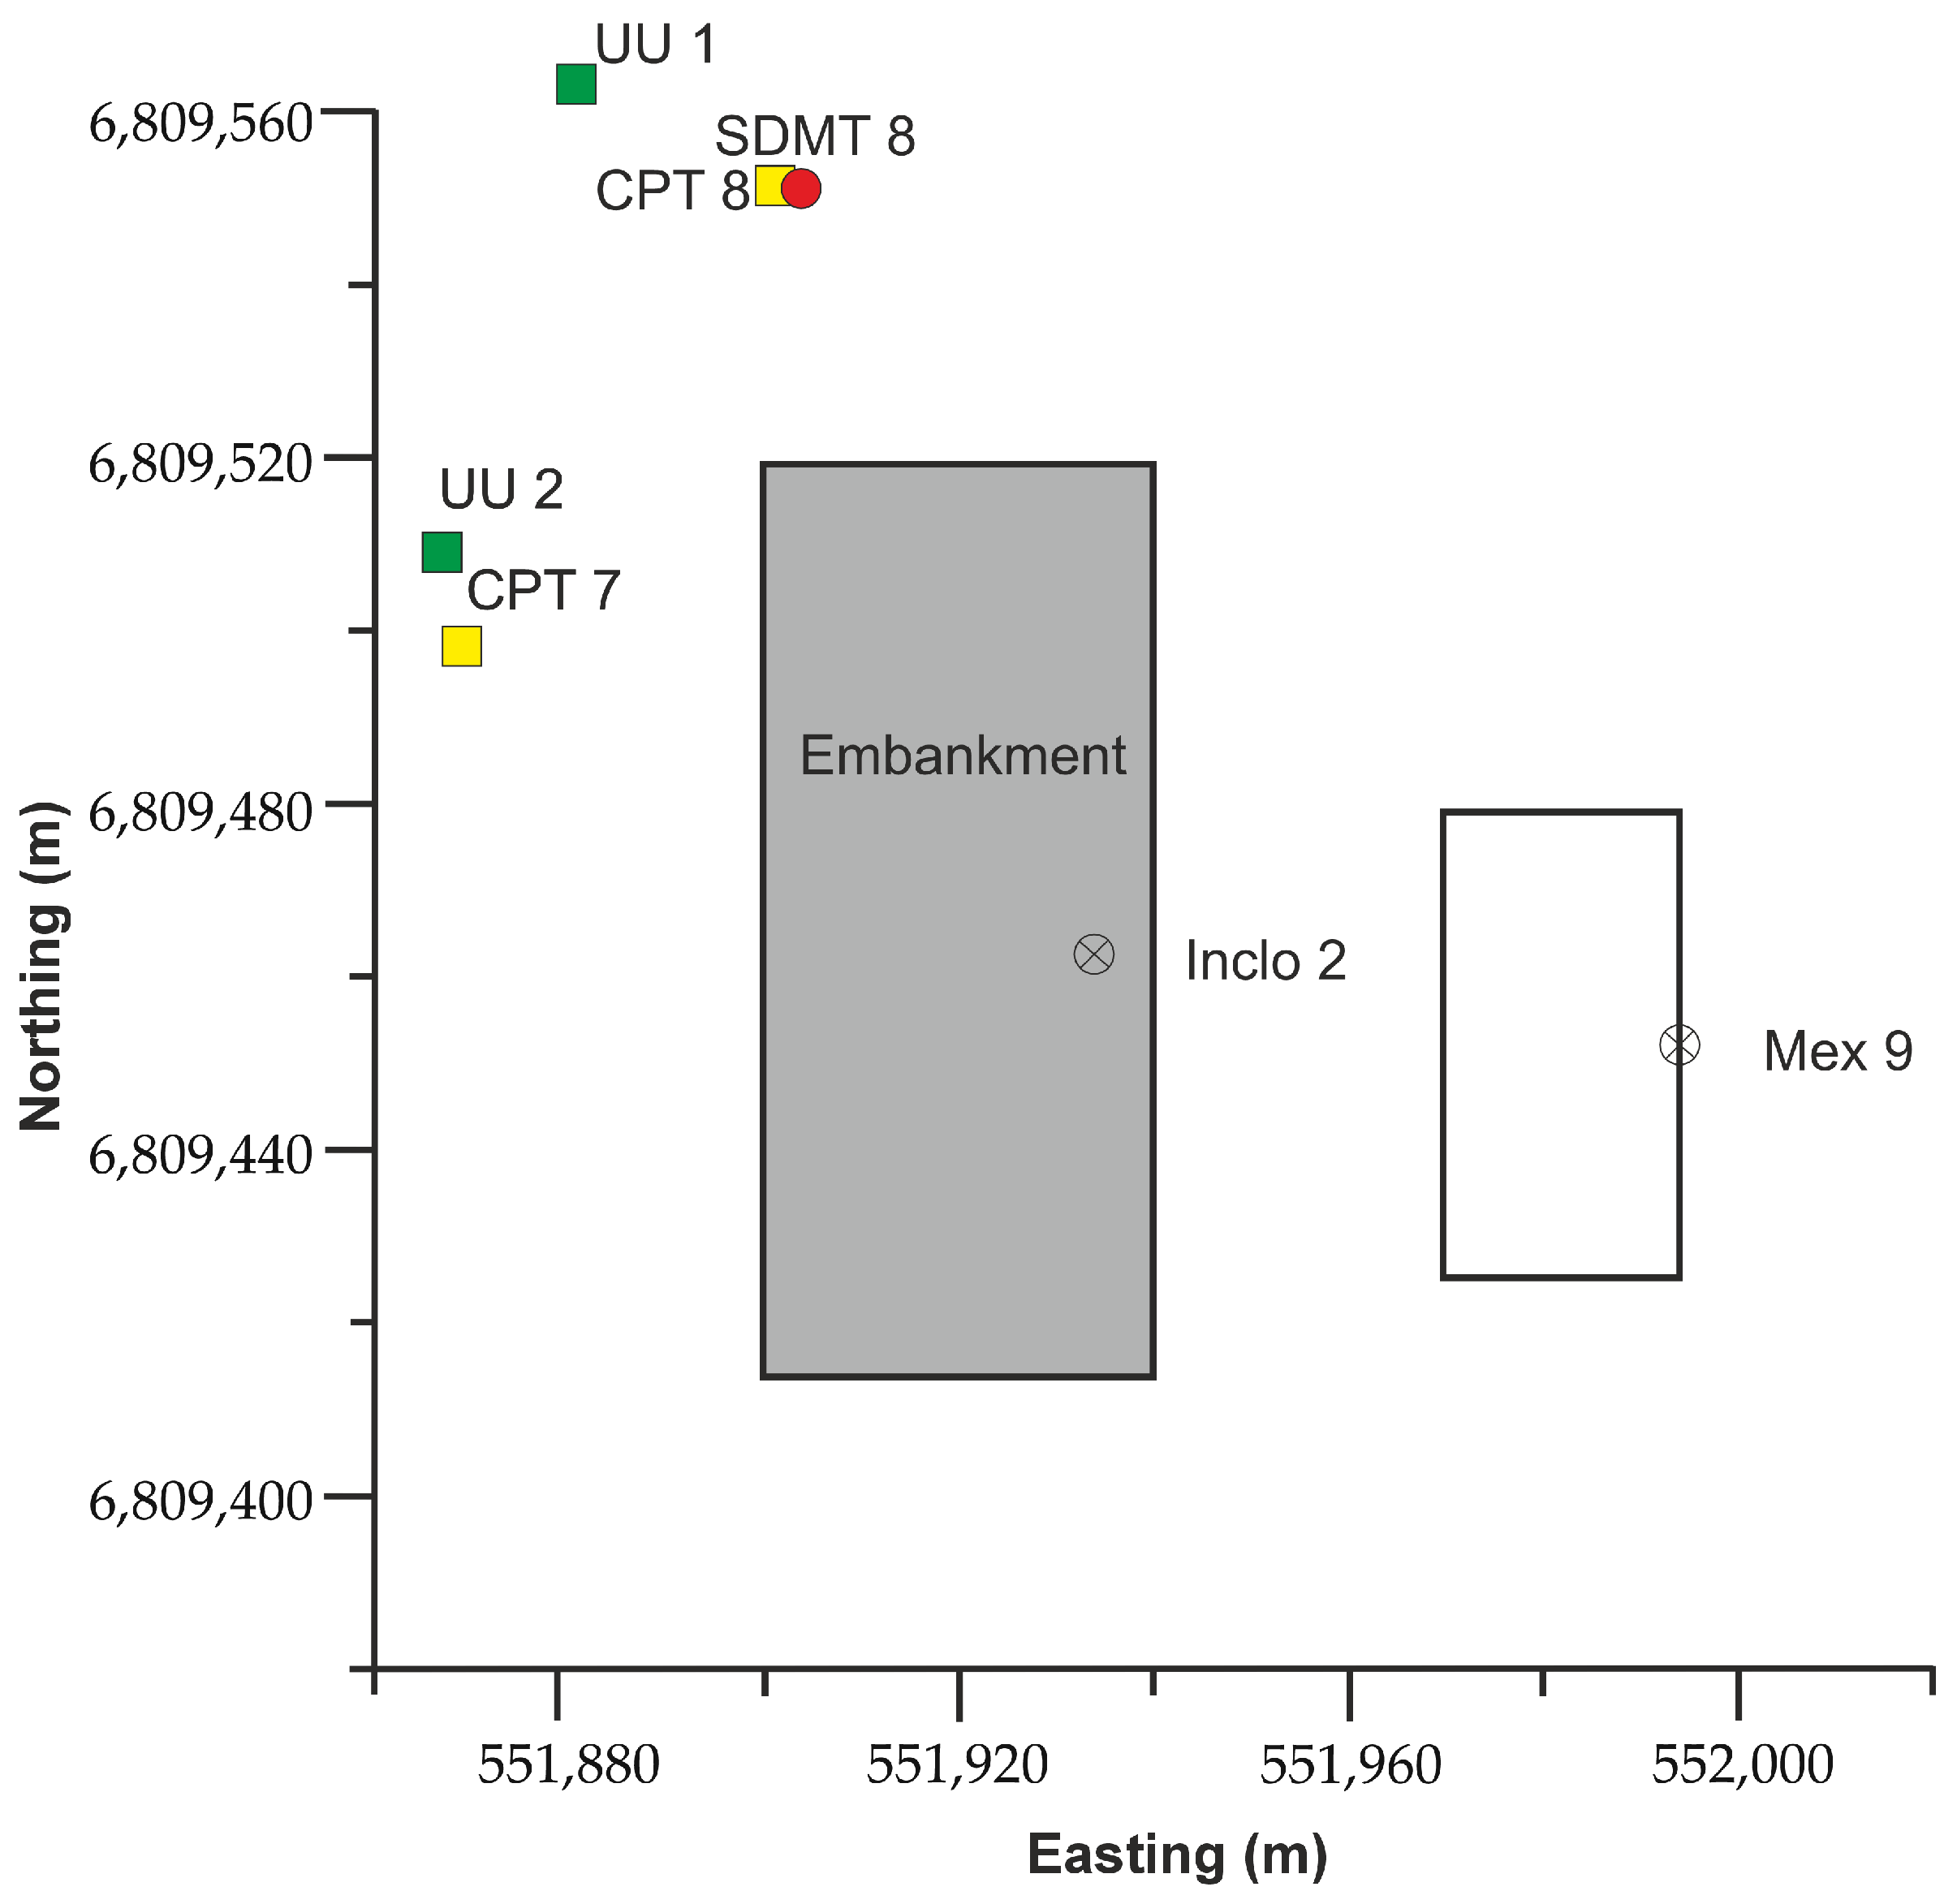
The characterisation of the test site is documented in [22,23,24], and the key elements relevant to this study are highlighted in Figure 4. Inclo 2 and Mex 9 are two continuous boreholes drilled to a depth of 13 m [23]. Laboratory tests were conducted on tube samples retrieved from these boreholes [23], and the results were obtained from Datamap [25], a web-based application for managing geotechnical data.
The BVPs considered in this study include the long-term settlements of an embankment and the failure load of shallow footings. The embankment is indicated by the grey rectangle in Figure 4, while the two undrained unconsolidated (UU) shallow footings are shown as green squares.
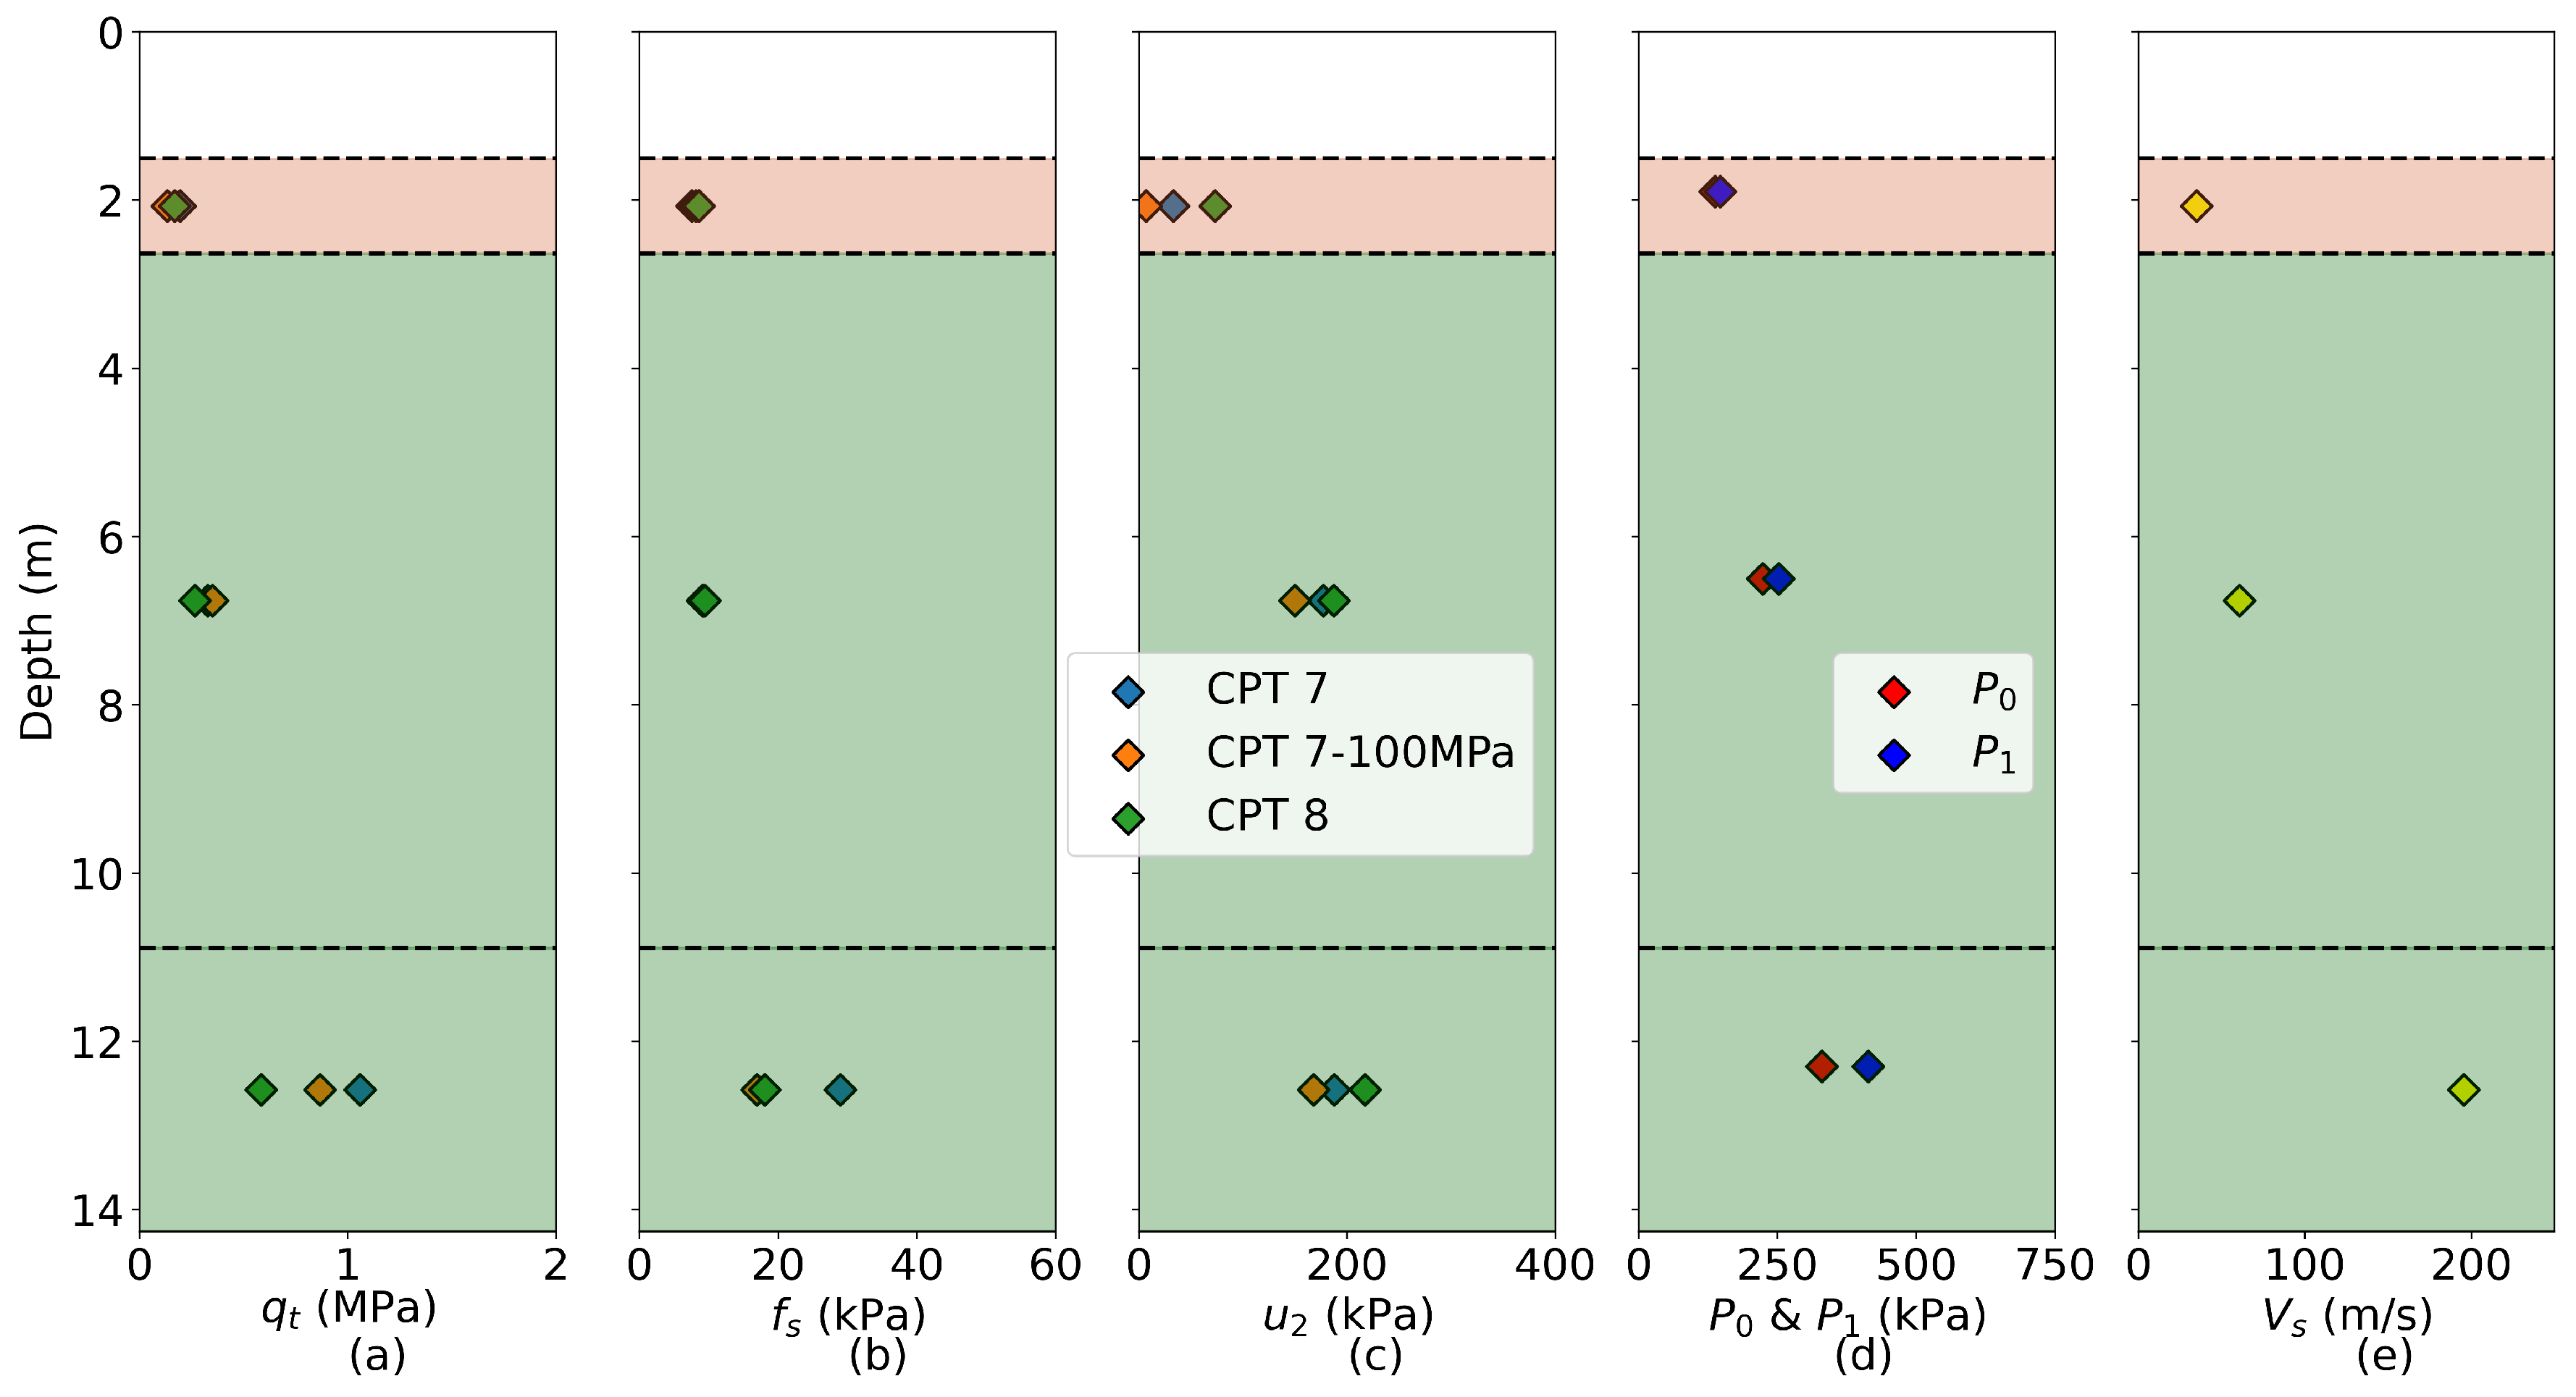
The in situ tests used as input for APD consist of a seismic dilatometer test (SDMT 8, represented by the red circle in Figure 4) and three cone penetration tests: CPT 7 (two tests—CPT 7 and CPT 7—100 MPa) and CPT 8 (yellow squares). The corresponding measurements are presented in Figure 5. The corrected cone tip resistance ( q t ) profiles (Figure 5a) are clipped at 3 MPa to improve visualisation of the soft estuarine clay layers, which are the main focus of this study. Previous investigations [26,27] have already demonstrated that these layers are the decisive material for the embankment prediction. The DMT sounding (Figure 5d) is shown as the corrected first and second readings ( P 0 and P 1 , respectively). The V s profile (Figure 5e) was derived from the SDMT results. The CPT measurements were recorded at 1 cm intervals, the DMT readings at 20 cm intervals, and the V s measurements at 50 cm intervals.
The soil profile consists of four main layers. A shallow alluvial layer is underlain by a soft clay layer. Beneath the soft clay, a transition zone with increased sand content is present, followed by a stiff clay layer at a greater depth [22]. The engineering properties relevant to this study are discussed in Section 4.

4. Application of APD to the Test Site

In this section, the in situ tests presented in Figure 5 are used as input for APD to determine constitutive model parameters for the soft estuarine clay layers, which were identified as the decisive layers for the embankment prediction. First, the stratification of the soil profile is presented, followed by the selection of the constitutive model and the resulting constitutive model parameters.

4.1. Stratification

Within the APD framework, parameters are generally computed for defined soil layers; therefore, stratification must be performed prior to parameter assessment. Owing to the flexibility of APD, various approaches can be used for stratification. Currently, three stratification algorithms are implemented in the tool. Additionally, stratification can be carried out manually by specifying layer boundaries and their corresponding soil behaviour type (SBT). External tools may also be employed for stratification, with their outputs subsequently used in APD, as demonstrated in the synthetic case study presented in [16]. Furthermore, machine learning (ML)-based methods, such as those proposed in [28,29], can be incorporated into the APD framework. The effective use of ML models, however, requires access to well-documented databases—such as the CPT database presented in [30]—for training the ML models.
In this study, the stratification algorithm presented in [31] is used to define the soil layers. The algorithm is described in detail in the referenced publication and consists of four main steps:
  • Preprocessing: Converts q t and R f to their logarithmic forms, i.e., log q t and log R f .
  • Detection of fluctuations using a moving window: Computes moving standard deviations over a specified window of measurements (e.g., 7 points) for log q t and log R f , and combines them into a single metric—the combined standard deviation.
  • Peak identification: Detects spikes in the combined standard deviation and retains only one peak within every d min meters, as specified by the user. The choice of d min significantly influences the number and thickness of the resulting layers; smaller values allow for a finer resolution, while larger values enforce a minimum layer thickness and suppress closely spaced transitions.
  • Filtering of similar layers: For each detected peak, the two adjacent layers are identified, and their positions in Robertson’s modified non-normalised SBT chart [32] are determined. The distance between these positions is calculated and compared to a threshold value (typically in the range [0.1–0.3] [31]). If the distance is below the threshold, the layers are considered similar, and the peak is discarded.
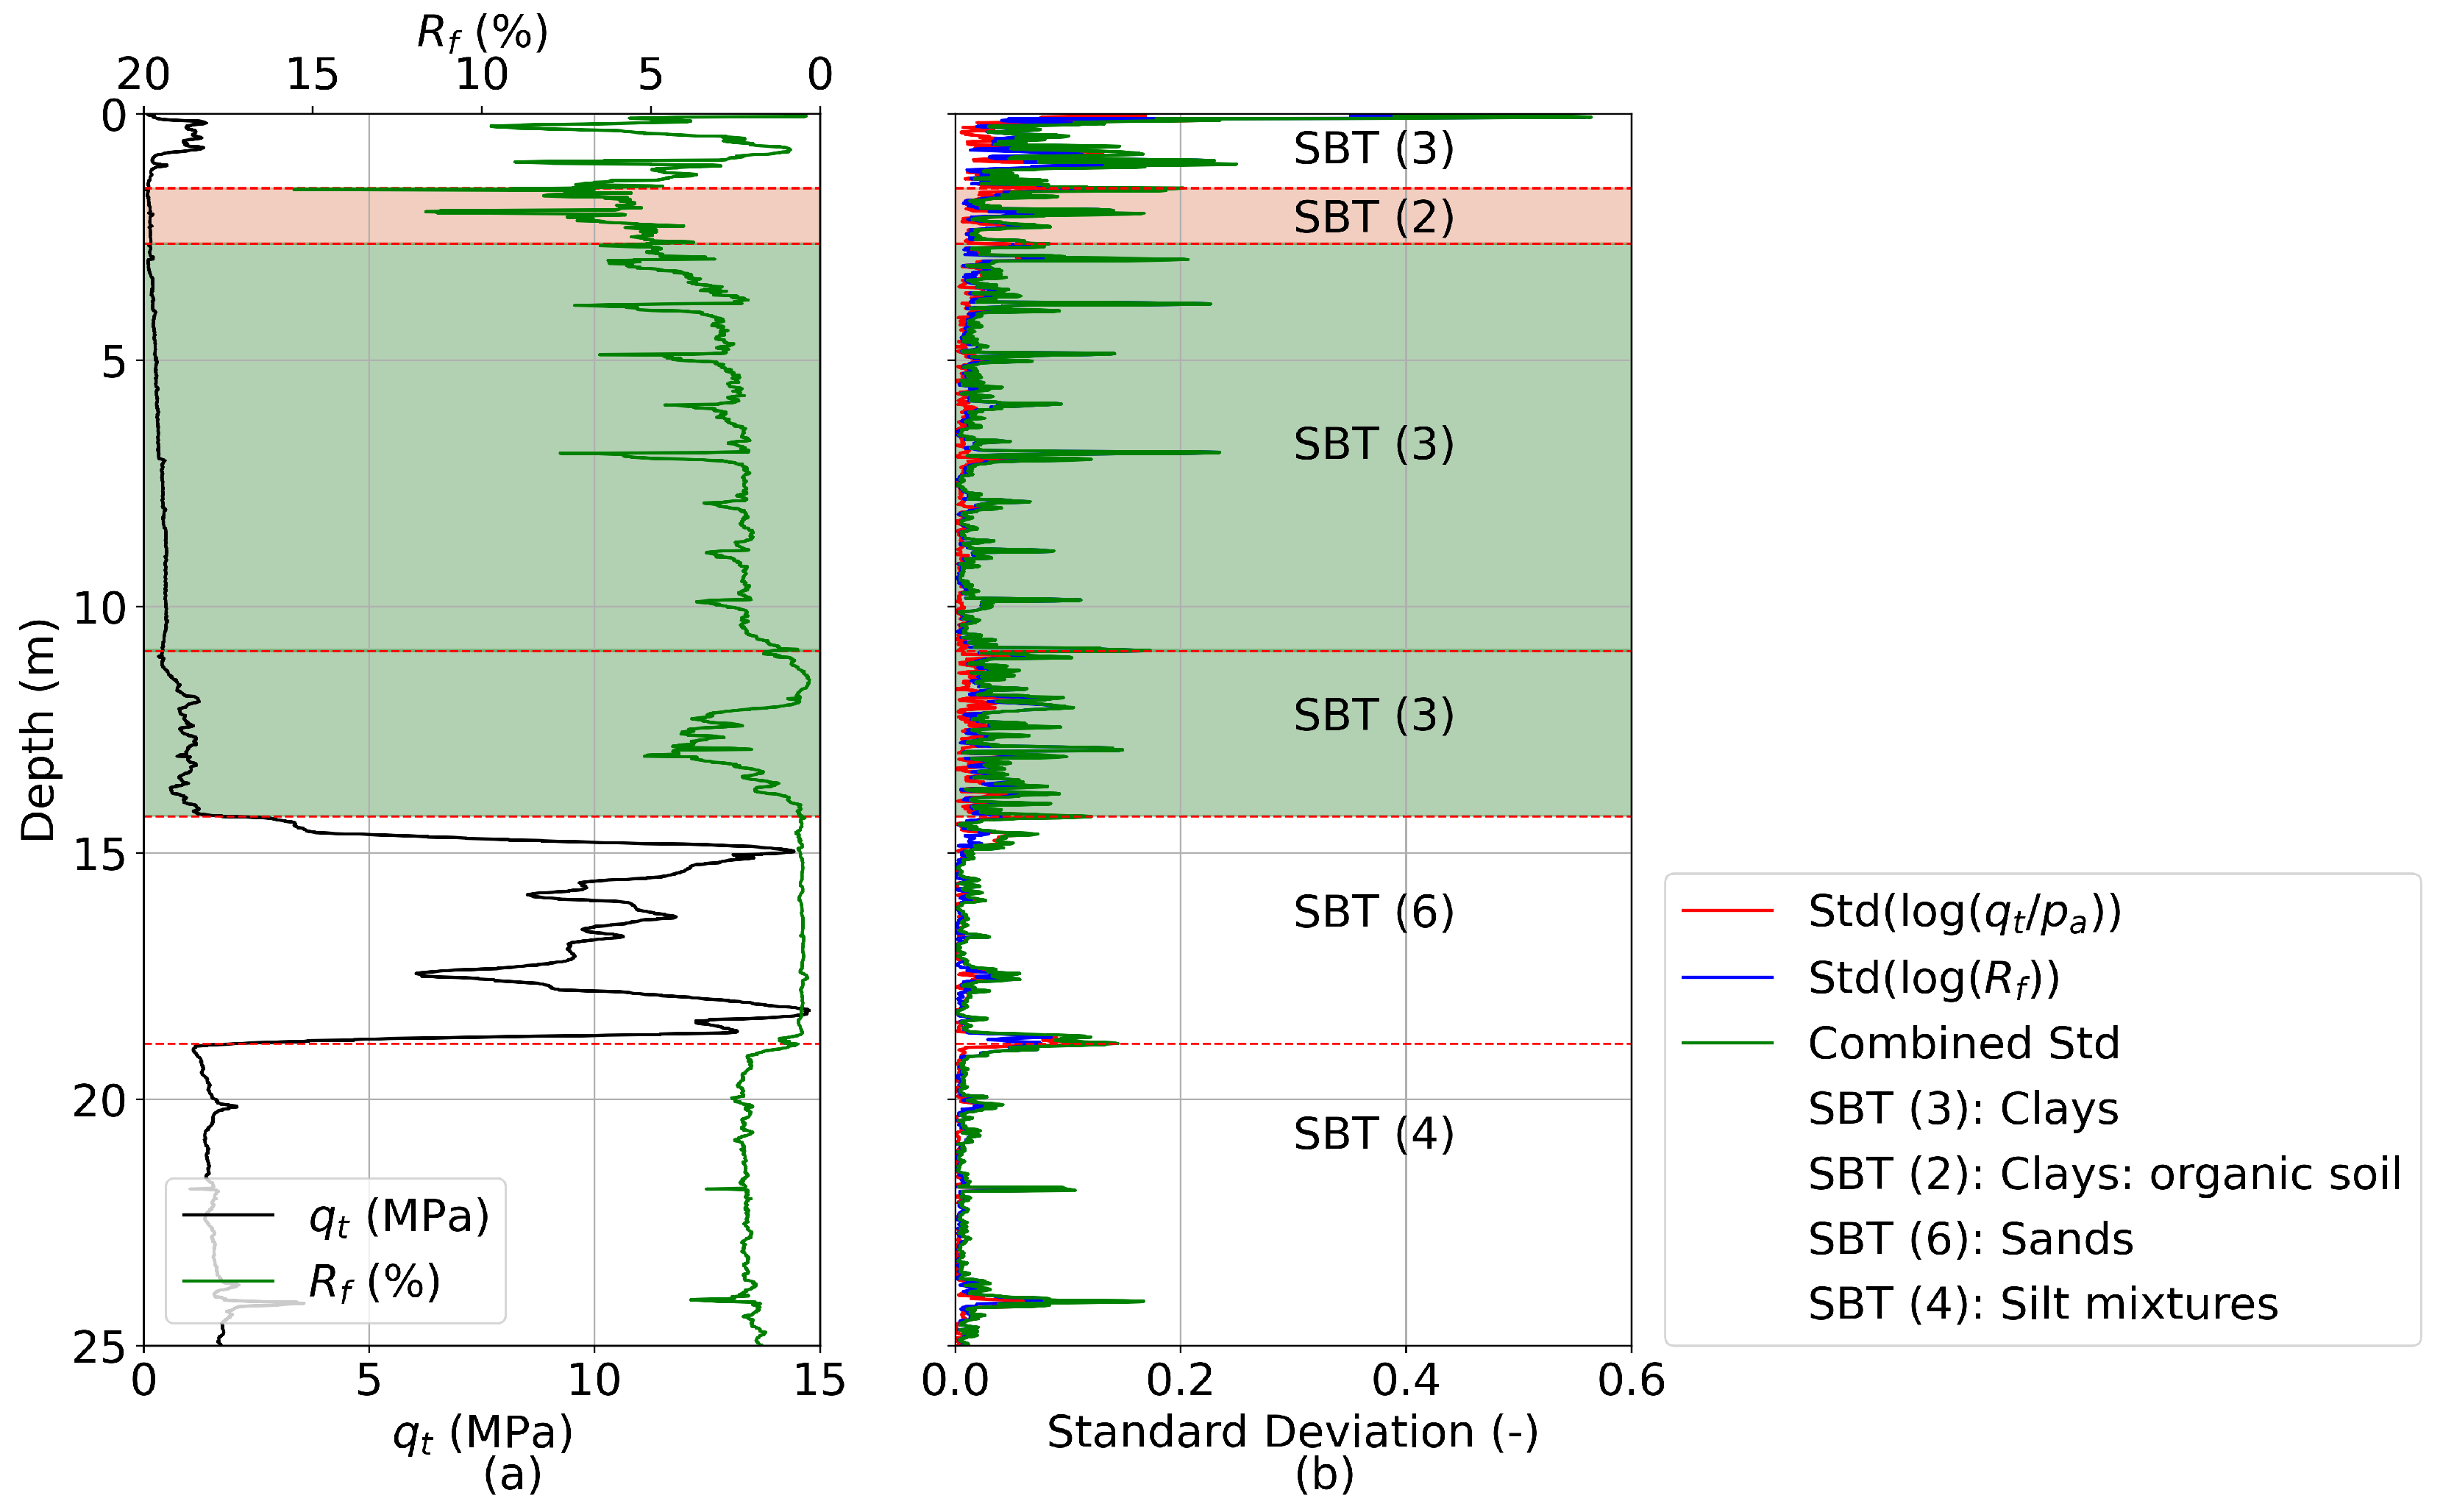
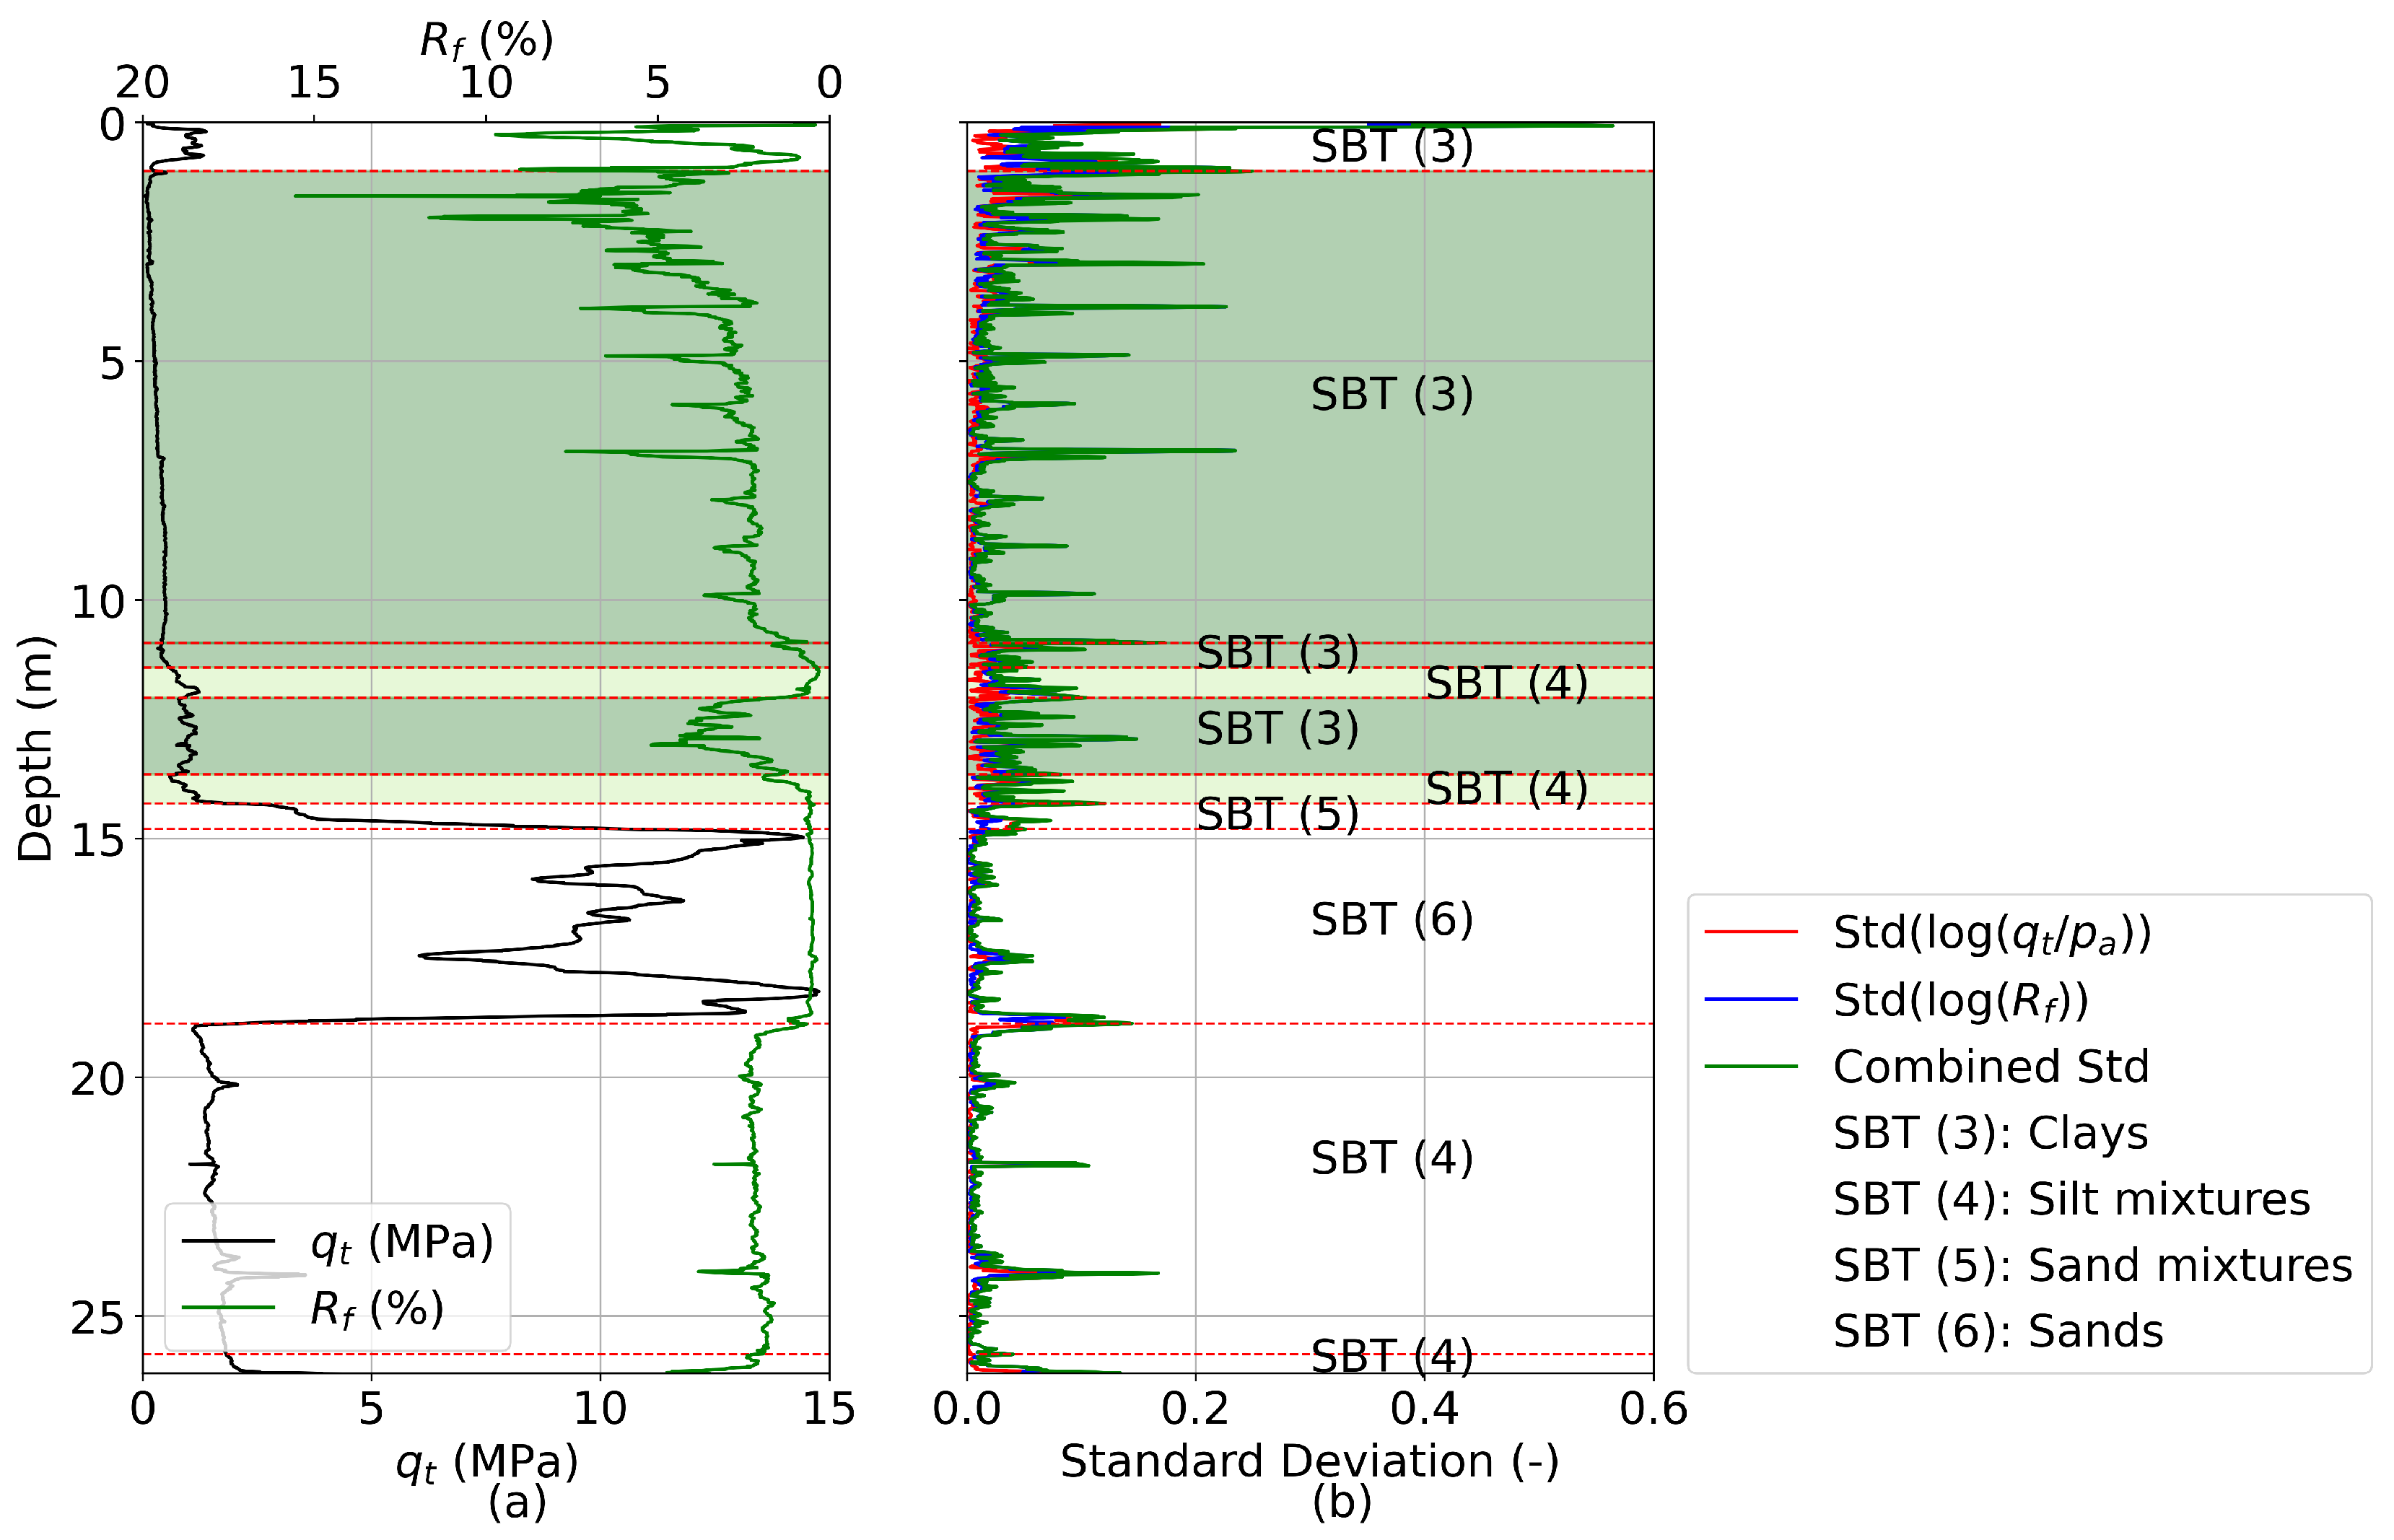
CPT 7–100 MPa (orange lines in Figure 5a–c) was used for stratification, as it was the deepest available sounding. The selected minimum layer thickness ( d min ) was 1 m, the moving window size was set to 7 points, and the threshold value for distinguishing similar layers was 0.2. The output of the stratification algorithm is shown in Figure 6. Figure 6a displays the CPT sounding in terms of q t and R f , while Figure 6b presents the moving standard deviations of log ( q t / p a ) and log R f , along with the combined standard deviation. The boundaries between the detected layers are indicated by horizontal dashed red lines. A total of six layers were identified, with the corresponding soil behaviour types (SBTs) of each layer shown in Figure 6. The three estuarine soft clay layers—relevant to this study—are highlighted in the figure.
It should be noted that the algorithm is sensitive to the user-defined values for the window size, minimum layer thickness, and threshold. When using the same parameters but reducing d min to 0.5 m, the resulting stratification is shown in Figure 7. In this case, the number of layers increases to 10, with the estuarine soft clay represented by five distinct layers. While decreasing d min from 1.0 m to 0.5 m predictably resulted in an increased number of detected layers (from 6 to 10), an interesting observation was that a previously detected thin layer classified as SBT (2) disappeared in the second run. This behaviour can be attributed to the fact that a smaller d min allows for the identification of more closely spaced peaks, which may cause the original peak responsible for separating the SBT (2) layer to be masked or replaced by a nearby stronger peak. Additionally, the altered layer partitioning may result in different adjacent layers being compared during the similarity filtering step. If these newly defined neighbouring layers are deemed statistically similar in the Robertson log-space (i.e., their distance falls below the threshold), the corresponding peak is removed, effectively eliminating the layer. This underscores the high sensitivity of the stratification outcome to the d min parameter and highlights the need for careful calibration. In practice, the selection of d min requires careful consideration. When site data is limited, calibration can be guided by expert judgement, comparisons to geological logs, or manual SBT interpretations. Additionally, performing sensitivity analyses using multiple d min values allows users to assess the robustness of the resulting stratification and its influence on downstream parameter determination. The stratification shown in Figure 6 is used for determining the parameters and modelling the two BVPs. Since the primary focus of this work is on validating the parameter sets derived from APD, further investigation of stratification sensitivity was considered beyond the scope of the current study.

4.2. Constitutive Model

It is necessary to determine the constitutive model before starting the analysis as the methods needed to determine the respective parameters for a given model should be included in the methods CSV file. There are no constraints to which models could be used within the framework of APD, as long as it is possible to determine the parameters from the results of the implemented in situ tests, the methods CSV file can be updated and the corresponding parameters would be computed.
As will be discussed in Section 5, the two BVPs involve predicting the long-term settlements of an embankment and the failure load of shallow footings. For the embankment problem, selecting a constitutive model that incorporates creep behaviour is crucial for reliably predicting long-term settlements. Models that neglect creep effects tend to underestimate both the magnitude and rate of settlement [33]. Therefore, the Soft Soil Creep (SSC) model [34], as implemented in PLAXIS [19], is adopted for both BVPs.

4.3. Parameter Determination

For modelling the BVPs using the Soft Soil Creep (SSC) model, the following parameters are required:
  • Index parameters: unit weight ( γ t ) and void ratio ( e 0 ).
  • Stiffness parameters: modified compression index ( λ ), modified swelling index ( κ ), and modified creep index ( μ ).
  • Strength parameters: effective friction angle ( φ ) and effective cohesion ( c ).
  • Permeability (k)
  • State parameters: overconsolidation ratio (OCR) and coefficient of earth pressure at rest ( K 0 ).
The methods used to determine these parameters are presented in the following tables and equations. For some parameters, methods are available for all three APD workflows (CPT, DMT, and V s ), while others could only be assessed using the CPT-based workflow.
The unit weight is determined using the methods presented in Table 1, while OCR is obtained from the methods listed in Table 2.
In fully saturated conditions, the saturated unit weight is calculated using the following equation:
γ s a t = ( G s + e 0 ) γ w 1 + e 0
Equation (13) can be rearranged to express the void ratio as a function of the saturated unit weight:
e 0 = γ s a t G s γ w γ w γ s a t
In this study, the specific gravity ( G s ) is assumed to be 2.65, and γ w is set to 9.81 kN/m3. The saturated unit weight ( γ s a t ) is determined using the methods presented in Table 1.
Table 2. Selected methods for the overconsolidation ratio ( O C R ).
WorkflowMethod Author
CPT 0.33 ( q t σ v ) m σ v ; m = 1 0.28 1 + ( I c n 2.65 ) 25 (15)[43,44]
0.25 Q t 1.25 (16)[45]
0.2 + 0.39 Q t (17)[46]
1.02 B q 1.077 (18)[47]
0.63 B q 1.286 (19)[48]
( 0.313 ( q t σ v / p a ) 0.514 ( u 2 u 0 / p a ) 0.511 σ v ) p a (20)[49]
1.261 B q 0.462 (21)[49]
DMT ( 0.5 K D ) 1.56 (22)[50]
2 ( P 0 σ v 6.63 σ v ) 1.19 (23)[51]
0.24 K D 1.32 (24)[52]
0.0135 K D 2 + 0.4959 K D 0.0359 (25)[53]
V s 0.01 V s 2 σ v (26)[54]
0.106 V s 1.47 σ v (27) [55] as cited in [54]
0.007691 V s 2.009 σ v (28)[56]
0.1097 V s 1.3575 σ v (29)[1]
Note: I c n = normalised soil behaviour type (SBT) index; B q = pore pressure parameter ratio; u o = in situ pore pressure; K D = horizontal stress index.
The stiffness parameters for the SSC model ( λ , κ , and μ ) are determined as follows:
  • Modified compression index ( λ ): A direct method between CPT measurements and the compression ratio ( C R ) is provided by [57]:
    C R = 0.036 R f + 0.132
    where λ = C R 2.3 .
    Alternatively, several empirical correlations exist between the compression index ( C c ) and common index parameters such as the plasticity index ( P I ), void ratio ( e 0 ), and liquid limit ( L L ). In this study, the following method between C c and P I from [58] is used:
    C c = P I 74
    from which λ is calculated as follows:
    λ = C c 2.3 ( 1 + e 0 )
    The plasticity index ( P I ) can be estimated from CPT data using the method proposed by [59]:
    P I = 17.5 R f ( 1 + B q ) 1.2 ( 0.33 Q t ) 0.31
  • Modified swelling index ( κ ): κ is determined from λ according to [57]:
    κ = 0.16 λ
  • Modified creep index ( μ ): Two methods for estimating the creep ratio ( C α ) are presented in [57]:
    C α = 0.143 C R 1.635
    C α = 0.00473 R f
    and μ is then computed as
    μ = C α 2.3
The effective friction angle ( φ ) was determined using the CPT-based workflow according to the method proposed by [60]:
φ = 29.5 B q 0.121 0.256 + 0.336 B q + log Q t
The effective cohesion ( c ) is estimated based on the preconsolidation stress ( σ p ) as follows [60]:
c = 0.03 σ p
The coefficient of permeability (k) is calculated according to [61] using two expressions depending on the value of the soil behaviour type index I c n :
k = 10 ( 0.952 3.04 I c n ) for 1.0 < I c n 3.27 10 ( 4.52 1.37 I c n ) for 3.27 < I c n < 4.0
The coefficient of earth pressure at rest ( K 0 ) is calculated using the method by [62], as cited in [63]:
K 0 = 1 sin φ c v · O C R sin φ c v
where φ c v denotes the critical state friction angle. Following [64], a mean value of 28 . 6 was used.

4.4. Results

In this subsection, the SSC model parameters obtained from APD using the in situ test data (see Figure 5) are presented. The stratification process resulted in a total of six layers, three of which correspond to the estuarine soft clay (see Figure 6). As this layer governs the behaviour of both BVPs, the analysis in this study focuses on these three layers. For the remaining layers—the top crust, the sand layer beneath the estuarine clays, and the clay layer below the sand—material parameters are taken from the literature, as discussed in Section 5. For the three selected layers, the averaged values from the in situ tests are shown in Figure 8. These averaged values serve as input for parameter determination using the methods described in Section 4.3. In total, six graphs were generated, corresponding to the six identified layers. The results used in this study were extracted from the three graphs associated with the three estuarine soft clay layers. It should be noted that the results could alternatively be obtained at the measurement level or at user-defined depths, rather than being based solely on the output of the stratification algorithm.
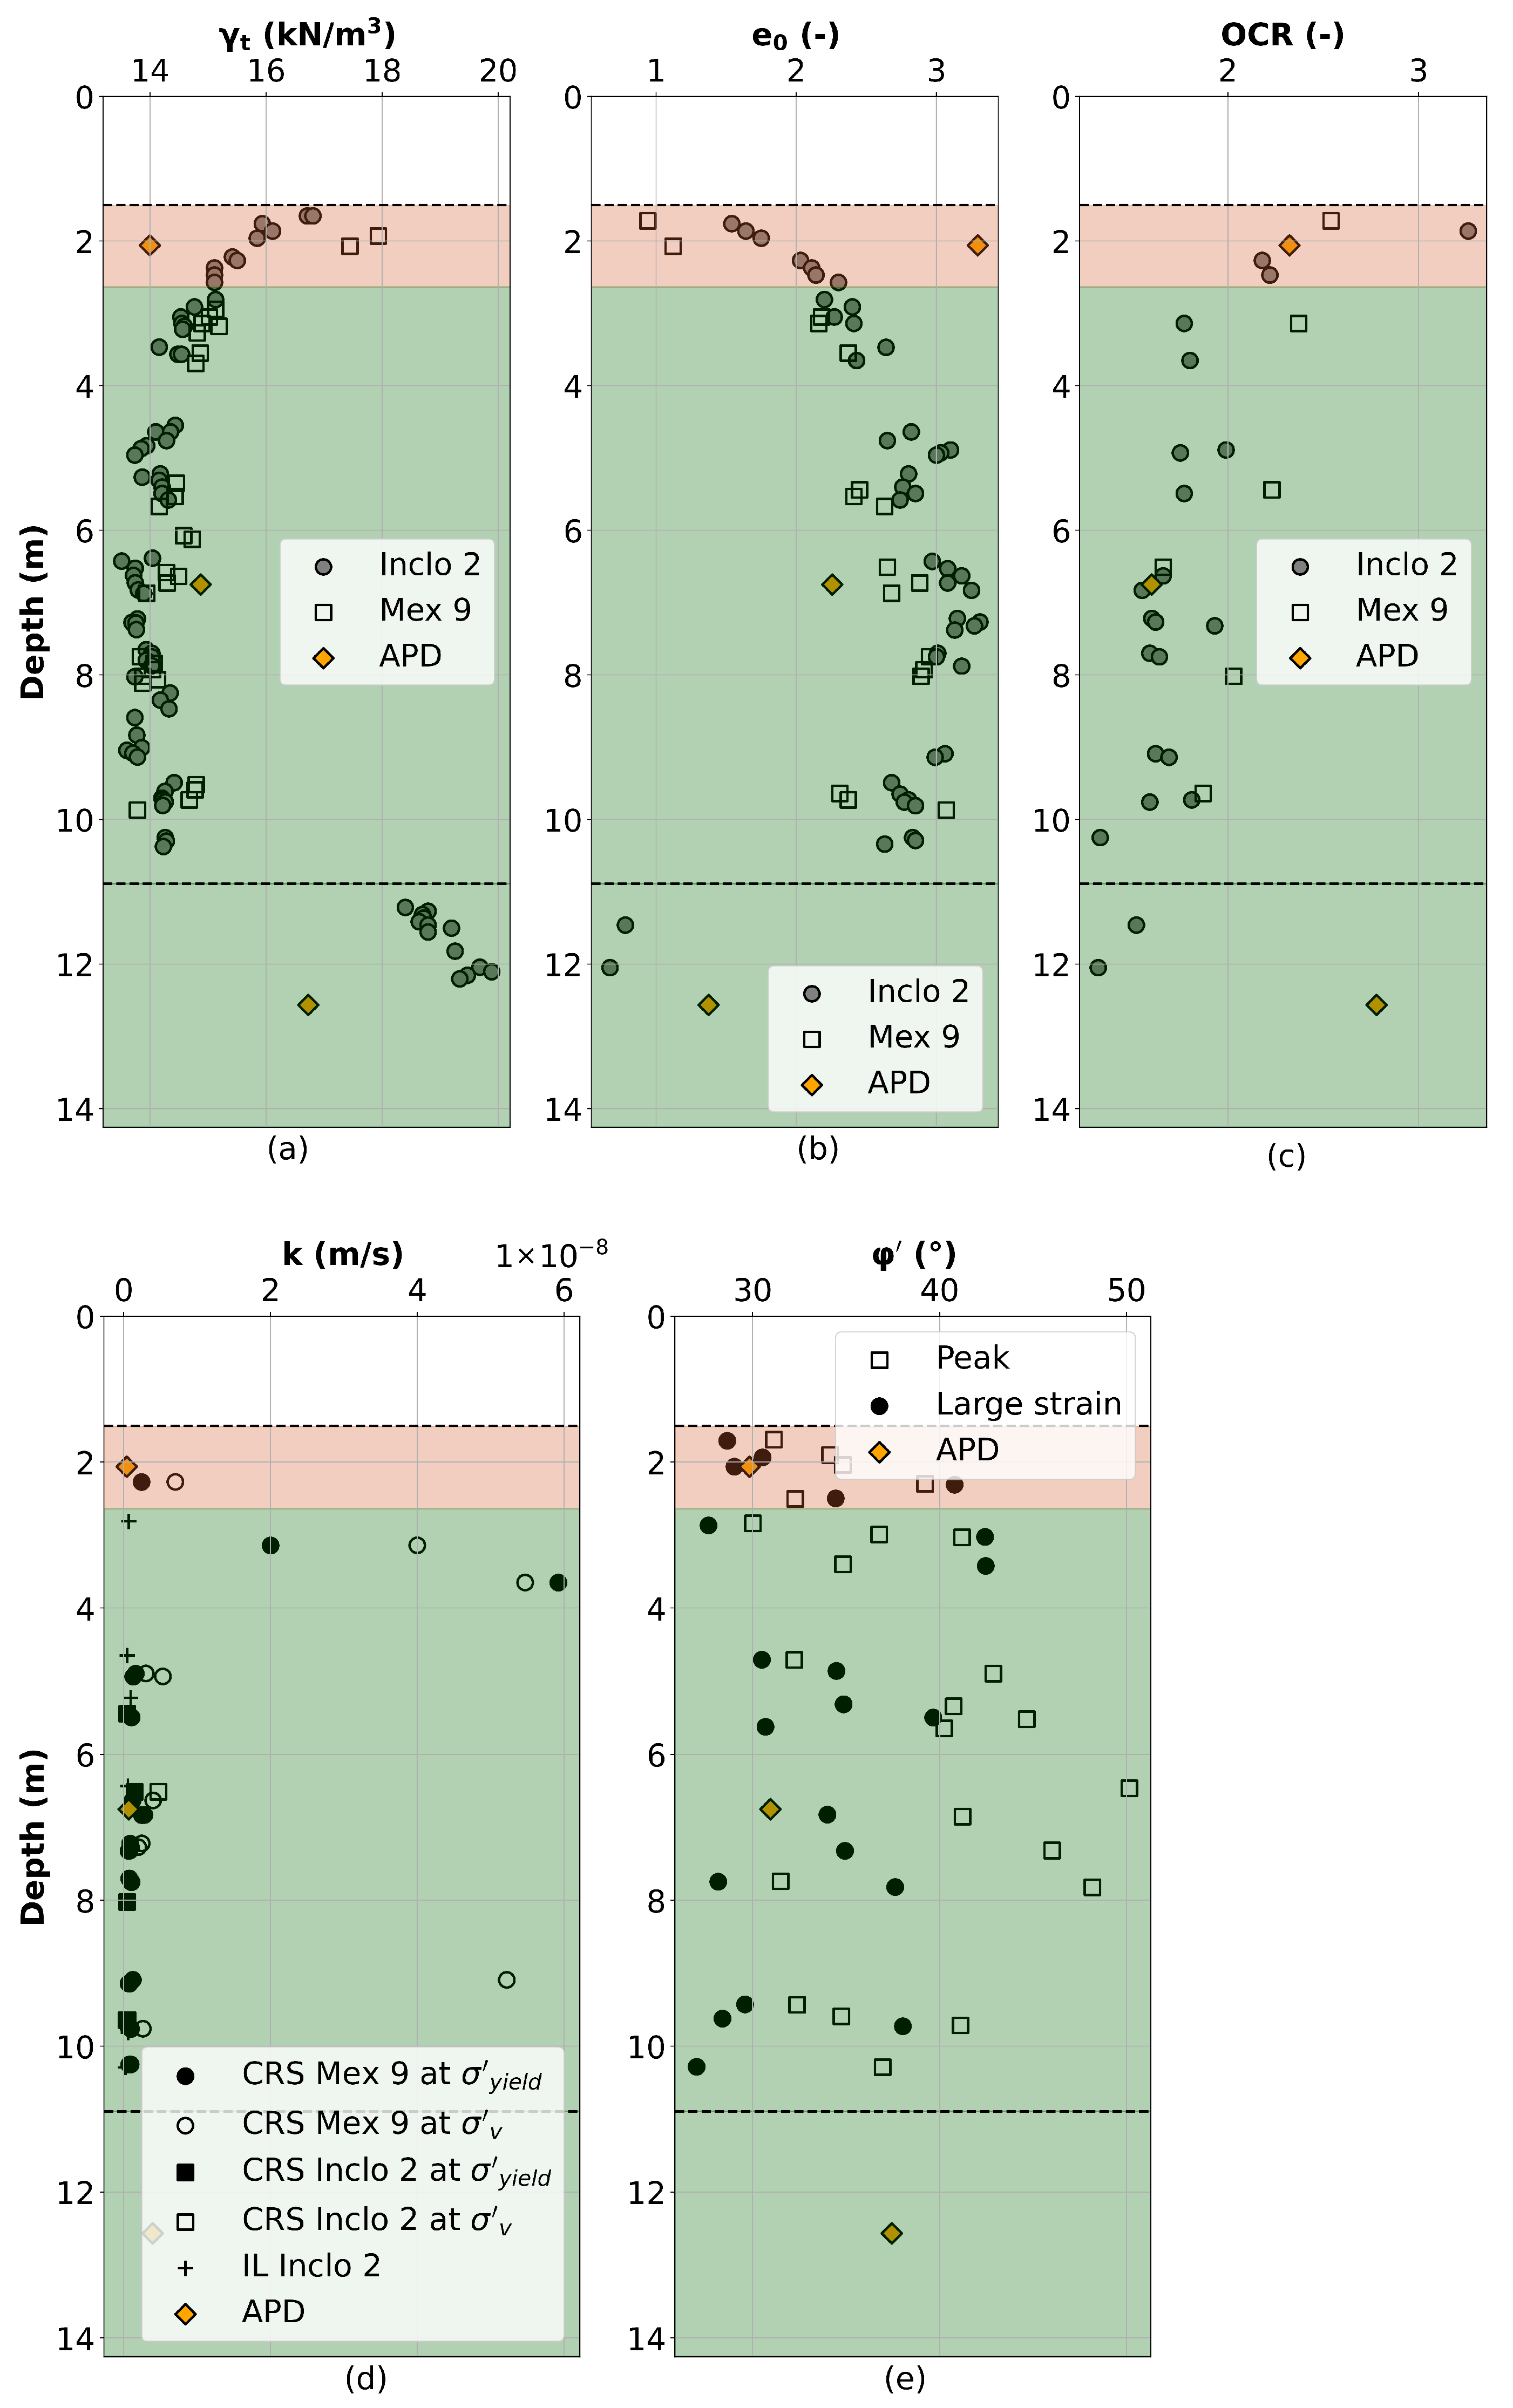
The results for unit weight, void ratio, OCR, permeability, and effective friction angle are presented in Figure 9a–e, respectively. The averaged values obtained from APD are indicated by orange diamonds in each figure. Additionally, values interpreted from laboratory tests conducted at the test site are also included for comparison. The final values for these five parameters, along with the remaining parameters presented in Section 4.3, are summarised in Table 3.
Starting with the unit weight (Figure 9a), the orange diamonds represent the average of 21 values determined using the methods listed in Table 1, including four CPT-based methods applied to three CPT soundings, five DMT-based methods, and four methods based on V s measurements. Reference values obtained from laboratory tests on samples from the two boreholes (Inclo 2 and Mex 9) are also shown in the figure. The averaged values from APD tend to underestimate the reference unit weight in estuarine layers 1 and 3, while providing a reasonable estimate in estuarine layer 2.
As discussed in Section 2.1, an initial unit weight must be defined after importing the raw in situ measurements. This initial value governs the calculation of effective and total stresses and affects derived CPT and DMT parameters—particularly those involving stresses. In the DMT-based workflow, the initial unit weight is determined using Marchetti’s chart [38]. Preliminary investigations indicated that underestimating the initial unit weight in the CPT-based workflow influences stress-dependent parameters, such as OCR. Equation (2) underestimates the reference unit weights in estuarine layers 1 and 3 but provides a reasonable estimate for layer 2. Conversely, Equation (4) shows good agreement with the reference values in layers 1 and 3 but overestimates the unit weight in layer 2. Based on these observations, a combined approach was adopted for estimating the initial unit weight in the CPT-based workflow: Equation (4) was used for all layers except estuarine layer 2, for which Equation (2) was applied.
Since the void ratio is computed directly from the unit weight using Equation (14), the underestimation of unit weight in estuarine layers 1 and 3 results in an overestimation of the corresponding void ratios, as shown in Figure 9b. In contrast, the average value obtained from APD for layer 2 provides a reasonable estimate when compared to the reference data.
The average OCR values obtained from APD (Figure 9c) indicate that the estuarine layers are overconsolidated. This is consistent with the reference values for layers 1 and 2; nevertheless, OCR is overestimated for layer 3 compared to the corresponding reference values. This overestimation has implications for the embankment prediction, as demonstrated in Section 5.1.
Permeability is estimated using the CPT-based workflow via Equation (40). Reference values are derived from constant rate of strain (CRS) tests conducted at both the in situ effective stress and the yield stress ( σ y i e l d ) for samples from both boreholes. Additionally, values obtained from incremental loading (IL) tests are included for comparison. The predicted permeability underestimates the reference value for estuarine layer 1 but provides, overall, a reasonable estimate for layer 2.
The effective friction angle is evaluated through the CPT-based workflow using Equation (38). Reference values comprise peak friction angles and large-deformation (constant-volume) friction angles derived from K 0 -consolidated undrained triaxial tests (C K 0 U) conducted on both natural and reconstituted samples [24]. The predicted values show better agreement with the large-strain friction angles, while they tend to underestimate the peak values.
The results for the five parameters (presented in Figure 9), along with the remaining SSC parameters, are summarised in Table 3. The stiffness parameters for the SSC model are determined using the CPT-based workflow, as described in Section 4.3. The effective cohesion ( c ) is computed using Equation (39), based on the preconsolidation stress derived from the average OCR values and the average effective stress obtained across the three APD workflows. The coefficient of earth pressure at rest ( K 0 ) is calculated using Equation (41), also based on the average OCR values from the three workflows.
To account for the influence of void ratio change on permeability, parameter c k is defined. It is determined using the empirical correlation proposed by [65] based on the average void ratio from the three workflows:
c k = 0.5 e 0

5. Boundary Value Problems

This section presents the modelling details of two BVPs to assess the accuracy of the predicted parameters using the material sets provided in Table 3. Both BVPs were part of a prediction exercise held in Newcastle, Australia, in 2016 [33,66].
The stratification shown in Figure 6 is applied to both models (embankment and footings). The only difference regarding the stratification between the two FE models lies in the thickness of the top crust: for the embankment BVP, the top crust is 1.0 m thick, while for the shallow footing BVP, it is 1.5 m thick. In both cases, the groundwater table is located 1.0 m below ground level.
The APD framework automatically imports in situ test data, stratifies the soundings, computes both soil and constitutive model parameters, and transfers the results to PLAXIS (version 24.3). A borehole is then created in PLAXIS, with layers defined according to the stratification. For each layer, the corresponding computed parameters are assigned. The top crust (above the estuarine layers), the underlying sand, and the deeper clay layer are modelled using the HSS model, adopting the parameters reported by [26] as presented in Table 4.

5.1. Long-Term Settlements of Embankment

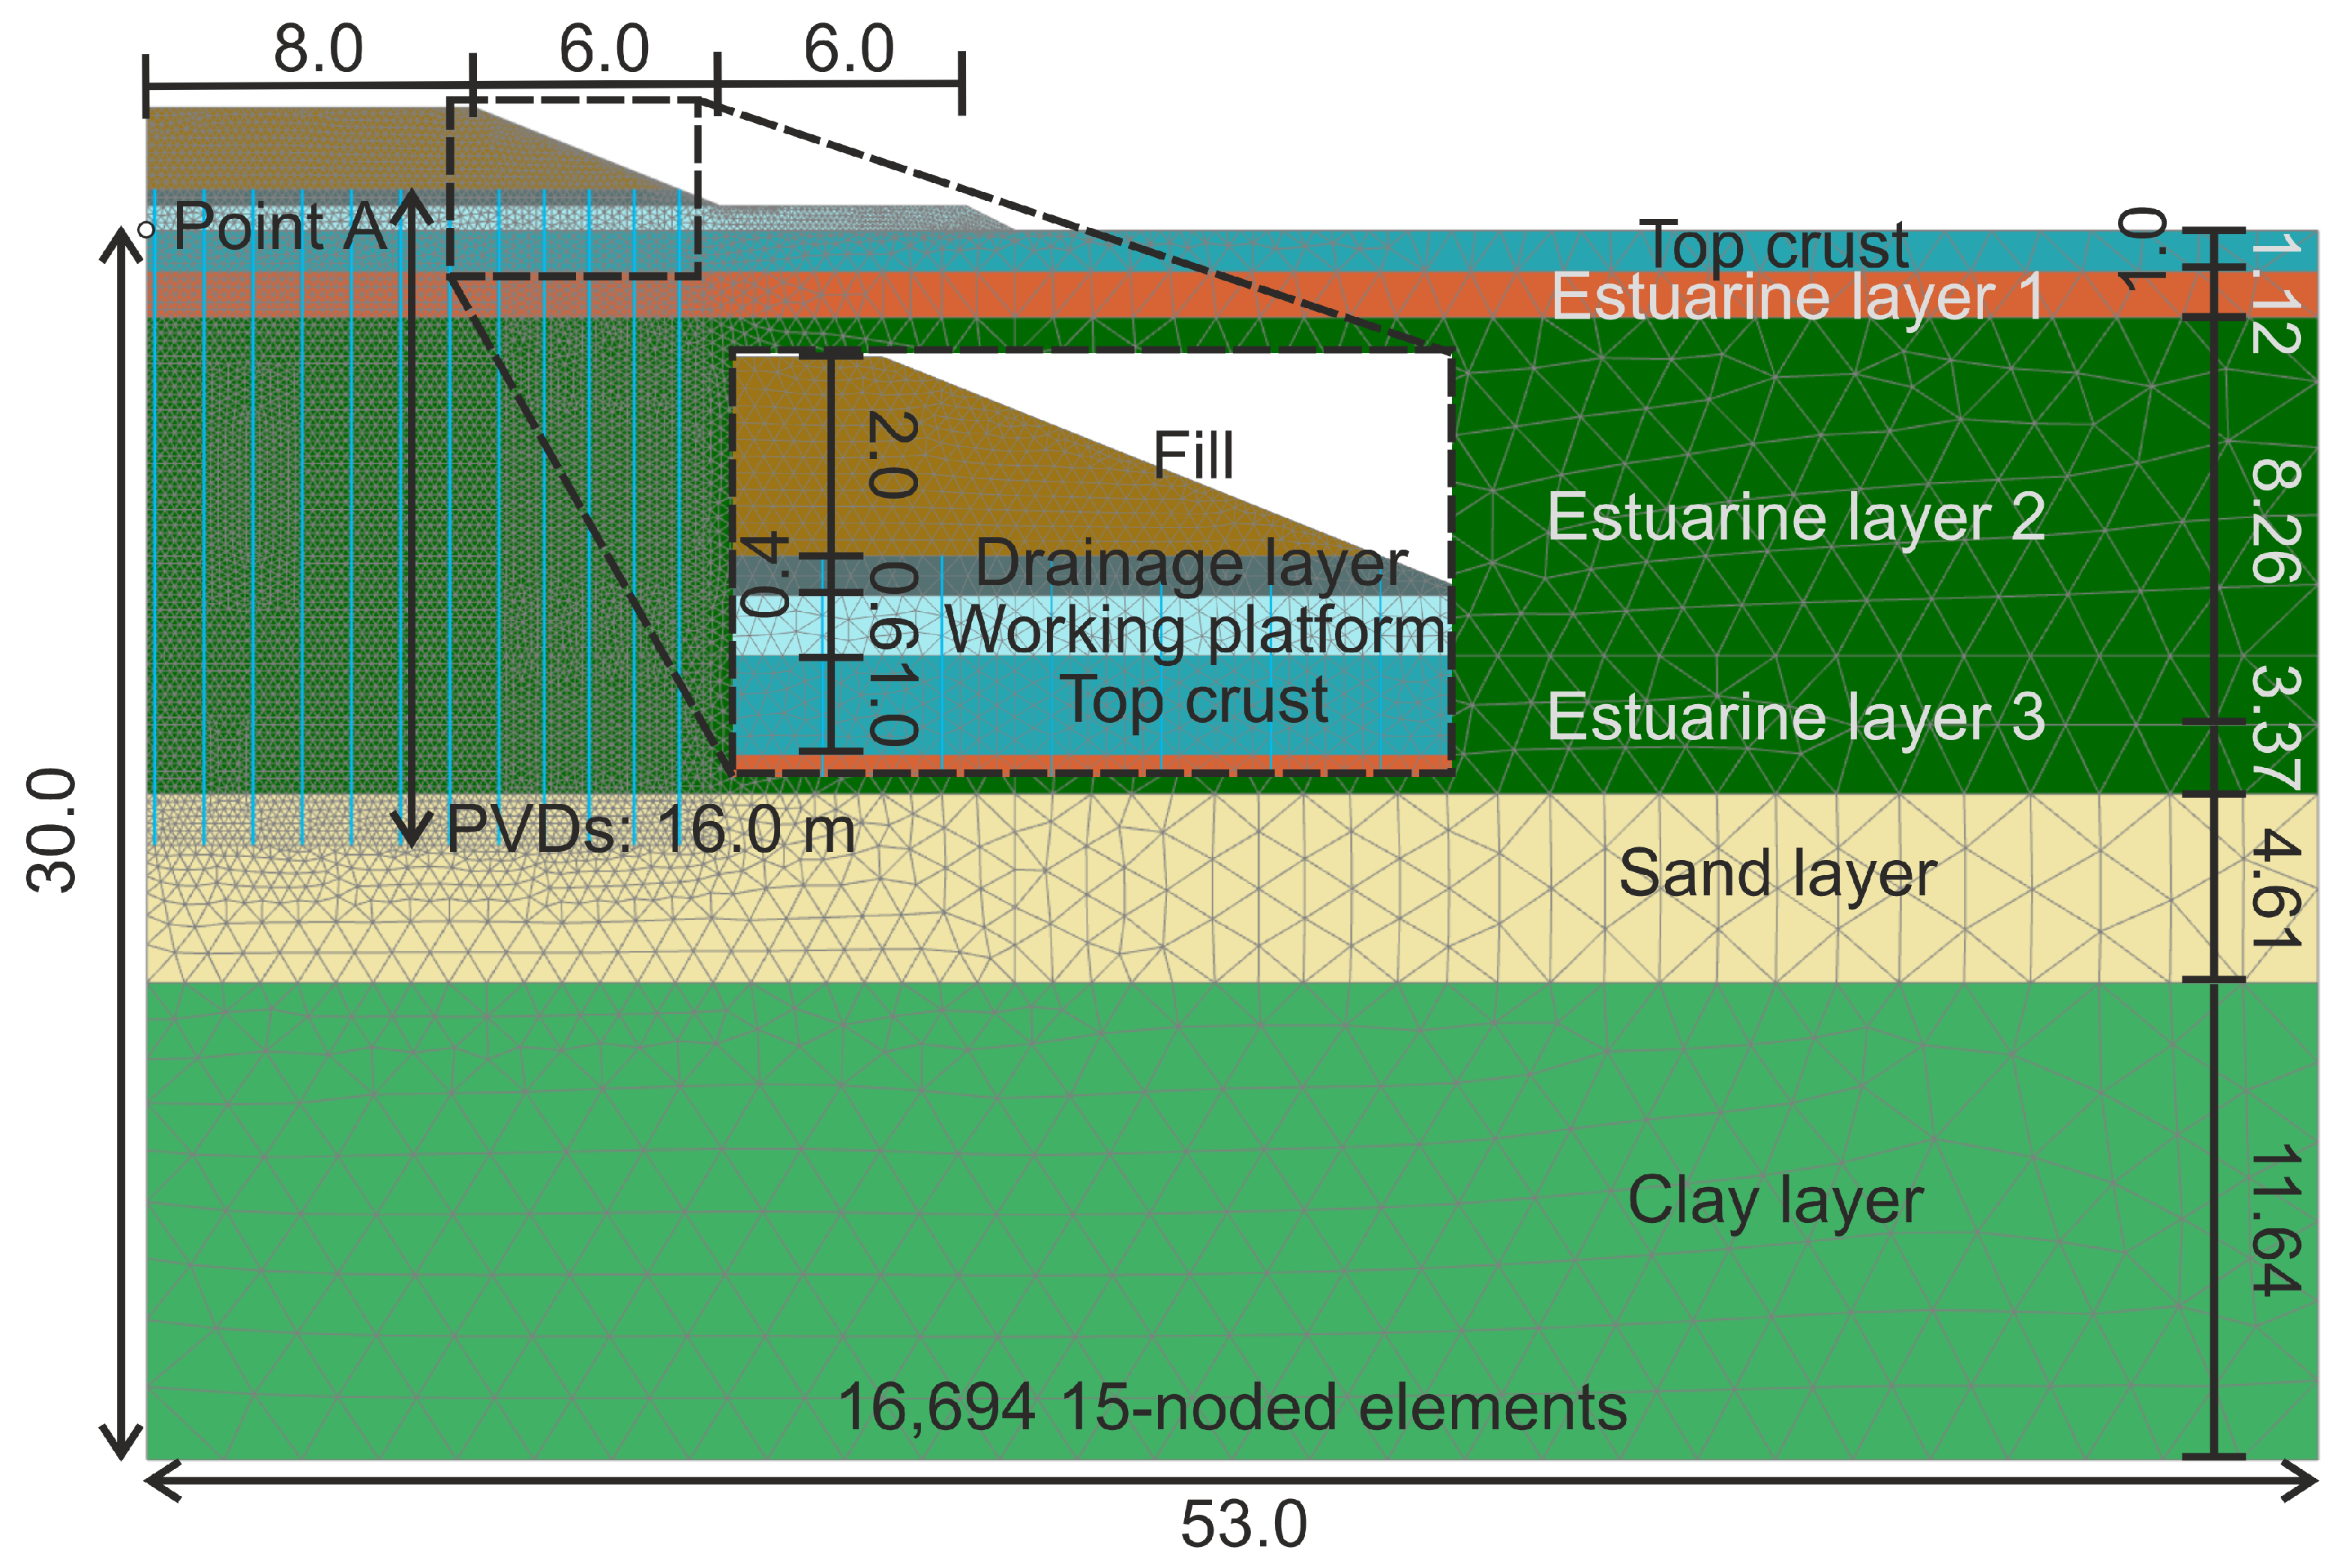
Figure 10 presents the 2D plane strain FE model used for the embankment BVP. The model consists of 16,694 15-noded elements with a fourth-order shape function and spans a total width of 53 m with a depth of 30 m. Due to the embankment’s symmetry, only one half of it was included in the model. Further details about the embankment are provided in [33].
Prefabricated vertical drains (PVDs) were explicitly modelled using drain elements. In the regions influenced by the PVDs, the horizontal permeability was adjusted to account for plane strain conditions using the approach described in [67].
The numerical analysis was performed considering the effects of consolidation during staged construction. The calculation steps were defined as follows:
  • Initial phase;
  • Installation of a 0.6 m working platform (see Figure 10)—duration: 3 days;
  • Consolidation—duration: 14 days;
  • Installation of a 0.4 m sand layer (see Figure 10)—duration: 8 days;
  • Activation of PVDs—duration: 23 days;
  • Construction of a 2.0 m embankment (see Figure 10)—duration: 16 days;
  • Final consolidation—duration: 1026 days.
The time–settlement response is evaluated at point A (refer to Figure 10) and compared with field measurements obtained from four settlement plates (SPs) installed along the centreline of the embankment [33].
The results for the time–settlement behaviour at point A are presented in Figure 11. The performance of the SSC model, using the parameters listed in Table 3, is shown by the blue line. Field measurements from the four settlement plates indicate that the long-term settlements range between 1.46 and 1.51 m. In comparison, the material set derived from APD predicted a long-term settlement of 1.17 m.
A detailed comparison of the predicted parameters with reference values obtained at the site reveals that OCR was overestimated for estuarine layer 3 (see Figure 9c). This overestimation is primarily attributed to the CPT- and V s -based workflow methods. When only the DMT-based workflow is considered, the OCR for this layer decreases from 2.779 to 1.219. This reduction subsequently affects both K 0 and c : K 0 decreases from 0.8503 to 0.5732, and c decreases from 6.088 to 2.671 kPa.
To evaluate the influence of OCR on the computed settlements, the material set was updated by assigning the reduced OCR value to layer 3. The resulting time–settlement curve is shown in Figure 11 (orange line). This reduction in OCR leads to an increase in the predicted long-term settlement to 1.40 m, providing a closer match to the measured values.
The prediction exercise involved 28 participants, and the predicted long-term settlements after three years ranged from 0.45 m to 1.40 m, indicating a significant degree of scatter [33]. In contrast, the parameters obtained from APD were derived solely from in situ test data. Despite this, the predicted settlements showed reasonable results. After further examining the material set and reducing the OCR value for layer 3, the predicted settlements aligned very closely with the measured values. This highlights the potential of the APD to provide reliable and consistent material sets for numerical modelling applications.

5.2. Failure Load of Shallow Footing

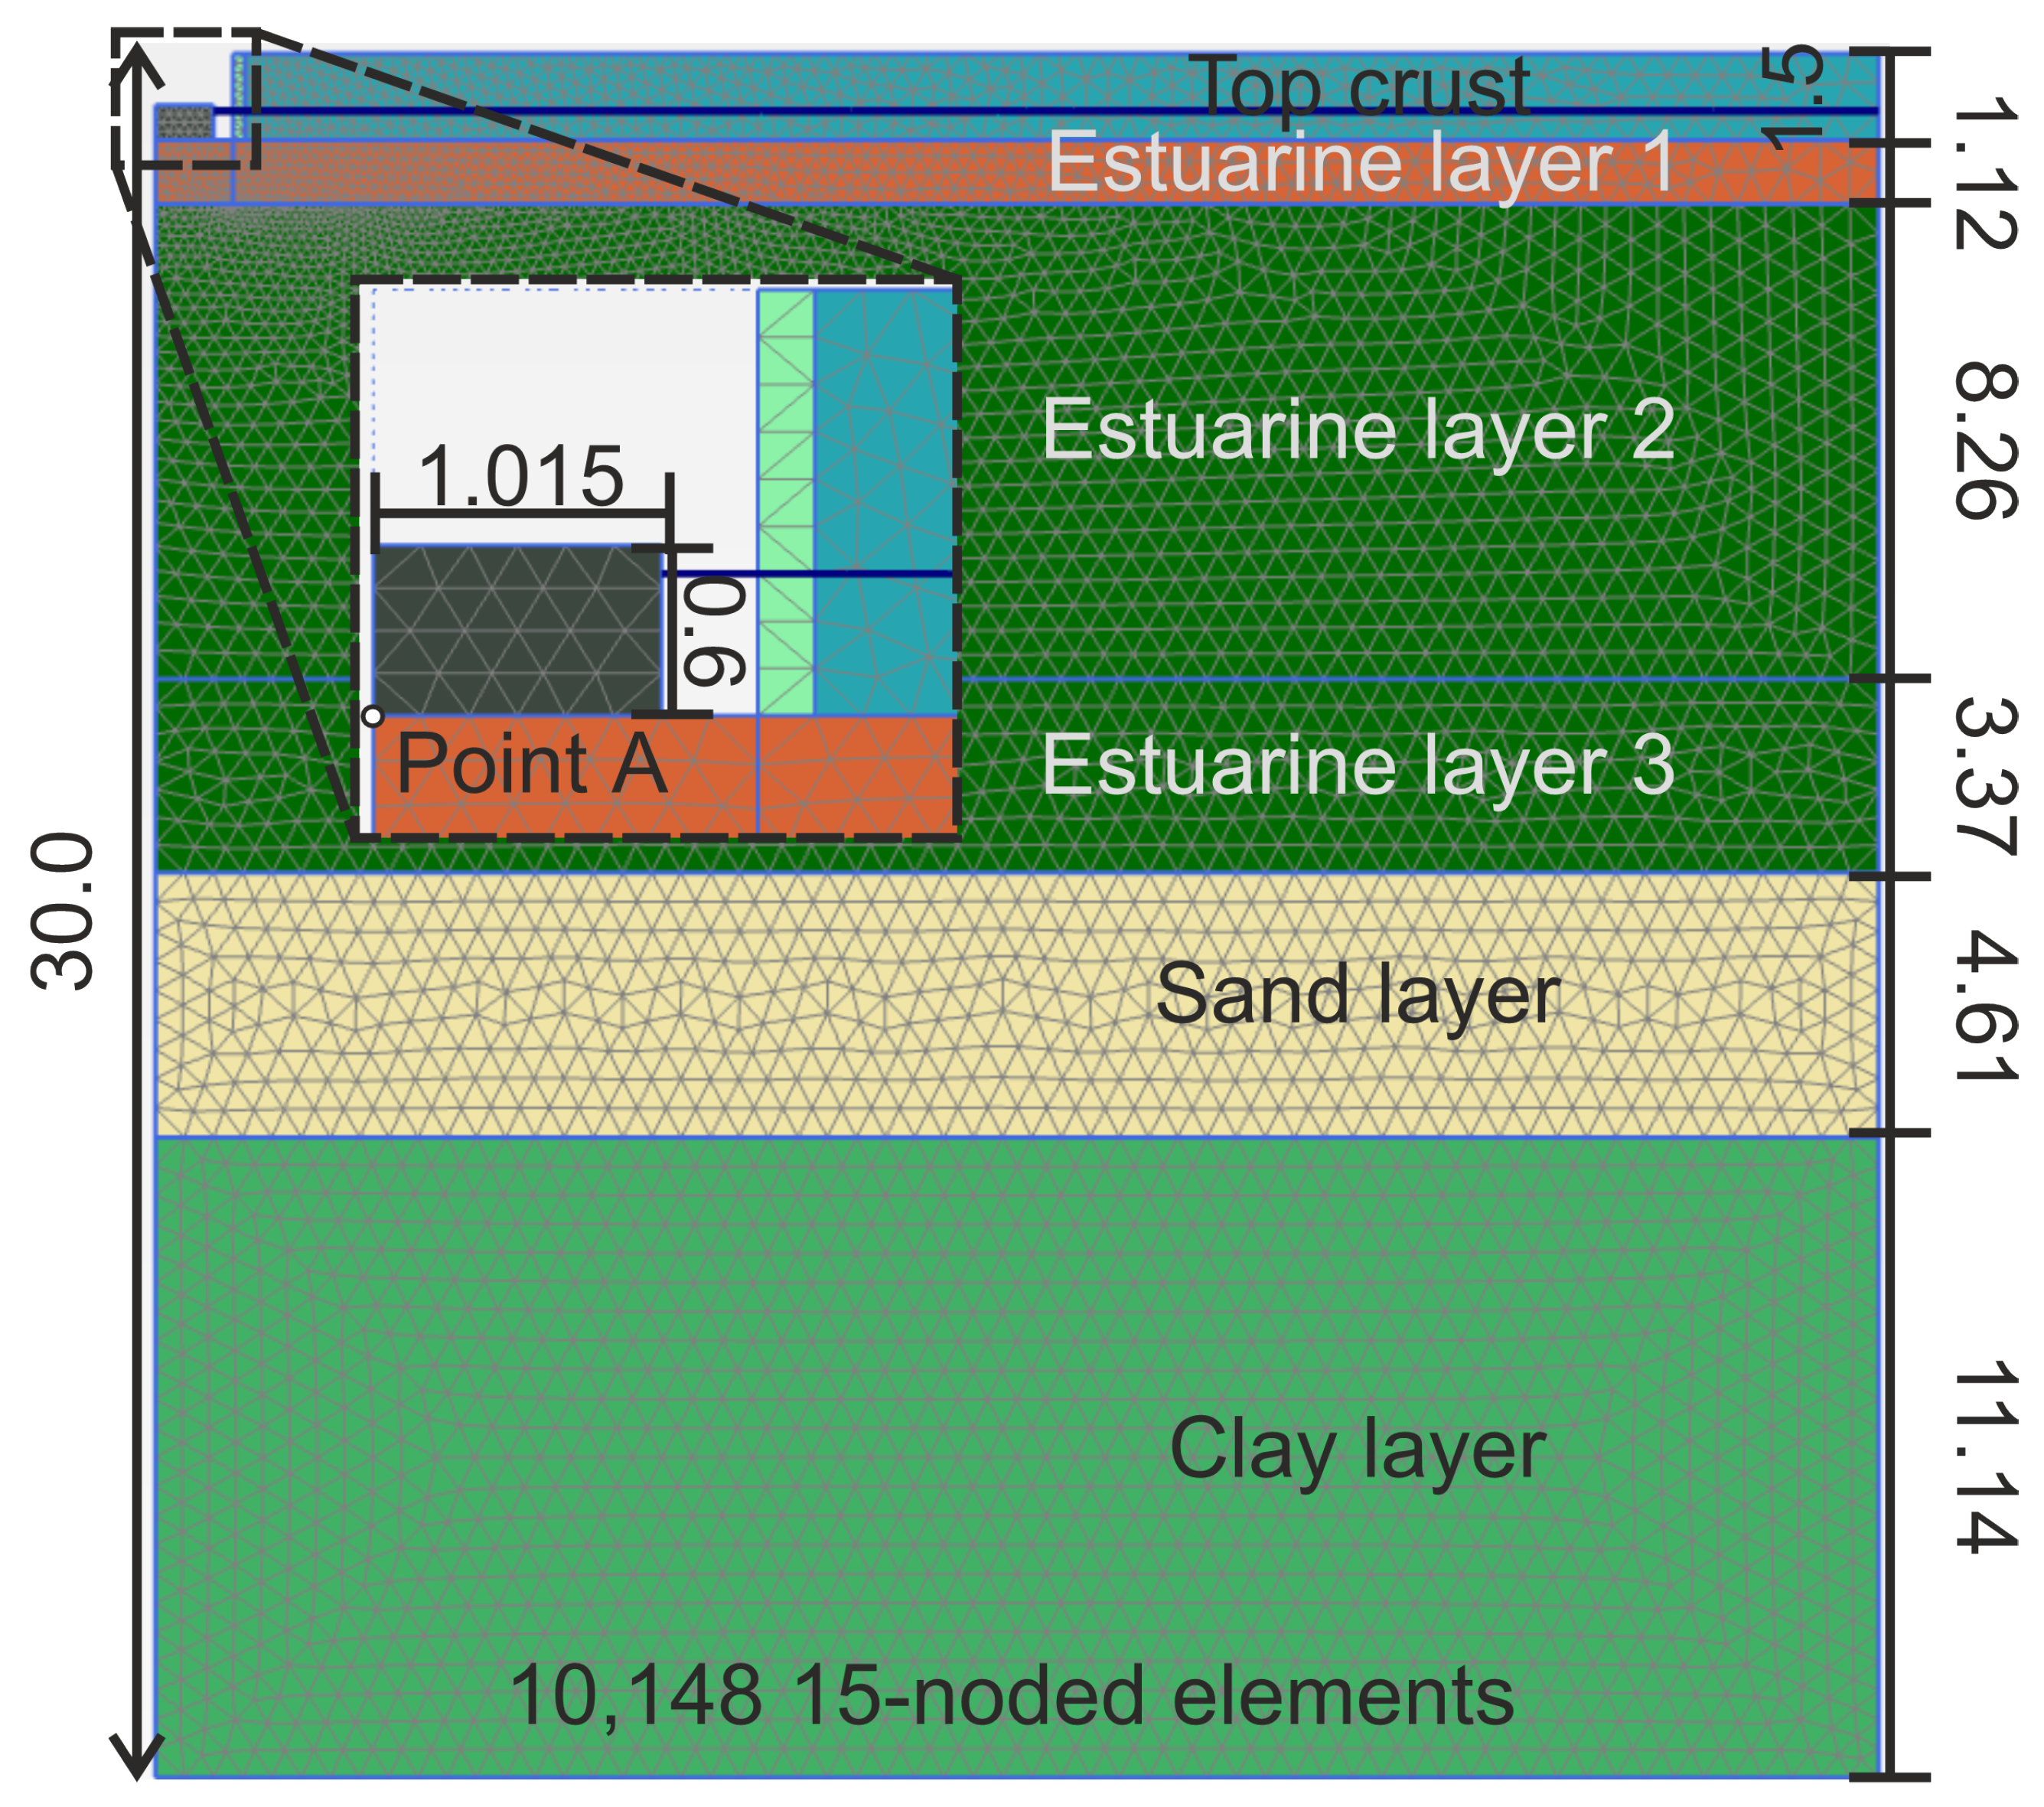
Figure 12 presents the 2D axisymmetric FE model used for the shallow footing BVP. The model consists of 10,148 15-noded elements with fourth-order shape functions, spanning a total width of 30 m and a depth of 30 m. Detailed information about the footing can be found in [68].
To account for the area of the square footing and the excavation in the axisymmetric model, the radii of the footing and excavation were adjusted so that the corresponding circular areas matched the actual geometry. This geometric adjustment is illustrated in Figure 12. To maintain the stability of the upper crust during excavation, a thin zone with a width of 20 cm was incorporated along the left boundary of the layer. This cluster shares the same properties as the top crust but includes additional cohesion to prevent failure. The numerical simulation was carried out in the following steps:
  • Initial phase;
  • Excavation;
  • Construction of the footing;
  • Consolidation-duration: 30 days;
  • Application of load.
The load–settlement behaviour at point A (see Figure 13) was evaluated using both the SSC material set presented in Table 3 and the modified set with reduced OCR for layer 3. The results are shown in Figure 13b, while the corresponding failure mechanism—based on the reduced OCR set—is illustrated in Figure 13a.
The load–settlement curves for the two shallow footings (UU1 and UU2; see Figure 4) are also included in the figure. The estimated failure load from both tests was approximately 205 kN, occurring at a settlement of 22 mm. The predicted failure load using both material sets (green and red lines) is 196 kN, which agrees well with the field measurements. However, the settlement at failure is significantly overestimated, with the predicted value reaching approximately 50 mm. This overprediction of settlement at failure is also reported in [66]. Employing a constitutive model that accounts for small-strain stiffness effects—such as the HSS model—would likely improve the agreement between the measured and simulated responses, particularly in the initial soft response phase highlighted by both the red and green curves. Nevertheless, the objective of this study was to employ a consistent material model and, of course, parameter set across both BVPs. Therefore, the shallow footing BVP was analysed using the same SSC model and parameters applied in the embankment BVP, since creep effects contribute significantly to the considered SLS BVP.

6. Discussion

This section provides a discussion of the study’s scope and addresses additional considerations regarding the APD framework.

6.1. Motivation of the Study

Previous studies employing the APD framework focused primarily on validating the tool’s output in terms of soil parameters by comparing them with values interpreted from laboratory tests at various sites. The tool was applied to clay, silt, and sand sites of the Norwegian Geotechnical Test Sites (NGTSs) in these studies [10,13,15], respectively. Additionally, it was applied to a soft clay site in Canada, as presented in [16].
Validating the output in terms of constitutive model parameters and its consequence on BVPs is more challenging than for soil parameters. It depends not only on the availability of well-documented BVPs but also on the limitations of the constitutive models and the feasibility of deriving their parameters from in situ tests. An attempt to validate the constitutive model output from APD was made in [15], where CASM material sets were used to numerically simulate CPTs at various depths, and the results were compared to the original CPTs used to derive the parameters.
This study presents two well-documented BVPs that were part of a prediction competition held in 2016. The Soft Soil Creep (SSC) model was selected for parameter determination, as it was known in advance that creep behaviour would play a decisive role in the long-term settlement behaviour of the embankment. The initial material dataset obtained from APD was based on the average of all values computed across the three workflows (CPT, DMT, and V s ). While this averaged dataset resulted in an underestimation of the final settlement, the overall model performance was considered reasonable. Further analysis revealed that the OCR value for estuarine layer 3 was overestimated, primarily due to the OCR methods of the CPT- and V s -based workflows. When these methods were excluded and only the DMT-based workflow was considered, the long-term settlement predictions aligned much more closely with field observations.
For the shallow footing BVP, the predicted failure load closely matched the measured value, indicating that the effective strength parameters obtained using APD were within a realistic range. However, the settlement at failure was overestimated. Incorporating a model that accounts for small-strain stiffness would likely improve the prediction of settlement at failure. Nevertheless, there is no constitutive model available in the used FE software, which accounts for both creep and small-strain stiffness.
The prediction exercise for both BVPs showed a wide scatter in the submitted results [33,66], highlighting that the material sets derived from APD provided reasonable predictions. Overall, the findings from both BVPs demonstrate that APD-derived material sets can be effectively used to model real-world geotechnical problems. Nevertheless, engineering judgement remains essential when interpreting the obtained parameters and evaluating the results.

6.2. Initial Unit Weight

The initial unit weight plays a critical role in the analysis from the early stages. It is, thus, advisable to establish a representative value using relatively low-cost tests that can be conducted in the early stages of a project. If such tests are unavailable, the selected unit weight should be cross-checked against typical values known for the specific site based on prior experience. Additionally, sensitivity analyses can be performed by repeating the analysis using different methods for estimating the initial unit weight to assess its influence on the resulting material sets. A new feature is under development that enables users to automatically repeat the analysis using updated initial unit weights derived from Module 4 of the different APD workflows.

6.3. Uncertainty in the Obtained Values

Determining parameters based on correlations is inherently associated with uncertainty. Correlations are often site-specific and typically applicable to certain soil types and conditions. Incorporating multiple correlations for each parameter within the APD framework increases this uncertainty.
Relying solely on the average of all obtained values is questionable, as the mean may still be influenced by outliers. Therefore, it is essential to evaluate the validity of each method and the distribution of all computed values before averaging or to consider alternative statistical approaches.
Figure 14 illustrates the uncertainty through various statistical measures. The results for two parameters—unit weight ( γ t ) and OCR—are presented as examples in Figure 14a and Figure 14b, respectively. Furthermore, the probability density function (PDF) for γ t in layer 1 is shown in Figure 14c. For the three estuarine clay layers, values computed from the three workflows (CPT, DMT, and V s ) were collected—21 values in the case of γ t , for example. The mean, median, and standard deviation were then calculated, and a 95% confidence interval was constructed for each parameter at each layer.
The confidence interval indicates the range in which the actual population mean is likely to fall, based on a chosen confidence level (95% in this study). The computation relies on the standard error of the mean together with the critical value obtained from the t-distribution. In Figure 14, the median is marked by a red circle, the mean by a black circle, and the standard deviation ( σ ) is illustrated by grey dotted lines, with the values indicated along the top x-axis. The results reveal that the scatter in the computed values varies with depth. For the unit weight, the greatest scatter is observed in estuarine layer 1, with decreasing variability in the subsequent layers. A similar trend is seen for OCR, although the scatter increases again in layer 3 after decreasing in layer 2.
To address the issue of uncertainty, a statistical module is currently being developed as an add-on to APD. The objective of this module is to provide users with deeper insights into the variability of the computed values by offering additional statistical metrics (e.g., as shown in Figure 14) and visualising the distributions of different parameters across layers.
Users will then be able to select a representative value for each parameter based on statistical measures such as the mean, median, minimum, maximum, or a trimmed mean (e.g., excluding outliers from the distribution). The influence of these selections can be further explored by simulating element tests available in FE software, such as the SoilTest tool in PLAXIS. This will give users valuable feedback on how their parameter selections affect the stress–strain behaviour at the element level.

7. Conclusions

APD is a parameter determination tool that employs a graph-based approach to derive soil and constitutive model parameters from in situ test data. At the early stages of geotechnical projects—when soil information is still limited—this tool can provide valuable insights and support initial site characterisation. During this phase, cost-effective in situ tests such as CPT and DMT are commonly performed prior to laboratory testing. The purpose of the framework is not to replace or eliminate laboratory testing but to complement it; laboratory results remain essential for refining parameter values in the final design stage. A key feature of the framework is its transparency and adaptability: it not only allows users to trace how parameter values are computed, but also gives them control over the selection of methods used in the computation.
Section 3 introduces the testing facility used in this study, including the site layout and the in situ tests considered. Section 4 describes the stratification approach applied, as well as the methods used to determine the parameters for the Soft Soil Creep (SSC) model. In addition, the derived parameters are presented, with several of them compared to reference values interpreted from laboratory tests.
Section 5 describes the two BVPs and their corresponding numerical models. The results of the embankment BVP demonstrated that the long-term time–settlement behaviour was reasonably predicted, although the final settlement was initially underestimated. A closer examination of the material set revealed that reducing OCR for estuarine layer 3 led to a more accurate prediction of the final settlement. For the shallow footings, the predicted failure load showed very good agreement with the measurements; however, the settlement at failure was overestimated. Finally, Section 6 discusses several aspects of the framework and outlines current research activities aimed at enhancing its capabilities—specifically, by integrating statistical tools to evaluate parameter variability and allowing users to assess the influence of their selections through element-level simulations (e.g., PLAXIS SoilTest).

Author Contributions

Conceptualisation, I.M. and F.T.; methodology, I.M. and F.T.; software, I.M.; validation, I.M. and F.T.; formal analysis, I.M. and F.T.; investigation, I.M.; resources, I.M. and F.T.; data curation, I.M.; writing—original draft preparation, I.M.; writing—review and editing, I.M. and F.T.; visualisation, I.M.; supervision, F.T.; project administration, F.T. All authors have read and agreed to the published version of the manuscript.

Funding

This research received no external funding.

Data Availability Statement

The data used in this study was obtained from Datamap (www.geocalcs.com/datamap, accessed on 1 June 2025) as described in the paper.

Acknowledgments

The authors extend their gratitude to the members of the APD group, Arny Lengkeek, and Ronald Brinkgreve for their valuable contributions. Special thanks to Richard Kelly and Jubert Pineda for providing the CPT soundings used in this study. We gratefully acknowledge the financial support from the Open Access Funding by the Graz University of Technology for providing the open access funding.

Conflicts of Interest

The authors declare no conflicts of interest.

References

  1. Duan, W.; Cai, G.; Liu, S.; Puppala, A.J. Correlations between Shear Wave Velocity and Geotechnical Parameters for Jiangsu Clays of China. Pure Appl. Geophys. 2019, 176, 669–684. [Google Scholar] [CrossRef]
  2. Lunne, T.; Robertson, P.; Powell, J. Cone Penetration Testing in Geotechnical Practice, 1st ed.; CRC Press: Boca Raton, FL, USA, 1997. [Google Scholar]
  3. Mayne, P.W. Interpretation of geotechnical parameters from seismic piezocone tests. In Proceedings of the 3rd International Symposium on Cone Penetration Testing, Las Vegas, NV, USA, 13–14 May 2014. [Google Scholar]
  4. Marchetti, S.; Monaco, P.; Totani, G.; Calabrese, M. The Flat Dilatometer Test (DMT) in Soil Investigations—A Report by the ISSMGE Committee TC16; International Society for Soil Mechanics and Geotechnical Engineering (ISSMGE): London, UK, 2001. [Google Scholar]
  5. Mair, R.; Wood, D. Pressuremeter Testing: Methods and Interpretation; Elsevier Science: Kent, UK, 1987. [Google Scholar]
  6. Clarke, B. Pressuremeters in Geotechnical Design, 2nd ed.; CRC Press: Boca Raton, FL, USA, 2022. [Google Scholar]
  7. Brinkgreve, R.; Engin, E.; Engin, H. Validation of empirical formulas to derive model parameters for sands. In Proceedings of the 7th NUMGE 2010, Trodheim, Norway, 2–4 June 2010. [Google Scholar]
  8. Tao, Y.q.; Sun, H.l.; Cai, Y.q. Bayesian inference of spatially varying parameters in soil constitutive models by using deformation observation data. Int. J. Numer. Anal. Methods Geomech. 2021, 45, 1647–1663. [Google Scholar] [CrossRef]
  9. Van Berkom, I.; Brinkgreve, R.; Lengkeek, H.; de Jong, A. An automated system to determine constitutive model parameters from in situ tests. In Proceedings of the 20th International Conference on Soil Mechanics and Geotechnical Engineering, Sydney, Australia, 1–5 May 2022. [Google Scholar]
  10. Marzouk, I.; Brinkgreve, R.; Lengkeek, H.; Tschuchnigg, F. APD: An automated parameter determination system based on in-situ tests. Comput. Geotech. 2024, 176, 106799. [Google Scholar] [CrossRef]
  11. Marzouk, I.; Tschuchnigg, F.; Brinkgreve, R. Expansion of an automated system for determining soil parameters using in-situ tests. In Proceedings of the 10th European Conference on Numerical Methods in Geotechnical Engineering (NUMGE 2023), London, UK, 26–28 June 2023. [Google Scholar] [CrossRef]
  12. Marzouk, I.; Oberhollenzer, S.; Tschuchnigg, F. An automated system for determining soil parameters: Case study. In Proceedings of the 8th International Symposium on Deformation Characteristics of Geomaterials, Porto, Portugal, 3–6 September 2023. [Google Scholar] [CrossRef]
  13. Marzouk, I.; Tschuchnigg, F. A combined approach to Automated Parameter Determination (APD). In Proceedings of the 7th International Conference on Geotechnical and Geophysical Site Characterization, Barcelona, Spain, 18–24 June 2024. [Google Scholar] [CrossRef]
  14. Yu, H. CASM: A unified state parameter model for clay and sand. Int. J. Numer. Anal. Methods Geomech. 1998, 22, 621–653. [Google Scholar] [CrossRef]
  15. Marzouk, I.; Wijaya, A.E.; Schweiger, H.F.; Tschuchnigg, F. An automated system for determining soil parameters from in situ tests: Application to a sand site. Aims Geosci. 2025, 11, 489–516. [Google Scholar] [CrossRef]
  16. Marzouk, I.; Tschuchnigg, F. Bridging In Situ Testing and Constitutive Modelling: An Automated Approach to Soil Parameter Identification. Appl. Sci. 2025, 15, 7224. [Google Scholar] [CrossRef]
  17. Schanz, T.; Vermeer, P.; Bonnier, P. The hardening soil model: Formulation and verification. In Beyond 2000 in Computational Geotechnics; Routledge: London, UK, 1999; pp. 281–296. [Google Scholar]
  18. Benz, T. Small-Strain Stiffness of Soils and Its Numerical Consequences. Ph.D. Thesis, University of Stuttgart, Stuttgart, Germany, 2007. [Google Scholar]
  19. Bentley System Inc. PLAXIS 2D (24.3); Bentley System Inc.: Exton, PA, USA, 2024. [Google Scholar]
  20. Marzouk, I.; Granitzer, A.; Rauter, S.; Tschuchnigg, F. A Case Study on Advanced CPT Data Interpretation: From Stratification to Soil Parameters. Geotech. Geol. Eng. 2024, 42, 4087–4113. [Google Scholar] [CrossRef]
  21. Gansner, E. Drawing Graph with Graphviz; AT&T Bell Laboratories: New York, NY, USA, 2011. [Google Scholar]
  22. Pineda, J.A.; Kelly, R.B.; Suwal, L.; Bates, L.; Sloan, S.W. The Ballina soft soil Field Testing Facility. Aims Geosci. 2019, 5, 509–534. [Google Scholar] [CrossRef]
  23. Kelly, R.B.; Pineda, J.A.; Bates, L.; Suwal, L.P.; Fitzallen, A. Site characterisation for the Ballina field testing facility. Géotechnique 2017, 67, 279–300. [Google Scholar] [CrossRef]
  24. Pineda, J.A.; Suwal, L.P.; Kelly, R.B.; Bates, L.; Sloan, S.W. Characterisation of Ballina clay. Géotechnique 2016, 66, 556–577. [Google Scholar] [CrossRef]
  25. Doherty, J.; Gourvenec, S.; Gaone, F.; Pineda, J.; Kelly, R.; O’Loughlin, C.; Cassidy, M.; Sloan, S. A novel web based application for storing, managing and sharing geotechnical data, illustrated using the national soft soil field testing facility in Ballina, Australia. Comput. Geotech. 2018, 93, 3–8. [Google Scholar] [CrossRef]
  26. Tschuchnigg, F.; Schweiger, H. Embankment and footing prediction by means of 2D and 3D finite element analyses. In Proceedings of the Embankment and Footing Prediction Symposium, Newcastle, Australia, 12–13 September 2016; pp. 360–390. [Google Scholar]
  27. Tschuchnigg, F.; Schweiger, H.F. Embankment prediction and back analysis by means of 2D and 3D finite element analyses. Comput. Geotech. 2018, 93, 104–114. [Google Scholar] [CrossRef]
  28. Rauter, S.; Tschuchnigg, F. CPT Data Interpretation Employing Different Machine Learning Techniques. Geosciences 2021, 11, 265. [Google Scholar] [CrossRef]
  29. Rauter, S.; Tschuchnigg, F. Identification of Soil Strata from In-Situ Test Data Using Machine Learning. In Proceedings of the Challenges and Innovations in Geomechanics, Turin, Italy, 30 August–2 September 2022; Barla, M., Di Donna, A., Sterpi, D., Insana, A., Eds.; Springer: Cham, Switzerland, 2022; pp. 37–44. [Google Scholar] [CrossRef]
  30. Oberhollenzer, S.; Premstaller, M.; Marte, R.; Tschuchnigg, F.; Erharter, G.H.; Marcher, T. Cone penetration test dataset Premstaller Geotechnik. Data Brief 2021, 34, 106618. [Google Scholar] [CrossRef]
  31. Brinkgreve, R.B.J.; Tschuchnigg, F.; Laera, A.; Brasile, R.S. Automated CPT interpretation and modelling in a BIM/Digital Twin environment. In Proceedings of the 10th European Conference on Numerical Methods in Geotechnical Engineering (NUMGE 2023), London, UK, 26–28 June 2023. [Google Scholar] [CrossRef]
  32. Robertson, P. Soil Behaviour Type from the CPT: An Update. In Proceedings of the 2nd International Symposium on Cone Penetration Testing, Huntington Beach, CA, USA, 9–11 May 2010; pp. 575–583. [Google Scholar]
  33. Kelly, R.; Sloan, S.; Pineda, J.; Kouretzis, G.; Huang, J. Outcomes of the Newcastle symposium for the prediction of embankment behaviour on soft soil. Comput. Geotech. 2018, 93, 9–41. [Google Scholar] [CrossRef]
  34. Vermeer, P.; Neher, H. A soft soil model that accounts for creep. In Proceedings of the Beyond 2000 in Computational Geotechnics—10 Years of PLAXIS International, Balkema, Rotterdam, The Netherlands, 18–20 March 1999; pp. 249–261. [Google Scholar]
  35. Robertson, P.; Cabal, K. Estimating soil unit weight from CPT. In Proceedings of the 2nd International Symposium on Cone Penetration Testing, Huntington Beach, CA, USA, 9–11 May 2010. [Google Scholar]
  36. Lengkeek, H.; Brinkgreve, R. CPT-based unit weight estimation extended to soft organic clays and peat: An update. In Cone Penetration Testing 2022; CRC Press: Boca Raton, FL, USA, 2022; pp. 503–508. [Google Scholar] [CrossRef]
  37. Mayne, P.; Cargil, E.; Greig, J. A CPT Design Parameter Manual; ConeTec Group: Richmond, BC, Canada, 2023. [Google Scholar]
  38. Marchetti, S.; Crapps, D.K. Flat Dilatometer Manual; Internal Report of G.P.E. Inc.; G.P.E. Inc.: Gainesville, FL, USA, 1981. [Google Scholar]
  39. Ozer, A.T.; Bartlett, S.F.; Lawton, E.C. CPTU and DMT for estimating soil unit weight of Lake Bonneville clay. In Proceedings of the 4th International Conference on Site Characterization 4, ISC-4, Porto de Galinhas, Brazil, 18–21 September 2012; pp. 291–296. [Google Scholar]
  40. Mayne, P.W. Stress-strain-strength-flow parameters from enhanced in situ tests. In Proceedings of the International Conference on In Situ Measurement of Soil Properties & Case Histories, Bali, Indonesia, 21–24 May 2001. [Google Scholar]
  41. Mayne, P.W. In-Situ Test Calibrations for Evaluating Soil Parameters. In Characterisation and Engineering Properties of Natural Soils; Taylor & Francis Group: London, UK, 2007; Volume 3, pp. 1601–1652. [Google Scholar]
  42. Burns, S.; Mayne, P.W. Small- and High-Strain Measurements of In Situ Soil Properties Using the Seismic Cone Penetrometer. Transp. Res. Rec. J. Transp. Res. Board 1996, 1548, 81–88. [Google Scholar] [CrossRef]
  43. Mayne, P.W.; Coop, M.; Springman, S.; Huang, A.B.; Zornberg, J. State-of-the-art paper (SOA-1): Geomaterial behavior and testing. In Proceedings of the 17th International Conference on Soil Mechanics and Geotechnical Engineering, Alexandria, Egypt, 5–9 October 2009. [Google Scholar]
  44. Mayne, P.W. Stress History of Soils from Cone Penetration Tests. Soils Rocks 2017, 40, 203–218. [Google Scholar] [CrossRef]
  45. Robertson, P. Interpretation of cone penetration tests—A unified approach. Can. Geotech. J. 2009, 46, 1337–1355. [Google Scholar] [CrossRef]
  46. Paniagua, P.; D’Ignazio, M.; L’Heureux, J.S.; Lunne, T.; Karlsrud, K. CPTU correlations for Norwegian clays: An update. Aims Geosci. 2019, 5, 82–103. [Google Scholar] [CrossRef]
  47. Chen, B.S.; Mayne, P.W. Statistical relationships between piezocone measurements and stress history of clays. Can. Geotech. J. 1996, 33, 488–498. [Google Scholar] [CrossRef]
  48. Schroeder, K.; Andersen, K.H.; Tjok, K.M. Laboratory Testing and Detailed Geotechnical Design of the Mad Dog Anchors. In Proceedings of the Offshore Technology Conference, Houston, TX, USA, 1–4 May 2006. [Google Scholar] [CrossRef]
  49. D’Ignazio, M.; Lunne, T.; Andersen, K.H.; Yang, S.; Di Buò, B.; Länsivaara, T. Estimation of preconsolidation stress of clays from piezocone by means of high-quality calibration data. Aims Geosci. 2019, 5, 104–116. [Google Scholar] [CrossRef]
  50. Marchetti, S. In Situ Tests by Flat Dilatometer. J. Geotech. Eng. Div. 1980, 106, 299–321. [Google Scholar] [CrossRef]
  51. Cao, L.F.; Peaker, S.M.; Ahmad, S. Use of Flat Dilatometer in Ontario. In Proceedings of the Fifth International Conference on Geotechnical and Geophysical Site Characterisation, Gold Coast, QLD, Australia, 5–9 September 2016; pp. 755–760. [Google Scholar]
  52. Powell, J.J.M.; Uglow, I.M. The Interpretation of the Marchetti Dilatometer Test in UK Clays; Telford (Thomas) Limited: London, UK, 1989. [Google Scholar]
  53. Monaco, P.; Amoroso, S.; Marchetti, S.; Marchetti, D.; Totani, G.; Cola, S.; Simonini, P. Overconsolidation and Stiffness of Venice Lagoon Sands and Silts from SDMT and CPTU. J. Geotech. Geoenviron. Eng. 2014, 140, 215–227. [Google Scholar] [CrossRef]
  54. Long, M.; L’Heureux, J.S. Shear wave velocity—SCPTU correlations for sensitive marine clays. In Cone Penetration Testing 2022; Gottardi, G., Tonni, L., Eds.; CRC Press: Boca Raton, FL, USA, 2022; pp. 515–520. [Google Scholar] [CrossRef]
  55. Mayne, P.; Robertson, P.K.; Lunne, T. Clay stress history evaluated from seismic piezocone tests. In Proceedings of the 1st. International Conference on Geotechnical Site Characterisation, Atlanta, GA, USA, 19–22 April 1998. [Google Scholar]
  56. L’Heureux, J.S.; Long, M. Relationship between Shear-Wave Velocity and Geotechnical Parameters for Norwegian Clays. J. Geotech. Geoenviron. Eng. 2017, 143, 04017013. [Google Scholar] [CrossRef]
  57. Lengkeek, H.J. Testing and Modeling of Sheet Pile Reinforced Dikes on Organic Soils: Insights from the Eemdijk Full-SCALE Failure Test. Ph.D. Thesis, Delft University of Technology, Delft, The Netherlands, 2022. [Google Scholar] [CrossRef]
  58. Wroth, C.P.; Wood, D.M. The correlation of index properties with some basic engineering properties of soils. Can. Geotech. J. 1978, 15, 137–145. [Google Scholar] [CrossRef]
  59. Ramsey, N.; Tho, K. New methods for assessing Plasticity Index and Low-strain Shear Modulus in fine-grained offshore soils. In Cone Penetration Testing 2022; Gottardi, G., Tonni, L., Eds.; CRC Press: Boca Raton, FL, USA, 2022; pp. 657–663. [Google Scholar] [CrossRef]
  60. Mayne, P.W. Evaluating effective stress parameters andundrained shear strength of soft-firm clays from CPT and DMT. Aust. Geomech. J. 2016, 51, 27–55. [Google Scholar]
  61. Robertson, P. Estimating in-situ soil permeability from CPT and CPTu. In Proceedings of the 2nd International Symposium on Cone Penetration Testing, Huntington Beach, CA, USA, 9–11 May 2010. [Google Scholar]
  62. Mayne, P.; Kulhawy, F. Ko - OCR Relationships in Soil. J. Geotech. Eng. Div. 1982, 108, 851–872. [Google Scholar] [CrossRef]
  63. Kulhawy, F.; Mayne, P. Manual on Estimating Soil Properties for Foundation Design; Electric Power Research Institute: New York, NY, USA, 1990. [Google Scholar]
  64. Mayne, P. Updating our geotechnical curricula via a balanced approach of in-situ, laboratory, and geophysical testing of soil. In Proceedings of the 61st Annual Geotechnical Conference, Minnesota Geotechnical Society, University of Minnesota, St. Paul, MN, USA, 22 February 2013; pp. 65–86. [Google Scholar]
  65. Tavenas, F.; Jean, P.; Leblond, P.; Leroueil, S. The permeability of natural soft clays. Part II: Permeability characteristics. Can. Geotech. J. 1983, 20, 645–660. [Google Scholar] [CrossRef]
  66. Doherty, J.; Gourvenec, S.; Gaone, F. Insights from a shallow foundation load-settlement prediction exercise. Comput. Geotech. 2018, 93, 269–279. [Google Scholar] [CrossRef]
  67. Hird, C.C.; Pyrah, I.C.; Russel, D. Finite element modelling of vertical drains beneath embankments on soft ground. Géotechnique 1992, 42, 499–511. [Google Scholar] [CrossRef]
  68. Gaone, F.; Gourvenec, S.; Doherty, J. Large-scale shallow foundation load tests on soft clay—At the National Field Testing Facility (NFTF), Ballina, NSW, Australia. Comput. Geotech. 2018, 93, 253–268. [Google Scholar] [CrossRef]
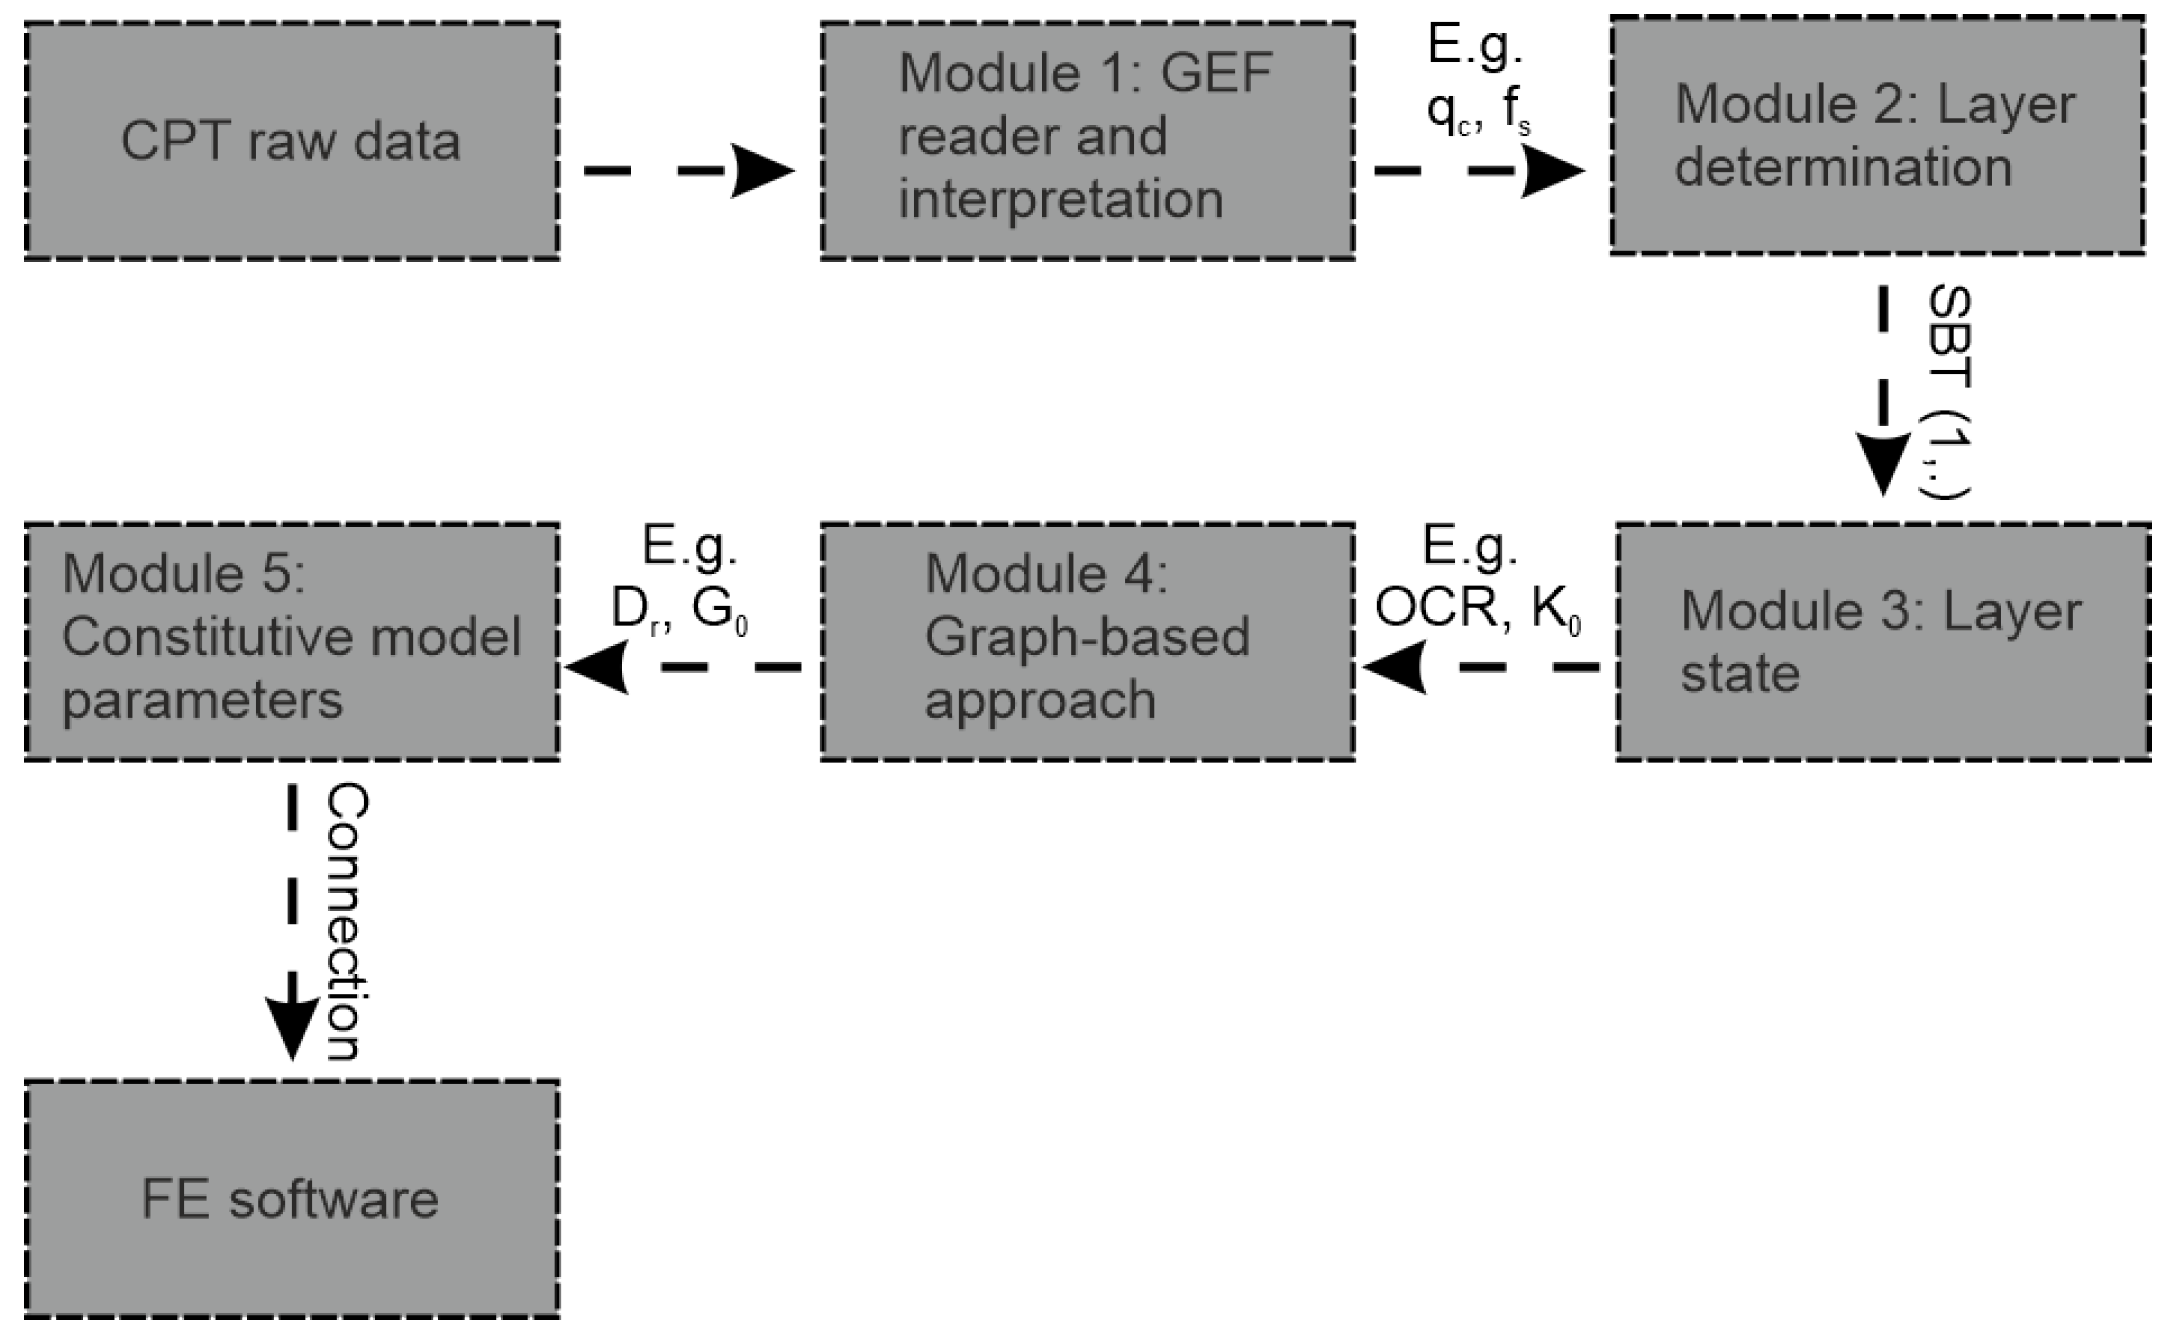
Figure 1. Overview of APD modules (modified from [10]).
Buildings 15 03092 g001
Figure 2. Graph-based approach implemented in APD (modified from [20]).
Buildings 15 03092 g002
Figure 3. Format of the CSV files for methods and parameters (modified from [10]).
Buildings 15 03092 g003
Figure 4. Layout of the test site (modified from [23]).
Buildings 15 03092 g004
Figure 5. In situ test results used in the present work: (ac) CPTu profiles showing q t , f s , and u 2 ; (d) DMT measurements of P 0 and P 1 ; (e) shear wave velocity V s .
Buildings 15 03092 g005
Figure 6. Stratified layers. (a) q t and R f ; (b) standard deviation.
Buildings 15 03092 g006
Figure 7. Stratified layers ( d m i n set to 0.5 m). (a) q t and R f ; (b) standard deviation.
Buildings 15 03092 g007
Figure 8. In situ test results after stratification, (ac) CPTu profiles showing q t , f s , and u 2 ; (d) DMT measurements of P 0 and P 1 ; (e) shear wave velocity V s .
Buildings 15 03092 g008
Figure 9. Comparison of APD results with site-interpreted values: (a) unit weight, (b) void ratio, (c) OCR, (d) permeability, (e) effective friction angle.
Buildings 15 03092 g009
Figure 10. Embankment FE model (all dimensions are in meters).
Buildings 15 03092 g010
Figure 11. Time–settlement behaviour at point A.
Buildings 15 03092 g011
Figure 12. Footing FE model (all dimensions are in meters).
Buildings 15 03092 g012
Figure 13. (a) Failure mechanism, (b) load–displacement curve at point A.
Buildings 15 03092 g013
Figure 14. Scatter in the obtained values represented by confidence intervals and standard deviation, (a) unit weight, (b) OCR, and (c) probability density function for unit weight for layer 1.
Buildings 15 03092 g014
Table 1. Selected methods for the unit weight ( γ t ).
WorkflowMethod Author
CPT γ w [ 0.27 ( log R f ) + 0.36 ( log q t / p a ) + 1.236 ] (1) [35]
19.5 2.87 [ log ( 9000 q t ) log ( 20 R f ) ] (2) [36]
26 14 1 + [ 0.5 log f s + 1 ] 2 (3)[3]
γ w [ 0.254 · log ( q t u 2 p a ) + 1.54 ] (4)[37]
DMTfrom Marchetti’s chart [38]
γ w · 1.31 ( P 1 p a ) 0.161 (5)[39]
γ w · 1.35 ( P 0 p a ) 0.159 (6)[39]
γ w · 1.32 ( P 1 p a ) 0.091 ( P 0 p a ) 0.0733 (7)[39]
γ w · 1.47 ( E D p a ) 0.045 (8)[39]
V s 8.31 log V s 1.61 log z (9)[40]
4.17 ln V s 1 4.03 (10)[41]
6.87 V s 0.227 σ v 0.057 (11)[42]
4.96 + 5.97 log V s (12)[1]
Note: γ w = unit weight of water; p a = atmospheric pressure; E D = dilatometer modulus; z = depth; σ v = vertical effective stresses; V s 1 = effective stress-normalised shear wave velocity ( V s 1 = V s / ( σ v / p a ) 0.25 ).
Table 3. Obtained parameters for the three estuarine layers.
ParameterEstuarine Layer 1Estuarine Layer 2Estuarine Layer 3
γ s a t (kN/m3)13.9914.8716.72
e 0 (-)3.2952.2561.373
λ (-)0.14060.13660.1053
κ (-)0.022490.021860.01685
μ (-)0.01004 6.292 × 10 3 5.384 × 10 3
c (kPa)1.5712.0176.088
φ (°)29.8330.9537.44
k x = k y (m/d) 0.03386 × 10 3 0.05676 × 10 3 0.3398 × 10 3
c k (-)1.6471.1280.6867
K 0 (-)0.78030.65280.8503
OCR (-)2.3221.62.779
Table 4. HSS model parameters for the top crust, the underlying sand, and the deeper clay layer are adapted from [26].
ParameterTop CrustSand LayerDeeper Clay Layer
γ s a t (kN/m3)2020.519
E o e d r e f (MPa)133020
E 50 r e f (MPa)133030
E u r r e f (MPa)409090
m (-)0.70.50.9
p r e f (kPa)100100100
ν u r (-)0.20.20.2
G 0 r e f (MPa)83.3187.5187.5
γ 0.7 (-) 2 × 10 4 2 × 10 4 2 × 10 4
c (kPa)308
φ (°)303427
k x = k y (m/d) 8.64 × 10 3 0.864 8.64 × 10 5
K 0 (-)0.6250.53620.6940
OCR (-)1.51.51.5
Disclaimer/Publisher’s Note: The statements, opinions and data contained in all publications are solely those of the individual author(s) and contributor(s) and not of MDPI and/or the editor(s). MDPI and/or the editor(s) disclaim responsibility for any injury to people or property resulting from any ideas, methods, instructions or products referred to in the content.