Article

Damage Characteristics Analysis of High-Rise Frame-Core-Tube Building Structures in Soft Soil Under Earthquake Action

1
Tianjin Key Laboratory of Civil Structure Protection and Reinforcement, Tianjin Chengjian University, Tianjin 300384, China
2
School of Civil Engineering, Tianjin University, Tianjin 300354, China
3
China Railway Liuyuan Group Co., Ltd., Tianjin 300133, China
4
China Railway Design Corporation, Tianjin 300308, China
5
Department of Building Structures and Structural Mechanics, Faculty of Civil Engineering and Environmental Sciences, Bialystok University of Technology, 15-351 Bialystok, Poland
*
Author to whom correspondence should be addressed.
Buildings 2025, 15(17), 3085; https://doi.org/10.3390/buildings15173085
Submission received: 4 August 2025 / Revised: 24 August 2025 / Accepted: 26 August 2025 / Published: 28 August 2025

Abstract

This paper analyzes the seismic performance and damage characteristics of high-rise frame-core-tube structures on soft soil, explicitly incorporating dynamic soil–pile–structure interaction (SSI). A refined 3D finite element model of a 52-storey soil–pile–structure system was developed in ABAQUS, utilizing viscous-spring boundaries and the equivalent nodal force method for seismic input. Nonlinear analyses under six seismic waves were compared to a fixed-base model neglecting SSI. Key findings demonstrate that SSI significantly alters structural response; it amplifies lateral displacements and inter-storey drift ratios throughout the structure, particularly at the top level. While total base shear decreased, frame column base shear forces substantially increased. SSI also reduced peak top-storey accelerations, diminished short-period spectral components, and prolonged the predominant period of response spectra. Analysis of member damage revealed SSI generally reduced compressive and tensile damage in core walls, floor slabs, and frame beams. Principal compressive stresses at the base of frame columns increased under SSI. These results highlight the necessity of including dynamic SSI in seismic analysis for high-rises on soft soil, specifically due to its detrimental amplification of forces in frame columns.

1. Introduction

High-rise buildings, which are beyond-code-specification structures (BCTS) [1], usually have the characteristics of a super-high roof, complex shape, and super-large scale. Conventional structural forms are often complex to meet their mechanical requirements. To ensure the safety of BCTS, complex structural forms with better stiffness, strength, and integrity, such as tube-in-tube, frame-core wall, and frame-core wall with outriggers, have been widely used in practical engineering. In addition, BCTS has strict requirements for foundation performance. Pile foundations with high bearing capacity, good stability, and ease of construction are usually adopted in BCTS, especially in BCTS built on a soft soil site.
Seismic performance study of BCTS is an essential issue in the BCTS research field, and there have been many related reports until now. For example, Kamal and Inel [2] investigate the correlation between ground motion parameters and displacement demands of mid-rise reinforced-concrete frame buildings on soft soils, considering the soil–structure interaction. Li et al. [3] discussed the performance-based seismic design of BCTS. Ma et al. [4] selected a four-storey frame structure and a three-tower super high-rise building to compare the differences in seismic structural responses caused by Gaussian and non-Gaussian earthquake groups. The 18-storey numerical model established by Zhao et al. [5] analyzed the response patterns of a double-layer seismic isolation structure under earthquake actions.
It is worth pointing out that the present earthquake response results of BCTS are mainly limited to the fixed-based above-ground BCTS model. That is, only the above-ground part of BCTS is modeled, with its base fixed and seismic wave input provided in the form of seismic acceleration time histories to the base. This model can effectively reduce the calculation scale and improve the calculation efficiency, but, unfortunately, it fails to consider the dynamic interaction among soil, pile, and BCTS.
The dynamic soil–pile–BCTS interaction will undoubtedly have very significant impacts on the earthquake responses of BCTS, which can be inferred from many existing research results of the dynamic soil–pile–structure interaction. Since the 1960s [6], researchers have studied the dynamic soil–pile–structure interaction using various methods, such as the in-situ observation method [7,8], the model test method [9,10], and the numerical analysis method [11,12,13,14,15,16,17,18]. Among these methods, numerical analysis is the most widely used, which can be classified as the substructure method and the direct method. The substructure method is to divide the soil–pile–structure system into the soil-pile subsystem and the structure subsystem, and then analyze the two subsystems separately, as described in [11,12]. The direct method is to establish the whole model of the soil–pile–structure system, and then explore the entire system, such as the finite element model in [13,14,15,16], the finite element-boundary element model in [17], and the wave number domain boundary element model in [18]. Consulting the above research results, one can find that none of them emphasized the importance of the dynamic soil–pile–structure interaction to the earthquake responses of the structure. Therefore, it is essential to attach importance to the existence of piles and soils for obtaining accurate results of earthquake response analysis of BCTS.
On the other hand, it seems unfeasible to conclude the analysis of the dynamic soil-pile–BCTS interaction from the existing research results of the dynamic soil–pile–structure interaction. There is still controversy regarding the role (beneficial or detrimental) of the dynamic soil–pile–structure interaction in the seismic performance of structures. For example, Carbonari et al. [12] took a 6-storey 4-bay wall-frame structure as the research object and compared the earthquake responses of the fixed-base structure model with those of the soil–pile–structure model. They concluded that, for each soil deposit (12 types of soil, from soft soil to stiff soil), the dynamic soil–pile–structure interaction reduced the shear at the wall base and increased that at the frame base. However, Hokmabadi et al. [15] took a 15-storey frame structure founded on the clay soil as the research object. They analyzed the influence of the dynamic soil–pile–structure interaction on its earthquake responses. They concluded that the base shear in the soil–pile–structure model was smaller than that in the fixed-base structure model. Thus, it can be seen that the influence trends of the dynamic soil–pile–structure interaction on the earthquake responses of the structure vary with the different research objects. Therefore, the existing research results of the dynamic soil–pile–structure interaction have no obvious reference value to the analysis conclusion of the dynamic soil–pile–BCTS interaction. Although existing studies have extensively explored the seismic response patterns of super-tall structures, most have focused on global seismic performance indicators such as lateral displacement and inter-storey drift ratio, while overlooking the influence of complex structural features. What changes will happen to the earthquake responses of BCTS after considering the dynamic soil–pile–BCTS interaction, as well as the complex structural features of the buildings, or what beneficial or detrimental effects the dynamic soil–pile–BCTS interaction will have on the earthquake responses of BCTS, has become an urgent problem to be solved.
In this paper, a refined model of the soil–pile–BCTS system is established by using finite element software ABAQUS 2024, taking a 52-storey BCTS as an example. The BCTS is found on a deep soft soil site, and its structure type is frame-core wall with outriggers. To ensure the accuracy of the model, the viscous-spring boundary is applied to eliminate the boundary effect, and the equivalent nodal force method is used to realize the seismic wave input. Then, the earthquake responses of the soil–pile–BCTS model are analyzed and compared with those of the fixed-base above-ground BCTS model. The effects of the dynamic soil–pile–BCTS interaction on the earthquake responses of BCTS are investigated, and some suggestions for the seismic design of BCTS are provided.

2. Model Overview

2.1. Brief Introduction to Building

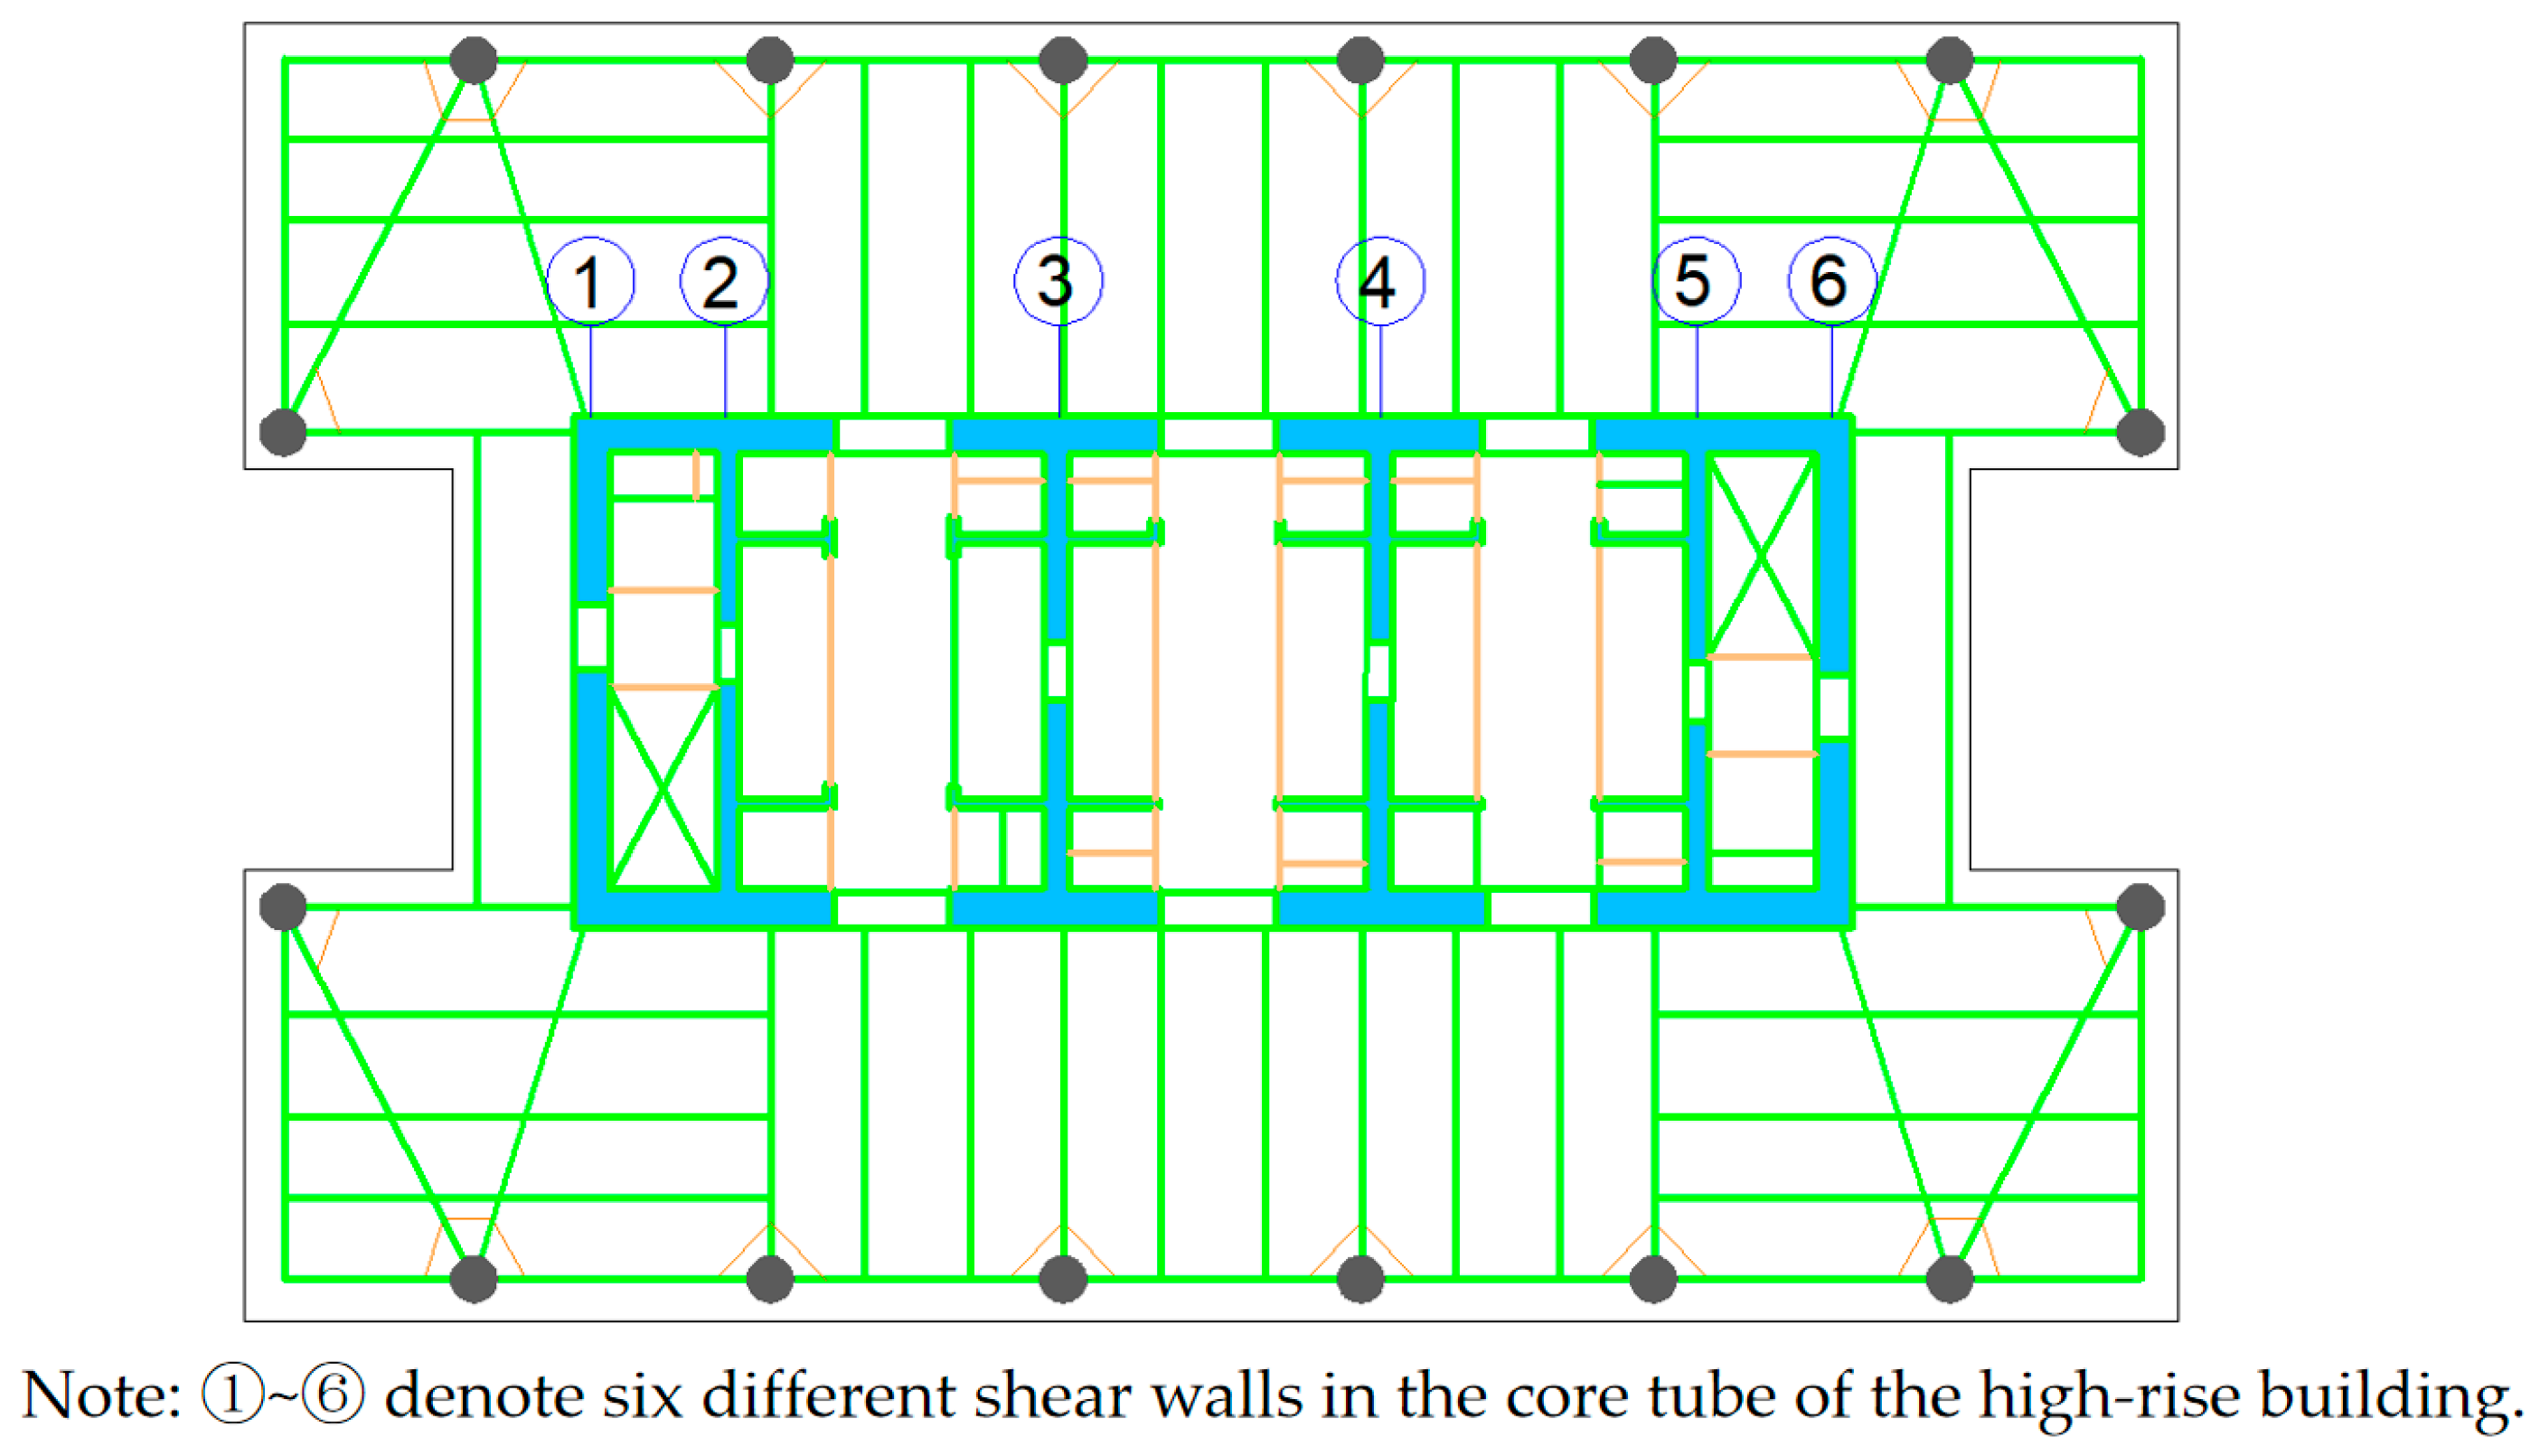
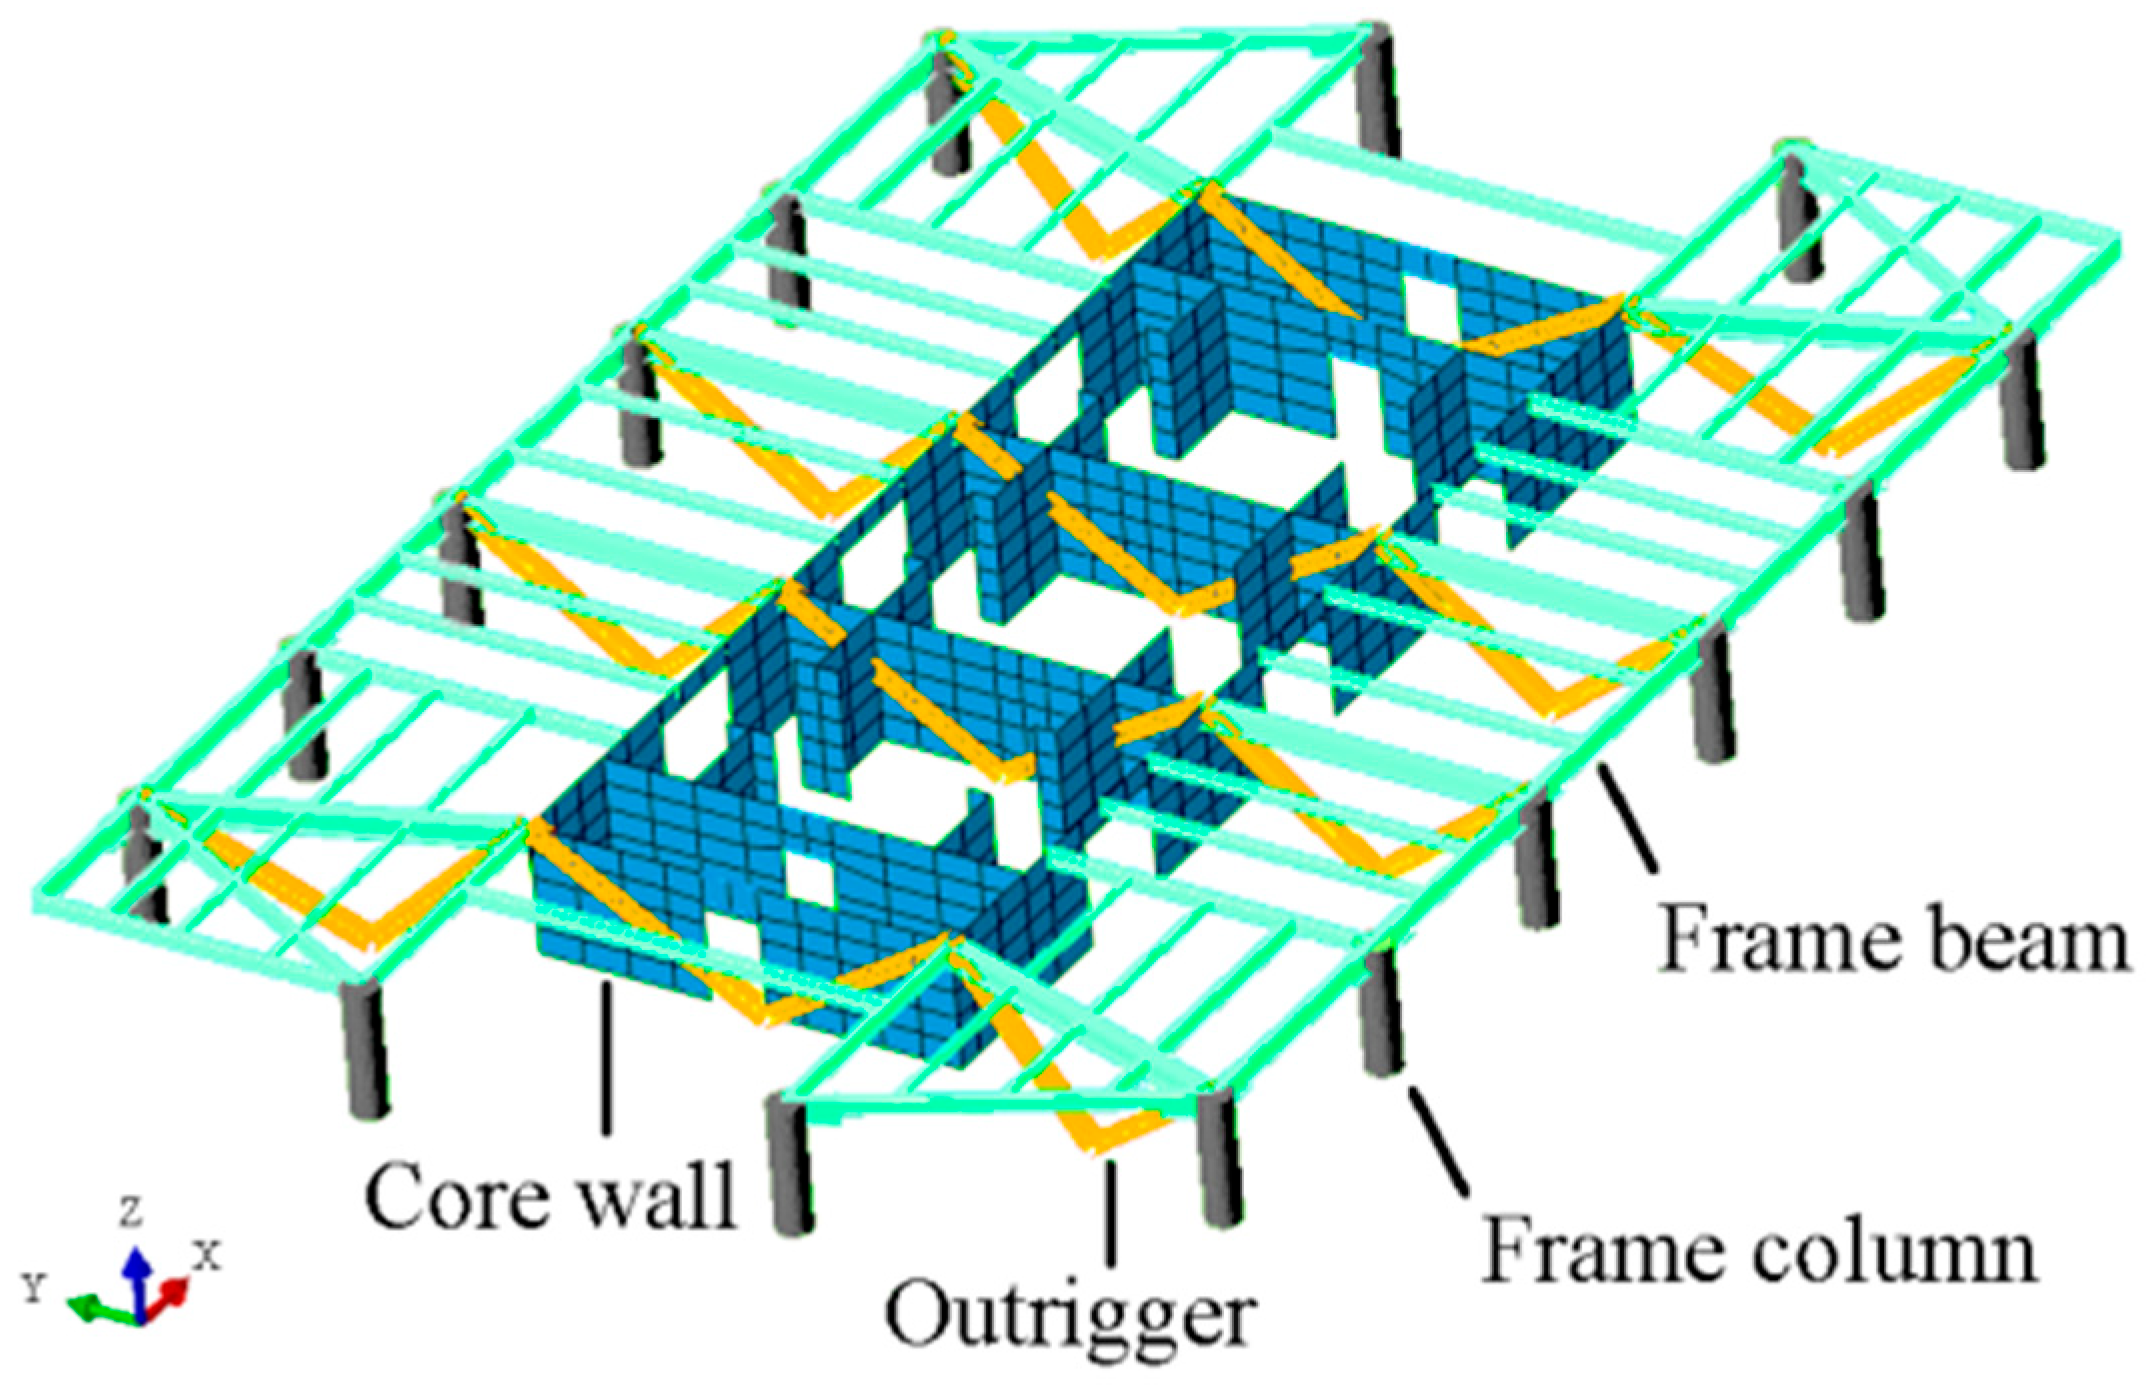
As illustrated in Figure 1, the project under investigation is a multi-functional office skyscraper, comprising 52 above-ground storeys and culminating at a total height of 240 m. The architectural form presents a generally rectangular layout, characterized by distinctive concave curvatures along both of its shorter edges, contributing to its unique aerodynamic and aesthetic profile. A typical structural floor plan, provided in Figure 2, further elucidates this geometric configuration. The primary structural system is a hybrid frame-core tube design, integrated with multi-level outrigger trusses for enhanced lateral resistance, as visually detailed in Figure 3. To effectively fortify the interaction and load transfer between the central reinforced concrete core and the external framing system, outriggers are strategically installed across several mechanical and refuge floors over the building’s height. All the glossary in this paper is shown in Table 1.
The structure is designed for a service life of 50 years in a region with a defined seismic precautionary intensity of 7 degrees on the Chinese scale. According to Clause [19] of the Technical Specification for Concrete Structures of Tall Buildings, the stipulated maximum height permissible for a frame-core wall structure under a 7-degree seismic intensity is 180 m. This building’s height of 240 m significantly surpasses the code-specified limit. Consequently, due to this height exceedance, the structure falls into the classification of a Beyond Code Tall Structure. This designation necessitates the implementation of specialized engineering analyses and performance-based design evaluations to ensure structural safety and compliance with functional requirements under wind and seismic loads.

2.2. Constitutive Model and Element Selection

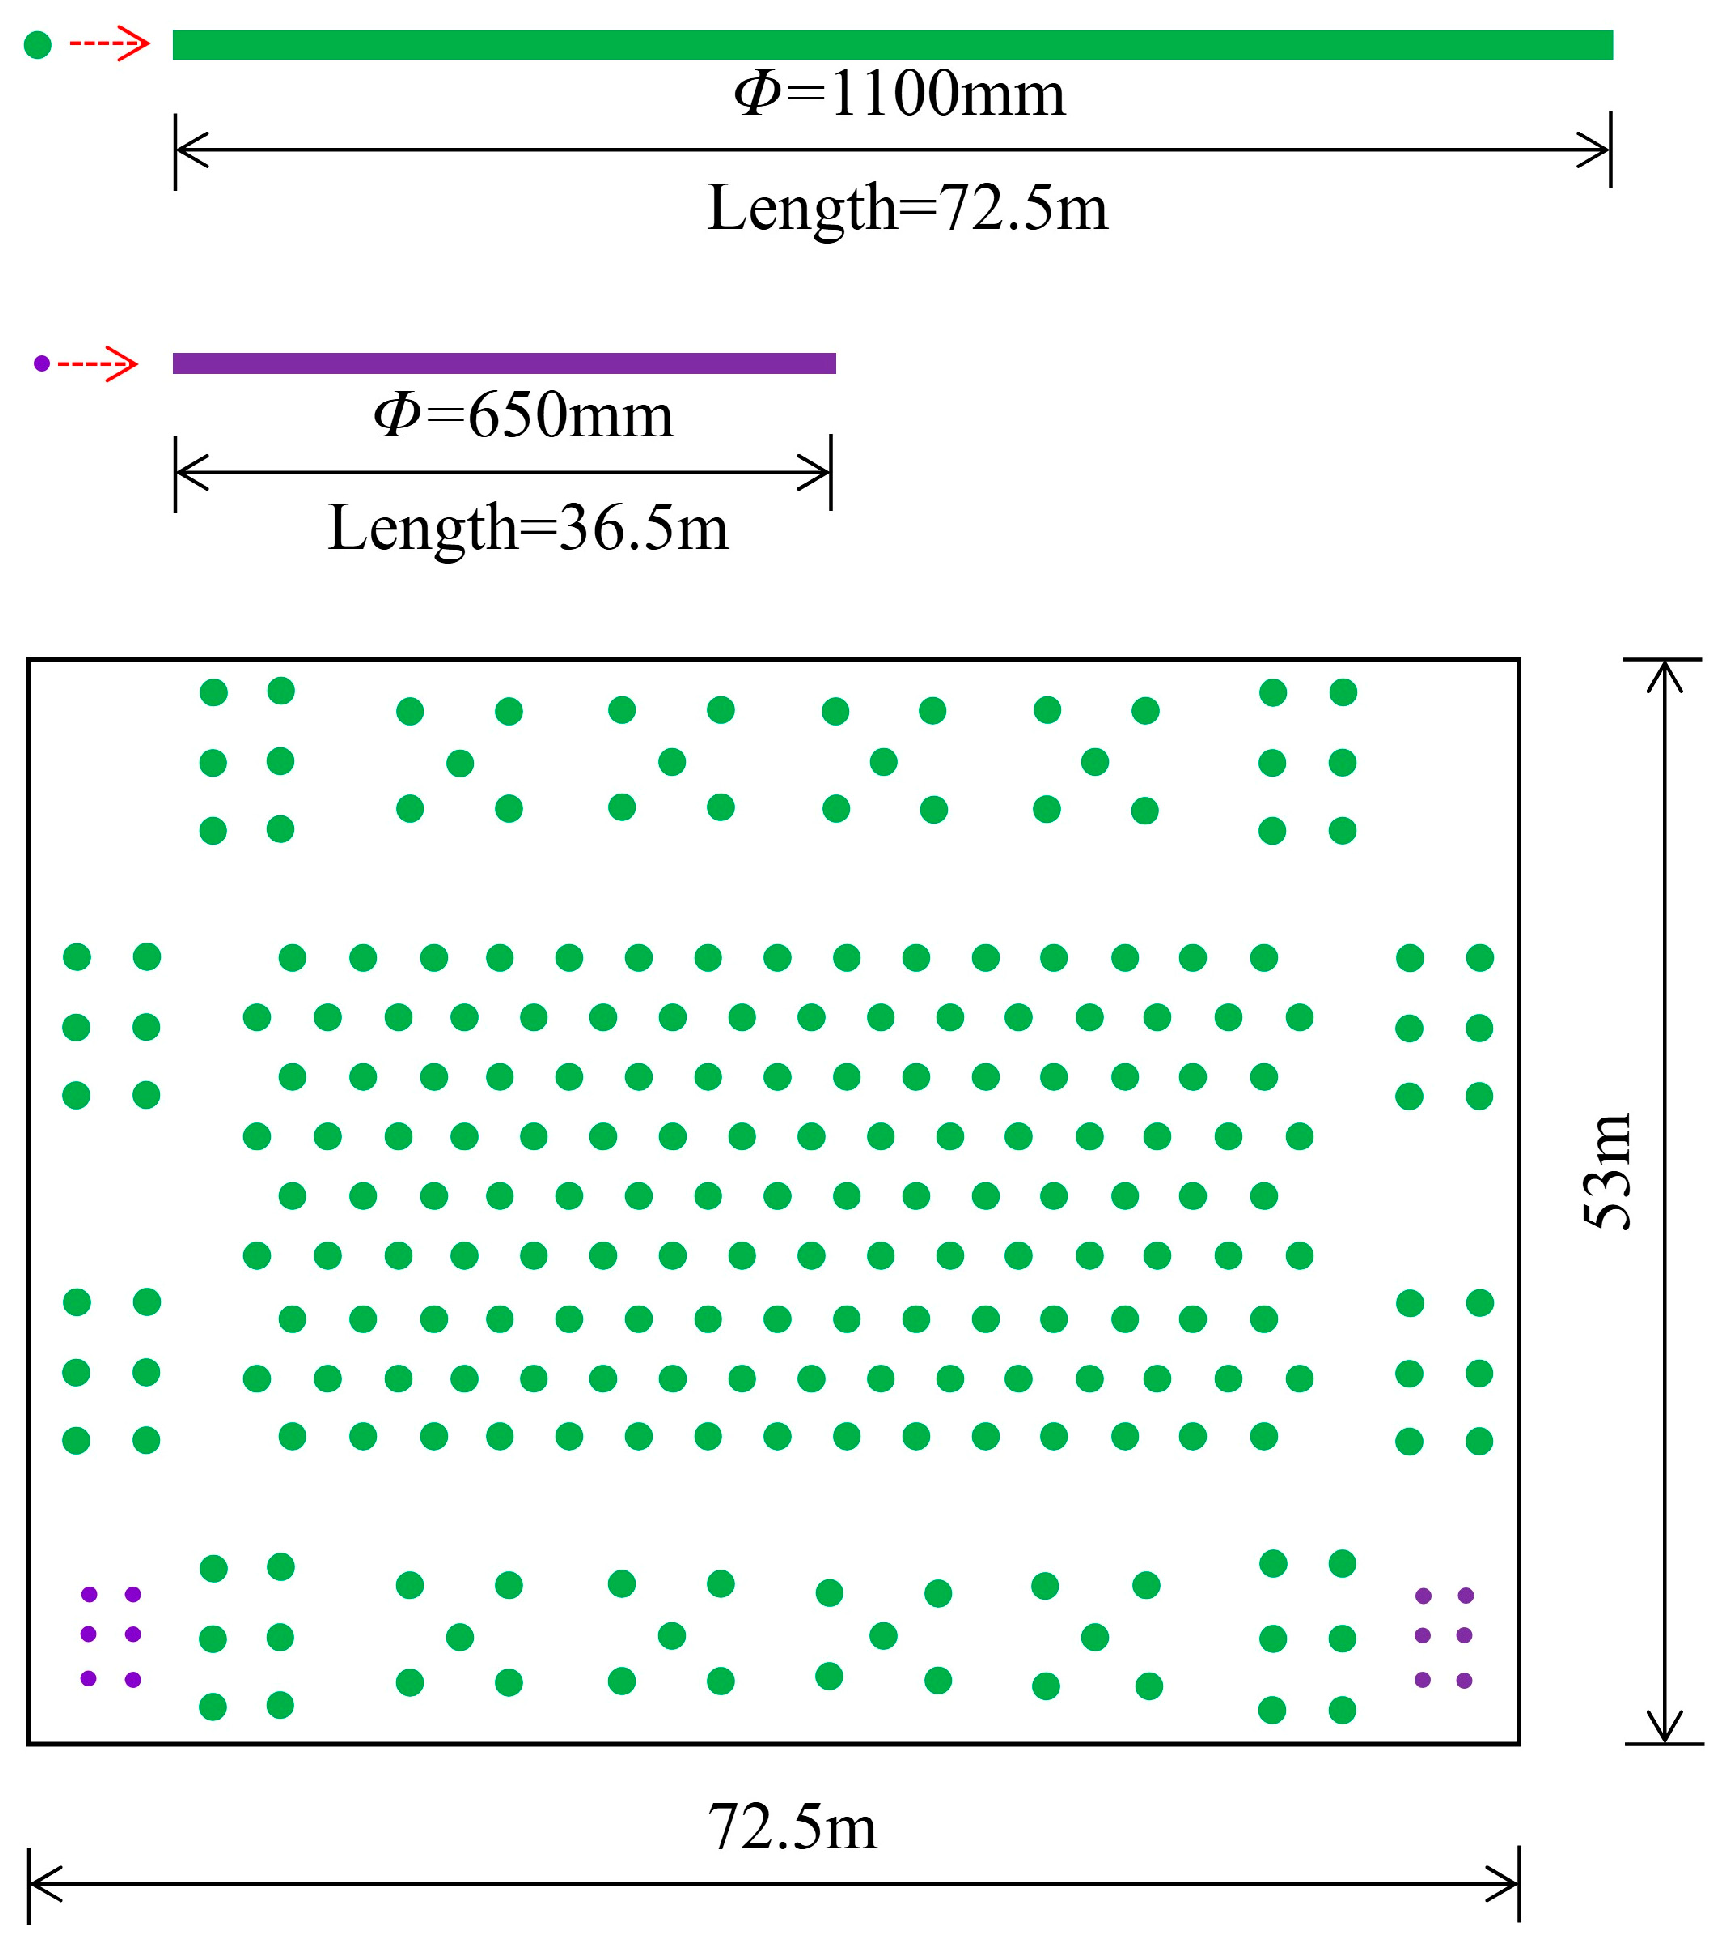
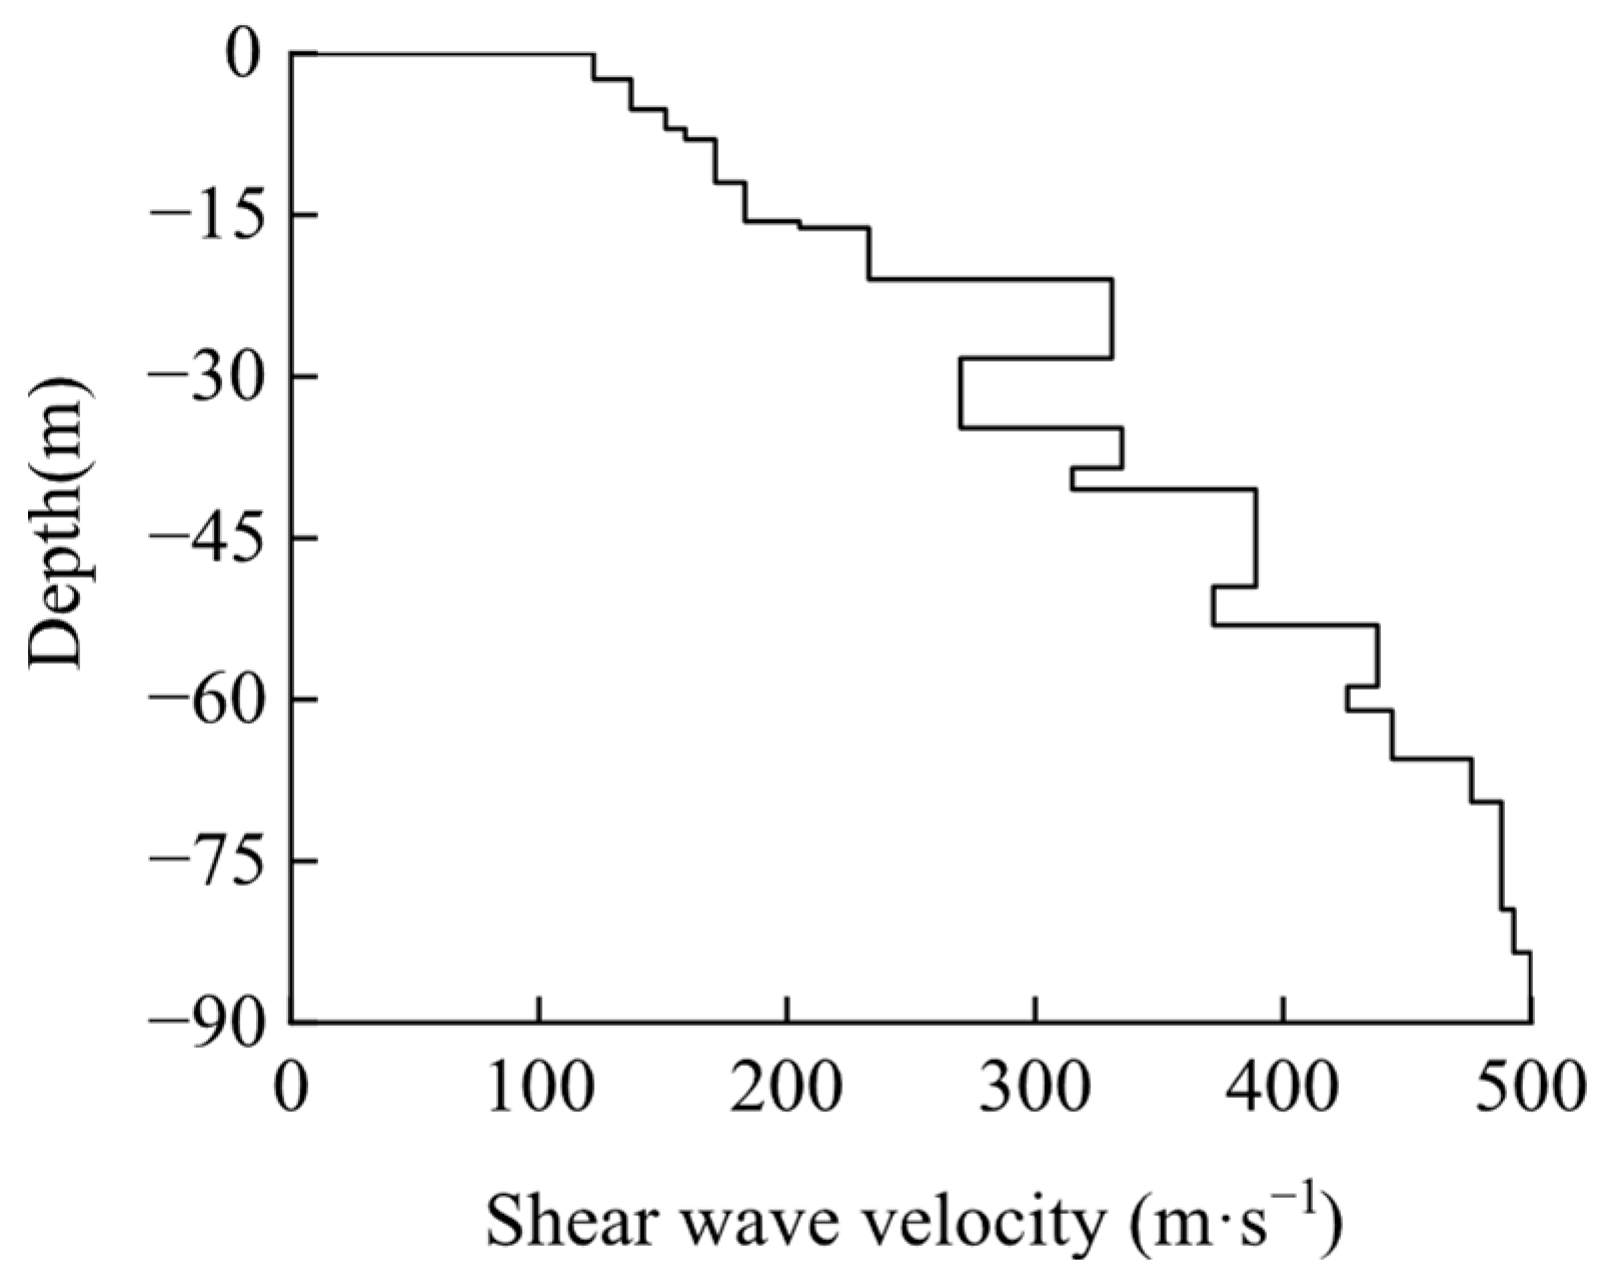
The foundation system of the structure utilizes a total of 239 cast-in-place reinforced concrete piles, which are categorized into two distinct types based on their geometric dimensions. The majority of these are 227 piles, each with a diameter of 1100 mm and a length of 72.5 m. The remainder consists of 12 piles with a smaller diameter of 650 mm and a shorter length of 36.5 m. The arrangement and spatial distribution of these piles within the foundation plan are illustrated in Figure 4. Regarding the subsoil conditions, the site comprises horizontally stratified layers. The variation of the shear wave velocity, a key parameter for evaluating soil stiffness and dynamic response, within these different strata with increasing depth is presented in Figure 5.
The primary lateral force-resisting element is a reinforced concrete core wall. Surrounding this core, the perimeter frame is composed of concrete-filled steel tube (CFST) columns and steel frame beams. The outrigger trusses, which provide additional stiffness by connecting the core to the exterior columns, are fabricated from structural steel sections. Horizontal diaphragms, i.e., the floor slabs, along with all pile foundations, are constructed of reinforced concrete. Structural element and elevation grade material specifications are included. For the core wall and the CFST columns, the concrete strength grade transitions from C60 at the lower levels to C40 at the upper storeys. The floor slabs and piles with a diameter of 600 mm utilize C30 concrete, whereas the larger piles with a diameter of 1000 mm are made from higher-strength C45 concrete. Reinforcement employs HRB400 steel bars in the core walls and floor slabs. The piles are reinforced with HRB335 steel bars. For the structural steel members, the columns and beams in the frame are made of Q345B grade steel, while the outrigger trusses use higher-performance Q390B grade steel to withstand significant moments.
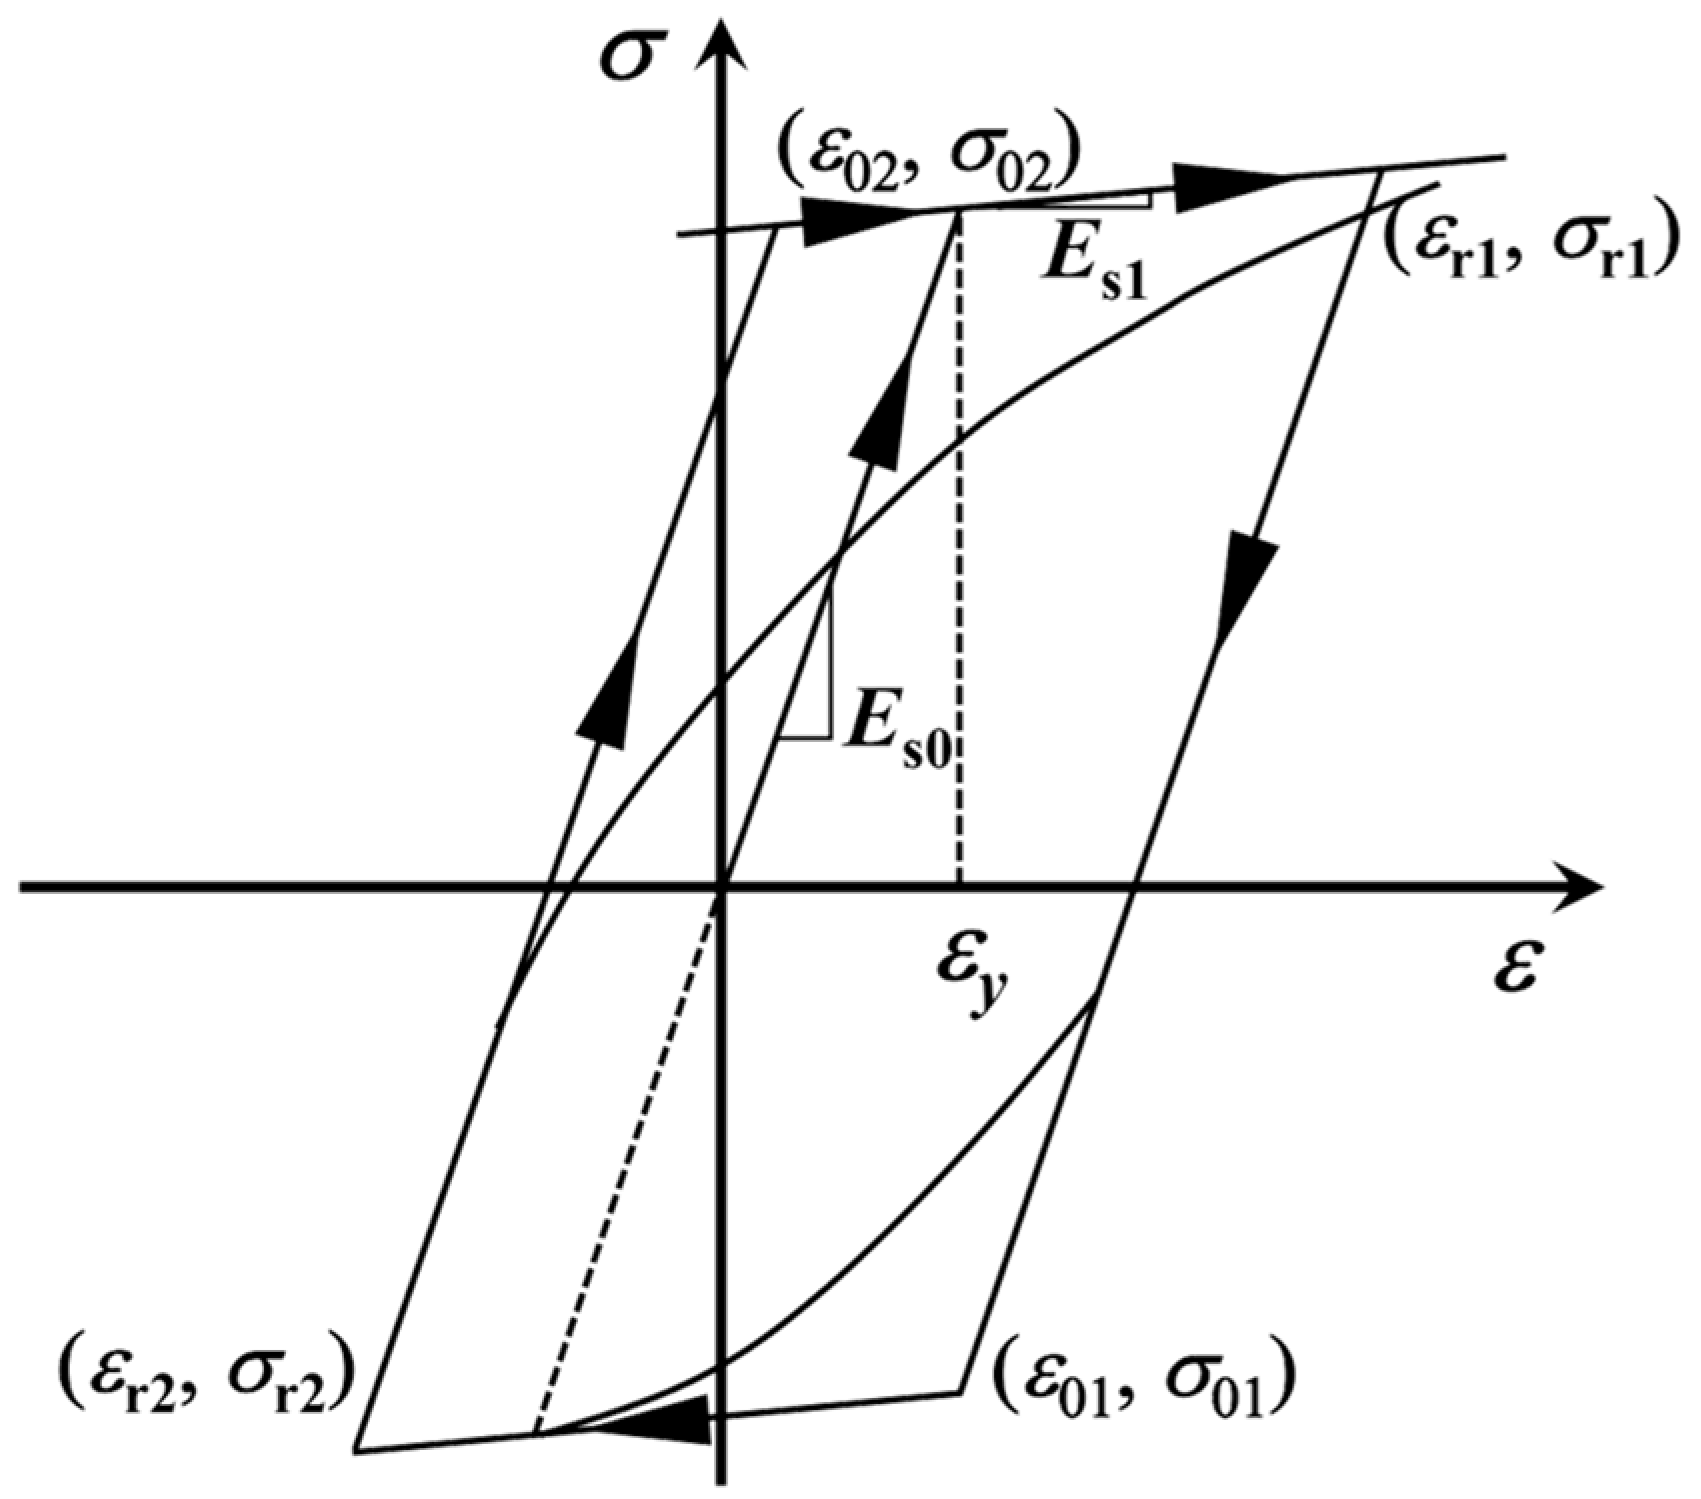
The structural materials employed in this Beyond Code Tall Structure primarily include steel and concrete, with distinct constitute models applied to simulate their mechanical behavior under seismic loads. For the steel components, the kinematic hardening plasticity model [20], illustrated in Figure 6, is utilized. This model effectively captures the Bauschinger effect, making it particularly suitable for representing the cyclic elastoplastic characteristics of steel under repeated reversed loading, such as that induced by earthquakes. Regarding the concrete elements, the analysis adopts the concrete damaged plasticity model [21], presented in Figure 7. This model is capable of accounting for the asymmetry in material behavior between tension and compression. It also incorporates the progressive degradation of stiffness under cyclic stresses, providing a realistic simulation of concrete’s nonlinear seismic performance. Furthermore, to represent the nonlinear dynamic response of the foundation soil, an equivalent linear approach [22] is implemented. This method approximates soil nonlinearity by iteratively adjusting the shear modulus and damping ratio for each soil element based on its computed equivalent shear strain level. This model is recognized for its practical utility and widespread application in geotechnical earthquake engineering. The detailed soil parameters are listed in Table 2, which were gained through an integration of on-site geotechnical investigation data and laboratory test results.
In the finite element model developed for this study, several element types were employed to represent different structural components. The core walls and floor slabs were discretized using reduced-integration shell elements, specifically, quadrilateral S4R and triangular S3R elements. For linear members such as frame columns, beams, outriggers, and piles, the B31 beam element was adopted. The surrounding soil was modeled with C3D8 hexahedral solid elements. It is important to note that all connections between components were simulated either through shared nodes or embedded constraints, as interface contact and separation were not considered in this analysis.

2.3. Finite Element Model

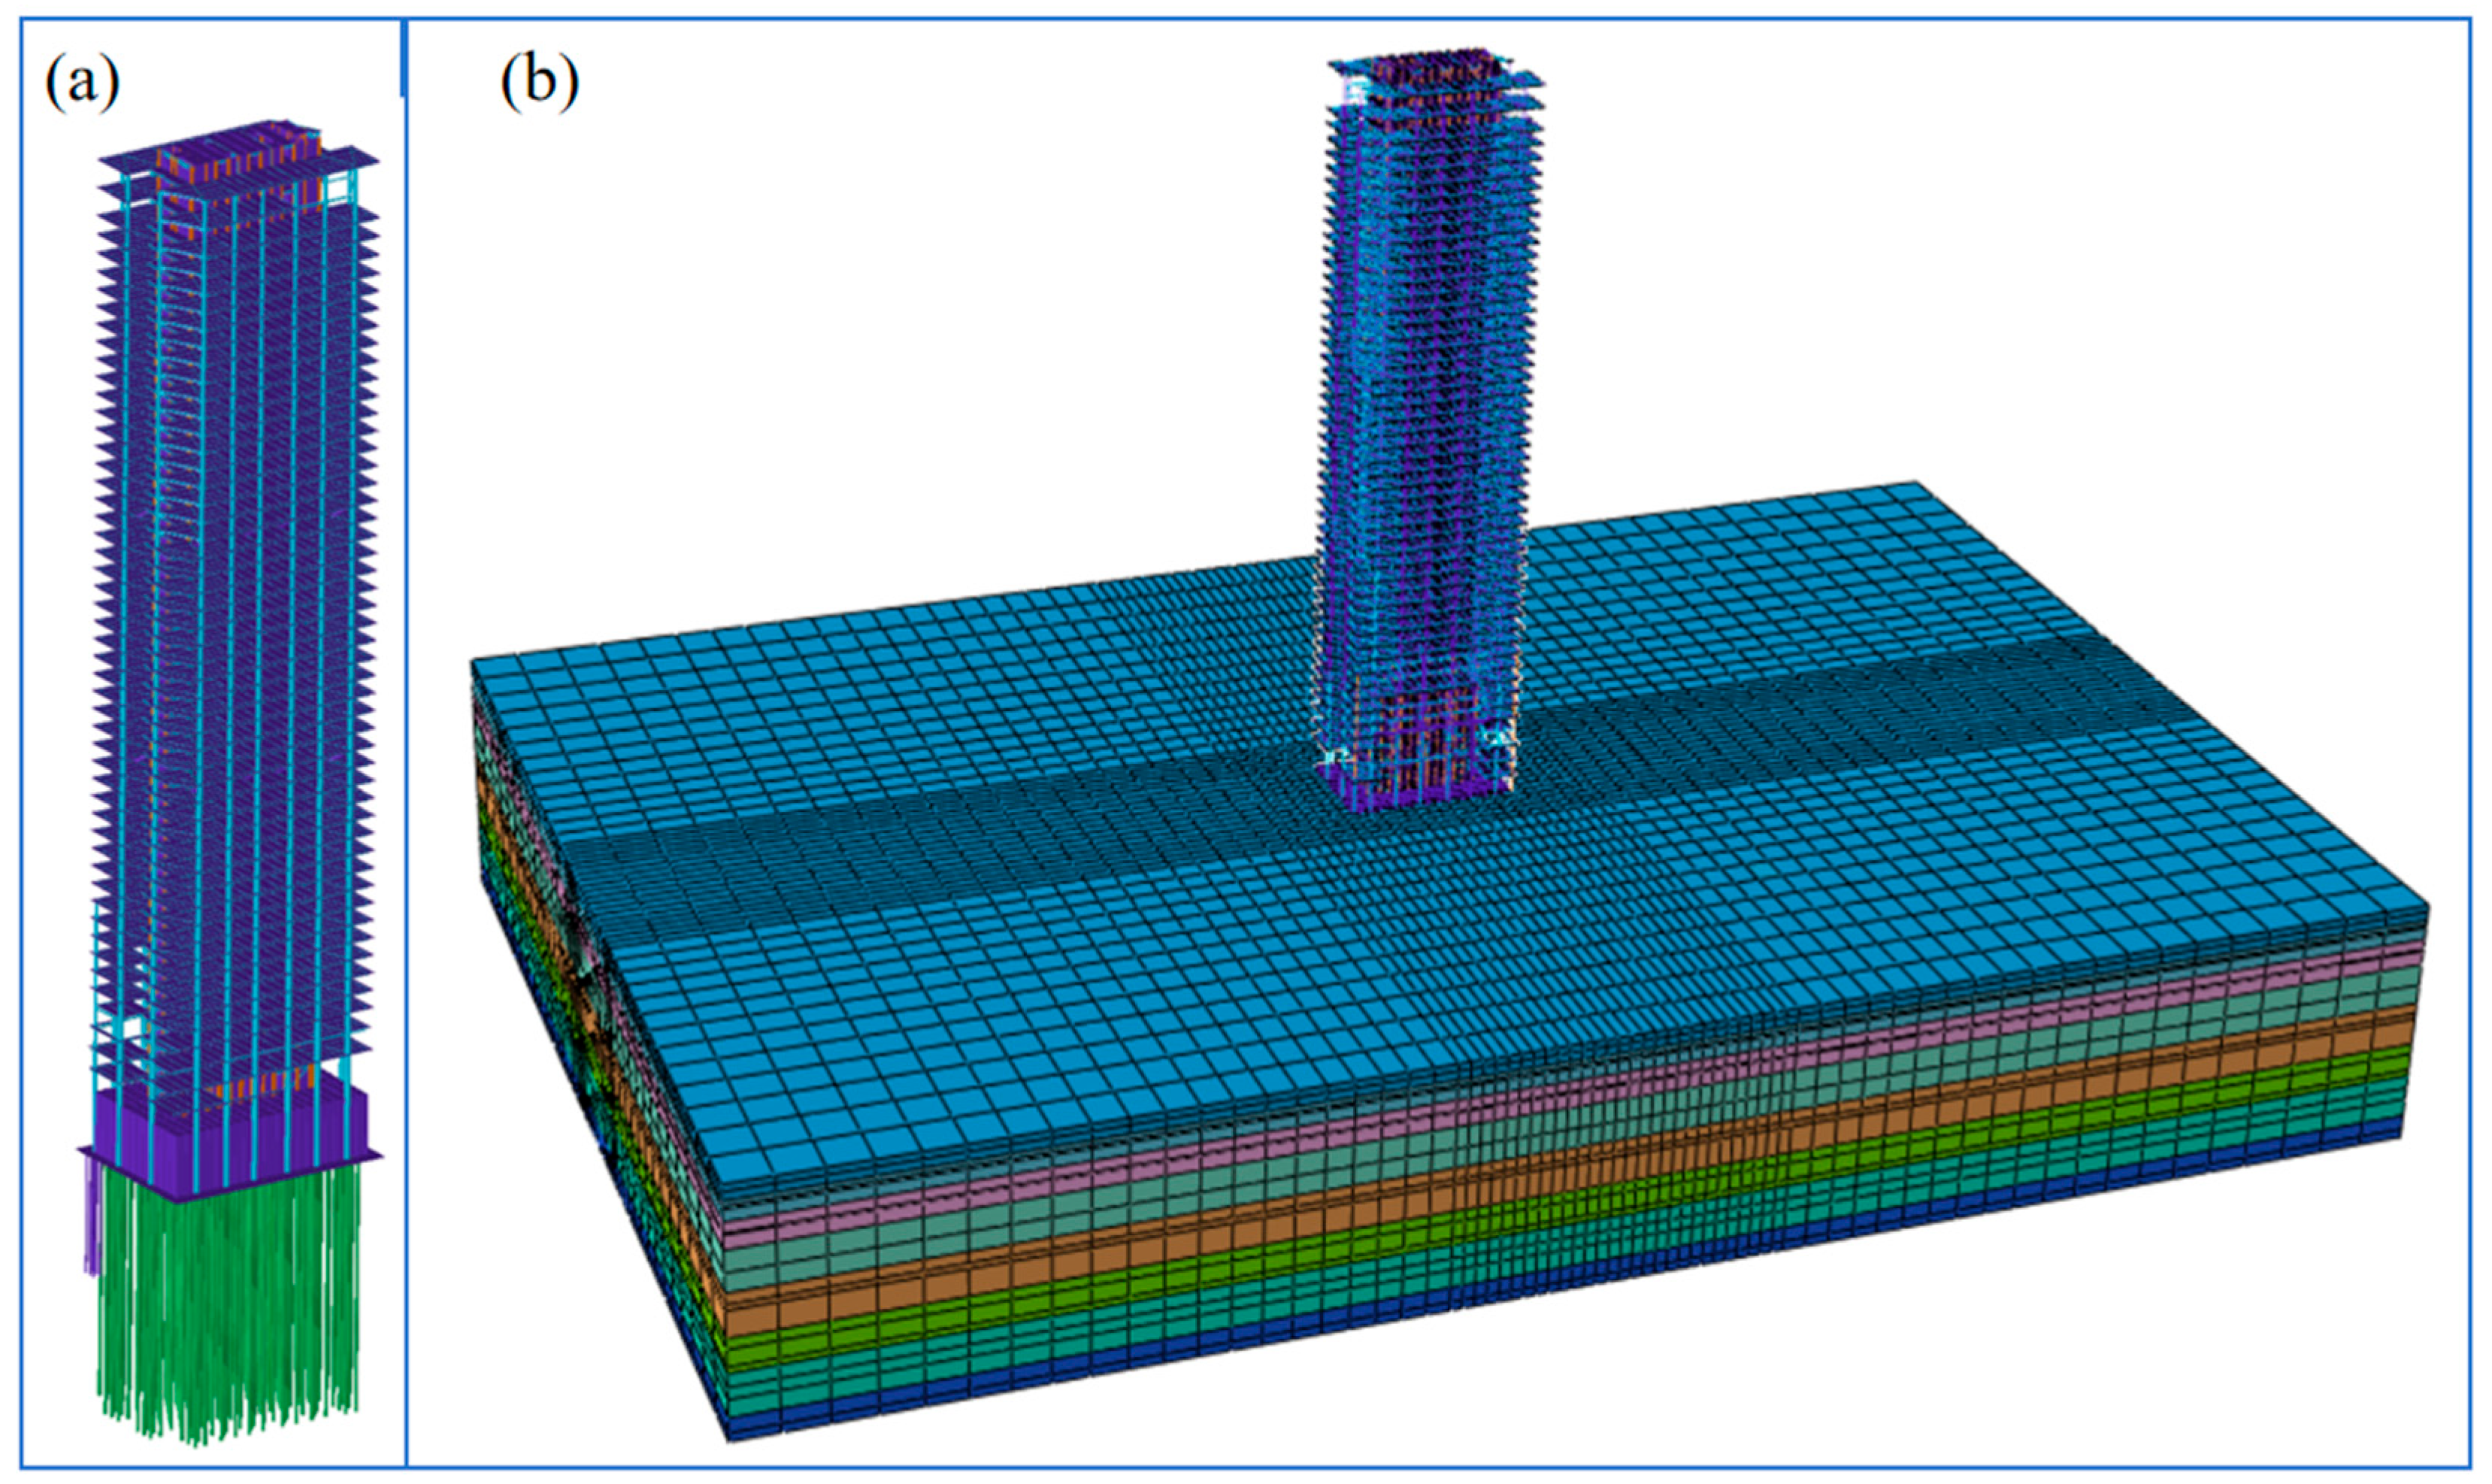
The finite element model of the fixed-base above-ground BCTS with 52 storeys is shown in Figure 8. The upper and lower storeys with outriggers in Figure 8 correspond to the 19th and 33rd storeys with outriggers, respectively. By comparing the results of ABAQUS modal analysis with those of SATWE [23], the correctness of this finite element model has been verified, as detailed in [24].
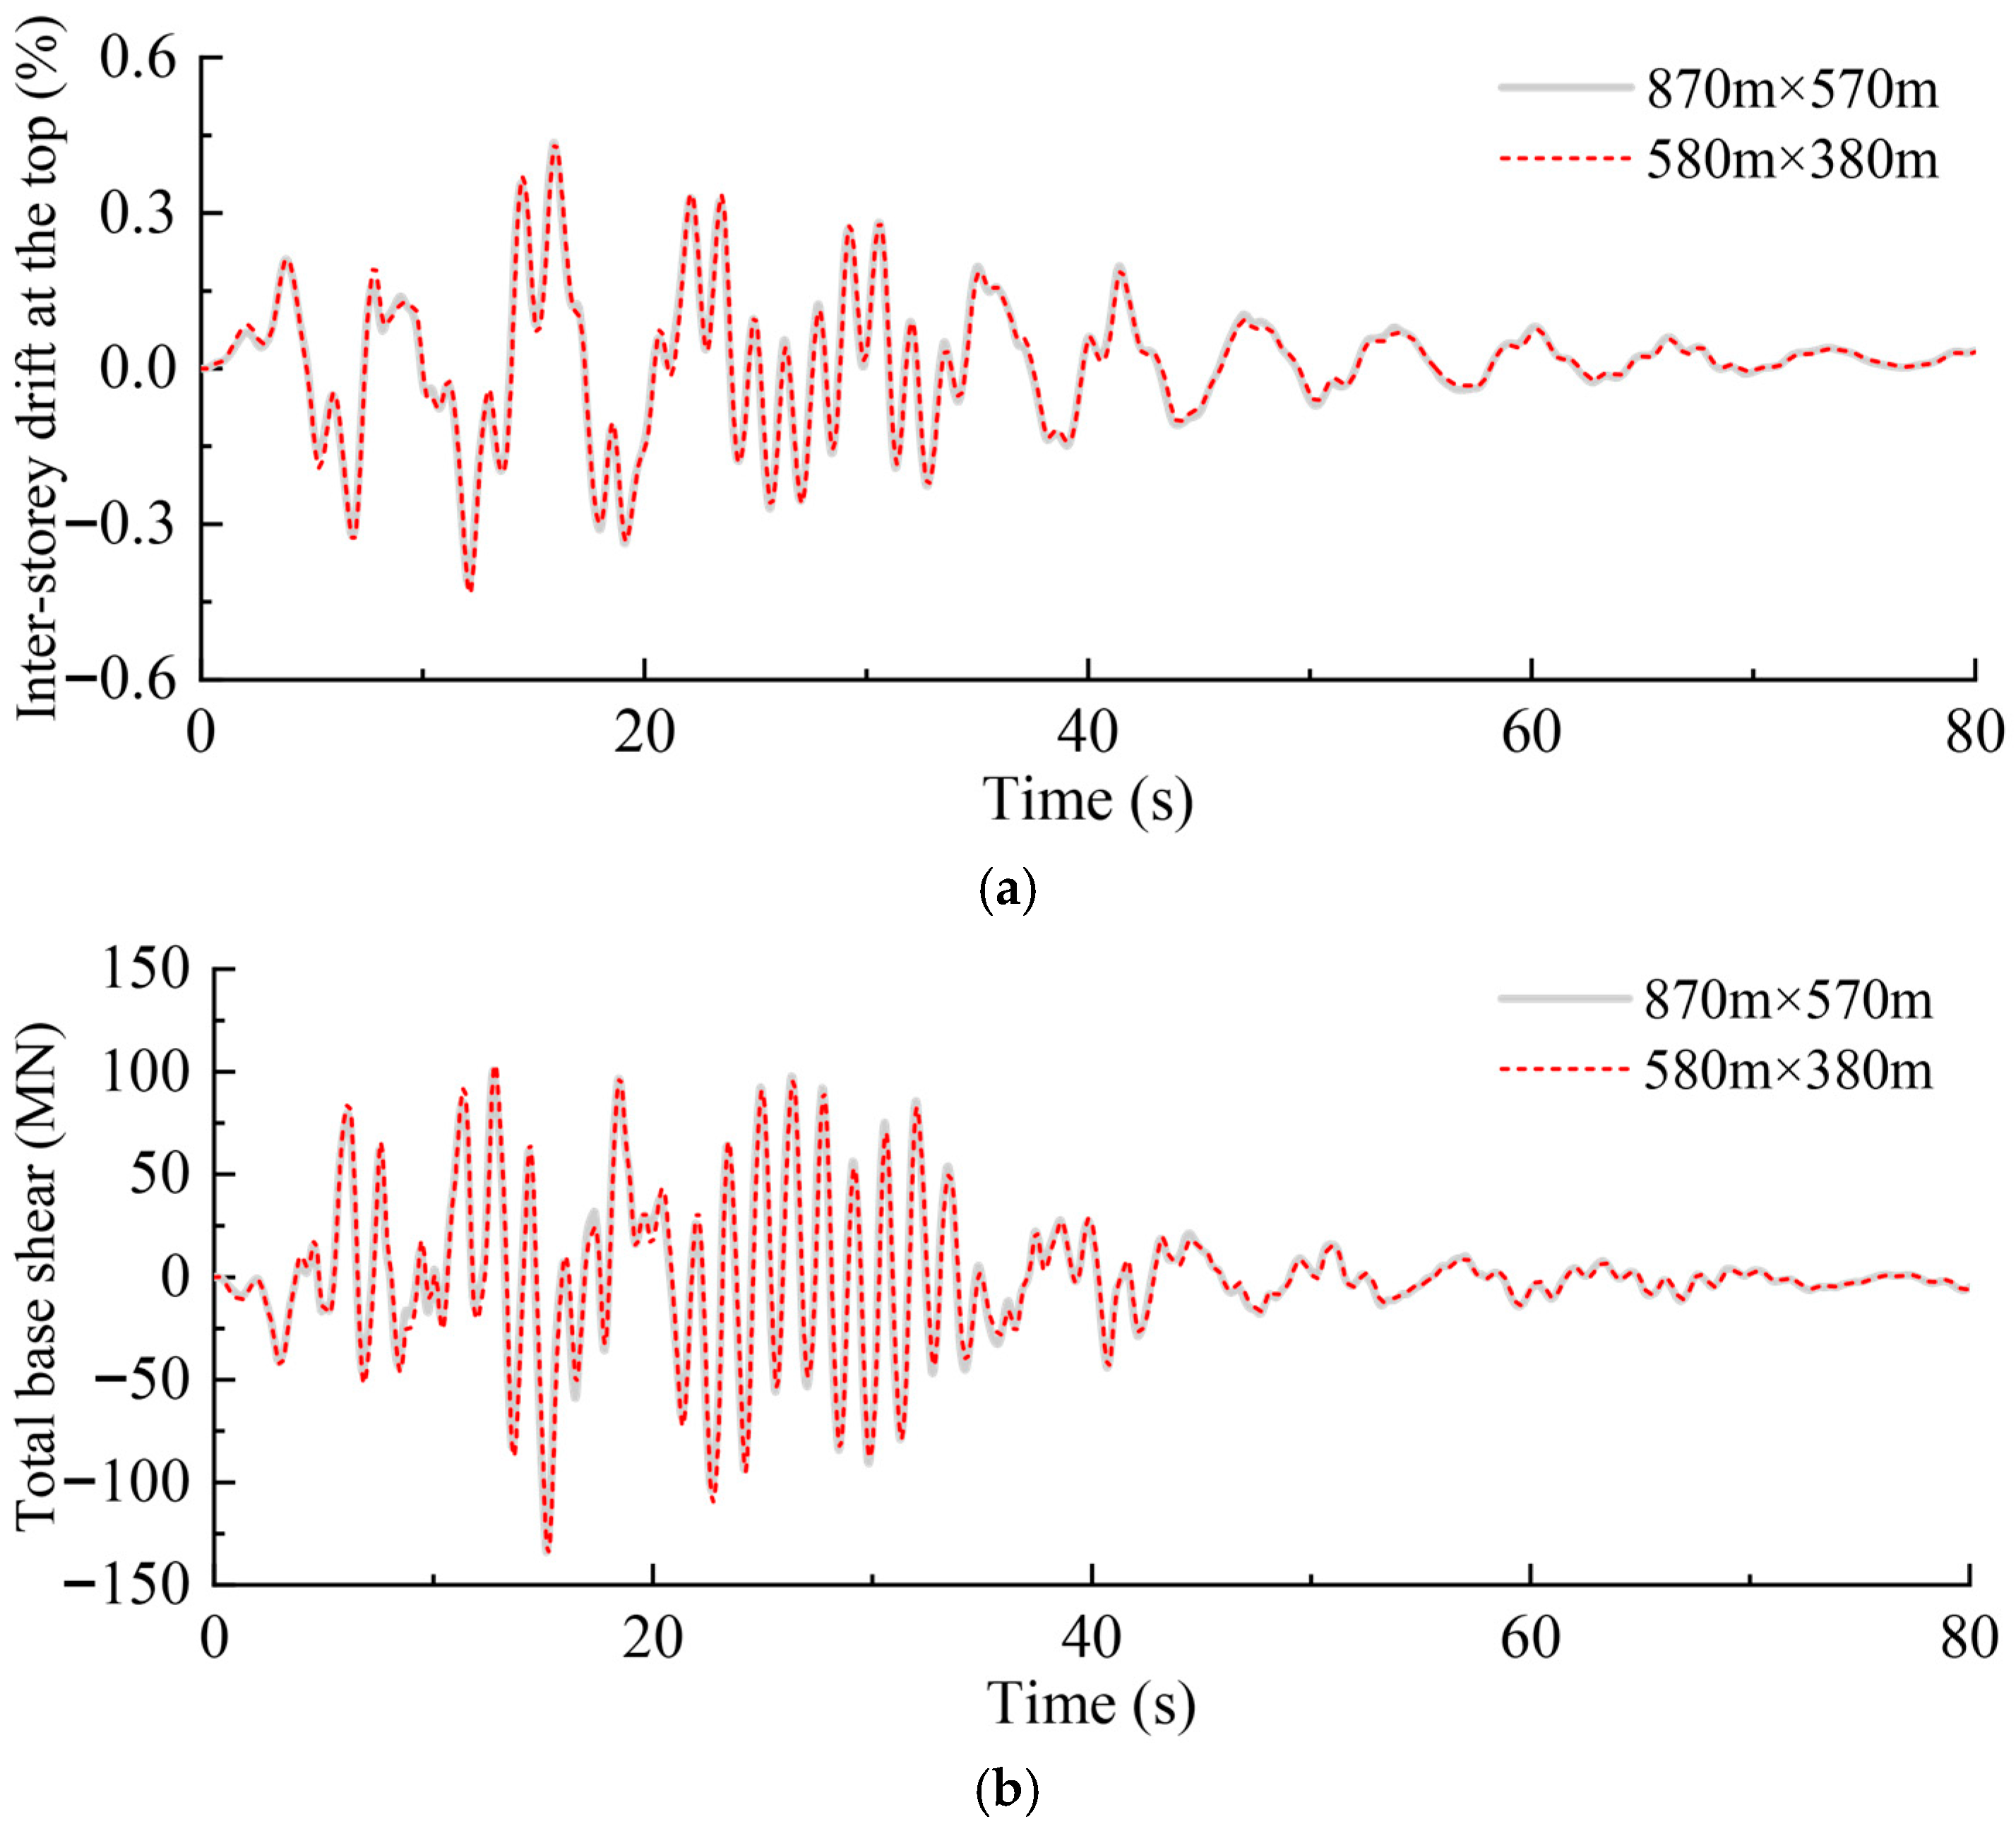
The finite element model of the soil–pile–BCTS system is shown in Figure 8, in which the bedrock surface is selected as the bottom boundary, and the layer with shear wave velocity of 500 m · s 1 is regarded as the bedrock according to Code for Seismic Design of Buildings [25]; moreover, the length and width of the soil are 580 m and 380 m, respectively, corresponding to 10 times of the length and width of the above-ground BCTS, respectively. In addition, to investigate whether the soil dimensions are large enough to ensure that the calculation results are not affected by the soil dimensions, Figure 9 compares the time-history curves of the inter-storey drift at the top and the total base shear of the structure when the length × width of the soil is 580 m × 380 m and 870 m × 570 m, respectively, where 870 m × 570 m corresponds to 15 times of the length × width of the above-ground BCTS. It can be found that the differences between the results of the two cases are negligible. Therefore, the accuracy of the model in which the length × width of the soil is 580 m × 380 m is sufficient.

3. Model Boundary and Seismic Wave Input

3.1. Viscous-Spring Boundary

When a finite model is used to simulate the semi-infinite soil, the definition of the truncated boundary should be carefully dealt with, which directly affects the accuracy and reliability of the calculation results. A reasonable boundary type should be able to simulate the propagation of scattering waves toward infinity. The common boundary types include the viscous boundary proposed by Lysmer and Kuhlemeyer [26], the transmitting boundary proposed by Liao et al. [27], and the viscous-spring boundary proposed by Deeks and Randolph [28], as well as Liu et al. [29,30,31]. The viscous boundary is easy to implement, but its accuracy is not high, and there is a problem of low-frequency instability. The transmitting boundary has high precision, but its implementation is complex. In this paper, the viscous-spring boundary with high accuracy, good stability, and easy implementation is adopted.
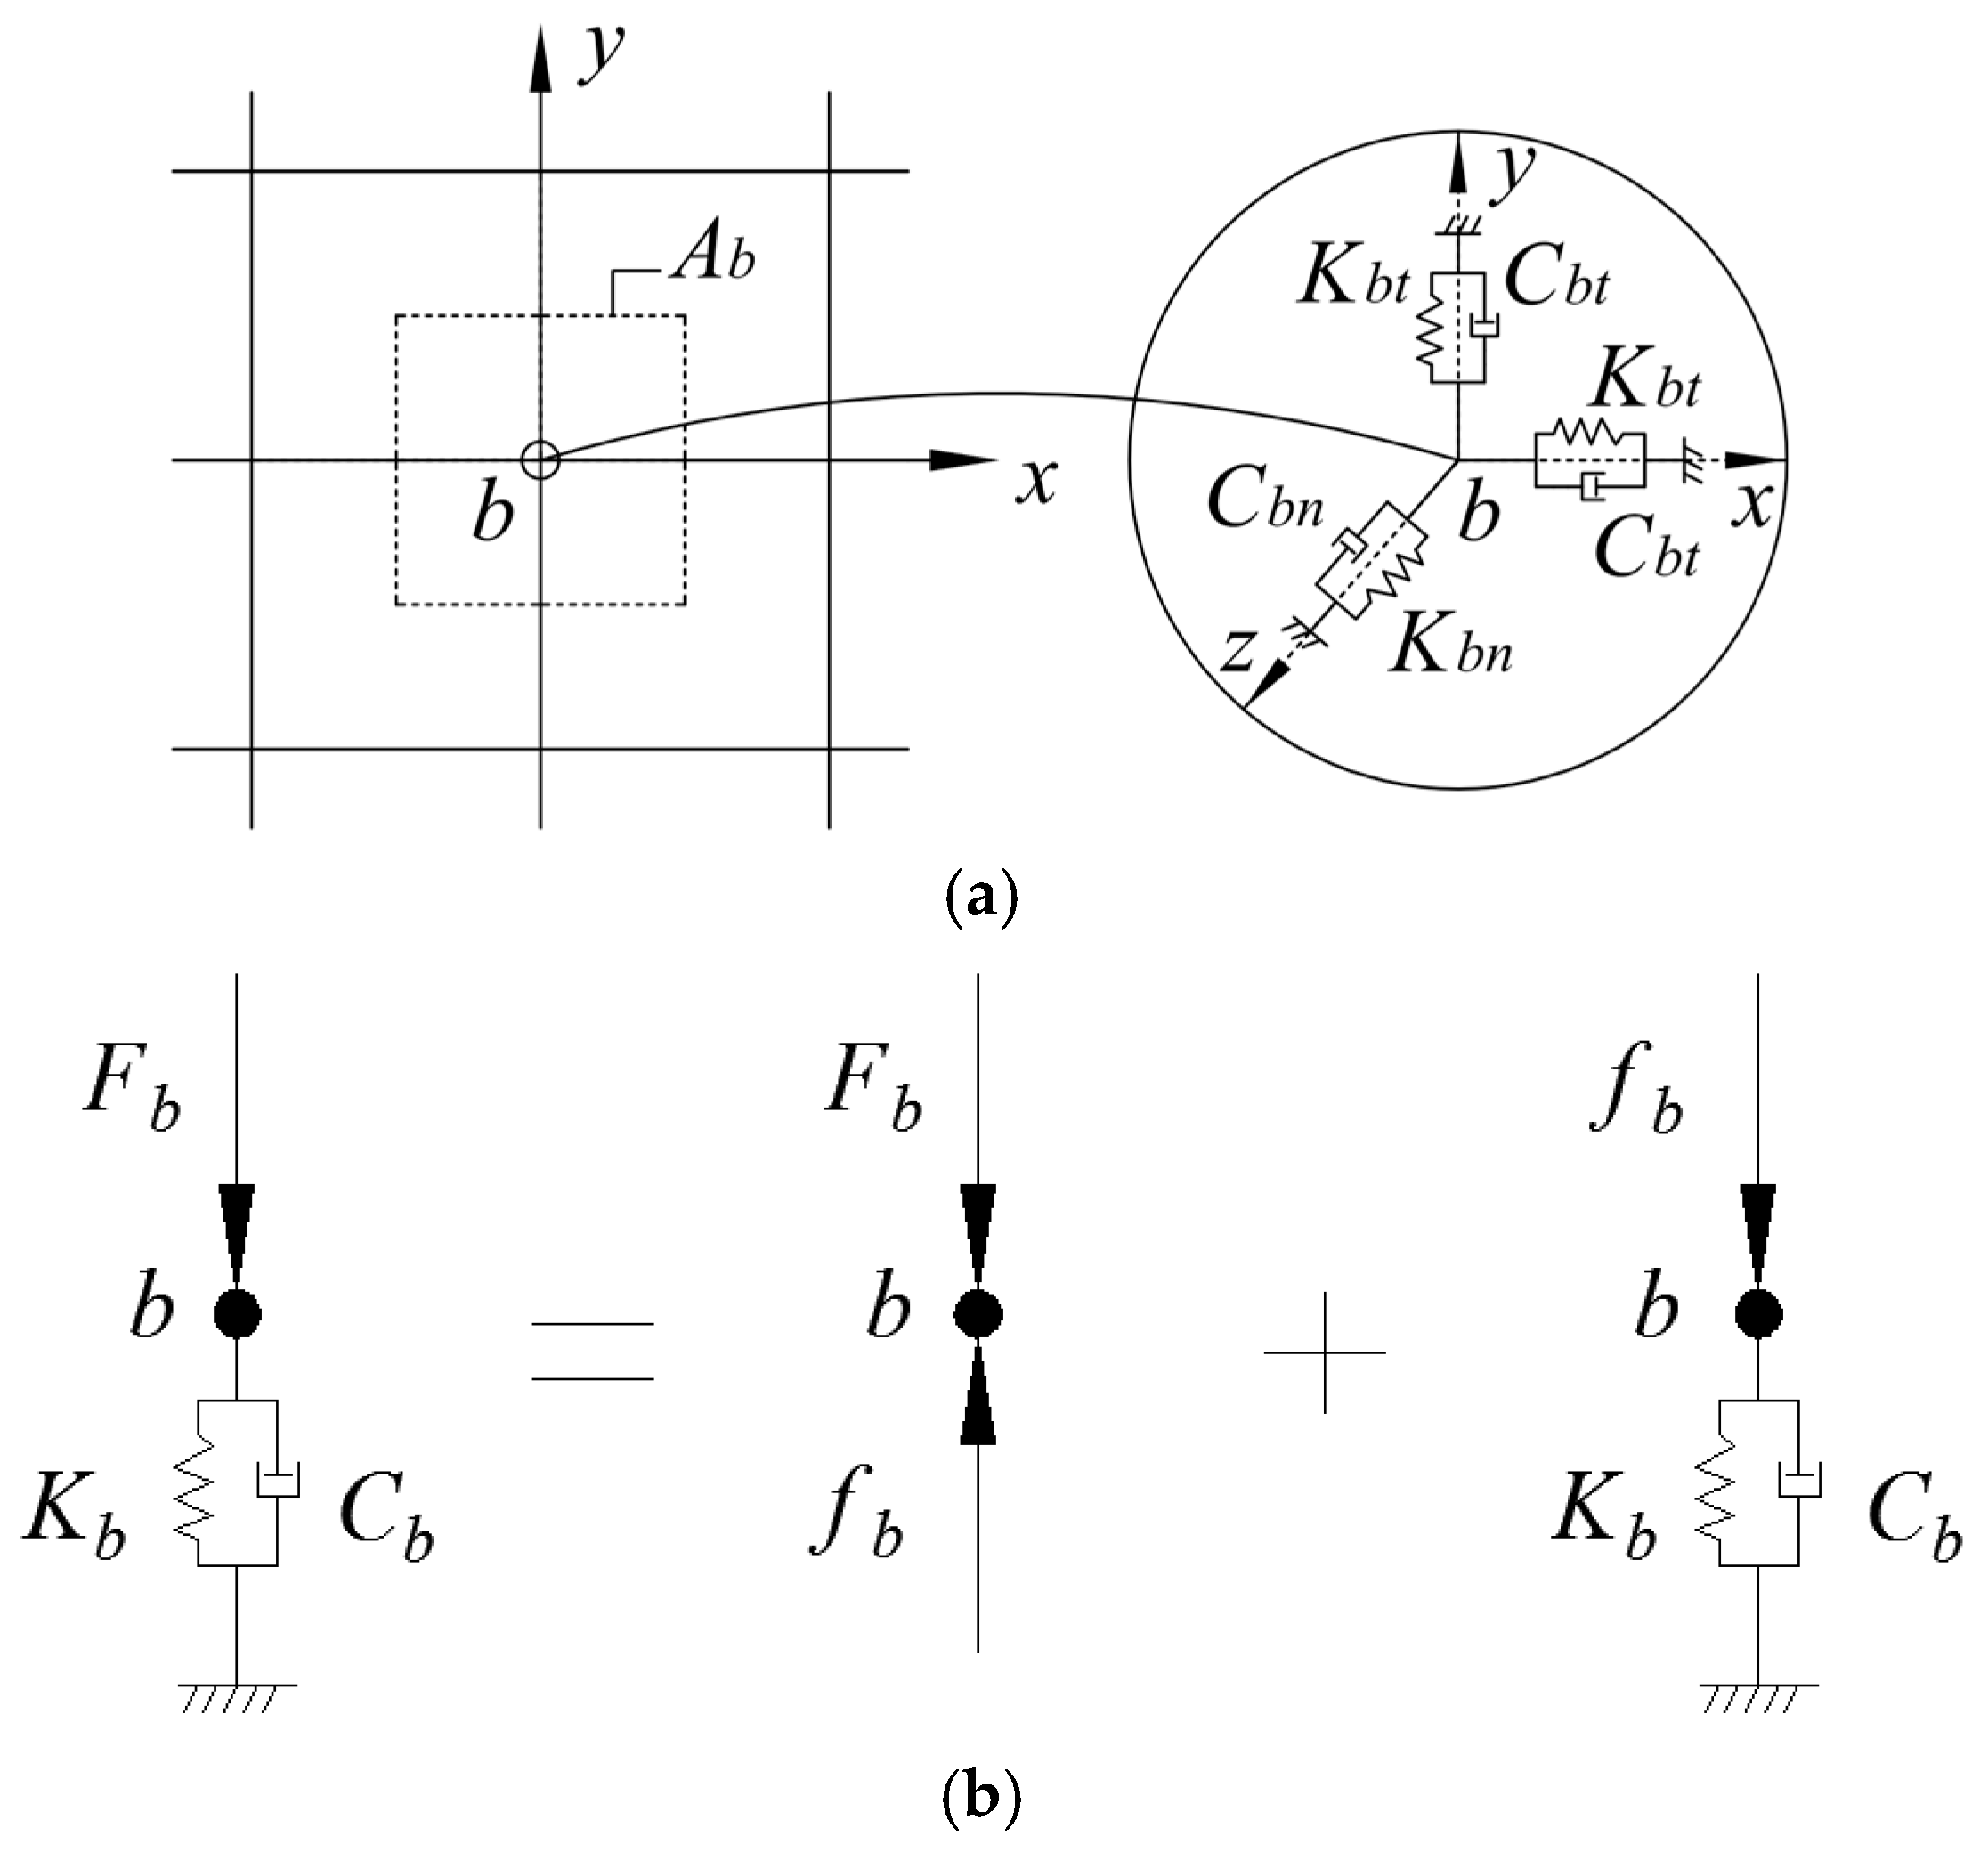
Figure 10a,b show the viscous-spring boundary of node b on the boundary surface x-y of a three-dimensional finite element model and the schematic of equivalent nodal force For the viscous-spring boundary, springs in parallel with dashpots are installed on node b along the tangential and normal directions. For the linear problem, the spring stiffness and the dashpot coefficient of node b can be obtained from the following equation [31]:
K b n = α n G R · A b   ,   K b t = α t G R · A b   ,   C b n = ρ c P · A b   ,   C b t = ρ c S · A b
where c p = 2 G 1 v / ρ / 1 2 v and c s = G / ρ , where v is the Poisson’s ratio of the medium, and ρ is the mass density of the medium. The viscous-spring boundary has good robustness, and the analysis results can always be satisfactory even if α n , α t and R varies in a wide range. The values recommended by [31] are adopted in this study, i.e., α n = 1.33 and α t = 0.67. In addition, scattering wave source in a practical problem is not a point. Still, a distributive line or surface in space, so the value of R is characterized by randomness [29], and for the convenience of programming, R is usually selected on average [29,32,33,34]. In this study, R is taken as the square root of the sum of the squares of the height, half-length, and half-width of the soil part by referring to [34].
For the nonlinear problem in which the soil adopts the equivalent linear constitutive model, Wang and Liu [30] pointed out that Equation (1) could still be used to calculate the spring stiffness and dashpot coefficient of the viscous-spring boundary as long as G, C P and C S were modified as the equivalent shear modulus, equivalent P-wave velocity and equivalent S-wave velocity, respectively. These equivalent parameters refer to the converged soil parameters obtained from the free-field equivalent linear analysis. The seismic wave is vertically incident along the horizontal direction in this study, and the free-field equivalent linear analysis under this condition can be carried out via the computer program EERA developed by Bardet et al. [22]. For the shear wave velocity and soil stratification directly obtained from the drilling data of a specific site, the parameters of the equivalent linear soil model were calibrated with the help of EERA software 2016 based on free field analysis to ensure that they were consistent with the dynamic characteristics of Tianjin soft soil. The response caused by the S6 wave, the Ninghe earthquake, is consistent with the local earthquake report, which also confirms that the mathematical model can adapt to the actual engineering conditions.

3.2. Equivalent Nodal Force Method

The accurate input of seismic waves is a critical factor influencing the success and reliability of wave motion simulation in geotechnical engineering. Conventional approaches, such as the method described in [13], often simplify the analysis by assuming a rigid bedrock condition. In this simplified model, seismic excitation, typically in the form of acceleration or displacement time histories, is directly applied at the fixed base of the model. While this technique offers simplicity and ease of implementation, it introduces significant inaccuracies. As noted by Wang et al. [35], prescribing base motion effectively creates a closed system within a finite computational domain, which prevents the radiation of energy into the unbounded exterior soil. This artificial boundary condition leads to an accumulation of spurious wave energy within the model, thereby producing substantial computational errors. Moreover, this traditional approach only introduces input motions at the bottom boundary, neglecting the contributions from lateral wave propagation. This omission further deviates from realistic field conditions and introduces additional inaccuracies.
To overcome these limitations, the present study employs the equivalent nodal force method developed by Liu et al. [29,30]. In this technique, the seismic wave input is converted into a set of equivalent nodal forces that are applied along the viscous-spring artificial boundary. This method effectively simulates the radiation damping effect and allows for a more realistic representation of wave propagation from an infinite domain into the finite model. The approach has been widely validated and demonstrated to achieve high computational accuracy, as evidenced in references [32,36].
The truncated boundary cuts out a finite computational region from a semi-infinite space. Thus, the condition for accurate seismic wave input is that the equivalent nodal force imposed on the boundary of the finite element model should generate the same displacement and stress as the original semi-infinite free field [29], i.e.,
u x b , y b , z b , t = u f x b , y b , z b , t ,   τ x b , y b , z b , t = τ f x b , y b , z b , t
As shown in Figure 10b, the boundary node is separated from the spring-dashpot appended to it by using the concept of a separate body in general mechanical analysis. First of all, from the balance equation of force,
τ x b , y b , z b , t · A b = F b t f b t
Then, from the motion equation of the spring-dashpot,
K b u x b , y b , z b , t + C b u ˙ x b , y b , z b , t = f b t
Substituting Equation (4) into Equation (3),
F b t = K b u x b , y b , z b , t + C b u ˙ x b , y b , z b , t + τ x b , y b , z b , t · A b
Finally, substituting Equation (2) into Equation (5),
F b t = K b u f x b , y b , z b , t + C b u ˙ f x b , y b , z b , t + τ f x b , y b , z b , t · A b
In this paper, all seismic waves are vertically incident along the horizontal direction. Thus, the displacement and velocity responses in the free field are along the horizontal direction, and there is only shear stress but no normal stress response in the free field, as shown in Figure 11a. The equivalent nodal forces imposed on the boundaries of the three-dimensional model are shown in Figure 11b.

3.3. Verification of Accuracy

Two examples are solved, and comparisons are made to verify the accuracy of the viscous-spring boundary and the equivalent nodal force method.

3.3.1. Linear Earthquake Response of a Hemispherical Canyon

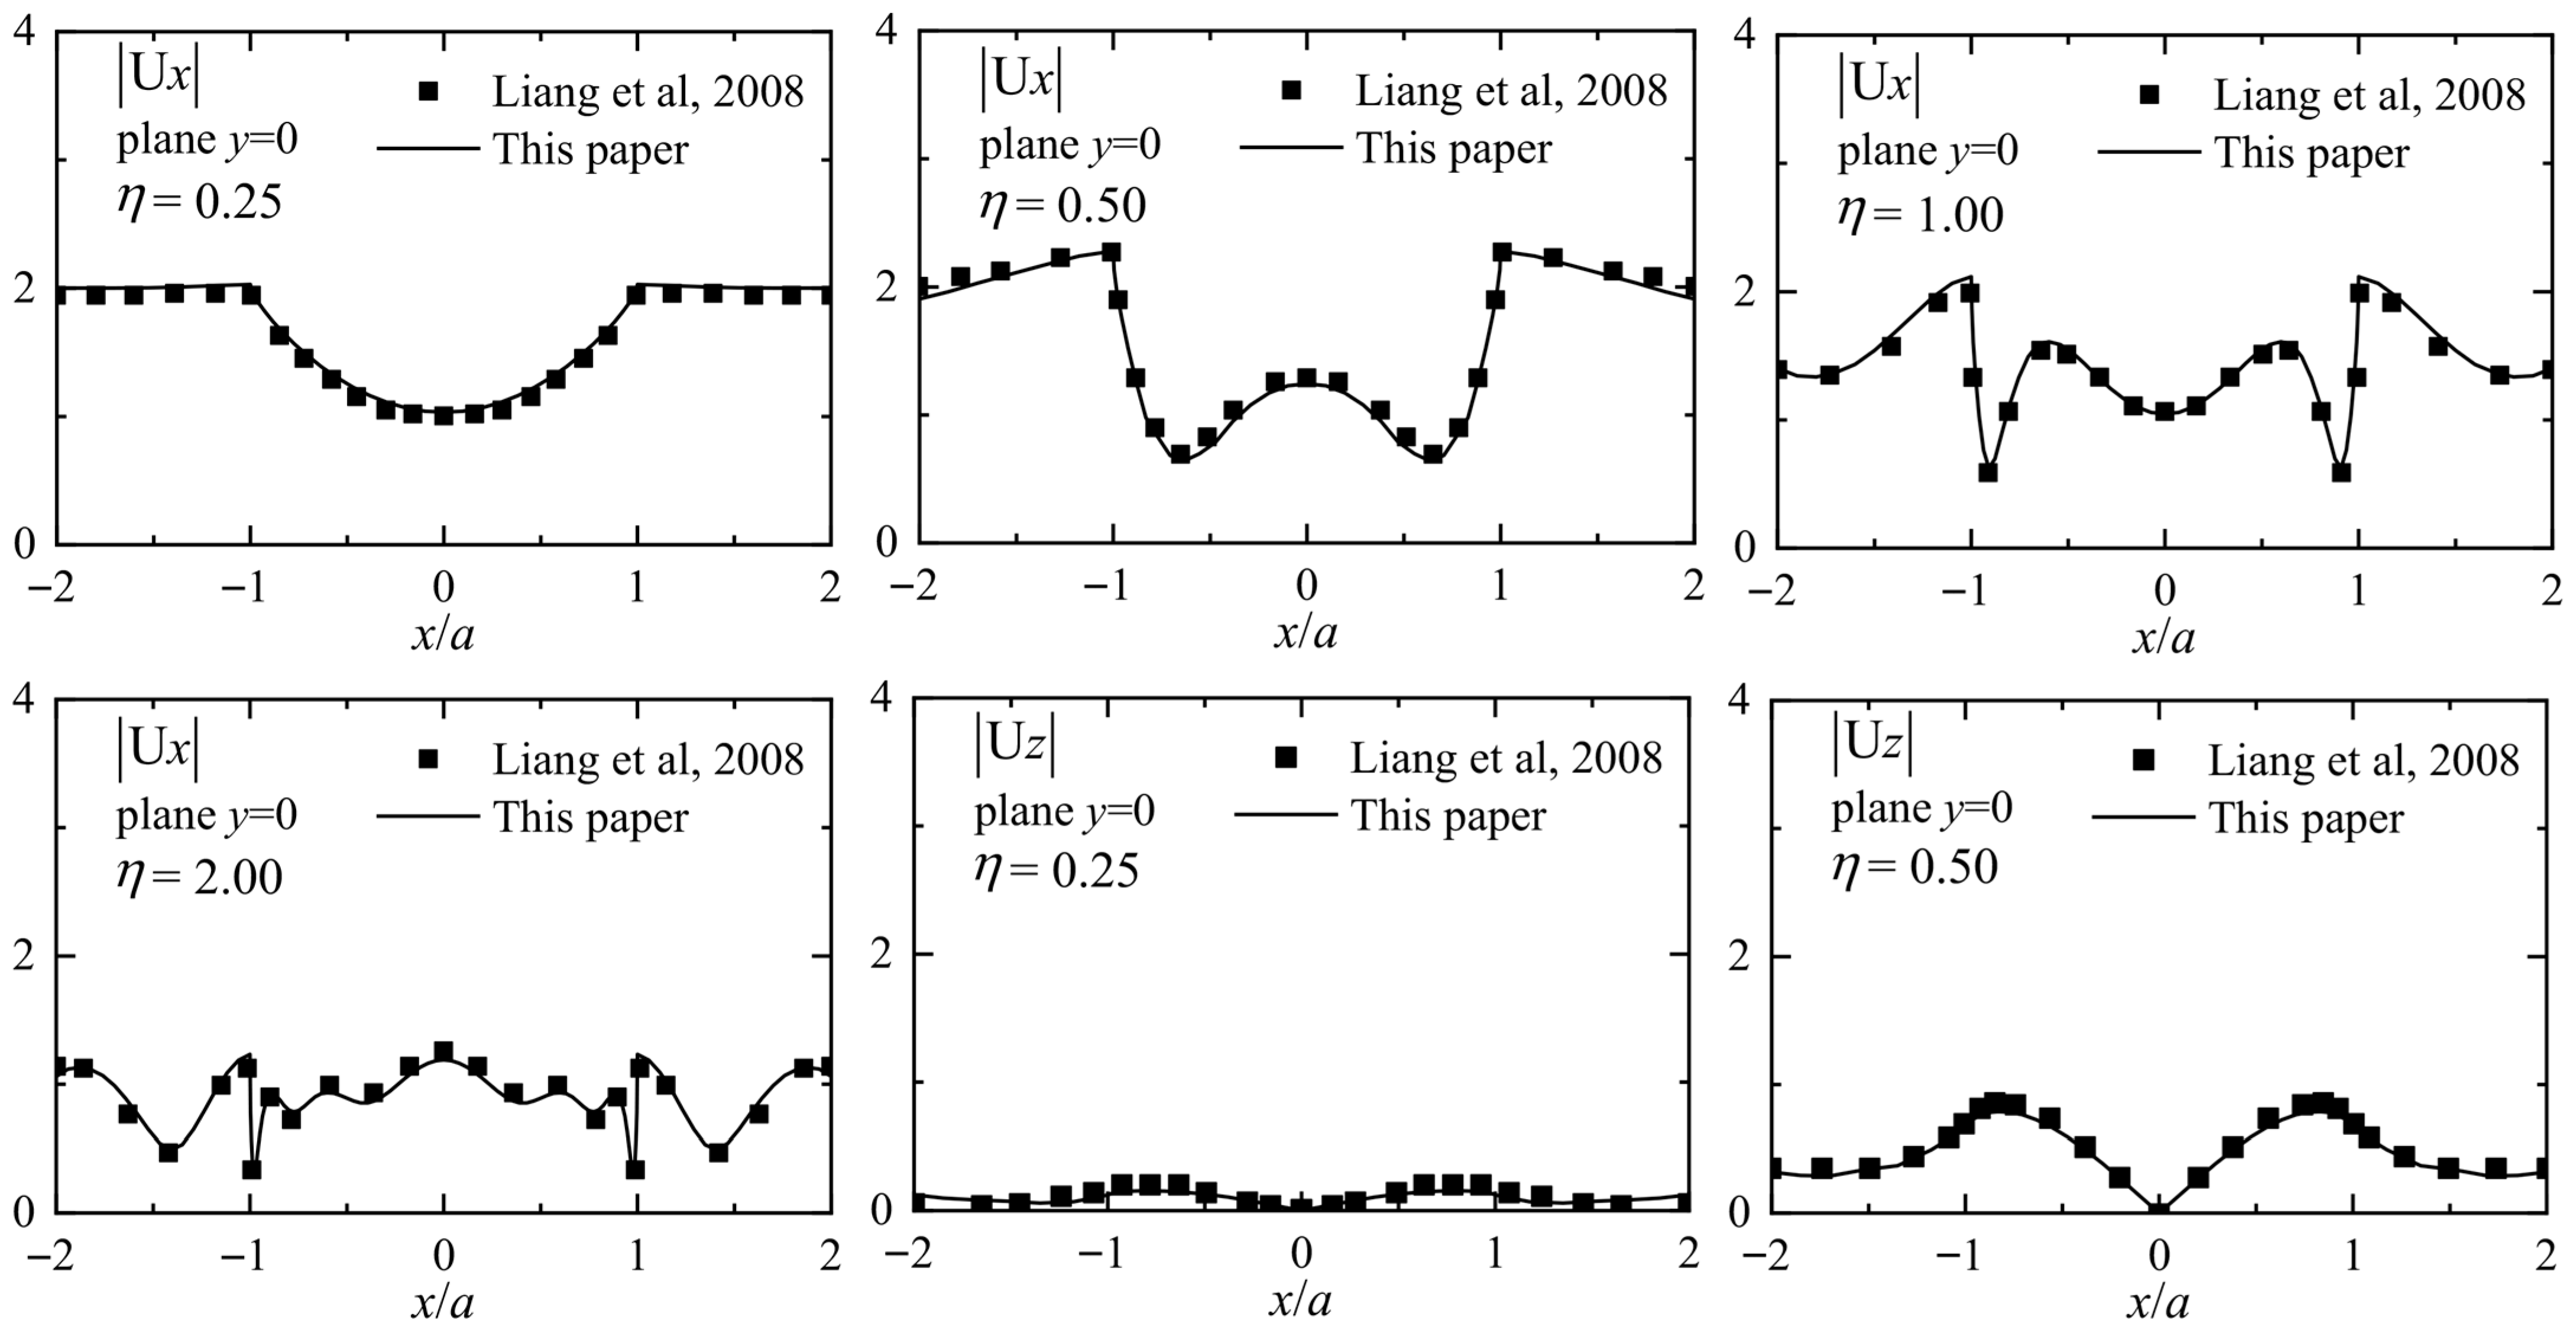
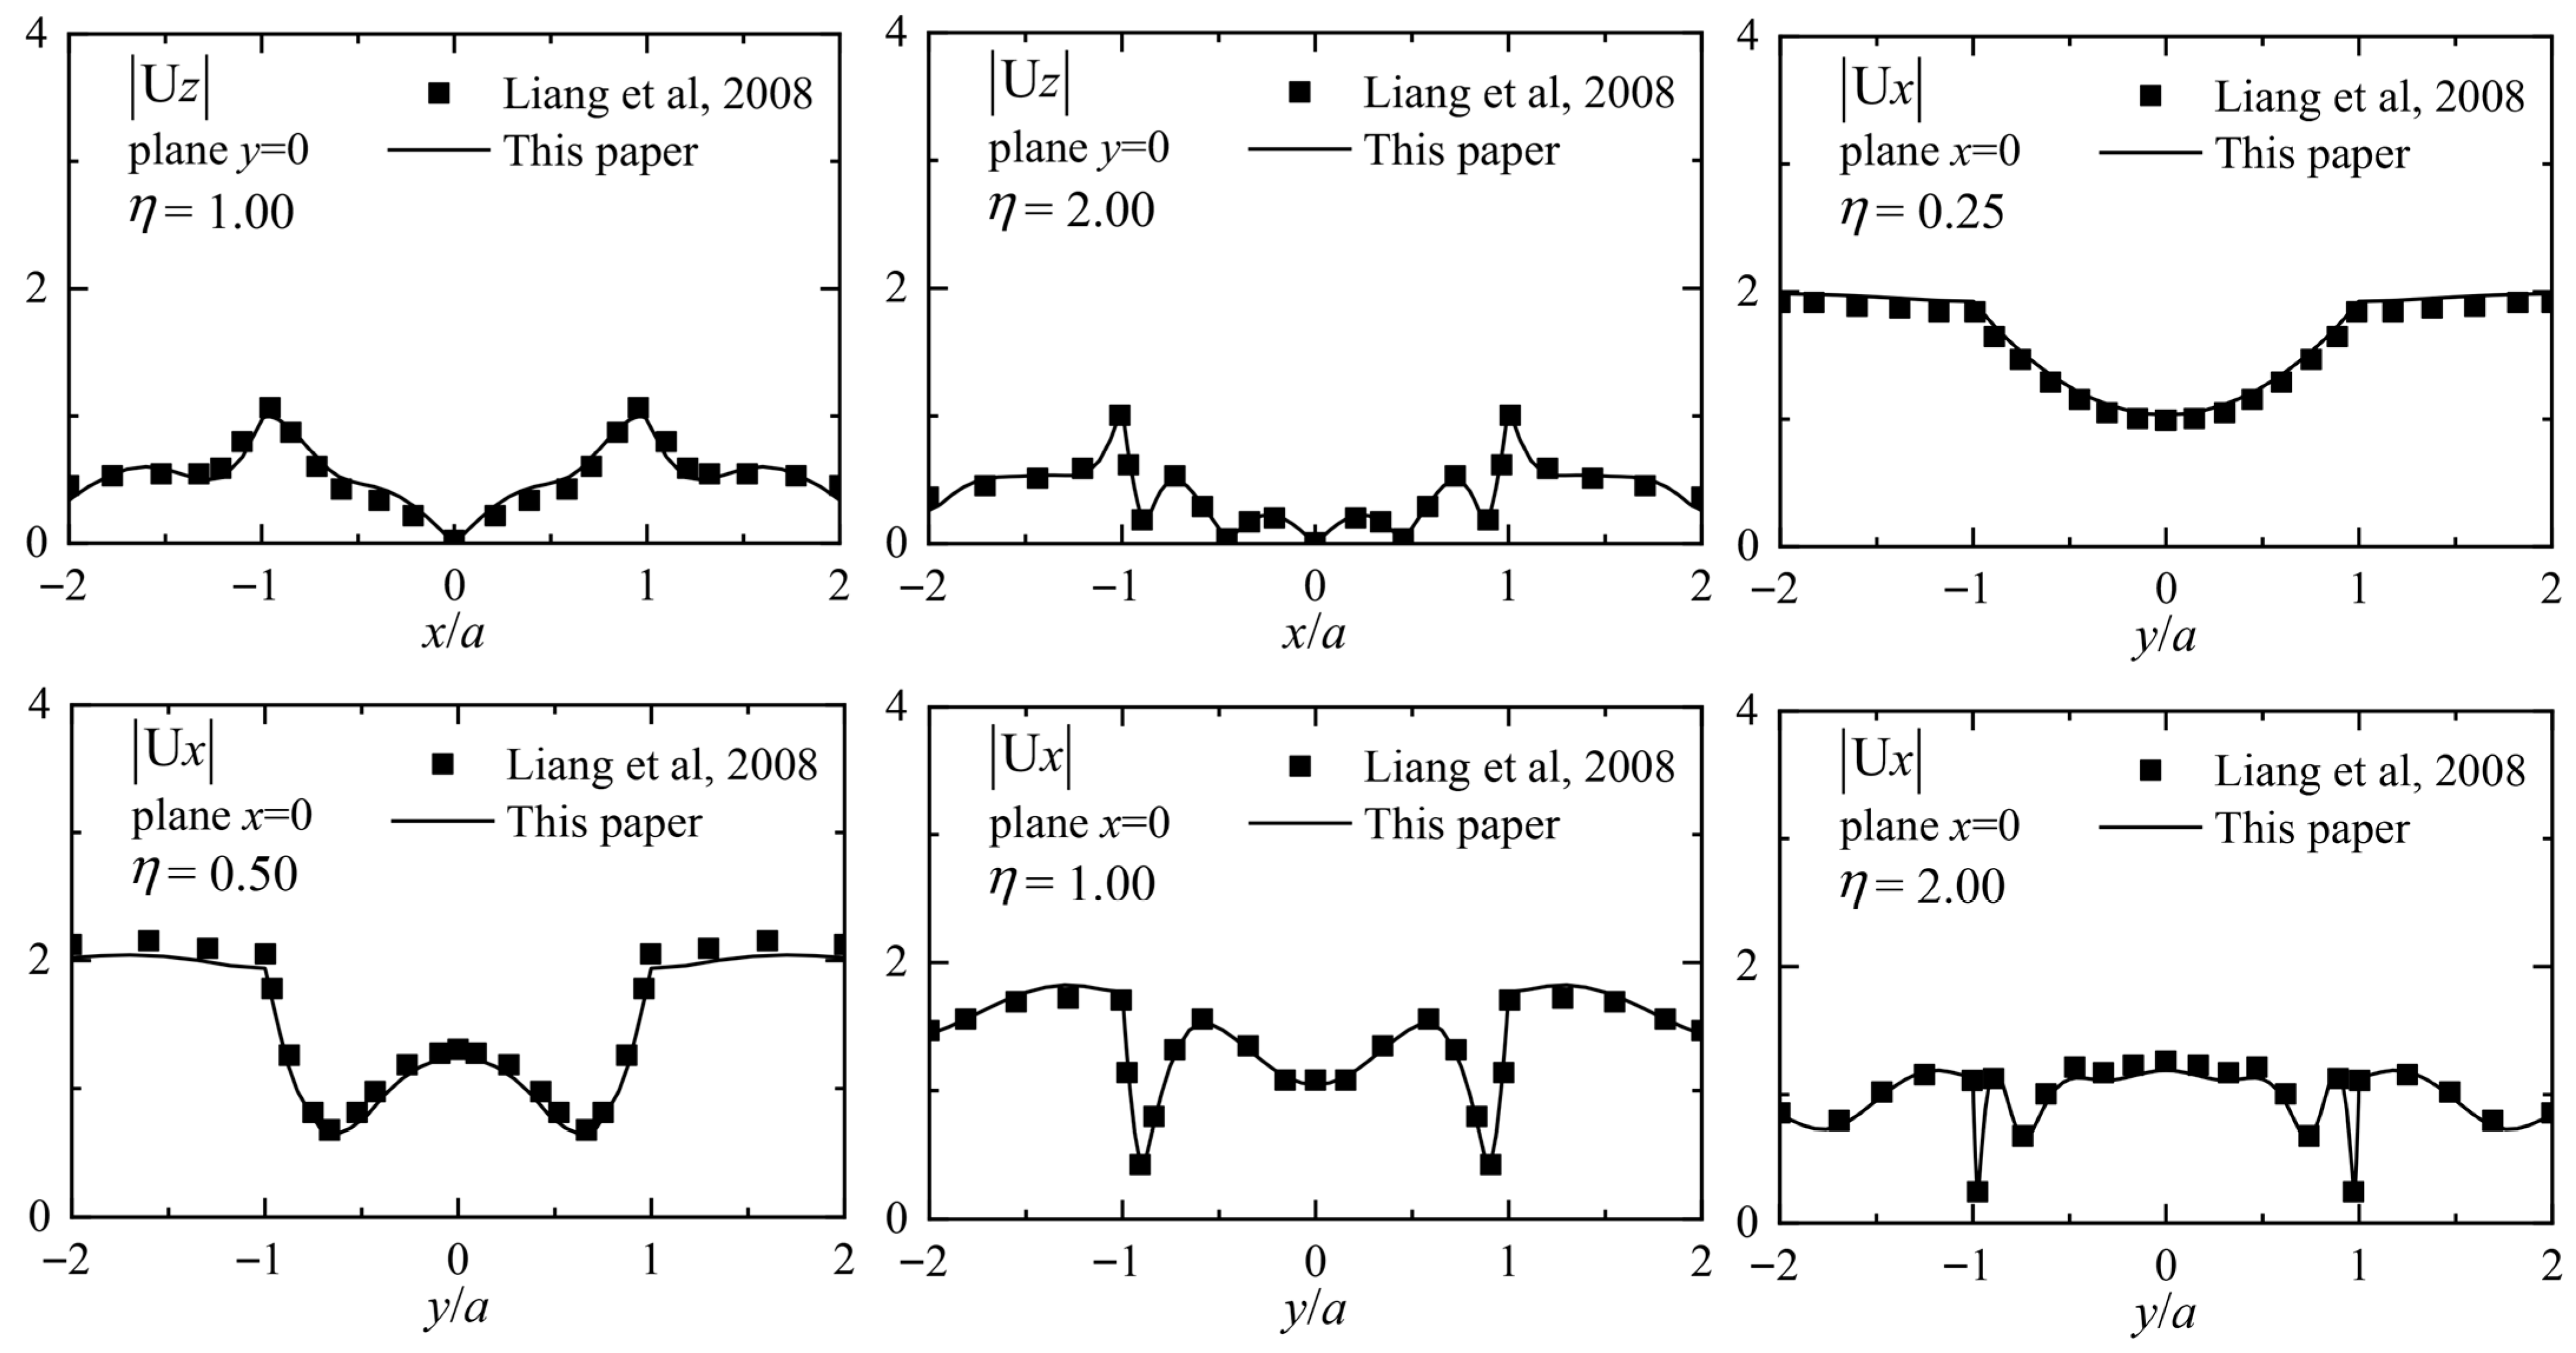
Consider a hemispherical canyon embedded in single-layer soil on the elastic bedrock. The dimensionless frequency η is defined as ω α / π C s L , where the canyon radius, ω is the circular frequency of the incident harmonic wave, and C s L is the shear wave velocity of the soil. Detailed values of the calculation parameters can be consulted in [37]. Assuming that the harmonic wave is vertically incident on the bedrock along the x direction, the surface displacement responses of the canyon are solved when η is 0.25, 0.50, 1.00, and 2.00, respectively. Figure 12 compares the displacement amplitudes obtained by the finite element model in this paper with those obtained by the indirect boundary element model in [37]. It can be seen from Figure 12 that the results in this paper are in good agreement with those in [37], whether at low or high frequencies.

3.3.2. Nonlinear Earthquake Response of Three-Dimensional Free Field

A three-dimensional finite element model for nonlinear earthquake response analysis of the free field is established. The free field consists of eight horizontal soil layers on elastic bedrock with a total thickness of 80 m. The calculation parameters of each soil layer and the equivalent linear parameters of each soil category are detailed in [38]. The half-width (x direction), half-length (y direction), and depth (z direction) of the finite element model are taken as 100 m, 100 m, and 80 m, respectively. It is assumed that the El Centro wave of amplitude 0.1 g is vertically incident on the bedrock along the x direction. In this case, the surface responses of the three-dimensional free field model should be the same in theory. Figure 13 shows the acceleration time history responses of the surface observation points x = 0 m, y = 0 m (on the surface center), x = 92 m, y = 0 m (on the x axis), and x = 0 m, y = 92 m (on the y axis). One can see from Figure 13 that the surface acceleration time history responses of the three observation points obtained by the finite element model in this paper are basically consistent, and they are in good agreement with the result obtained by EERA [22].

4. Results and Discussion

Two models are established in this paper for the nonlinear earthquake response analysis, as shown in Figure 14. One is the fixed-base above-ground BCTS model (BCTS, see Figure 8), in which the seismic wave input is realized by assigning the acceleration response of the surface of free field to the base. The other is the soil–pile–BCTS model with the viscous-spring boundary (S-P-BCTS, see Figure 8), in which the seismic wave input is implemented by using the equivalent nodal force method, i.e., the seismic wave is vertically incident on the bedrock along the horizontal direction, and, according to the displacement, velocity and stress responses of every soil layer of free field, it is eventually transformed into the equivalent nodal forces applied on the five boundary faces (see Figure 11b).
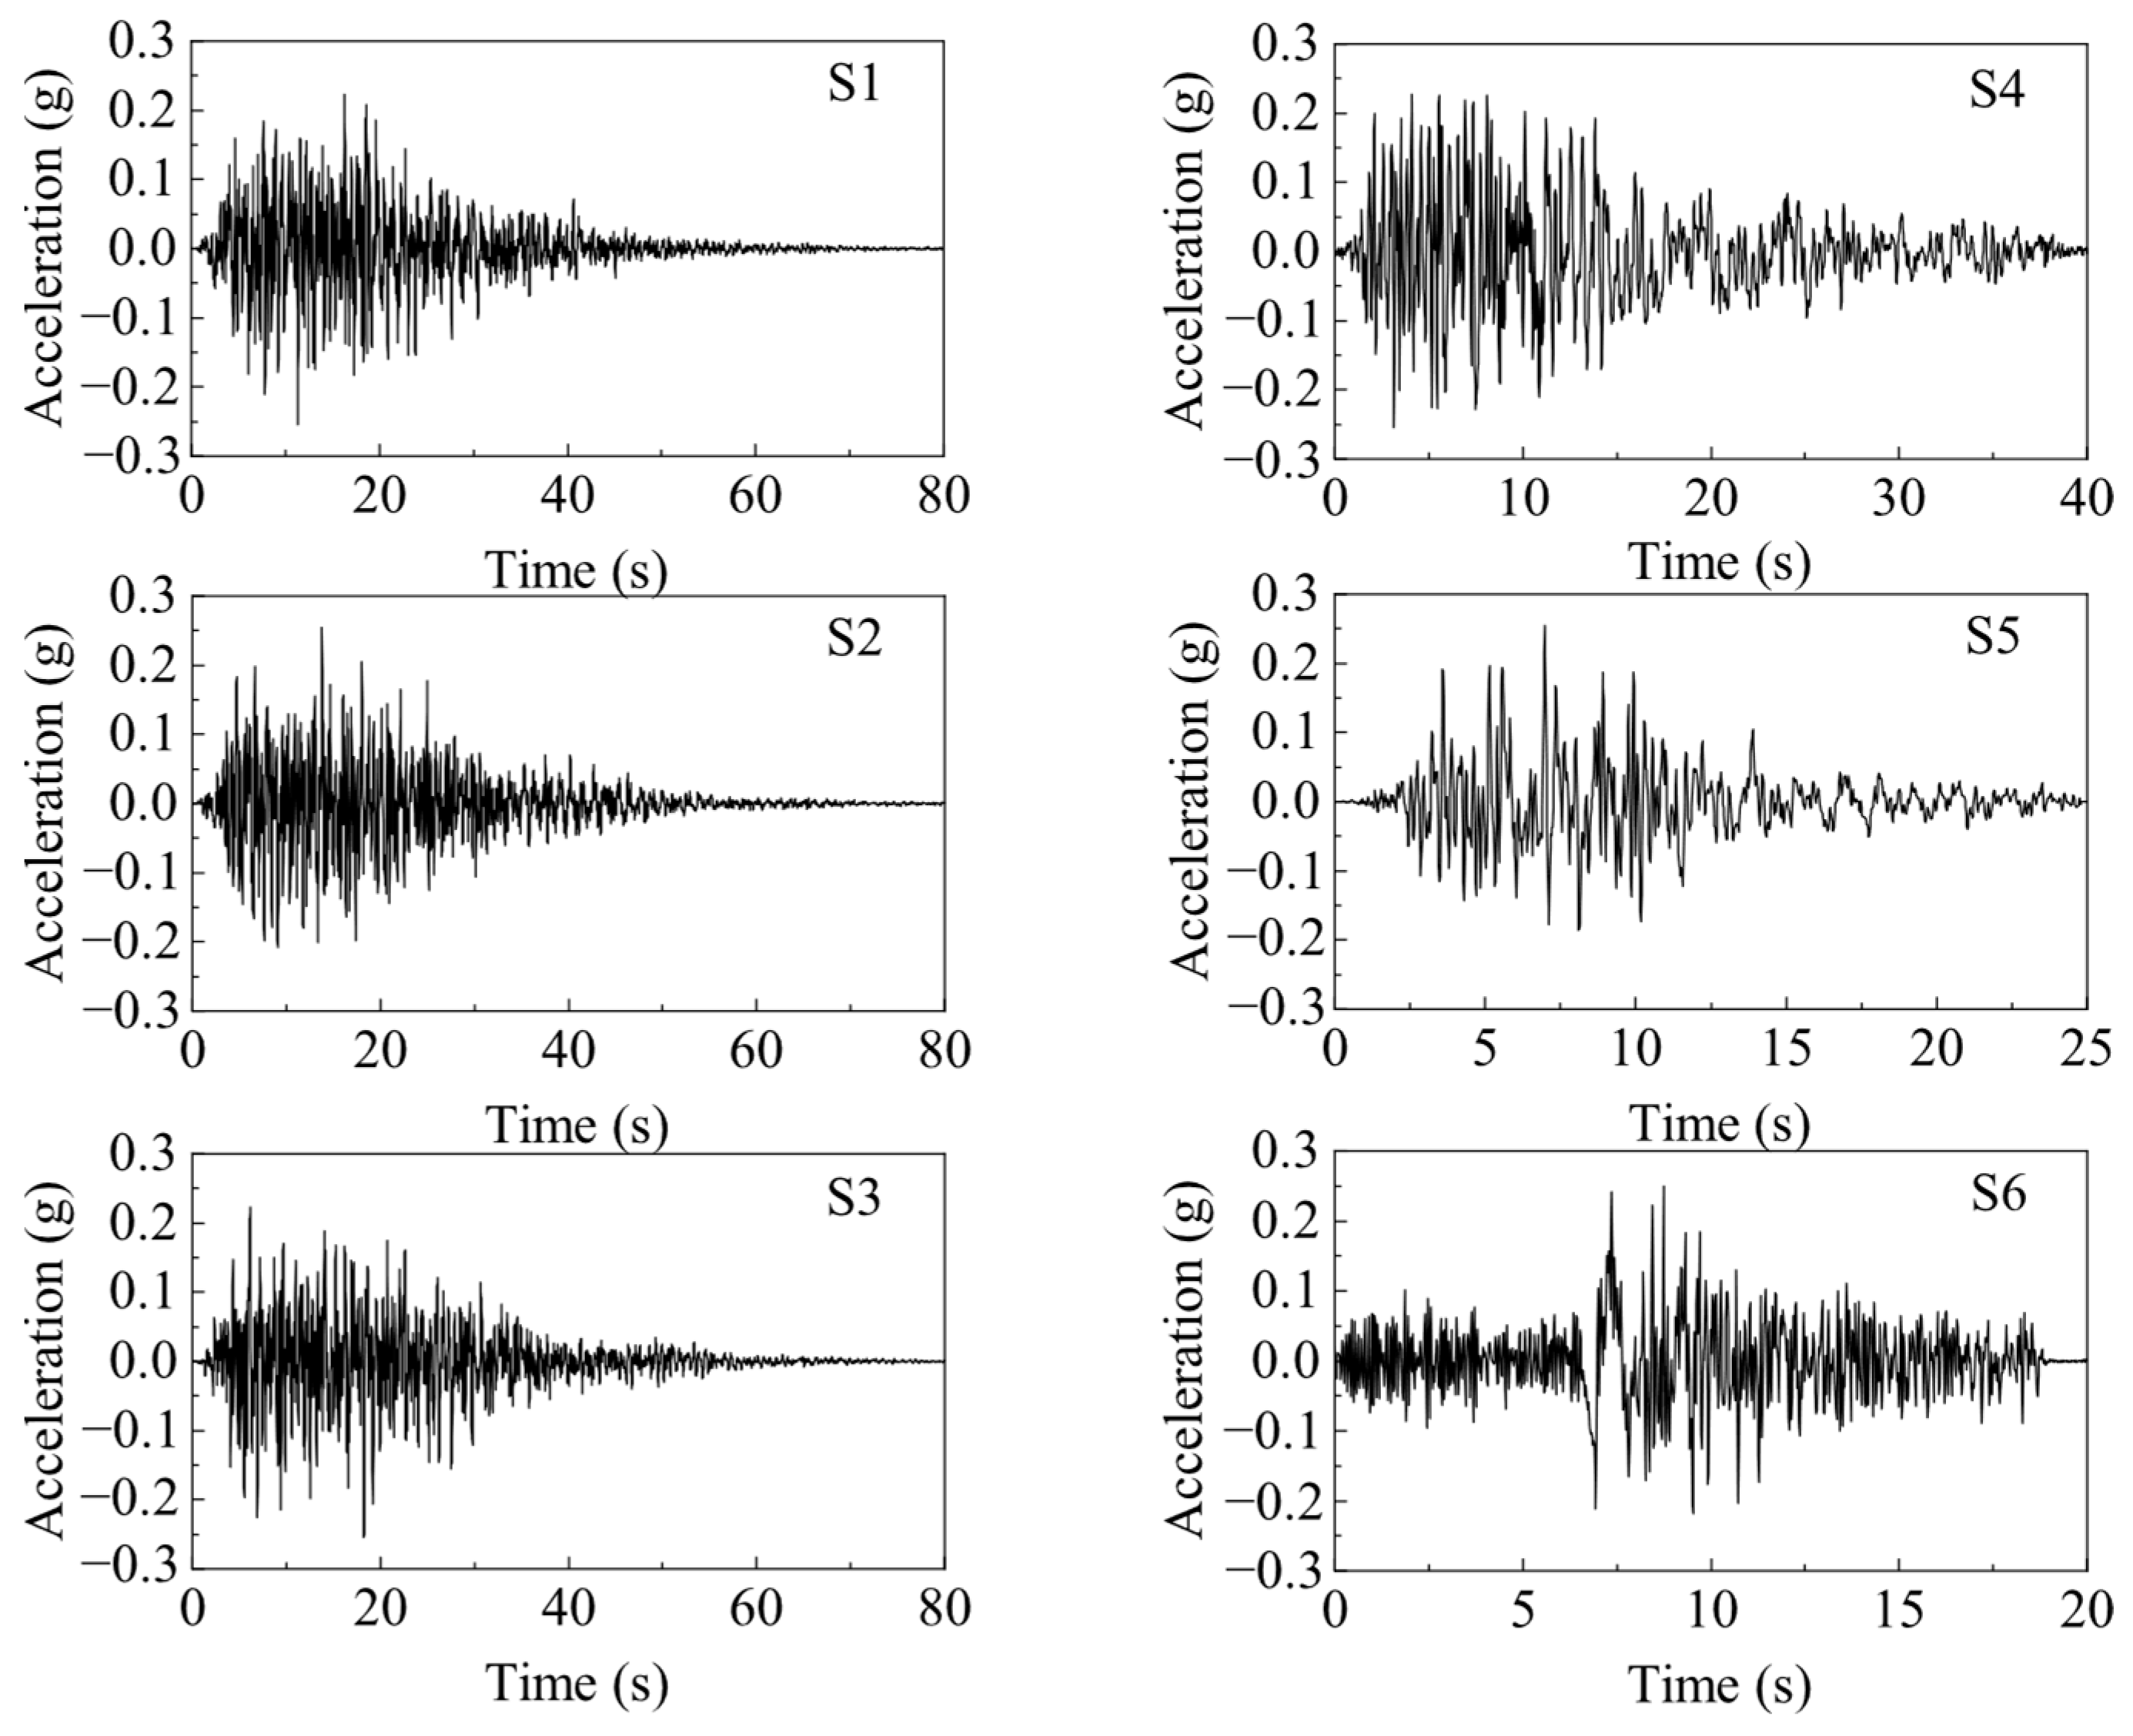
Six seismic waves are adopted in this paper as the vertically incident excitation on the bedrock. Their acceleration time histories and response spectra are shown in Figure 15. Three of them are artificial waves (S1–3), which are provided by the evaluation report of seismic safety for engineering site and have the exceedance probability of 2% in 50 years with the amplitude of 0.25 g. The response spectra of the three artificial waves are similar, but their time histories are different. The other three are real waves (S4–6), of which two are the real waves recorded on the bedrock (S4–5), and the remaining one is the seismic wave on the bedrock obtained by the inversion of the seismic wave recorded on the surface during the Ninghe Earthquake in Tianjin (S6). The acceleration amplitudes of the three real waves are scaled to 0.25 g. In addition, the spectral predominant periods of the six seismic waves are 0.36 s, 0.37 s, 0.37 s, 0.21 s, 0.16 s, and 0.11 s, respectively.
Table 3 lists the first 10 natural vibration periods and modal properties of the two models. Considering that the property of mode 1 is the y-direction translation, the six seismic waves are excited along the horizontal y-direction in this paper. In addition, as can be seen from Table 3, the natural vibration periods of the S–P–BCTS model are obviously more extended than those of the BCTS model. From mode 1 to mode 6, the modal properties of the two models are the same. However, from mode 7 to mode 10, they are no longer the same; the modal properties of the BCTS model are still translation or torsion, but the vertical vibration has appeared in the S–P–BCTS model. From the simple modal analysis, it has been found that there are significant differences between the two models.

4.1. Top-Storey Acceleration

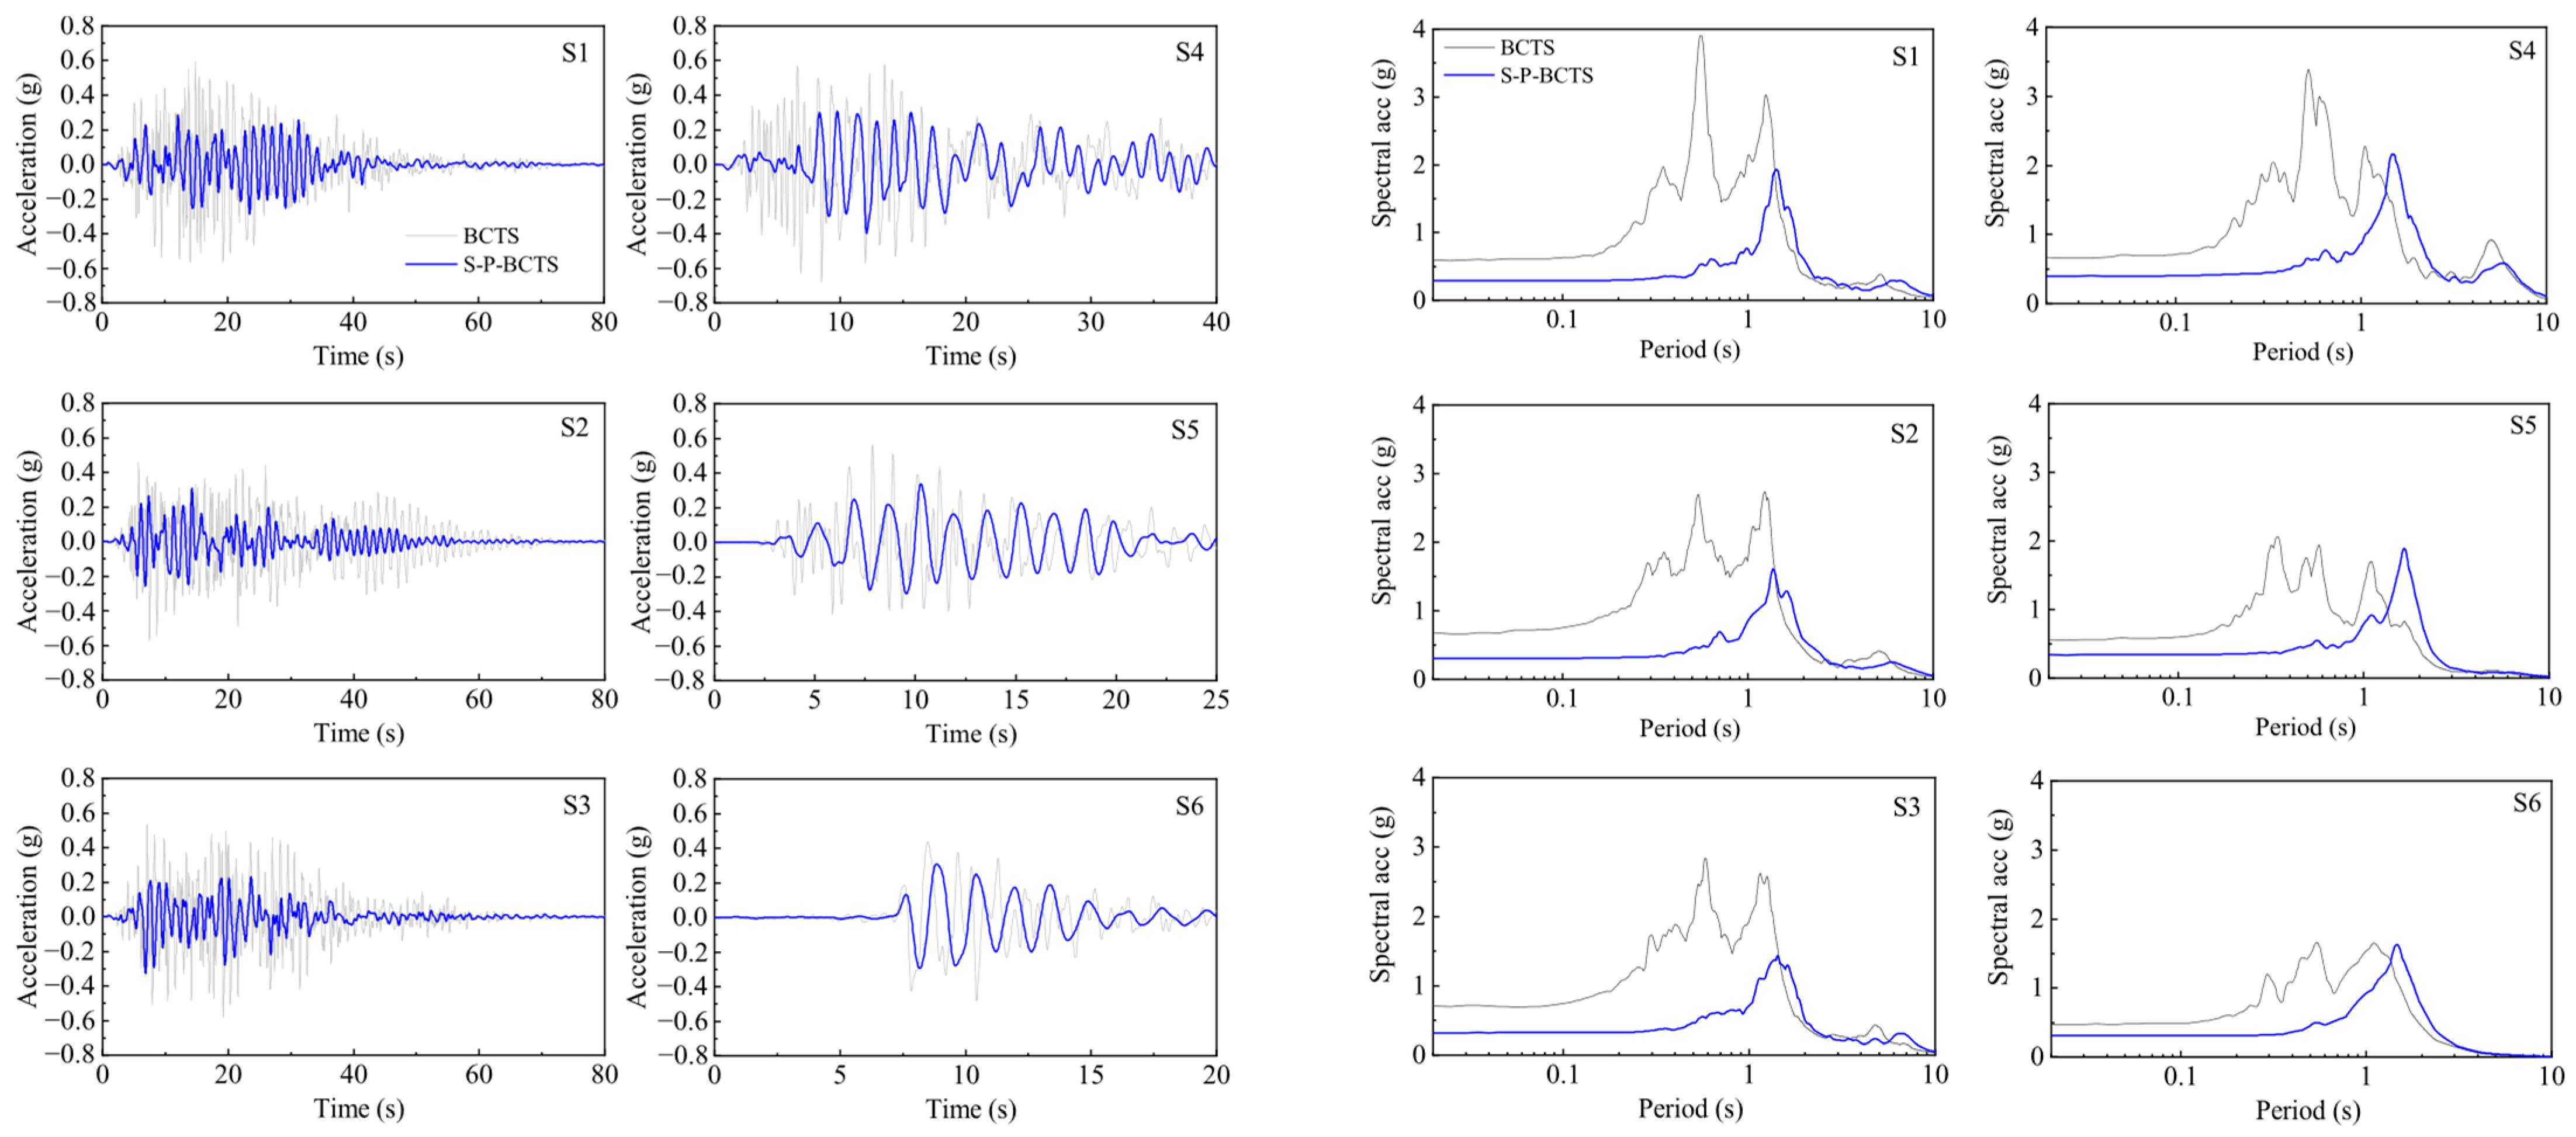
Figure 16 shows the time histories and response spectra of the top-storey accelerations obtained from BCTS and S–P–BCTS models. Clearly, the top-storey accelerations of the two models differ greatly. In terms of time history, the peak accelerations of the S–P–BCTS model are significantly smaller than those of the BCTS model. In terms of response spectrum, compared with the BCTS model, the short-period components of the S–P–BCTS model are obviously reduced, which is related to the dynamic characteristic of the model itself. Because the natural vibration periods of the S–P–BCTS model are more extended than those of the BCTS model, a lot of short-period components will inevitably be filtered out. In addition, compared with the BCTS model, the predominant periods of the response spectra of the S–P–BCTS model are obviously prolonged, and the peak values of the response spectra tend to decrease.

4.2. Lateral Displacement

Figure 17 gives the lateral displacements of each storey obtained from BCTS and S–P–BCTS models. The lateral displacements of each storey here refer to the peak lateral displacements of each storey relative to the base of the above-ground part during the period of seismic excitation. The spatial distribution trends of the lateral displacements in the two models are basically the same: the lateral displacements increase storey by storey beginning from the first storey, and reaching the maximum on the top storey. However, it is noteworthy that the lateral displacements of the S–P–BCTS model are significantly larger than those of the BCTS model. When S1–6 is incident respectively, the lateral displacements of the top storey of the S–P–BCTS model can reach 1.79, 1.49, 1.34, 1.16, 1.39, and 1.43 times of those of the BCTS model, respectively.
Table 4 lists the maximum rocking angles of the base at the instant of the peak lateral displacements of the top storey. The base of the BCTS model has no rocking, while that of the S–P–BCTS model has obvious rocking. Rocking plays an important role in the lateral deformation of the above-ground structure [15], and it is the main reason for the lateral displacements of the S–P–BCTS model being larger than those of the BCTS model. This is because, in the S–P–BCTS model, the lateral displacements include not only the lateral displacement components caused by the deformation of the structure itself, but also the lateral displacement components caused by the overall rocking of the structure.

4.3. Inter-Storey Drift

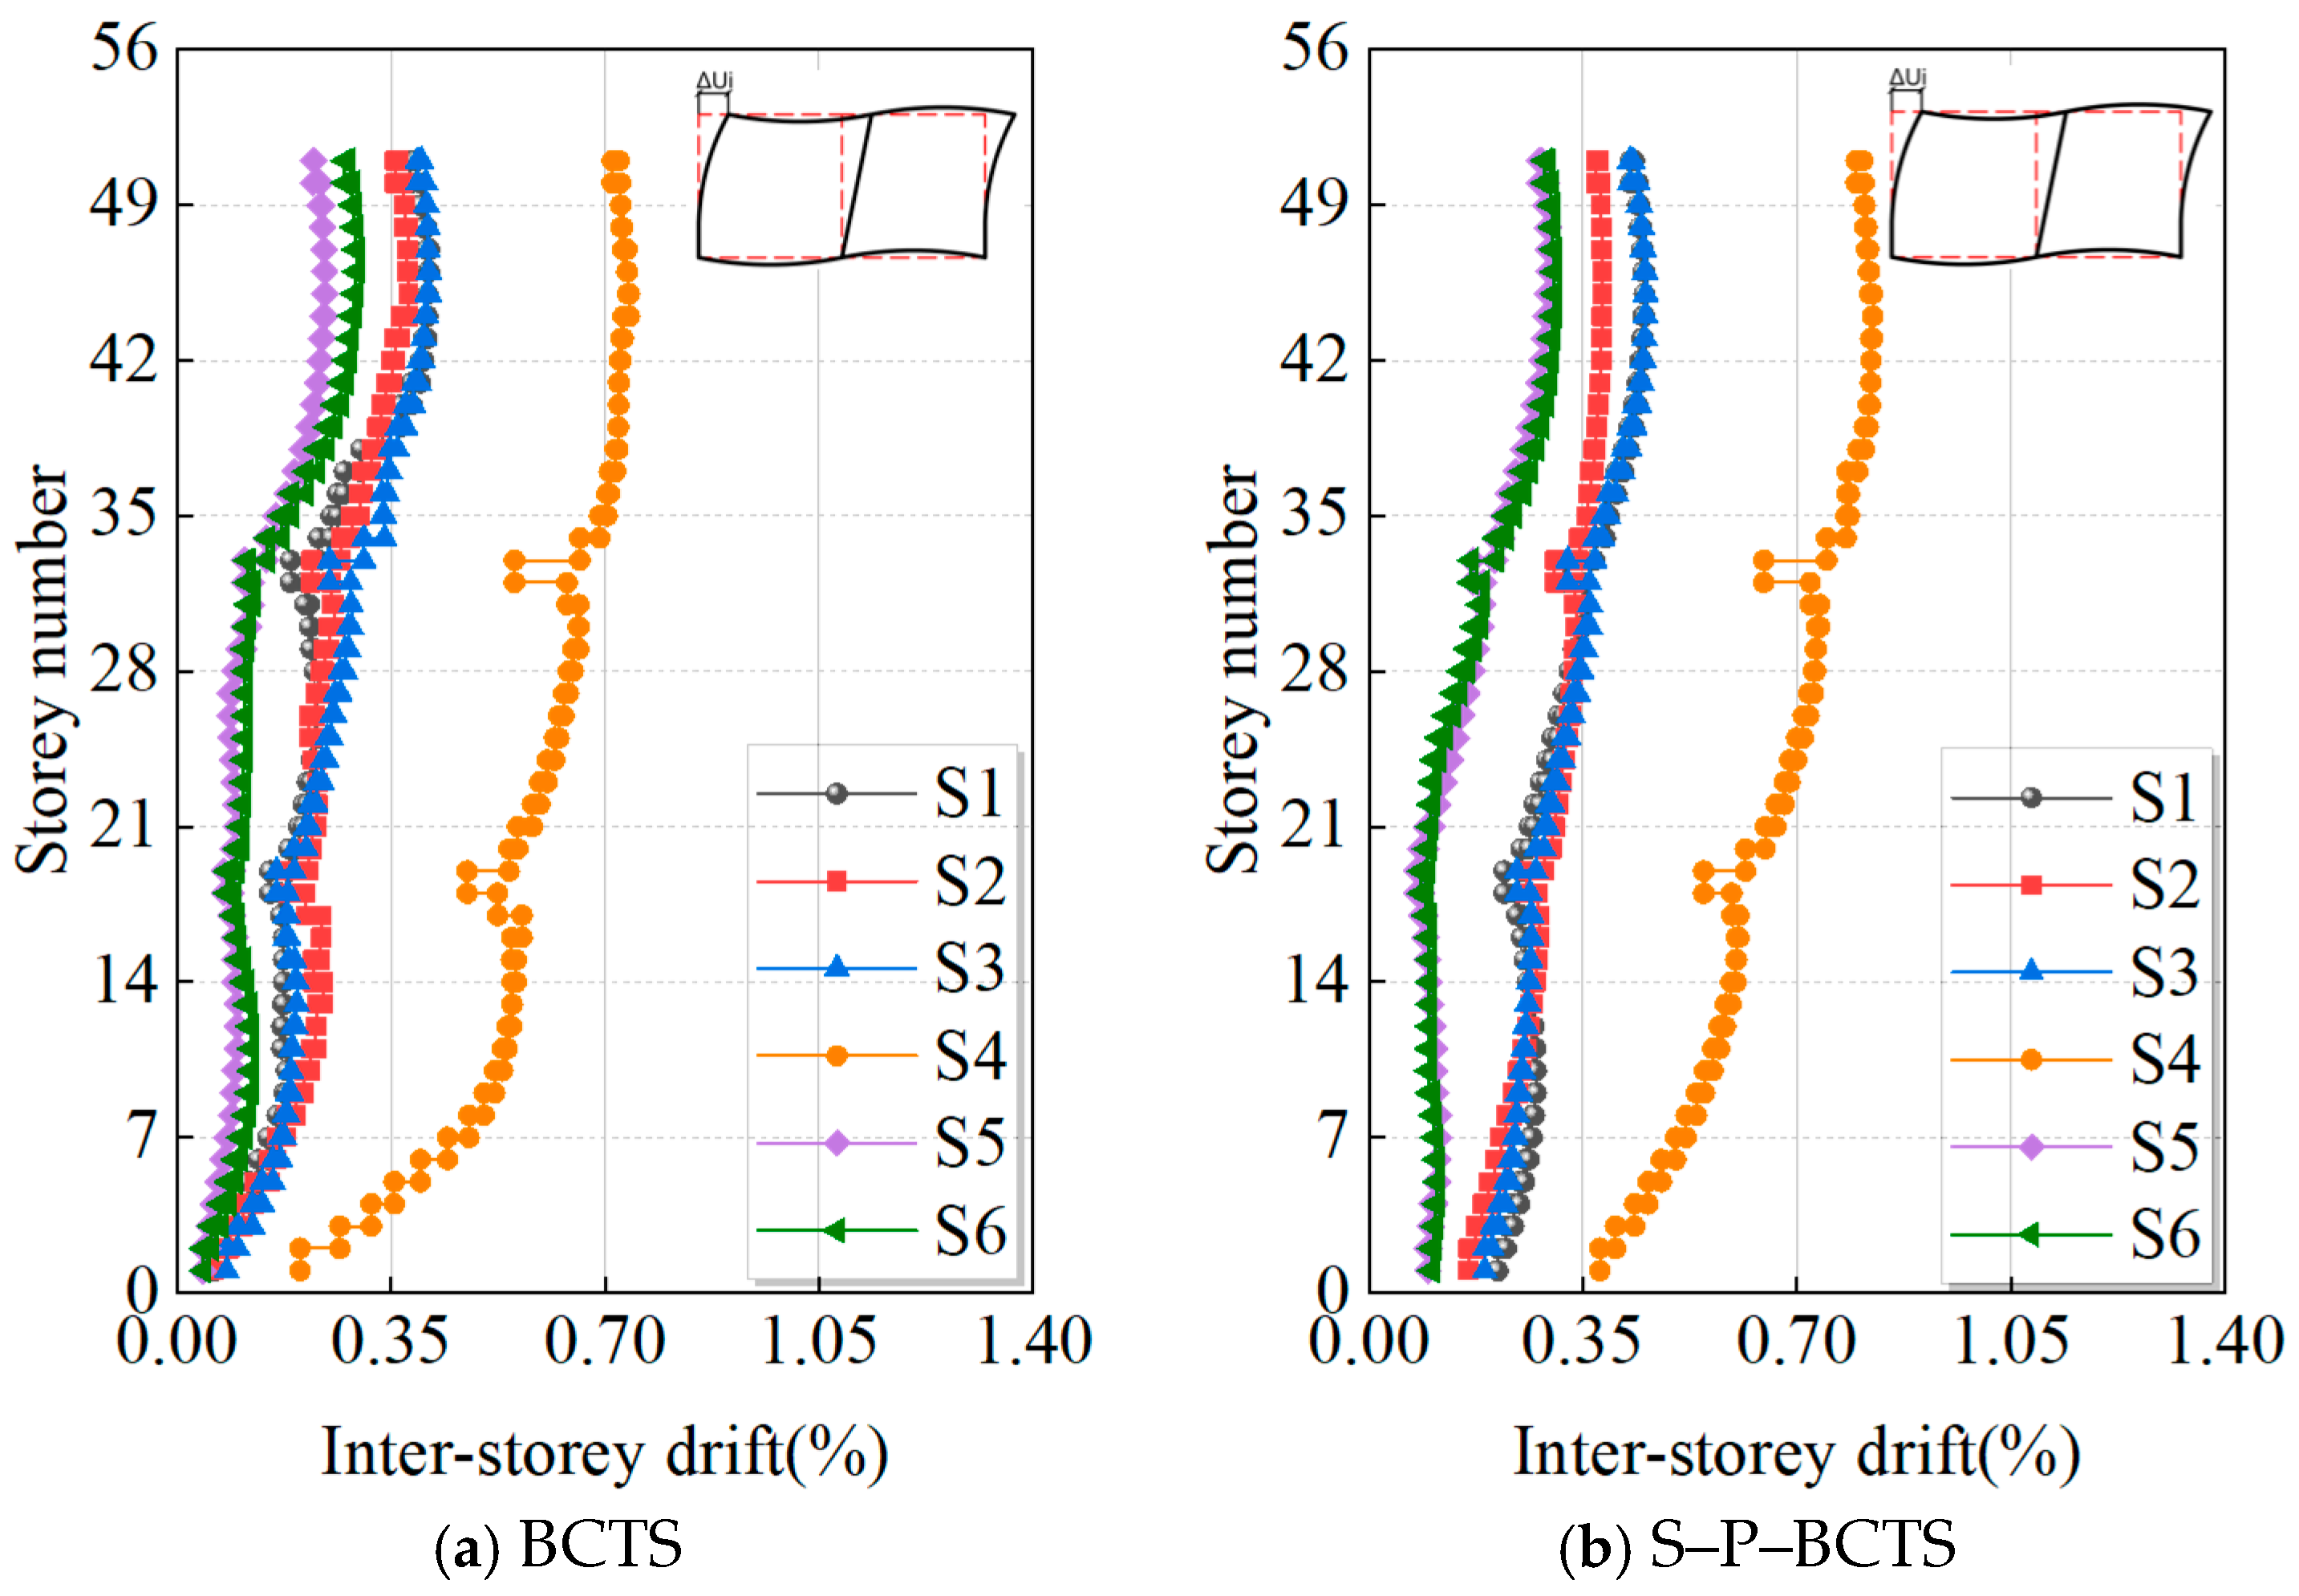
Figure 18 shows the inter-storey drifts of each storey obtained from BCTS and S–P–BCTS models. The inter-storey drifts of each storey here refer to the peak inter-storey drifts of each storey during the period of seismic excitation. Table 5 summarizes the maximum inter-storey drifts and the corresponding storey numbers. It can be seen from Figure 18 that the spatial distribution trends of the inter-storey drifts in the S–P–BCTS model are basically the same as those in the BCTS model: the inter-storey drifts of the lower storeys are smaller, those of the upper storeys are larger, and those of the storeys with outriggers decrease significantly. However, it should be noted that, on the whole, the inter-storey drifts of the S–P–BCTS model are obviously larger than those of the BCTS model. Furthermore, the storey numbers corresponding to the maximum inter-storey drifts in the S–P–BCTS model are different from those in the BCTS model, as shown in Table 5. When S1–6 are incidents, respectively, the maximum inter-storey drifts of the S–P–BCTS model can reach 1.09, 1.01, 1.10, 1.12, 1.22, and 1.04 times of those of the BCTS model, respectively. The reason for this amplification effect is that the whole system becomes more flexible, and the deformation increases after considering the dynamic soil–pile–BCTS interaction.

4.4. Member Damage and Stress

Among the six seismic waves adopted in this paper, the damage to structural members is the most serious when S4 is incident, followed by S1–3, and the damage is relatively weak when S5 and S6 are incident. In the following sections, the damage and stresses of structure members obtained from BCTS and S–P–BCTS models subjected to S1 and S4 are listed in detail, and the differences between the two models are analyzed.

4.4.1. Core Wall Damage

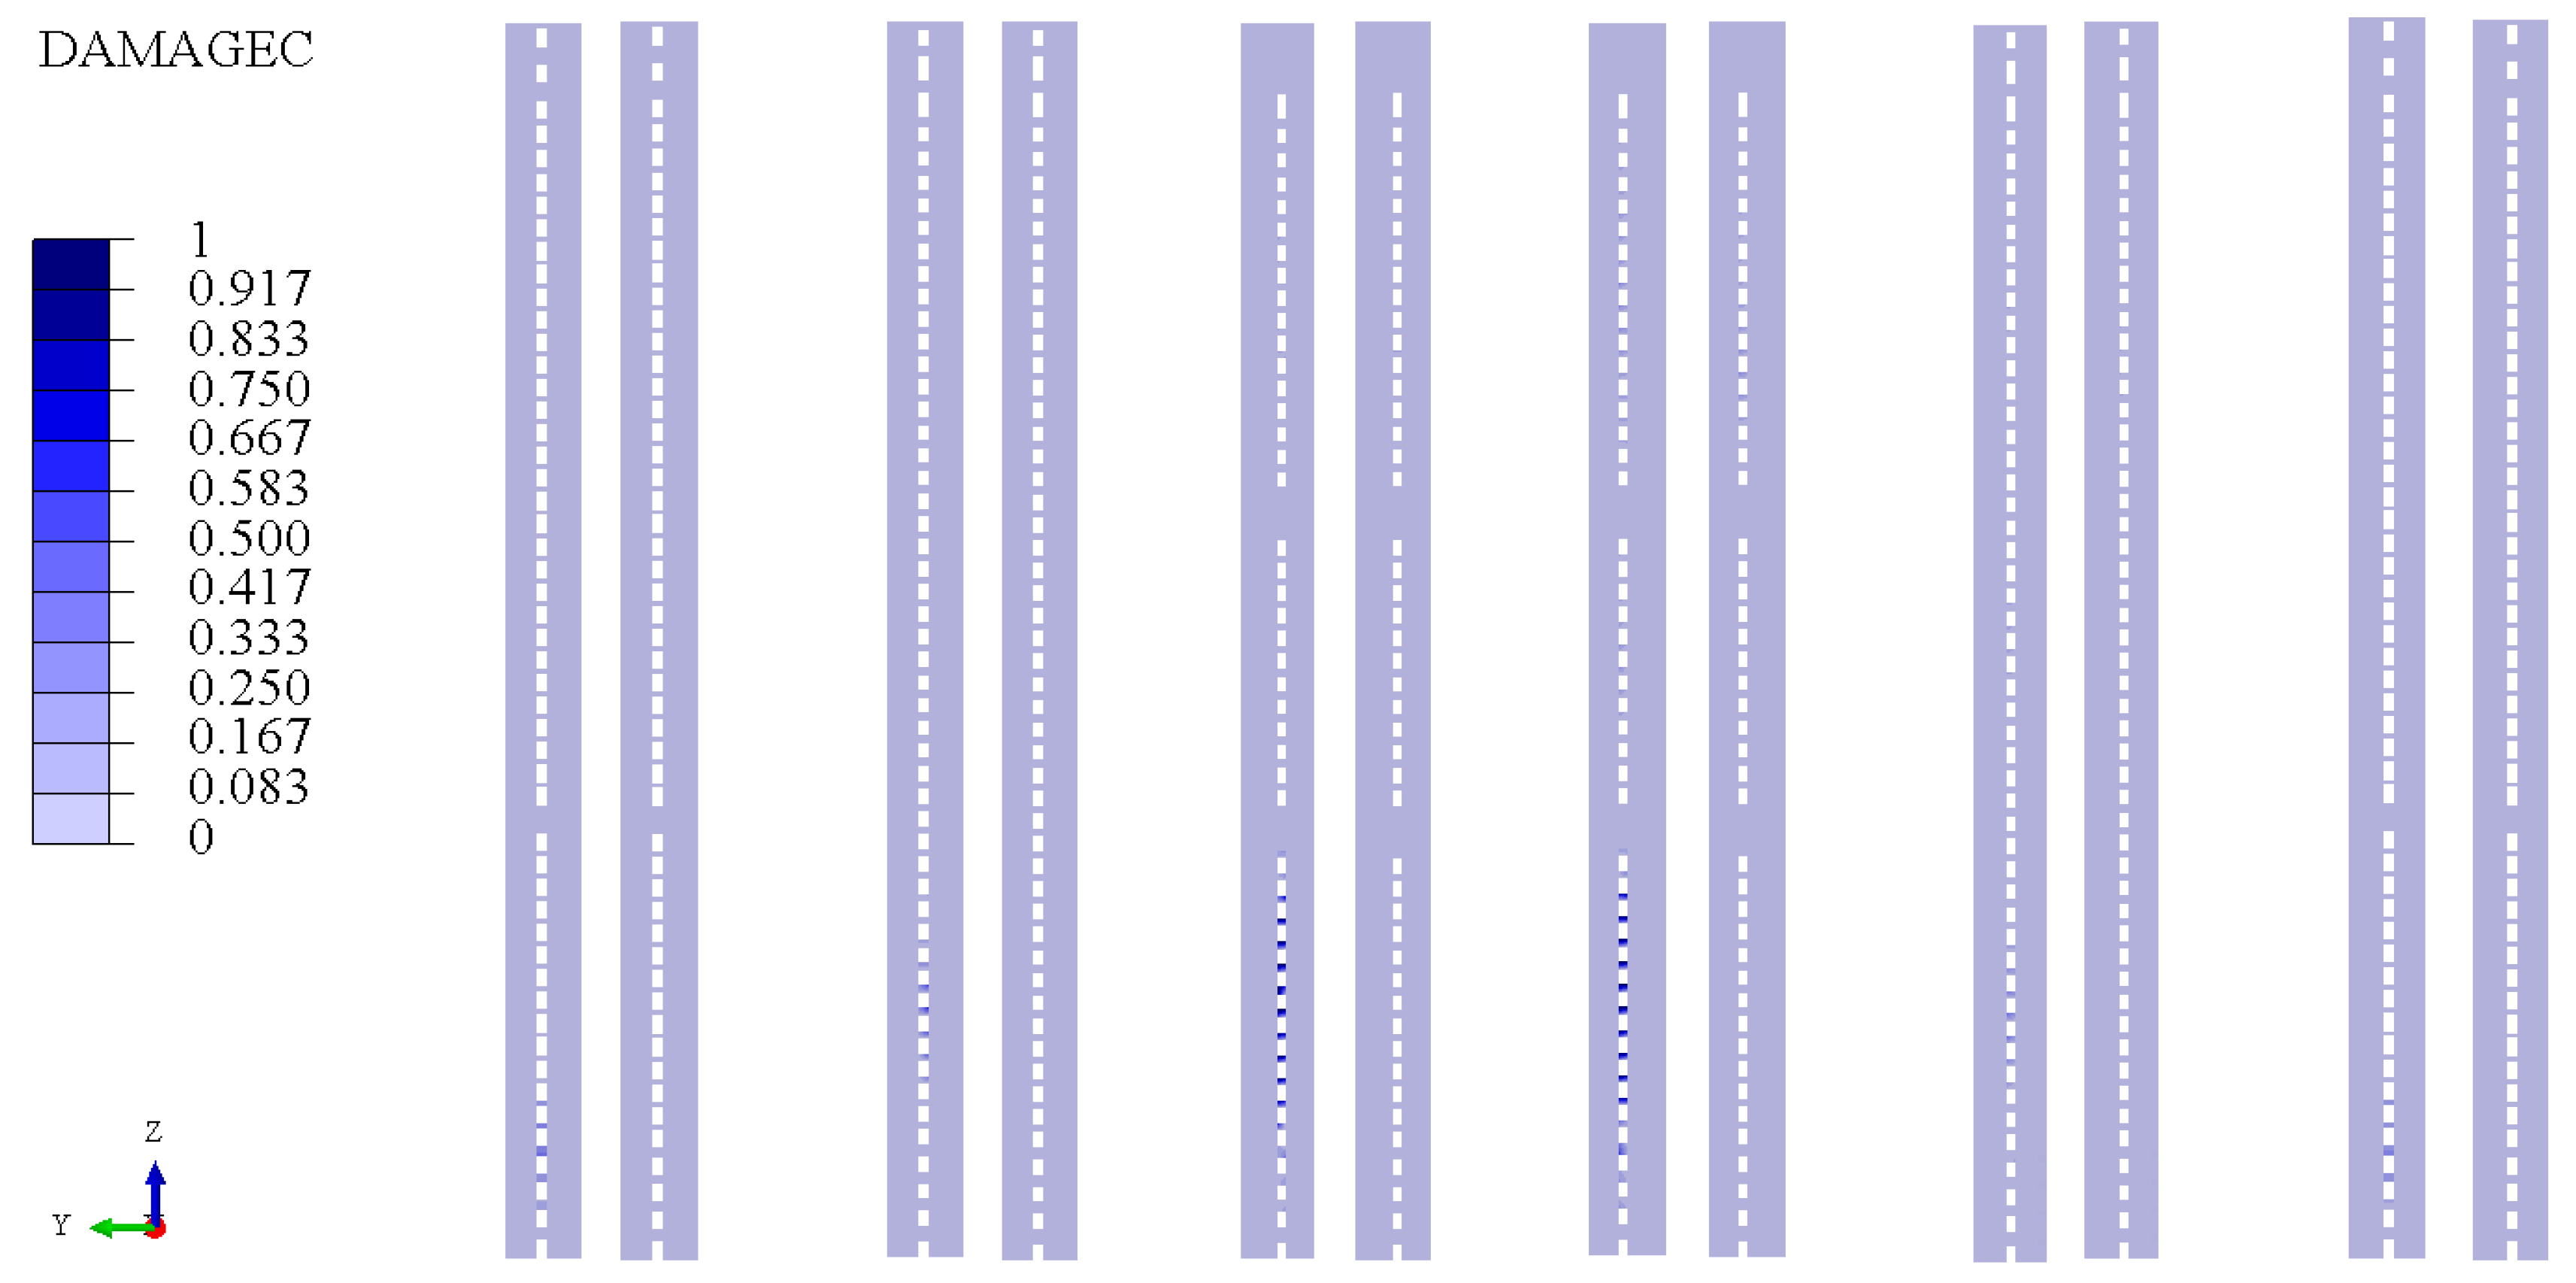
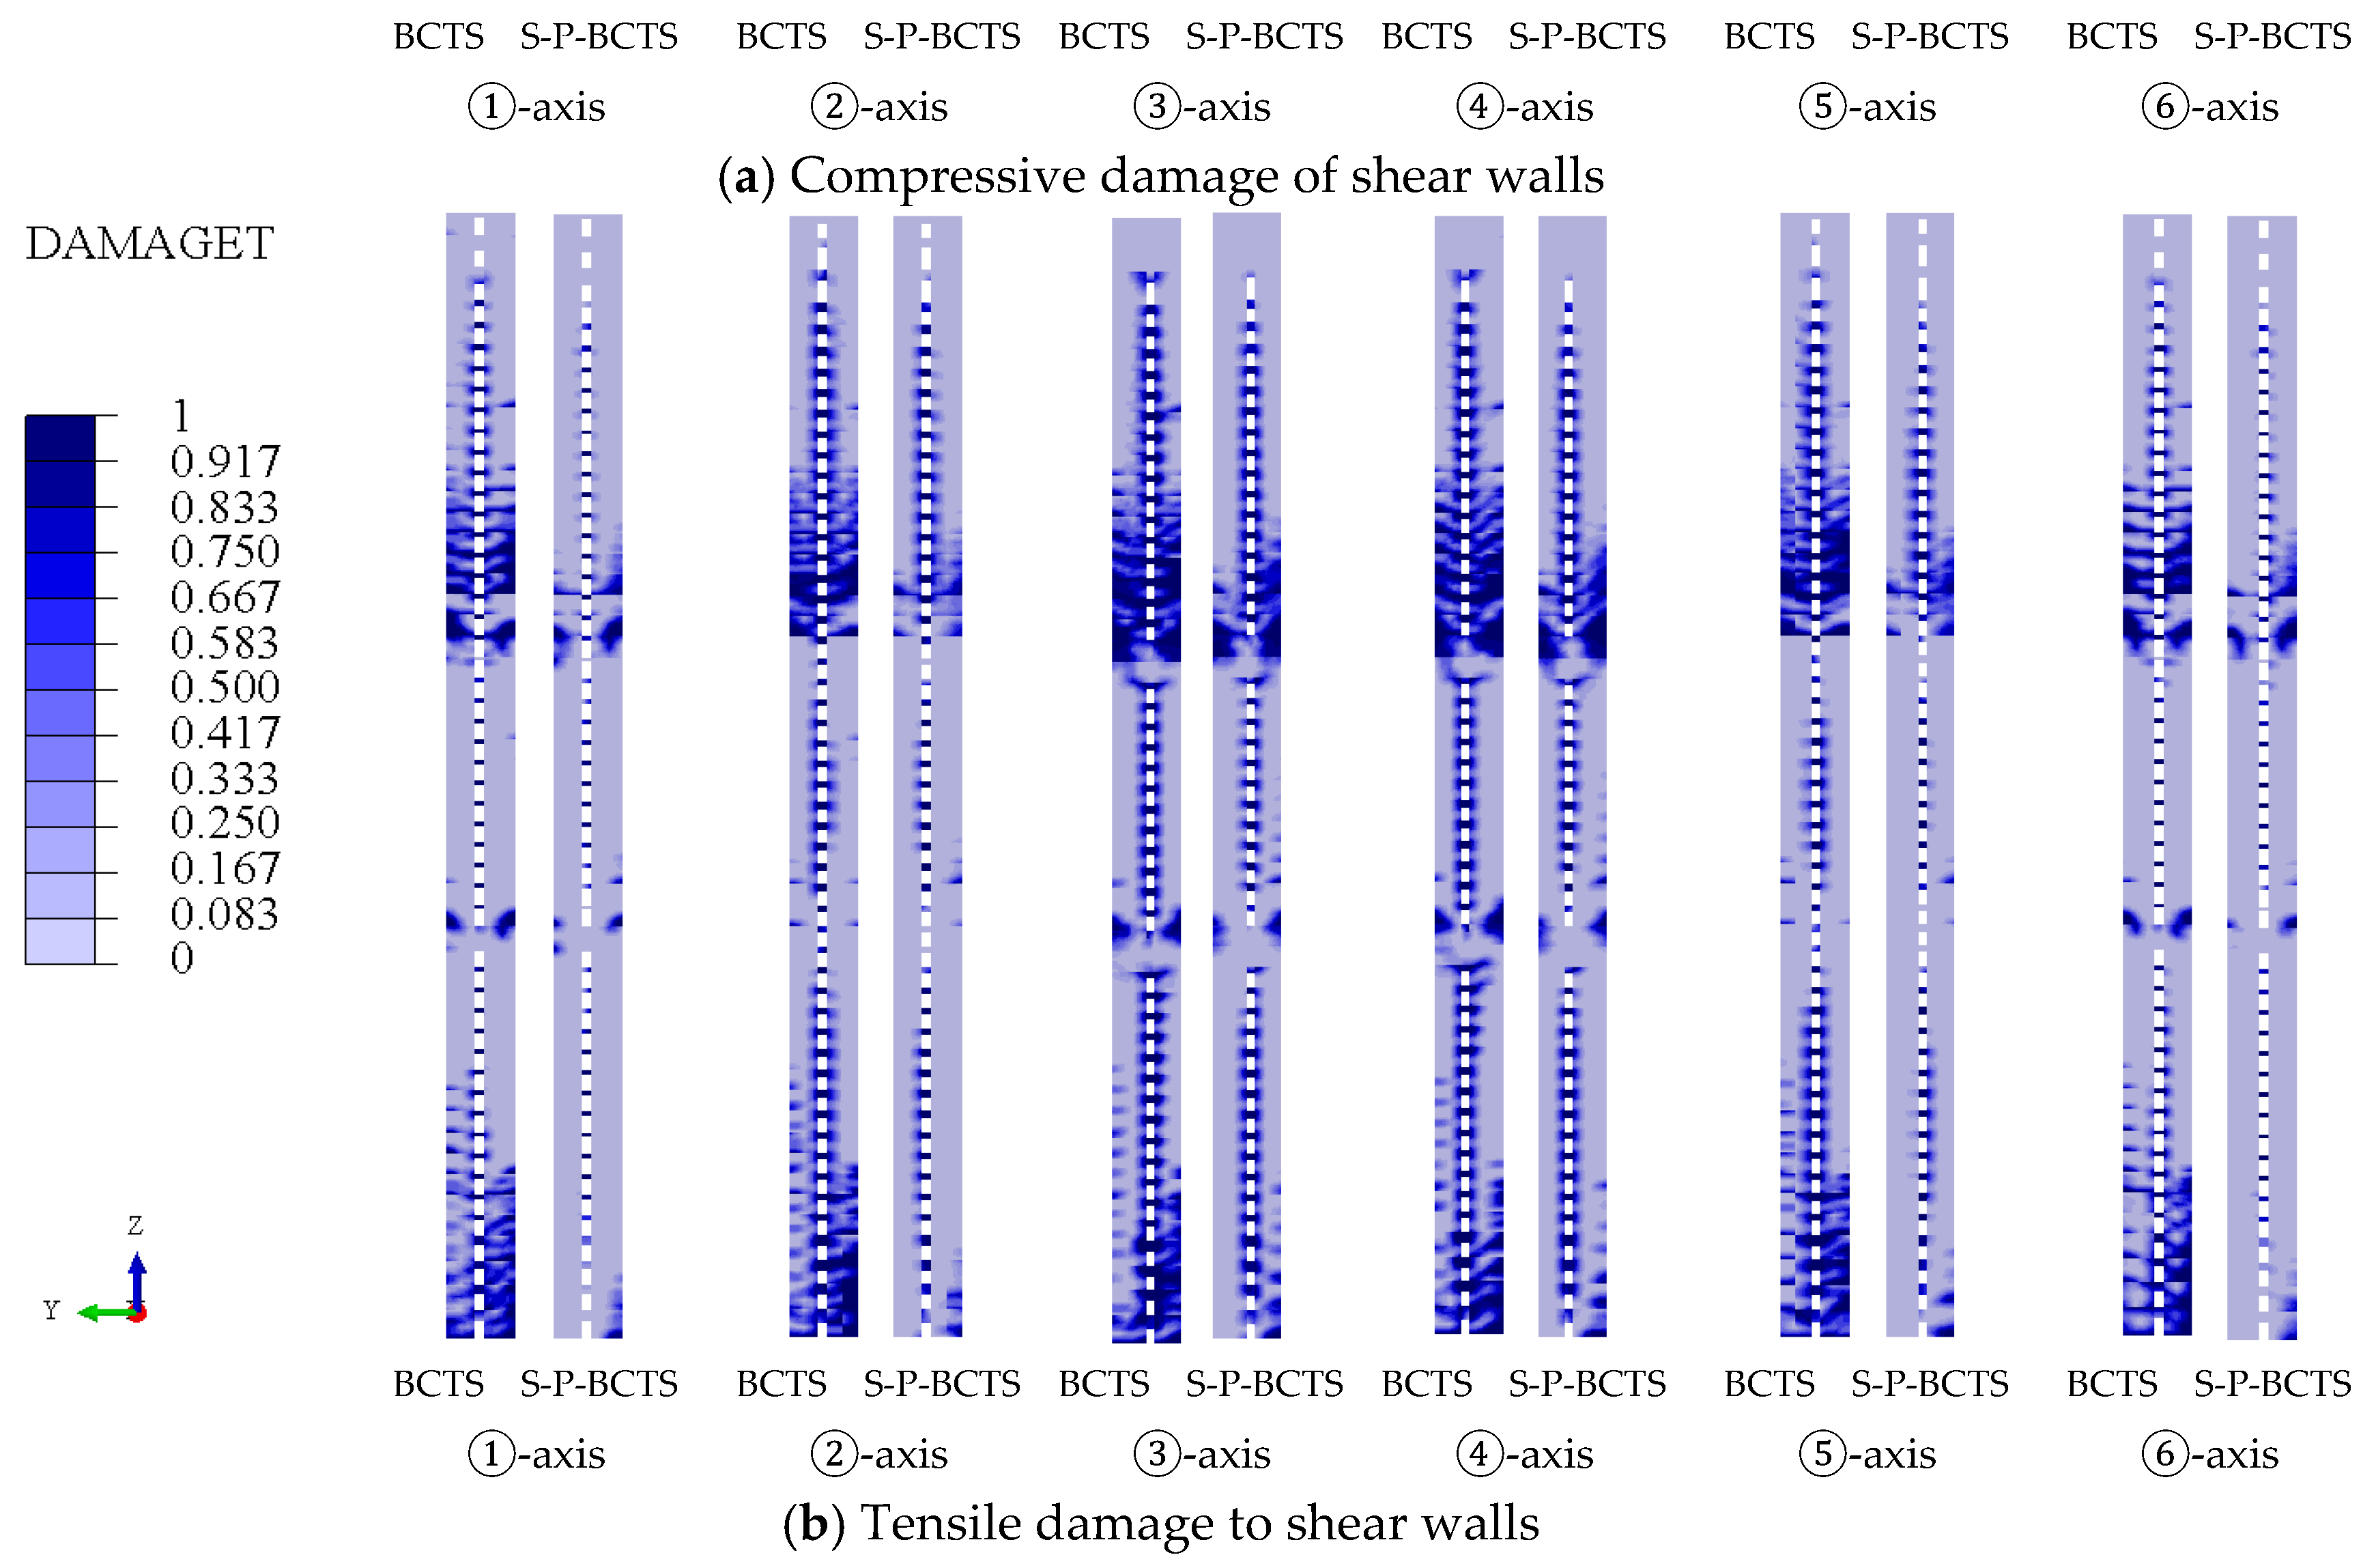
Figure 19 compares the damage of shear walls on ①–⑥ axes obtained from the two models when S1 is incident, and Figure 20 compares the results when S4 is incident. The damage here refers to the final damage at the instant of the end of seismic excitation. The numbers of shear walls are shown in Figure 4. Moreover, it is worth noting that the damage factor is a value between 0 and 1. A damage factor of 0 indicates no damage in the structure, while a value of 1 represents complete failure. For values between 0 and 1, damage is generally considered negligible when the damage factor is less than 0.1; minor when the damage factor is between 0.1 and 0.3; moderate when it ranges from 0.3 to 0.7; and severe when it is between 0.7 and 1.
It can be seen from Figure 19a and Figure 20a that, for the wall-limbs, no compressive damage is found in the S–P–BCTS model, which is consistent with that in the BCTS model. But for the coupling wall-beams, the results of the two models are no longer consistent. In the BCTS model, some coupling wall-beams on the lower storeys present the obvious compressive damage, especially for those of the ③- and ④-axis shear walls, while in the S–P–BCTS model, almost no coupling wall-beam presents the compressive damage.
It can be seen from Figure 19b and Figure 20b that, in the S–P–BCTS model, the coupling wall-beams exhibit the tensile damage in an extensive area, while the wall-limbs exhibit the tensile damage in a limited area. When S1 is in the incident, the tensile damage of wall-limbs mainly concentrates near the upper storey with outriggers. When S4 is incident, the tensile damage of wall-limbs mainly concentrates near the base and near the upper and lower storeys with outriggers. These phenomena are like those in the BCTS model. But it can also be seen that, compared with the results in the BCTS model, the areas of tensile damage in the S–P–BCTS model are significantly reduced, and the tensile damage at the same location is substantially weakened.

4.4.2. Frame Column Stress

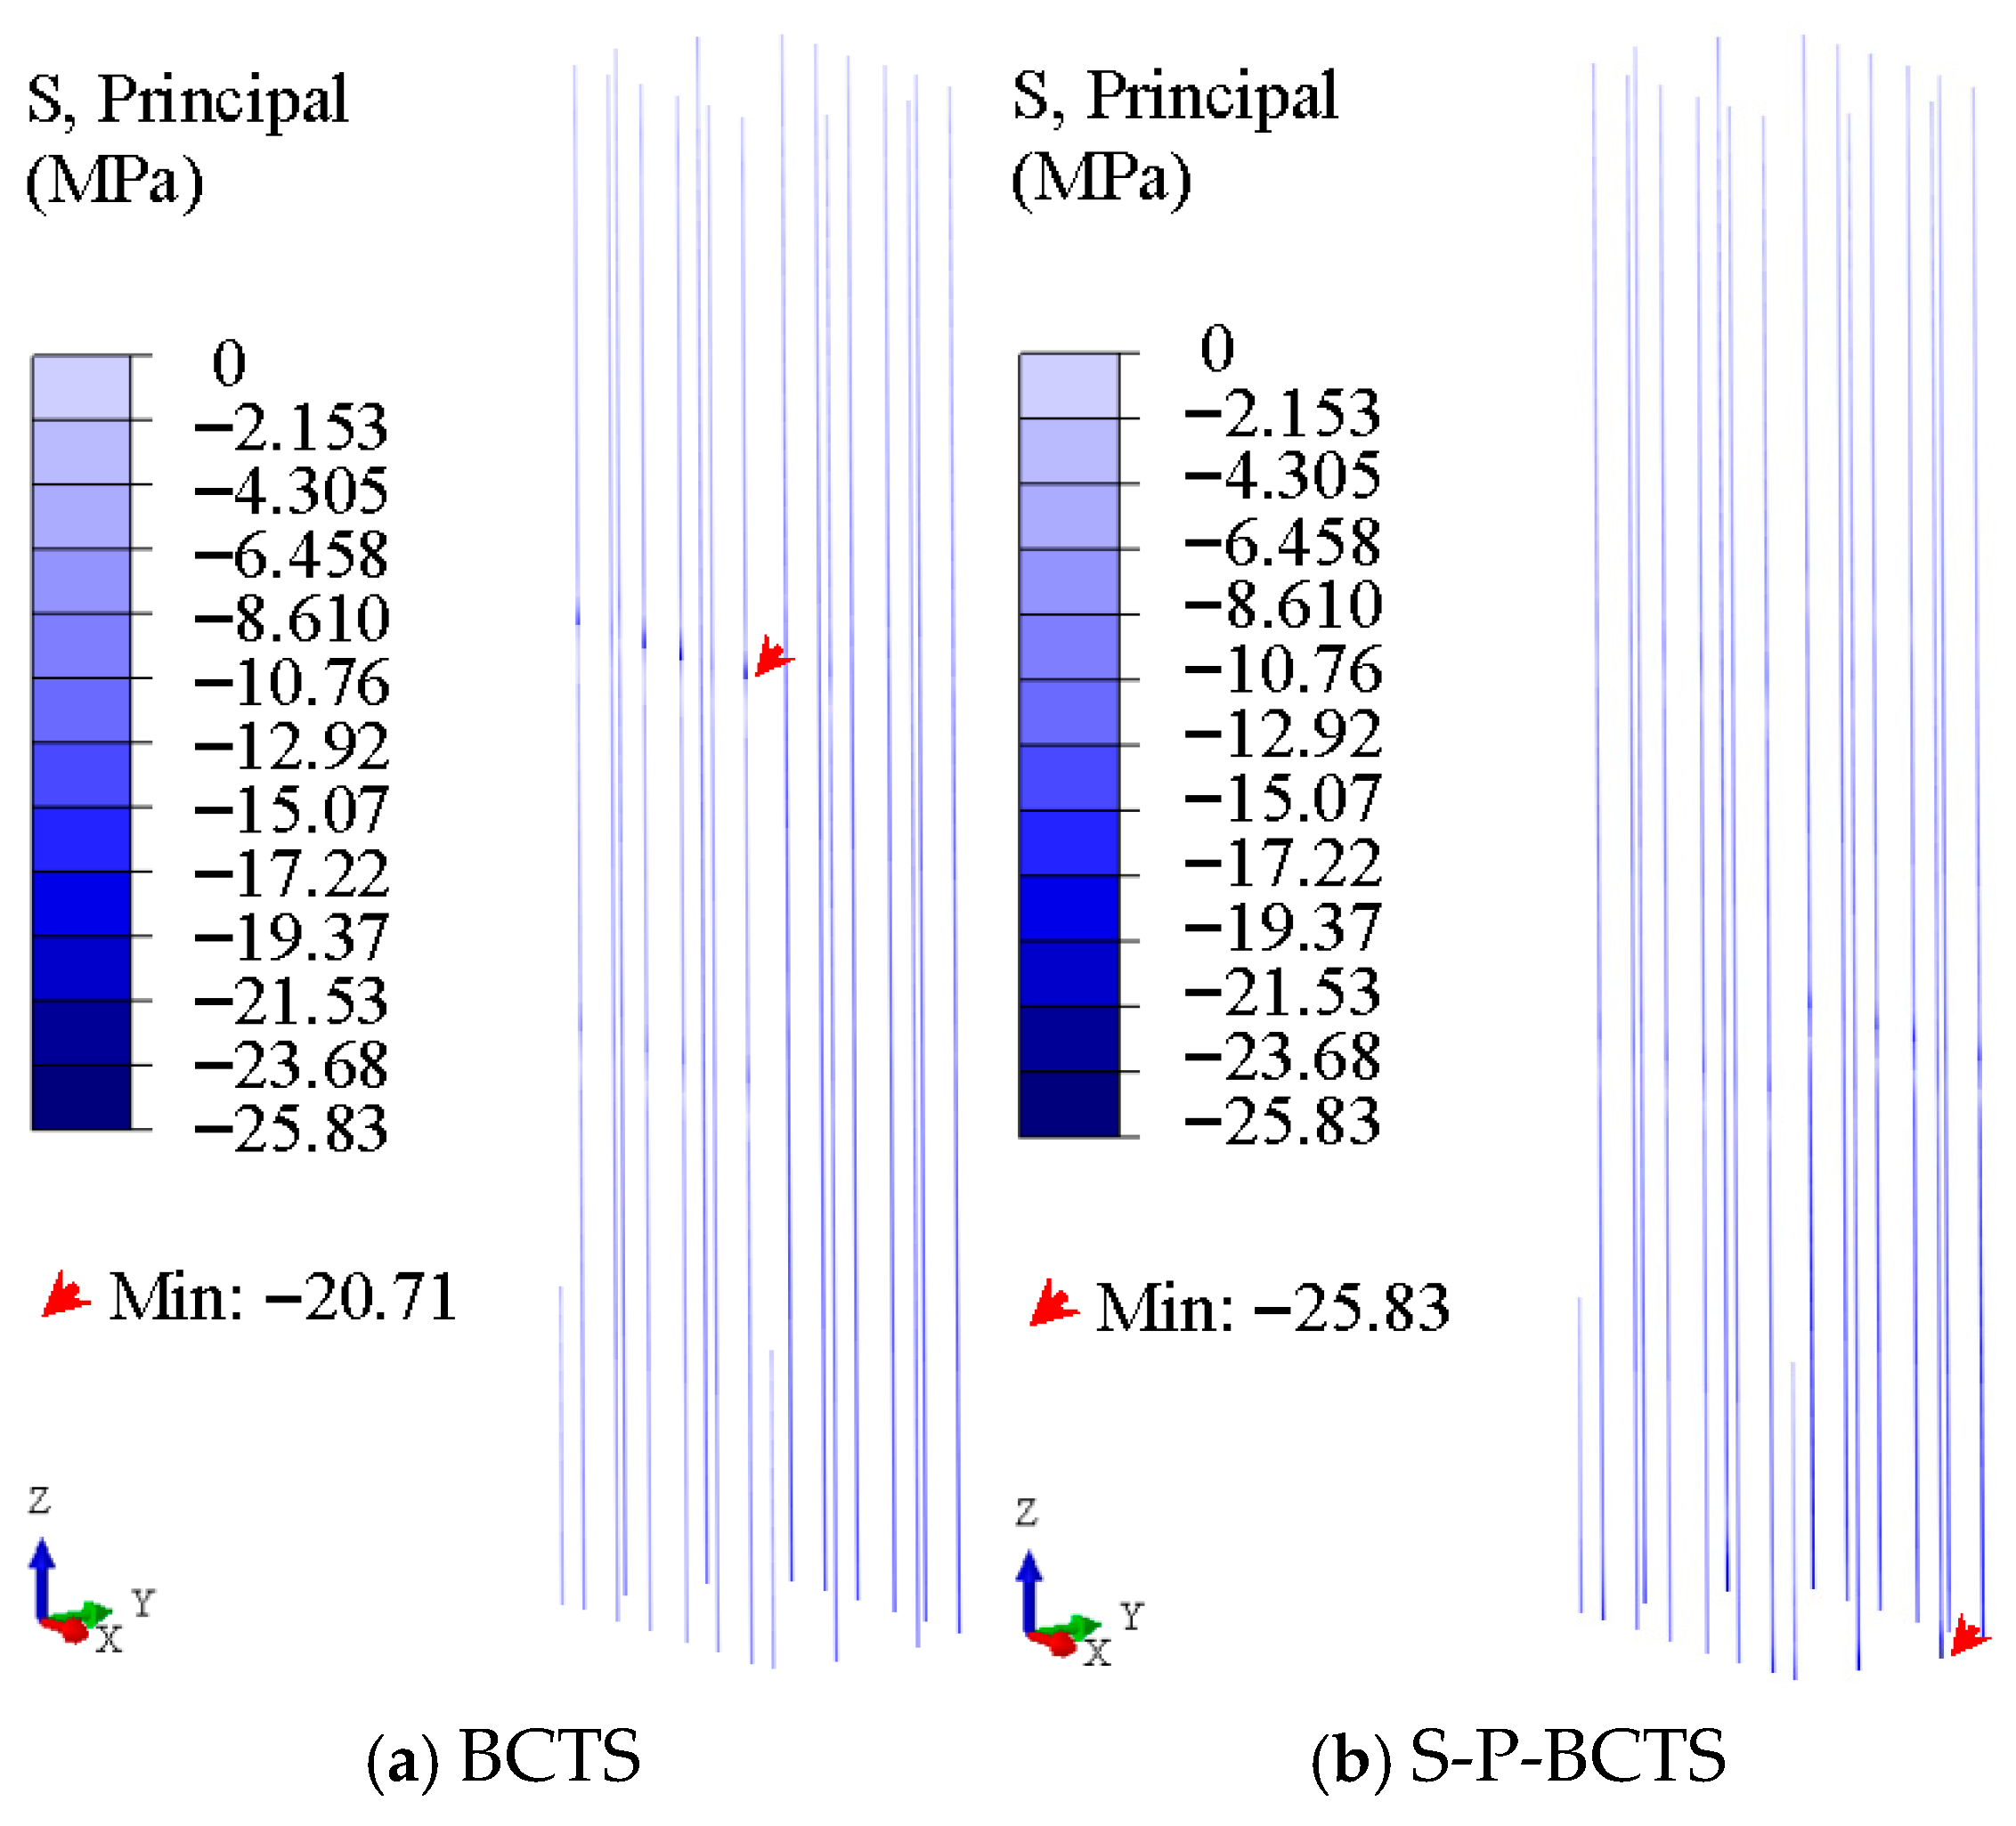
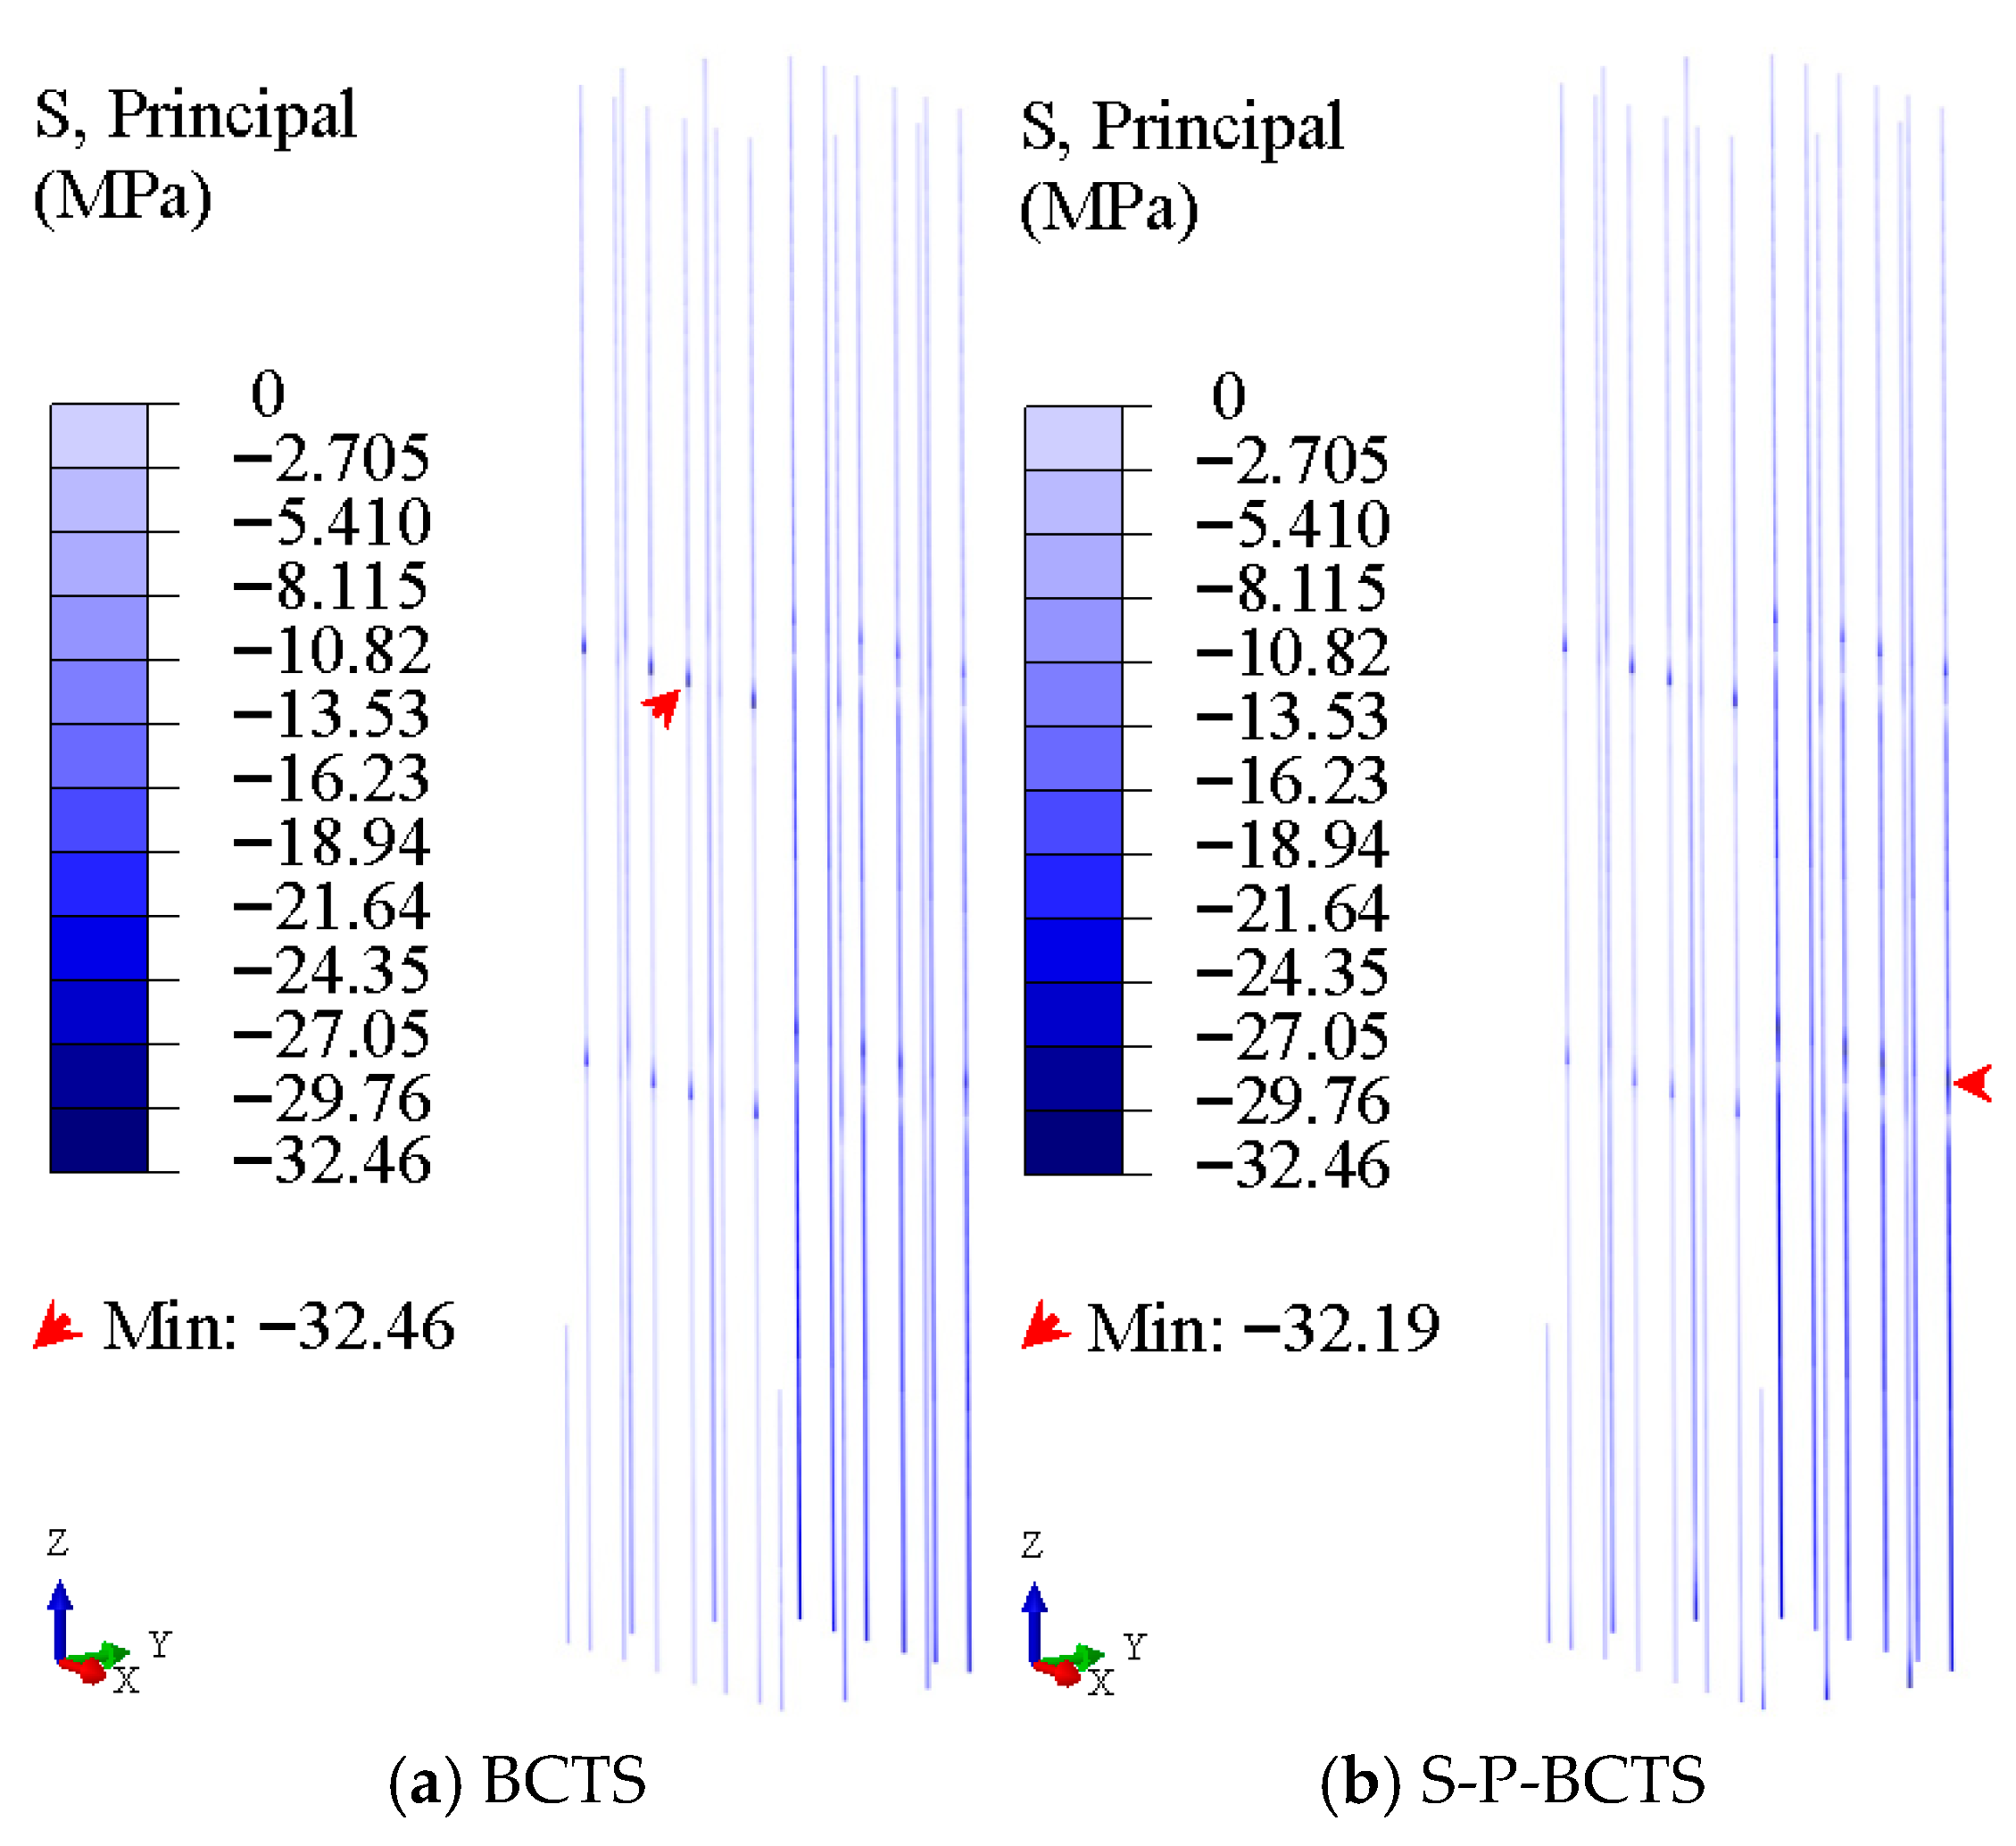
Figure 21 and Figure 22 give the principal compressive stresses of frame columns in the two models when S1 and S4 are incident, respectively. The principal compressive stresses of frame columns here refer to the principal compressive stresses of frame columns at the instant of the maximum principal compressive stress of frame columns during the period of seismic excitation. One can see that, overall, the principal compressive stresses of the upper storeys are smaller, while those of the lower storeys are larger, and the principal compressive stresses increase abruptly on the storeys with outriggers. These spatial distribution characteristics can be observed in both BCTS and S–P–BCTS models. However, there are also the following differences between the results of the two models:
When S1 is incident, in the BCTS model, the principal compressive stress increases remarkably on the upper storey with outriggers and weakly on the lower storey with outriggers. The maximum principal compressive stress appears at the upper storey with outriggers, and its value is 20.71 MPa. However, in the S–P–BCTS model, the principal compressive stresses increase weakly on both upper and lower storeys with outriggers. The maximum principal compressive stress appears at the foot of the frame column, and its value is 25.83 MPa, which is larger than that of the BCTS model. This amplification phenomenon indicates that the dynamic soil–pile–BCTS interaction is detrimental to the foot of the frame column, which is consistent with the conclusion in Section 4.4.
When S4 is incident, the principal compressive stresses of the two models increase remarkably on both upper and lower storeys with outriggers. In the BCTS model, the maximum principal compressive stress appears at the upper storey with outriggers, and its value is 32.46 MPa. However, in the S–P–BCTS model, the maximum appears at the lower storey with outriggers, and its value is 31.29 MPa, which is slightly smaller than that of the BCTS model.

4.4.3. Frame Beam Stress

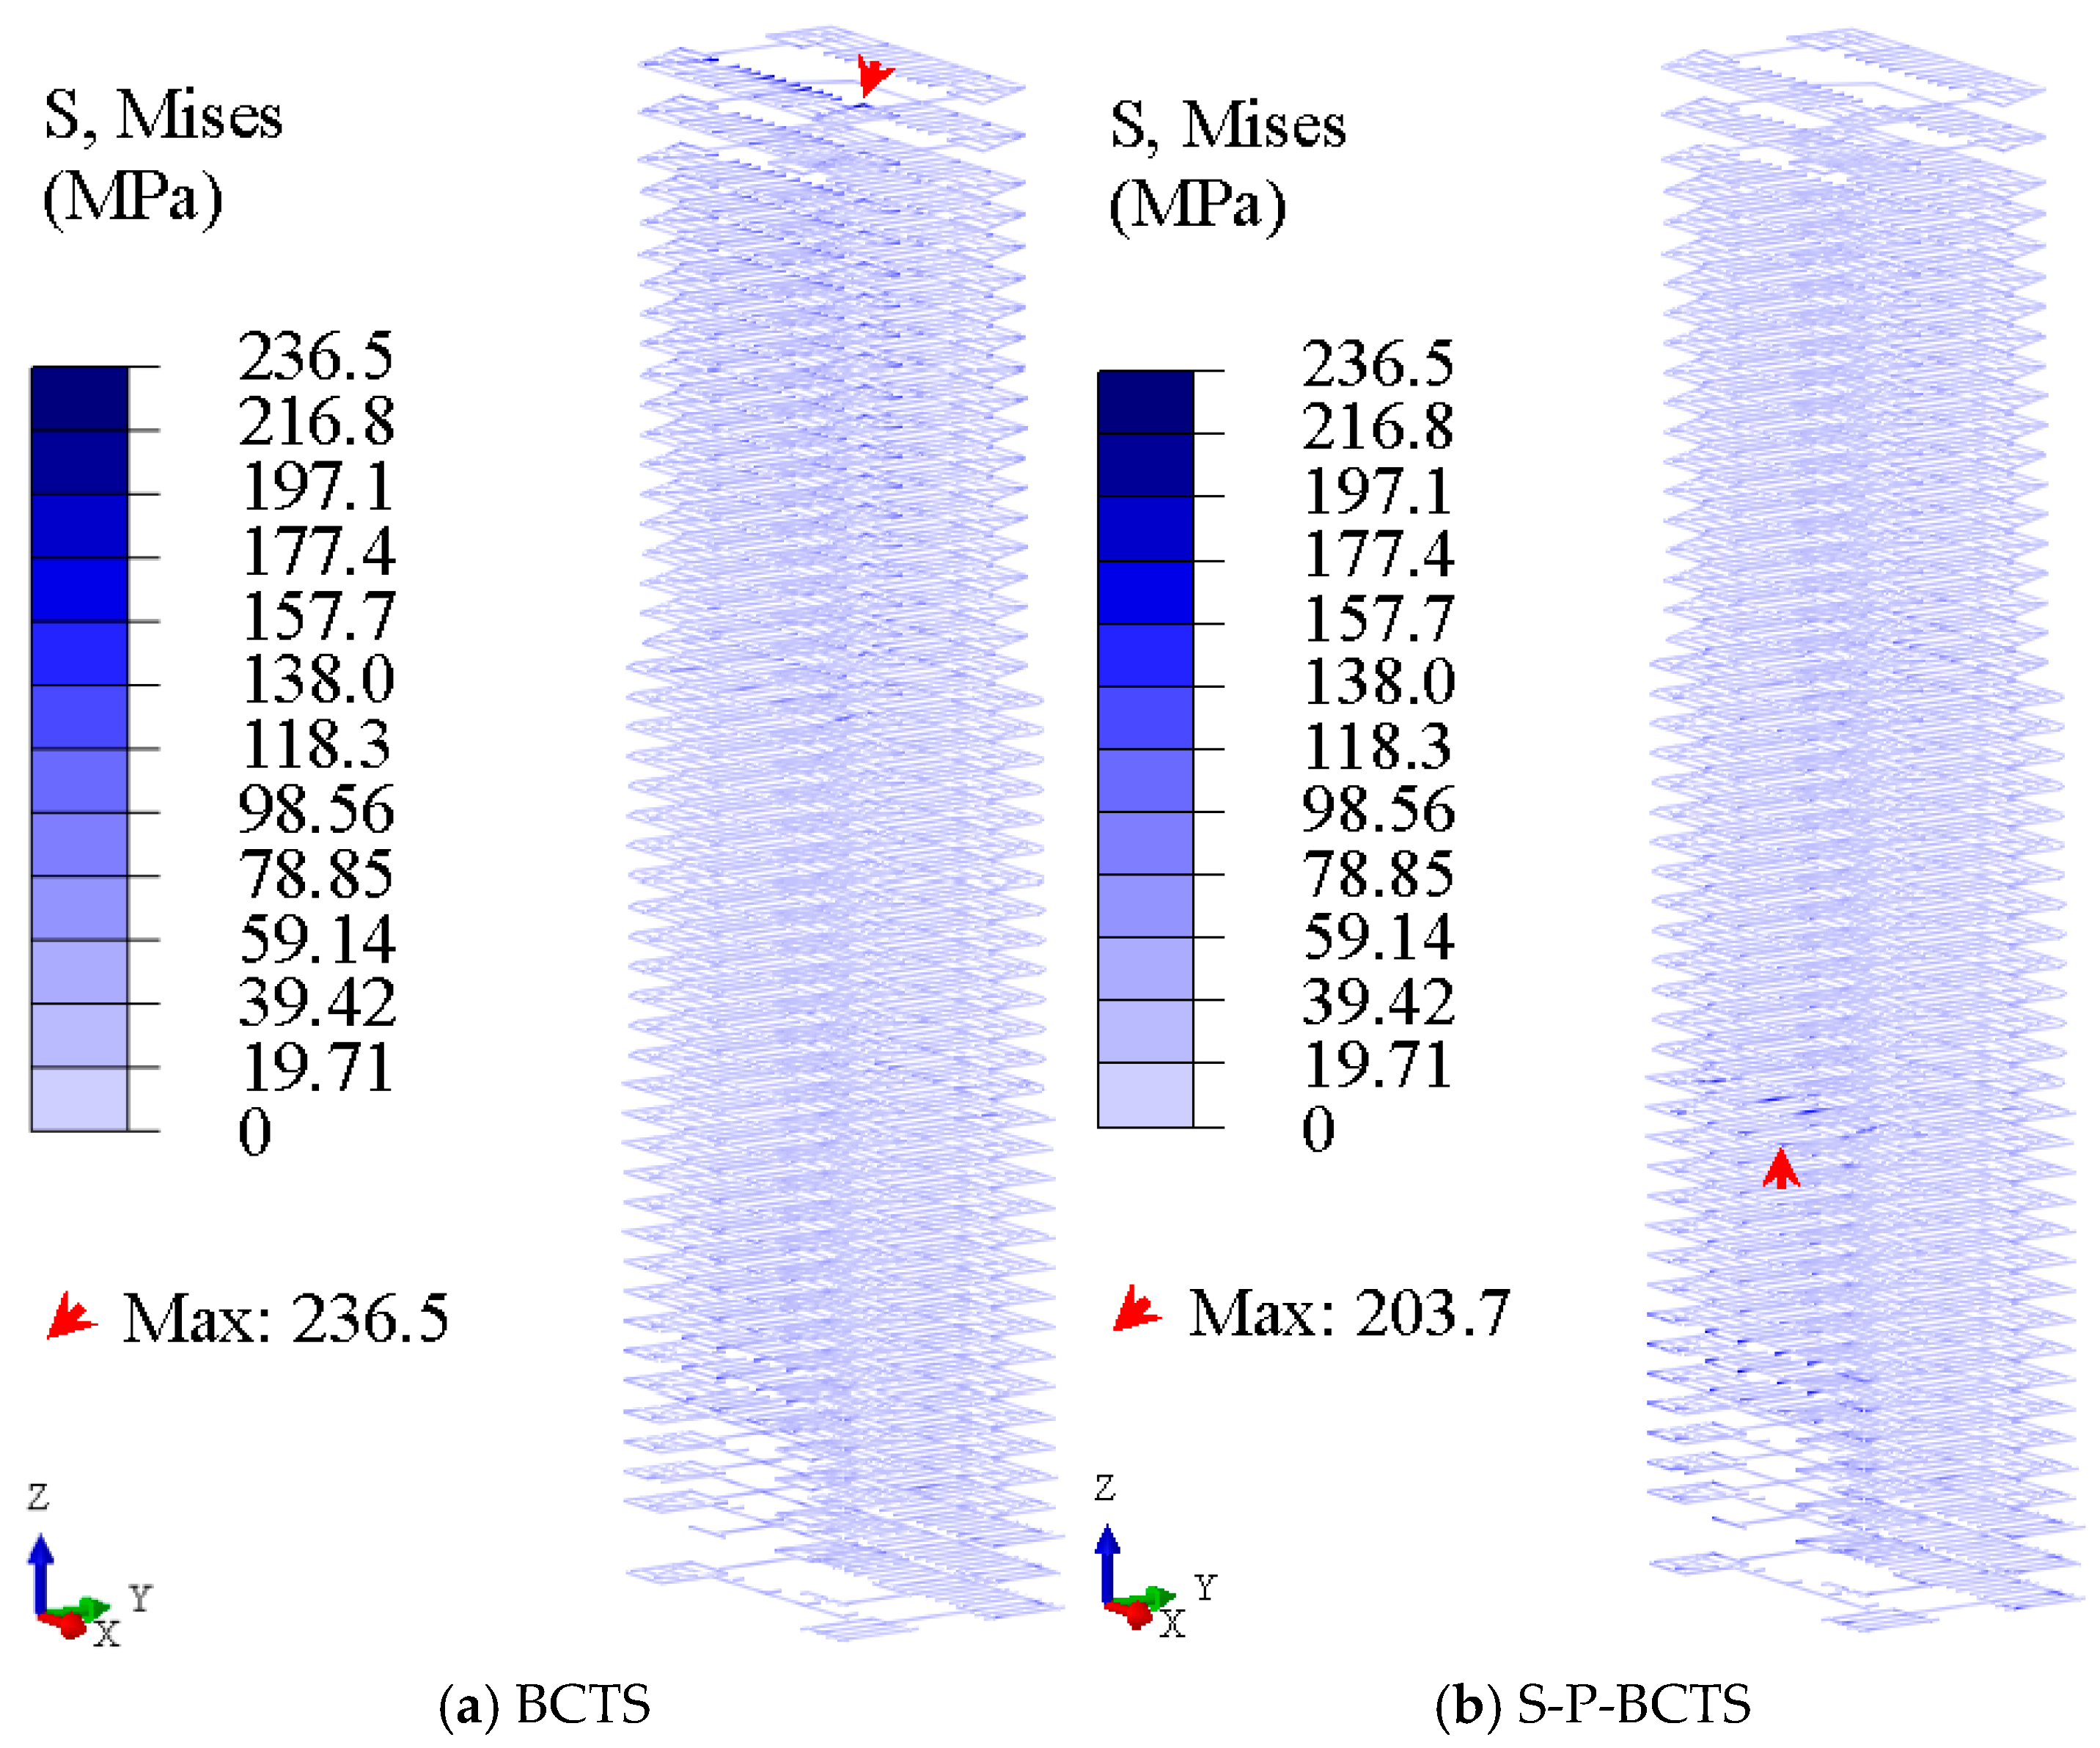
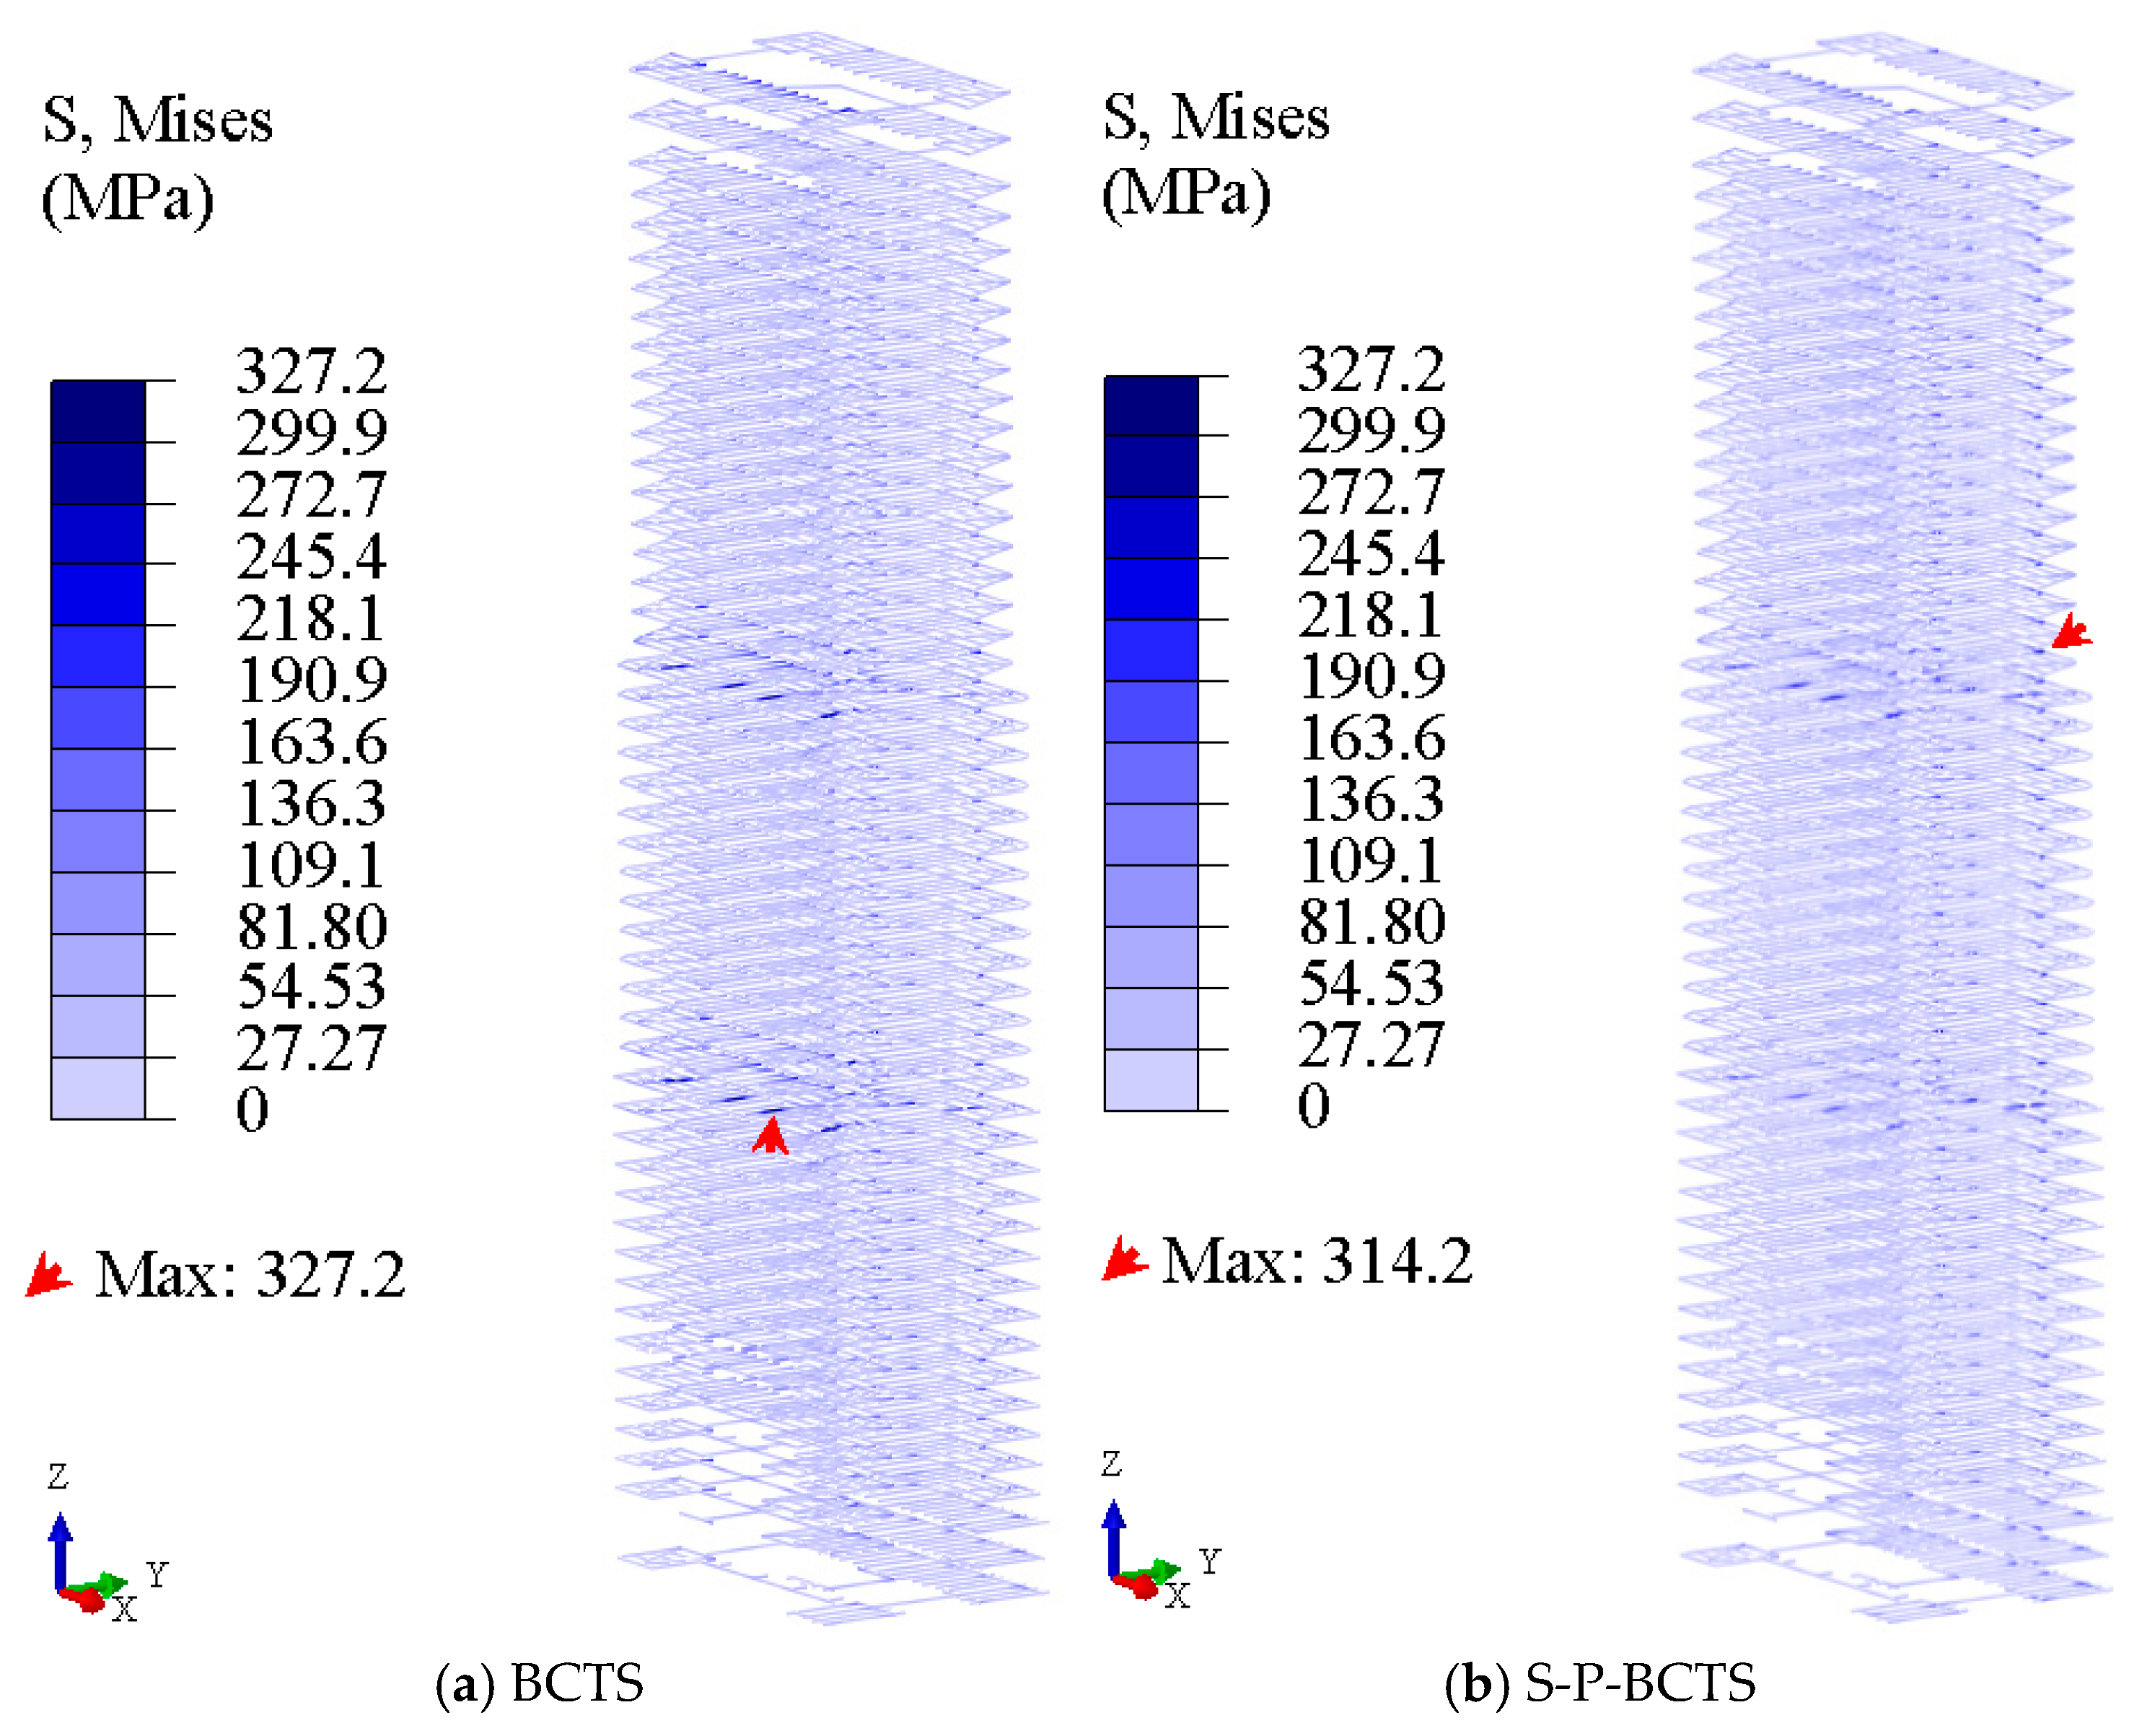
Figure 23 and Figure 24 show the Mises stresses of frame beams obtained from the two models when S1 and S4 are in incident, respectively. The Mises stresses of frame beams here refer to the Mises stresses of frame beams in the instant of the maximum Mises stress of frame beams during the period of seismic excitation. One can see that the overall spatial distribution of the Mises stresses in the two models is basically similar. However, the maximum Mises stress in the S–P–BCTS model is smaller than that in the BCTS model, and its location is different from that in the BCTS model.
When S1 is incident, in the BCTS model, the Mises stress does not increase significantly near the storeys with outriggers, and the maximum Mises stress appears at the top with a value of 236.5 MPa. But in the S–P–BCTS model, the Mises stresses increase obviously near the lower storey with outriggers, and the maximum Mises stress appears near the lower storey with outriggers, and its value is 203.7 MPa. When S4 is in incident, the Mises stresses of the two models increase significantly near both upper and lower storeys with outriggers. In the BCTS model, the maximum Mises stress appears near the lower storey with outriggers, and its value is 327.2 MPa, while in the S–P–BCTS model, the maximum appears near the upper storey with outriggers, and its value is 314.2 MPa.

4.4.4. Floor Plate Damage

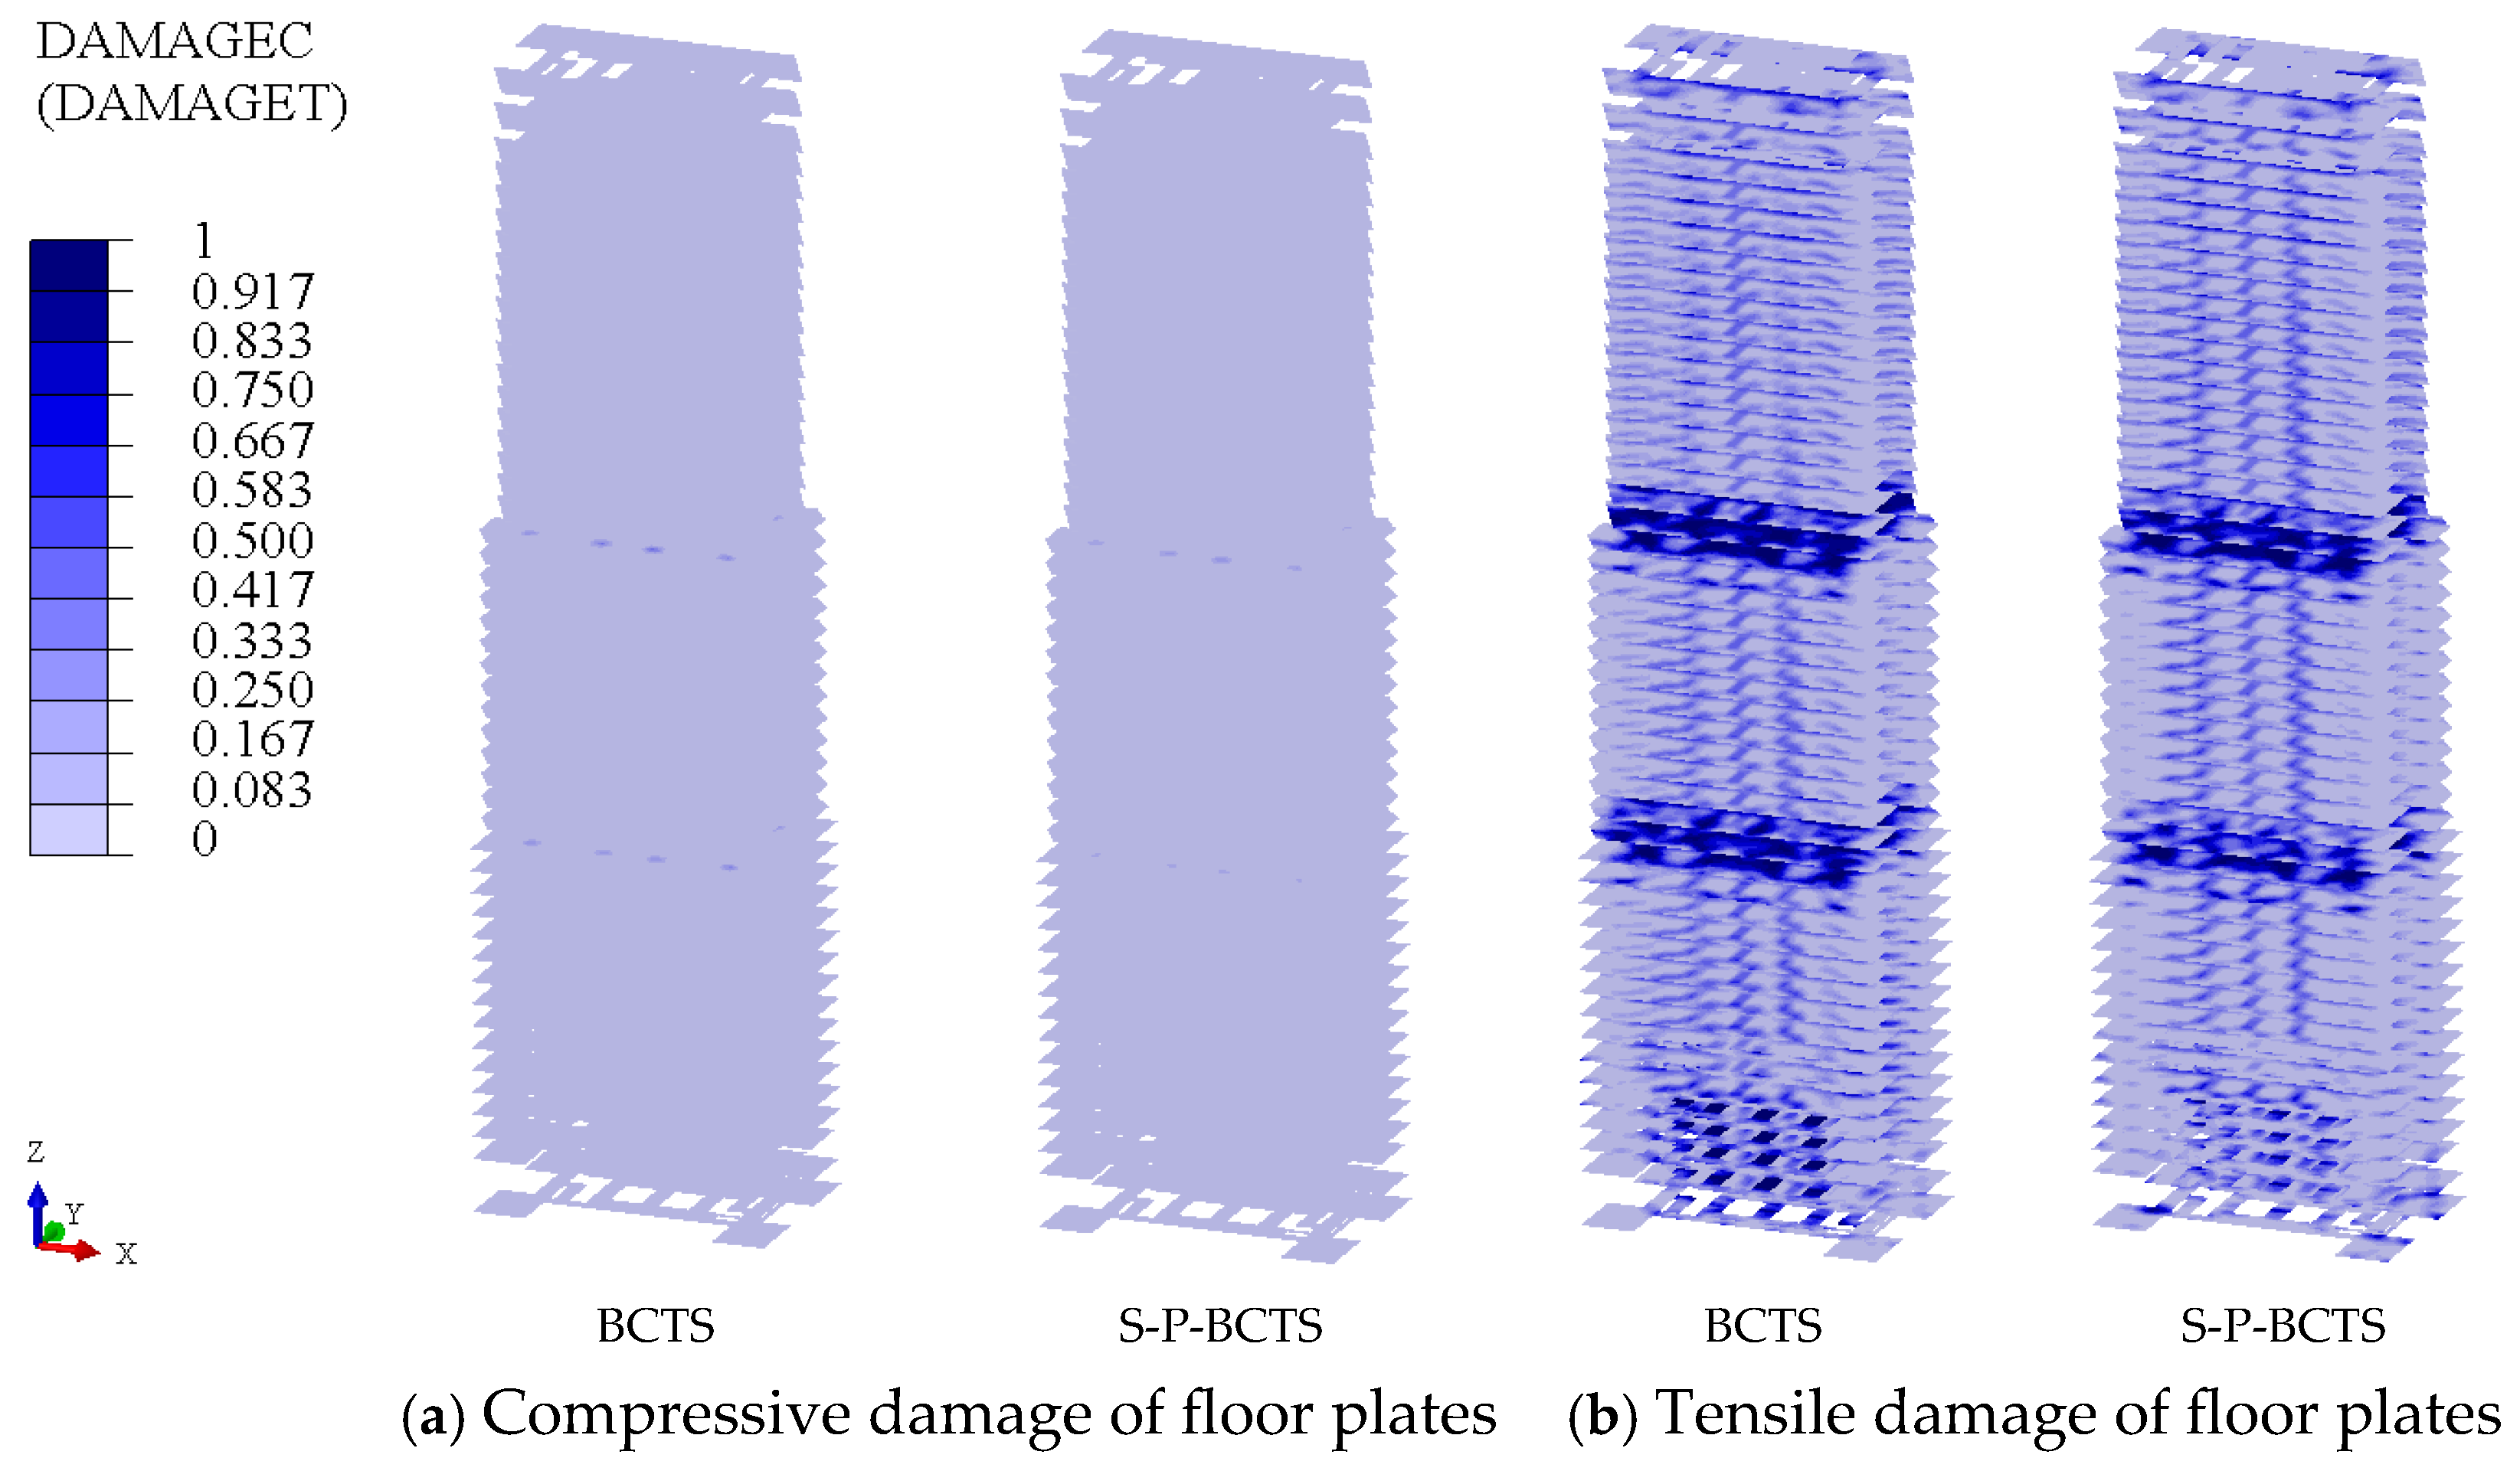
Figure 25 presents the final damage contours of the floor slabs obtained from the BCTS model and the S–P–BCTS model under the incidence of S4.
As can be observed from Figure 25a, under S4 incidence, the BCTS model exhibits minor compressive damage only in the slabs of the strengthening storeys, while no compressive damage is observed in the remaining slabs. This phenomenon is also noted in the S–P–BCTS model. However, additionally, it can be observed that compared to the BCTS model, the S–P–BCTS model shows a reduction in compressive damage in the strengthening storey slabs, along with a mitigation of damage severity in the same regions.
From Figure 25b, the spatial distribution of tensile damage in the floor slabs is generally consistent between the BCTS and S–P–BCTS models: the tensile damage in the slabs within the core tube is more significant than that outside the core tube, with pronounced tensile damage primarily concentrated near the bottom storeys and the strengthening storeys. From an overall perspective, compared to the BCTS model, the area exhibiting tensile damage in the S–P–BCTS model can be considered essentially reduced.

4.5. Pile Stress

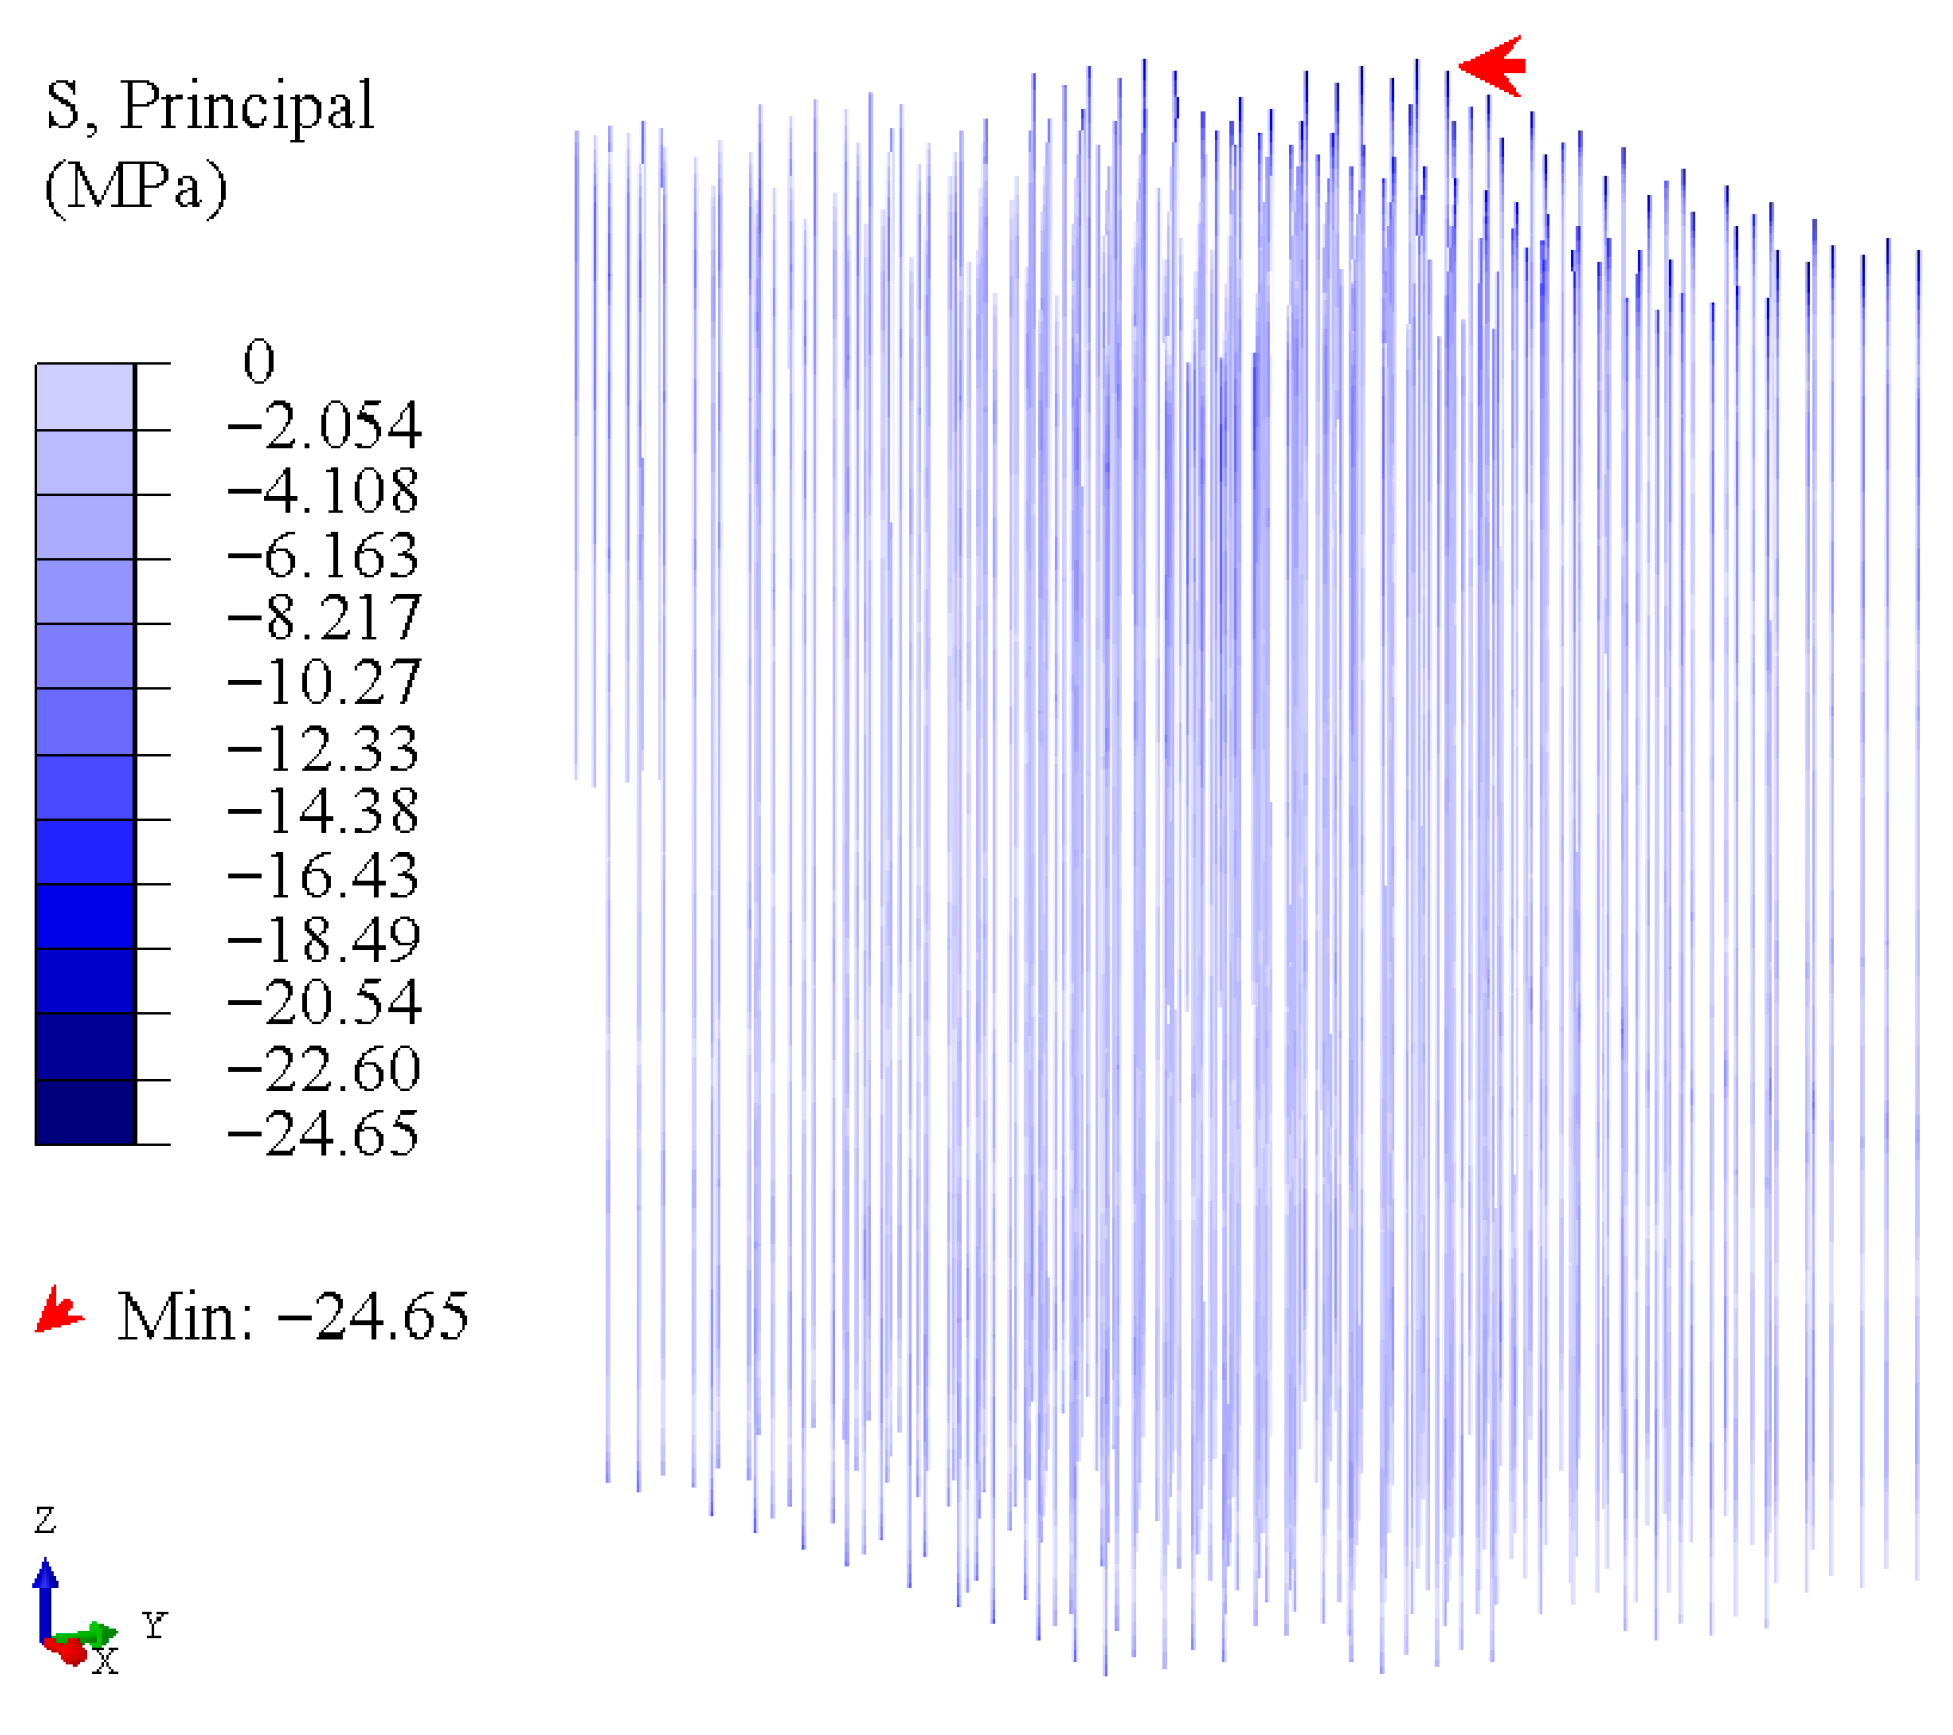
Figure 26 and Figure 27 give the principal compressive stresses of piles in the two models when S1 and S4 are incident, respectively. The principal compressive stresses of piles here refer to the principal compressive stresses of piles at the instant of the maximum principal compressive stress of piles during the period of seismic excitation. One can see that, when S1 is incident, the maximum principal compressive stress appears at the head of the boundary pile with a value of 24.65 MPa. When S4 is incident, the maximum appears at the head of the corner pile with a value of 29.52 MPa. The above maximum values are less than 29.6 MPa, the compressive strength of concrete used in piles, indicating that the piles have not been seriously damaged, but the maximum under the excitation of S4 is close to the compressive strength, which deserves attention.

5. Conclusions

In this paper, a refined finite element model for nonlinear earthquake response analysis of the soil–pile–BCTS system is established. The BCTS is a 52-storey building with a total height of 240 m, has a structure type of frame-core wall with outriggers, and rests on a deep, soft soil site. The viscous-spring boundary is used in the system to eliminate the boundary effect, and the equivalent nodal force method is applied to realize the seismic wave input. By comparing the earthquake responses of the soil–pile–BCTS model with those of the fixed-base above-ground BCTS model, the dynamic soil–pile–BCTS interaction under seismic excitation is studied. The main conclusions, after considering the dynamic soil–pile–BCTS interaction, are as follows:
(1)
For the top-storey acceleration, the peak value of the time histories decreases significantly. In addition, the short-period components of the response spectra decrease obviously, the predominant period of the response spectra prolongs clearly, and the peak value of the response spectra tends to decrease.
(2)
The lateral displacement and inter-storey drift increase significantly. The results in this paper show that the lateral displacement of the top storey and the maximum inter-storey drift obtained from the soil–pile–BCTS model can be as high as 1.79 and 1.22 times those obtained from the fixed-base above-ground BCTS model, respectively. The dynamic soil–pile–BCTS interaction should be fully considered in seismic analysis.
(3)
The total base shear decreases significantly. However, by observing the core wall and frame column base shear separately, it can be found that the core wall base shear also decreases significantly, but the frame column base shear increases significantly. The results in this paper show that the frame column base shear obtained from the soil–pile–BCTS model can be as high as 1.76 times that obtained from the fixed-base above-ground BCTS model. This amplification effect should be fully considered in the seismic design of the column.
(4)
The area of compressive damage and tensile damage of the core wall decreases significantly, the maximum Mises stress of the frame beam decreases, and the area of compressive damage and tensile damage of the floor plate decreases. However, the maximum principal compressive stress of the frame column may increase at the foot of the frame column. These mean that the dynamic soil–pile–BCTS interaction is beneficial to the seismic performance of the core wall, frame beam, and floor plate overall, but may be detrimental to the seismic performance of the frame column.
It should be pointed out that, as mentioned in the introduction, the influence of the dynamic soil–pile–structure interaction on the earthquake responses of the structure is related to the research object, so it can be inferred that the influence of the dynamic soil–pile–BCTS interaction on the earthquake responses of BCTS should also be related to the research object. Therefore, the conclusions given in this paper can be used as a reference for the BCTS, which is founded on deep soft soil sites such as Tianjin and Shanghai, and has structures of frame-core wall with outriggers or frame-core wall. For the BCTS located in other site types or belonging to other structural types, the conclusions may be different, and further research is needed.

Author Contributions

Conceptualization, methodology, writing—original draft, J.L.; formal analysis, investigation, writing—original draft, S.S.; methodology, software, writing—review and editing, G.Z.; data curation, software, funding acquisition, D.W.; investigation, resources, validation, Y.Y.; investigation, resources, validation, J.W.; visualization, writing—review and editing, K.R.C. All authors have read and agreed to the published version of the manuscript.

Funding

This study is supported by the Technology Research and Development Plan of China Railway Group Limited (Grant Nos. 23JCYBJC00390, 23YDTPJC00670), which are gratefully acknowledged.

Conflicts of Interest

Author Yong Yu was employed by the company China Railway Liuyuan Group Co., Ltd. Author Jihu Wu was employed by the company China Railway Design Corporation. The remaining authors declare that the research was conducted in the absence of any commercial or financial relationships that could be construed as a potential conflict of interest.

References

  1. Ministry of Housing and Urban-Rural Development of the People’s Republic of China (MOHURD). Technical Key Points of Special Examination of Seismic Fortification for Tall Building Engineering Beyond the Code-Specification. 2015. Available online: https://www.mohurd.gov.cn/gongkai/zc/wjk/art/2015/art_17339_220992.html (accessed on 21 May 2015).
  2. Kamal, M.; Inel, M. Correlation between Ground Motion Parameters and Displacement Demands of Mid-Rise RC Buildings on Soft Soils Considering SoilStructure-Interaction. Buildings 2021, 11, 125. [Google Scholar] [CrossRef]
  3. Li, W.; Li, Q.N. Performance-based seismic design of complicated tall building structures beyond the code specification. Struct. Des. Tall Spec. Build. 2012, 21, 578–591. [Google Scholar]
  4. Ma, X.; Liu, Z. Inffuence of Ground Motion Non-Gaussianity on Seismic Performance of Buildings. Buildings 2024, 14, 2364. [Google Scholar] [CrossRef]
  5. Zhao, G.; Zhang, L.; Liu, D.; Shen, K. Seismic Response Analysis of Double-Layer Isolation Structures in High-Rise Buildings. Buildings 2025, 15, 1292. [Google Scholar] [CrossRef]
  6. Penzien, J.; Scheffey, C.F.; Parmelee, R.A. Seismic analysis of bridges on long piles. J. Eng. Mech. Div. 1964, 90, 223–254. [Google Scholar] [CrossRef]
  7. Tokimatsu, M.; Mizuno, H.; Kakurai, M. Building damage associated with geotechnical problems. Soils Found. 1996, 36, 219–234. [Google Scholar] [CrossRef]
  8. Trifunac, M.D.; Ivanović, S.S.; Todorovska, M.I.; Novikova, E.I.; Gladkov, A.A. Experimental evidence for flexibility of a building foundation supported by concrete friction piles. Soil Dyn. Earthq. Eng. 1999, 18, 169–187. [Google Scholar] [CrossRef]
  9. Boulanger, R.W.; Curras, C.J.; Kutter, B.L.; Wilson, D.W.; Abghari, A. Seismic soil-pile-structure interaction experiments and analyses. J. Geotech. Geoenviron. Eng. 1999, 125, 750–759. [Google Scholar] [CrossRef]
  10. Tang, L.; Ling, X. Response of a RC pile group in liquefiable soil: A shake-table investigation. Soil Dyn. Earthq. Eng. 2014, 67, 301–315. [Google Scholar] [CrossRef]
  11. Cai, Y.X.; Gould, P.L.; Desai, C.S. Nonlinear analysis of 3D seismic interaction of soil–pile–structure systems and application. Eng. Struct. 2000, 22, 191–199. [Google Scholar] [CrossRef]
  12. Carbonari, S.; Dezi, F.; Leoni, G. Nonlinear seismic behaviour of wall-frame dual systems accounting for soil-structure interaction. Earthq. Eng. Struct. Dyn. 2012, 41, 1651–1672. [Google Scholar] [CrossRef]
  13. Lu, H.; Liang, P.; Shang, S. Computational analysis of dynamic layered soil-pile-structure interaction. Chin. J. Geotech. Eng. 2007, 29, 705–711. [Google Scholar]
  14. Rovithis, E.N.; Pitilakis, K.D.; Mylonakis, G.E. Seismic analysis of coupled soil-pile-structure systems leading to the definition of a pseudo-natural SSI frequency. Soil Dyn. Earthq. Eng. 2009, 29, 1005–1015. [Google Scholar] [CrossRef]
  15. Hokmabadi, A.S.; Fatahi, B.; Samali, B. Assessment of soil-pile-structure interaction influencing seismic response of mid-rise buildings sitting on floating pile foundations. Comput. Geotech. 2014, 55, 172–186. [Google Scholar] [CrossRef]
  16. Badry, P.; Satyam, N. Seismic soil structure interaction analysis for asymmetrical buildings supported on piled raft for the 2015 Nepal earthquake. J. Asian Earth Sci. 2017, 133, 102–113. [Google Scholar] [CrossRef]
  17. Padrón, L.A.; Aznárez, J.J.; Maeso, O. 3-D boundary element-finite element method for the dynamic analysis of piled buildings. Eng. Anal. Bound. Elem. 2011, 35, 465–477. [Google Scholar] [CrossRef]
  18. Lu, J.F.; He, C.Y. A model for the seismic analysis of a periodic viaduct when considering the pile-soil-structure interaction. Soil Dyn. Earthq. Eng. 2014, 56, 13–27. [Google Scholar] [CrossRef]
  19. JGJ 3-2010; Technical Specification for Concrete Structures of Tall Building. Ministry of Housing and Urban-Rural Development of the People’s Republic of China (MOHURD): Beijing, China, 2011.
  20. Dassault Systèmes. 22.2.2 Models for metals subjected to cyclic loading. In Abaqus 6.11. Abaqus Analysis User’s Manual; Dassault Systèmes: Vélizy-Villacoublay, France, 2011. [Google Scholar]
  21. Dassault Systèmes. 22.6.3 Concrete damaged plasticity. In Abaqus 6.11. Abaqus Analysis User’s Manual; Dassault Systèmes: Vélizy-Villacoublay, France, 2017. [Google Scholar]
  22. Bardet, J.P.; Ichii, K.; Lin, C.H. EERA–A Computer Program for Equivalent Linear Earthquake Site Response Analyses of Layered Soil Deposits; University of Southern California: Los Angeles, CA, USA, 2000. [Google Scholar]
  23. China Academy of Building Research. User’s manual and technical specification of SATWE–Space finite element analysis and design software for multi-story and tall buildings with wall-element. Available online: https://uc.pkpm.cn/TrialCenterProDerail?trialCenterProductId=c8bb7833-b554-40ea-8ad1-95cc5b95e68c (accessed on 22 February 2021).
  24. Liang, J.; Cao, Z.; Zhou, D.; Zhao, H. Elastoplastic time-history analysis of a super high-rise building in Tianjin under rare earthquake. Ind. Constr. 2016, 46, 179–186. [Google Scholar]
  25. GB 50011-2010; Code for Seismic Design of Buildings: 4.1 Site. Ministry of Housing and Urban-Rural Development of the People’s Republic of China (MOHURD): Beijing, China, 2010.
  26. Lysmer, J.; Kuhlemeyer, R.L. Finite dynamic model for infinite media. J. Eng. Mech. Div. 1969, 95, 859–878. [Google Scholar] [CrossRef]
  27. Liao, Z.P.; Wong, H.L.; Yang, B.P.; Yuan, Y.F. A transmitting boundary for transient wave analyses. Sci. Sin. Ser. A 1984, 27, 1063–1076. [Google Scholar]
  28. Deeks, A.J.; Randolph, M.F. Axisymmetric time-domain transmitting boundaries. J. Eng. Mech. 1994, 120, 25–42. [Google Scholar] [CrossRef]
  29. Liu, J.; Lu, Y. A direct method for analysis of dynamic soil-structure interaction based on interface idea. Dev. Geotech. Eng. 1998, 83, 261–276. [Google Scholar]
  30. Wang, Z.; Liu, J. Study on wave motion input and artificial boundary for problem of nonlinear wave motion in layered soil. Chin. J. Rock Mech. Eng. 2004, 23, 1169–1173. [Google Scholar]
  31. Gu, Y.; Liu, J.; Du, Y. 3D consistent viscous-spring artificial boundary and viscous-spring boundary element. Eng. Mech. 2007, 24, 31–37. [Google Scholar]
  32. Zhang, C.; Pan, J.; Wang, J. Influence of seismic input mechanisms and radiation damping on arch dam response. Soil Dyn. Earthq. Eng. 2009, 29, 1282–1293. [Google Scholar] [CrossRef]
  33. He, J.; Ma, H.; Zhang, B.; Chen, H. Method and realization of seismic motion input of viscous-spring boundary. Shuli Xuebao 2010, 41, 960–969. [Google Scholar]
  34. Liang, J.; Yu, J.; Zhang, J.; Ba, Z. Seismic response analysis of metro twin tunnels by the viscous-spring boundary. China Civ. Eng. J. 2014, 47, 274–279. [Google Scholar]
  35. Wang, Q.; Chen, J.; Li, J. Seismic response analysis of underground pipeline under obliquely incident seismic wave. J. Huazhong Univ. Sci. Technol. 2008, 25, 283–286. [Google Scholar]
  36. Huang, J.Q.; Du, X.L.; Liu, J.; Zhao, M. Impact of incident angles of P waves on the dynamic responses of long lined tunnels. Earthq. Eng. Struct. Dyn. 2016, 45, 2435–2454. [Google Scholar] [CrossRef]
  37. Liang, J.; Liu, Z.; Lee, V.W. Scattering of plane waves by a 3-D canyon in layered half-space. In Proceedings of the 14th World Conference on Earthquake Engineering, Beijing, China, 12–17 October 2008. [Google Scholar]
  38. Liang, J.; Liang, J.; Zhang, J.; Ba, Z. Nonlinear seismic response of 3D canyon in deep soft soils. Chin. J. Geotech. Eng. 2017, 39, 1196–1205. [Google Scholar]
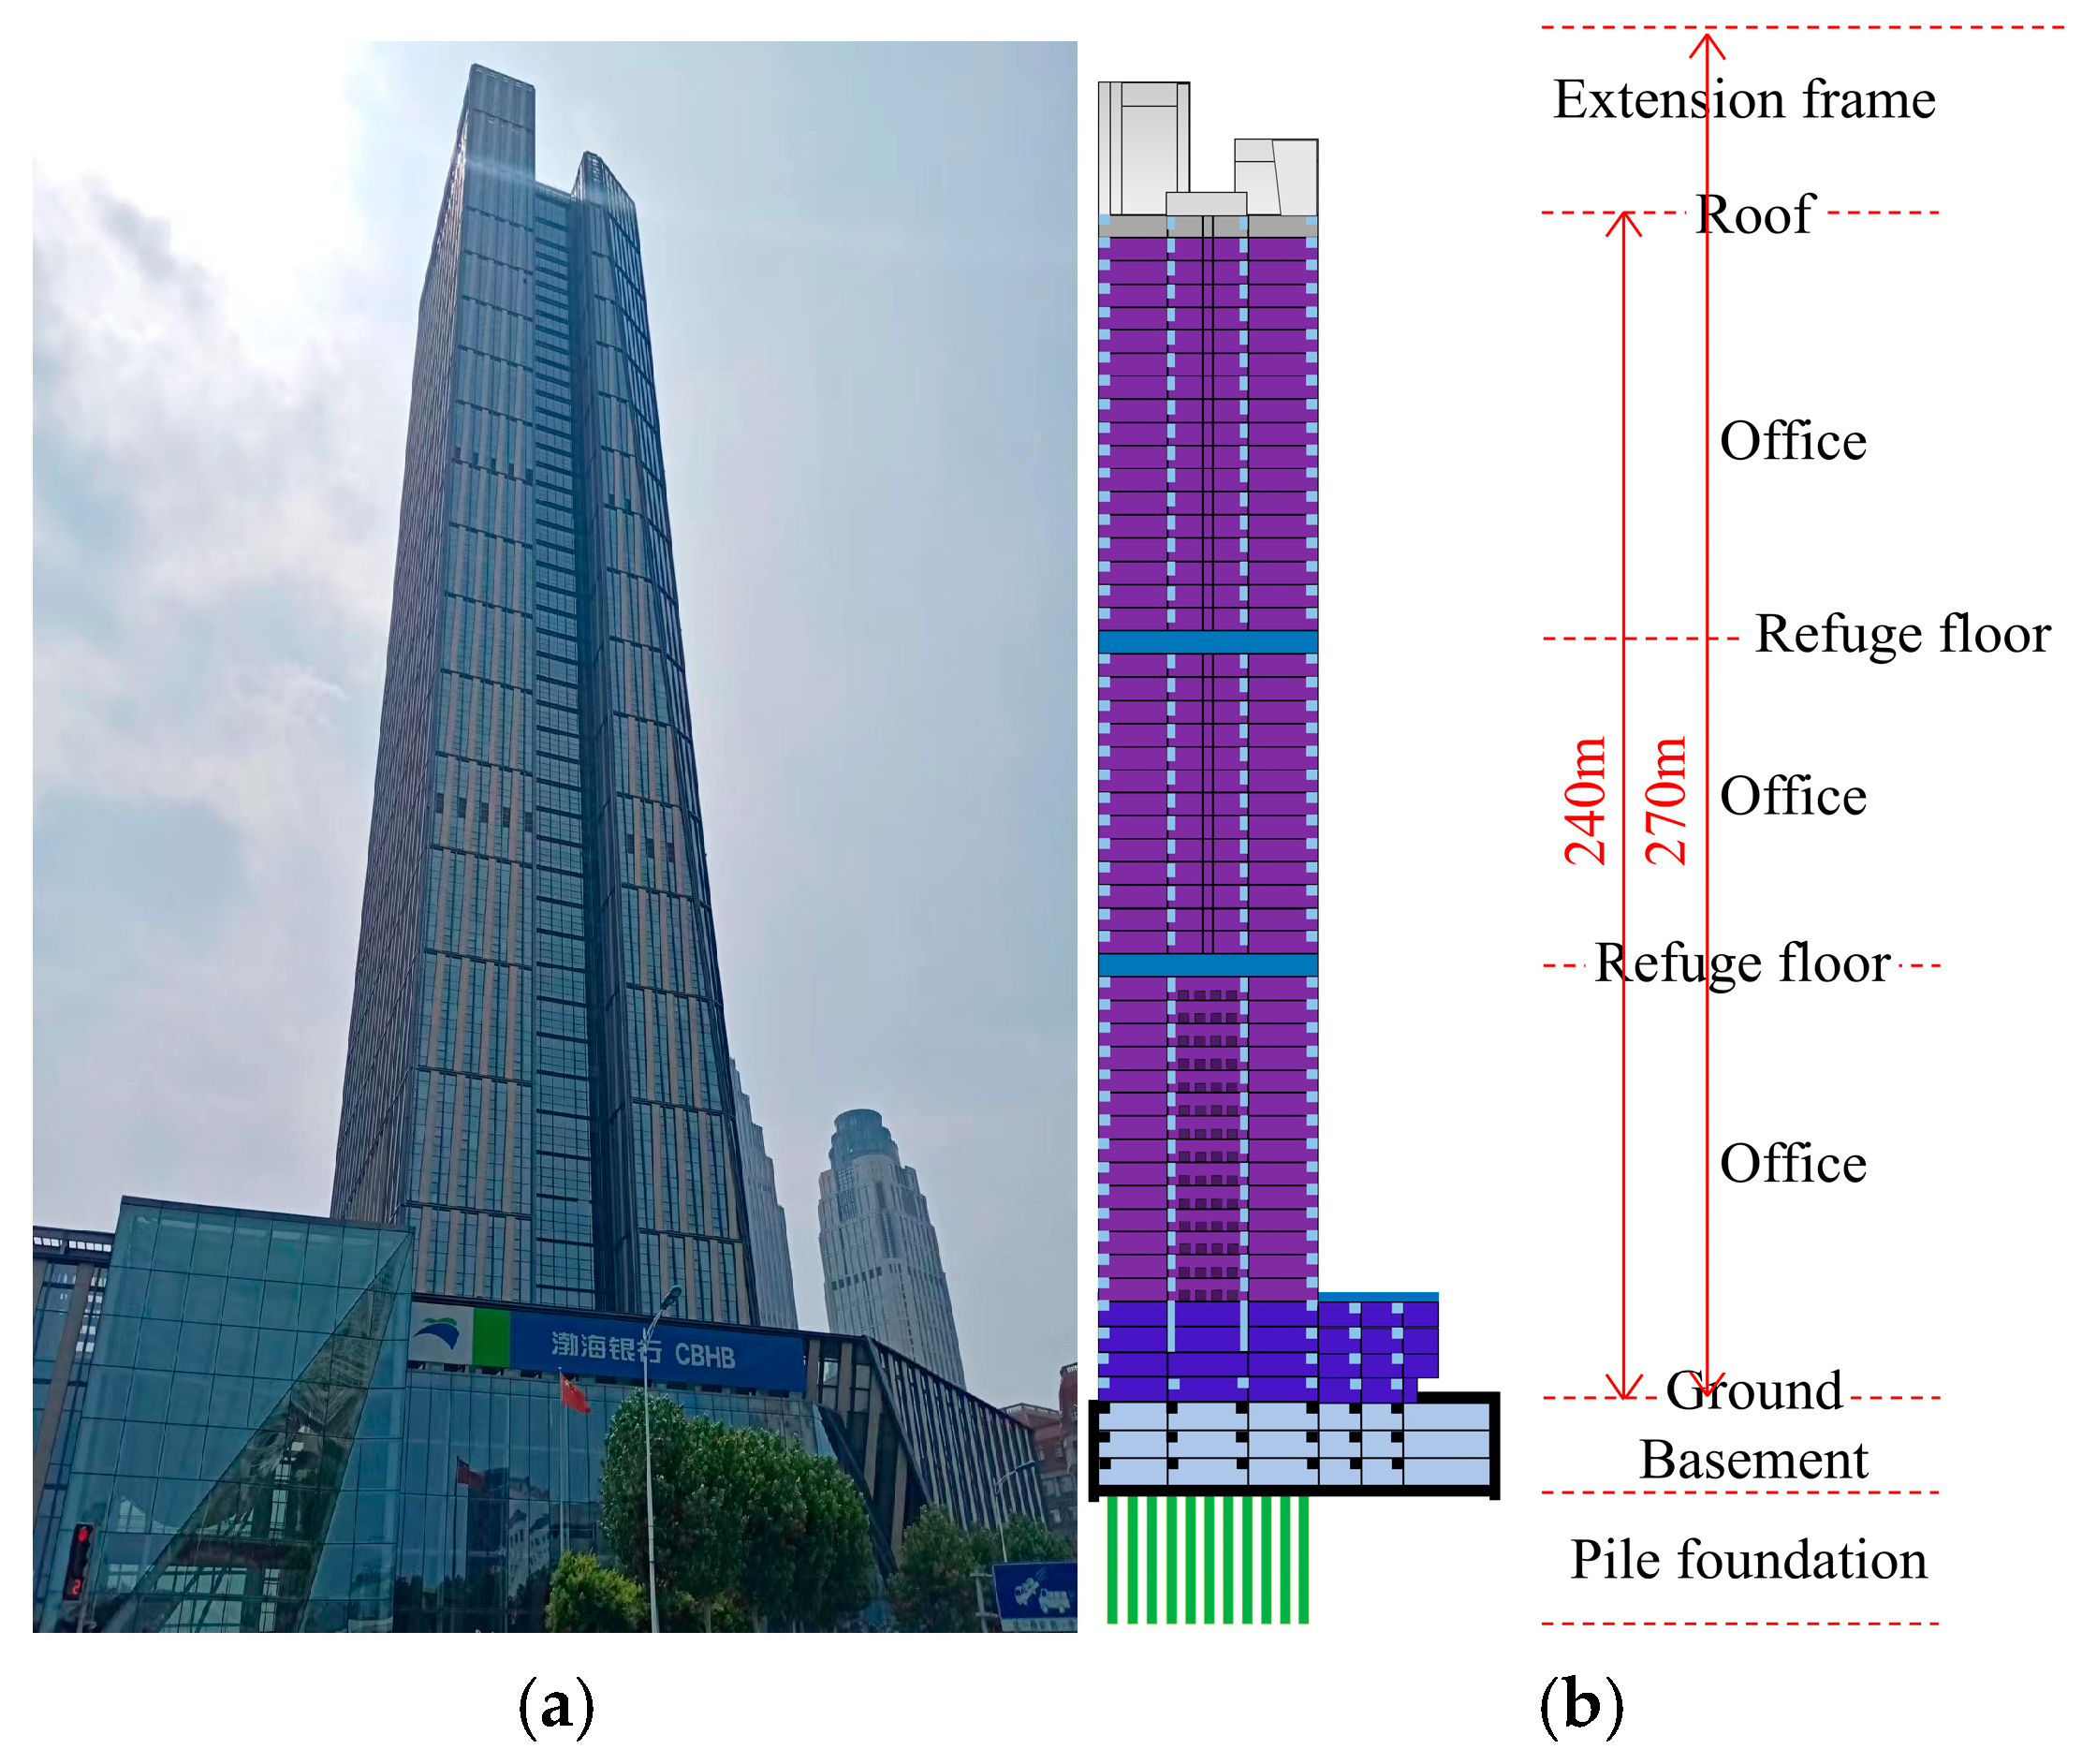
Figure 1. Overview of the high-rise building. (a) Realistic picture. (b) Diagrammatic sketch.
Buildings 15 03085 g001
Figure 2. Structural plan layout of the typical storey and the number of shear walls.
Buildings 15 03085 g002
Figure 3. Structural type of frame-core wall with outriggers.
Buildings 15 03085 g003
Figure 4. Plan layout of piles.
Buildings 15 03085 g004
Figure 5. Distribution of the shear wave velocity of each soil layer along the depth direction.
Buildings 15 03085 g005
Figure 6. Kinematic hardening model.
Buildings 15 03085 g006
Figure 7. Damaged plasticity model.
Buildings 15 03085 g007
Figure 8. Structural model diagram. (a) The building structure. (b) Soil–pile-–BCTS model.
Buildings 15 03085 g008
Figure 9. Time-history curves of the inter-storey drift at the top and the total base shear of the structure. (a) The length × width of the soil is 580 m × 380 m. (b) The length × width of the soil is 870 m × 570 m.
Buildings 15 03085 g009
Figure 10. (a) Schematic of three-dimensional viscous-spring boundary. (b) Schematic of equivalent nodal force.
Buildings 15 03085 g010
Figure 11. (a) Displacement, velocity, and stress responses in the free field when seismic waves are vertically incident along the horizontal direction. (b) Equivalent nodal forces are imposed on the boundaries of the three-dimensional model.
Buildings 15 03085 g011
Figure 12. Comparison of the linear earthquake responses of the hemispherical canyon between Liang et al. [36] and this paper.
Buildings 15 03085 g012aBuildings 15 03085 g012b
Figure 13. Comparison of the nonlinear earthquake responses of three-dimensional free field between EERA [21] and this paper.
Buildings 15 03085 g013aBuildings 15 03085 g013b
Figure 14. Methods for seismic wave input adopted by BCTS and S–P–BCTS models.
Buildings 15 03085 g014
Figure 15. Time histories and response spectra of the vertically incident seismic waves on the bedrock.
Buildings 15 03085 g015
Figure 16. Time histories and response spectra of the top-storey accelerations.
Buildings 15 03085 g016
Figure 17. Lateral displacements of each storey.
Buildings 15 03085 g017
Figure 18. Inter-storey drifts of each storey.
Buildings 15 03085 g018
Figure 19. Damage of shear walls on ①–⑥ axes under the excitation of S1.
Buildings 15 03085 g019
Figure 20. Damage of shear walls on ①–⑥ axes under the excitation of S4.
Buildings 15 03085 g020aBuildings 15 03085 g020b
Figure 21. Principal compressive stresses frame columns under the excitation of S1.
Buildings 15 03085 g021
Figure 22. Principal compressive stresses frame columns under the excitation of S4.
Buildings 15 03085 g022
Figure 23. Mises stresses of frame beams under the excitation of S1.
Buildings 15 03085 g023
Figure 24. Mises stresses of frame beams under the excitation of S4.
Buildings 15 03085 g024
Figure 25. Damage of floor plates under the excitation of S4.
Buildings 15 03085 g025
Figure 26. Principal compressive stresses piles under the excitation of S1.
Buildings 15 03085 g026
Figure 27. Principal compressive stresses piles under the excitation of S4.
Buildings 15 03085 g027
Table 1. Glossary.
Table 1. Glossary.
Symbol IdentificationMeaning of Symbols
σ Stress
ϵStrain
E 0 Initial elastic modulus
E s 1 Tangent modulus in the plastic phase
f c y Compressive yield stress
f c u Ultimate compressive strength
ϵ c y Compressive yield strain
ϵ c u Ultimate compressive strain
( ϵ 01 , σ 01 ) Yield initiation
( ϵ r 1 , σ r 1 ) Stress reversal state
d t Tensile damage variables
d c Compressive damage variables
KbnNormal spring stiffness of viscous-spring boundary
KbtTangent spring stiffness of viscous-spring boundary
CbnNormal dashpot coefficients of viscous-spring boundary
CbtTangent dashpot coefficients of viscous-spring boundary
GShear modulus of medium
cpP-wave velocities of medium
csS-wave velocities of medium
υPoisson’s ratio of medium
ρMass density of medium
AbInfluence area of node b
αnNormal correction factors of spring stiffness
αtTangent correction factors of spring stiffness
RDistance from scattering wave source to boundary node
tTime term
xbx-coordinates of node b
yby-coordinates of node b
zbz-coordinates of node b
uDisplacement at the boundary node b in the finite element model
τStress at the boundary node b in the finite element model
ufDisplacement at the node b in the semi-infinite free field
τfStress at the node b in the semi-infinite free field
FbEquivalent nodal force imposed on the boundary node of finite element model
fbInterior force between boundary node and spring-dashpot
KbSpring stiffness calculated by the converged soil parameters obtained from the free-field equivalent linear analysis
CbDashpot coefficient calculated by the converged soil parameters obtained from the free-field equivalent linear analysis
ufConverged displacement received from the free-field equivalent linear analysis
u ˙ f Velocity received from the free-field equivalent linear analysis
τfStress responses received from the free-field equivalent linear analysis
aCanyon radius
ωCircular frequency of the incident harmonic wave
C L s Shear wave velocity of the soil
ηDimensionless frequency
ρ s Soil particle density
ρ f Water density
nPorosity
G m a x Maximum shear modulus
Table 2. Soil parameters.
Soil No.ρs (kg·m−3)ρf (kg·m−3)nGmax (MPa)υ
247710000.3523.960.48
229410000.3229.280.35
249310000.3390.660.30
261410000.30200.500.34
239710000.32118.830.35
258510000.35188.540.26
246310000.33228.330.26
258610000.30347.240.30
248510000.32306.690.25
Table 3. Natural vibration periods and modal properties.
ModePeriod (s)Property
BCTSS-P-BCTSBCTSS-P-BCTS
14.935.96First-order translation in y-directionFirst-order translation in y-direction
24.455.16First-order translation in x-directionFirst-order translation in x-direction
33.243.47First-order torsionFirst-order torsion
41.432.57Second-order translation in x-directionSecond-order translation in x-direction
51.232.54Second-order translation in y-directionSecond-order translation in y-direction
61.072.32Second-order torsionSecond-order torsion
70.742.05Third-order translation in x-directionFirst-order vertical vibration
80.551.92Third-order torsionThird-order translation in x-direction
90.531.88Third-order translation in y-directionSecond-order vertical vibration
100.471.82Fourth-order translation in x-directionThird-order torsion
Table 4. Maximum rocking angles of the base (1 × 10⁻³ rad).
Seismic WaveBCTSS-P-BCTS
S101.63
S201.87
S301.64
S403.65
S501.05
S601.60
Table 5. Maximum inter-storey drifts and the corresponding storey numbers.
Seismic WaveBCTSS-P-BCTS
S11/242 (47th storey)1/222 (45th storey)
S21/264 (46th storey)1/262 (45th storey)
S31/242 (46th storey)1/220 (45th storey)
S41/135 (45th storey)1/121 (44th storey)
S51/414 (46th storey)1/339 (47th storey)
S61/341 (47th storey)1/329 (46th storey)
Disclaimer/Publisher’s Note: The statements, opinions and data contained in all publications are solely those of the individual author(s) and contributor(s) and not of MDPI and/or the editor(s). MDPI and/or the editor(s) disclaim responsibility for any injury to people or property resulting from any ideas, methods, instructions or products referred to in the content.