Article

Experimental and Design Research on Seismic Performance of Connectors in Timber–Concrete Composite Structures

1
College of Civil Engineering, Central South University of Forestry & Technology, Changsha 410004, China
2
Hunan Provincial Transportation Science Research Institute Co., Ltd., Changsha 410118, China
3
College of Railway Architecture, Hunan Technical College of Railway High-Speed, Hengyang 421002, China
*
Author to whom correspondence should be addressed.
These authors contributed equally to this work.
Buildings 2025, 15(17), 3084; https://doi.org/10.3390/buildings15173084
Submission received: 22 July 2025 / Revised: 22 August 2025 / Accepted: 26 August 2025 / Published: 28 August 2025
(This article belongs to the Section Building Structures)

Abstract

To evaluate the mechanical properties of connectors in timber–concrete composite (TCC) structures under low-cycle reversed loading, eighteen push-out specimens were designed and fabricated following the standard push-out test method. This study presents the first comparative analysis of the seismic performance between notch-bolted and ordinary bolted connections across three bolt diameters (12 mm, 16 mm, and 20 mm), addressing a gap in systematic experimental data for different connection types. Key performance indices under cyclic loading—including stiffness degradation, strength degradation, energy dissipation capacity, and ductility—were investigated. Furthermore, cumulative damage analysis elucidated the damage accumulation process, establishing a damage index (Dw) based on an energy method and proposing Dw = 0.6 as a critical early-warning threshold for failure. Practical recommendations for seismic design and engineering applications are provided. The results demonstrate that compared to ordinary bolted connections, notch-bolted connections achieve a 15–30% increase in ultimate bearing capacity and exhibit superior stiffness. Specimens with 16 mm bolts exhibited optimal ductility (ductility coefficient ξ = 3.6), while notch-bolted connections maintained stable ductility within the range of ξ = 2–3. Finally, a numerical model was developed using ANSYS finite element software. Validation against experimental results confirmed the model’s accuracy in simulating structural behavior. This research elucidates the cumulative damage mechanisms in TCC structures under cyclic loading, providing a theoretical basis for design optimization and valuable insights for promoting the seismic application of these composite systems.

1. Introduction

Modern timber structures offer advantages, such as being green and ecological, excellent seismic performance, a high industrialization level, and health and livability. The development of modern timber structures aligns with national strategies of sustainable development. Timber structures exhibit favorable seismic performance under strong earthquakes due to their lightweight nature, structural redundancy, and energy absorption capabilities. Timber–concrete composite (TCC) structures represent an innovative building form that skillfully integrates timber beams and concrete slabs through shear connectors, enabling synergistic interaction. Compared to pure timber structures, TCC structures not only significantly enhance structural bearing capacity and stiffness but also effectively improve fire resistance and sound insulation performance. By utilizing the excellent tensile performance of timber and the superior compressive strength of concrete, they achieve optimal utilization of material properties. This endows the structure with multiple advantages, including light weight with high strength, outstanding bearing capacity, convenient construction, and good fire and sound insulation effects, making it highly suitable for floor systems in buildings or bridge deck systems [1], such as the LifeCycle Tower in Austria [2] and timber–concrete composite bridges [3]. These hybrid systems leverage the synergistic advantages of material properties, combining timber’s ductility with concrete’s compressive strength [4,5].
However, as shear connectors undergo deformation while transferring longitudinal shear forces, interfacial slip occurs in composite structures. Consequently, the traditional plane-section assumption is no longer applicable to TCC structures. Therefore, the mechanical behavior of shear connectors becomes a key research focus for TCC structures. While substantial research exists on steel–concrete composite connections [6,7,8], timber–concrete connections present unique challenges due to their more complex mechanical behavior. Currently, domestic and international scholars have conducted extensive research on the static and fatigue performance of shear connectors in composite structures, achieving substantial results [9,10,11,12,13,14,15,16,17,18,19,20,21]. In seismic research, existing studies focus on the mechanical behavior of composite structures under low-cycle reversed loading, exploring key characteristics through a combination of experimental and numerical simulation methods [22,23,24,25,26,27,28,29]. Cao et al. [30,31] summarized the advantages and disadvantages of three hysteretic models. Md Shahnewaz et al. [32] investigated the hysteretic performance of a six-story CLT structure using incremental dynamic analysis. Roko Žarnić et al. [33] conducted low-cycle reversed loading tests on a novel composite structure comprising cross-laminated timber frames with laminated glass infill panels, analyzing deformation capacity, lateral strength, stiffness, strength degradation, and energy dissipation capacity. Li et al. [34] improved the Kratzig seismic damage model to quantitatively assess the seismic damage degree and evolution process of through-tenon joints in ancient timber structures. Dong et al. [35] designed a novel prefabricated frame joint, tested eight specimens under low-cycle reversed loading, and established a modified damage model suitable for prefabricated joints. Tao et al. [36,37,38], through six-story moment-resisting frame tests and the development of novel semi-rigid connections, demonstrated that concrete slabs can increase overall stiffness by 25% but require optimized connections to avoid abrupt stiffness changes; steel–timber hybrid joints reduced residual displacement by 35% through material complementarity, offering a new paradigm for high-rise timber–concrete structures.
Despite achievements in research on the mechanical performance of timber–concrete composite structures, studies on the seismic performance of connectors remain insufficient overall, with the following main issues: (1) Experimental studies on the low-cycle reversed loading behavior of connectors in timber–concrete composite structures are insufficiently systematic. Particularly, there is a lack of comparative experimental data on the influence of different connection types (e.g., notch-bolt connections and ordinary bolt connections) and key parameters (e.g., bolt size) on failure modes, hysteretic characteristics, and stiffness/strength degradation laws, hindering targeted analysis of connector seismic performance. (2) The analysis of the cumulative damage process of timber–concrete connectors under cyclic loading is inadequate. The corresponding relationship between the damage state of connectors and the cumulative damage factor has not been clearly established, and there is a lack of quantitative standards for damage early warning that can directly guide engineering practice. (3) Specific optimization suggestions for the seismic design of connectors in timber–concrete composite structures are lacking.
To comprehensively explore the seismic performance of connectors in timber–concrete composite structures, this paper undertakes the following research work: (1) Conducted low-cycle reversed loading push-out tests on 18 push-out specimens; (2) Discussed and analyzed the mechanical response, failure modes, hysteretic phenomena, and energy dissipation capacity of bolt connectors and notch-bolt connectors under low-cycle reversed loading; (3) Proposed a reliable damage model based on the mechanical response of connectors under low-cycle reversed loading and the corresponding test results; (4) Proposed specific suggestions for the seismic performance design and engineering application of timber–concrete composite structures, combining the results of experimental analysis and the damage model, to ensure higher durability and safety of the structure during seismic events and facilitate engineering application; (5) Verified the accuracy of the test results and conclusions by means of finite element analysis.
Through experimental research, theoretical analysis, and numerical simulation, this paper addresses the previous inadequacies in the research on hysteretic performance, cumulative damage laws, and seismic design of shear connectors under low-cycle reversed loading, providing a reference for seismic research on timber–concrete composite structures.

2. Experimental Investigation

Experimental investigations of bolted connector behavior can be conducted through two primary methodologies: push-out tests and flexural tests. For steel–concrete composite structures, the European Standard EC4 [39] provides standardized specifications for push-out test specimens. Considering the analogous load-transfer mechanisms between timber–concrete and steel–concrete composite systems, push-out testing represents the most appropriate method for evaluating the hysteretic performance of bolted connectors in timber–concrete applications. As shown in Figure 1, the standardized push-out specimen configuration consists of three key components: (1) a central timber member, (2) dual concrete flanges, and (3) shear connectors that mechanically couple these dissimilar materials.

2.1. Timber–Concrete Connection

To investigate the influence of bolt diameter and connection typology on the hysteretic performance of Timber–Concrete Composite (TCC) structures, this experimental program incorporated three bolt diameters and two connection configurations (bolted connection and notch-bolted connection), yielding six distinct test groups with three replicates per group (totaling 18 push-out specimens). The specimen geometry adhered to standardized push-out test protocols while integrating modifications informed by domestic and international research status and the specific characteristics of TCC structures. The concrete flanges employed C30-grade concrete, with coarse aggregate consisting of continuously graded crushed stone ranging from 7 to 33.4 mm and fine aggregate comprising medium sand. After 28 days of standard curing, the concrete compressive strength was tested according to specification [40]. The timber beam utilized Northeast China larch glulam with a moisture content of 10–12%. The timber’s compressive strength parallel to grain was tested in accordance with specification [41], using six small, defect-free specimens measuring 20 × 20 × 30 mm. The interfacial connection between the concrete slab and timber beam was achieved through bolt connectors with a shank length of 120 mm, a penetration depth into timber of 90 mm, a strength grade of 8.8, an ultimate tensile strength of 800 MPa, and a yield strength of 640 MPa. Specimen nomenclature follows the S-C-D convention, where “S” denotes the test specimen; “C” represents the connection typology (1: bolted, 2: notch-bolted), and “D” signifies the bolt diameter (12 mm, 16 mm, or 20 mm).
Dimensional specifications are detailed in Figure 1 and Table 1. Prior to conducting the push-out tests on the bolted connectors, comprehensive mechanical characterization of the constituent materials was performed, with test results summarized in Table 2.
Figure 2 shows the manufacturing process of the push-out specimen.

2.2. Test Configuration

The experimental setup is illustrated in Figure 3. A hydraulic actuator with a maximum loading capacity of 250 kN was employed to apply cyclic loads to the specimen through a reaction frame. To ensure loading symmetry and mitigate asymmetric loading effects, a steel alignment plate was incorporated. This configuration guaranteed stable and precise load application throughout testing.
The supporting system comprised a pair of high-strength bolts and a steel formwork. The bolts rigidly secured the timber component to the loading frame, while the steel formwork immobilized the concrete flanges relative to the foundation. This arrangement maintained fixed relative positions of all components during testing, preventing unwanted displacements that could compromise test integrity. The foundation was firmly anchored to the laboratory’s strong floor via two steel rods, ensuring system stability and reliable performance under cyclic loading conditions.

2.3. Loading Procedure

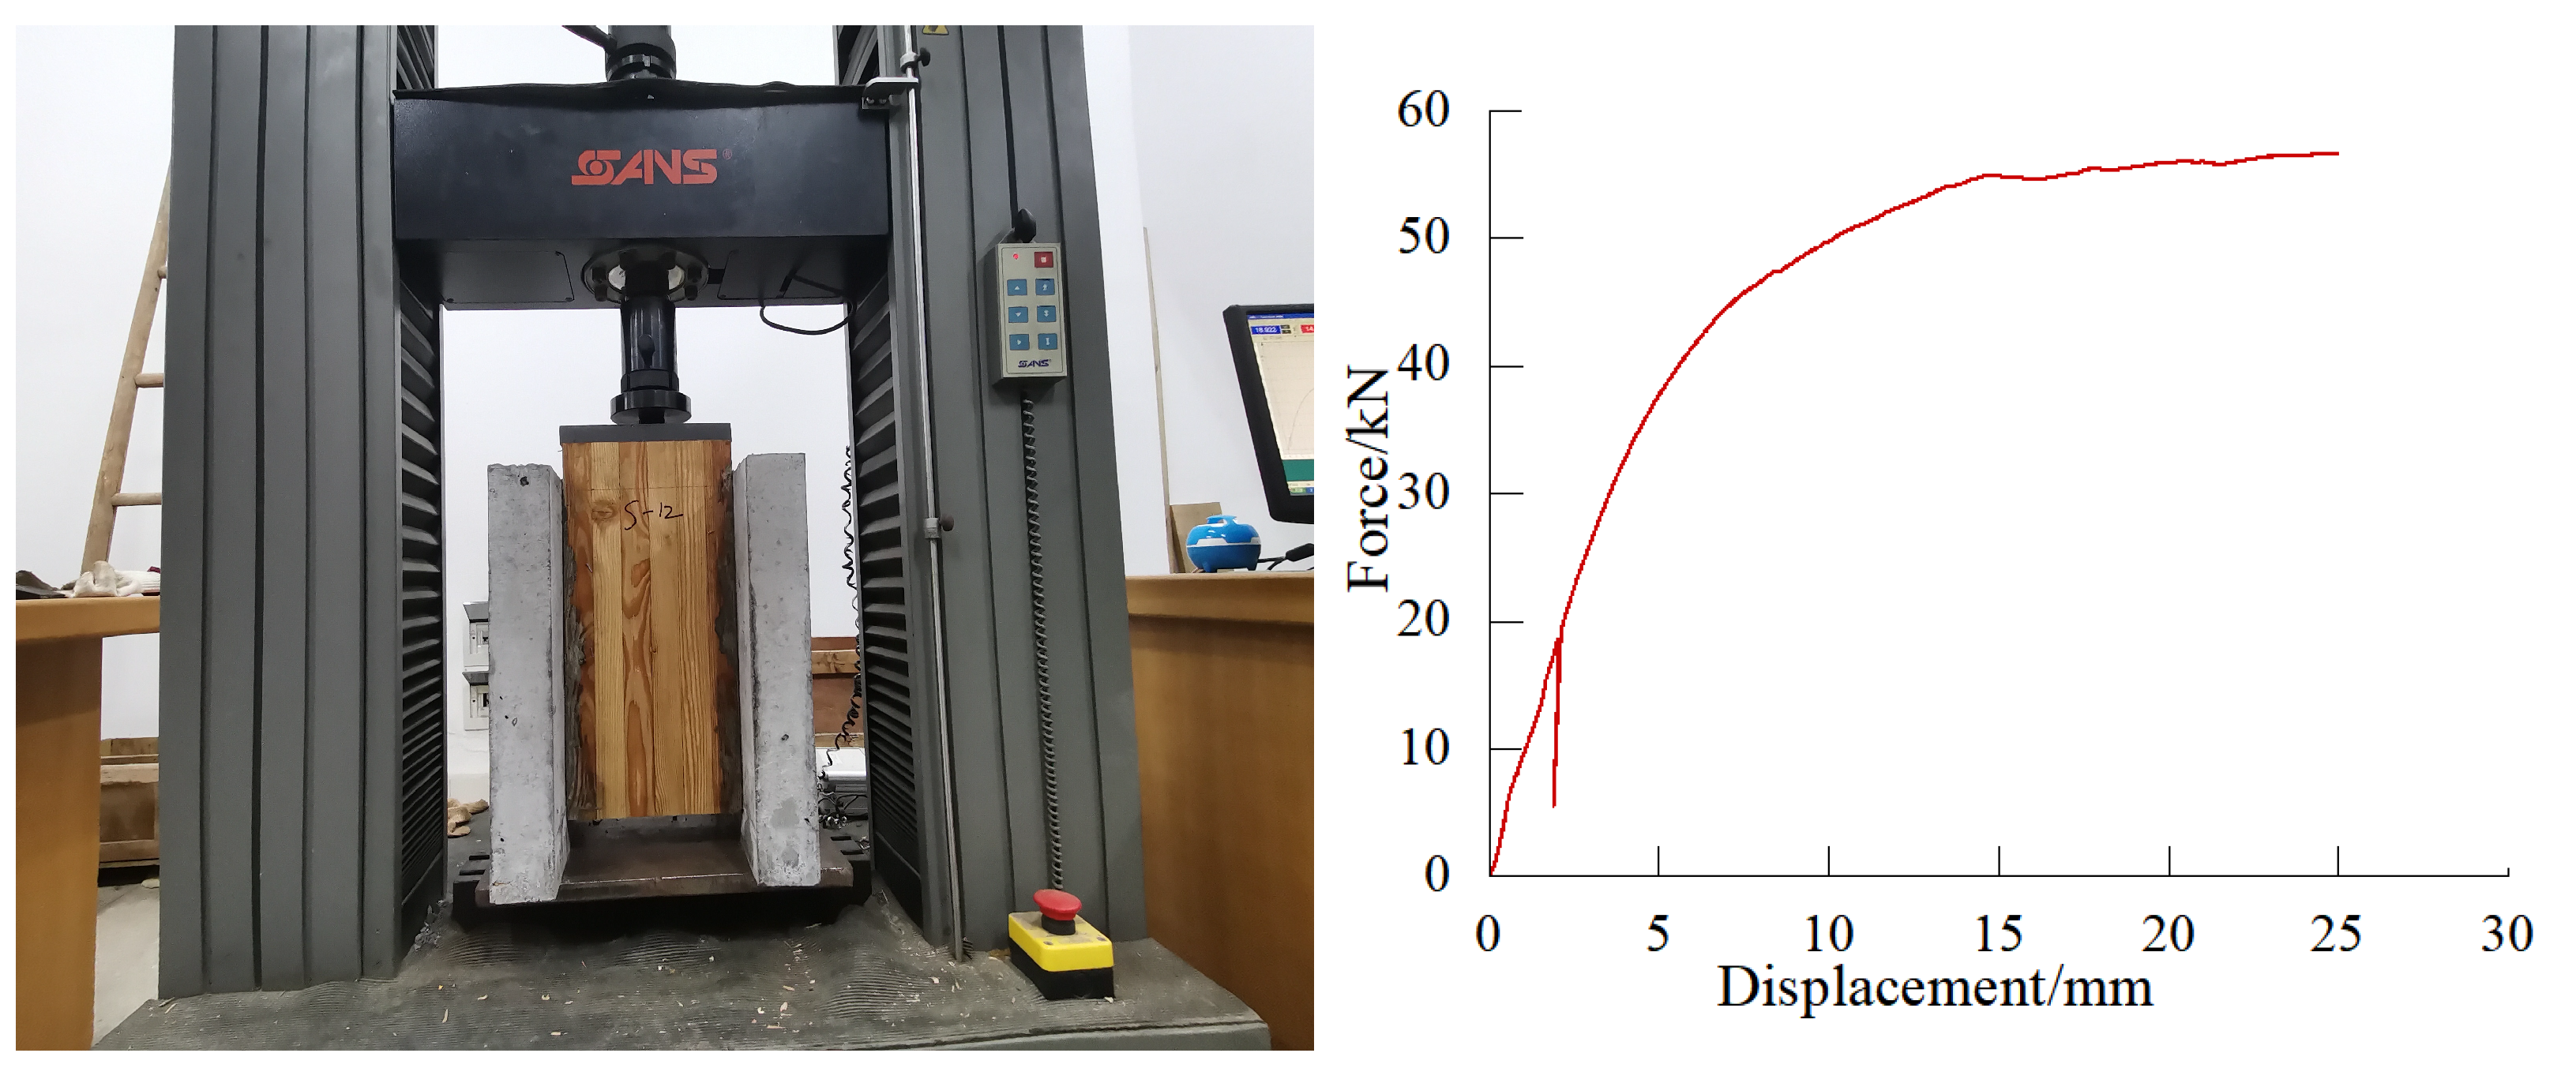
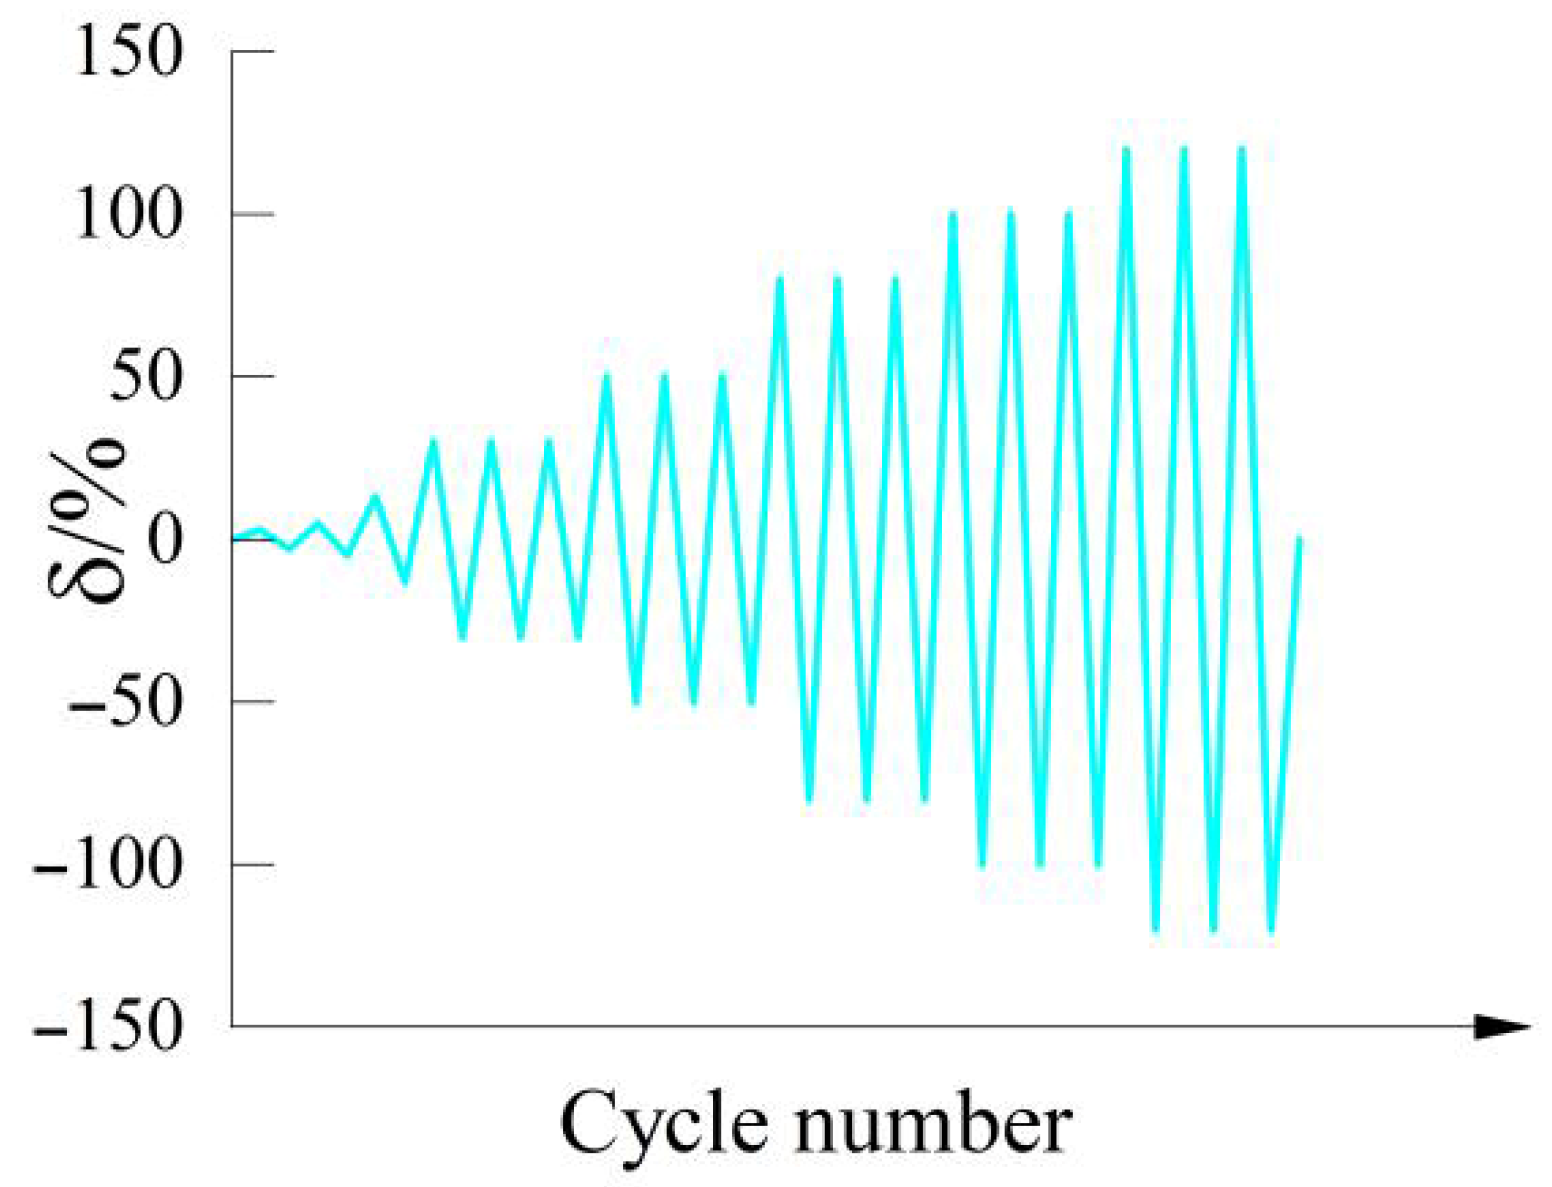
The cyclic loading protocol adhered to the following principles, as detailed in Table 3 and Figure 4. During the initial three loading cycles, displacement amplitudes were set to 3%, 5%, and 13% of the reference displacement (δ), respectively. Subsequently, equal-amplitude cyclic loading was sequentially applied at amplitudes corresponding to 30%, 50%, 80%, 100%, and 120% of δ. The reference displacement δ was defined as the displacement corresponding to 80% of the peak load observed on the post-peak descending branch of the force-displacement curve obtained from the monotonic loading test. Based on the results of the monotonic loading tests conducted in this study (see Appendix A), δ was determined to be 15 mm. The loading rate was maintained at 0.5 mm/s. Detailed information regarding the monotonic loading test is provided in Appendix A.

2.4. Failure Mode

Distinct failure modes were observed for the two connection types. For bolted connection specimens: Specimen S-1-12 exhibited an intact concrete slab but separation from the timber beam, accompanied by localized crushing of the timber surrounding the bolt holes (Figure 5a,g). This separation occurred prior to concrete failure due to progressive deformation of the bolts under load, attributable to their lower strength relative to the concrete slab. Specimens S-1-16 and S-1-20 displayed localized timber crushing near the bolts, concrete cracking, and separation of the concrete slab from the timber beam (Figure 5b,c,g).
For notch-bolted connection specimens (S-2-12, S-2-16, S-2-20), concrete slab separation from the timber beam occurred in all cases, accompanied by crushing of the concrete within the notches and cracking around the bolt holes (Figure 5d–f). The confinement provided by the notched concrete prevented localized timber crushing. A bolt shear fracture occurred in S-2-12 (Figure 5h), resulting from the bolt strength being lower than that of the adjacent confined concrete; the bolt sheared off at the ultimate load. Bolts in S-2-16 and S-2-20 exhibited no significant deformation (Figure 5i).
Analysis of the experimental results revealed that larger bolt diameters consistently increased the failure load for both connection types, confirming enhanced shear resistance. Furthermore, at identical bolt diameters, notch-bolted specimens exhibited higher failure loads than conventional bolted specimens. This performance improvement stems from the mechanics enabled by the notch: 1. The concrete within the notch forms a continuous encasement around the bolt. With an elastic modulus approximately 2.7 times higher than that of timber parallel to the grain, this encasement significantly enhances shear stiffness; 2. The concrete encasement suppresses timber crushing parallel to the grain through triaxial stress confinement; 3. Geometrically, the notch shifts the primary load-transfer mechanism from timber bearing perpendicular to grain to concrete bearing; 4. The triaxial confinement effect of the notched concrete generates radial compressive stresses, enhancing the local bearing strength of the timber.
Collectively, this mechanism optimizes the structural failure mode, transitioning it from brittle timber crushing to the more ductile plastic extrusion of concrete, resulting in a substantial theoretical capacity increase.

2.5. Hysteretic Curve

Hysteretic curves, depicting the load–deformation relationship of specimens under low-cycle reversed loading, provide critical insights into their mechanical behavior under cyclic loads [42]. These curves also serve as an indirect indicator of seismic performance. Generally, a fuller hysteresis loop signifies superior seismic resistance.
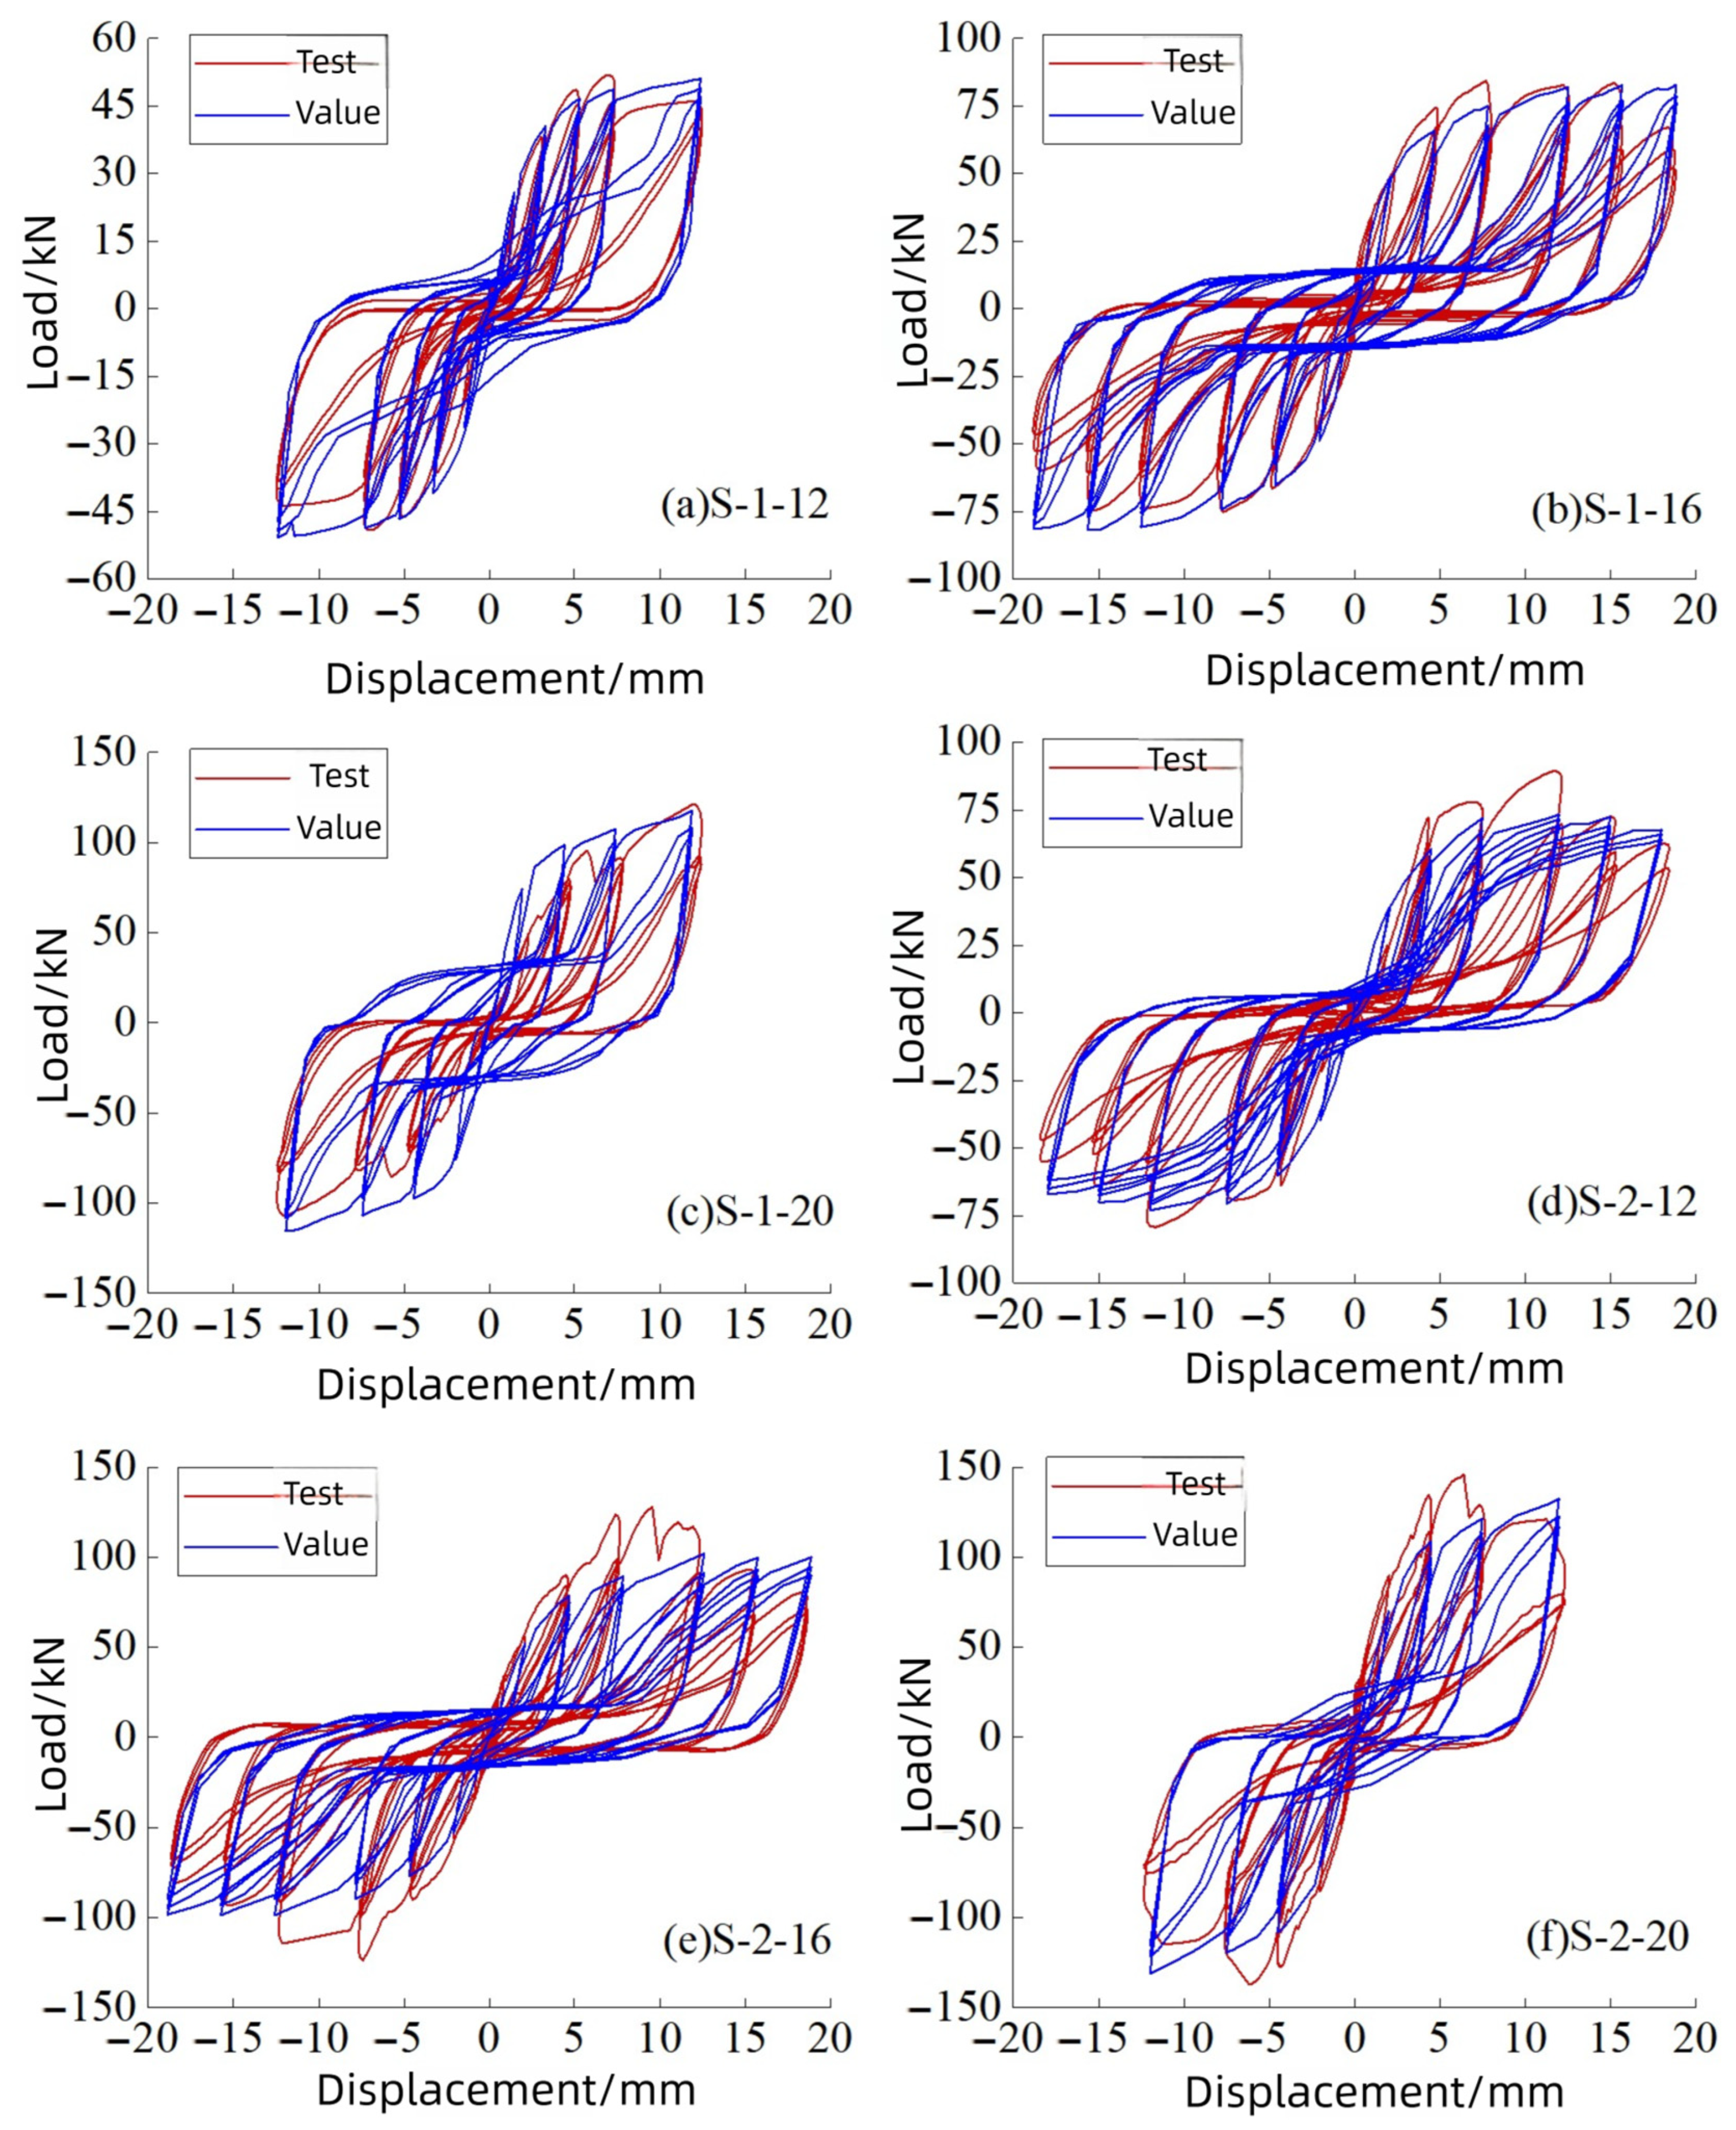
The hysteretic curves exhibited symmetry, characterized by an antisymmetric “S” shape with a pronounced pinching effect. This pinching indicates that the primary shear deformation mechanism involves crack propagation. During unloading/reloading phases (negative loading direction), cracks closed under relatively low loads, resulting in distinct pinching of the curves. The consistent slope progression across cycles suggested minimal residual deformation in the connectors at lower stress levels. In the initial loading stages, the small cyclic loads and the bonded state between the concrete slab and timber beam resulted in low connector forces, keeping the specimens within the elastic range. Consequently, no significant slip was observed; the curves remained relatively dense without noticeable pinching. As the load progressively increased, specimen stresses rose, leading to increasingly sparse hysteretic curves with distinct pinching. Upon connector yielding, the hysteresis loops gradually became fuller, signifying entry into the elastoplastic stage with progressively increasing slip and significant residual deformation.
Examination of the hysteretic curves for the six push-out specimens (Groups S-1 and S-2) revealed that specimens with 12 mm diameter bolts exhibited lower ultimate loads than those with 16 mm and 20 mm bolts. This demonstrates that increasing bolt diameter effectively enhances the ultimate bearing capacity of push-out specimens. Furthermore, as shown in Figure 6, notch-bolted connection specimens exhibited higher ultimate loads compared to standard bolted connection specimens with identical bolt diameters, primarily attributable to the reinforcing effect of the notches.

2.6. Skeleton Curves

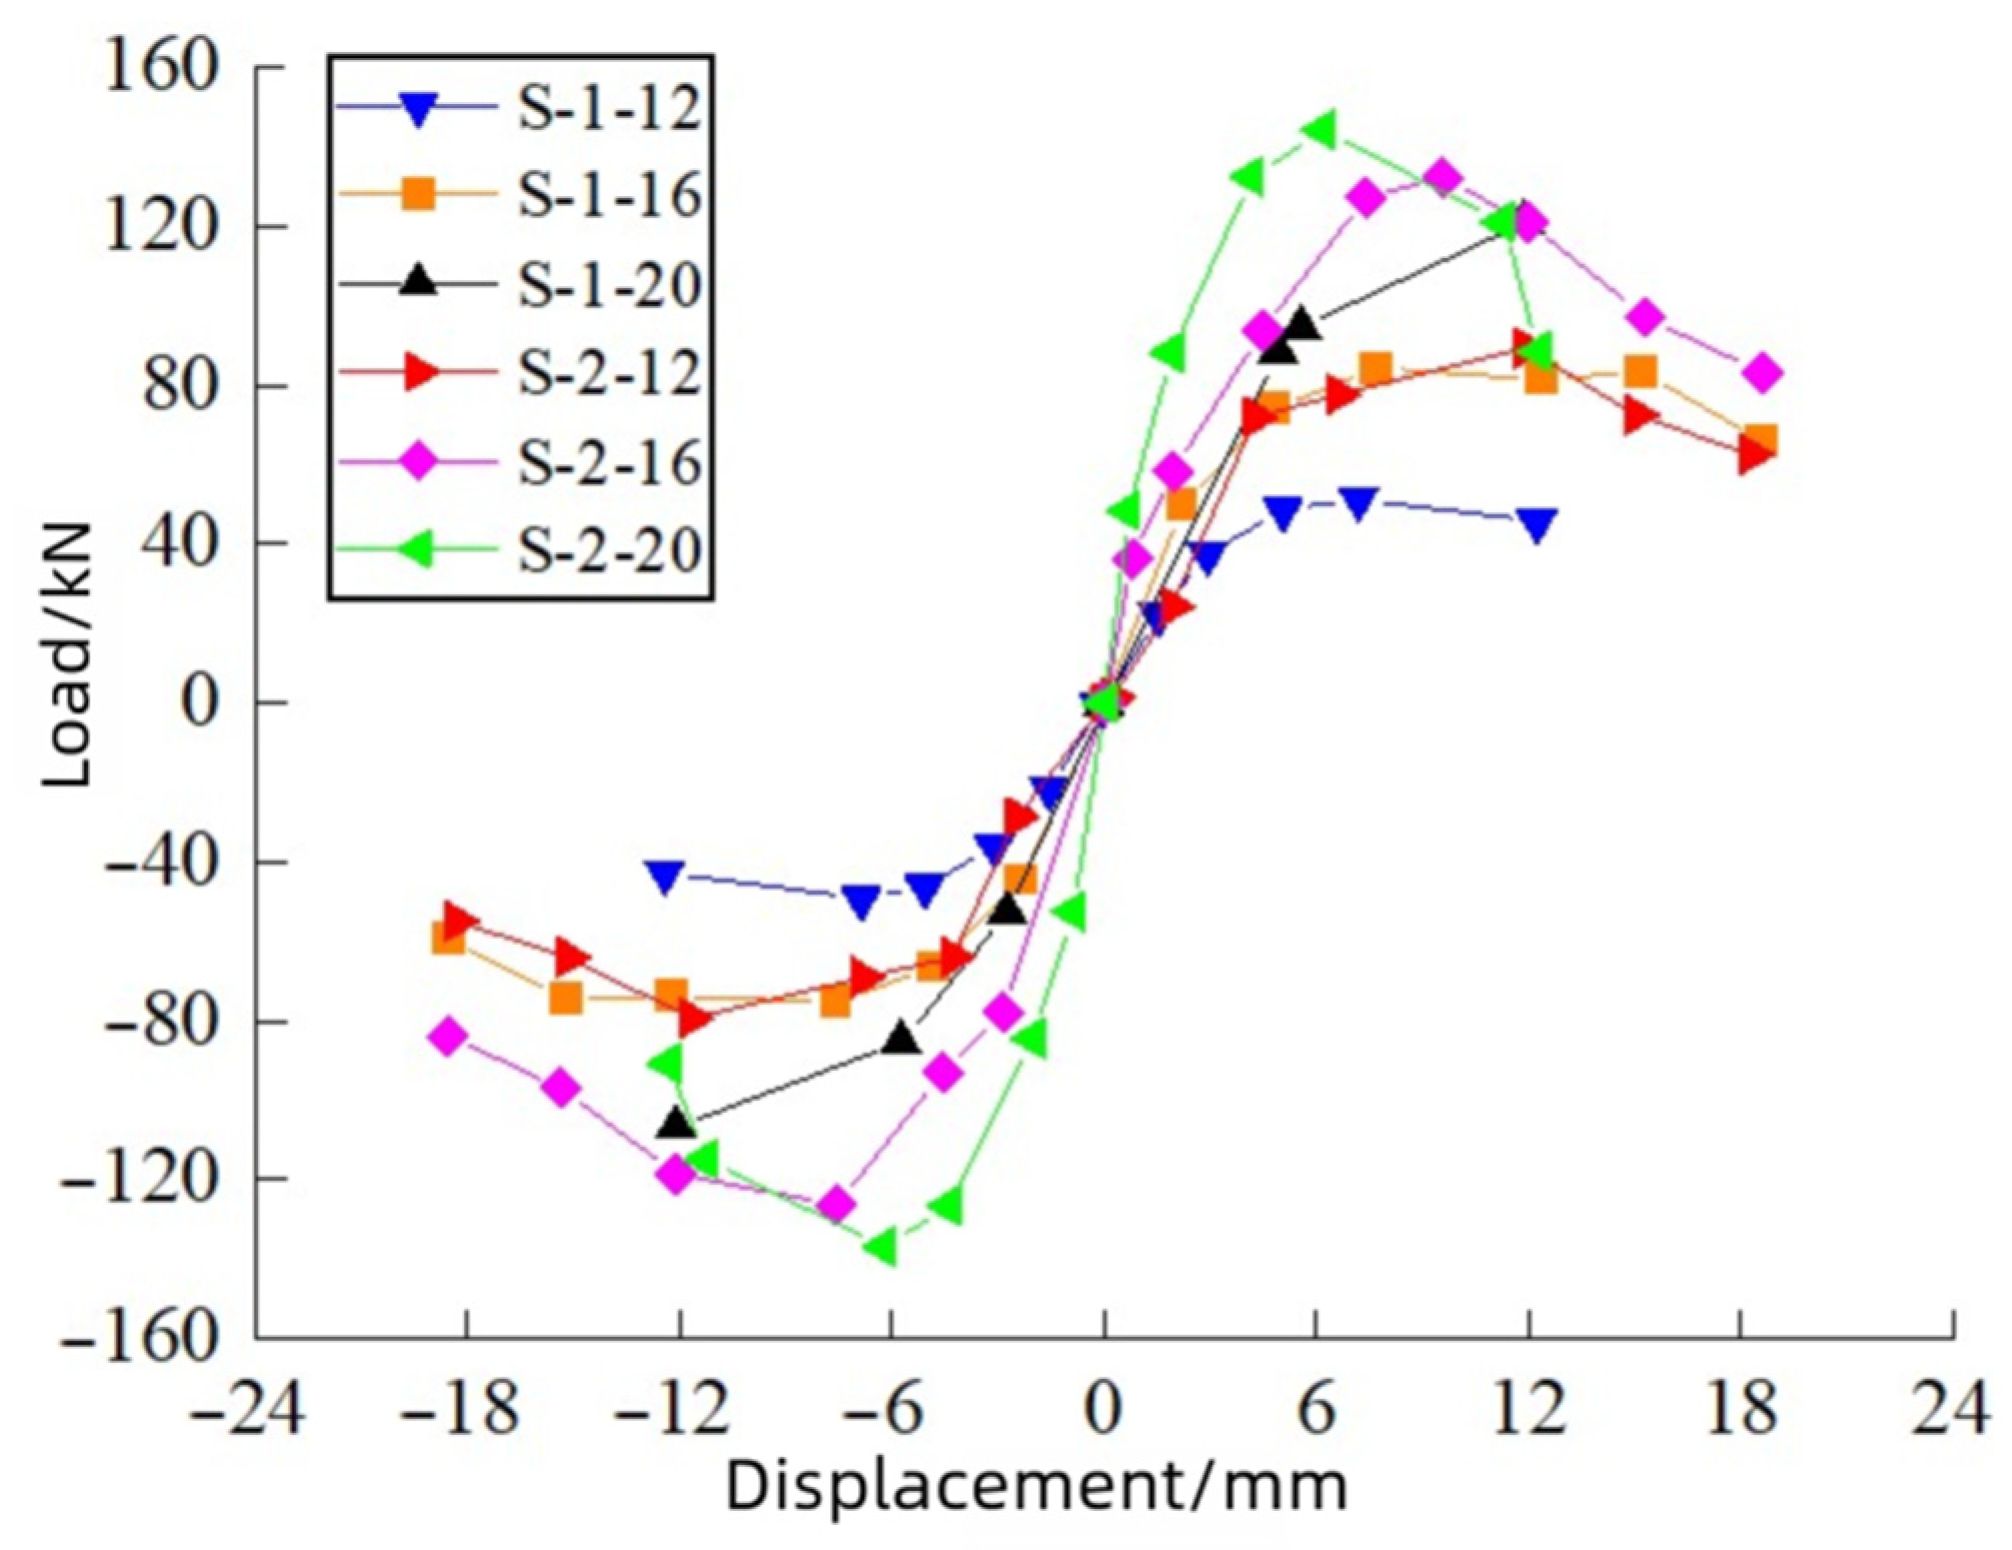
The skeleton curve, derived by sequentially connecting the peak load points attained during each cycle, serves as an envelope curve characterizing the mechanical property evolution of the push-out specimen throughout cyclic loading. As presented in Figure 7, the skeleton curves exhibit similar developmental trends, delineated into three distinct phases: elastic, plastic, and yielding/failure. During the initial elastic phase, the curve demonstrates a steep slope, signifying predominantly elastic deformation; hysteresis loops are minimal, and deformation is fully recoverable upon unloading. Upon entering the plastic phase, the curve slope diminishes, reflecting the onset of material nonlinearity. Localized crushing of timber fibers and concrete occurs adjacent to the bolts, reducing connection stiffness and resulting in residual deformation after unloading. Finally, in the yielding/failure phase, the curve slope becomes negative, indicating a decline in bearing capacity and ultimate failure.
Analysis of the six groups of curves in Figure 7 reveals that under otherwise identical conditions, increasing the bolt diameter significantly enhances the ultimate bearing capacity of the push-out specimens. This demonstrates that bolt diameter is a key parameter influencing the bearing capacity within the scope of this test. Furthermore, for a given bolt diameter, specimens with notch-bolted connections consistently exhibited higher bearing capacities compared to those with ordinary bolted connections.

3. Seismic Performance

Under cyclic loading, timber–concrete connections exhibit distinct hysteretic characteristics, including pinching effects, stiffness and strength degradation, and energy dissipation. This section provides an in-depth analysis of these key performance indicators.

3.1. Stiffness Degradation

Stiffness degradation describes the progressive reduction in structural or component stiffness with increasing displacement amplitude [43]. It is quantified using the secant stiffness (Ki) of the hysteresis loop, calculated as follows:
K i = F i + + | F i | | D i + | + | D i |
where Ki is the secant stiffness for the i-th hysteresis loop; F i + and F i are the peak loads in the positive and negative loading directions, respectively, and D i + and D i are the corresponding displacements.
The secant stiffness values calculated using Equation (1) are presented in Figure 8. All six specimen groups exhibited significant stiffness degradation with similar patterns, comprising three distinct stages: rapid degradation, slow degradation, and stabilization.
Comparing initial stiffness values revealed that specimens S-1-20 and S-2-20 exhibited 33.3% and 57.9% higher initial stiffness than S-1-12 and S-2-12, respectively. This demonstrates that increasing bolt diameter effectively enhances specimen initial stiffness. Furthermore, for a given bolt diameter, notch-bolted connections exhibited higher initial stiffness than ordinary bolted connections.
As cyclic loading progressed, connector stiffness decreased progressively, with a relatively large reduction amplitude. The stiffness values at failure were similar across all three bolt diameter groups, suggesting that while increasing bolt diameter or using notch-bolted connections improves initial stiffness and resistance to lateral slip, they have minimal effect on the residual stiffness at failure.

3.2. Strength Degradation

Strength degradation refers to the reduction in component strength under repeated loading cycles at a constant displacement amplitude [44]. It is defined as follows:
λ i = P i , 3 P i , 1
where λ i is the strength degradation coefficient at the i-th displacement amplitude level; P i , 1 and P i , 3 are the peak loads of the first and third hysteresis loops, respectively, at that amplitude level.
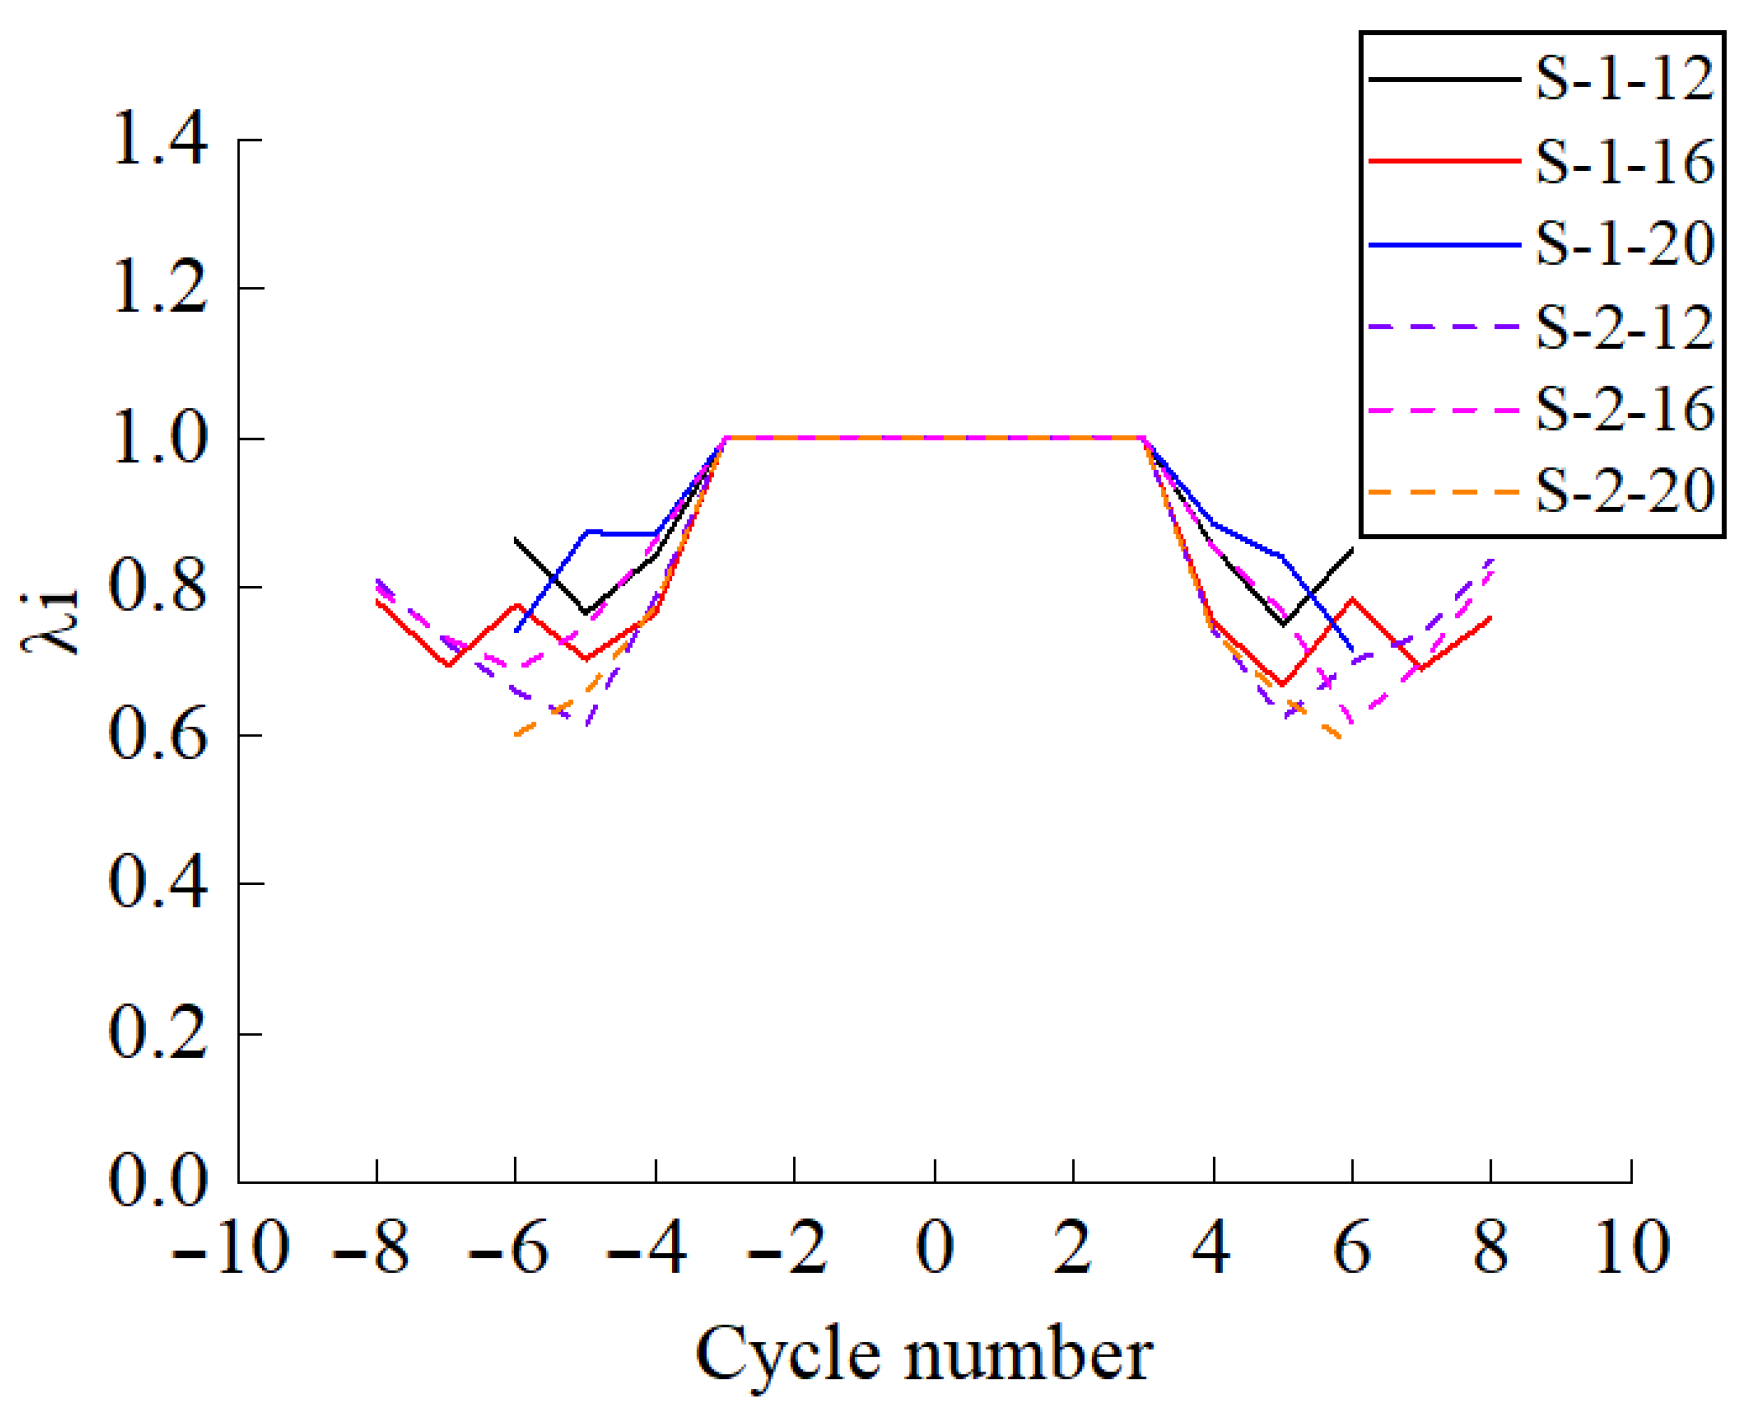
Figure 9 illustrates the strength degradation for all specimens. Strength degradation was generally symmetric in both loading directions. Degradation values remained at 1.0 during the first three loading stages, as only one hysteresis loop was generated per amplitude. Beyond these stages, the degradation coefficient fell below 1.0, exhibiting an initial decrease followed by a slight increase.

3.3. Energy Dissipation

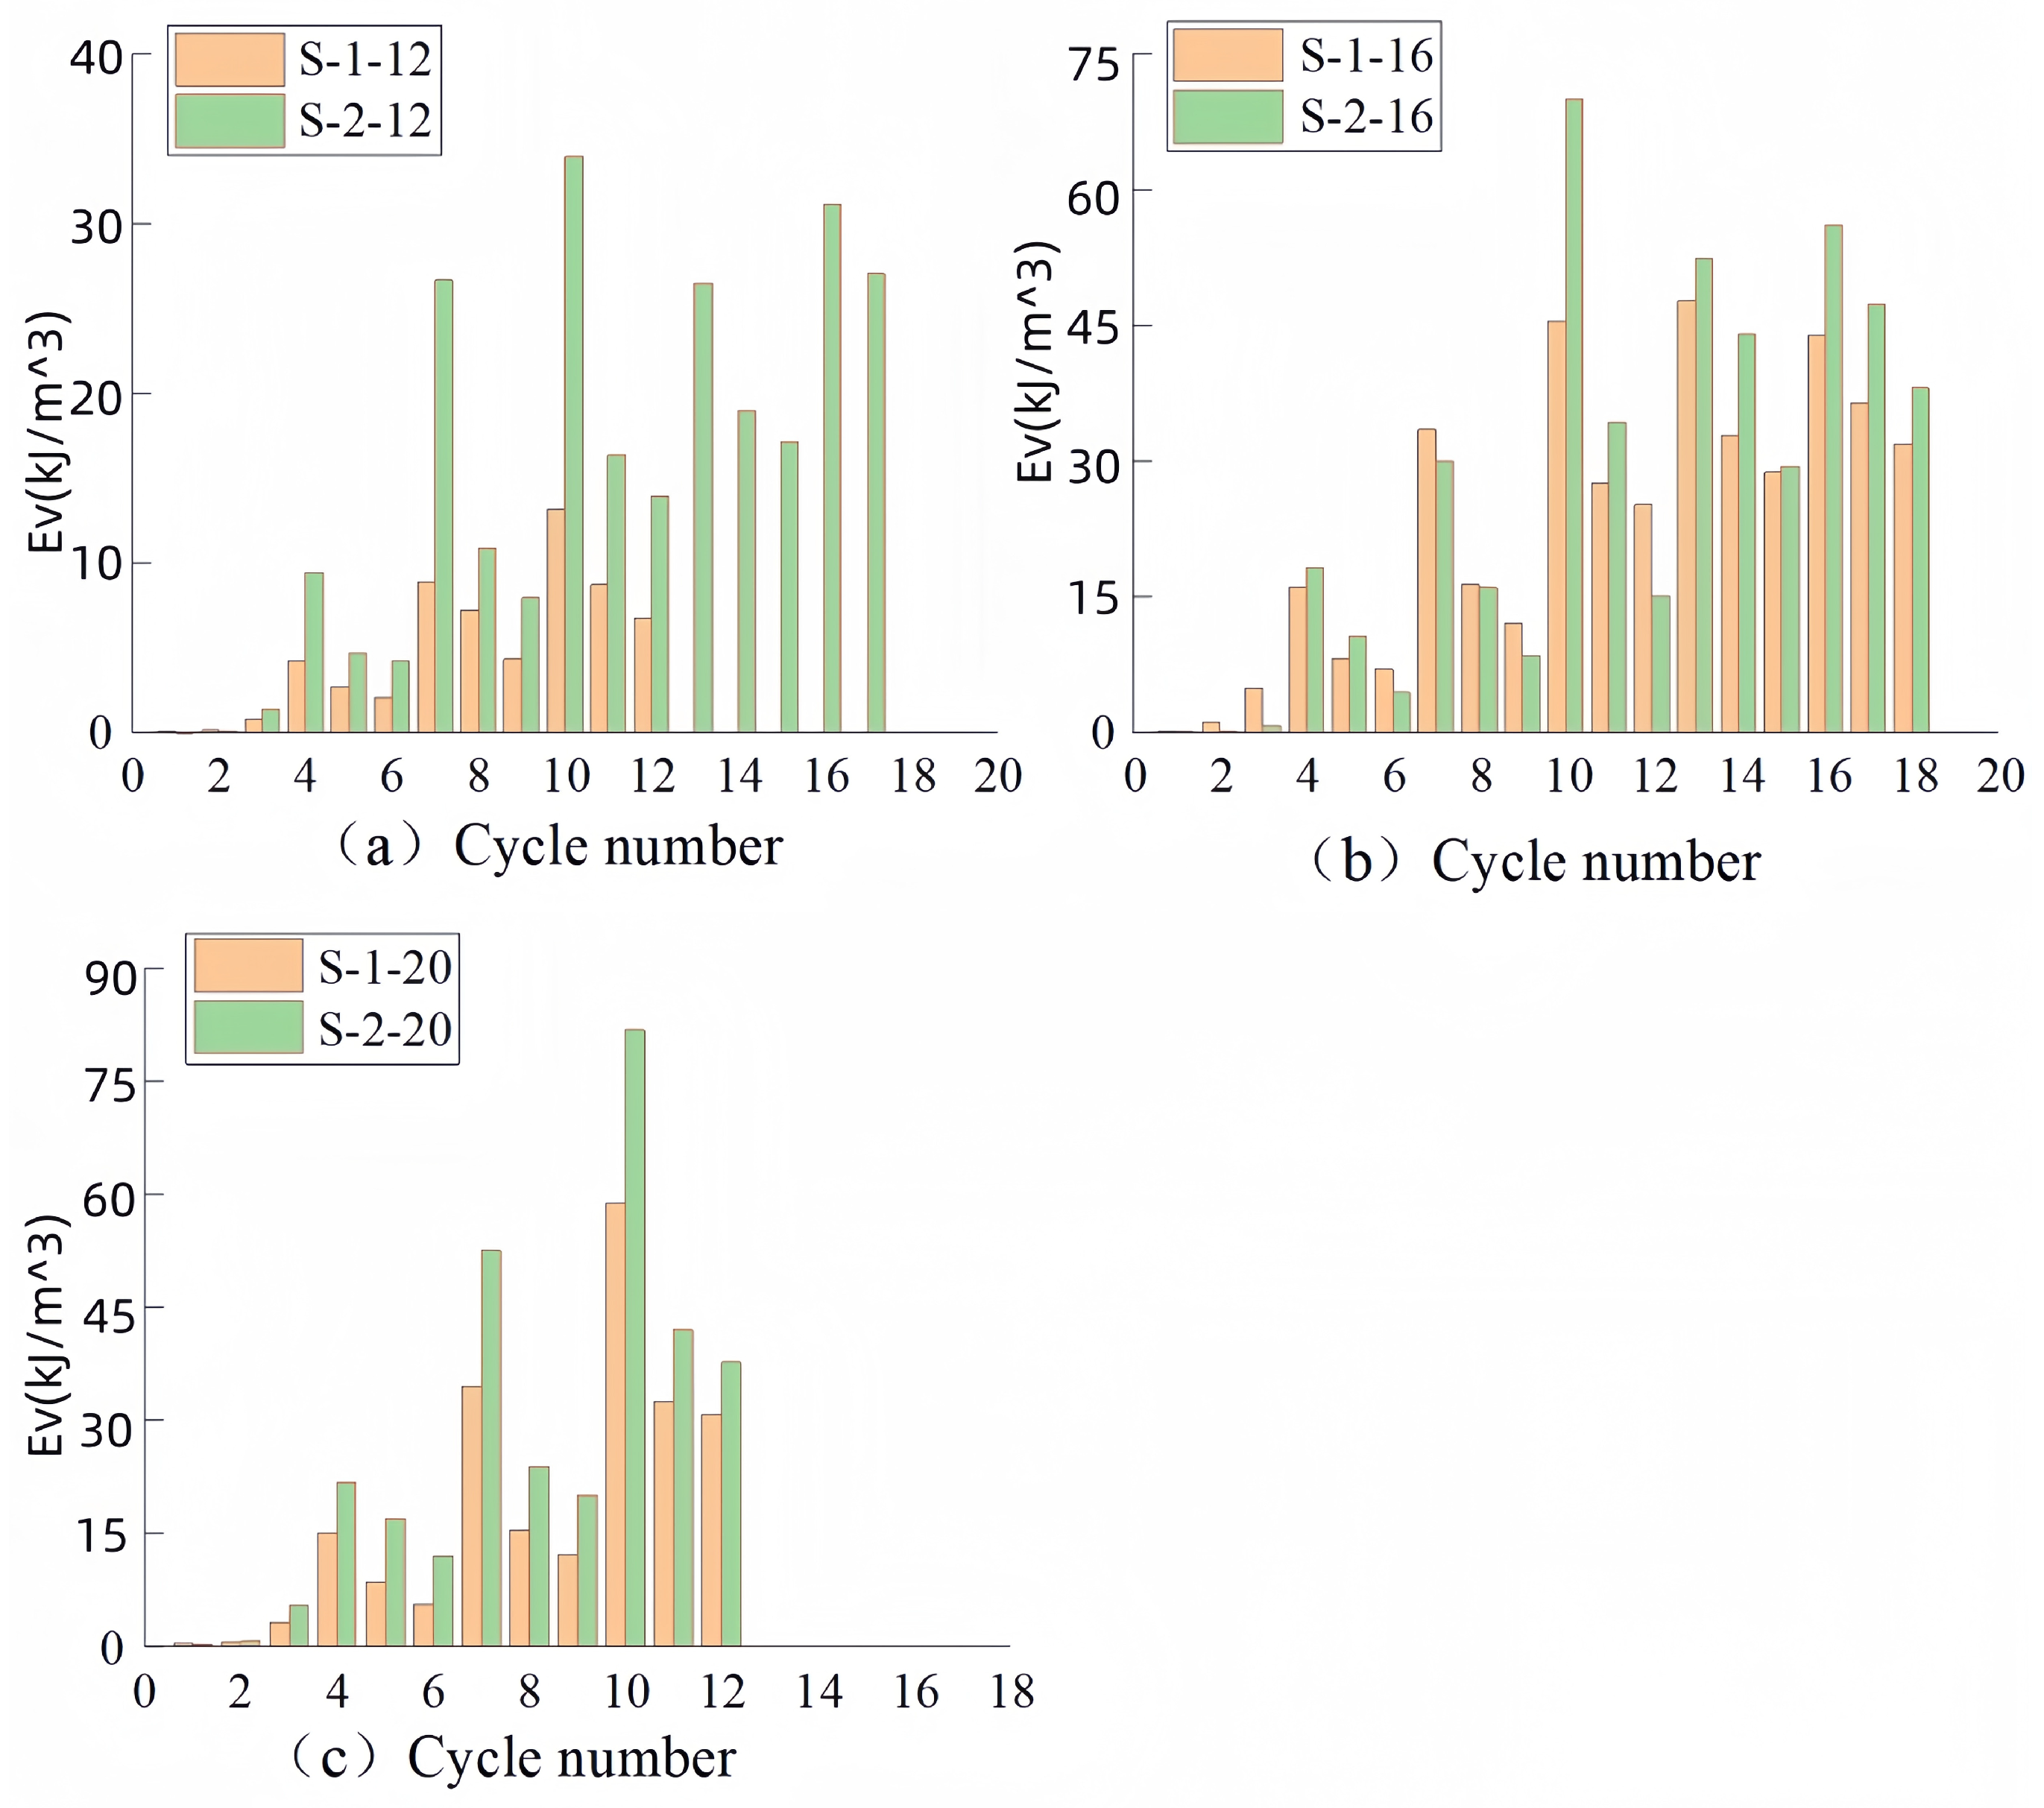
Energy dissipation capacity, characterized by the area enclosed within the hysteretic loop E, is a critical performance indicator. Figure 10 presents the volume-normalized energy dissipation density Ev (kJ/m3) for each specimen.
Due to premature failure, data for S-1-12 and S-2-20 were incomplete. Overall, notch-bolted connections dissipated more energy than ordinary bolted connections. For both connection types, energy dissipation increased with bolt diameter, indicating superior energy dissipation performance for notch-bolted connections. Energy dissipation was low during the initial loading cycles. Upon reaching the fourth cycle, dissipation increased significantly. Notably, for a given displacement amplitude, the first hysteresis loop dissipated more energy than subsequent loops. Energy dissipation primarily occurred through the deformation of timber and concrete surrounding the bolts.

3.4. Ductility

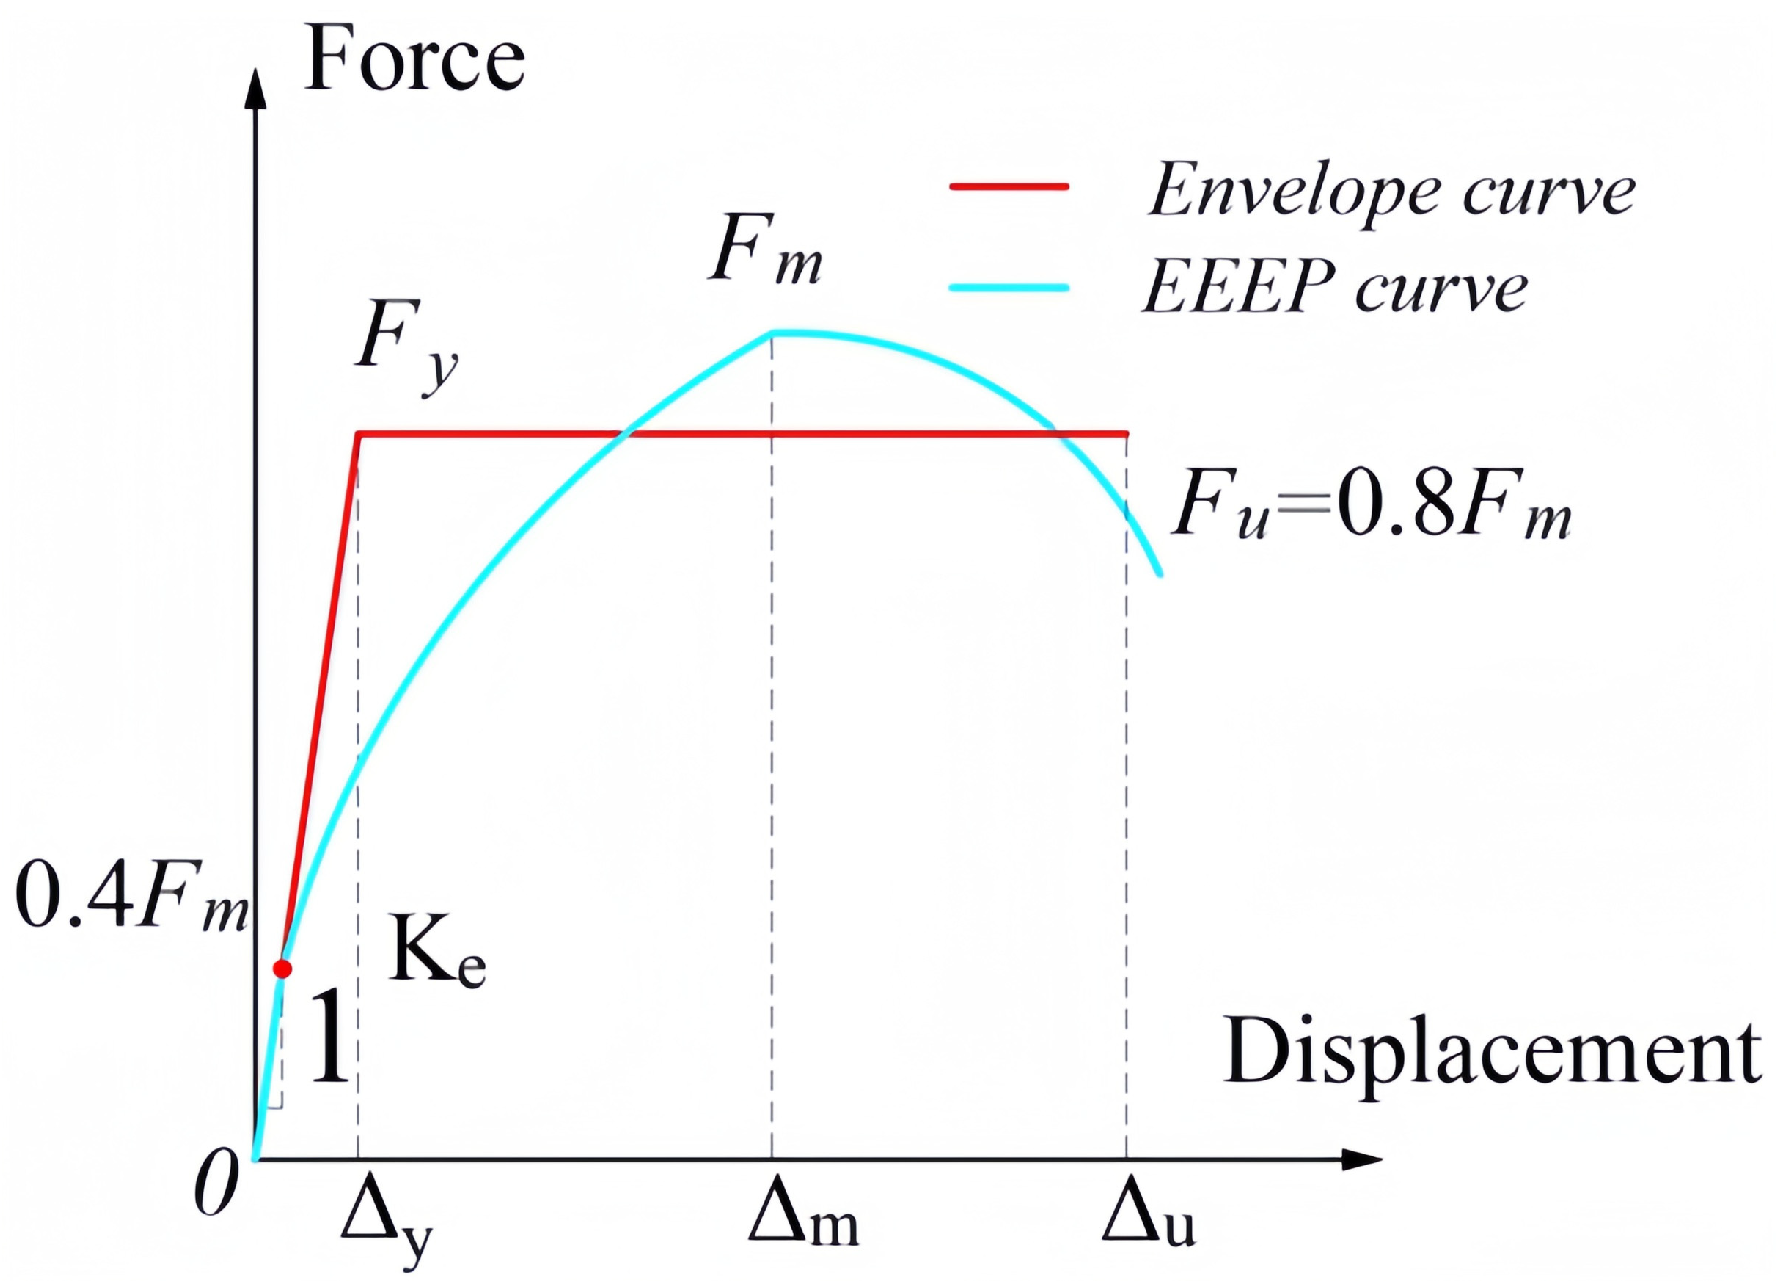
Ductility and elastic shear stiffness are fundamental parameters for assessing connection seismic performance. The ductility ratio ξ is defined as the ratio of ultimate displacement Δu to yield displacement Δyield. Here, Δu corresponds to the displacement at 80% of the maximum load Fmax on the post-peak descending branch [45]. The yield displacement Δyield was determined using the Equivalent Energy Elastic–Plastic (EEEP) curve method, as illustrated in Figure 11. The yield load Fyield represents the plateau value of the idealized bilinear curve and was calculated as follows:
F y i e l d = u u 2 2 A K e K e
where A is the area under the monotonic envelope curve from zero to Δu, and K e is the elastic shear stiffness, given by
K e = 0.4 F m a x e
where e is the displacement when the load is 0.4 F m a x ; F m a x denotes the peak force.
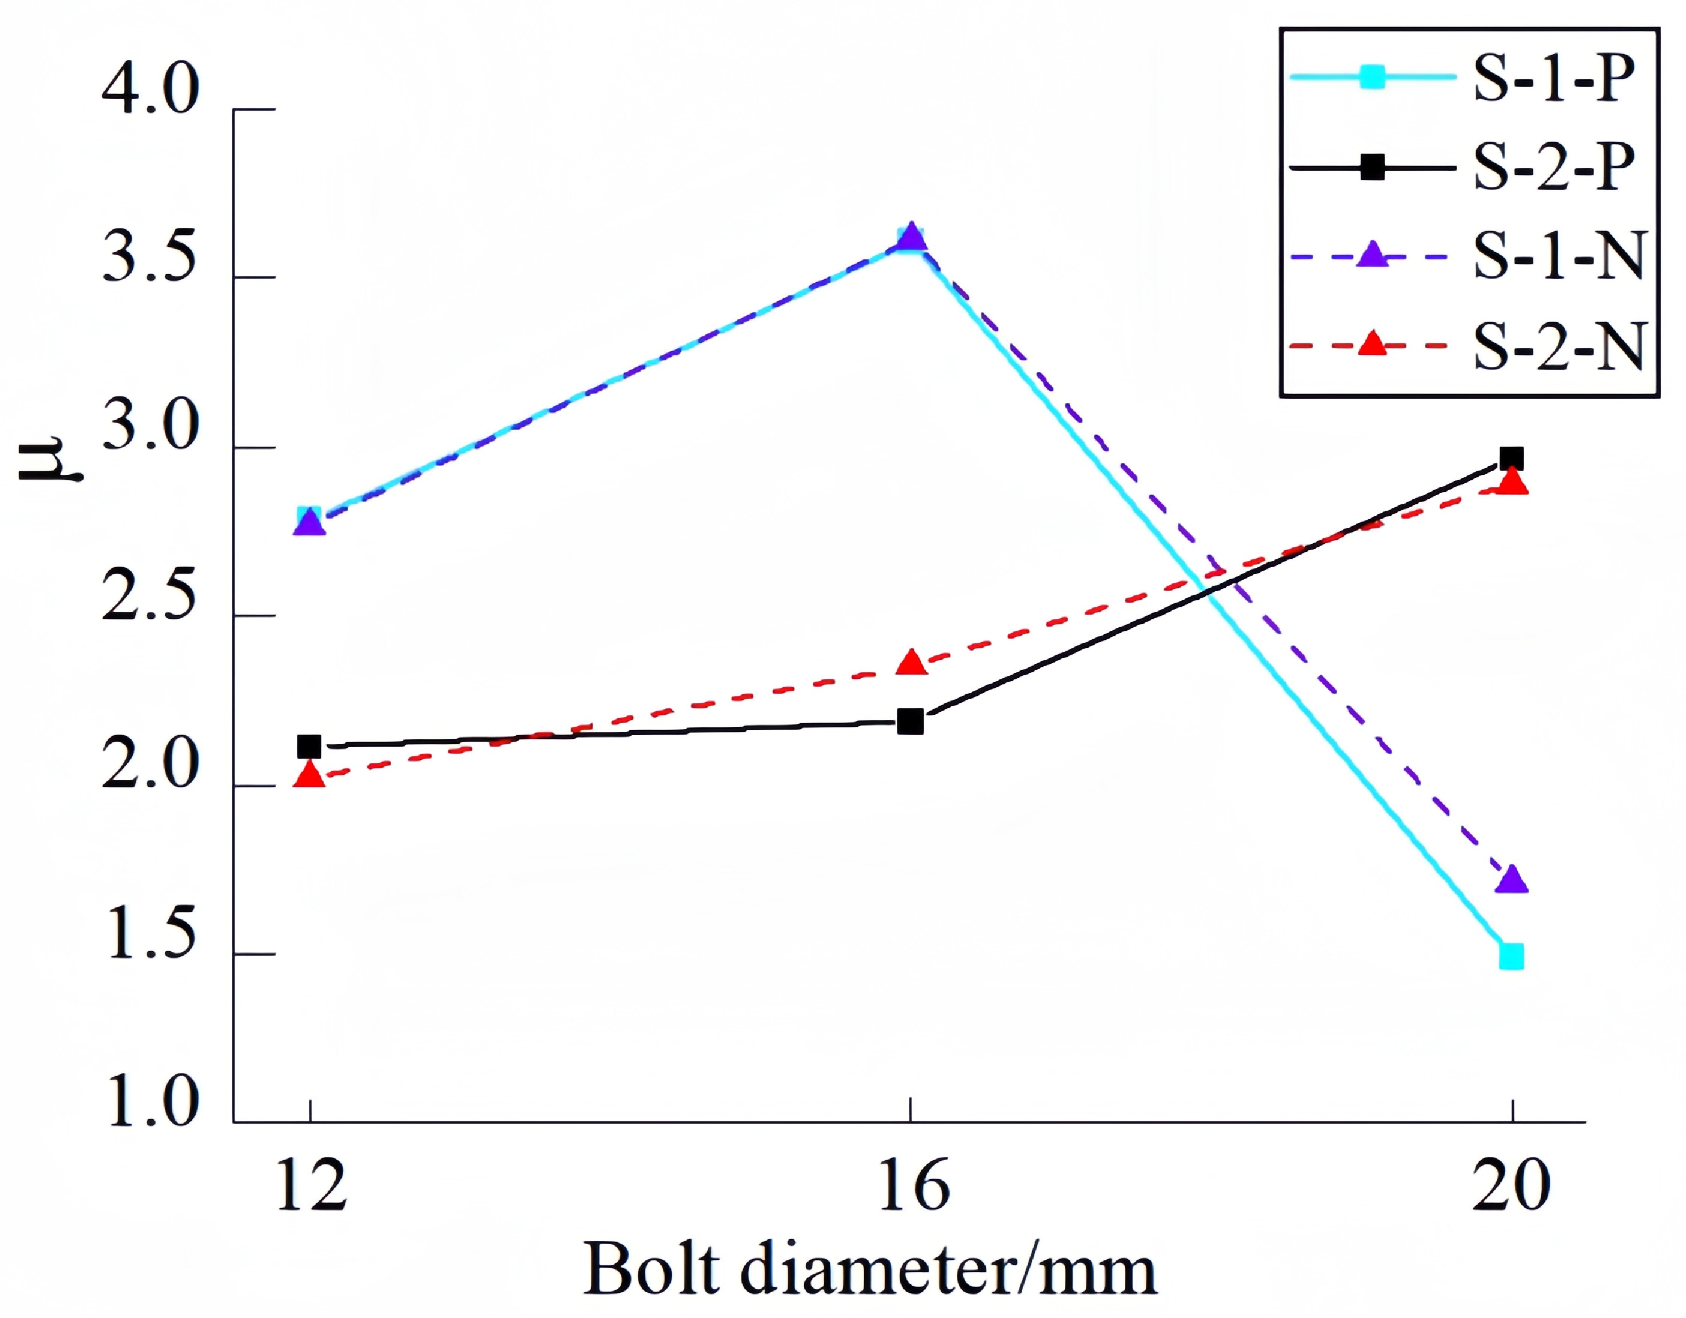
The calculated ductility ratios are shown in Figure 12 (S-1(2)-P/N denote positive/negative directions for ordinary/notch-bolted connections). Ductility ratios were similar in both loading directions. For ordinary bolted connections, ductility first increased and then decreased with bolt diameter, peaking for S-1-16 (ξ = 3.6). In contrast, notch-bolted connections exhibited stable ductility (2 < ξ < 3) regardless of bolt diameter. This difference arises because larger bolt diameters in ordinary connections induce stress concentration, promoting brittle timber failure and reduced ductility, consistent with the strength-ductility trade-off. The concrete confinement in notch-bolted connections mitigates stress concentration, resulting in stable ductility.
Table 4 compares yield displacement, peak load, elastic shear stiffness, and yield load. For a given connection type, both peak load and elastic shear stiffness increased with bolt diameter, with consistently higher values for notch-bolted connections. S-2-20 achieved the highest (Fm = 136.9 kN, Ke = 60.9 kN/mm), while S-1-12 exhibited the lowest (49.2 kN, 12.7 kN/mm). The relatively low elastic shear stiffness for S-1-20 is attributed to initial voids near the bolts in the concrete.
Overall, notch-bolted connections demonstrated superior performance, characterized by higher peak load, greater elastic shear stiffness, and favorable ductility.

4. Damage Accumulation Assessment

This section employs the energy-based cumulative damage assessment method proposed by Kraetzig et al. to evaluate the damage accumulation in the connection specimens. This method comprehensively considers cumulative damage effects and establishes a correlation between the damage index ( D w ) and the physical failure state of the connections.

4.1. Damage Assessment Principle

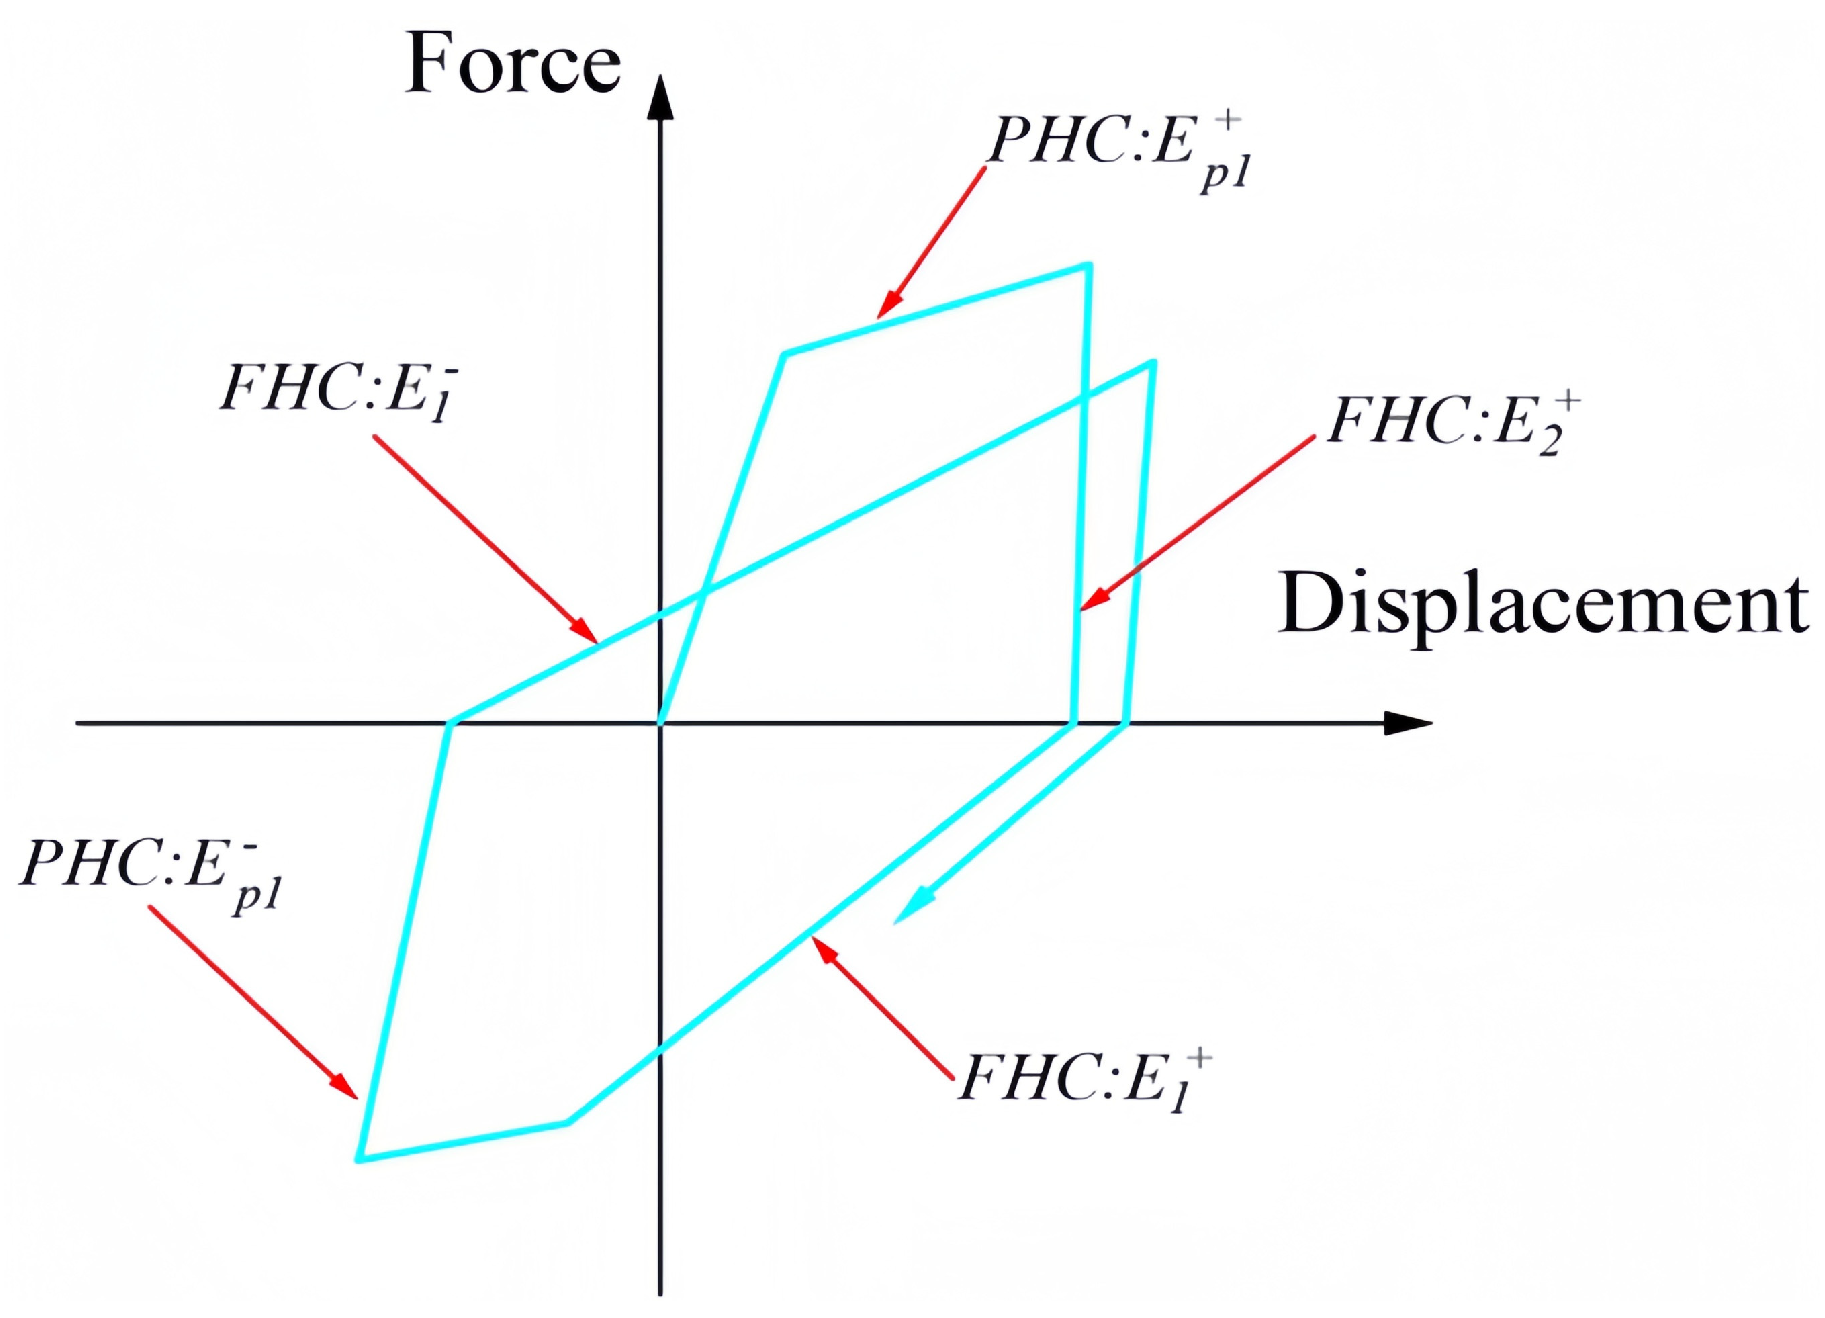
The assessment is conducted based on specific half-cycles within the hysteresis loops, distinguishing between deformation-type and fatigue-type damage. As illustrated in Figure 13, the initial half-cycle at a given displacement amplitude is termed the primary half-cycle (PHC), while the subsequent part of the cycle following the peak load is termed the follower half-cycle (FHC). The FHC primarily characterizes the degradation of stiffness and strength. The damage index for the positive portion of the hysteresis loop is defined as follows:
D + = E p , i + + E i + E f + + E i +
where E p , i + and E i + represent the energies in the primary half-cycle and the follower half-cycle, respectively; E f + represents the energy in a monotonic loading-to-failure test. Similarly, the damage index for the negative part of the hysteretic loop can be calculated using the same formula, with only the superscripts changed to negative signs (i.e., E p , i , E i , E f ). The overall damage index ( D w ) of a connection joint is determined by the following formula:
D W = D + + D D + D
where D + and D represent the damages in the positive and negative parts of the hysteretic loop, respectively, and D + D reflects the interaction between D + and D .
Using Equations (5) and (6), the overall damage indices for all six connection specimens were calculated at each displacement amplitude level. The results are presented in Figure 14. Generally, the damage index increases with increasing displacement amplitude. At small displacement amplitudes, the damage index is low. As the displacement amplitude increases, Dw approaches 1.0, and its rate of increase tends to slow down.

4.2. Physical Failure

For specimens S-1-16, S-2-12, and S-2-16, complete failure was defined as the point where the load dropped below 0.8Fmax after reaching the peak load Fmax [44]. Visual observations during testing confirmed that selecting 0.8Fmax corresponded well with the occurrence of concrete cracking and separation from the timber, validating this failure criterion. For specimens S-1-12, S-1-20, and S-2-20, complete failure was defined as the point where concrete cracks propagated through the entire concrete panel adjacent to the bolt hole. Based on these definitions, the physical failure descriptions and corresponding damage indices for Dwat failure are listed in Table 5.
For the ordinary bolted connections (S-1 series), the damage indices at failure ranged from 0.613 to 0.850. The notch-bolted connection specimens (S-2 series) exhibited damage indices at failure within a similar range (0.603 to 0.836). At Dw = 0.6, the failure probability based on these specimens is 100%. This threshold also aligns with conservative engineering principles for damage warning [46,47]. Therefore, for conservative design purposes, the critical damage index for connection failure is proposed as Dw = 0.6, corresponding to observable damage such as cracking at the connector location and (for ordinary bolted connections) timber crushing. While the proposed damage index prediction is necessarily limited to the specific connection types tested (common bolts or notch-bolts), it provides a valuable reference basis for assessing the performance and predicting the physical failure state of similar timber–concrete connection systems.

5. Finite Element Simulation

5.1. Framework of FEA Model

Nonlinear finite element simulations of the timber–concrete connections were conducted using the large-scale general-purpose finite element analysis (FEA) software ANSYS (Version 19.2). As illustrated in Figure 15, the three-dimensional eight-node solid element (SOLID65) was employed to simulate the cracking and crushing behavior of concrete. The three-dimensional twenty-node solid element (SOLID186) was assigned to model the timber and bolts, while the three-dimensional eight-node surface-to-surface contact element (CONTA174) was used in conjunction with the three-dimensional target element (TARGE170) to simulate the contact interactions between bolts and timber or concrete. The adhesion between timber and concrete was neglected in the model. The real constants for the CONTA174 element are listed in Table 6.
The numerical model adopted a displacement-controlled loading protocol. The solution process terminated upon convergence failure or material failure. Structured meshing techniques were employed for discretization, ensuring mesh conformity at contact interfaces. The mesh size for bolts was refined to approximately 4–9 mm, while stress-concentration zones, such as bolt holes in the concrete slab and timber beam, were meshed with similar refinement. The remaining regions of the concrete slab and timber beam were coarsely meshed with an element size of approximately 20 mm.
The constitutive behavior of materials was modeled as follows: for concrete: the multilinear kinematic hardening model was used to capture its nonlinear stress-strain response; for bolts: the bilinear isotropic hardening model was adopted to simulate their elastoplastic behavior; for timber: although timber exhibits orthotropic properties, it was simplified as an ideal elastoplastic material using the bilinear isotropic hardening model for computational efficiency [48]. Critical material parameters, derived from experimental tests, are summarized in Table 7. The constitutive relationships of the materials are depicted in Figure 16.
To replicate experimental boundary conditions, the bottom of the concrete was fixed, and lateral displacements were constrained. Cyclic displacements were applied to the top of the timber to simulate the loading process, and the reaction forces at the concrete base were extracted to construct the hysteretic curves.

5.2. FEA Results

5.2.1. Hysteretic Curves

Figure 17 compares the numerical and experimental hysteretic curves. The numerical model effectively captured the stiffness and strength degradation of the specimens. However, deviations were observed in simulating the pinching effect, primarily due to simplifications in material modeling and boundary conditions. For instance, the ideal elastoplastic assumption for timber neglected its post-yielding capacity loss, which contributed to the pinching effect in experiments.

5.2.2. Stress Contour

Figure 18 compares the experimental failure modes with the simulated stress contours predicted by the model. Overall, the model predictions exhibit substantial agreement with the experimental observations and effectively capture the stiffness and strength degradation characteristics of the connections. However, certain discrepancies are noted. For instance, the largest prediction error occurs for specimen S-1-20, where the model inadequately simulates the pronounced pinching effect observed in its hysteretic curve. This discrepancy is attributed to the formation of cavities in the timber surrounding the bolt during testing, leading to a near-complete loss of timber bearing capacity. In contrast, the model employs an ideal elastoplastic simplification for timber, which retains load-bearing capability post-yielding.
Stress level serves as a critical indicator for evaluating the seismic performance and identifying primary failure modes of the connections. Critical regions can be determined by identifying areas exhibiting high stress concentrations [49]. For clarity, Figure 18 presents the stress contours, specifically for specimens S-1-16 (representing common bolt connections) and S-2-16 (representing notch-bolted connections). The subfigures are denoted as follows: S-1-Concrete/S-2-Concrete: Concrete component stress contours for S-1-16 and S-2-16, respectively; S-1-Timber/S-2-Timber: Timber component stress contours for S-1-16 and S-2-16, respectively; S-1-Bolt/S-2-Bolt: Bolt stress contours for S-1-16 and S-2-16, respectively.
Analysis of the stress contours reveals the following:
(1)
Concrete: Both connection types (S-1-16 and S-2-16) exhibit similar high-stress regions concentrated near the bolt (Figure 18a,b), consistent with the locations of observed concrete cracking and crushing during testing;
(2)
Timber: Significant differences exist in timber stress distribution between the two connection types. For the common bolt connection (S-1-16), the high-stress region extends extensively throughout the timber surrounding the bolt (Figure 18c). For the notch-bolted connection (S-2-16), the stress concentration is markedly reduced compared to S-1-16, and the stress level remains below the timber’s compressive strength (Figure 18d). This explains the experimental observation that the timber in notch-bolted connections remained intact (Figure 5h), as evidenced by the lower simulated stress;
(3)
Bolts: The stress distributions within the bolts are similar for both connection types. In both cases, a plastic hinge forms near the mid-length of the bolt (Figure 18e,f).

6. Suggestions for Seismic Design and Engineering Applications

(1)
Prioritize the use of notch-bolted connections. Tests have shown that the ultimate bearing capacity of notch-bolted connections is 15% to 30% higher than that of ordinary bolted connections with the same diameter. Moreover, the restraining effect of concrete on timber prevents timber crushing (no timber crushing was observed in the tests), making this type particularly suitable for regions with seismic fortification intensity ≥ 7 or structures subjected to reversed loads (e.g., bridges and gymnasiums);
(2)
Energy Dissipation and Ductility Control. The tests revealed that notch-bolted connections exhibit superior energy dissipation capacity compared to ordinary bolted connections of the same diameter. However, for smaller diameters (12 mm and 16 mm), the ductility of notch-bolted connections is inferior to that of ordinary bolted connections. Therefore, for smaller bolt diameters, ordinary bolted connections are preferred, but large-diameter or high-strength bolts should be avoided due to their poor ductility. In the tests, 16 mm bolts demonstrated better ductility (ξ = 3.6) compared to 20 mm bolts. For larger bolt diameters, notch-bolted connections are recommended due to their more stable ductility performance;
(3)
Damage Early Warning and Maintenance. Embed wireless displacement sensors near the connectors to monitor post-earthquake residual slip in real time and predict the cumulative damage factor (Dw). An early warning should be issued when Dw reaches 0.6;
(4)
Comprehensive consideration of seismic energy dissipation, damage, ductility control, and economic efficiency suggests the adoption of partial shear connection design. However, for partial shear composite beams, rational static design of shear connectors is required to ensure optimal utilization of the composite beam’s bearing capacity.

7. Summary and Conclusions

(1)
The failure mode of bolted connection specimens is characterized by concrete crushing at bolt holes and timber crushing, while notch-bolted connection specimens fail due to concrete crushing at bolt holes. The hysteretic curves exhibit an antisymmetric “S” shape with significant pinching effects;
(2)
The bearing capacity of bolted connection specimens increases with bolt diameter. For notch-bolted connection specimens, the bearing capacity improves with increasing bolt diameter initially, but further increases in diameter do not enhance capacity. For the same bolt diameter, notch-bolted connection specimens exhibit higher bearing capacity than ordinary bolted connections;
(3)
As bolt diameter increases, the ductility of bolted connection specimens first rises and then declines, while notch-bolted specimens show no significant change in ductility. For specimens with the same bolt diameter, bolted connections exhibit slightly better ductility than notch-bolted connections;
(4)
An ANSYS numerical model of the specimens under low-cycle reversed loading was established. Comparative analysis between numerical simulations and experimental results confirmed that the model accurately captures stiffness and strength degradation, validating its reliability;
(5)
Based on cumulative damage analysis, a correlation between specimen damage and the cumulative damage factor (Dw) was established. When Dw < 0.6, the specimen sustains moderate damage with no obvious signs; when 0.6 ≤ Dw < 0.7, the specimen is severely damaged; and when Dw ≥ 0.7, the specimen fails. Adhering to conservative evaluation principles, the critical damage index for joint failure is uniformly set at 0.6 and serves as the design basis.
(6)
Drawing upon the findings of Refs. [36,50], this study demonstrates a significant reduction in seismic risk: notch-bolted connections reduced the inter-story drift angle by approximately 17%. Furthermore, real-time monitoring ensuring Dw < 0.6 enables effective control of the residual deformation rate below 15%, thereby reducing repair costs by up to 38%.
The in-depth study on the hysteretic performance of push-out specimens with bolted and notch-bolted connections in timber–concrete composite structures suggests the adoption of notch-bolted connectors in earthquake-prone areas to enhance seismic performance. The findings of this study provide a foundation for the application of timber–concrete composite structures in such regions.
However, this study has several limitations and directions for future research:
(1)
The low-cycle reversed loading tests were conducted only on specimens with bolt diameters of 12 mm, 16 mm, and 20 mm. Factors such as bolt penetration depth into timber, variable amplitude loads, multi-material combinations, and environmental influences were not considered. Moreover, the test data are relatively limited, and the notch type was restricted to circular notches. Thus, the conclusions lack universality;
(2)
The ANSYS numerical model employed simplifications, leading to deviations in simulating the pinching effects of hysteretic curves. Future numerical analyses could utilize more accurate timber constitutive models (e.g., ANISO) or refined elements (e.g., spring elements) to simulate bolt-concrete (or timber) interactions;
(3)
The conclusions are specific to Northeast China larch glulam. The performance of other timber species (e.g., spruce/pine) requires further validation;
(4)
The current quantitative findings are based on laboratory specimens. Practical building performance must be verified through integrated structural models;
(5)
To investigate the impact of high-cycle fatigue loads in seismic environments, future studies could explore coupled seismic-fatigue damage mechanisms;
(6)
Development of sensor-based early warning systems, with a focus on cost analysis and field deployment, is recommended.

Author Contributions

Conceptualization, Z.Z. and S.Y.; methodology, G.H.; software, Z.Z.; validation, Z.Z. and S.Y.; formal analysis, Z.Z. and S.Y.; investigation, S.Y.; resources, G.H.; data curation, G.H.; writing—original draft preparation, Z.Z.; writing—review and editing, S.Y. and G.H.; visualization, Z.Z.; supervision, G.H.; project administration, G.H.; funding acquisition, G.H. All authors have read and agreed to the published version of the manuscript.

Funding

This research was funded by [National Natural Science Foundation project of China] grant number [51478485] And The APC was funded by [National Natural Science Foundation project of China].

Conflicts of Interest

Author Zuen Zheng was employed by the company Hunan Provincial Transportation Science Research Institute Co., Ltd. The remaining authors declare that the research was conducted in the absence of any commercial or financial relationships that could be construed as a potential conflict of interest.

Appendix A

To determine the reference displacement (δ) during the loading process, a monotonic loading test was conducted on specimen S-1-12 in accordance with the British Standard BSEN26891 [51]. The test process and results are shown in Figure A1, based on which the reference displacement (δ) was determined to be 15 mm.
Figure A1. The monotonic test process and results.
Buildings 15 03084 g0a1

References

  1. Bjertnaes, M.A.; Malo, K.A. Wind-induced motions of “Treet”-A 14-storey timber residential building in Norway. In Proceedings of the World Conference on Timber Engineering, Quebec City, QC, Canada, 10–14 August 2014. [Google Scholar]
  2. Flatscher, G.; Schickhofer, G. Life Cycle Tower—High-rise buildings in timber. In Proceedings of the ASCE Structures Congress, Chicago, IL, USA, 29–31 March 2012; pp. 1980–1990. [Google Scholar]
  3. Mohammad, M. Canada’s Tall Wood Buildings Demonstration projects. In Proceedings of the World Conference on Timber Engineering, Seoul, Republic of Korea, 20–23 August 2018. [Google Scholar]
  4. Ceccotti, A. Composite concrete-timber structures. Prog. Struct. Eng. Mater. 2002, 4, 264. [Google Scholar] [CrossRef]
  5. Yeoh, D.; Fragiacomo, M.; De Franceschi, M.; Buchanan, A.H. Experimental tests of notched and plate connectors for LVL-concrete composite beams. J. Struct. Eng. 2011, 137, 261–269. [Google Scholar] [CrossRef]
  6. Deng, K.; Pan, P.; Su, Y.; Xue, Y.; Dong, H. Behaviour insights on damage-control composite beam-to-beam connections with replaceable elements. J. Constr. Steel Res. 2023, 211, 108174. [Google Scholar]
  7. Wang, Z.; Zhang, A.; Li, S.; Liu, X. An experimental study of steel-concrete composite connections equipped with fuse angles. Eng. Struct. 2022, 270, 114848. [Google Scholar]
  8. Chen, X.; Li, H.; Wang, Y. Fatigue enhancement of bolted timber connections using composite reinforcements: Experimental and numerical analysis. Compos. Struct. 2023, 117, 105979. [Google Scholar]
  9. Rasmussen, P.K.; Sørensen, J.H.; Hoang, L.C.; Feddersen, B.; Larsen, F. Notched connection in timber-concrete composite deck structures: A literature review on push-off experiments & design approaches. Constr. Build. Mater. 2023, 397, 131761. [Google Scholar]
  10. Estévez-Cimadevila, J.; Martín-Gutiérrez, E.; Suárez-Riestra, F.; Vázquez-Rodríguez, J.; Otero-Chans, D. Timber-concrete composite structural flooring system. J. Build. Eng. 2022, 49, 104078. [Google Scholar] [CrossRef]
  11. Tao, H.; Yang, H.; Liu, W.; Wang, C. Mechanical behavior of crossed inclined coach screw shear connections for prefabricated timber-concrete composite structures. J. Build. Struct. 2022, 43, 164–174. [Google Scholar]
  12. Xie, L. Shear Property of Timber-Concrete Composite Structure with Nail Type Connectors. Ph.D. Thesis, Central South University of Forestry and Technology, Changsha, China, 2017. (In Chinese). [Google Scholar]
  13. Fragiacomo, M.; Amadio, C.; Macorini, L. Short-and long-term performance of the “Tecnaria” stud connector for timber-concrete composite beams. Mater. Struct. 2007, 40, 1013–1026. [Google Scholar] [CrossRef]
  14. Fernandez-Cabo, J.L.; Arriaga, F.; Majano-Majano, A.; Iñiguez-González, G. Short-term performance of the HSB® shear plate-type connector for timber–concrete composite beams. Constr. Build. Mater. 2012, 30, 455–462. [Google Scholar] [CrossRef]
  15. Auclair, S.C.; Sorelli, L.; Salenikovich, A. A new composite connector for timber-concrete composite structures. Constr. Build. Mater. 2016, 112, 84–92. [Google Scholar] [CrossRef]
  16. Du, H.; Hu, X.; Wang, H.; Zhang, J.; Sun, Z. Study on shear performance of oblique screw connectors in glulam-concrete composite structures. J. Build. Struct. 2020, 41, 191–200. [Google Scholar]
  17. Aldi, P.; Kuhlmann, U. Fatigue strength of timber-concrete-composite bridges: Determination of a s-n-line for the grooved connection and the “x-connector”. In Proceedings of the World Conference on Timber Engineering: WCTE, Riva Del Garda, Italy, 20–24 June 2010. [Google Scholar]
  18. Balogh, J.; Fragiacomo, M.; Gutkowski, R.M.; Fast, R.S. Influence of repeated and sustained loading on the performance of layered wood–concrete composite beams. J. Struct. Eng. 2008, 134, 430–439. [Google Scholar] [CrossRef]
  19. Yeoh, D.; Fragiacomo, M.; Carradine, D. Fatigue behaviour of timber-concrete composite connections and floor beams. Eng. Struct. 2013, 56, 2240–2248. [Google Scholar] [CrossRef]
  20. Yeo, K.J.T.; Yeoh, D.E.C. Stiffness and strength degradation of timber concrete composite under fatigue loading. IOP Conf. Ser. Mater. Sci. Eng. 2020, 713, 012024. [Google Scholar] [CrossRef]
  21. Zhang, R.; Liu, T.; Kim, S. Machine learning-based damage prediction for bolted joints under seismic loads via digital twin technology. Buildings 2024, 15, 579. [Google Scholar]
  22. Cao, Y.M.; Peng, L.N.; Chen, Z.A. Dynamic response of wood-hybrid beam bridge under seismic wave action. Hunan Transp. Sci. Technol. 2018, 45, 123–125. [Google Scholar]
  23. Hossaina, A. Cross-laminated timber connections assembled with a combination of screws. Eng. Struct. 2018, 168, 1–11. [Google Scholar] [CrossRef]
  24. Aranha, C.A. Finite element modelling of cyclic behaviour of CLT connectors. In Proceedings of the World Conference on Timber Engineering, Vienna, Austria, 22–25 August 2016; pp. 3501–3508. [Google Scholar]
  25. Sullivan, K.; Miller, T.H.; Gupta, R. Behavior of cross-laminated timber diaphragm connections with self-tapping screws. Eng. Struct. 2018, 168, 505–524. [Google Scholar] [CrossRef]
  26. Loss, C.; Marchetti, A.; Pessina, S. Numerical study of alternative seismic-resisting systems for CLT buildings. Buildings 2018, 8, 162. [Google Scholar] [CrossRef]
  27. Ling, Z.B. Bond-Anchorage and Seismic Behaviors of Glulam Joints with Glued-In Rods. Ph.D. Thesis, Southeast University, Nanjing, China, 2015. (In Chinese). [Google Scholar]
  28. Zheng, W.; Lu, W.; Liu, W. Lateral loading behavior of glulam frame-midply hybrid lateral systems. Constr. Build. Mater. 2019, 220, 53–63. [Google Scholar] [CrossRef]
  29. Schneider, J.; Karacabeyli, E.; Popovski, M. Damage assessment of connections used in cross-laminated timber subject to cyclic loads. J. Struct. Eng. 2014, 141, 04014188. [Google Scholar] [CrossRef]
  30. Cao, J.; Xiong, H.; Wang, Z. Experimental investigation and numerical analysis for concrete-CLT connections. Constr. Build. Mater. 2020, 223, 111118. [Google Scholar] [CrossRef]
  31. Cao, J.; Xiong, H.; Zhang, F.L. Bayesian model selection for the nonlinear hysteretic model of CLT connections. Eng. Struct. 2020, 223, 111118. [Google Scholar] [CrossRef]
  32. Shahnewaz, M.; Pan, Y.; Shahria Alam, M.; Tannert, T. Seismic fragility estimates for cross-laminated timber platform building. J. Struct. Eng. 2020, 146, 04020256. [Google Scholar] [CrossRef]
  33. Žarnić, R.; Rajčić, V.; Kržan, M. Response of laminated glass-CLT structural components to reverse-cyclic lateral loading. Constr. Build. Mater. 2020, 235, 117509. [Google Scholar] [CrossRef]
  34. Li, J.; Bai, F.; Wang, Y.S. Study on Seismic Damage Evolution Model of Through Tenon Joints in Ancient Timber Structures. J. Build. Struct. 2024, 54, 146–152. [Google Scholar]
  35. Dong, J.; Bai, Y.H.; Liu, Y.H. Seismic damage performance of novel prefabricated frame joints. J. Vib. Shock. 2024, 43, 267–277. [Google Scholar]
  36. Tao, H.T.; Yang, H.F.; Zhou, Z.X. Influence of slab composite effect on the seismic performance of timber-concrete composite structures. J. Build. Eng. 2025, 101, 111815. [Google Scholar] [CrossRef]
  37. Tao, H.; Yang, H.; Tang, L. Seismic Performance of Joint between Timber-Concrete Composite Beams and Steel Column. J. Struct. Eng. 2023, 149, 555–565. [Google Scholar] [CrossRef]
  38. Tao, H.T.; Yang, H.F.; Wu, Y.S.; Ju, G.Y.; Liu, J.W.; Shi, B.K. Seismic performance of timber moment-resisting frame with timber-steel hybrid joints. Structures 2025, 71, 108070. [Google Scholar] [CrossRef]
  39. EN 1994 Eurocode 4; Design of Composite Concrete and Steel Structures. European Committee for Standardization: Brussels, Belgium, 2005.
  40. GB/T 50107-2010; Standardization Administration of China. Standard for Inspection and Assessment of Concrete Strength. China Standards Press: Beijing, China, 2010.
  41. GB/T 1927.11-2022; Standardization Administration of China. Test Methods for Physical and Mechanical Properties of Small Clear Wood Specimens—Part 11: Determination of Compressive Strength Parallel to Grain. China Standards Press: Beijing, China, 2022.
  42. Huang, J. Seismic Performance of Composite Columns with Steel-Concrete Hybrid Tubes. Master’s Thesis, Wuhan University, Wuhan, China, 2009. (In Chinese). [Google Scholar]
  43. Zhang, X.C.; Hu, C.M.; Wu, C.W.; Han, Y.N.; Zhang, Y.T. Research on seismic performance of shape memory alloy reinforced mortise-tenon joints. Eng. Mech. 2022, 39, 164–176. [Google Scholar]
  44. Li, C.C.; Liu, W.Q.; Ou, J.; Lu, W.D.; Yang, H.F. Experimental study on seismic performance of timber frame structure with beam-column columns. Jiangsu Archit. 2010, 3, 61–63. [Google Scholar]
  45. Kraetzig, W.; Meyer, I.; Meskouris, K. Damage evolution in reinforced concrete members under cyclic loading. In Proceedings of the 5th International Conference on Structural Safety and Reliability, Barcelona, Spain, 14–15 August 2025; ASCE: Reston, VA, USA, 1989; pp. 795–802. [Google Scholar]
  46. ASTM E2126-11; Standard Test Methods for Cyclic Load Test. ASTM: West Conshohocken, PA, USA, 2009.
  47. ASCE/SEI 41-17; Seismic Evaluation and Retrofit of Existing Buildings. American Society of Civil Engineers: Reston, VA, USA, 2017.
  48. Price, A.T. A mathematical discussion on the structure of wood. Philos. Trans. R. Soc. 1929, 228, 1–62. [Google Scholar]
  49. Zhou, T.M. Parametric study on structural behavior of skewed-inverted-T bent caps. J. Bridge Eng. 2020, 25, 04020092. [Google Scholar] [CrossRef]
  50. Filiatrault, A.; Christovasilis, I.P.; Wanitkorkul, A.; van de Lindt, J.W. Seismic loss estimation of wood-frame buildings based on residual drift ratios. Earthq. Spectra 2010, 26, 573–592. [Google Scholar]
  51. BS EN 26891; Timber Structures-Joints Made with Mechanical Fasteners-General Principles for the Determination of Strength and Deformation Characteristics. British Standards Institution: London, UK, 1991.
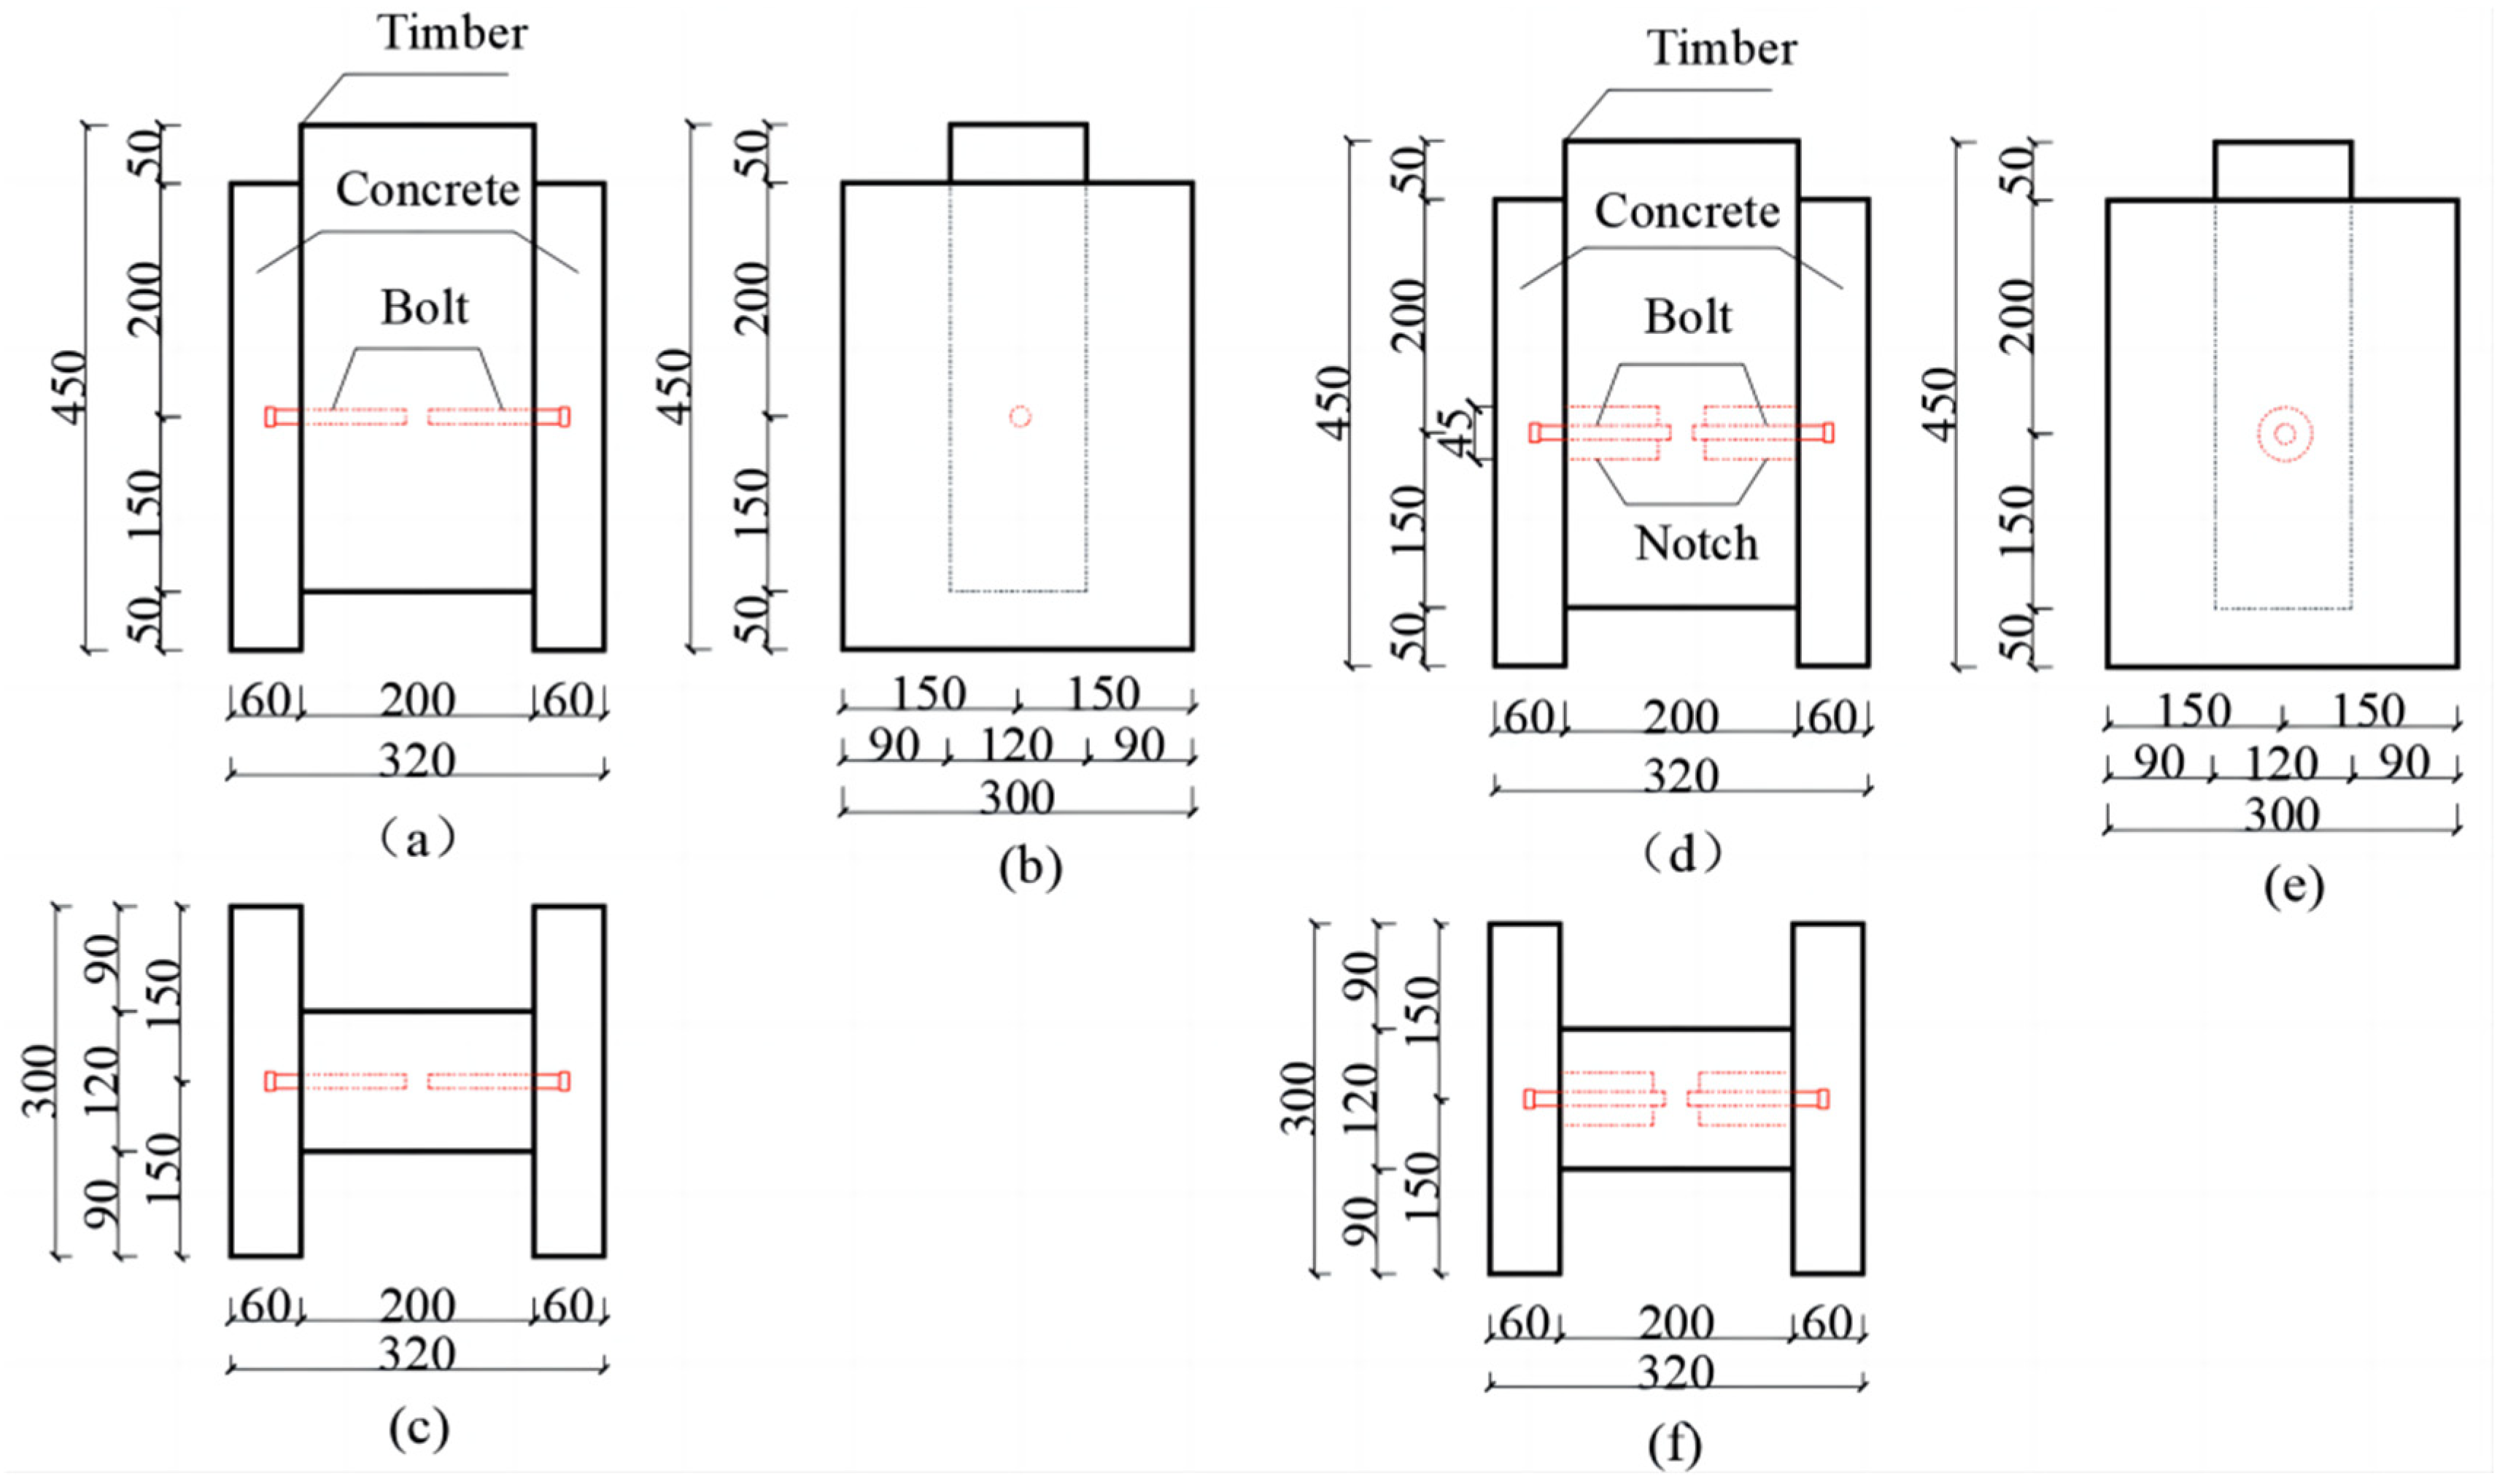
Figure 1. The dimension of timber–concrete connection (unit: mm). (a) front view(bolted), (b) side view(bolted), (c) top view(bolted), (d) front view(notch-bolted), (e) side view(notch-bolted), (f) side view(notch-bolted).
Buildings 15 03084 g001
Figure 2. The process of making the specimens.
Buildings 15 03084 g002
Figure 3. Test configuration.
Buildings 15 03084 g003
Figure 4. Loading procedure.
Buildings 15 03084 g004
Figure 5. Failure modes. (a) S-1-12, (b) S-1-16, (c) S-1-20, (d) S-2-12, (e) S-2-16, (f) S-2-20, (g) Timber, (h) Notch, (i) Bolts.
Buildings 15 03084 g005
Figure 6. Comparisons of hysteretic curves between test and FEA model.
Buildings 15 03084 g006
Figure 7. Skeleton curves.
Buildings 15 03084 g007
Figure 8. Stiffness degradation.
Buildings 15 03084 g008
Figure 9. Strength degradation.
Buildings 15 03084 g009
Figure 10. Energy dissipation of the connections. (a) S-1/2-12, (b) S-1/2-16, (c) S-1/2-20.
Buildings 15 03084 g010
Figure 11. The EEEP curve used to determine Fyield.
Buildings 15 03084 g011
Figure 12. Ductility ratio.
Buildings 15 03084 g012
Figure 13. Primary (PHC) and follower (FHC) half-cycle (based on equation from Kraetzig et al., 1989) [45].
Buildings 15 03084 g013
Figure 14. Cumulative damage index. (a) Displacement(S-1-12), (b) Displacement(S-1-16), (c) Displacement(S-1-20), (d) Displacement(S-2-12), (e) Displacement(S-2-12), (f) Displacement(S-2-12).
Buildings 15 03084 g014
Figure 15. FE modeling for the connection. (a) Concrete, (b) Timber and bolts.
Buildings 15 03084 g015
Figure 16. The constitutive relations of the materials. (a) Concrete, (b) Timber, (c) Bolts.
Buildings 15 03084 g016
Figure 17. Comparisons of hysteretic curve between numerical and test.
Buildings 15 03084 g017
Figure 18. Stress contour of FEA model. (a) S-1-Concrete, (b) S-2-Concrete, (c) S-1-Timber, (d) S-2-Timber, (e) S-1-Bolt, (f) S-2-Bolt.
Buildings 15 03084 g018
Table 1. Detailed information on the connections.
Connection IDBolt Diameter/mmConnector TypeThe Depth of Bolt in the Timber/mmThe Depth of Bolt in the Concrete/mm
S-1-1212bolts9030
S-1-1616
S-1-2020
S-2-1212notched bolts
S-2-1616
S-2-2020
Table 2. Material parameters of specimens (unit: mm).
Connection IDCompressive Strength of Concrete/MPaTensile
Strength of Timber
/MPa
Elasticity
Modulus of Timber/GPa
Yield Strength of Stud/MPaUltimate Tensile Strength of Stud/MPa
S-1-1232.2430.4212.32640800
S-1-16
S-1-20
S-2-12
S-2-16
S-2-20
Table 3. Loading procedure.
Cycle NumberRepetitionAmplitude/%Displacement/mm
1130.4
2150.8
31132
43304.5
53507.5
638012
7310015
8312018
Table 4. Comparisons of yield displacement, peak load, elastic shear stiffness, and yield load.
Connection IDΔyFm (kN)Ke (kN/mm)Fy (kN)
PositiveNegativePositiveNegativePositiveNegativePositiveNegative
S-1-124.44.551.449.214.512.745.143.2
S-1-165.25.184.275.022.319.174.266.7
S-1-208.07.1121.0106.817.921.5104.589.8
S-2-128.79.189.279.413.721.578.169.8
S-2-168.57.9131.9126.145.427.1111.5107.2
S-2-204.24.3144.1136.970.160.9122.3115.6
Table 5. Failure description and damage index.
Connection IDΔ (mm) at FailureFailure DescriptionDamage Index
S-1-1212.449Concrete separated from timber; Timber crushed0.613
S-1-1617.036Concrete cracked and separated from timber; Timber crushed0.787
S-1-2011.592Concrete cracked and separated from timber; Timber crushed0.850
S-2-1215.046Concrete separated from timber; Timber remained intact0.603
S-2-1612.283Concrete cracked and separated from timber; Timber remained intact0.768
S-2-2011.585Concrete cracked and separated from timber; Timber remained intact0.836
Table 6. Real constants of element CONTA174.
ElementNormal Penalty Stiffness FactorPenetration Tolerance FactorInitial Contact ClosureCoefficient of Friction
CONTA1740.10.10.010.2
Table 7. Critical variables of the material model.
MaterialsElastic Modulus (MPa)Poisson’s RatioStrength (MPa)
Concrete30,0000.232.24 (Compressive strength)
Timber12,3200.3730.42 (Compressive strength)
Bolt200,0000.3640 (Yield strength of stud)
Disclaimer/Publisher’s Note: The statements, opinions and data contained in all publications are solely those of the individual author(s) and contributor(s) and not of MDPI and/or the editor(s). MDPI and/or the editor(s) disclaim responsibility for any injury to people or property resulting from any ideas, methods, instructions or products referred to in the content.