Abstract
Concrete sleepers are essential components of railroad infrastructure, yet their service life has been reduced by one-third due to deterioration caused by internal swelling reactions (ISR), leading a major Brazilian railroad to replace millions of sleepers within a decade. This study investigates the reliability of various non-destructive testing (NDT) techniques to estimate damage levels in concrete sleepers. The methods evaluated include surface hardness testing, stress wave propagation, electromagnetic wave propagation using ground-penetrating radar (GPR), electrical resistivity, and resonant frequency. These techniques were applied to assess sleepers diagnosed as affected by alkali-silica reaction (ASR) and delayed ettringite formation (DEF) at different deterioration degrees. Although findings indicate that most NDT methods are limited and unreliable for quantifying ISR-induced damage, resonant frequency testing combined with energy dissipation analysis provided the highest accuracy across all damage stages and was able to capture microstructural changes before significant expansion occurred. These results support the use of vibration-based screening tools to enhance early detection and guide condition assessment of railroad infrastructure, helping to reduce the premature replacement of ISR-affected concrete sleepers.
1. Introduction
Concrete sleepers are essential components of railroad infrastructure, responsible for transferring loads from the rails to the ballast while ensuring proper alignment and structural stability. Due to their superior mechanical performance and durability compared to wood and steel alternatives, prestressed concrete sleepers are widely adopted across modern rail networks [1]. Prestressing is typically achieved through pre-tensioning, and the structural performance of sleepers strongly depends on their ability to maintain tendon tension over time [2,3].
Although designed for a 30-year service life, premature deterioration associated with internal swelling reactions (ISR), such as alkali-silica reaction (ASR) and delayed ettringite formation (DEF), has been increasingly reported worldwide over the years [4,5,6,7,8,9,10,11,12,13,14]. These mechanisms reduce the expected lifespan of concrete sleepers, particularly affecting their stiffness, which is critical for structural performance [2,3,15]. Existing studies have primarily focused on identifying the deterioration mechanism (i.e., cause), with limited emphasis on quantifying the degree of damage (i.e., extent) or evaluating its impact on mechanical behavior.
Most cases reported in the literature involve sleepers already exhibiting moderate to severe deterioration [4,5,6,7,8,9,10,11,12,13], with visible signs of damage detectable to the unaided eye [16]. Consequently, ISR-affected sleepers are often replaced based solely on visual indicators. In the absence of well-defined condition assessment protocols for early-stage detection of ISR-induced damage, railroad operators have implemented highly conservative replacement strategies. In Brazil, for instance, over one million sleepers were replaced within the past decade on one of the most important freight railroads in South America after superficial cracking was identified during visual inspections [17]. While this strategy has helped to prevent catastrophic failures, it has drastically shortened the service life of sleepers, imposing considerable financial and environmental burdens.
Nondestructive testing (NDT) methods have been used to assess the condition of concrete sleepers once signs of deterioration have been observed [18]. However, most applications target severely damaged sleepers, with limited effort directed toward detecting early stage degradation. Early diagnosis is particularly important for prestressed sleepers, where loss of stiffness can compromise the ability to maintain rail geometry and load transfer. Enhancing condition assessment protocols to capture the onset of ISR-related damage can strengthen inspection programs, minimize unnecessary replacements, and extend sleeper service life.
In this context, there is a need for a comprehensive evaluation of the reliability and effectiveness of the most prominent NDT techniques reported in the literature. These techniques are typically applied to assess the quality, homogeneity, and internal integrity of concrete, which can be compromised by various deterioration mechanisms, including overload, delamination, and loss of cohesion. Each NDT method operates based on a distinct physical principle, including mechanical impact response, electrical conductivity, stress wave propagation, electromagnetic wave propagation, etc. While these techniques are well-established for evaluating conventional types of damage (i.e., overload, impact, delamination, etc.), their reliability in detecting deterioration caused by internal swelling reactions (ISR) remains under debate. A better understanding of their effectiveness in identifying ISR-induced damage, particularly at early stages, is essential to support the development of more sustainable condition assessment strategies for managing ISR-affected sleepers and extending their service life.
2. Background
2.1. Deterioration of Concrete Due to Internal Swelling Reactions
2.1.1. Alkali-Silica Reaction
ASR is a chemical reaction that occurs between unstable siliceous mineral phases in the aggregates, whether coarse or fine, and the alkali hydroxides present in the pore solution of the concrete. In the early stages, the high pH ionizes the reactive silica by breaking silanol groups. Then, hydroxyl ions attack and disrupt siloxane bonds. The alkalis stabilize these ionized sites, leading to the formation of alkali-silicate-hydrate phases [19,20]. Recent findings indicate that the pressure buildup associated with ASR expansion is primarily linked to the precipitation of negatively charged reaction products in confined aggregate pores, rather than to the water absorption capacity of the gel. As these ASR products accumulate, repulsive electrostatic forces develop between the negatively charged reaction solids and the surrounding silicate surfaces. This interaction generates solidification pressure that can reach values between 6 and 13 MPa, which is sufficient to force apart aggregate walls and initiate microcracking, even in the absence of significant moisture gradients or gel swelling [21].
At early expansion levels (0.00–0.05%), cracks are typically confined to the aggregate particles. As expansion reaches moderate levels (around 0.12%), the initial cracks extend into the surrounding cement paste, while additional cracks also form in the aggregates. When the expansion increases to approximately 0.20%, most existing cracks propagate further into the cement paste, although the formation of new cracks becomes less frequent. At 0.30% expansion, these cracks begin to interconnect, resulting in a continuous crack network [21,22]. As ASR progresses, the modulus of elasticity exhibits an initial sharp decline, followed by a more gradual reduction at higher expansion levels. This behavior reflects the deterioration of the coarse aggregate, which significantly contributes to the overall stiffness of the concrete. A similar pattern is observed in tensile strength, which levels off at around 0.20% expansion, as it is primarily affected by the degree of cracking. The loss in compressive strength becomes more pronounced when cracks reach the interfacial transition zone (ITZ) and extend into the bulk cement paste, typically at or beyond 0.20% expansion [23].
2.1.2. Delayed Ettringite Formation (DEF)
DEF is a form of internal sulfate attack that occurs when concrete is exposed to elevated temperatures, typically above 65 °C, during the early stages of hydration [24,25]. These high temperatures decompose the primary ettringite initially formed during cement hydration. Once the internal temperature of the concrete decreases, ettringite re-forms in a delayed manner, leading to expansive pressures and deterioration of the hardened material [26,27]. This temperature rise can result from the heat of hydration in massive concrete elements with limited heat dissipation, or from accelerated curing methods, such as steam curing in precast concrete production [28,29].
Cracking due to DEF typically initiates within the interfacial transition zone (ITZ), especially at low to moderate expansion levels (up to 0.12%). As expansion increases, the cracks grow, connect, and form a network that extends into the bulk cement paste. At expansions between 0.20% and 0.30%, this cracking becomes more pronounced and continuous. When expansion exceeds 0.50%, aggregate particles may begin to debond and separate from the surrounding paste.
As DEF progresses, both the modulus of elasticity and compressive strength undergo substantial reductions. The early formation of cracks in the ITZ significantly impacts stiffness. While the modulus of elasticity tends to stabilize at later stages, the reduction in compressive strength continues throughout the expansion process [30].
2.1.3. ASR and DEF Coupled
ASR and DEF may exhibit chemical interactions that contribute to their co-occurrence in concrete. One proposed mechanism involves the reduction in pore solution pH due to the formation of alkali-silica gel during ASR. This pH shift can increase ionic mobility, creating favorable conditions for DEF development. It is hypothesized that in combined cases, ASR tends to initiate first when concrete is subjected to curing temperatures above 65 to 70 °C. The expansion and cracking caused by ASR then facilitate the onset and progression of DEF-related distress [27].
The severity and progression of ASR + DEF damage may be influenced by the size and nature of the reactive aggregate. When the reaction originates from fine aggregates, expansion levels as high as 0.50% have been observed. In contrast, when coarse aggregates are involved, expansion levels up to 0.30% have been reported for both DEF alone and ASR + DEF cases. Beyond this point, DEF-affected concrete tends to present greater expansion [30].
Although the physicochemical aspects associated with ASR and DEF mechanisms are well understood, their occurrence in field structures is often complex, variable, and difficult to detect at early stages. The co-occurrence of these mechanisms exacerbates internal deterioration, leading to microstructural damage that may precede visible damage “signatures” (e.g., cracking). As a result, early identification of ISR-induced distress remains a challenge, especially when damage is not yet visually apparent. This challenge underscores the importance of employing condition assessment tools capable of detecting subtle changes in the physical, electrical, or dynamic properties of concrete. In this context, non-destructive testing (NDT) methods may potentially prove to be promising techniques for detecting ISR-related degradation at early stage in concrete structures.
2.2. Non-Destructive Testing Methods to Assess Concrete Condition
Several nondestructive methods have been widely used to assess concrete conditions (i.e., quality, homogeneity, and internal integrity). These methods are based on physical principles, including motion, energy, and electricity. The most commonly used methods to appraise the current condition of concrete are the surface hardness test, stress and electromagnetic wave propagation, resonant frequency, and electrical resistivity. The concept of the methods, principles, and practical usage are discussed in the following sections.
2.2.1. Surface Hardness Test
The surface hardness test is based on the physical principle that materials with higher stiffness and compressive strength exhibit less surface deformation when subjected to impact. This response reflects the material’s ability to absorb and return mechanical energy, which can be indirectly linked to its mechanical properties, such as strength and uniformity [31,32,33].
In practical terms, this method is typically carried out using the Schmidt hammer, which applies a controlled impact to the concrete surface by releasing a spring-loaded mass. After striking the surface, the mass rebounds, and the rebound distance is measured to obtain the rebound number (Figure 1). This value increases with material stiffness and strength and decreases when the concrete is softer or more deteriorated. The device consists of a plunger, an internal spring, and a rider mechanism that records the rebound on a calibrated scale.
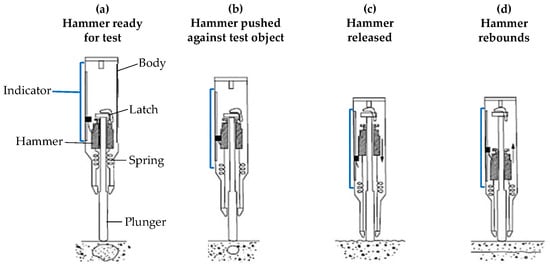
Figure 1.
Illustrative sketch of rebound hammer operation.
This method is widely used for evaluating the surface consistency of concrete, identifying zones with possible degradation, and estimating the in situ compressive strength through empirical correlations. However, these correlations are not universal and must be calibrated for each concrete under study [33,34]. It is important to note that the Schmidt hammer test does not replace destructive testing but rather serves as a complementary tool for condition assessment and quality control [32].
2.2.2. Wave Propagation
The wave propagation method is based on the principle that the velocity of a mechanical wave, such as compressive, transverse, Rayleigh, or Lamb waves, is governed by the elastic properties and density of the medium. In the context of concrete, these relationships allow for non-invasive assessment of stiffness, continuity, and material integrity. Higher wave velocities are typically associated with stiffer and denser concrete, while lower velocities can indicate internal flaws, such as cracking or voids. The test may be performed in three different wave propagation modes (Figure 2) [35].
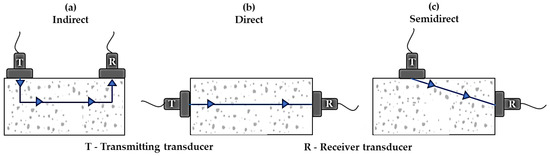
Figure 2.
Illustrative sketch of UPV testing based on the different wave propagation modes.
In practice, this principle is applied using the ultrasonic pulse velocity (UPV) technique. A pulse generator and transmitter introduce a short-duration mechanical wave that propagates through the concrete, and a receiver detects the wave’s arrival at a known distance. The time taken for the wave to travel this distance is measured and used to calculate the pulse velocity. This value is influenced by several parameters, including the modulus of elasticity, Poisson’s ratio, and density of the material, as well as the geometry and boundary conditions of the tested element [36].
The UPV technique is widely used to evaluate the concrete quality, detect internal defects, such as cracking and delamination, and monitor degradation due to mechanisms, such as freeze–thaw cycles [37]. Because the method does not damage the material and can be repeated at the same location over time, it is well-suited for long-term monitoring of structures. However, wave velocity results should be interpreted with caution since they may also be affected by factors such as the moisture content, temperature, or the presence of steel reinforcement [38].
2.2.3. Electromagnetic Wave Propagation
Electromagnetic wave propagation in concrete is governed by the material’s dielectric properties, particularly its ability to store and transmit electrical energy. Variations in the dielectric constant occur at interfaces where the composition, moisture content, or density changes. These contrasts affect the speed and reflection of electromagnetic waves, making them useful for identifying internal flaws or anomalies in heterogeneous materials, such as concrete.
Ground-penetrating radar (GPR) applies this principle by transmitting high-frequency electromagnetic waves into the concrete through a specialized antenna. When the waves encounter internal interfaces, such as between the cement paste and reinforcement bars or between intact zones and voids, part of the wave is reflected back to the surface. These reflected signals are recorded by a receiver and analyzed based on their travel time, amplitude, and frequency to identify internal heterogeneities or embedded objects (Figure 3) [39].
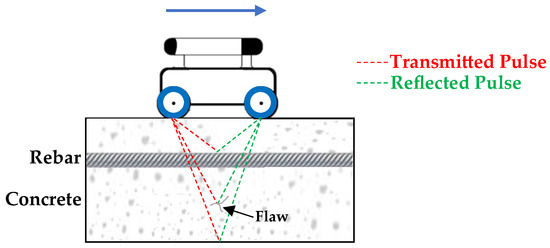
Figure 3.
Illustration of GPR testing based on the electromagnetic wave propagation.
GPR equipment typically includes a transmitting and receiving antenna, a control unit, and data processing software. The system is capable of generating continuous waveforms across a range of frequencies and interpreting the reflected signals to generate a dielectric profile of the scanned area. In concrete structures, GPR is widely used for locating reinforcement, identifying voids, and detecting delaminations. The dielectric contrast between materials and the moisture content of the concrete strongly influences its effectiveness. Higher moisture levels increase the dielectric constant, enhance signal attenuation, and reduce penetration depth, which must be considered during interpretation [40].
2.2.4. Surface Resistivity
Surface resistivity testing is based on the electrical properties of concrete, particularly its capacity to resist ionic current flow across the surface. The resistivity is directly influenced by the pore structure, the conductivity of the pore solution, and the degree of saturation [41]. In general, lower resistivity values are associated with a higher moisture content or greater ionic mobility, while higher resistivity suggests drier or less connected pore networks.
In practice, the test involves applying an alternating current (AC) to the concrete surface using electrodes and measuring the voltage drop. The surface resistivity is then calculated using Ohm’s law, factoring in the electrode spacing and specimen geometry. The result reflects the concrete’s ability to conduct electricity across its surface [39].
The most widely adopted configuration is the Wenner probe system (Figure 4), which uses four linearly aligned, equally spaced electrodes. The two outer electrodes inject current, and the two inner electrodes measure the resulting potential difference. This setup allows for efficient, repeatable measurements with minimal surface preparation [40].
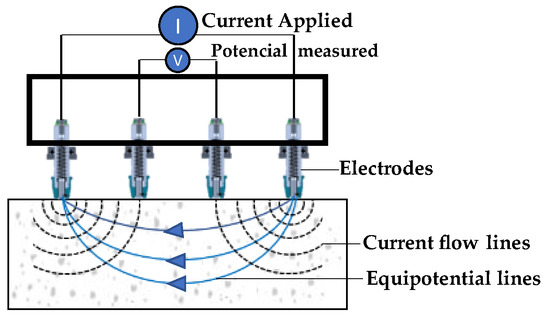
Figure 4.
Sketch of surface resistivity testing setup—Wenner probe.
Surface resistivity testing is commonly used to estimate concrete permeability and assess the risk of reinforcement corrosion. It is particularly suitable for comparative assessments across different zones or mixtures. However, interpretation of results must account for surface moisture, temperature, and the presence of surface coatings or carbonation, all of which can significantly influence the measurements.
2.2.5. Resonant Frequency
The resonant frequency method is based on the dynamic behavior of materials, in which the natural vibration frequencies are directly related to the geometry, mass, and elastic properties of the specimen. These frequencies are highly sensitive to stiffness and structural integrity, making them useful for detecting internal damage or degradation in concrete. As the material deteriorates, changes in stiffness lead to shifts in its resonant frequencies, which can be measured and tracked over time [42].
In practical terms, the test involves exciting a concrete element with a controlled mechanical impulse, such as that generated by an impact hammer or piezoelectric shaker. Sensors, including accelerometers or microphones, are positioned on the specimen to record the vibrational response. A frequency analyzer processes the resulting signal to identify the natural frequencies associated with different vibration modes (e.g., longitudinal, torsional, or flexural) (Figure 5) [43].
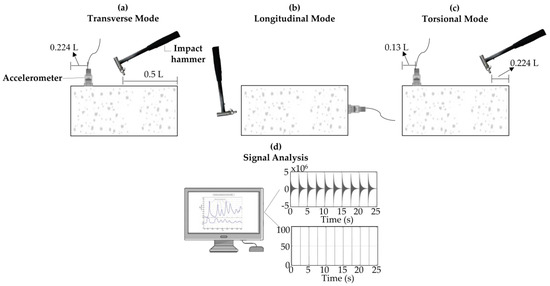
Figure 5.
Sketch of resonant frequency with vibration generated by the impact of a hammer. (a) Transverse mode. (b) Longitudinal mode. (c) Torsional mode. (d) Signal analysis.
Beyond identifying peak frequencies, the resonant frequency test provides input for modal analysis, which enables a deeper evaluation of the structure’s dynamic properties. Modal analysis interprets the measured response to extract not only the natural frequencies but also the associated mode shapes and damping ratios. These parameters help determine how different regions of the material contribute to the overall vibrational response and can reveal localized variations in stiffness and damage [44]. In concrete affected by deterioration mechanisms, modal analysis offers a comparative framework for evaluating damage progression, especially by tracking changes in vibrational behavior over time or between test locations [45,46]. Notably, this technique has demonstrated effectiveness in identifying early stage damage since shifts in modal properties often precede the appearance of visible cracks or measurable strength loss [47].
While various NDT techniques have been widely applied in concrete infrastructure assessment, their effectiveness in capturing early stage deterioration due to ISR remains uncertain. The interaction between NDT principles and ISR-induced changes, such as microcracking filled with reaction products, may compromise test sensitivity or lead to misleading results. Therefore, there is a need to evaluate ISR-affected concrete in field conditions using NDT methods and to compare the results with those obtained through a validated multi-level assessment protocol. This comparison is essential for verifying the ability of NDT to capture damage progression, specifically at early stages, and support condition assessment strategies for affected infrastructure.
3. Scope of the Work
As previously discussed, there is a need to better understand the reliability of non-destructive testing (NDT) techniques in identifying early deterioration associated with internal swelling reactions (ISR), with the potential to support routine inspection protocols for prestressed concrete sleepers. This study aims to identify which NDT methods provide reliable differentiation across damage stages, especially in early ISR progression. To this end, the effectiveness of several conventional NDT methods in detecting damage in field-exposed prestressed sleepers was investigated. The techniques evaluated include Schmidt hammer, ultrasonic pulse velocity (UPV), surface resistivity, corrosion potential, ground-penetrating radar (GPR), and resonant frequency measurements. The assessment focuses on concrete sleepers affected by the combined action of alkali-silica reaction (ASR) and delayed ettringite formation (DEF), representing a range of deterioration levels along a major Brazilian freight railroad.
The performance of these NDT methods is evaluated against damage levels previously established through a validated multi-level assessment protocol developed by Sanchez et al. [30,48], providing a consistent benchmark for analyzing their sensitivity and reliability in capturing ISR-induced deterioration across different stages.
4. Materials and Methods
Concrete sleepers from a northern Brazilian railroad presenting an isosceles trapezoid cross-section (225 mm [top side], 265 mm [bottom side], 250 mm [height], and 2800 mm [length]) (Figure 6) were selected for this study. The groups of sleepers were determined based on the level of deterioration, determined based on the multi-level assessment protocol encompassing microscopic (i.e., damage rating index—DRI) and mechanical (i.e., stiffness damage test—SDT) testing. Thus, four groups, each comprised of 8 concrete sleepers, were selected for this study.
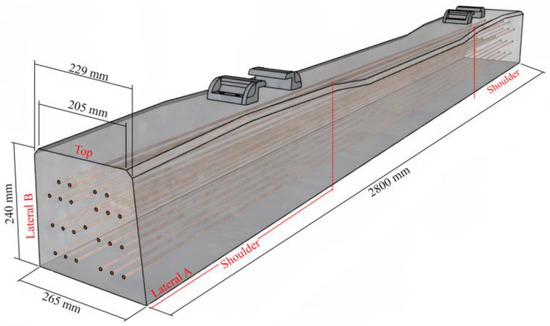
Figure 6.
Schematic representation of the pre-tensioning prestressed concrete sleepers investigated [14].
4.1. Multi-Level Assessment Protocol
The combined use of SDT and DRI results forms the cornerstone of a multi-level damage assessment protocol. Building on this approach, Sanchez et al. [30] developed a benchmark database encompassing mechanical and microscopic indicators for evaluating ISR-affected concrete.
- The damage rate index (DRI) is a microscopic procedure widely used to assess concrete distressed by internal swelling reaction mechanisms. The method consists of a well-trained operator counting the different distress features (i.e., cracks) in a polished concrete section of at least 100 cm2 using a stereomicroscope under 16× magnification. These counts are then weighed by specific weighting factors, summed, and normalized to 100 cm2, yielding the DRI number [22].
- The stiffness damage test (SDT) is a mechanical test based on 5 cycles at 0.1MPa/s to a maximum stress of 40% of the sound concrete under investigation. The stress–strain curve is then analyzed to provide the SDT parameters: i) the stiffness damage index (SDI) representing the ratio of dissipated energy to total energy applied during the test; ii) the plastic deformation index (PDI) quantifying the ratio of plastic deformation to total deformation; iii) the non-linearity index (NLI) providing insights into the cracking pattern within the material, and iv) the modulus of elasticity (E) representing the secant modulus based on the 2nd and 3rd loading cycles [49,50].
Table 1 demonstrates the established critical correlations between expansion, stiffness loss, reductions in compressive and tensile strength, and microscopic features (e.g., DRI number), providing a robust framework for assessing the current condition of ISR-affected concrete.

Table 1.
Benchmark table of ISR-induced development on affected concrete [30].
The multi-level assessment protocol has been validated to evaluate the current condition of various structures, including bridges [48] and sleepers [14,15].
4.2. The Current Condition of the Sleepers
The sleepers investigated in this research were evaluated using a multi-level assessment protocol, where the microscopic test (i.e., DRI) was performed on two samples (100 × 200 mm) and the mechanical test (i.e., SDT) was performed on three samples (50 × 100 mm) per sleeper group. It was found that alkali-silica reaction (ASR) and delayed ettringite formation (DEF) were the mechanisms distressing the sleepers. The combination of DRI and SDT results compared to the benchmark results presented in Table 1 yielded distinct deterioration levels for all four groups (Table 2), where group A presented a negligible (i.e., 0.0–0.03%), group B showed a marginal (i.e., 0.04 ± 0.01%), group C displayed a moderate (i.e., 0.11 ± 0.01%), and group D exhibited ultra-high (i.e., ≥ 1.00%) damage level.
Table 2.
Global assessment and damage classification of the investigated sleepers’ groups.
4.3. Non-Destructive Testing
All non-destructive tests, except for the resonant frequency analysis, were conducted directly on the full-size concrete sleepers prior to core extraction for complementary investigations. Due to logistical constraints during field access, resonant frequency testing was instead performed on cores extracted from the same sleeper population. Considering the sensitivity of the NDT tools used to assess the ISR-affected concrete to moisture and temperature, all the tests were performed under an ambient temperature of 30 ± 3 °C and relative humidity of 50 ± 5%.
Corrosion potential was measured using a copper/copper sulfate half-cell electrode with an accuracy of ±1 mV. A total of 16 measurements were collected to compute the region’s average potential value.
Schmidt hammer testing was carried out using impact energies of 2.207 Nm (N-type) and 0.735 Nm (L-type). Each region under evaluation received 16 hammer impacts. The highest and lowest 10% of the values were excluded to calculate a representative average. Two regions per sleeper were tested.
Ultrasonic pulse velocity (UPV) measurements were obtained using a system capable of 0.1 µs resolution, a configurable pulse voltage range (±100 to ±450 V), and a receiver gain adjustable from 1 to 10,000 (equivalent to 0 to 80 dB). The 54 kHz transducers were applied in both direct and indirect (surface) transmission configurations, with 16 measurements per sleeper taken in each mode to compute the average.
Surface resistivity was measured using a Wenner probe array with 50 mm spacing, operating within a range of 1 to ~1000 kΩ·cm and with an accuracy between ±0.2 and ±2 kΩ·cm. Measurements were taken at two positions along each sleeper, and the average value was calculated accordingly.
Ground-penetrating radar (GPR) assessments were performed using a stepped-frequency continuous-wave system operating between 200 and 4000 MHz, with penetration depths reaching up to 85 cm. Frequency modulation was managed by an embedded AI-based algorithm. The dielectric constant was averaged from measurements conducted on two different faces of each sleeper.
Resonant frequency tests were conducted on cylindrical cores to characterize the longitudinal, transverse, and torsional vibration modes. For each mode, 16 specimens were tested, and each specimen underwent three measurements. A piezoelectric accelerometer with an operational bandwidth of 20 Hz to 20 kHz was used to capture the dynamic response.
4.4. Modal Analysis
In this study, the damping behavior of concrete samples was estimated based on experimental frequency response curves obtained from dynamic tests. The data processing was conducted using MATLAB-R2024a, which automatically identified the first natural frequency of each sample using the findpeaks function. Due to the low to moderate damping typically observed in concrete and the potential influence of boundary effects or noise on higher-order modes, only the first resonance peak was considered for damping estimation.
The damping ratio (ξ) was determined using the half-power bandwidth method (−3 dB), a widely used and reliable technique for systems with damping ratios up to approximately 5%, as typically observed in concrete materials [51,52]. This method consists of the following steps:
- Determination of −3dB frequencies:
The maximum amplitude of the frequency response curve, denoted as , is first identified. The frequencies and are then determined, where the amplitude drops to of (Equation (1)):
These points define the bandwidth within which energy is dissipated around the resonance.
- 2.
- Calculation of the bandwidth (Δf)
The bandwidth is then calculated as the difference between the two frequencies, as per Equation (2):
- 3.
- Estimation of the damping ratio (ξ):
Finally, the damping ratio is then calculated as per Equation (3):
where is the frequency corresponding to the peak amplitude.
Figure 7 illustrates the analysis of the resonant frequency, highlighting the parameters used to determine the damping.
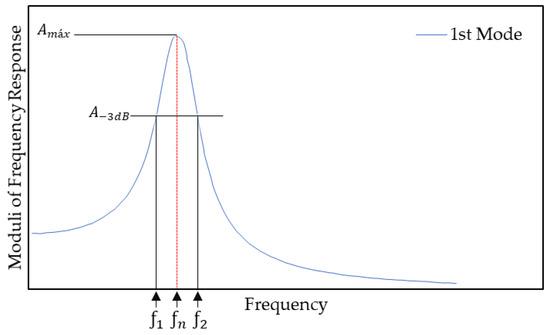
Figure 7.
Sketch illustrating the analysis of the resonant frequency, highlighting the parameters used to determine the damping.
This method assumes a single-degree-of-freedom (SDOF) response near the resonance, which is a valid simplification when the vibrational mode is well separated. Although concrete elements exhibit multi-degree-of-freedom (MDOF) behavior, their dynamic response near a distinct peak is typically dominated by a single mode [51]. In such cases, the influence of adjacent modes is negligible, justifying the SDOF approximation. In such cases, the influence of adjacent modes is negligible, justifying the use of the SDOF approximation. This assumption is particularly effective when the resonance is clearly identifiable and unaffected by mode coupling or noise [53]. The half-power bandwidth method remains a practical and accurate approach for estimating damping in concrete structures.
5. Results
The results obtained from the different NDT techniques performed on sleepers are presented in Figure 7, Figure 8, Figure 9, Figure 10, Figure 11 and Figure 12. Each average and median presented was obtained from 30 measurements.
The corrosion potential results (Figure 8) demonstrate a shift toward increasingly negative values from Group A to Group D, aligning with the deterioration gradient observed in other tests. According to ASTM C876, values more positive than −200 mV (Cu/CuSO4) indicate a greater than 90% probability of no corrosion activity, whereas values more negative than −350 mV suggest a greater than 90% probability that corrosion is actively occurring. Values in between are considered uncertain and require further investigation. Group A shows a median potential around −42 mV, with the upper whisker extending into the positive range, indicating that most samples fall within the passive or uncertain region. The relatively narrow interquartile range (IQR) and short whiskers suggest a homogeneous and corrosion-inactive condition, consistent with concrete with limited ionic mobility. In contrast, Group B already displays a median around −58 mV, with a noticeable spread toward more negative values. Although still largely within the uncertain range, the extension of the lower whisker beyond −200 mV indicates that a portion of the samples may already be experiencing incipient corrosion activity. Group C exhibits a median near −101 mV, with its lower quartile (Q1) falling below −120 mV, and whiskers approaching the −200 mV threshold, suggesting that corrosion is becoming increasingly probable in several specimens. The wider IQR and extended lower whisker support the interpretation of non-uniform corrosion behavior, likely linked to localized damage and increased moisture penetration. Group D presents the most concerning profile. The median potential is around −167 mV, with the Q1 well below −217 mV and the lower whisker extending beyond −398 mV, well into the region of high corrosion probability per ASTM C876. The broad IQR and extremely low values indicate severe and widespread corrosion activity, likely driven by a compromised concrete microstructure, high internal moisture levels, and increased ionic conductivity. This group exhibits the most heterogeneous condition, as reflected by its wide statistical spread and extensive lower tail. Although corrosion potential was not explored further in the subsequent sections, it is included here for completeness.

Figure 8.
Corrosion potential via half-cell.
The Schmidt hammer results (Figure 9) show relatively stable rebound values across all sleeper groups, with only slight variations in the median and interquartile range (IQR) from Group A to Group D. Median values remain close, ranging from 67.13 (Group A) to 69.41 (Group D), while Q1 values range between 66.06 (Group A) and 67.42 (Group D), and Q3 values from 68.14 (Group A) to 71.14 (Group D). The IQRs are consistently narrow across all groups, and overlapping interquartile ranges suggest a comparable distribution of surface hardness values. Although a modest increase in the upper quartile can be observed in Group D, this is not accompanied by a distinct separation from the other groups. The minimum and maximum values remain within a narrow band across groups, and the whisker lengths do not display a pattern of progressive increase or decrease. These observations suggest a uniform distribution of rebound values across the groups, without sharp contrasts that would indicate marked surface degradation or variability.
From a comparative standpoint, the Schmidt hammer measurements reveal a tight clustering of values among all groups, with overlapping quartiles and similar data spreads. The discussion section considers these patterns further, examining their relevance to internal swelling reaction (ISR)-related deterioration.

Figure 9.
Surface hardness through the Schmidt hammer.
The ultrasonic pulse velocity results, obtained through both direct (Figure 10a) and indirect (Figure 10b) transmission methods, reveal consistent median values across all sleeper groups, with limited distinction between their respective quartile ranges. In the direct method, median velocities range from 5.07 m/s in Group A to 4.93 m/s in Group D, while Q1 and Q3 values remain closely space; for instance, Q1 values range from 5.01 m/s (Group A) to 4.86 m/s (Group D), and Q3 values from 5.14 m/s (Group A) to 5.04 m/s (Group D). A similar trend is observed in the indirect method, where medians range from 3.79 m/s in Group A to 3.81 m/s in Group D, and the Q1–Q3 intervals display substantial overlap among all groups. For example, Q1 in Group D is 3.44 m/s, compared to 3.27 m/s in Group A, and Q3 in Group C reaches 4.03 m/s, comparable to 3.93 m/s in Group B.
While minor shifts are present, such as slightly broader IQRs in Groups C and D, these variations do not result in clearly distinguishable distributions among the groups. The whisker lengths, which reflect the overall data spread, are also broadly comparable, and no group displays significantly more extreme values than the others in a consistent manner. This is particularly evident in the indirect method, where greater data dispersion is observed across all groups, especially Group D, but without a distinct change in central tendency.
According to the classification thresholds for concrete homogeneity referenced in CEB-FIB [54] and Whitehurst [55], where UPV values above 4.5 m/s are associated with high-quality homogeneous concrete, values between 3.5 and 4.5 m/s indicate moderate quality, and values below 3.5 m/s suggest low quality or heterogeneity, most results across all groups remain within the moderate-to-high range. In both UPV methods, the distributions for each group predominantly fall between 3.5 and 5.2 m/s, with no group consistently entering the lower-quality range defined by these guidelines.
When considering the full dataset, the observed results highlight a high degree of overlap in the central and interquartile values across all groups and measurement methods. These patterns provide a basis for further discussion regarding the applicability of UPV—both direct and indirect—for distinguishing the internal condition of concrete affected by internal swelling reactions (ISR), which will be explored in detail in the discussion section.

Figure 10.
Ultrasonic pulse velocity. (a) UPV direct. (b) UPV indirect.
The ground-penetrating radar (GPR) dielectric constant results (Figure 11) exhibit a progressive increase in central values from Group A to Group D, accompanied by notable changes in interquartile spread. Group A shows the lowest median dielectric constant at 8.36, followed closely by Group B with a median value of 8.34. Group C presents a noticeable increase, with a median of 9.12, while Group D exhibits the highest median at 12.53. Beyond the upward trend in central tendency, the pattern is reinforced by the upward shift of the entire interquartile range (IQR). The values for Q1 and Q3 in Group A are 8.20 and 8.56, respectively. These remain similar in Group B (Q1 = 8.03, Q3 = 8.53), before increasing in Group C (Q1 = 8.68, Q3 = 9.53). In Group D, the dielectric constant values rise sharply, with Q1 at 12.30 and Q3 at 12.84. These non-overlapping IQRs, particularly between Groups A/B and D, highlight a clear distinction in the radar response among the groups. The spread of the data also varies across the groups. Groups A and B exhibit narrower IQRs, suggesting consistent dielectric properties within each group. Group C shows greater variability, while Group D, although elevated in values, maintains a relatively tight distribution. This trend may reflect increasing internal moisture and microstructural changes associated with ISR advancement.
Overall, the dielectric constant values obtained from GPR present a clear and structured shift in both median values and distribution from Group A to Group D. The descriptive trends across quartiles, medians, and data dispersion form the basis for further exploration regarding the sensitivity of GPR as a nondestructive evaluation tool for ISR-affected concrete, which is addressed in the discussion section.

Figure 11.
Ground radar penetration (GPR).
The surface resistivity results (Figure 12) display a consistent decrease in central values from Group A to Group D, with corresponding shifts in interquartile ranges (IQRs). Group A shows the highest median resistivity at 39.84 kΩ·cm, with an interquartile range extending from 39.16 kΩ·cm (Q1) to 40.52 kΩ·cm (Q3). Group B follows with a median of 36.34 kΩ·cm, and quartiles at 35.45 kΩ·cm (Q1) and 37.52 kΩ·cm (Q3). Group C presents a further decrease, with a median of 30.98 kΩ·cm, and quartile values of 29.44 kΩ·cm and 31.94 kΩ·cm. The lowest values are recorded in Group D, where the median drops to 21.02 kΩ·cm, and the Q1–Q3 range spans from 16.64 to 23.21 kΩ·cm.
The IQR increases progressively across the groups, from 1.36 kΩ·cm in Group A to 6.57 kΩ·cm in Group D, indicating increasing dispersion in electrical resistivity. While Groups A and B exhibit narrow and well-defined distributions, Groups C and D show broader spreads in values, particularly in Group D, suggesting greater heterogeneity in surface conductivity conditions within that group.
Although the trend from A to D is downward, the overlap between the upper quartiles of one group and the lower quartiles of the next is limited. For example, Q3 in Group B (37.52 kΩ·cm) remains clearly above Q1 in Group C (29.44 kΩ·cm), and Group D’s values are well separated from those of all other groups. These groupwise shifts and widening spreads will be further examined in the discussion section in relation to their potential connection with ISR-related damage progression.

Figure 12.
Surface electrical resistivity.
The cores extracted to perform the multi-level assessment were evaluated by the impact resonant frequency test in three modes (i.e., longitudinal, transverse, and torsional). The results obtained in all three vibration modes present marked differences in central tendency and data spread across the sleeper groups. For the longitudinal mode (Figure 13a), Group A exhibits the highest median frequency at 7220 Hz, with a narrow interquartile range (IQR) bounded by Q1 = 7204 Hz and Q3 = 7238 Hz. In contrast, Groups B and C present moderately lower medians at 5060 Hz and 4940 Hz, respectively, with slightly wider IQRs. Group D displays the lowest median frequency of 1990 Hz, accompanied by a considerably broader distribution, with Q1 and Q3 spanning from 1949 Hz to 2019 Hz. The distinct separation of quartile ranges between Group D and the others is visually evident.
In the transverse mode (Figure 13b), a similar trend is observed. Group A maintains the highest median at 2990 Hz (Q1 = 2979 Hz; Q3 = 3002 Hz), followed by Group B (2810 Hz) and Group C (2730 Hz). Group D again registers the lowest values, with a median of 1990 Hz and a significantly wider IQR, ranging from 1930 Hz to 2028 Hz. While some overlap is present between the upper quartile of Group D and the lower quartiles of Groups B and C, the central values remain distinctly separated.
In the torsional mode (Figure 13c), the values follow the same descending order of magnitude across groups. Group A reports a median frequency of 3100 Hz, with a tight IQR (Q1 = 3097 Hz; Q3 = 3104 Hz), while Group B and Group C present lower median values of 2520 Hz and 2210 Hz, respectively. Group D again shows the lowest median torsional frequency (990 Hz) and the widest IQR, from 958 Hz to 1015 Hz.
Across all three modes, the results reveal a consistent reduction in resonant frequency values from Group A to Group D, accompanied by increasing variability. The interquartile ranges of Group D are distinctly wider and do not overlap with those of Group A in any mode, while Groups B and C remain intermediate. These group-wise differences in frequency distributions are explored further in the discussion section.

Figure 13.
Resonant frequency: (a) longitudinal; (b) transverse; (c) torsional.
6. Discussion
Non-destructive test (NDT) methods, based on diverse physical principles—including mechanical responses (Schmidt hammer), stress wave propagation (ultrasonic pulse velocity [UPV] and resonant frequency), electrical properties (surface resistivity and corrosion potential), and electromagnetic responses (ground-penetrating radar [GPR])—have been widely employed to assess the condition of concrete structures. While these methods demonstrate potential for detecting structural integrity loss and reinforcing steel deterioration, their effectiveness in accurately estimating damage associated with internal swelling reactions (ISR) remains under continuous evaluation. This study contributes to this field by examining the reliability of these NDT techniques in appraising deterioration severity as benchmarked against a validated multi-level assessment protocol.
6.1. Accuracy and Reliability of NDT Methods in Estimating ISR-Induced Damage Level
Figure 14 presents the evolution of key multi-level assessment parameters (i.e., DRI, SDI, PDI, and expansion) as a function of each NDT technique. Results for the Schmidt hammer and UPV methods (both direct and indirect) exhibited substantial overlap in standard deviation ranges, indicating high intra-group variability. While one-way ANOVA results (Table 3) for Schmidt hammer (p = 2.43 × 10⁻⁷) and UPV direct (p = 2.70 × 10⁻⁹) suggest statistically significant differences between groups, the practical resolution of these techniques is limited. Tukey HSD analysis (Figure 15) revealed that for both Schmidt hammer and UPV direct, only Group D (ultra-high damage) differed significantly from the other groups. These methods failed to detect damage levels below moderate, and overlapping confidence intervals in the Tukey plots further highlight their inaccuracy for early stage ISR detection. UPV indirect, in particular, was statistically non-significant (p = 3.90 × 10⁻¹), confirming its limited sensitivity to ISR-induced deterioration at any level within the range of damage degree evaluated in this experimental program.
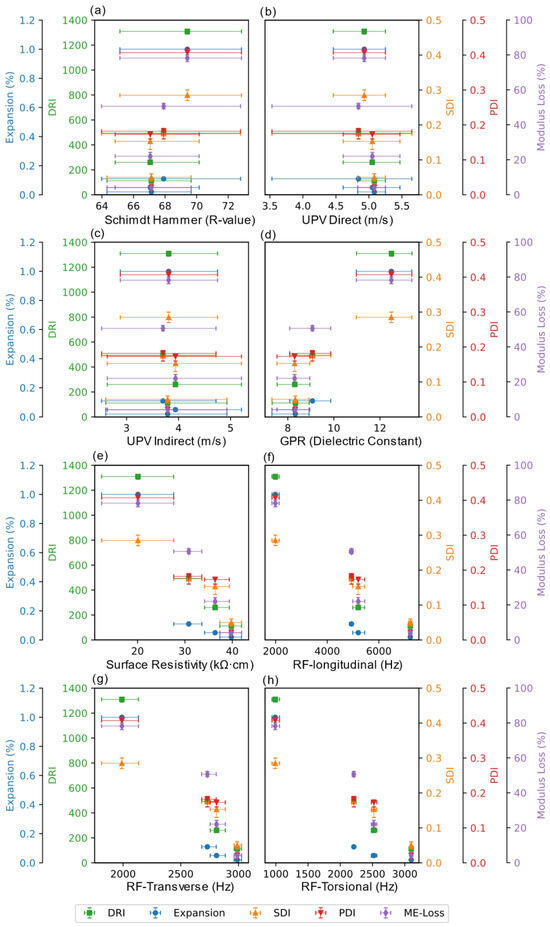
Figure 14.
Scatter plot of (a) Schmidt hammer, (b) UPV direct, (c) UPV indirect, (d) ground radar penetration (GPR), (e) surface electrical resistivity, (f) resonant frequency—longitudinal, (g) resonant frequency—transverse, (h) resonant frequency—torsional versus DRI number, SDI, PDI, and expansion.
Table 3.
One-way ANOVA of the NDT techniques.
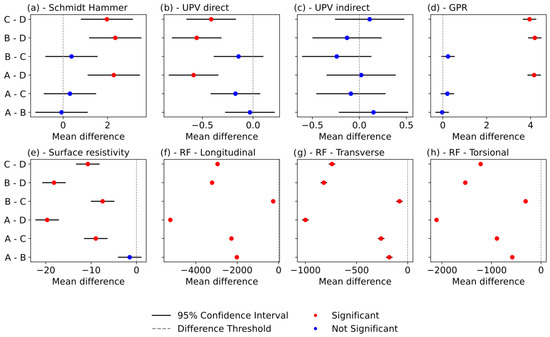
Figure 15.
Tukey honestly significant difference (HSD) of (a) Schmidt hammer, (b) UPV direct, (c) UPV indirect, (d) ground radar penetration (GPR), (e) surface electrical resistivity, (f) resonant frequency—longitudinal, (g) resonant frequency—transverse, (h) resonant frequency—torsional.
In contrast, the GPR dielectric constant (p = 2.97 × 10−43) and surface resistivity (p = 1.90 × 10−74) demonstrated clear statistical separation among the groups. GPR was especially effective in identifying sleepers with ultra-high deterioration (Group D), which it consistently distinguished from Groups A, B, and C. While this makes GPR a reliable tool for binary classification (i.e., damaged vs. non-damaged), it lacks the sensitivity to distinguish between intermediate stages, such as marginal and moderate damage. Surface resistivity provided finer resolution across most group comparisons. However, it was unable to differentiate between Group A (negligible) and Group B (marginal), as indicated by the non-significant Tukey p-value of 0.398. This limitation restricts its usefulness in capturing the onset of ISR-related deterioration.
Resonant frequency testing, applied to cores extracted from the field sleepers, produced the most consistent and accurate alignment with the multi-level assessment parameters. The longitudinal mode exhibited an interesting estimation of the stiffness damage index (SDI), while the torsional mode aligned closely with the plastic deformation index (PDI). ANOVA p-values were remarkably low—3.12 × 10−160 for longitudinal and 2.37 × 10−189 for torsional, highlighting these modes’ strong reliability to distinguish across all levels of deterioration. Tukey analysis further confirmed that both modes could differentiate between all four damage categories: negligible (A), marginal (B), moderate (C), and ultra-high (D). The transverse mode, while still statistically significant (p = 4.67 × 10−113), showed reduced reliability to distinguish between Groups B and C, limiting its resolution at early to moderate damage stages.
Considering the overall results, resonant frequency, particularly in the longitudinal mode, emerges as the most reliable NDT method for estimating the extent of ISR-induced damage in prestressed concrete sleepers. Surface resistivity and GPR also offer valuable diagnostic capabilities, especially when used in combination within a multi-method condition assessment strategy. Despite their statistical significance in ANOVA, the Schmidt hammer and UPV methods are constrained by high variability and limited discrimination power at lower damage levels, making them less effective for early-stage evaluation.
The level of accuracy and sensitivity in detecting ISR-induced damage is further discussed in 6.2 based on the fundamental behavior concepts of each NDT method.
6.2. Understanding the Sensitivity of NDTs to Detect the Early Stage of ISR-Induced Damage
The effectiveness of non-destructive testing (NDT) techniques in detecting early stage deterioration depends strongly on the fundamental principle, whether physical or chemical, underlying each method, and how it interacts with the evolving microstructure in concrete affected by internal swelling reactions (ISR). The limited sensitivity observed for the Schmidt hammer and ultrasonic pulse velocity (UPV), in both direct and indirect modes, is explained by their inherent insensitivity to incipient microcracking and subtle modulus changes. In ISR-affected concrete, deterioration of the cement paste and aggregate particles occurs with the formation of microcracks that are often filled with reaction products, such as alkali-silica reaction (ASR) gel and delayed ettringite. The presence of these products reduces both acoustic reflection and impact energy dissipation, two mechanisms that are essential for wave- and rebound-based damage detection.
Specifically, the presence of ASR gel or delayed ettringite within ISR-induced cracks attenuates the acoustic contrast typically exploited by wave propagation techniques, like UPV. These filling materials can partially bridge or mask microstructural discontinuities, preserving high wave velocities even in the presence of internal damage. Consequently, the signal may appear deceptively stable in velocity-based measurements. This highlights the importance of understanding wave–material interaction mechanisms across ISR stages, especially when early detection is needed to inform preventive maintenance. Similarly, during Schmidt hammer testing, the presence of reaction products within the cracks reduces the energy absorbed by the damaged concrete. As a result, the rebound value of the impact remains largely unaffected, leading to inaccurate assessments in the early stages of deterioration.
By contrast, surface resistivity and ground-penetrating radar (GPR) are more responsive to ISR-induced microstructural changes, as they operate based on electrical and dielectric properties influenced by moisture ingress, ionic mobility, and pore connectivity. These characteristics tend to evolve throughout the progress of ISR-induced damage, even before visible cracking develops. In the dataset analyzed, both surface resistivity and GPR successfully differentiated Group D (i.e., ultra-high damage) from the other groups, with surface resistivity also distinguishing moderate deterioration. However, the overlap observed between Groups A (i.e., negligible) and B (i.e., marginal), where expansion ranged from 0.00–0.03% to 0.04 ± 0.01%, respectively, indicates a resolution gap in capturing the most incipient damage.
Resonant frequency, on the other hand, testing demonstrated greater accuracy across all damage levels by detecting reductions in dynamic stiffness associated with internal microcracking. As shown in Figure 14, as damage progresses (from 0.05% to ≥1.00% expansion), the frequency of vibration gradually decreases due to stiffness loss. The frequency shift is related to the envelope of the free vibration amplitude decay, which captures changes in the internal energy dissipation capacity of the material (Figure 15). This enables the technique to detect subtle changes in mechanical integrity even before significant expansion.
Quantitative indicators across sleeper groups reinforce this sensitivity. From Group A (1 year old, negligible damage) to Group D (12 years old, ultra-high damage), the damage progression was marked by an increase in DRI (from 112 to 1310), SDI (from 0.05 to 0.29), and PDI (from 0.02 to 0.41). More notably, the modulus of elasticity (ME) decreased sharply, from 28.78 GPa in Group A to 6.50 GPa in Group D, corresponding to a 77.4% reduction. Intermediate stages followed the same trend: Group B (marginal) showed a ~18.8% ME loss, while Group C (moderate) experienced a ~48.6% drop. These changes were successfully captured by resonant frequency testing through decreases in free vibration frequency, even in the absence of substantial expansion and despite the presence of cracks partially or fully filled with reaction products. The decay of the free vibration signal, governed by internal energy absorption, explains the method’s ability to detect ISR-induced damage even at early stages when traditional indicators remain inconclusive.
In contrast, UPV-based methods rely on continuous excitation and do not allow monitoring of free vibration decay. As illustrated in Figure 16, this limitation reduces their ability to capture internal energy dissipation, particularly at early stages. For specimens with negligible and marginal damage degrees (Groups A and B), the signal decay is insufficient to indicate meaningful internal damage. Attenuation becomes measurable only in later stages of deterioration. At this level, external cracks are visible to unaided eyes.
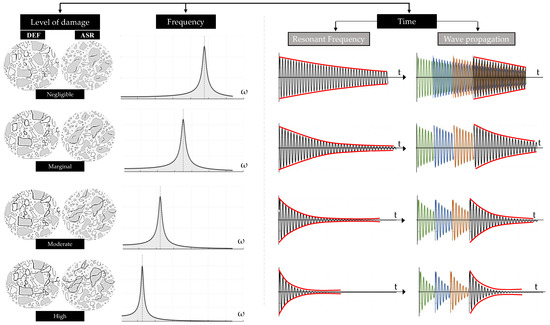
Figure 16.
Schematic representation of dynamic response differences between resonant frequency and wave propagation (UPV) methods in ISR-affected concrete. Red waves correspond to the signals measured by the instrument. Each additional color represents a wave introduced into the concrete material during testing, illustrating successive propagation events.
These findings emphasize the varying degrees of effectiveness among NDT methods in detecting the subtle microstructural and mechanical changes associated with early ISR-induced damage. While resonant frequency testing demonstrated superior sensitivity, particularly through frequency shifts associated with the development of cracks filled with reaction products, its sensitivity can still be refined. The next section explores how advanced interpretation of vibrational responses, particularly through modal analysis, can further enhance the accuracy of damage quantification screening and improve classification of early stage ISR deterioration.
6.3. Enhancing the Sensitivity in Estimating the Damage Degree in the Early Stage of the ISR-Affected Concrete
The reduction in the free vibration frequency observed in ISR-affected concrete can be further interpreted by analyzing the rate at which this vibration decays over time. This decay is directly associated with internal energy loss, which can be quantified through the damping ratio, a parameter that reflects the material’s internal friction and capacity to dissipate vibrational energy. This parameter is calculated using the half-power bandwidth method, as detailed in Section 4.4, which estimates damping from the frequency response curve obtained during resonant frequency testing. This method is particularly suitable for concrete, which typically exhibits low damping ratios, and offers a robust, physically grounded metric for assessing internal damage.
Damping provides a screening indication of microstructural changes by measuring how quickly the amplitude of vibration decreases after excitation. It captures internal energy dissipation due to microcracking, interfacial damage, and frictional effects, features that emerge early in the ISR-induced deterioration process but may remain undetected by other NDT techniques. Thus, damping is theoretically sensitive to the presence of internal damage and has the potential to aid routine inspections via meaningful physical interpretations linked to the dynamic behavior of the material.
The ability of damping to differentiate between damage levels was confirmed through one-way ANOVA and Tukey’s HSD post hoc analysis (Table 4). The ANOVA results (p-value < 0.0001) indicate statistically significant differences in damping across the four damage groups. The Tukey test further confirms that all group comparisons were statistically significant at the 95% confidence level, including between Groups A (negligible) and B (marginal), which many other techniques failed to distinguish. These findings reinforce the method’s high resolution and its capacity to identify even the earliest stages of ISR-induced deterioration.
Table 4.
One-way ANOVA and Tukey HSD post hoc of damping.
The results presented in Figure 17 illustrate the correlation between damping and multi-level assessment parameters: a) DRI and b) SDI. An important increasing trend is observed in both plots, where higher damping values correspond to greater damage as quantified by microscopic and mechanical testing results. As damping increases from negligible to ultra-high levels, DRI rises from approximately 112 to 1310, and SDI increases from 0.05 to 0.29. This alignment indicates that damping can serve as an effective damage screening parameter, especially when deterioration is not yet extensive enough to manifest through visual inspection and other NDT techniques.
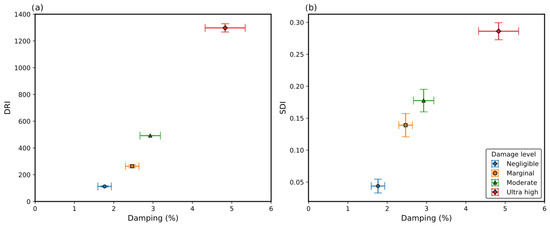
Figure 17.
(a) DRI and (b) SDI as a function of damping.
This finding supports the growing recognition that damping-related parameters offer valuable insight into early stage damage, especially in ISR-affected concrete, where stiffness alone may not sufficiently capture the extent or severity of deterioration. By integrating modal damping characteristics with existing condition assessment protocols as a screening tool, the sensitivity and accuracy of damage detection in field applications can be significantly improved. It is important to note that this approach is not intended to replace any existing test method; rather, it is designed to support routine inspection, providing reliable damage quantification estimates that inform decision-making. When abnormal or elevated damping is detected, a thorough condition assessment, such as the multi-level protocol combining the Damage Rating Index (DRI) and the Stiffness Damage Test (SDT), must be conducted to accurately determine the cause and extent of the deterioration.
7. Conclusions
This study investigated the reliability and sensitivity of several non-destructive testing (NDT) techniques for detecting varying degrees of deterioration in prestressed concrete sleepers affected by internal swelling reactions (ISR), specifically alkali-silica reaction (ASR) and delayed ettringite formation (DEF). The evaluation was benchmarked against a validated multi-level condition assessment protocol, incorporating both microscopic and mechanical indicators. Statistical analyses were conducted to quantify the performance of each NDT method. The results support the following conclusions:
- Conventional methods, such as the Schmidt hammer and ultrasonic pulse velocity (UPV), although commonly applied in concrete assessment, demonstrated limited sensitivity and reliability in distinguishing ISR-induced damage. Their limited performance is attributed to their reliance on wave transmission and impact rebound, which are not significantly affected when cracks are partially or fully filled with reaction products, such as ASR gel or delayed ettringite. These filling products preserve materials’ continuity and acoustic transmission while preventing impact energy absorption by the cracks, masking the early microstructural changes that precede visible deterioration.
- Electrical and electromagnetic-based techniques, including surface resistivity and ground-penetrating radar (GPR), demonstrated sensitivity to certain levels of ISR-induced deterioration. These methods respond to changes in pore structure, ion mobility, and moisture content, parameters that evolve early in the damage process. Although both were effective in identifying high levels of deterioration, only surface resistivity was able to partially resolve moderate damage levels. Nonetheless, both techniques exhibited limitations in detecting negligible or marginal damage, highlighting a very limited sensitivity.
- Resonant frequency testing emerged as the most reliable NDT method among those investigated. By capturing reductions in natural frequency associated with internal microstructural changes, this technique successfully distinguished between all four levels of damage extent investigated. Furthermore, the decay of the vibration signal provided additional insight into internal energy dissipation, and its quantification through the damping ratio revealed an interesting correlation with key damage parameters such as DRI and SDI. The statistical analyses confirmed the ability of damping to separate even closely related deterioration levels, making it a promising screening parameter for early detection of ISR-induced damage. It is essential to note that validation in real-scale sleepers has yet to be performed.
Overall, this work highlights the complementary nature of NDT techniques and supports the use of modal analysis, particularly damping-based assessments, as a frontline screening tool in field inspections. When used in conjunction with established multi-level evaluation protocols, such approaches can significantly improve diagnostic accuracy in early damage detection and support more effective asset management strategies for concrete infrastructure affected by ISR, especially concrete sleepers of the type investigated in this work.
Author Contributions
R.M.: Writing—original draft, Writing—review & editing, Visualization, Validation, Methodology, Investigation, Formal analysis, Data curation, Conceptualization. M.E.G.: Writing—original draft, Writing—review & editing, Formal analysis, Validation, Investigation, Conceptualization. L.S.: Writing—review & editing, Validation, Supervision, Investigation, Conceptualization. A.C.d.S.: Writing—review & editing, Supervision. All authors have read and agreed to the published version of the manuscript.
Funding
This research was funded by VALE S.A. Project VALE 1.
Data Availability Statement
Supporting data will be provided by the corresponding author upon request.
Acknowledgments
The funding of this project was provided through a research contract obtained from VALE S.A.
Conflicts of Interest
The funders had no role in the design of the study, in the collection, analysis, or interpretation of data, in the writing of the manuscript, or in the decision to publish the results.
Abbreviations
The following abbreviations are used in this manuscript:
| Abbreviation | Definition |
| ACI | American Concrete Institute |
| ASR | Alkali-Silica Reaction |
| DEF | Delayed Ettringite Formation |
| DRI | Damage Rating Index |
| GPR | Ground-Penetrating Radar |
| ISR | Internal Swelling Reactions |
| ME | Modulus of Elasticity |
| NDT | Non-Destructive Testing |
| NLI | Non-Linearity Index |
| PDI | Plastic Deformation Index |
| SDI | Stiffness Damage Index |
| SEM | Standard Error of the Mean |
| UPV | Ultrasonic Pulse Velocity |
References
- International Federation for Structural Concrete (fib). Precast Concrete Railway Track Systems; State-of-the-Art Report Prepared by Task Group 6.5, Commission 6 “Prefabrication.” fib Bulletin No. 37; fib: Lausanne, Switzerland, 2006; ISBN 978-2-88394-077-2. ISSN 1562-3610. [Google Scholar]
- Carlsson, S.; Holmbom, E. Process Induced Prestress Losses in long Bed Systems for Railway Sleepers. Master’s Thesis, Chalmers University of Technology, Gothenburg, Sweden, 2012. [Google Scholar]
- Taherinezhad, J.; Sofi, M.; Mendis, P.A.; Ngo, T. A review of behaviour of prestressed concrete sleepers. Electron. J. Struct. Eng. 2013, 13, 1. [Google Scholar] [CrossRef]
- Tepponen, P.; Eriksson, B.E. Damages in Concrete Railway Sleepers in Finland. Nord. Concr. Res. 1987, 6, 199–209. [Google Scholar]
- Mielenz, R.C.; Marusin, S.L.; Hime, W.G.; Jugovic, Z.T. Investigation of prestressed concrete railway tie distress. Concr. Int. 1995, 17, 62–68. [Google Scholar]
- Rogers, C.A.; Tharmabala, T. Prestressed concrete members affected by alkali-silica reaction. ACI Mater. 1990, 12, 35–39. [Google Scholar]
- Qinhua, J.; Min, D.; Sufen, H. Investigation of deteriorated concrete railway ties. Cem. Concr. Res. 1996, 26, 999–1006. [Google Scholar] [CrossRef]
- Shayan, A.; Quick, G.W. Microscopic features of cracked and uncracked concrete railway sleepers. ACI Mater. 1992, 89, 348–361. [Google Scholar] [CrossRef]
- Sahu, S.; Thaulow, N. Delayed ettringite formation in Swedish concrete railroad ties. Cem. Concr. Res. 2004, 34, 1675–1681. [Google Scholar] [CrossRef]
- Silva, A.S.; Gonçalves, A.F.; Pipa, M. Diagnosis and Prognosis of Portuguese Concrete Railway Sleepers Degradation—A Combination of ASR and DEF; ICAAR: Trondheim, Norway, 2008; Volume 2, pp. 1–10. [Google Scholar]
- Petrova, Y.A.; Sorvacheva, T.M. Revisiting the durability of concrete structures. Sci. World 2013, 2, 30. [Google Scholar]
- Awasthi, A.; Matsumoto, K.; Nagai, K.; Asamoto, S.; Goto, S. Investigation on possible causes of expansion damages in concrete. J. Asian Concr. Fed. 2017, 3, 49–66. [Google Scholar] [CrossRef]
- Jokūbaitis, A.; Marčiukaitis, G.; Valivonis, J. Damage of prestressed concrete railway sleepers; its impact on durability. In Proceedings of the 13th International Conference “Modern Building Materials, Structures and Techniques” (MBMST 2019), Vilnius, Lithuania, 16–17 May 2019. [Google Scholar] [CrossRef]
- Medeiros, R.; De Souza, D.J.; Sanchez, L.F.M.; Santos, A.C. Condition assessment of pre-tensioning prestressed concrete sleepers distressed by internal swelling reactions (ISR). CEMENT 2025, 21, 100154. [Google Scholar] [CrossRef]
- Medeiros, R.; Sanchez, L.; Santos, A.C.D. Exploring microscopic and mechanical tools to uncover the anisotropic damage evolution of prestressed concrete sleepers affected by internal swelling reactions. Mag. Concr. Res. 2025, 58. [Google Scholar] [CrossRef]
- Gunn, R.M.; Scrivener, K.L.; Leemann, A. The identification, extent and prognosis of alkali-aggregate reaction related to existing dams in Switzerland. In Swelling Concrete in Dams and Hydraulic Structures; Sellier, É., Grimal, S., Multon, É., Bourdarot, A., Eds.; Wiley: Hoboken, NJ, USA, 2017; pp. 117–143. [Google Scholar]
- Valdes, A. “Renovadora MATISA” Alcançou Mais de 1 Milhão de Dormentes Substituídos. 2021. Available online: https://abifer.org.br/renovadora-matisa-alcancou-mais-de-1-milhao-de-dormentes-substituidos/ (accessed on 17 June 2021).
- Zhang, D.; Zhai, W.; Wang, K.; Liu, P. Vertical Vibration Characteristics of a Concrete Sleeper with Cracks in a Heavy-Haul Railway. In ICTE; American Society of Civil Engineers: Reston, VA, USA, 2015; pp. 1213–1221. [Google Scholar] [CrossRef]
- Diamond, S. A review of alkali-silica reaction and expansion mechanisms and Reactive aggregates. Cem. Concr. Res. 1976, 6, 549–560. [Google Scholar] [CrossRef]
- Rajabipour, F.; Giannini, E.; Dunant, C.; Ideker, J.H.; Thomas, M.D.A. Alkali–silica reaction: Current understanding of the reaction mechanisms and the knowledge gaps. Cem. Concr. Res. 2015, 76, 130–146. [Google Scholar] [CrossRef]
- Leemann, A.; Góra, M.; Lothenbach, B.; Heuberger, M. Alkali silica reaction in concrete—Revealing the expansion mechanism by surface force measurements. Cem. Concr. Res. 2024, 176, 107392. [Google Scholar] [CrossRef]
- Sanchez, L.F.M.; Fournier, B.; Jolin, M.; Duchesne, J. Reliable quantification of AAR damage through assessment of the Damage Rating Index (DRI). Cem. Concr. Res. 2015, 67, 74–92. [Google Scholar] [CrossRef]
- Sanchez, L.F.M.; Fournier, B.; Jolin, M.; Mitchell, D.; Bastien, J. Overall assessment of Alkali-Aggregate Reaction (AAR) in concretes presenting different strengths and incorporating a wide range of reactive aggregate types and natures. Cem. Concr. Res. 2017, 93, 17–31. [Google Scholar] [CrossRef]
- Taylor, H.F.W.; Famy, C.; Scrivener, K.L. Delayed ettringite formation. Cem. Concr. Res. 2001, 31, 683–693. [Google Scholar] [CrossRef]
- Kchakech, B.; Martin, R.-P.; Metalssi, O.O.; Renaud, J.-C.; Baron, L. Effect of temperature and curing duration of early heat treatments on the risk of expansion associated with delayed ettringite formation. In Proceedings of the 15th International Conference on Alkali Aggregate Reaction (ICAAR), São Paulo, Brazil, 3–7 July 2016. [Google Scholar]
- Scrivener, K.; Skalny, J.P. Conclusions of the International RILEM TC 186-ISA Workshop on Internal Sulfate Attack and Delayed Ettringite Formation (4–6 September 2002, Villars, Switzerland). Mater. Struct. 2005, 38, 659–663. [Google Scholar] [CrossRef]
- Martin, R.P. Analyse sur Structures Modèles des Effets Mécaniques de la Réaction Sulfatique Interne du Béton. Ph.D. Thesis, Université Paris Est, Pairs, France, 2010. [Google Scholar]
- Divet, L.; Pavoine, A. Delayed Ettringite Formation in massive concrete structures: An account of some studies of degraded bridges. In International RILEM TC 186-ISA Workshop on Internal Sulfate Attack and Delayed Ettringite Formation; Scrivener, K.L., Skalny, J.P., Eds.; RILEM Publications S.A.R.L.: Villars, Switzerland, 2002; pp. 98–126. [Google Scholar]
- Godart, B.; Omikrine-Metalssi, O.; Kchakech, B.; Lavaud, S. The effects of delayed ettringite formation on the expansion of a massive bridge pier and a precast prestressed concrete beam of a bridge. In Proceedings of the 15th ICAAR, São Paulo, Brazil, 3–7 July 2016. [Google Scholar]
- Sanchez, L.F.M.; Drimalas, T.; Fournier, B.; Mitchell, D.; Bastien, J. Comprehensive damage assessment in concrete affected by different internal swelling reaction (ISR) mechanisms. Cem. Concr. Res. 2018, 107, 284–303. [Google Scholar] [CrossRef]
- Raj, A.; Deshmukh, P.; Pradeepa, S. A Study to Establish Correlation Between Rebound Value and Compressive Strength of Concrete Using Materials Available Locally in Nagpur. Int. J. Res. Advent Technol. 2021, 9, 1–6. [Google Scholar] [CrossRef]
- Malhotra, V.M.; Carino, N.J. Handbook on Nondestructive Testing of Concrete, 2nd ed.; CRC Press (Taylor & Francis Group): Boca Raton, FL, USA, 2003. [Google Scholar]
- ACI Committee. 228.2R-13: Report on Nondestructive Test Methods for Evaluation of Concrete in Structures; American Concrete Institute: Farmington Hills, MI, USA, 2013. [Google Scholar] [CrossRef]
- EN 13791:2019; Assessment of In-Situ Compressive Strength in Structures and Precast Concrete Components. European Committee for Standardization (CEN): Brussels, Belgium, 2019.
- Komlos, K.; Popovics, S.; Nürnbergerová, T.; Babál, B.; Popovics, J.S. Ultrasonic pulse velocity test of concrete properties as specified in various standards. Cem. Concr. Compos. 1996, 18, 357–364. [Google Scholar] [CrossRef]
- Dashti, D. A study of the NDT Techniques Using Ultrasonic Pulse Velocity Test and Microwave Oven Method on SCC and TVC. Master’s Thesis, West Virginia University, Morgantown, WV, USA, 2016. [Google Scholar]
- C666; Test Method for Resistance of Concrete to Rapid Freezing and Thawing. ASTM International Standard: West Conshohocken, PA, USA, 2015.
- Wang, S.; Bai, Y.; Zhang, X.; Fan, L.; Zhou, H. Magnetic Domain-Wall Induced Electric Polarization in NdCrO3 Polycrystalline Ceramic. Materials 2020, 13, 1904. [Google Scholar] [CrossRef] [PubMed]
- Polder, R.B. Test methods for on site measurement of resistivity of concrete—A RILEM TC-154 technical recommendation. Constr. Build Mater. 2001, 15, 125–131. [Google Scholar] [CrossRef]
- Gowers, K.R.; Millard, S.G. Measurement of Concrete Resistivity for Assessment of Corrosion Severity of Steel Using Wenner Technique. ACI Mater. 1999, 96, 536–541. [Google Scholar]
- Morris, W.; Moreno, E.I.; Sagüés, A.A. Practical evaluation of resistivity of concrete in test cylinders using a Wenner array probe. Cem. Concr. Res. 1996, 26, 1779–1787. [Google Scholar] [CrossRef]
- Sansalone, N.J.; Carino, M. Stress wave propagation methods. In Nondestructive Testing of Concrete; Malhotra, N.J., Carino, V.M., Eds.; CRC Press: Boca Raton, FL, USA, 1991. [Google Scholar]
- Subramaniam, K.V.; Popovics, J.S.; Shah, S.P. Determining elastic properties of concrete using vibrational resonance frequencies of standard test cylinders. ACI Mater. 2000, 97, 650–659. [Google Scholar]
- Ahmed, M.S.; Mohammand, F.A. Experimental modal analysis of reinforced concrete square slabs. Civ. Environ. Eng. 2015, 9, 448–452. [Google Scholar]
- Khalil, A.E.-A.; Etman, E.; Atta, A.; Essam, M. Strengthening of rc beams subjected to cyclic load using ultra high-performance strain hardening cementitious composites. Resilient Struct. Sustain. Constr. 2024, 64, 1264–1270. [Google Scholar] [CrossRef]
- Liu, Y.; Zhang, Y.; Wang, Y. Experimental modal analysis of RC beams strengthened with SHCC under cyclic loading. Eng. Struct. 2022, 264, 114459. [Google Scholar]
- Meruane, V.; Yanez, S.J.; Quinteros, L.; Flores, E.I.S. Damage Detection in Steel–Concrete Composite Structures by Impact Hammer Modal Testing and Experimental Validation. Sensors 2022, 22, 3874. [Google Scholar] [CrossRef]
- Sanchez, L.F.M.; Fournier, B.; Mitchell, D.; Bastien, J. Condition assessment of an ASR-affected overpass after nearly 50 years in service. Constr. Build Mater. 2020, 236, 117554. [Google Scholar] [CrossRef]
- Sanchez, L.F.M.; Fournier, B.; Jolin, M.; Bastien, J. Evaluation of the stiffness damage test (SDT) as a tool for assessing damage in concrete due to ASR: Test loading and output responses for concretes incorporating fine or coarse reactive aggregates. Cem. Concr. Res. 2014, 56, 213–229. [Google Scholar] [CrossRef]
- Sanchez, L.F.M.; Fournier, B.; Jolin, M.; Bastien, J.; Mitchell, D. Practical use of the Stiffness Damage Test (SDT) for assessing damage in concrete infrastructure affected by alkali-silica reaction. Constr. Build Mater. 2016, 125, 1178–1188. [Google Scholar] [CrossRef]
- Ewins, D.J.; Testing, M. Theory, Practice and Application; Research Studies Press: Hertfordshire, UK, 2000. [Google Scholar]
- Wei, J.; Dong, J.H.; Ke, W. The influence of cooling processes on the corrosion performance of the rebar scale. Constr. Build Mater. 2010, 24, 275–282. [Google Scholar] [CrossRef]
- Olmos, J.M.; Roesset, B.A. Analytical Evaluation of the Accuracy of the Half-Power Bandwidth Method to Estimate Damping Ratios in a Structure. In Proceedings of the International Conference on Structural Health Monitoring of Intelligent Infrastructure (SHMII-4), Zurich, Switzerland, 22–24 July 2009. [Google Scholar]
- COMITE EURO-INTERNATIONAL DU BETON (CEB). Bulletin D’Information no 192: Diagnosis and Assessment of Concrete Structures. 1989. Available online: https://www.fib-international.org/publications/ceb-bulletins/diagnosis-and-assessment-of-concrete-structures-detail.html (accessed on 20 May 2021).
- Whitehurst, E.A. Evaluation of Concrete Properties from Sonic Tests; The Iowa State University Press: Ames, IA, USA, 1966. [Google Scholar]
Disclaimer/Publisher’s Note: The statements, opinions and data contained in all publications are solely those of the individual author(s) and contributor(s) and not of MDPI and/or the editor(s). MDPI and/or the editor(s) disclaim responsibility for any injury to people or property resulting from any ideas, methods, instructions or products referred to in the content. |
© 2025 by the authors. Licensee MDPI, Basel, Switzerland. This article is an open access article distributed under the terms and conditions of the Creative Commons Attribution (CC BY) license (https://creativecommons.org/licenses/by/4.0/).