Article

Experimental Study on the Pullout Behavior of Helical Piles in Geogrid-Reinforced Dense Shahriyar Sand

1
Department of Civil Engineering, School of Engineering, Damghan University, Damghan 36716-45667, Iran
2
Faculty of Civil Engineering, Shahid Rajaee Teacher Training University, Tehran 16788-15811, Iran
3
Faculty of Civil Engineering, Babol Noshirvani University of Technology, Babol 47148-73113, Iran
4
Department of Civil Engineering, Faculty of Engineering and Technology, University of Mazandaran, Babolsar 47416-13534, Iran
5
Department of Design, Civil Engineering for Risk Mitigation, Politecnico di Milano, 20133 Milan, Italy
6
Department of Civil Engineering, Roodehen Science and Research Branch, Islamic Azad University, Tehran 39731-88981, Iran
*
Authors to whom correspondence should be addressed.
Buildings 2025, 15(16), 2963; https://doi.org/10.3390/buildings15162963
Submission received: 29 July 2025 / Revised: 14 August 2025 / Accepted: 19 August 2025 / Published: 21 August 2025
(This article belongs to the Section Building Structures)

Abstract

This study investigates the effectiveness of combining helical piles (HPs) with geogrid reinforcement compared to conventional piles in improving pullout performance in dense sand, addressing a key challenge in reinforced foundation design. A comprehensive experimental program was conducted to evaluate the pullout behavior of HPs embedded in Shahriyar sand reinforced with geogrid layers. The research focused on quantifying the effects of critical parameters—pile configuration, helix pitch, and geogrid placement depth—on ultimate pullout capacity and displacement response to better understand hybrid reinforcement mechanisms. Pullout tests were performed using a Zwick/Roell Z150 universal testing machine with automated data acquisition via TestXpert11 V3.2 software. The experimental program assessed the following influences: (1) pile configurations—plain, single-helix, and double-helix; (2) helix pitch ratios of 1.00, 1.54, and 1.92 (pitch-to-shaft diameter); and (3) geogrid placement depths of 7.69, 11.54, and 15.38 (depth-to-shaft diameter) on pullout behavior. Results demonstrate that geogrid reinforcement substantially enhances pullout resistance, with single-helix HPs achieving up to a 518% increase over plain piles. Pullout resistance is highly sensitive to geogrid spacing, with optimal performance at a non-dimensional distance of 0.47 from the pile–soil interface. Additionally, double-blade HPs with geogrid placed at 0.35 exhibit a 62% reduction in displacement ratio, underscoring the role of geogrid in improving pile stiffness and load-bearing capacity. These findings provide new insights into the synergistic effects of helical pile geometry and geogrid placement for designing efficient reinforced granular foundations.

1. Introduction

Helical piles are regarded as a practical option for foundations in many engineering applications, such as the foundations of residences, businesses, utility poles, and pedestrian bridges [1]. These advantages include ease of installation, particularly in locations with limited access, low sound and vibration levels, and cost effectiveness.
Helical piles have emerged as a reliable deep foundation solution for various applications. Full-scale testing by Sakr [2,3] demonstrated their effectiveness in supporting structures on oil sands and dense sand, with tensile capacities reaching up to 2900 kN (around 80% of compressive capacities). These studies highlight the importance of both full-scale testing and numerical modeling for understanding helical pile behavior. While full-scale testing provides valuable real-world data, it can be expensive and limited in scope. Numerical modeling offers a cost-effective way to investigate pile behavior under various conditions. However, the accuracy of numerical models relies heavily on a reliable constitutive rule.
Further research has focused on optimizing helical pile design for specific applications. Spagnoli et al. [4] investigated the pullout capacity of helical piles in sand through small-scale models. Their findings suggest an optimal helix-to-shaft diameter ratio of 1.5 to 2.0 for balancing resistance and ease of installation. Studies by George et al. [5] explored the efficiency of double-bladed helical piles in cohesionless soil, demonstrating significant increases in bearing capacity compared to single-bladed designs. This research investigated the influence of soil density and helical blade geometry on axial capacity in cohesionless soils. Wang et al. [6] proposed a theoretical method to predict uplift capacity considering installation processes. Recent finite element modeling by Angurana et al. [7] further explored uplift capacity, suggesting its dependence on factors like embedment depth, friction angle, helical configuration, and spacing between helices.
Many researchers focused on the response of the load–displacement curve and load transfer by various sections of multi-helix piles under uplift and compressive loads. These studies looked at the axial response of helical piles in cohesionless, cohesive, and structured soils. Hence, some recent experimental simulations [8,9,10,11] and numerical simulations [12,13,14,15,16,17,18], as well as analytical models [19,20], have been conducted.
Furthermore, soil reinforcement with geogrids, a low-cost geosynthetic material, is a well-established technique for improving soil properties like bearing capacity, stability, and pullout resistance. Studies by Jawad and Shakir [21] and Ahmad and Mahboubi [22] demonstrate the effectiveness of geogrids in enhancing the performance of shallow foundations, strip foundations, and helical pile uplift capacity, respectively. Understanding the geogrid–soil interface behavior is crucial for optimal design, as shown by Liu et al. [23] who investigated the influence of factors like normal stress and soil composition on pullout behavior in gravelly soils.
The combined use of helical piles and geogrids offers promising solutions for projects requiring strong and stable foundation systems. For instance, the Beigan Canal slope repair project utilized this combination to improve the safety factor against slope sliding [24]. Studies have shown significant improvements in load capacity and ground stiffness when geosynthetics are incorporated in geosynthetic-reinforced granular piles [25]. Furthermore, geosynthetic-reinforced soil (GRPS) embankments, which combine retaining piles and geogrids, have gained popularity due to their faster construction time and minimized displacements. Recent research suggests that geogrid layers facilitate the transfer of embankment loads to piles through the soil arch effect [26]. GRPS embankments, effectively reinforced by vertical piles and geogrids, are a common solution for high-speed railway lines in China [27].
Helical piles have emerged as a versatile and efficient foundation solution for various engineering applications, offering advantages such as ease of installation, low noise and vibration levels, and cost-effectiveness. However, their performance can be significantly influenced by soil conditions. Geogrids, on the other hand, are a low-cost geosynthetic material that can enhance soil properties, including bearing capacity and pullout resistance. While both helical piles and geogrids have been studied extensively individually, research on their combined use is relatively limited. This research explores the synergistic integration of helical piles and geogrid reinforcement to enhance foundation performance. Helical piles support the geogrid, creating a more stable soil system, while the study evaluates their combined effect on pullout resistance and displacement reduction. The novelty lies in the systematic parametric investigation of helical pile geometry (helix pitch and number of plates) and geogrid depth simultaneously—a combination rarely examined with such precision. This approach provides high-quality data to reveal soil–geogrid–pile interaction mechanisms and offers practical insights for optimizing reinforced foundation systems in challenging soils.

2. Methodology

2.1. Testing Program

The experiment, conducted at Shahid Rajaee University’s Structural Lab, assessed the pullout capacity of a model reinforced soil structure with scaled-down helical piles. To achieve this, a dedicated testing box was designed to fit within a universal testing machine (UTM) alongside Shahriar sand, geogrids for soil reinforcement, and the custom-built helical piles. The test box, measuring 700 mm × 500 mm × 1000 mm, was constructed from steel plates with a thickness of 5 mm. These dimensions were selected to reduce boundary effects, following the approach outlined by Mooney et al. [28]. This setup allowed researchers to precisely measure pullout force and displacement, providing valuable data on the effectiveness of helical piles and geogrids in enhancing soil performance. Sampling was conducted in three scenarios: (1) uplift capacity of a standalone helical pile foundation (using a shaft pile), (2) uplift capacity of a helical pile foundation with varying helical plate pitches in unreinforced soil, and (3) uplift capacity of a shaft pile and helical pile foundation with varying helical plate pitches in geogrid-reinforced soil. The number and dimensions of the samples followed established laboratory testing standards. Figure 1 displays the schematic representation of helical pile configurations, with and without geogrid-reinforced soil, under axial tension.

2.2. Dimensional Analysis

This section identifies a set of normalized parameters for interpreting test results independent of the problem’s scale or scope. Dimensional analysis was used for this purpose, following approaches by Westine et al. [29] and Sedran et al. [30]. Buckingham π theorem [31], as one of the methods for nondimensionalization and dimensional analysis, was applied. The effective parameters governing the performance of helical piles in geogrid-reinforced soil reinforcement soil are shown in Figure 1, and the corresponding function, f q i , is defined as follows:
f q i = f φ ,   n ,   d ,   L ,   L ,   a ,   b ,   L a ,   S ,   t p ,   L a ,   D h ,   t h ,   S ,   E p ,   E s ,   G p ,   T ,   d s = 0 ,
where q i i = 1 , , N are effective parameters including, friction angle φ ,   number of helices n, shaft diameter d , total length of pile L, embedded length of pile L , geogrid length a, geogrid width b, spacing between helices La, spacing between geogrid and ground surface S , shaft thickness t p , spacing between the pile tip and bottom helix L a , diameter of helix D h , helix thickness t h , pitch S, elastic modules of pile E p , elastic modules of soil E s , shear modules of pile G p , axial load T , and pile displacement d s . The dimensions of the effective parameters in Equation (1) are the following:
dim φ , n = 1 dim d ,   L ,   L ,   a ,   b ,   S ,   L a ,   t p ,   L a ,   D h ,   t h ,   S ,   d s = L dim E p , E s , G p = M L 1 T 2 dim T = M L T 2 .
A set of dimensionless parameters π j j = 1 , , p , where p represents the total number of dimensionless parameters constructed from the effective parameters, q i , can typically be interpreted as the ratio of two quantities with the same dimension, as follows:
π 1 = φ , π 2 = n , π 3 = L d , π 4 = L d , π 5 = a d , π 6 = b d , π 7 = L a d , π 8 = S d , π 9 = t p d , π 10 = L a d , π 11 = D h d , π 12 = t h d , π 13 = S d , π 14 = E s E p , π 15 = G p E p , π 16 = d s d ,
The remaining quantities are Q , d , and E p . We need only the k = N p = 1 ( k : maximal dimensionally independent) dimensionless parameter, denoted by π 17 , and the model can be re-expressed as follows:
π 17 = T × E p α × d β = M L T 2 × M α L α T 2 α × L β = M α + 1 L 1 α + β T 2 2 α = 1 .
Equating the coefficient of each power of fundamental units ( M , L , and T ) to zero, the exponents α and β are obtained equal to −1 and −2, respectively. Hence, we have the following:
π 14 = T E p × d 2 .
Applying dimensional analysis, and selecting two parameters E p and d as repeating variables, Equation (1) can be restated as below:
g φ ,   n ,   L d ,   L d ,   a d ,   b d ,   L a d ,   S d ,   t p d ,   L a d ,   D h d ,   t h d ,   S d ,   E s E p ,   G p E p ,   T E p × d 2 ,   d s d = 0 .
In Equation (6), most parameters relate to pile geometry. Since the present experiments used piles of similar geometry and soil properties, several dimensionless parameters remain constant and can be omitted. Thus, Equation (6) reduces to Equation (7), with uplift capacity evaluated for different numbers of helices, installation helices spacings, and geogrid depth.
T d = T E p × d 2 = ( n ,   S d , L a d , S d , d s d )
The analysis was conducted under the assumptions of homogeneous, isotropic, dry granular soil, subjected to uniform axial loading, while neglecting the effects of installation-induced disturbances. These simplifications were adopted to ensure dimensional consistency and preserve analytical tractability. Nevertheless, it should be recognized that, in practical field conditions, factors such as installation torque, soil stratification, and anisotropy may significantly influence the pile response.

2.3. Helical Pile Model Design and Construction

The dimensions of the helical pile were selected to comply with the height limitations of the universal testing machine (UTM) used in the experiments. Additionally, the design recommendations of Chen et al. [32] were incorporated to ensure that the pile geometry was representative of practical applications. The pile consisted of a central steel shaft with a diameter of 0.5 in. (≈13 mm), to which helical plates were welded. Tungsten inert gas (TIG) welding was employed to securely attach the helices to the steel shaft at the designated locations.
The criteria suggested by previous studies [33,34] were used to identify the properties of the used helices. Thus, the properties of helices, including their diameter ( D h ), thickness ( t h ), pitch (S), and spacing ( L a ) were calculated due to the diameter of the pile model as follows:
D h = 2 4 d = 3.9 × 13 51   mm t h d = 1 5 t h = 13 5 t h 2.5   mm S d = 1 ,   1.5 ,   and   2 S 13 , 20 , and   25   mm .
Helical piles were made of a steel tube with a diameter of 13 mm and length of 600 mm, and the helical plate pitches of 13, 20, and 25 mm were considered to evaluate the pitch effects on the displacement and pile capacities.
The spacing between the helical blades was determined based on the performance of the cylindrical shear mode, assuming a maximum of two helical blades, as follows:
L a = 2 3 D h L a = 2.3 D h 115   m m H 1 5 D h H 1 265   m m

2.4. Soil Testing Procedures

Several soil tests were conducted to characterize the properties of the sand used in the study. These tests were as outlined below.
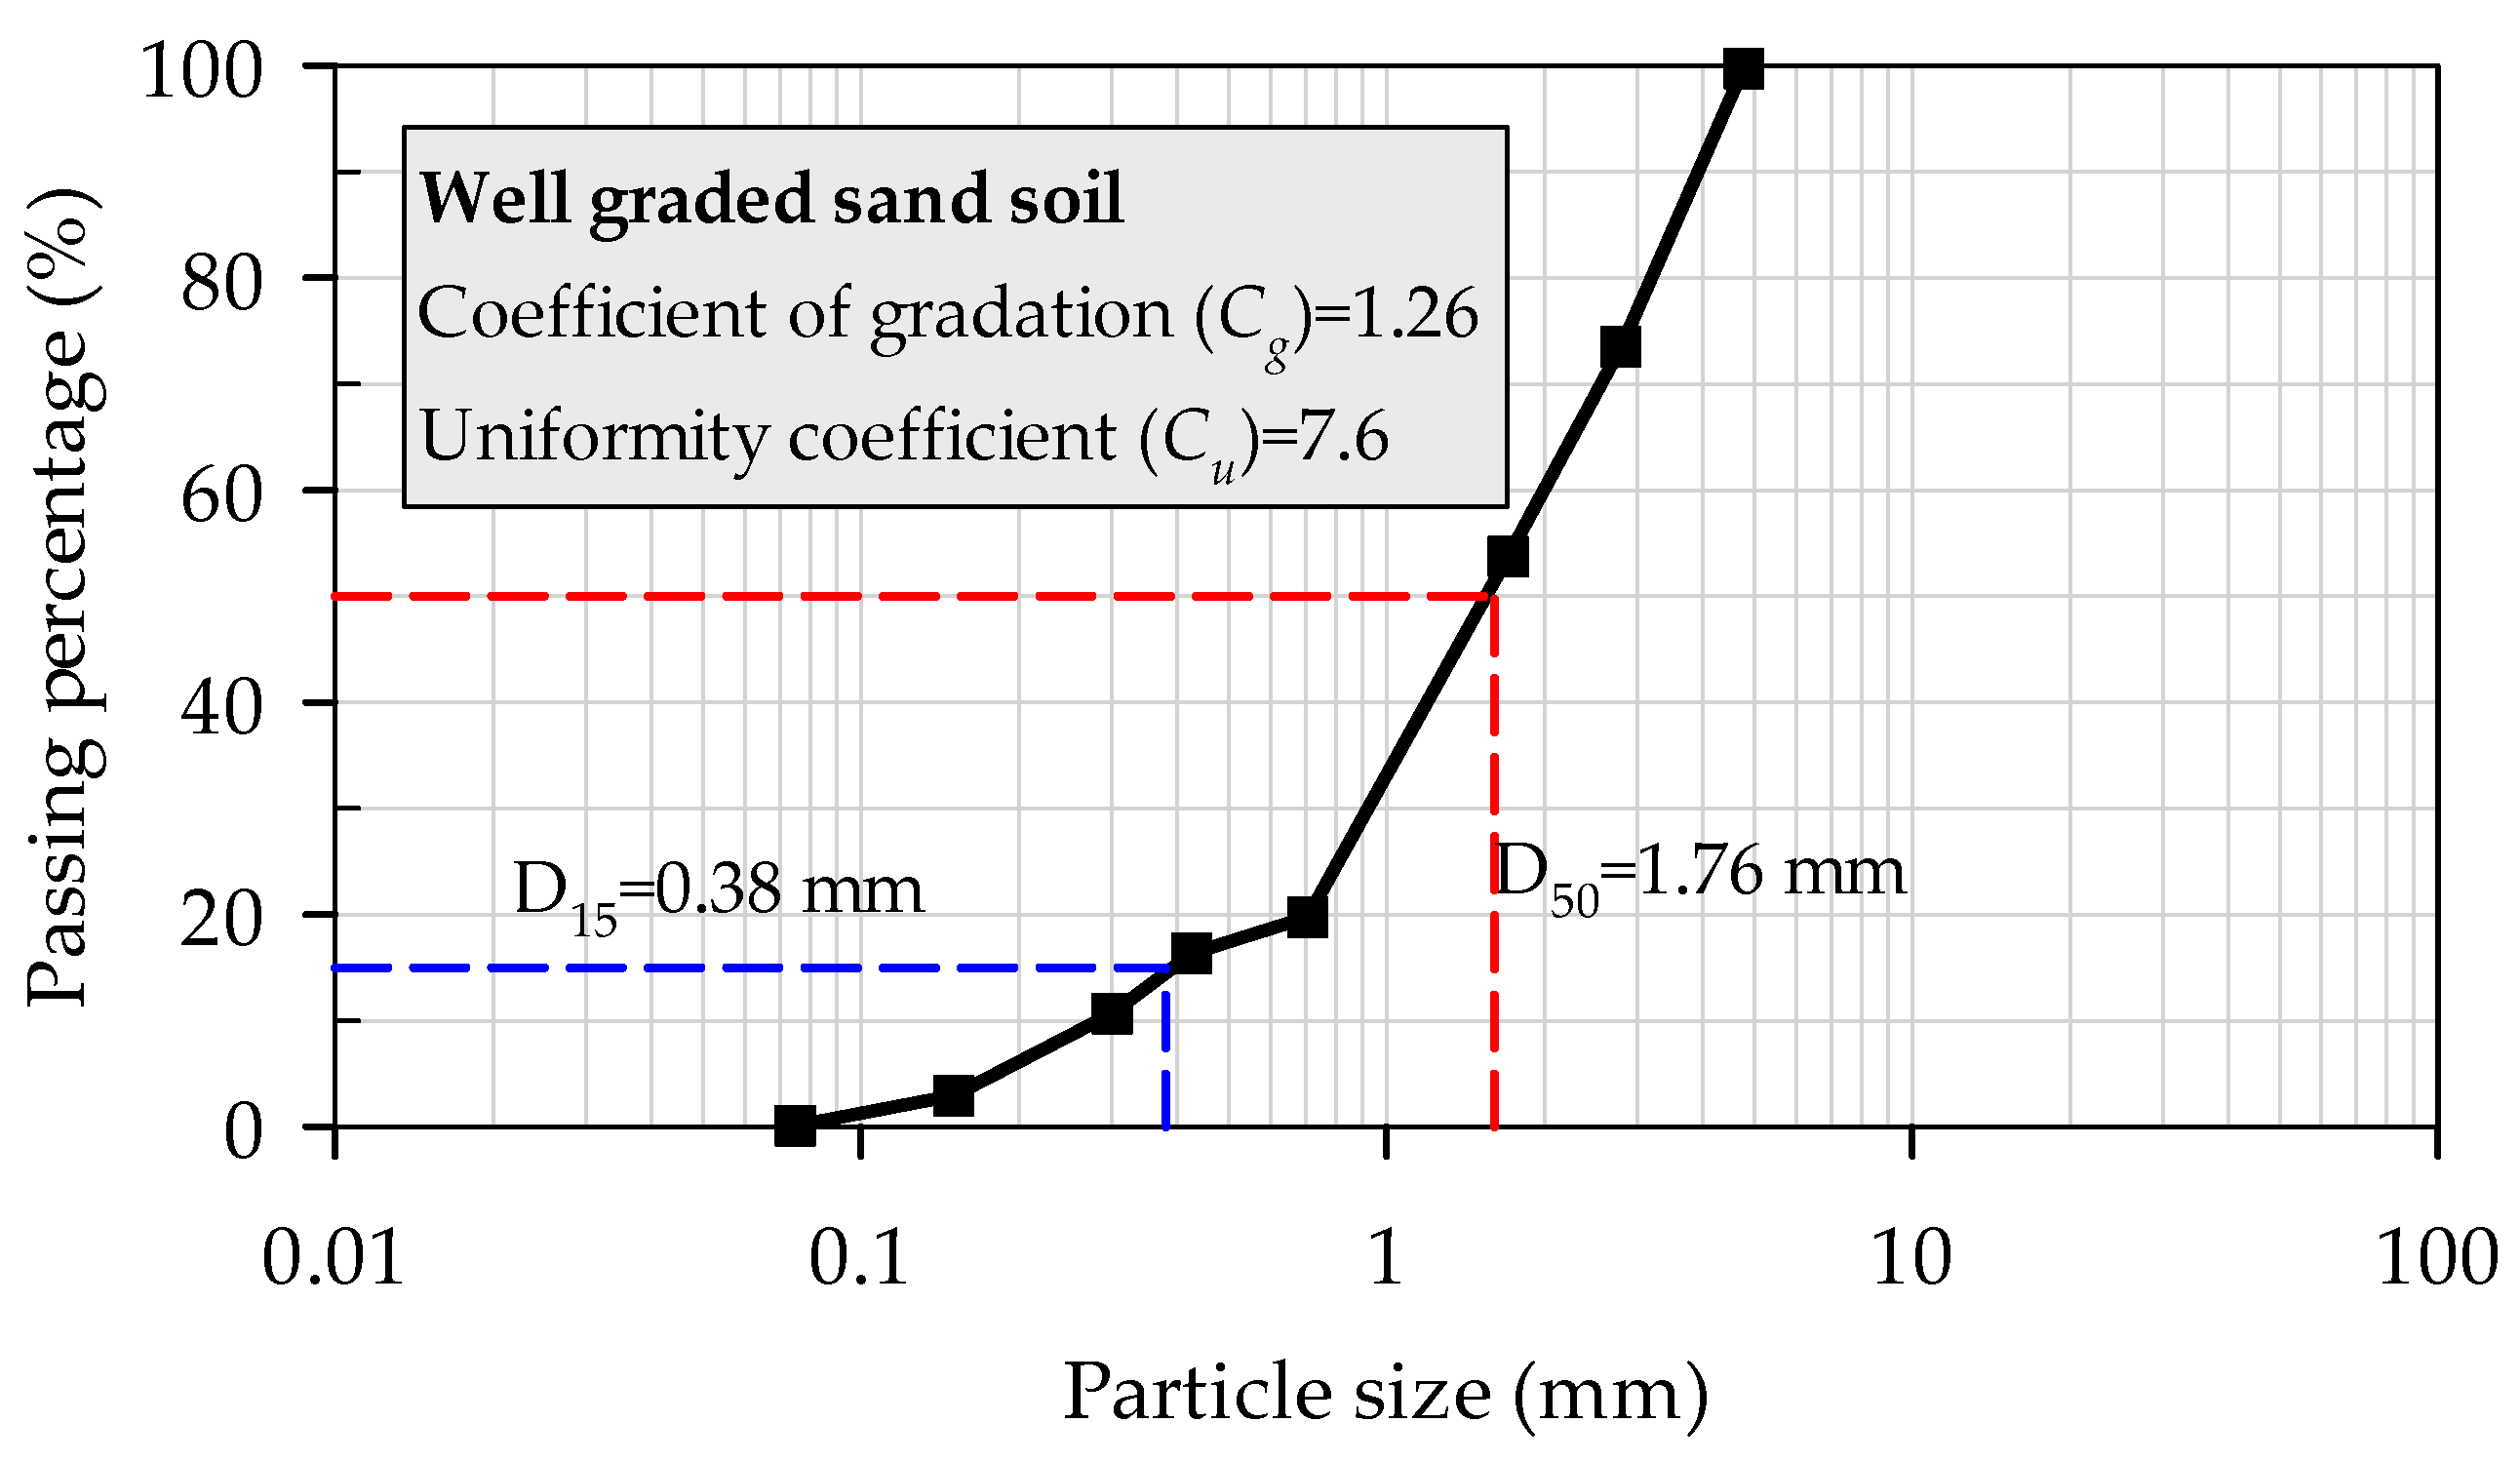
Particle-size analysis of soil: The particle size distribution test was performed in accordance with ASTM D422 [35]. Based on the Unified Soil Classification System (USCS), the tested soil was classified as well graded sand. The grain size distribution curve of the soil is presented in Figure 2. In terms of angularity, the sand is classified as angular to sub-angular (crushed sand).
Specific gravity (Gs) test: The specific gravity of the sand grains was determined in accordance with ASTM D854 [36]. Three representative sand samples were tested, and the average value was taken as the specific gravity. The average specific gravity of soil was 2.46.
Direct shear test: This test was conducted in accordance with ASTM D3080 [37] to determine the internal friction angle of the sand. The friction angle reflects the resistance of sand particles to sliding against one another. The measured internal friction angle was 38°.
Minimum and maximum dry unit weight tests: These tests, performed in accordance with ASTM D4254 [38] and ASTM D4253 [39], respectively, were conducted to determine the minimum and maximum dry densities that the sand can achieve under compaction. The minimum and maximum dry densities were obtained as 1.78 gr/cm3 and 1.98 gr/cm3, respectively.
Moisture content test: This test, conducted in accordance with ASTM D2216 [40], was performed to determine the water content of three sand samples. The average water content of the Shahriar sand soil was 0.48%.

2.5. Geogrid Model

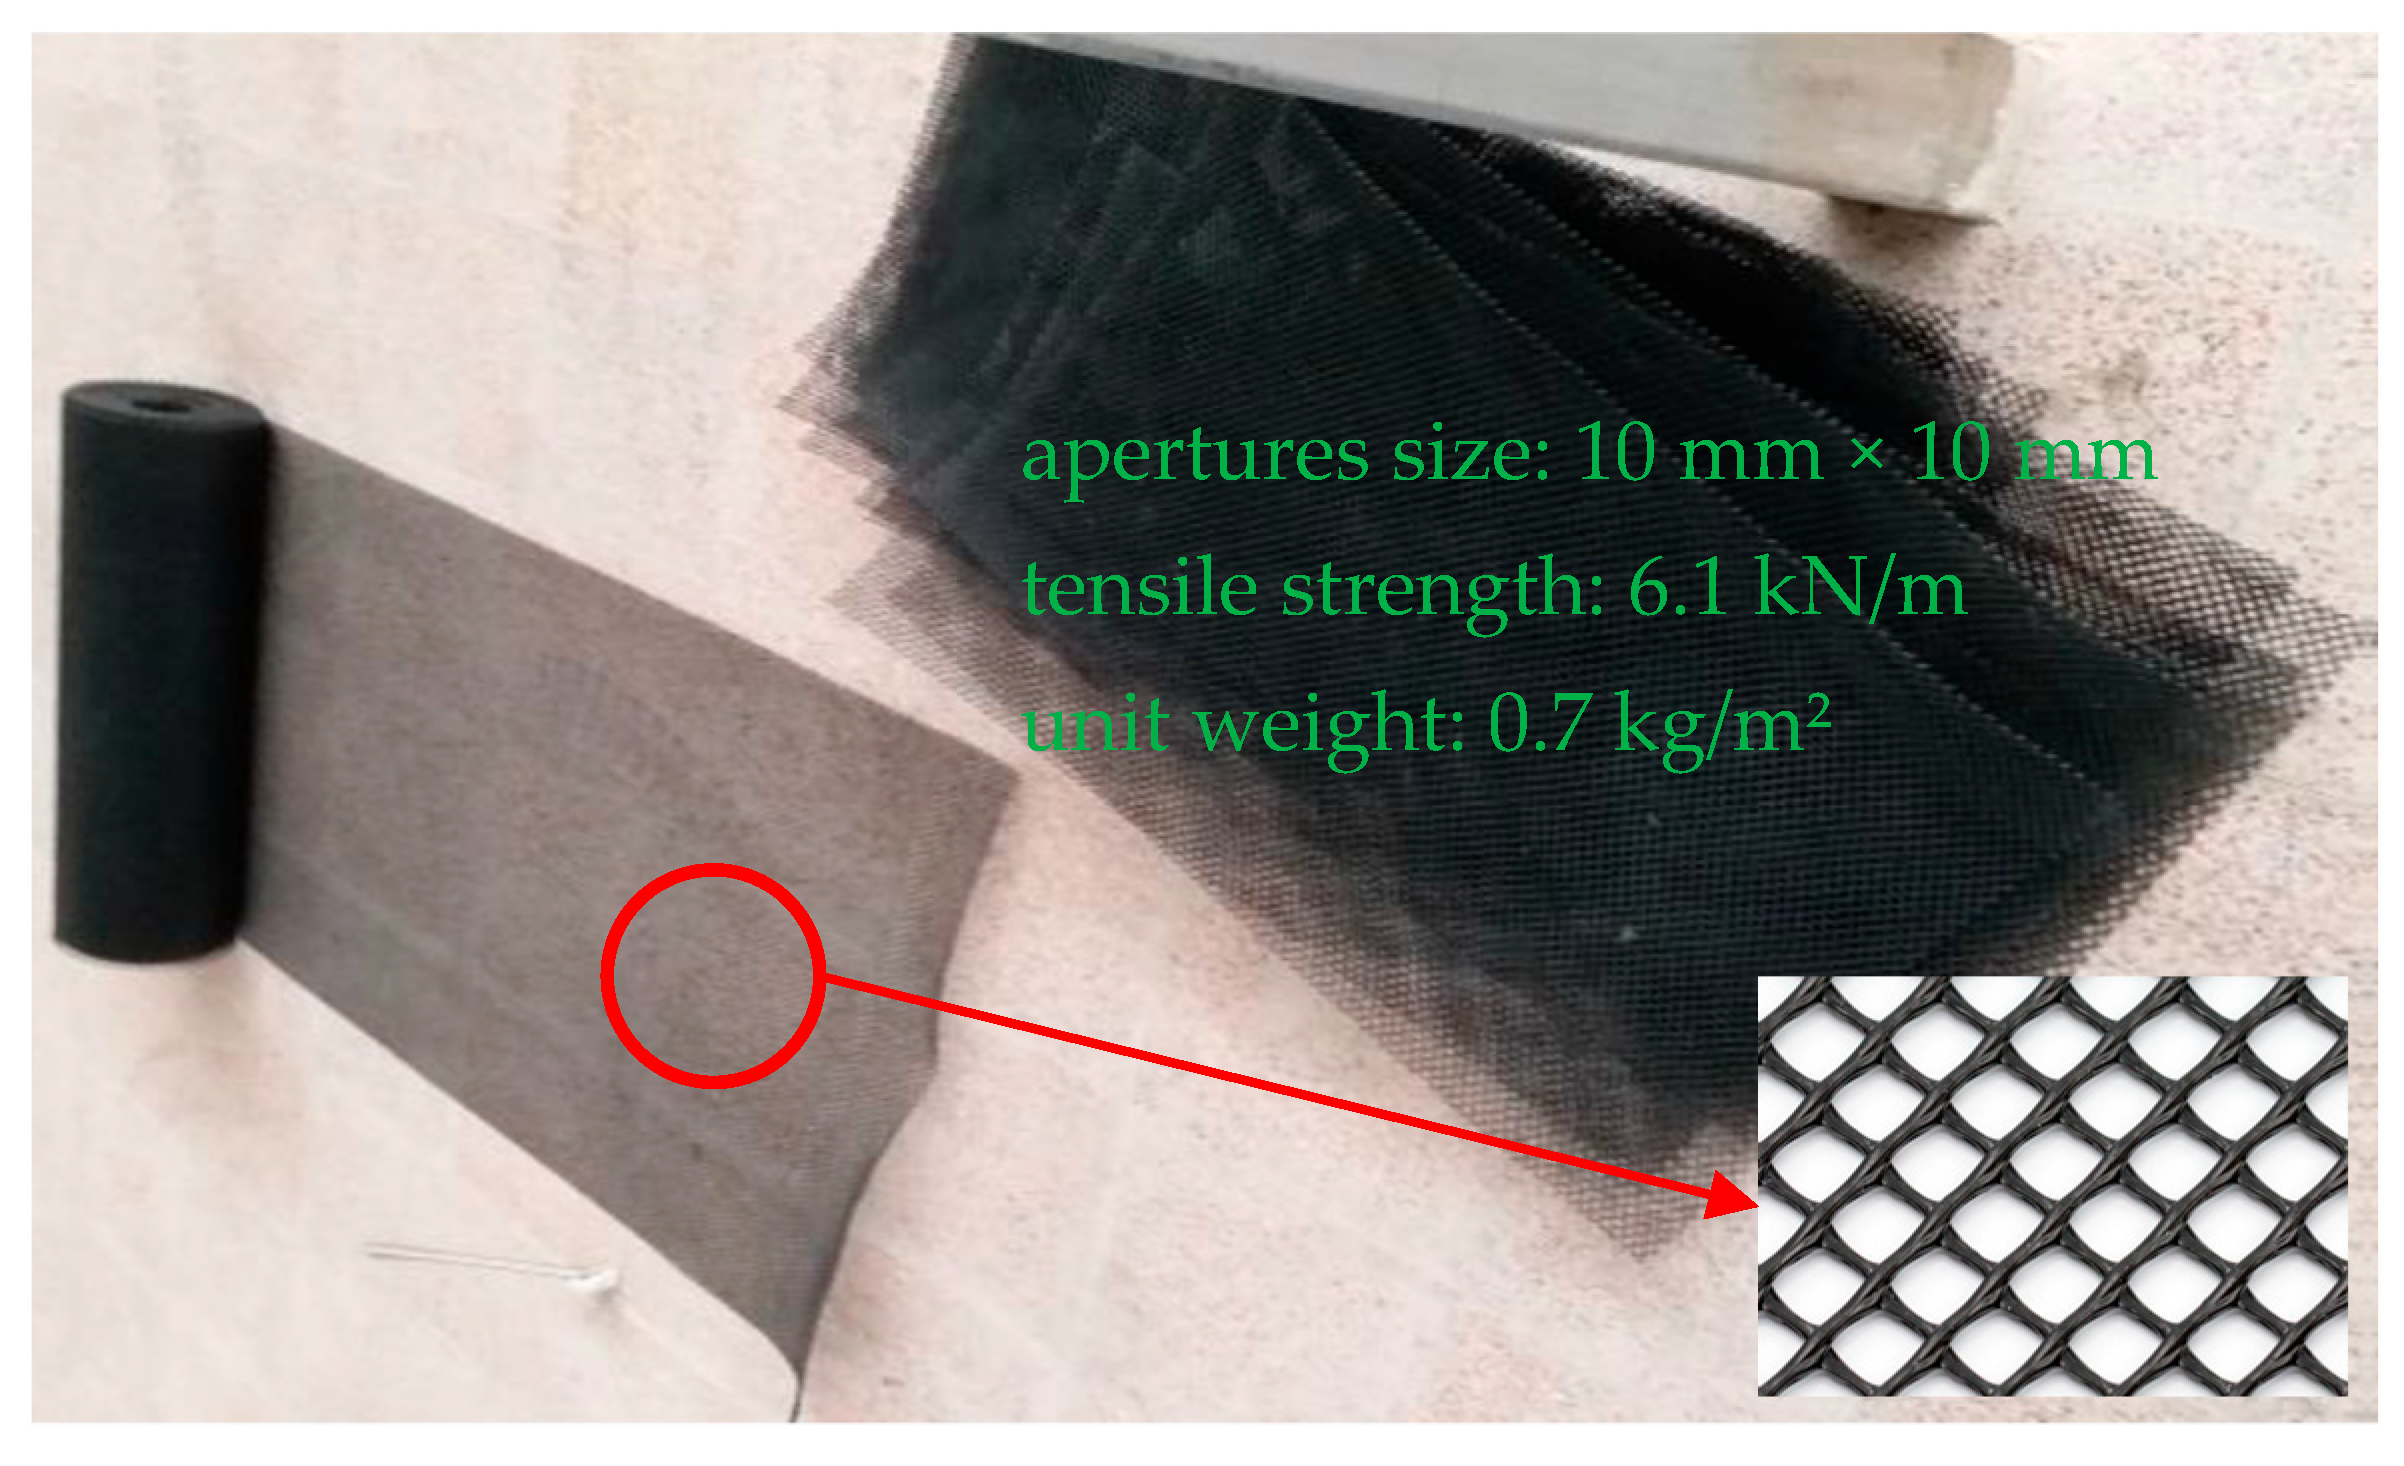
The CE161B geogrid was selected for its compatibility with the tested sand and its mechanical properties, which are well-suited for soil reinforcement applications. The geogrid dimensions were chosen to be 1000 mm in length and 500 mm in width, providing adequate coverage around the 13 mm diameter helical pile to enhance reinforcement efficiency. The geogrid features diamond-shaped apertures, each measuring 10 mm × 10 mm, which facilitate soil interlocking and may influence parameters such as drainage and load transfer (see Figure 3). The ribs, or structural elements of the geogrid, have a thickness of 3.3 mm, contributing to its mechanical strength. With a unit weight of 0.7 kg/m2, the geogrid remains lightweight and easy to handle during installation. It exhibits a maximum tensile strength of 6.1 kN/m before failure. The geogrid was strategically positioned to improve the pullout resistance of the helical pile by reinforcing the surrounding soil and enhancing confinement within the pile’s zone of influence. A single horizontal geogrid layer was installed for each reinforced case at the target depth from the ground surface (0, 100, 150, or 200 mm) within the testing box. The geogrid extended over the full cross-sectional area of the box to ensure uniform reinforcement across the pile surroundings. No pre-tensioning was applied before backfilling with sand. The sand above the geogrid was placed and compacted in layers following the same procedure used for the rest of the test specimen to maintain uniform density.

2.6. Soil Container Design and Soil Density

To ensure consistent and reliable testing conditions, a custom soil container was fabricated using 5 mm thick steel plates, with dimensions of 700 × 500 × 1000 mm. The container was designed to accommodate the helical pile and geogrid while withstanding the weight of the sand and the applied testing loads. Gridlines were marked on the interior walls to facilitate precise displacement measurements. To eliminate movement during testing, the container was securely mounted on a rail system. Special attention was given to minimizing boundary effects, as the proximity of container walls can artificially influence soil behavior by introducing confinement or constraints. Additionally, the container design enabled controlled and uniform sand placement, which is critical to maintaining consistent density and distribution—factors known to significantly affect experimental outcomes.
The test container was prepared by compacting Shahriyar sand to achieve a target relative density (Dr) of 70%. Initially, the container was segmented into layers of 100 mm thickness. The mass of sand required for each layer was precisely calculated using the target relative density and the corresponding volume. Once the mass was determined, each layer of sand was carefully placed into the container and lightly compacted with a plastic hammer to ensure uniform density and level. To verify the achieved relative density, in situ density measurements were performed using the rubber balloon method in accordance with ASTM D-2167 [41], confirming a density close to the intended 70%.

3. Experimental Setup

3.1. Experimental Setup for Axial Tensile Load Test

Helical pile pullout tests were performed with rigorous preparation to ensure accuracy and repeatability. The sand within the test container was compacted to a target relative density of approximately 70%. For reinforced cases, geogrids were placed at predetermined depths prior to pile installation. Each helical pile was installed centrally using a power drill, with vertical alignment verified by a spirit level and plumb bob. The piles were embedded to the specified depth, leaving approximately 170 mm protruding above the sand surface to enable connection with the loading system.
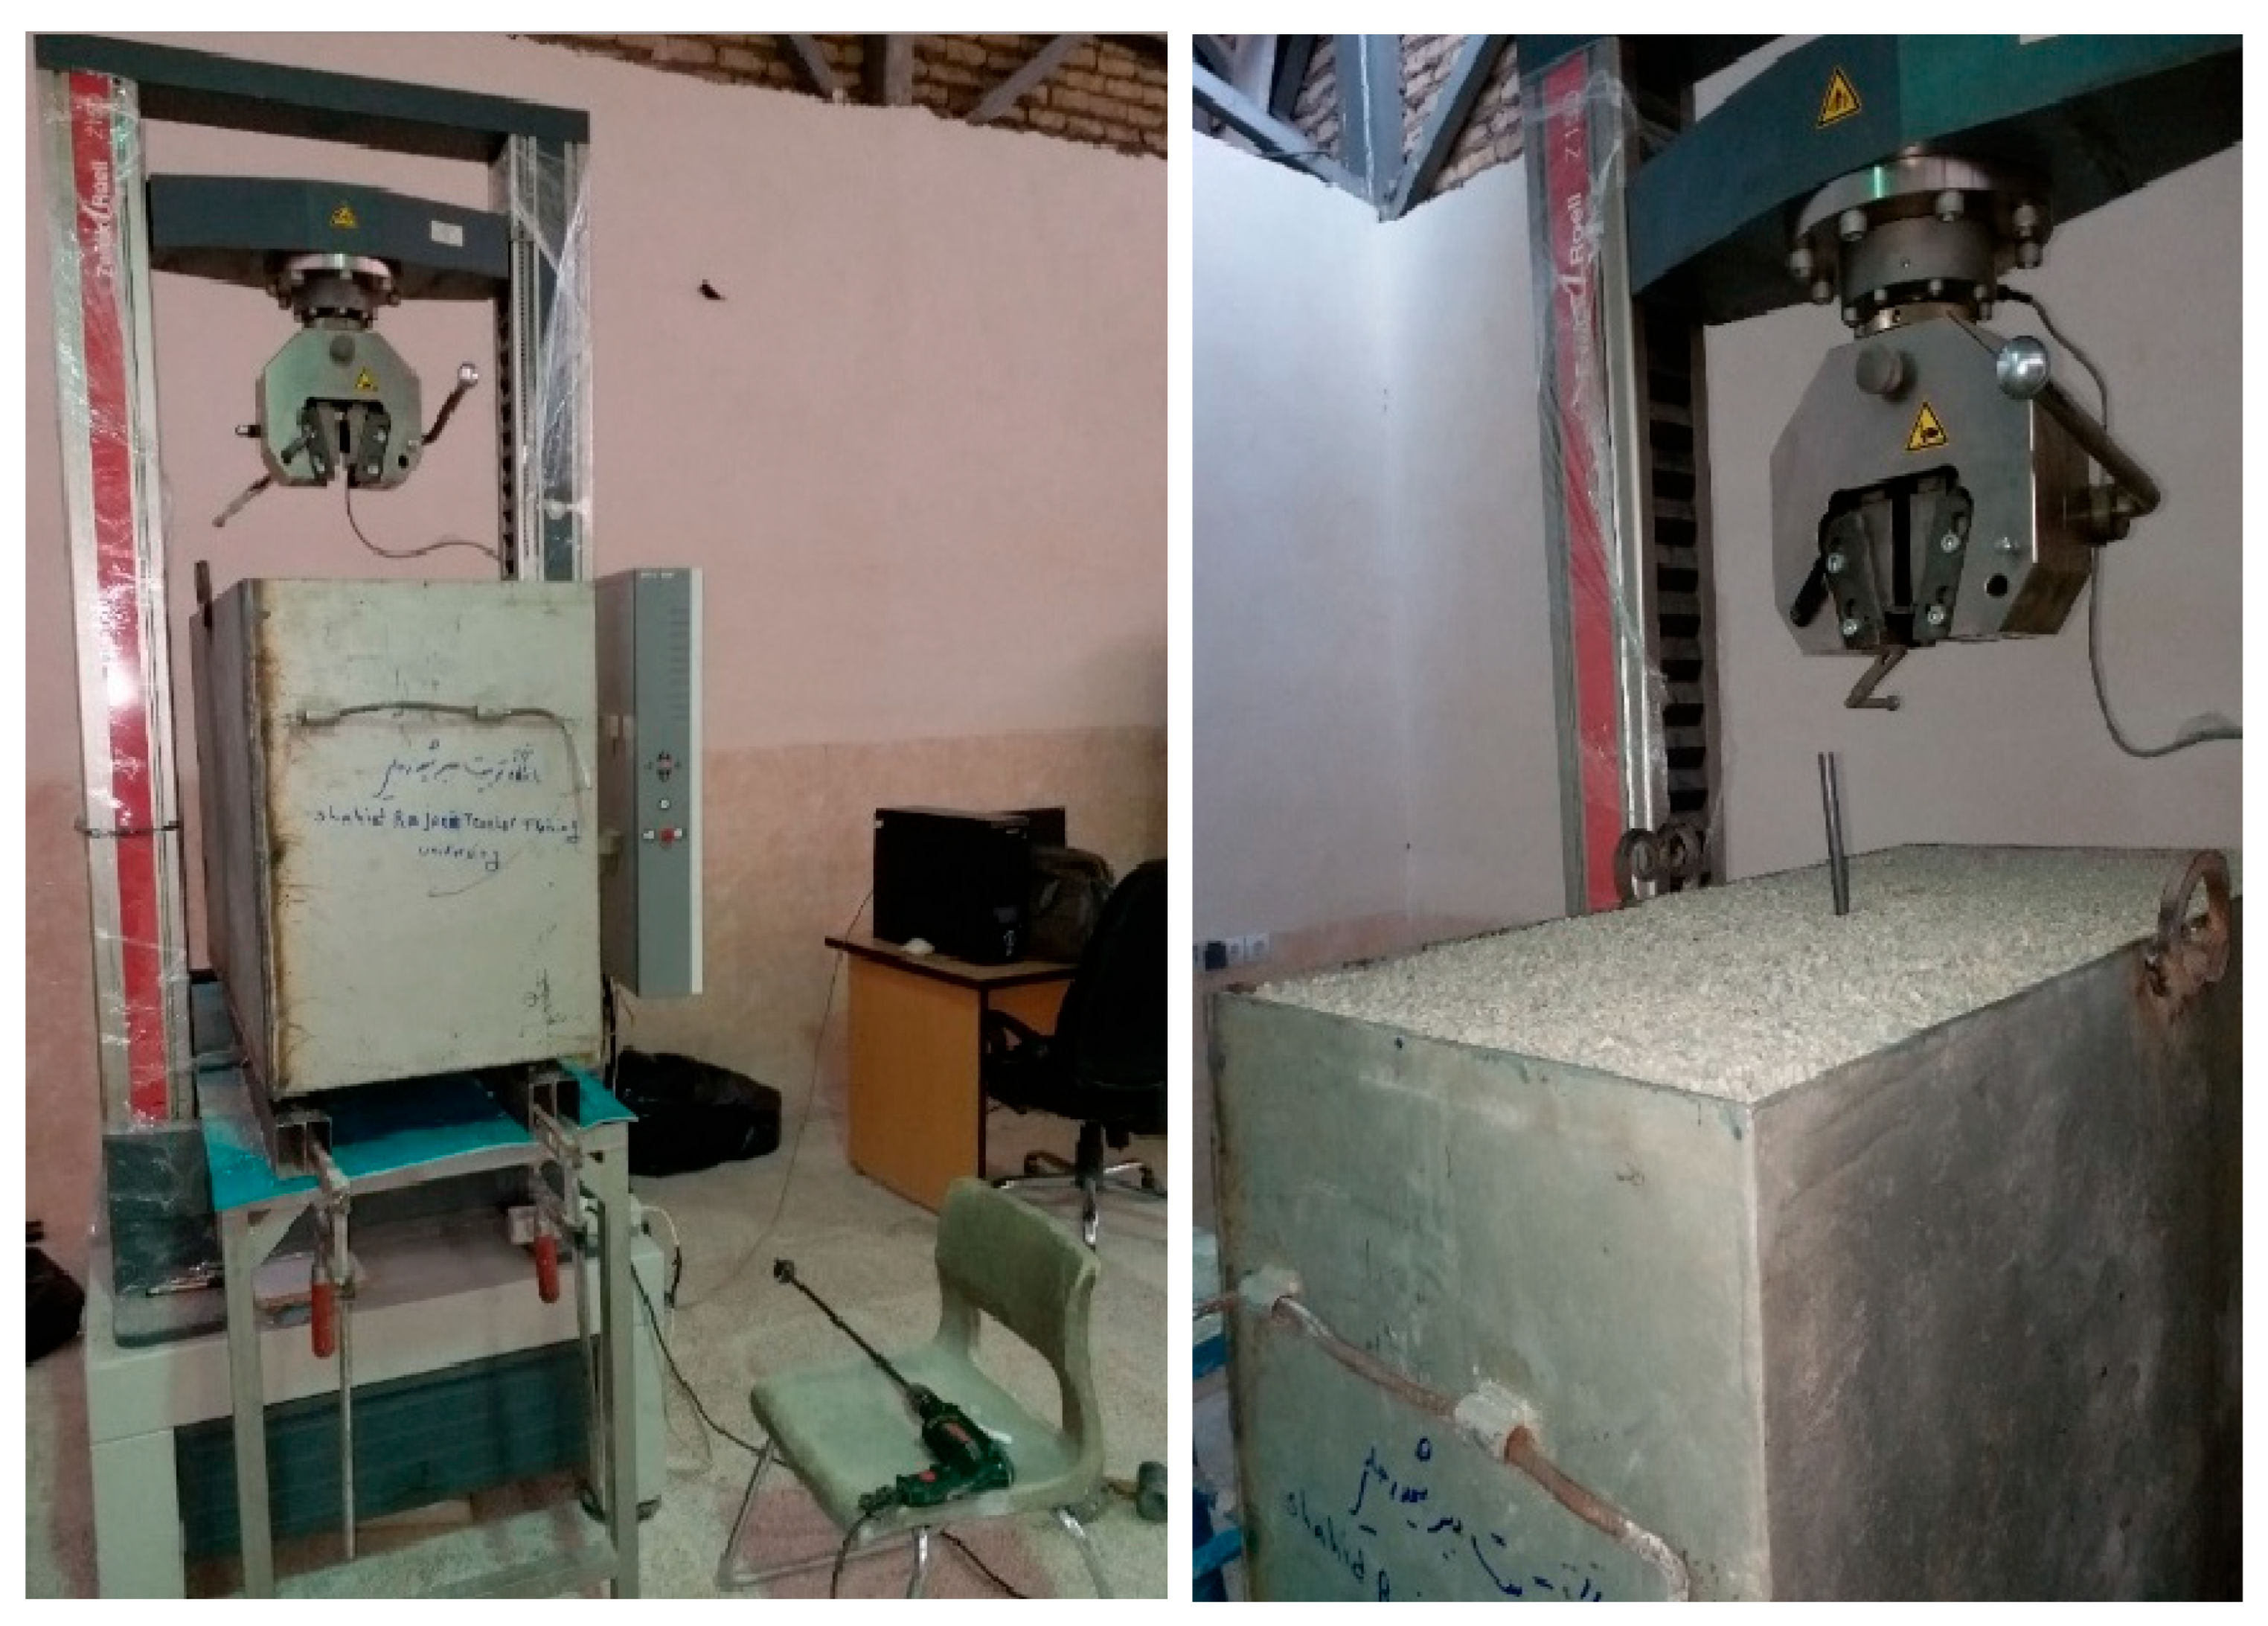
Following installation, the soil container was positioned beneath the loading frame of a universal testing machine (UTM; Zwick/Roell Z150; ZwickRoell GmbH & Co. KG, Ulm, Germany) (Figure 4). The UTM and data acquisition system were calibrated to continuously record pullout force and displacement. Data were collected using the TestXpert11 V3.2 software. After the required software adjustments, the UTM jaw was closed via a lever and secured to the pile cap to prevent rotation during loading.
A constant pullout rate of 0.2 mm/s was applied. Testing followed ASTM D3689 [42] and continued until either the pullout force reached the predefined limit, or the maximum displacement capacity of the machine was attained. The recorded data were subsequently analyzed to determine the pullout capacity of the helical pile and to evaluate the effect of geogrid reinforcement on its performance.

3.2. Design of Experiments

In the experiments, four variables were considered: the distance of the geogrid from the soil surface, the presence or absence of the geogrid, the number of pile blades, and the interval distance of the blade pitches. Three values of 100, 150, and 200 mm were considered for the variable of geogrid distance from the soil surface. Additionally, the effect of the number of pile blades on pullout capacity was evaluated with three values: zero (shaft), one, and two. Table 1 presents the characteristics of the 27 laboratory tests. A simple model without blades and without the use of geogrid was also constructed as a reference sample, bringing the total number of laboratory specimens to 28. In addition to these 28 tests, several repeat tests were also conducted to verify the accuracy and reliability of the results.
The research investigated the pullout behavior of helical piles in sand by manipulating three key variables: helix pitch (13 mm, 20 mm, and 25 mm), number of helices (configurations with 0, 1, and 2 helices), and geogrid layer spacing (100 mm, 150 mm, and 200 mm) for tests with geogrids. This design aimed to capture the influence of these factors on pullout performance. A reference test with a simple pile (no helices) was included for comparison.

4. Results and Discussions

In this section, the results of the experimental tests conducted in this research are presented. These results are related to soil parameter determination tests, software settings, and the uplift capacity of different models of helical piles. Due to the necessity of comparing helical piles (HPs) with conventional piles (CPs), the test was also performed on a conventional pile. Then, the effect of each of the variables of this research on the pullout (uplift) capacity of helical piles was investigated. Finally, the results of the experiments and the obtained values were compared with those of other researchers.

4.1. Pullout Test Results of Conventional Pile

In this section, the dimensionless parameters used in the presentation of results are defined. The dimensionless pullout force is the pullout force divided by the elastic modulus of the pile times the square of the diameter of the central shaft of the pile T E b × d 2 . The dimensionless displacement is the displacement due to the pullout divided by the diameter of the central shaft of the pile, d s d . The dimensionless geogrid spacing is the distance of the geogrid from the ground surface divided by the diameter of the central shaft of the pile, S d . The dimensionless helix pitch is the pitch of the helical coil divided by the diameter of the central shaft of the pile, S d . These dimensionless parameters are used to normalize the data and to facilitate comparison between different pile configurations.

4.1.1. Pullout Load–Displacement Curve of Conventional Pile

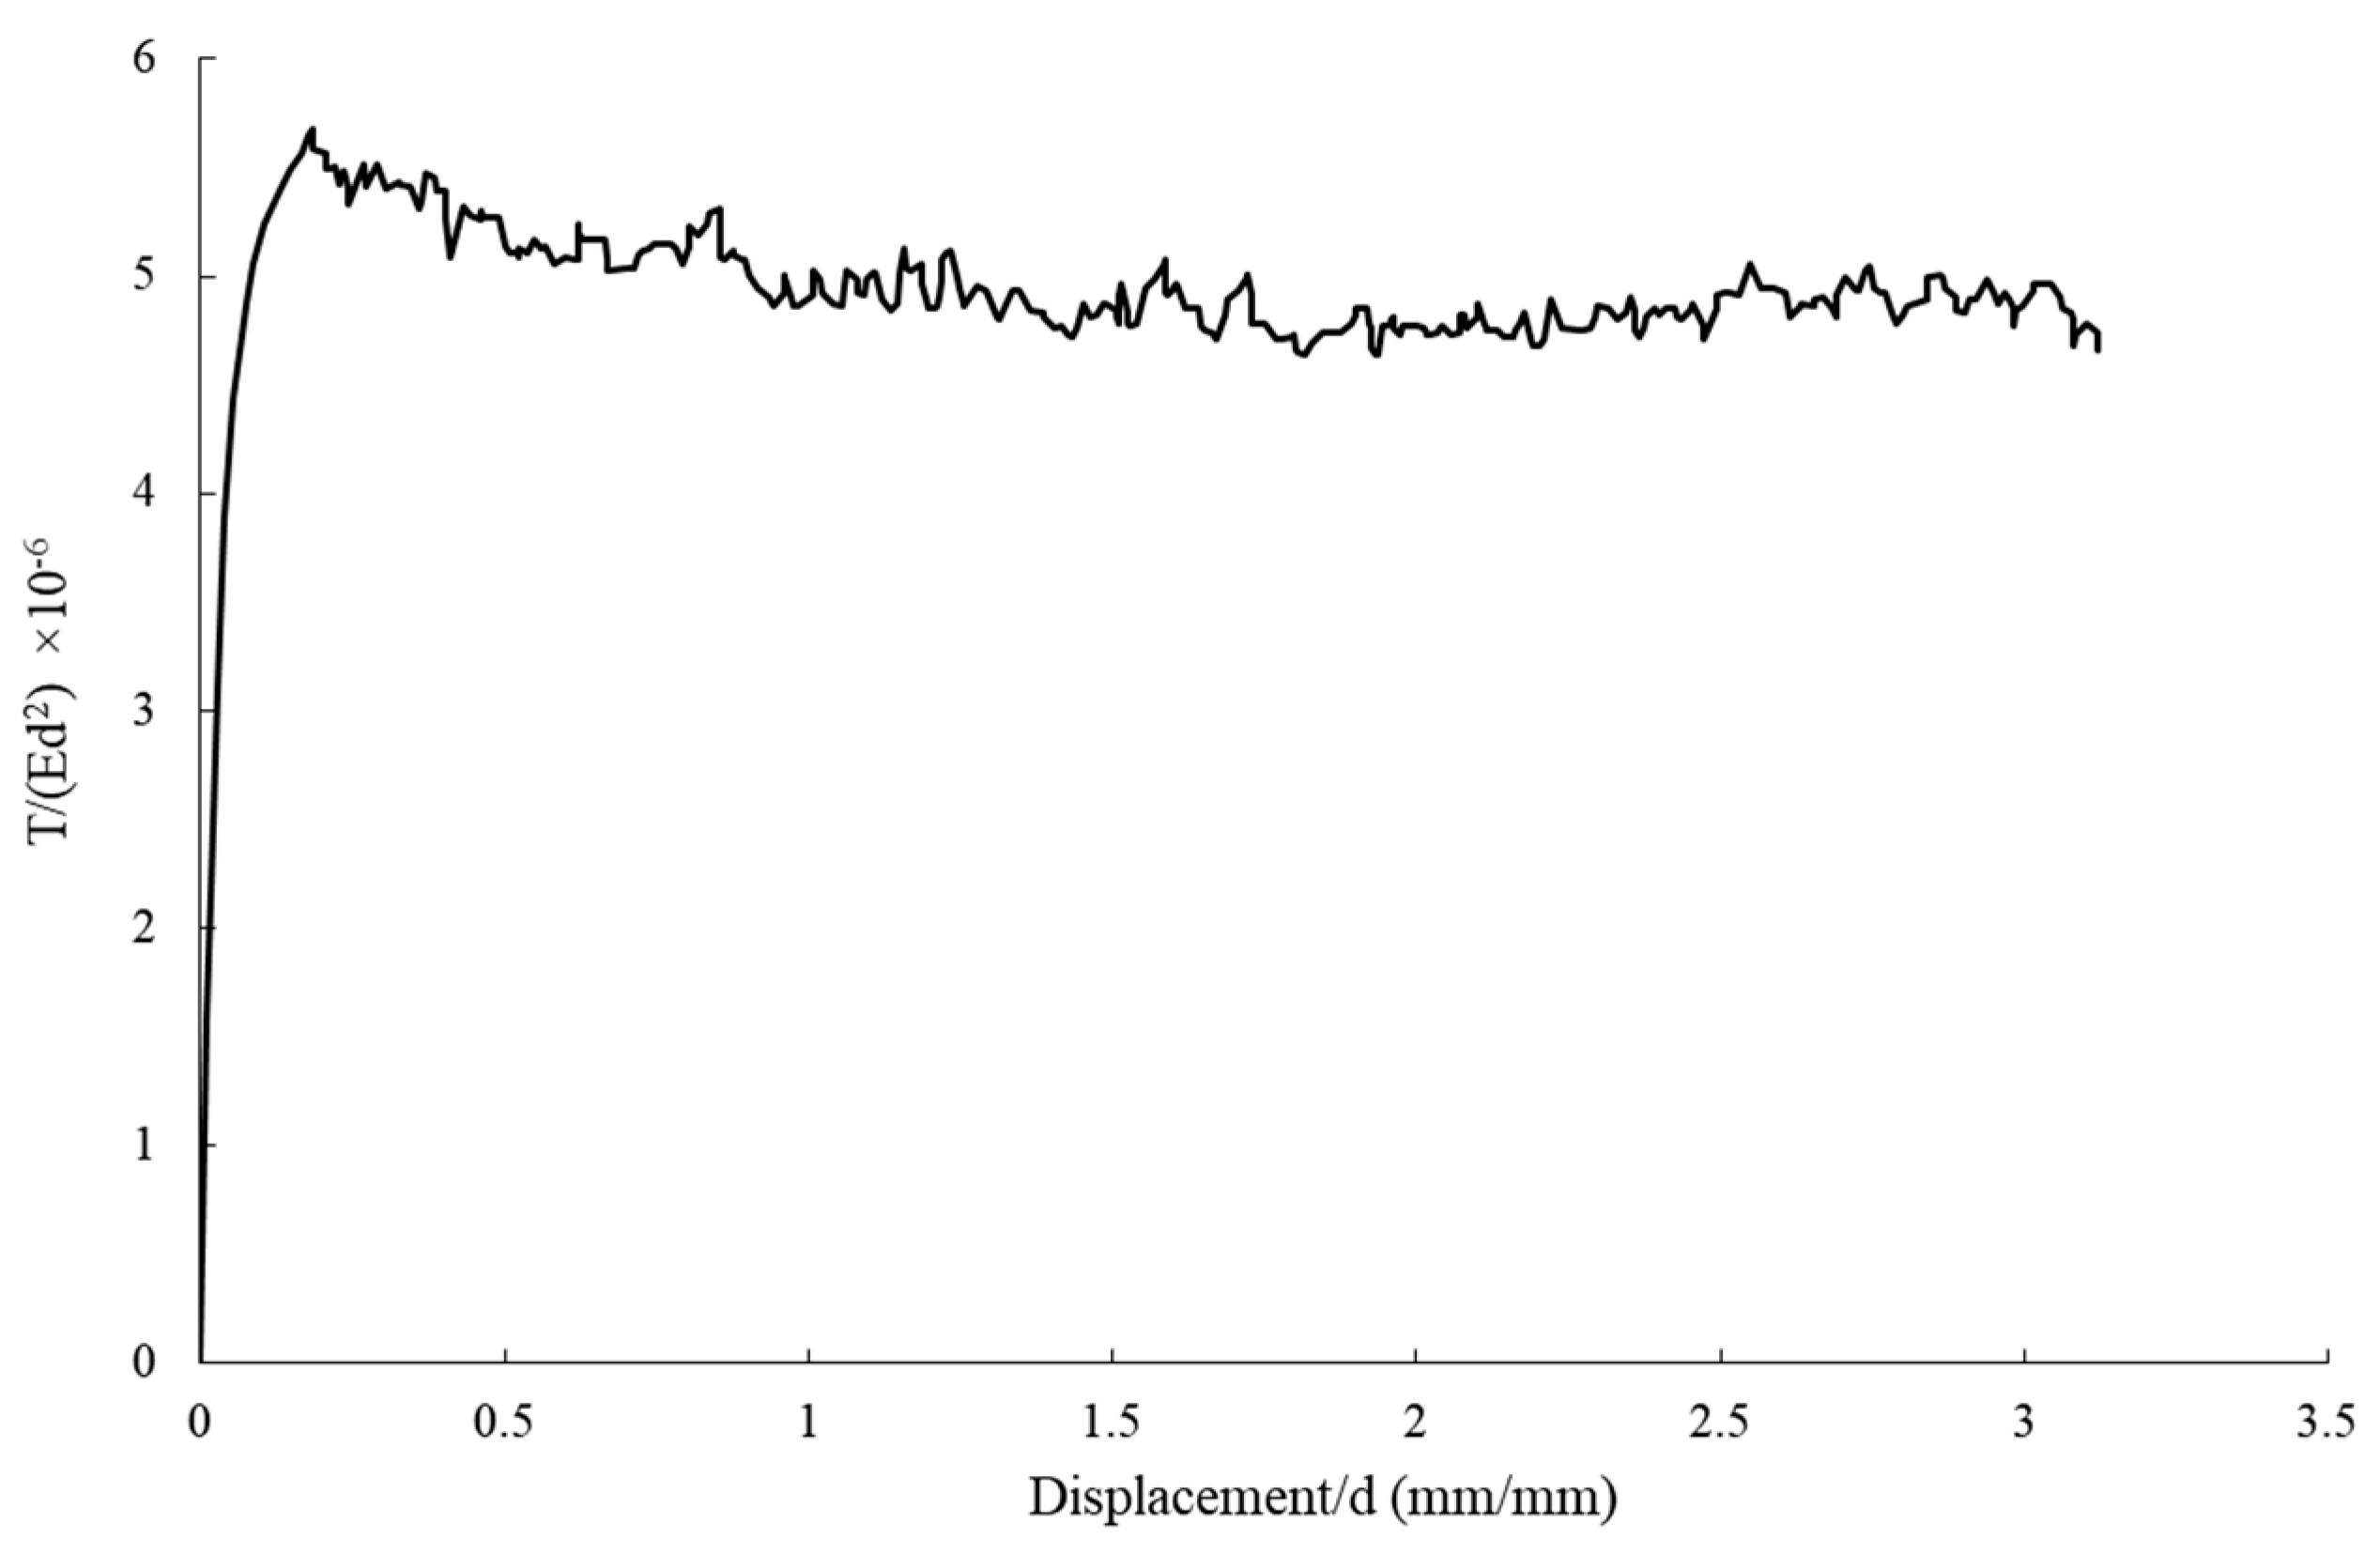
Figure 5 is for a conventional pile tested in dense sand with the pile diameter (d) and the embedded length of the pile being 13 mm and 430 mm, respectively.
In this section, the behavior of the conventional pile under the influence of uplift force is analyzed based on the curve presented in Figure 5. The curve initially exhibits a relatively linear trend and then transitions into a downward-curving curve until it reaches the ultimate uplift capacity point. After the curve reaches its maximum point, the uplift force gradually decreases with increasing pile displacement. Subsequently, the uplift force continues to decrease gradually as a relatively gentle slope. In this experiment, the maximum dimensionless pullout force is 5.724 × 10⁻⁶.

4.1.2. Effect of Geogrid Sheet Distance to Soil Surface on Pullout–Displacement Curves for CPs

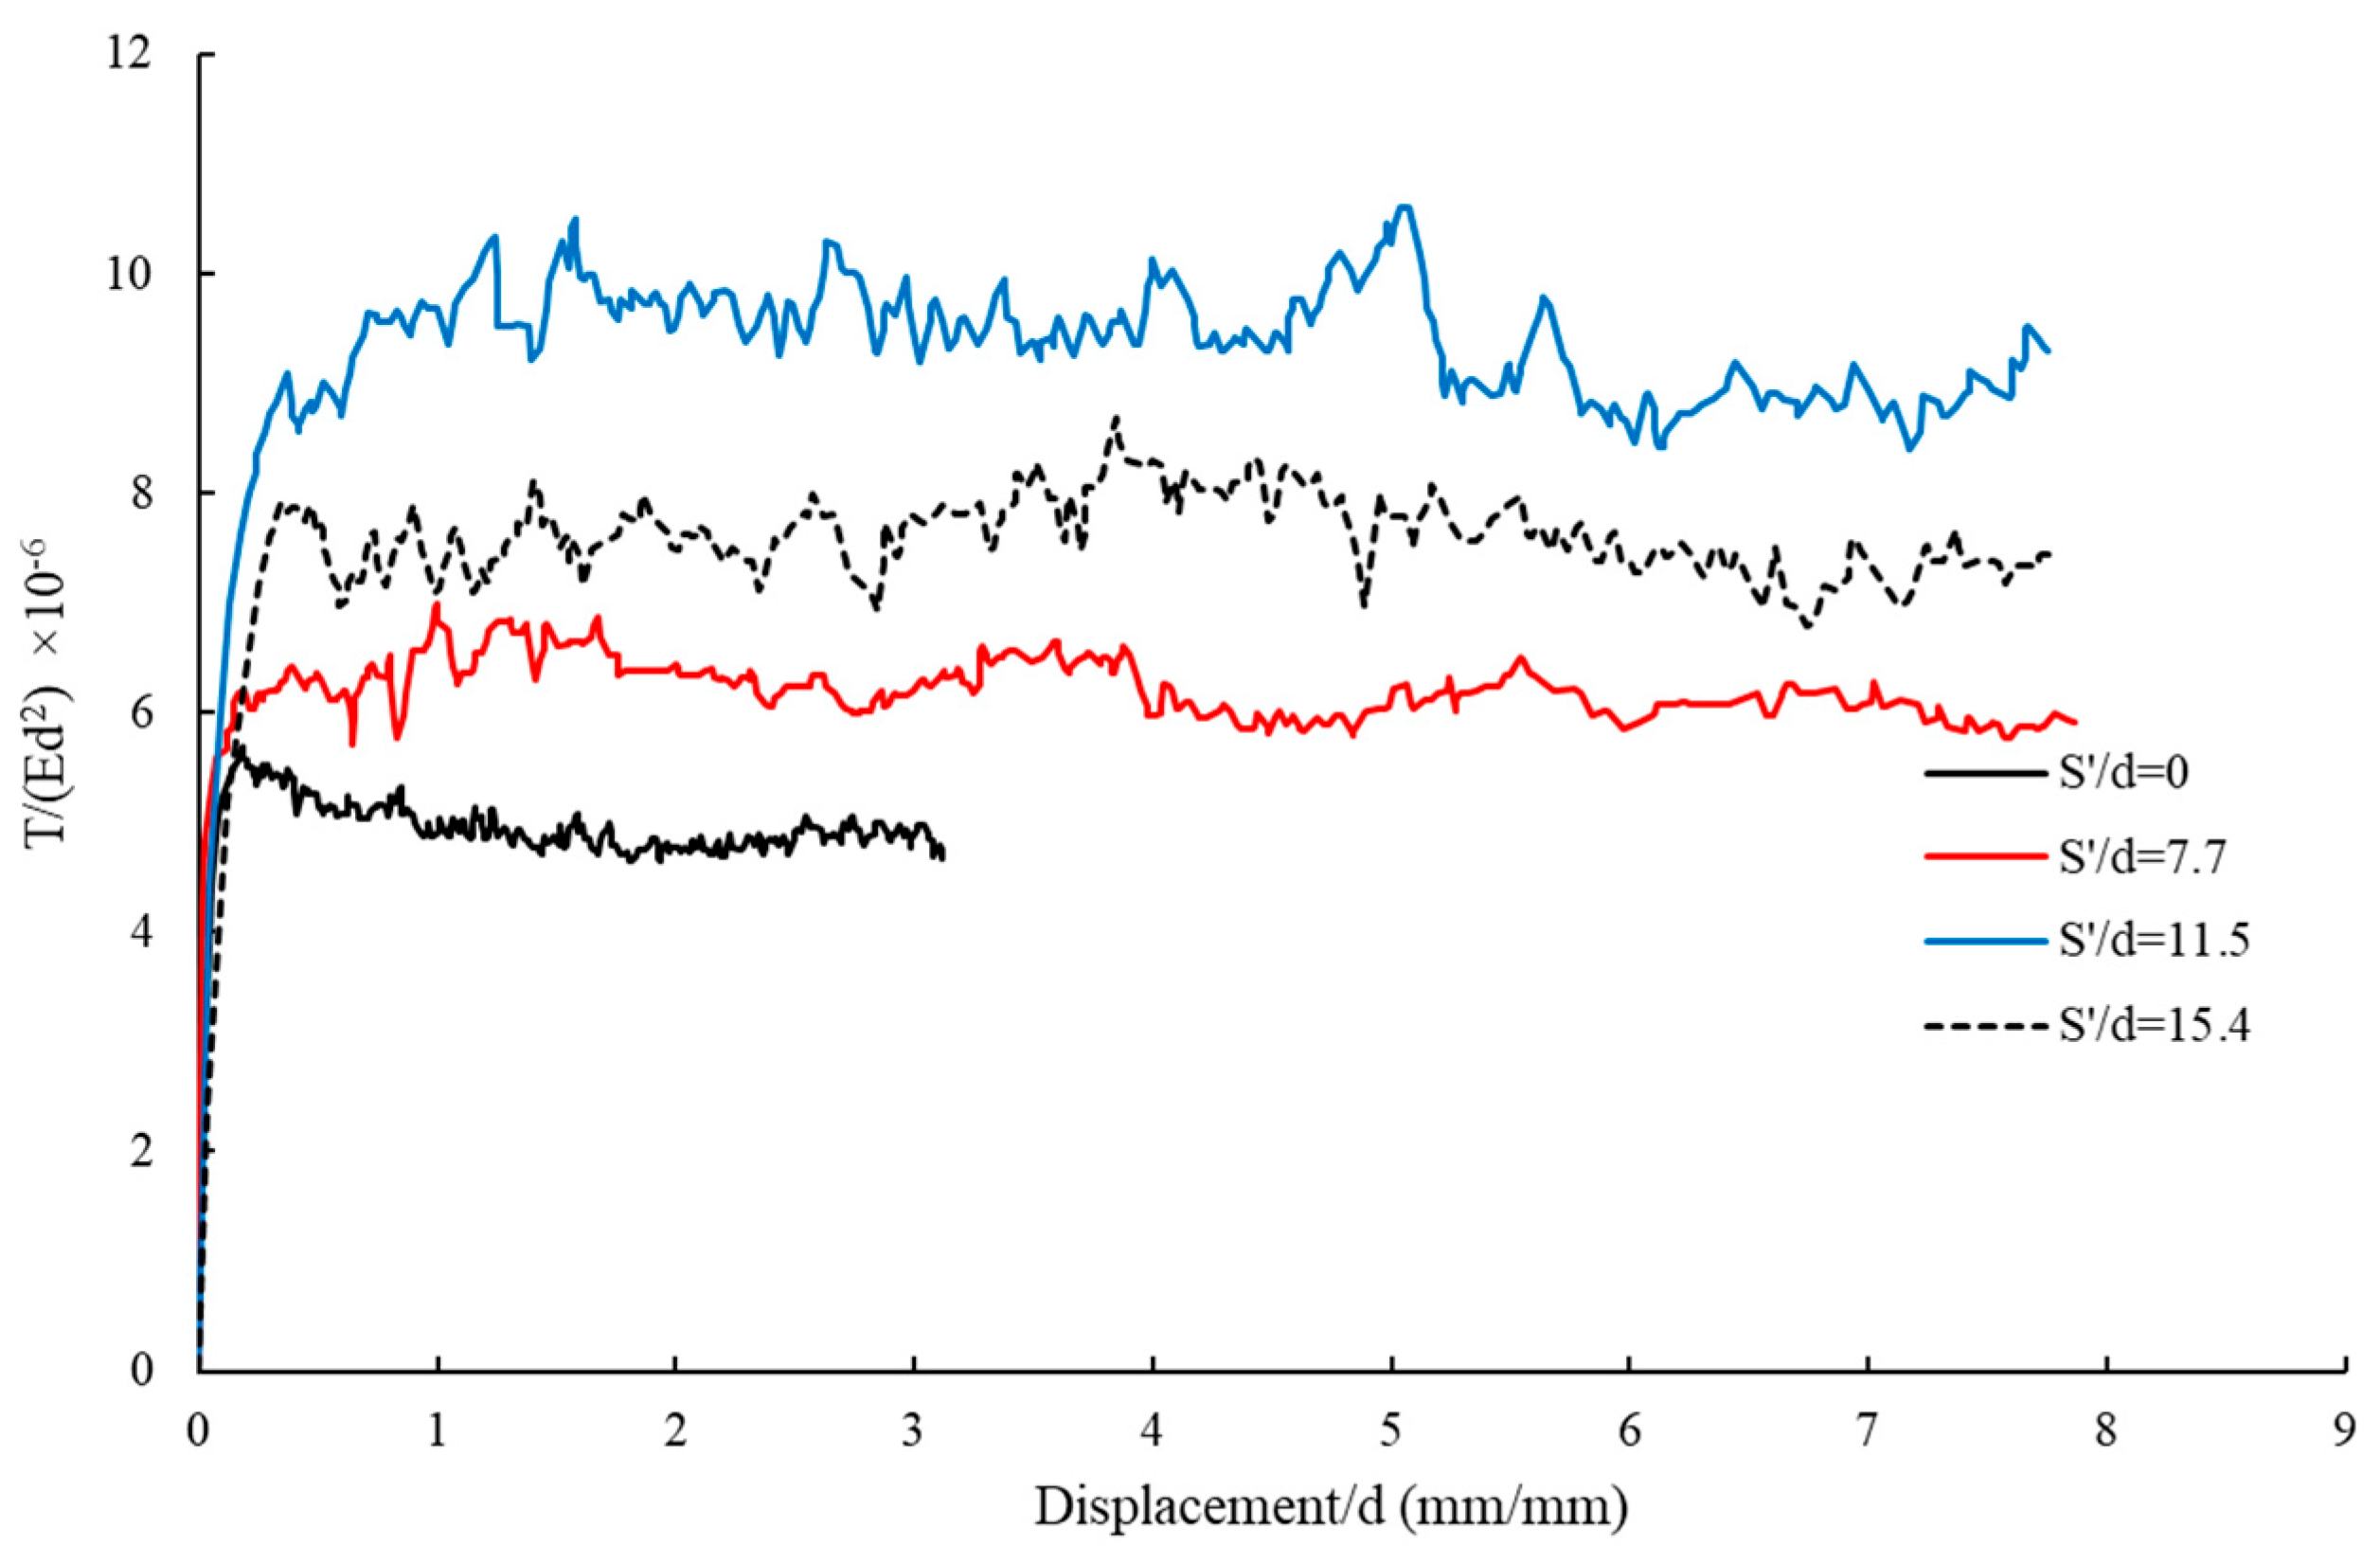
Figure 6 presents the pullout–displacement curves for CPs in which the pile diameter, height of the pile, and the length of the pile buried in the soil are considered equal to 13 mm, 600 mm, and 430 mm, respectively. The effect of the distance of the geogrid sheet to the soil surface on the pullout capacity of CPs is investigated.
Figure 6 illustrates the enhancement in pullout capacity with the incorporation of geogrids at varying distances in dense sand. The maximum dimensionless pullout force for a CP without geogrid is 5.724 × 10⁻⁶ N, whereas the values for geogrid sheet dimensionless distances of 7.7, 11.5, and 15.4 from the soil surface are 7.018 × 10⁻⁶, 1.069 × 10⁻⁵, and 8.632 × 10⁻⁶ N, respectively. Considering that 430 mm of the pile is embedded in the soil, the uplift improvement compared to the CP without geogrid is observed to be 22%, 86%, and 50% for geogrid sheet dimensionless distances of 7.7 (0.23 L , engaged length of pile with soil), 11.5 (0.35 L , engaged length of pile with soil), and 15.4 (0.47 L , engaged length of pile with soil) from the soil surface. Figure 6 further indicates that the higher uplift capacity at 150 mm compared to 200 mm occurs because the geogrid at 150 mm better reinforces the soil zone directly involved in load transfer and friction along the pile shaft. At 200 mm, the geogrid is too far to effectively strengthen this critical zone, reducing its contribution. This highlights the need to place geogrids at an optimal depth for maximum reinforcement efficiency.

4.2. Pullout–Displacement Curves for Helical Piles

In this section, the pullout–displacement curves for all helical piles (HPs) are presented, categorized based on the experimental variable parameters. The variable parameters investigated in the experiments include helical pitch (S), number of helix blades (n), and geogrid sheet distance from soil surface ( S ).

4.2.1. Effect of Geogrid Sheet Distance on Pullout–Displacement Curves for Piles

Comparison of Pullout–Displacement Curves for Single Blade HP with a Pitch of 13 mm
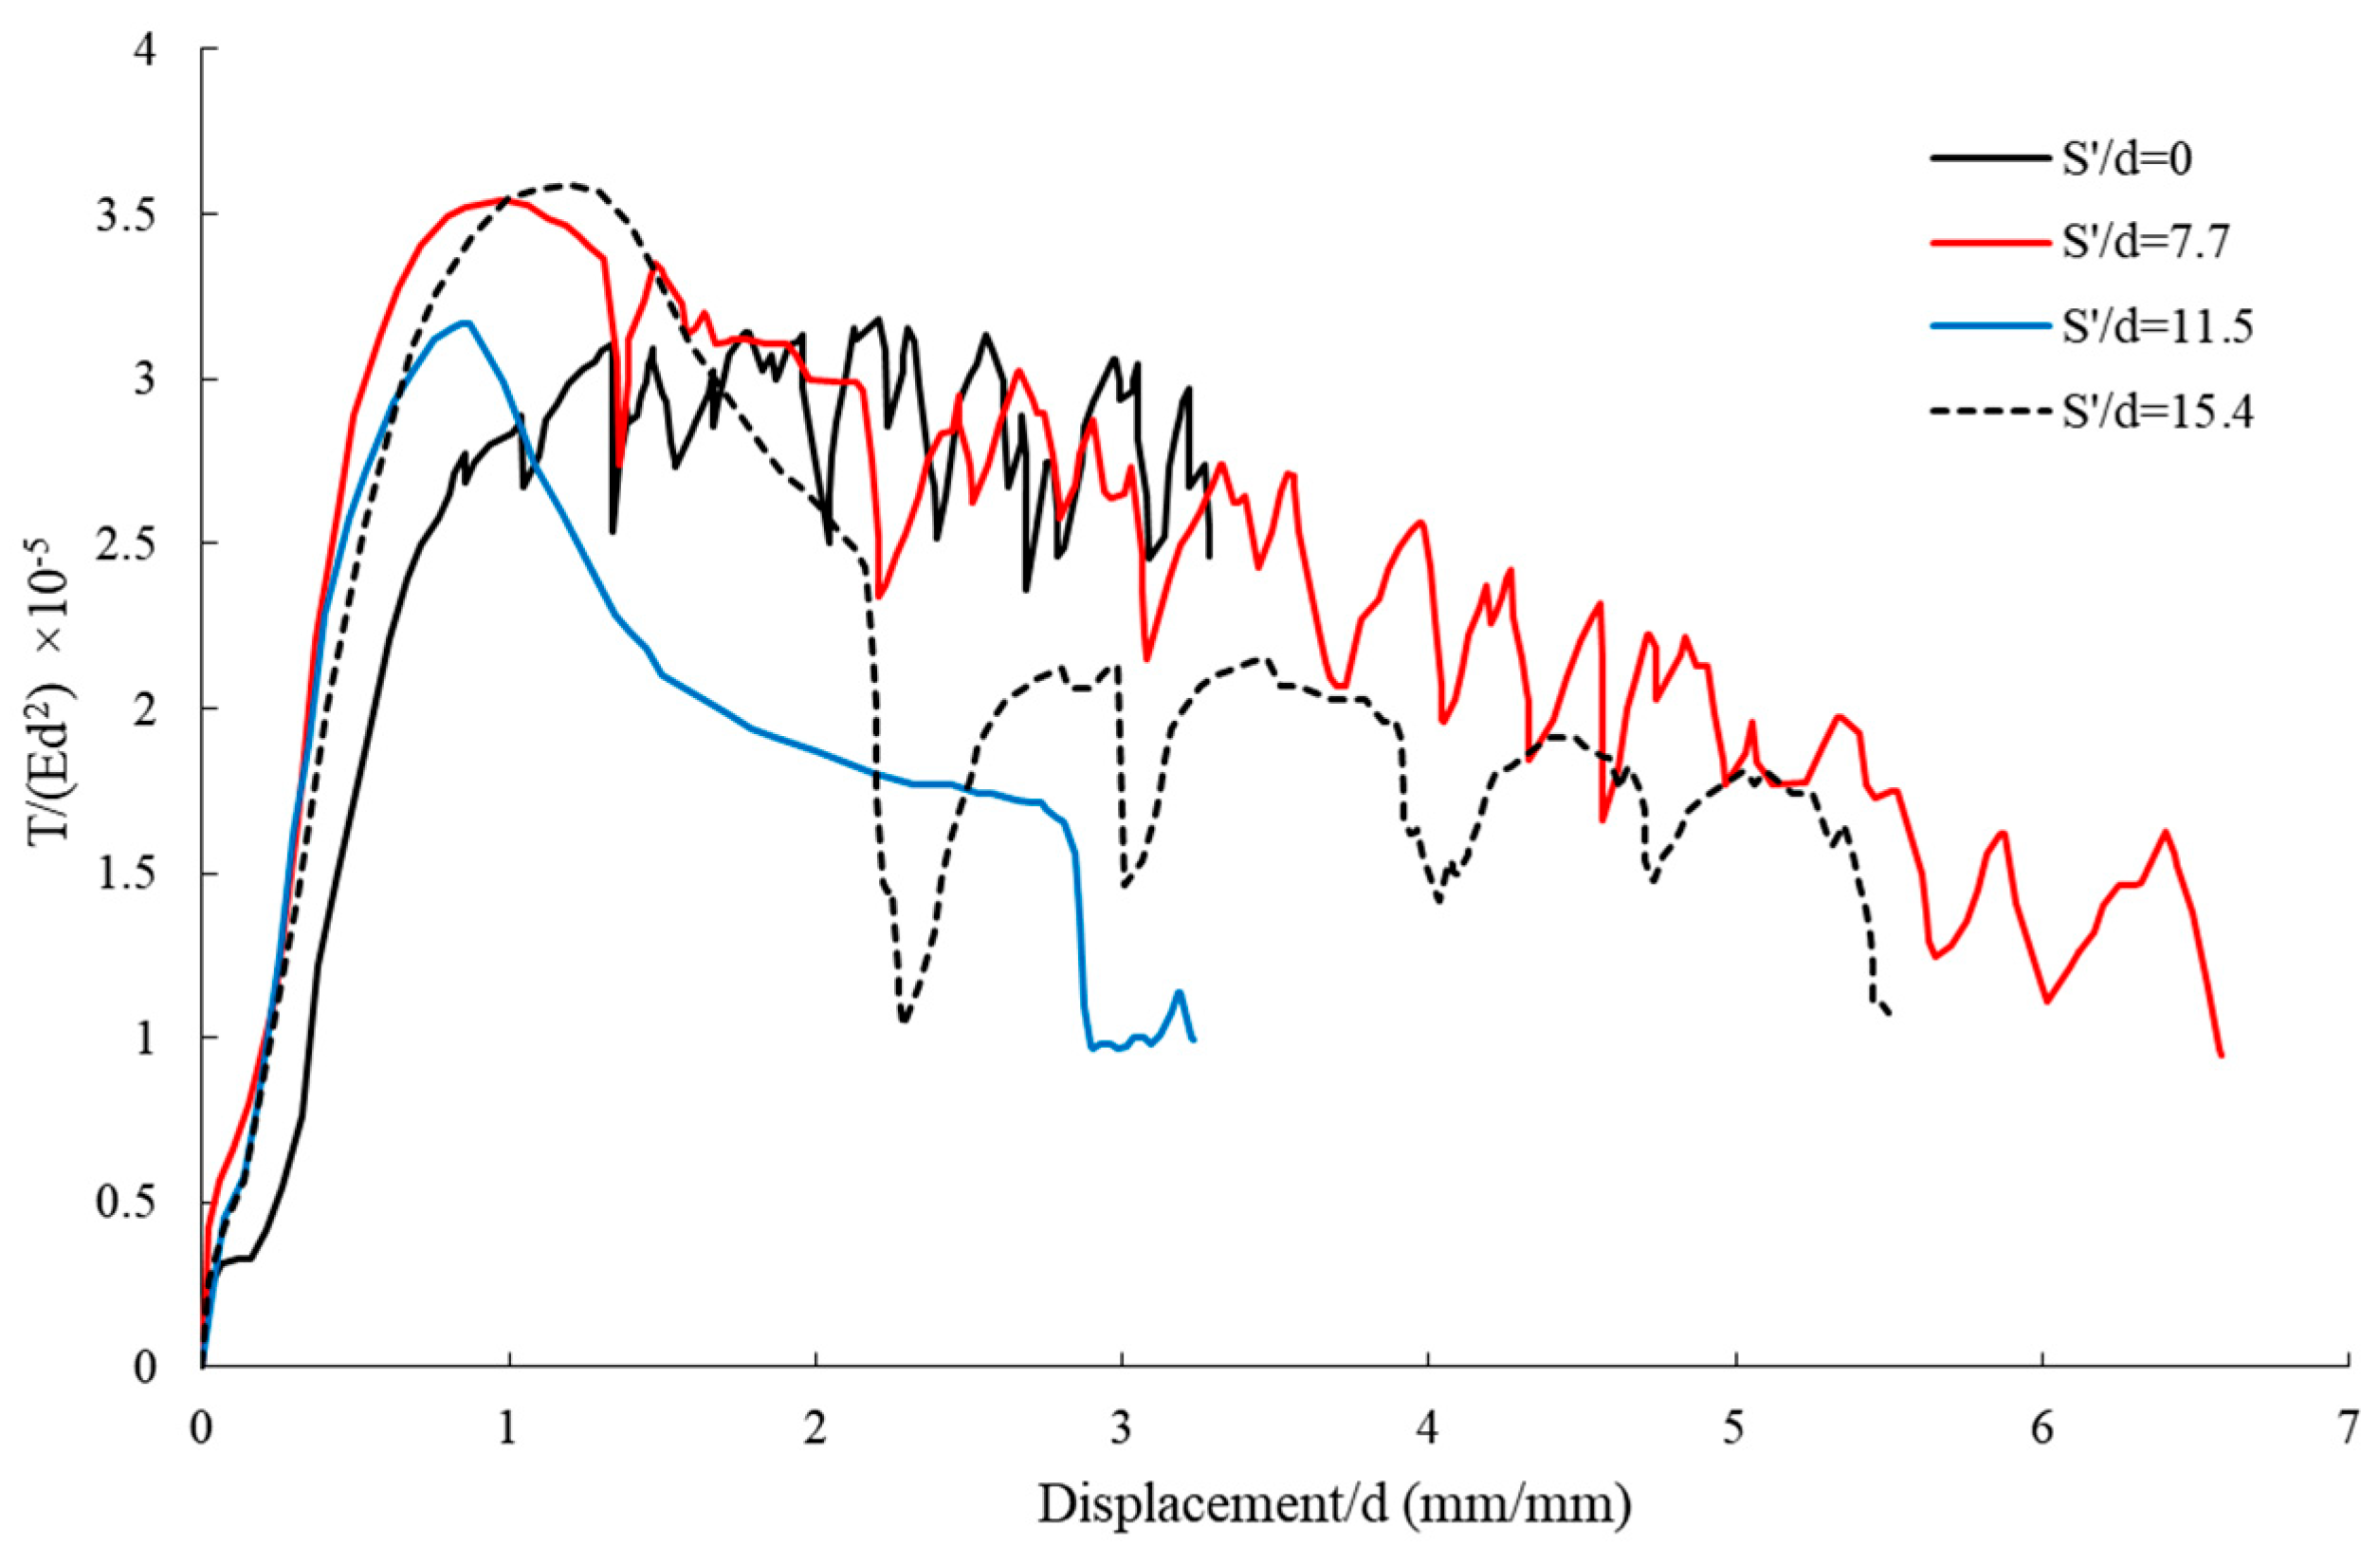
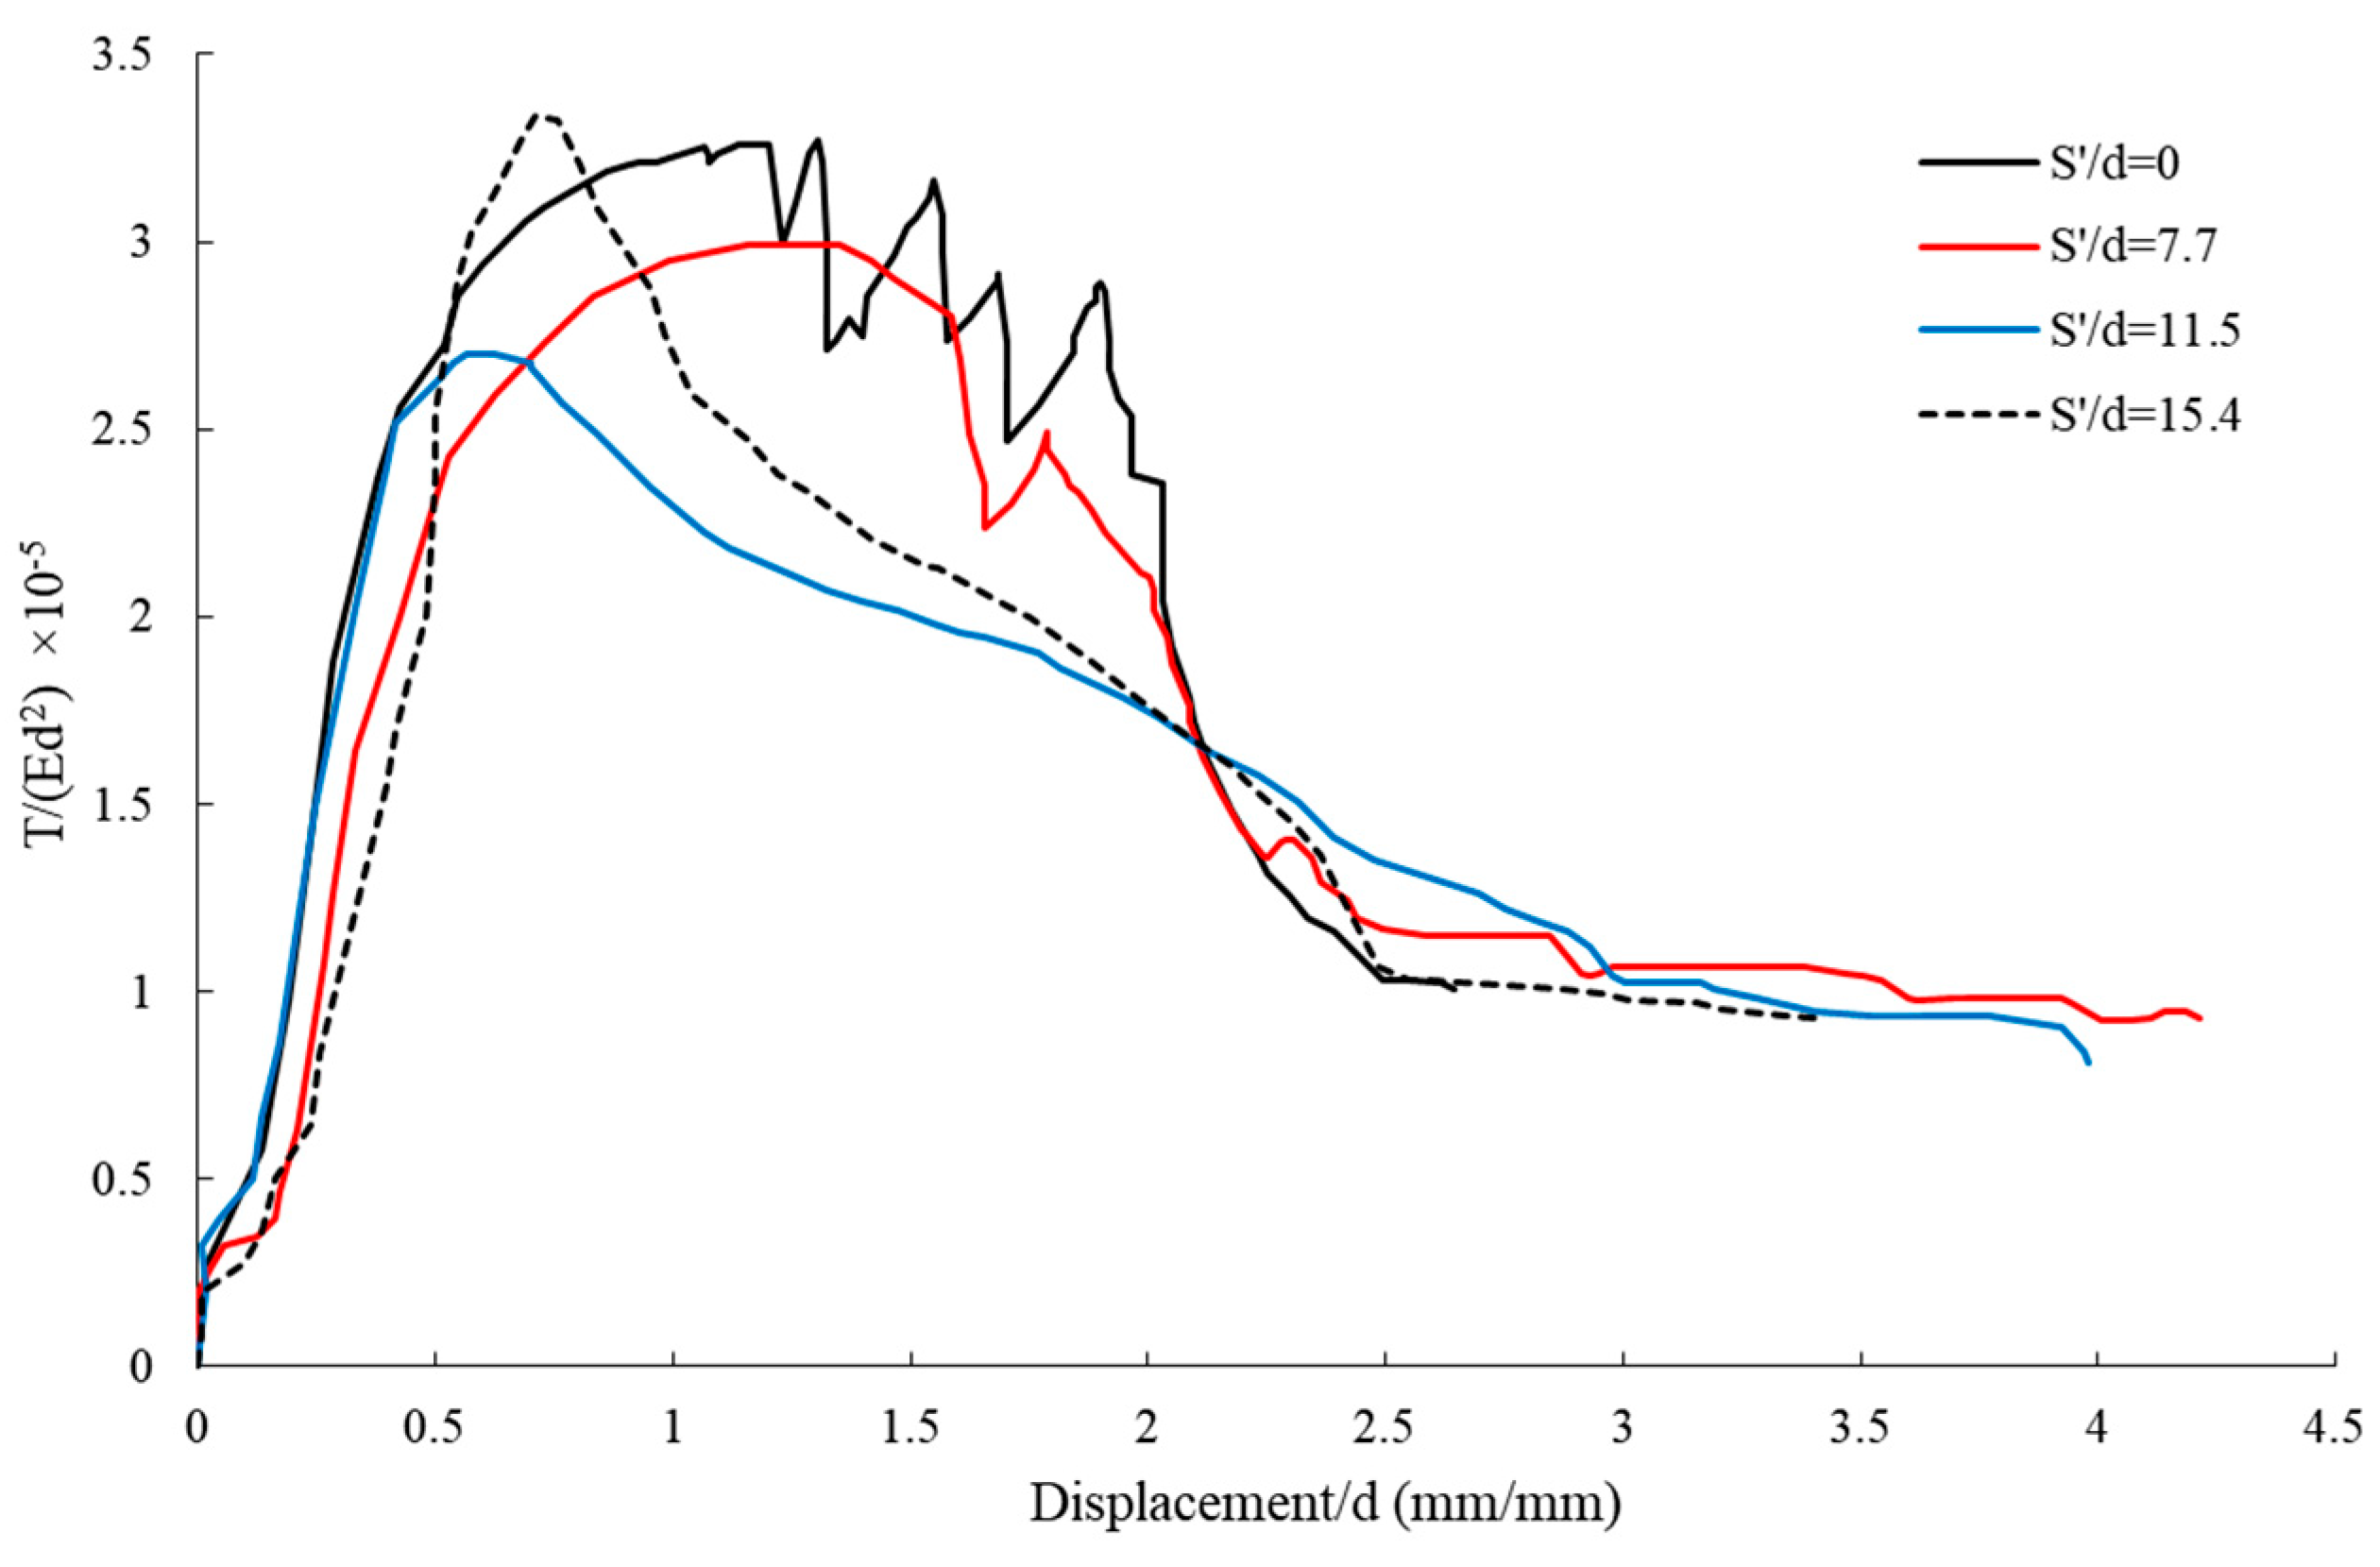
Figure 7 presents the pullout–displacement curves for single blade HPs with a pitch of 13 mm under varying geogrid sheet distances from the soil surface. The piles have a diameter (d) of 13 mm, helical blade pitch (S) of 13 mm, total length of 600 mm, and embedded length of 430 mm. The impact of geogrid sheet placement on the pullout capacity of these piles is analyzed.
The maximum dimensionless pullout capacity for the plain single blade HP without geogrid is 3.169 × 10⁻⁵. With geogrid sheet dimensionless distances of 7.7, 11.5, and 15.4 from the soil surface, the dimensionless pullout capacities are 3.496 × 10⁻⁵, 3.148 × 10⁻⁵, and 3.577 × 10⁻⁵, respectively. Compared to the CP without geogrid, the uplift improvement for geogrid sheet dimensionless distances of 7.7, 11.5, and 15.4 from the soil surface is 10% increase, 6% decrease, and 13% increase, respectively.
A noteworthy observation is the significant reduction in displacement at peak pullout force when geogrids are employed. The dimensionless pullout capacity reaches its maximum value at a much lower displacement in the presence of geogrids. Without geogrids, the dimensionless pullout capacity attains its peak at a dimensionless displacement of 2.158. With geogrids placed at dimensionless distances of 7.7, 11.5, and 15.4 from the soil surface, the dimensionless displacements corresponding to peak pullout are 0.965, 0.818, and 1.138, respectively. This substantial reduction in displacement, amounting to 55%, 62.5%, and 47% for geogrid distances of 7.7, 11.5, and 15.4, respectively, holds significant practical value in earthquake-prone regions. Generally, Figure 7 reveals that geogrid placement at dimensionless distances of 15.4 and 11.5 from the ground surface results in the highest uplift improvement and the lowest displacement for single blade HPs with a dimensionless pitch of one.
Comparison of Pullout–Displacement Curves for Double Blade HPs with a Pitch of 13 mm
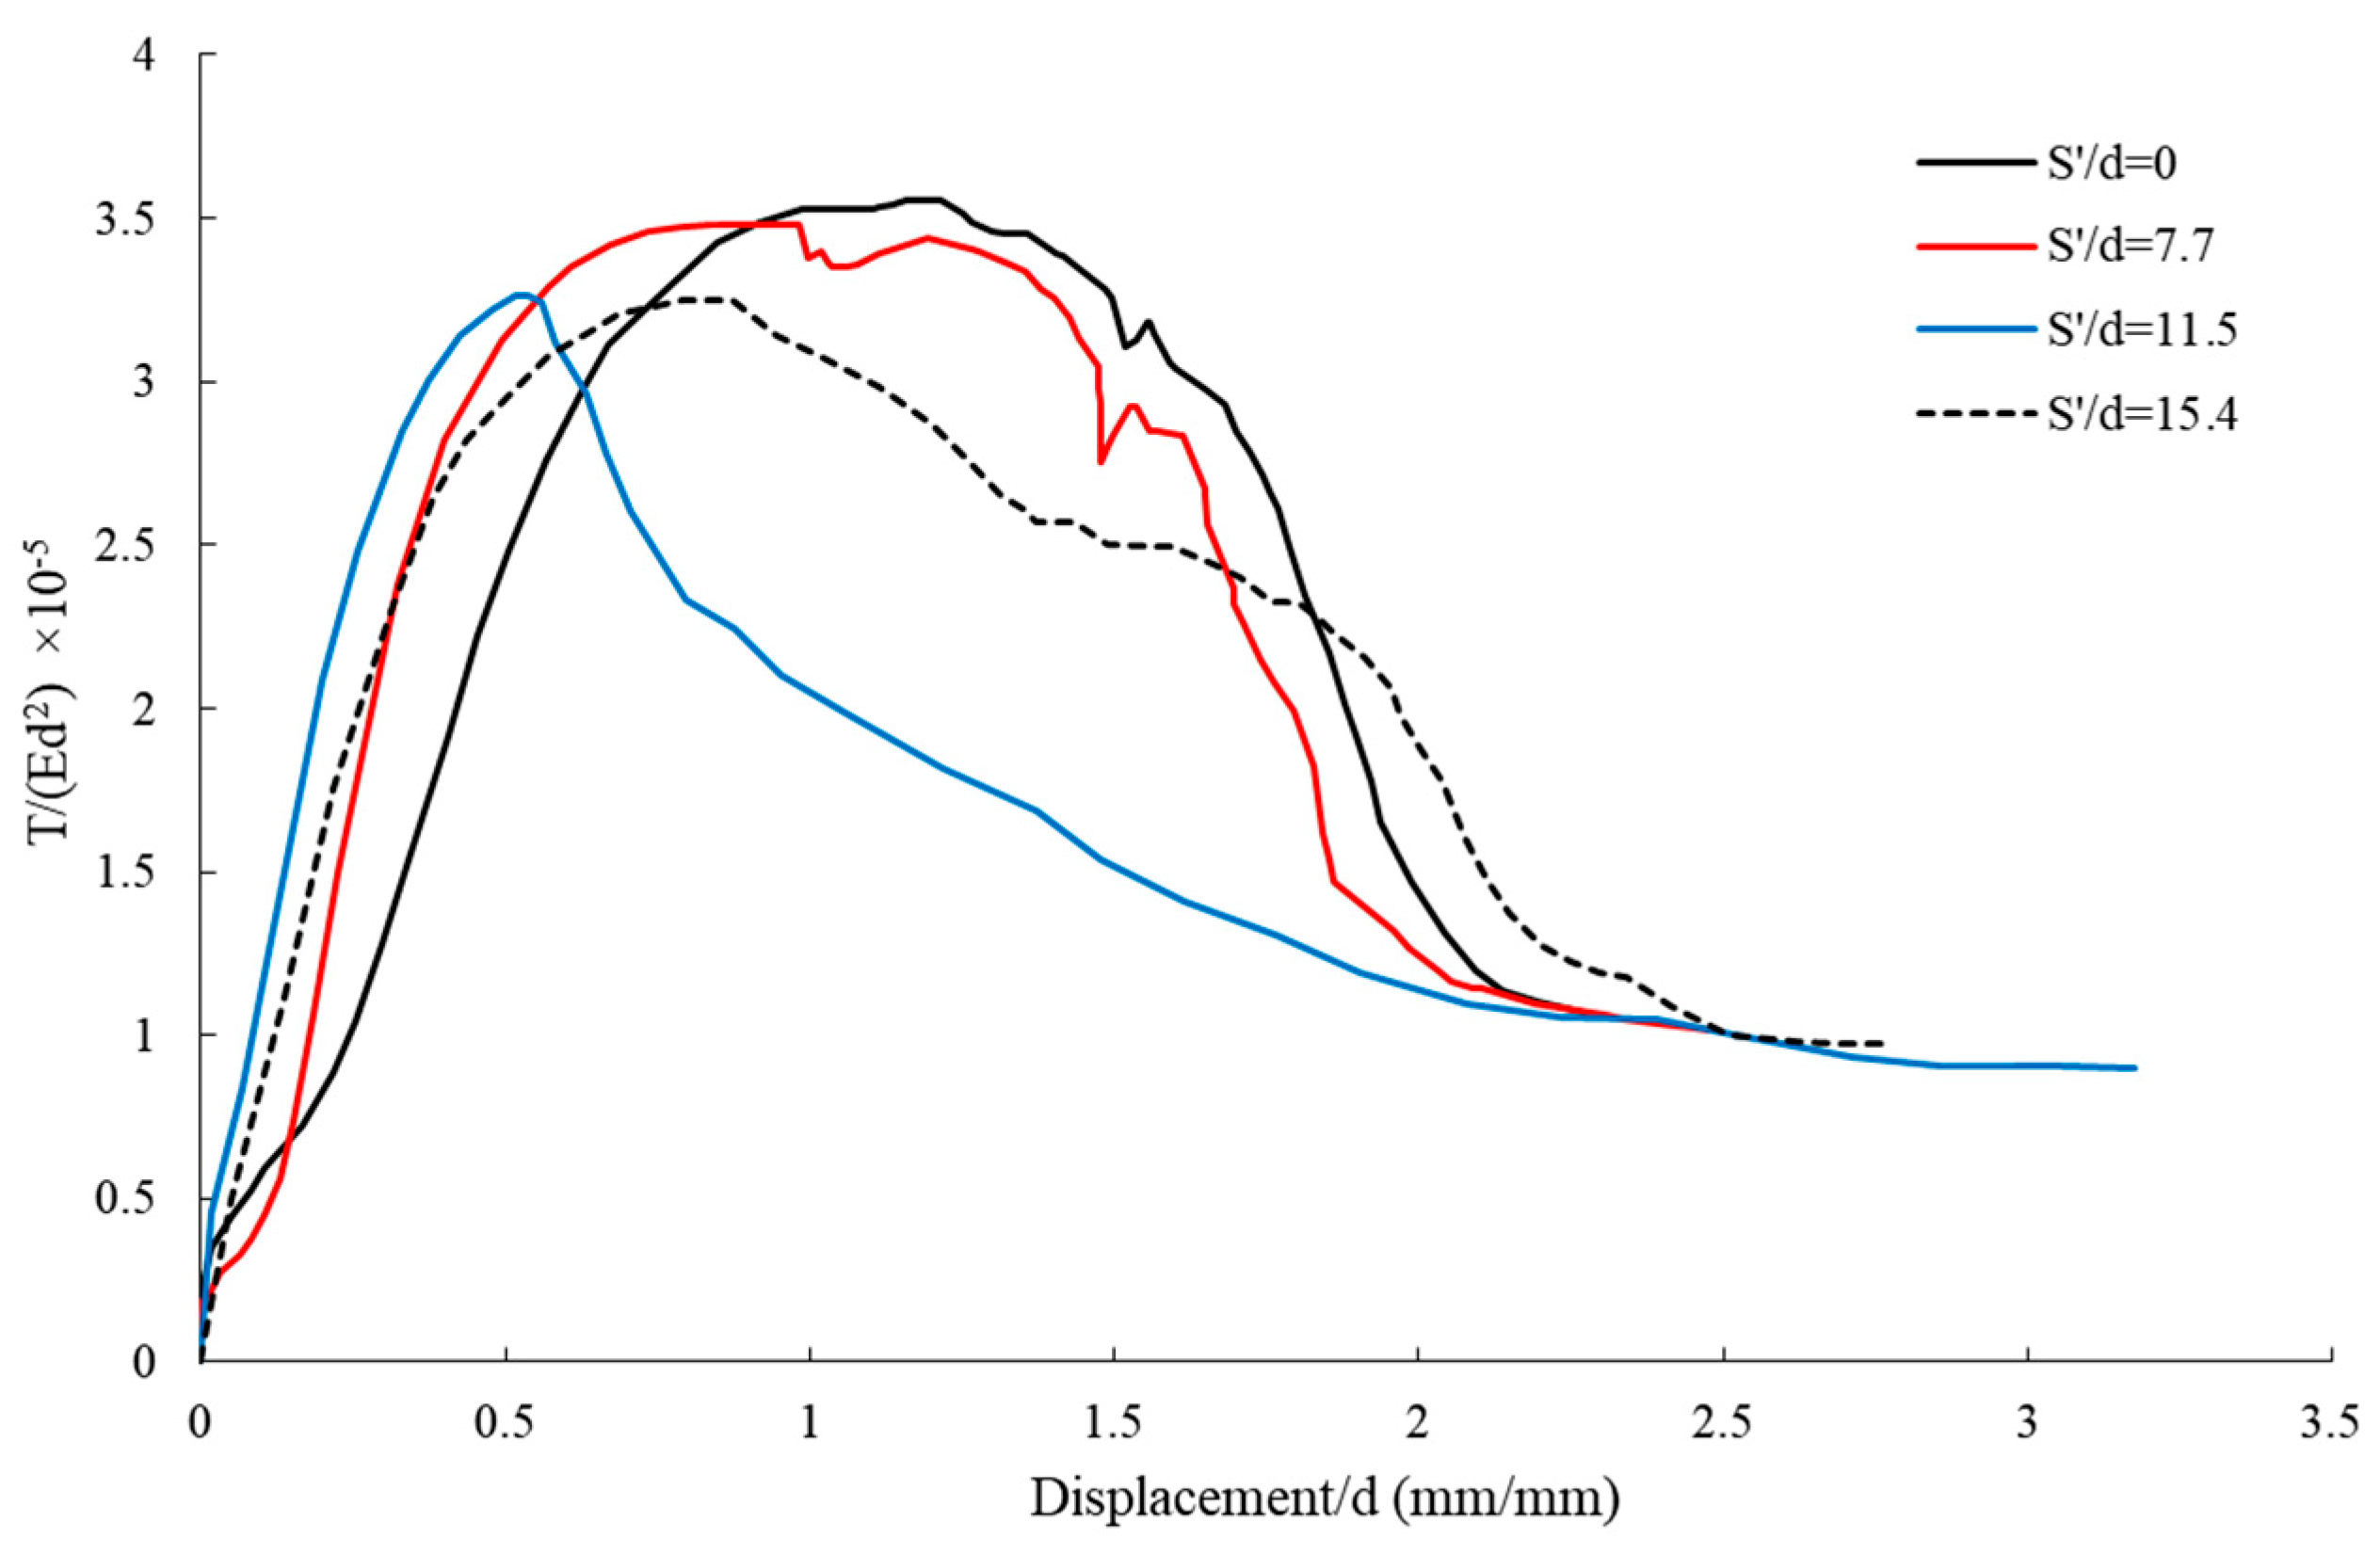
Figure 8 presents the pullout–displacement curves for double blade HPs with a pitch of 13 mm under varying geogrid sheet distances from the soil surface. All parameters remain the same as those described in the previous section. This section focuses on the effect of geogrid sheet placement on the pullout capacity of HPs.
The effect of geogrid on the pullout capacity and displacement of a two-blade helical pile with a dimensionless pitch of one was investigated. The results showed that the use of geogrids can significantly increase the pullout capacity and reduce the displacement of the pile. The maximum dimensionless pullout capacity without geogrids was 3.573 × 10⁻⁵, while the maximum dimensionless pullout capacity with geogrids at dimensionless distances of 7.7, 11.5, and 15.4 from the ground surface was 3.508 × 10⁻⁵, 3.276 × 10⁻⁵, and 3.283 × 10⁻⁵, respectively. The geogrids were placed at dimensionless distances of 0.23, 0.35, and 0.47 from the end of the pile, respectively. The use of geogrids reduced the displacement at pullout by 1.8%, 8.2%, and 8%, respectively. The pullout capacity was reached at a lower displacement when geogrids were used. The dimensionless displacement at pullout without geogrids was 1.12, while the dimensionless displacement at pullout with geogrids at dimensionless distances of 7.7, 11.5, and 15.4 from the ground surface was 0.911, 0.507, and 0.571, respectively. The use of geogrids reduced the displacement by 18.62%, 54.48%, and 32.75%, respectively. The results showed that the use of geogrids at dimensionless distances of 7.7 and 11.5 from the ground surface resulted in the maximum pullout capacity and the minimum displacement for the two-blade helical pile with a dimensionless pitch of one.
Comparison of Pullout Capacity–Displacement for a Single-Blade Helical Pile with a Pitch of 20 mm
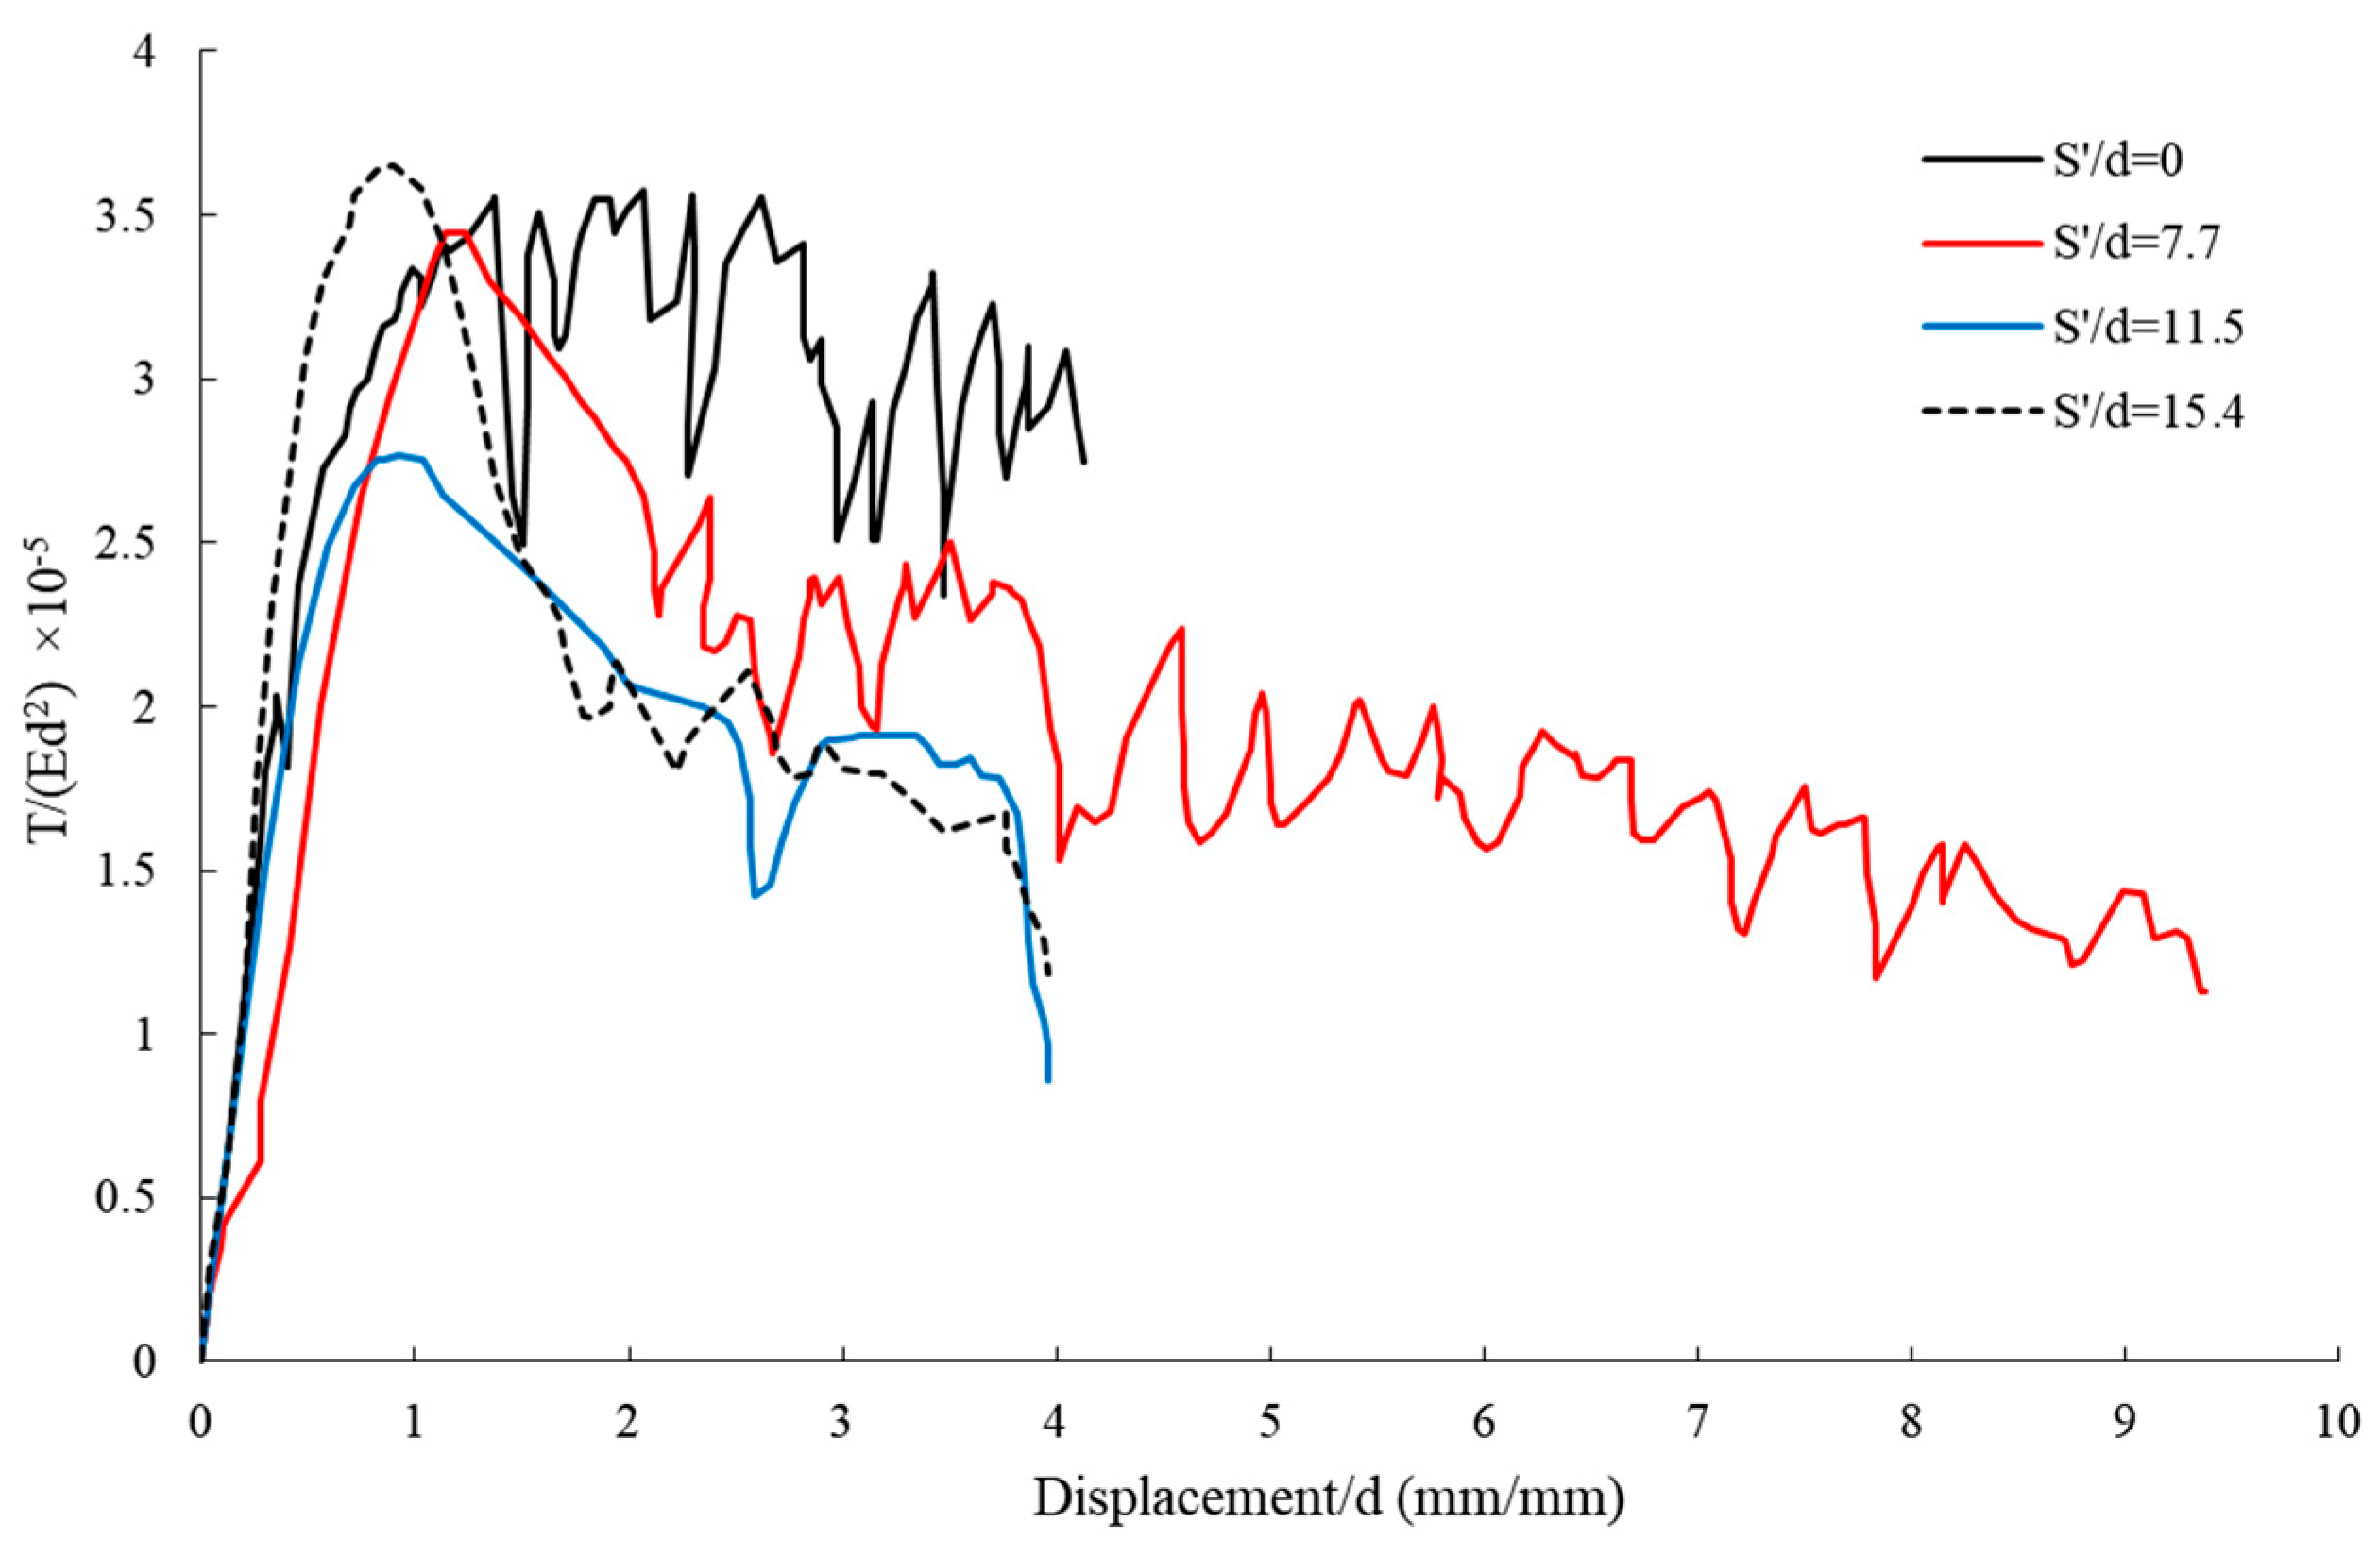
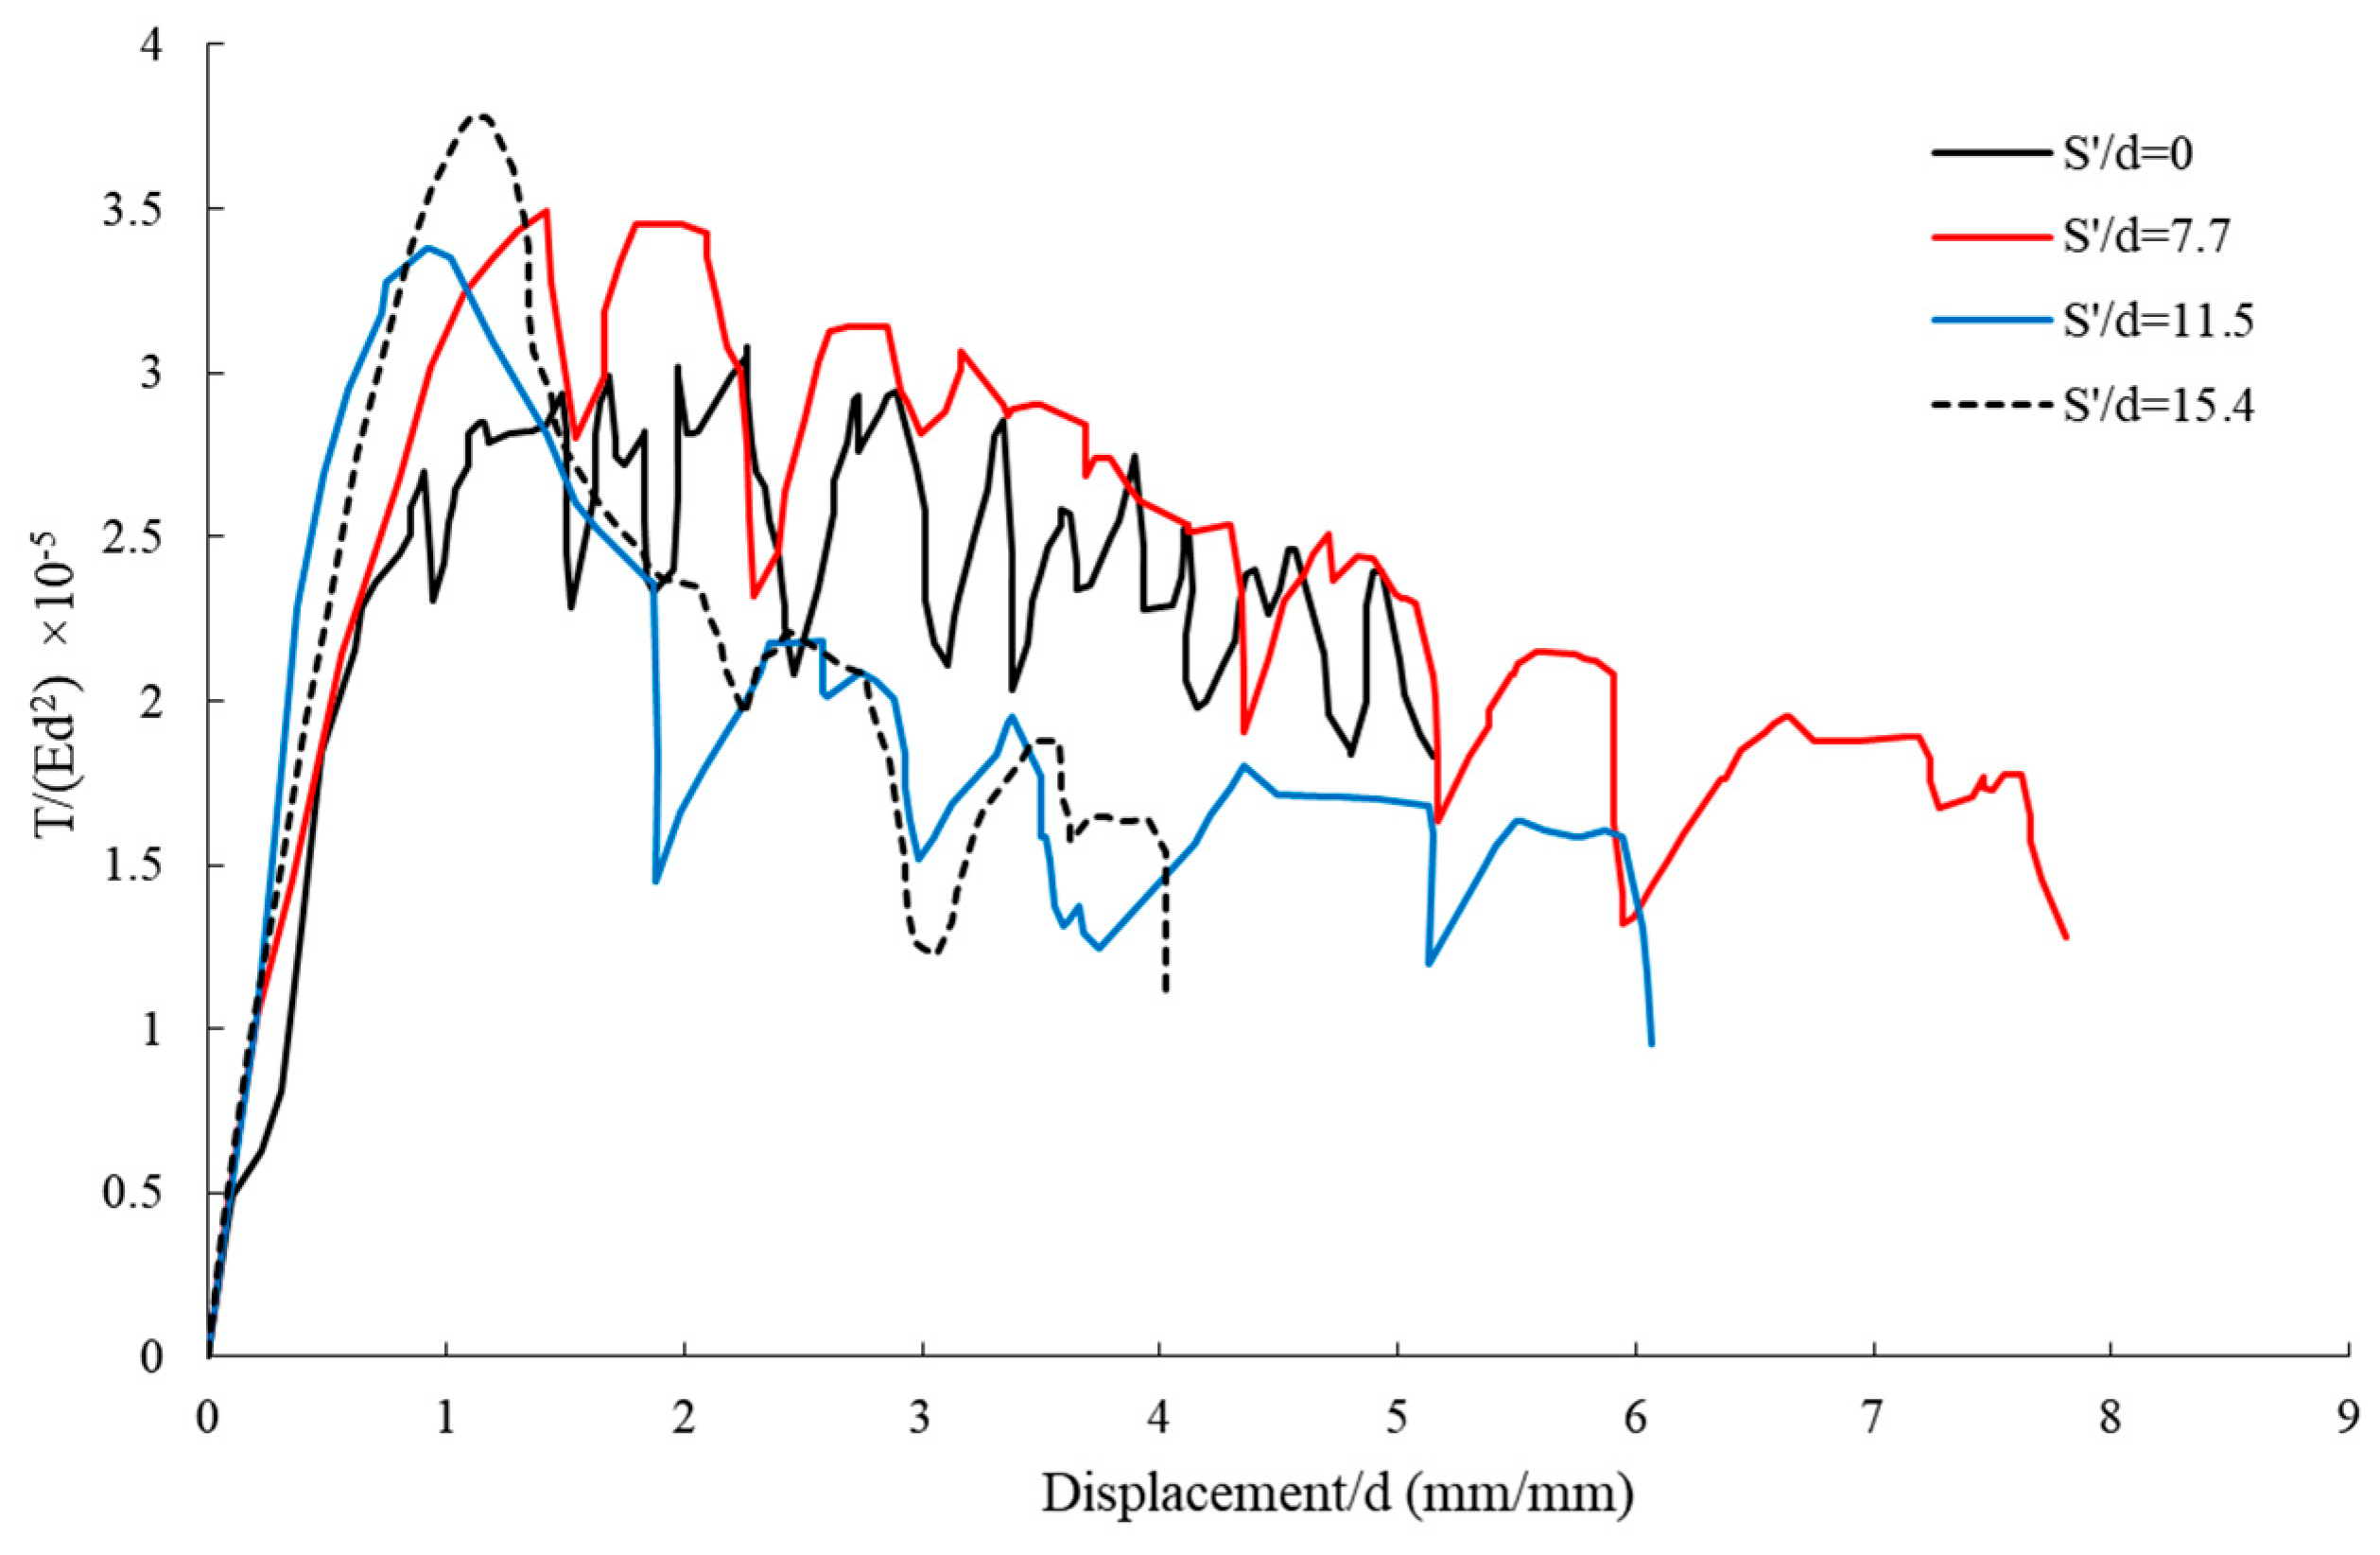
Figure 9 shows the pullout–displacement curves of a single-blade HP with a pitch of 20 mm, where the pile diameter (d) is 13 mm, the blade pitch (n) is one, the pitch of the helical plates (S) is 20 mm, the pile height (L) is 600 mm, and the buried length of the pile in the soil (L’) is 430 mm. The effect of the distance of the geogrid plate from the ground surface on the pullout capacity of this type of HP is compared.
Figure 9 shows the pullout–displacement curves of a single-blade helical pile with a dimensionless pitch of 1.5, with and without geogrids. The maximum dimensionless pullout capacity without geogrids is 3.542 × 10⁻⁵, while the maximum dimensionless pullout capacity with geogrids at dimensionless distances of 7.7, 11.5, and 15.4 from the ground surface is 3.448 × 10⁻⁵, 2.779 × 10⁻⁵, and 3.626 × 10⁻⁵, respectively. The geogrids were placed at dimensionless distances of 0.23, 0.35, and 0.47 from the end of the pile, respectively. The use of geogrids reduced the displacement at pullout by 2.63%, 1.492%, and 2.38%, respectively. The dimensionless displacement at pullout without geogrids was 2.083, while the dimensionless displacement at pullout with geogrids at dimensionless distances of 7.7, 11.5, and 15.4 from the ground surface was 1.137, 0.95, and 0.873, respectively. The use of geogrids reduced the displacement by 45.75%, 54.61%, and 58.3%, respectively. The results showed that the use of geogrids at a dimensionless distance of 15.4 from the ground surface resulted in the maximum pullout capacity and the minimum displacement for the single-blade HP with a dimensionless pitch of 1.5.
Comparison of Pullout Capacity–Displacement for a Double-Blade Helical Pile with a Pitch of 20 mm
Figure 10 shows the pullout–displacement curves of a two-blade HP with a pitch of 20 mm, where all parameters are the same as those described in the previous section. The effect of geogrid plate spacing on the pullout capacity of this type of HP is compared.
Figure 10 shows the pullout–displacement curves of a two-blade HP with a dimensionless pitch of 1.54, with and without geogrids. The maximum dimensionless pullout capacity without geogrids is 3.292 × 10⁻⁵, while the maximum dimensionless pullout capacity with geogrids at dimensionless distances of 7.7, 11.5, and 15.4 from the ground surface is 3.005 × 10⁻⁵, 2.709 × 10⁻⁵, and 3.280 × 10⁻⁵, respectively. The geogrids were placed at dimensionless distances of 0.23, 0.35, and 0.47 from the end of the pile, respectively. The use of geogrids reduced the displacement at pullout by 8.73%, 17.72%, and 0.42%, respectively. The dimensionless displacement at pullout without geogrids was 1.16, while the dimensionless displacement at pullout with geogrids at dimensionless distances of 7.7, 11.5, and 15.4 from the ground surface was 1.186, 0.584, and 0.785, respectively. The use of geogrids reduced the displacement by 1.98%, 49.66%, and 32.45%, respectively. The results showed that the use of geogrids at dimensionless distances of 7.7 and 11.5 from the ground surface resulted in the maximum pullout capacity and the minimum displacement for the two-blade HP with a dimensionless pitch of 1.54.
Comparison of Pullout Capacity–Displacement for a Single-Blade Helical Pile with a Pitch of 25 mm
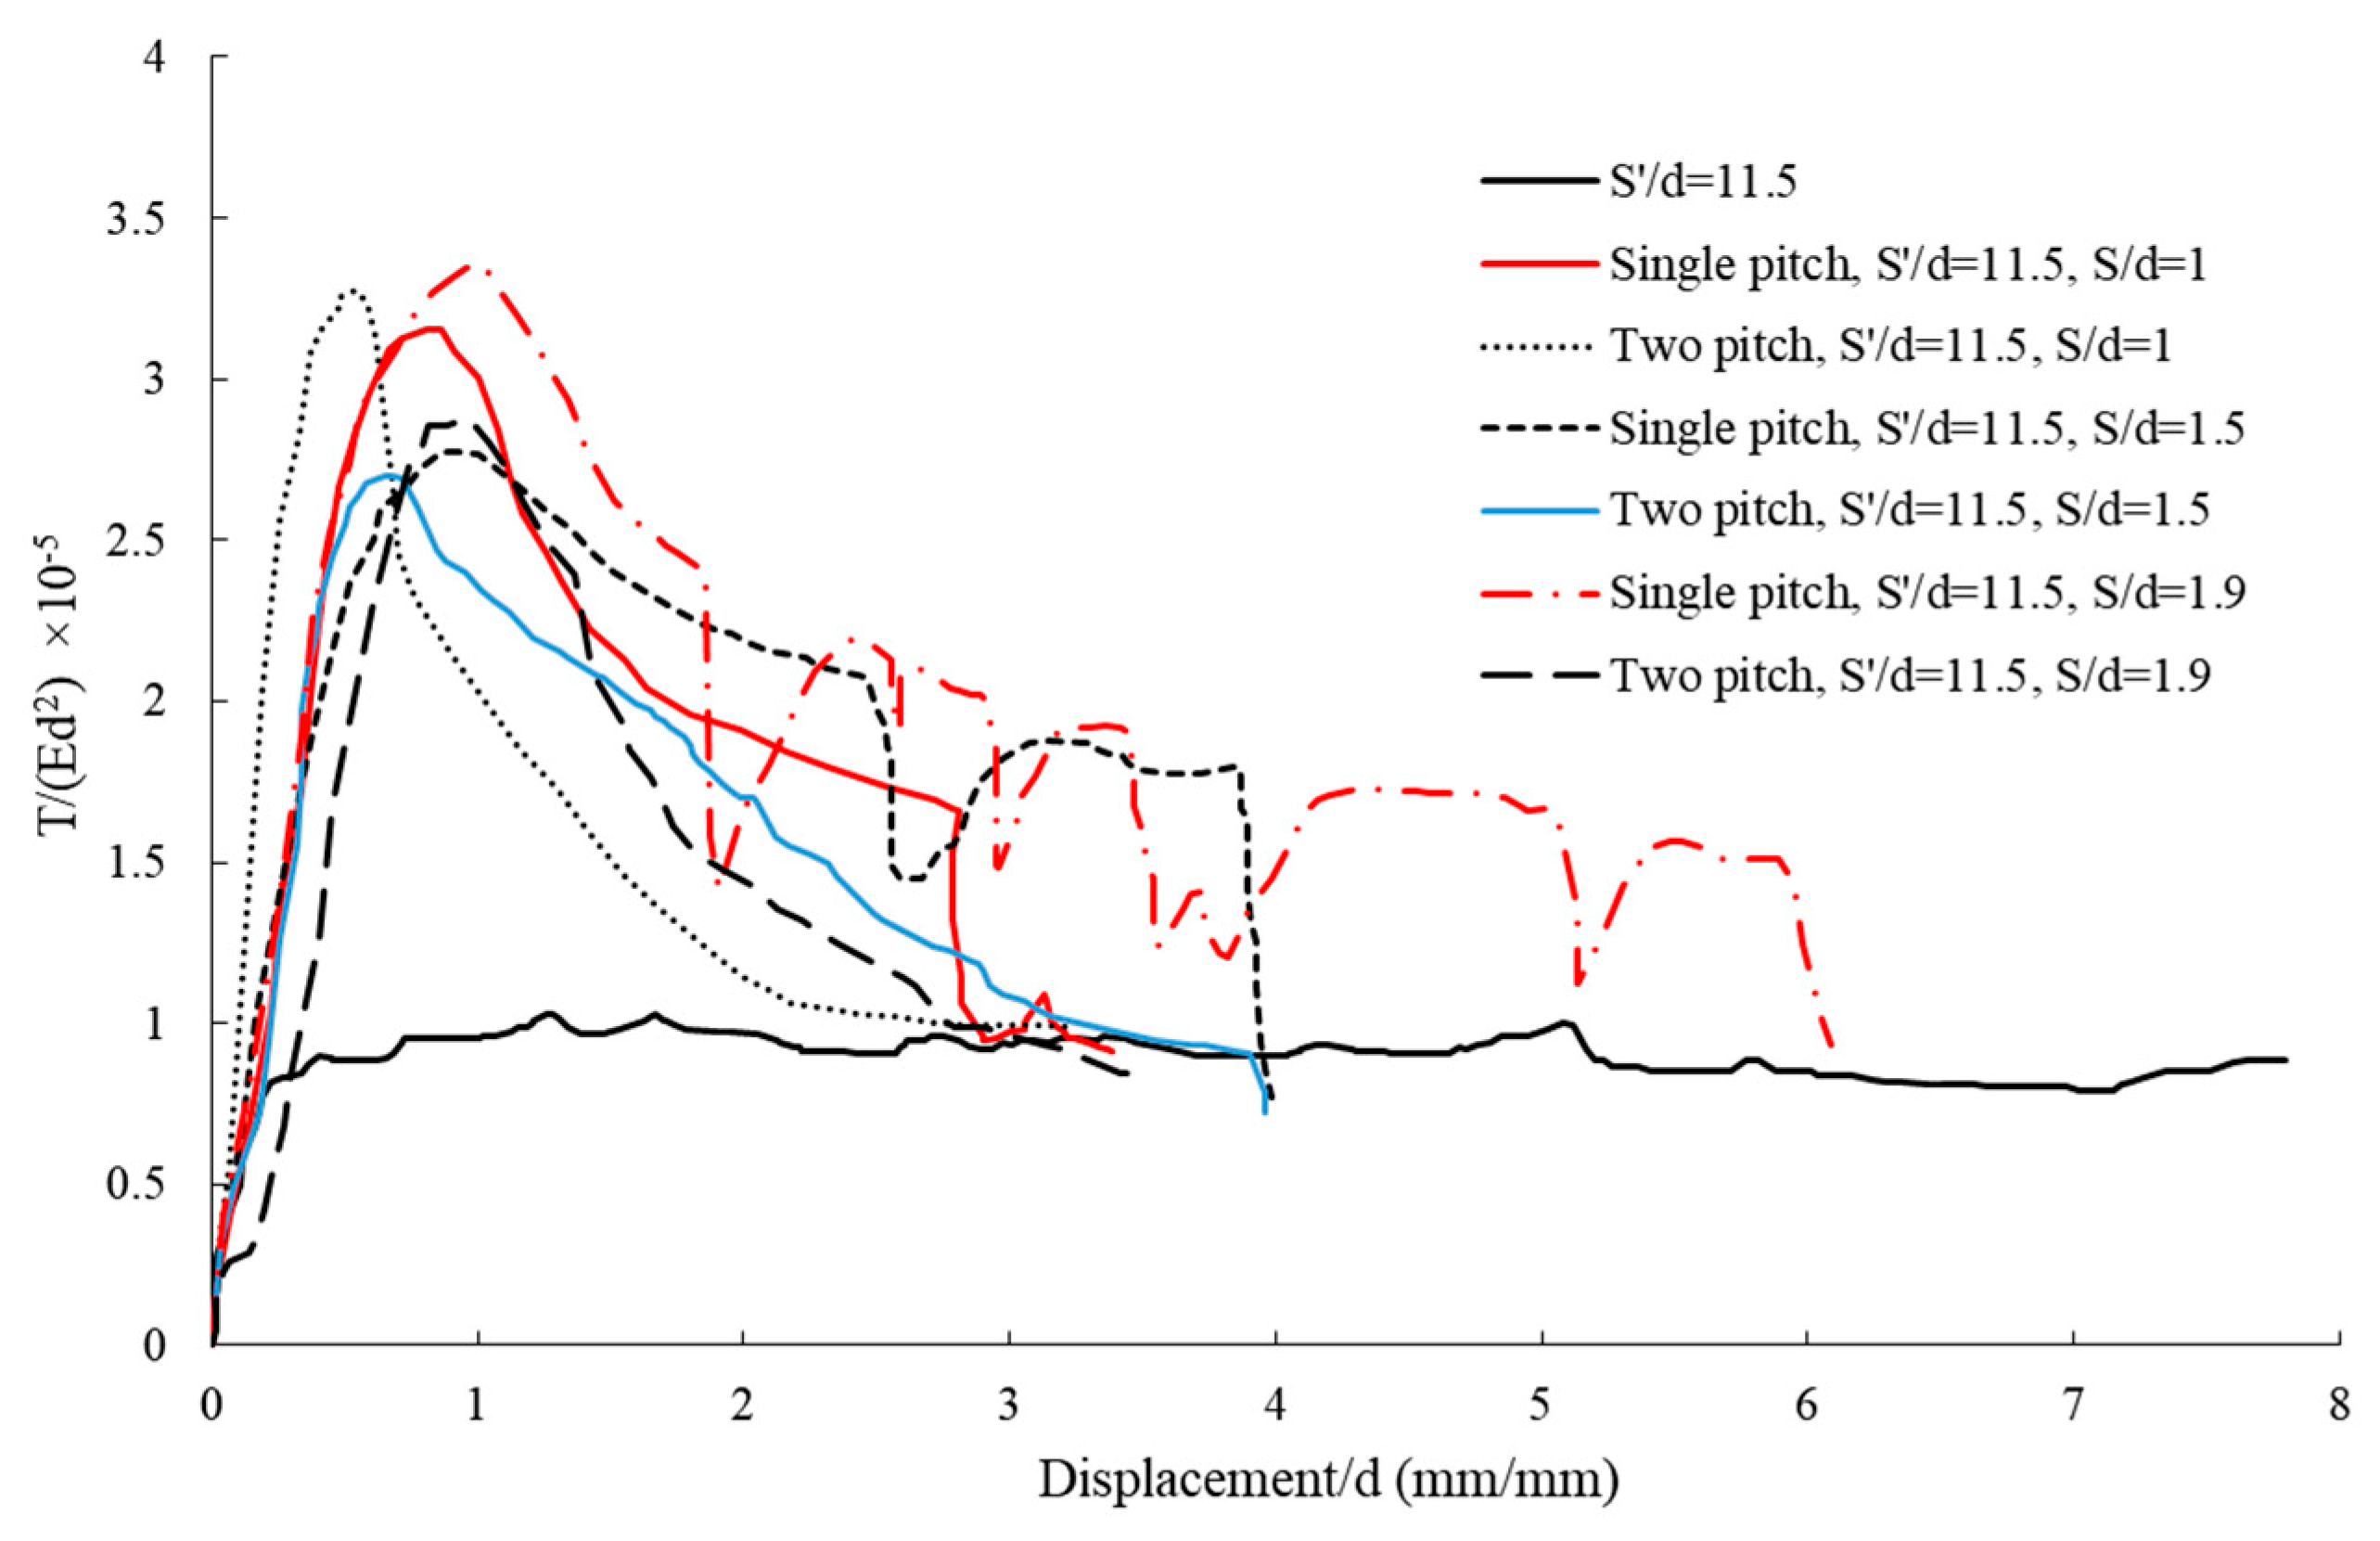
Figure 11 shows the pullout–displacement curves of a single-blade helical pile with a pitch of 254 mm. The effect of geogrid plate spacing on the pullout capacity of HP is compared. The maximum dimensionless pullout capacity without geogrids is 3.070 × 10⁻⁵, while the maximum dimensionless pullout capacity with geogrids at dimensionless distances of 7.7, 11.5, and 15.4 from the ground surface is 3.465 × 10⁻⁵, 3.391 × 10⁻⁵, and 3.790 × 10⁻⁵, respectively. The geogrids were placed at dimensionless distances of 0.23, 0.35, and 0.47 from the end of the pile, respectively. The use of geogrids increased the pullout by 12.85%, 10.47%, and 23.51%, respectively. The dimensionless displacement at pullout without geogrids was 2.294, while the dimensionless displacement at pullout with geogrids at dimensionless distances of 7.7, 11.5, and 15.4 from the ground surface was 1.446, 0.967, and 1.134, respectively. The use of geogrids reduced the displacement by 36.91%, 57.72%, and 50.67%, respectively. The single-spiral pile with a dimensionless pitch of 1.9 is one of the best examples used in this research, which, in addition to increasing the pullout capacity, also shows a decrease in displacement at all distances where the geogrid is placed on the ground surface. Finally, based on Figure 11, it can be concluded that the use of geogrids at dimensionless distances of 15.4 and 11.5 from the ground surface results in the maximum pullout capacity and the minimum displacement for the single-blade helical pile with a dimensionless pitch of 1.9.
Comparison of Pullout Capacity–Displacement for a Double-Blade Helical Pile with a Pitch of 25 mm
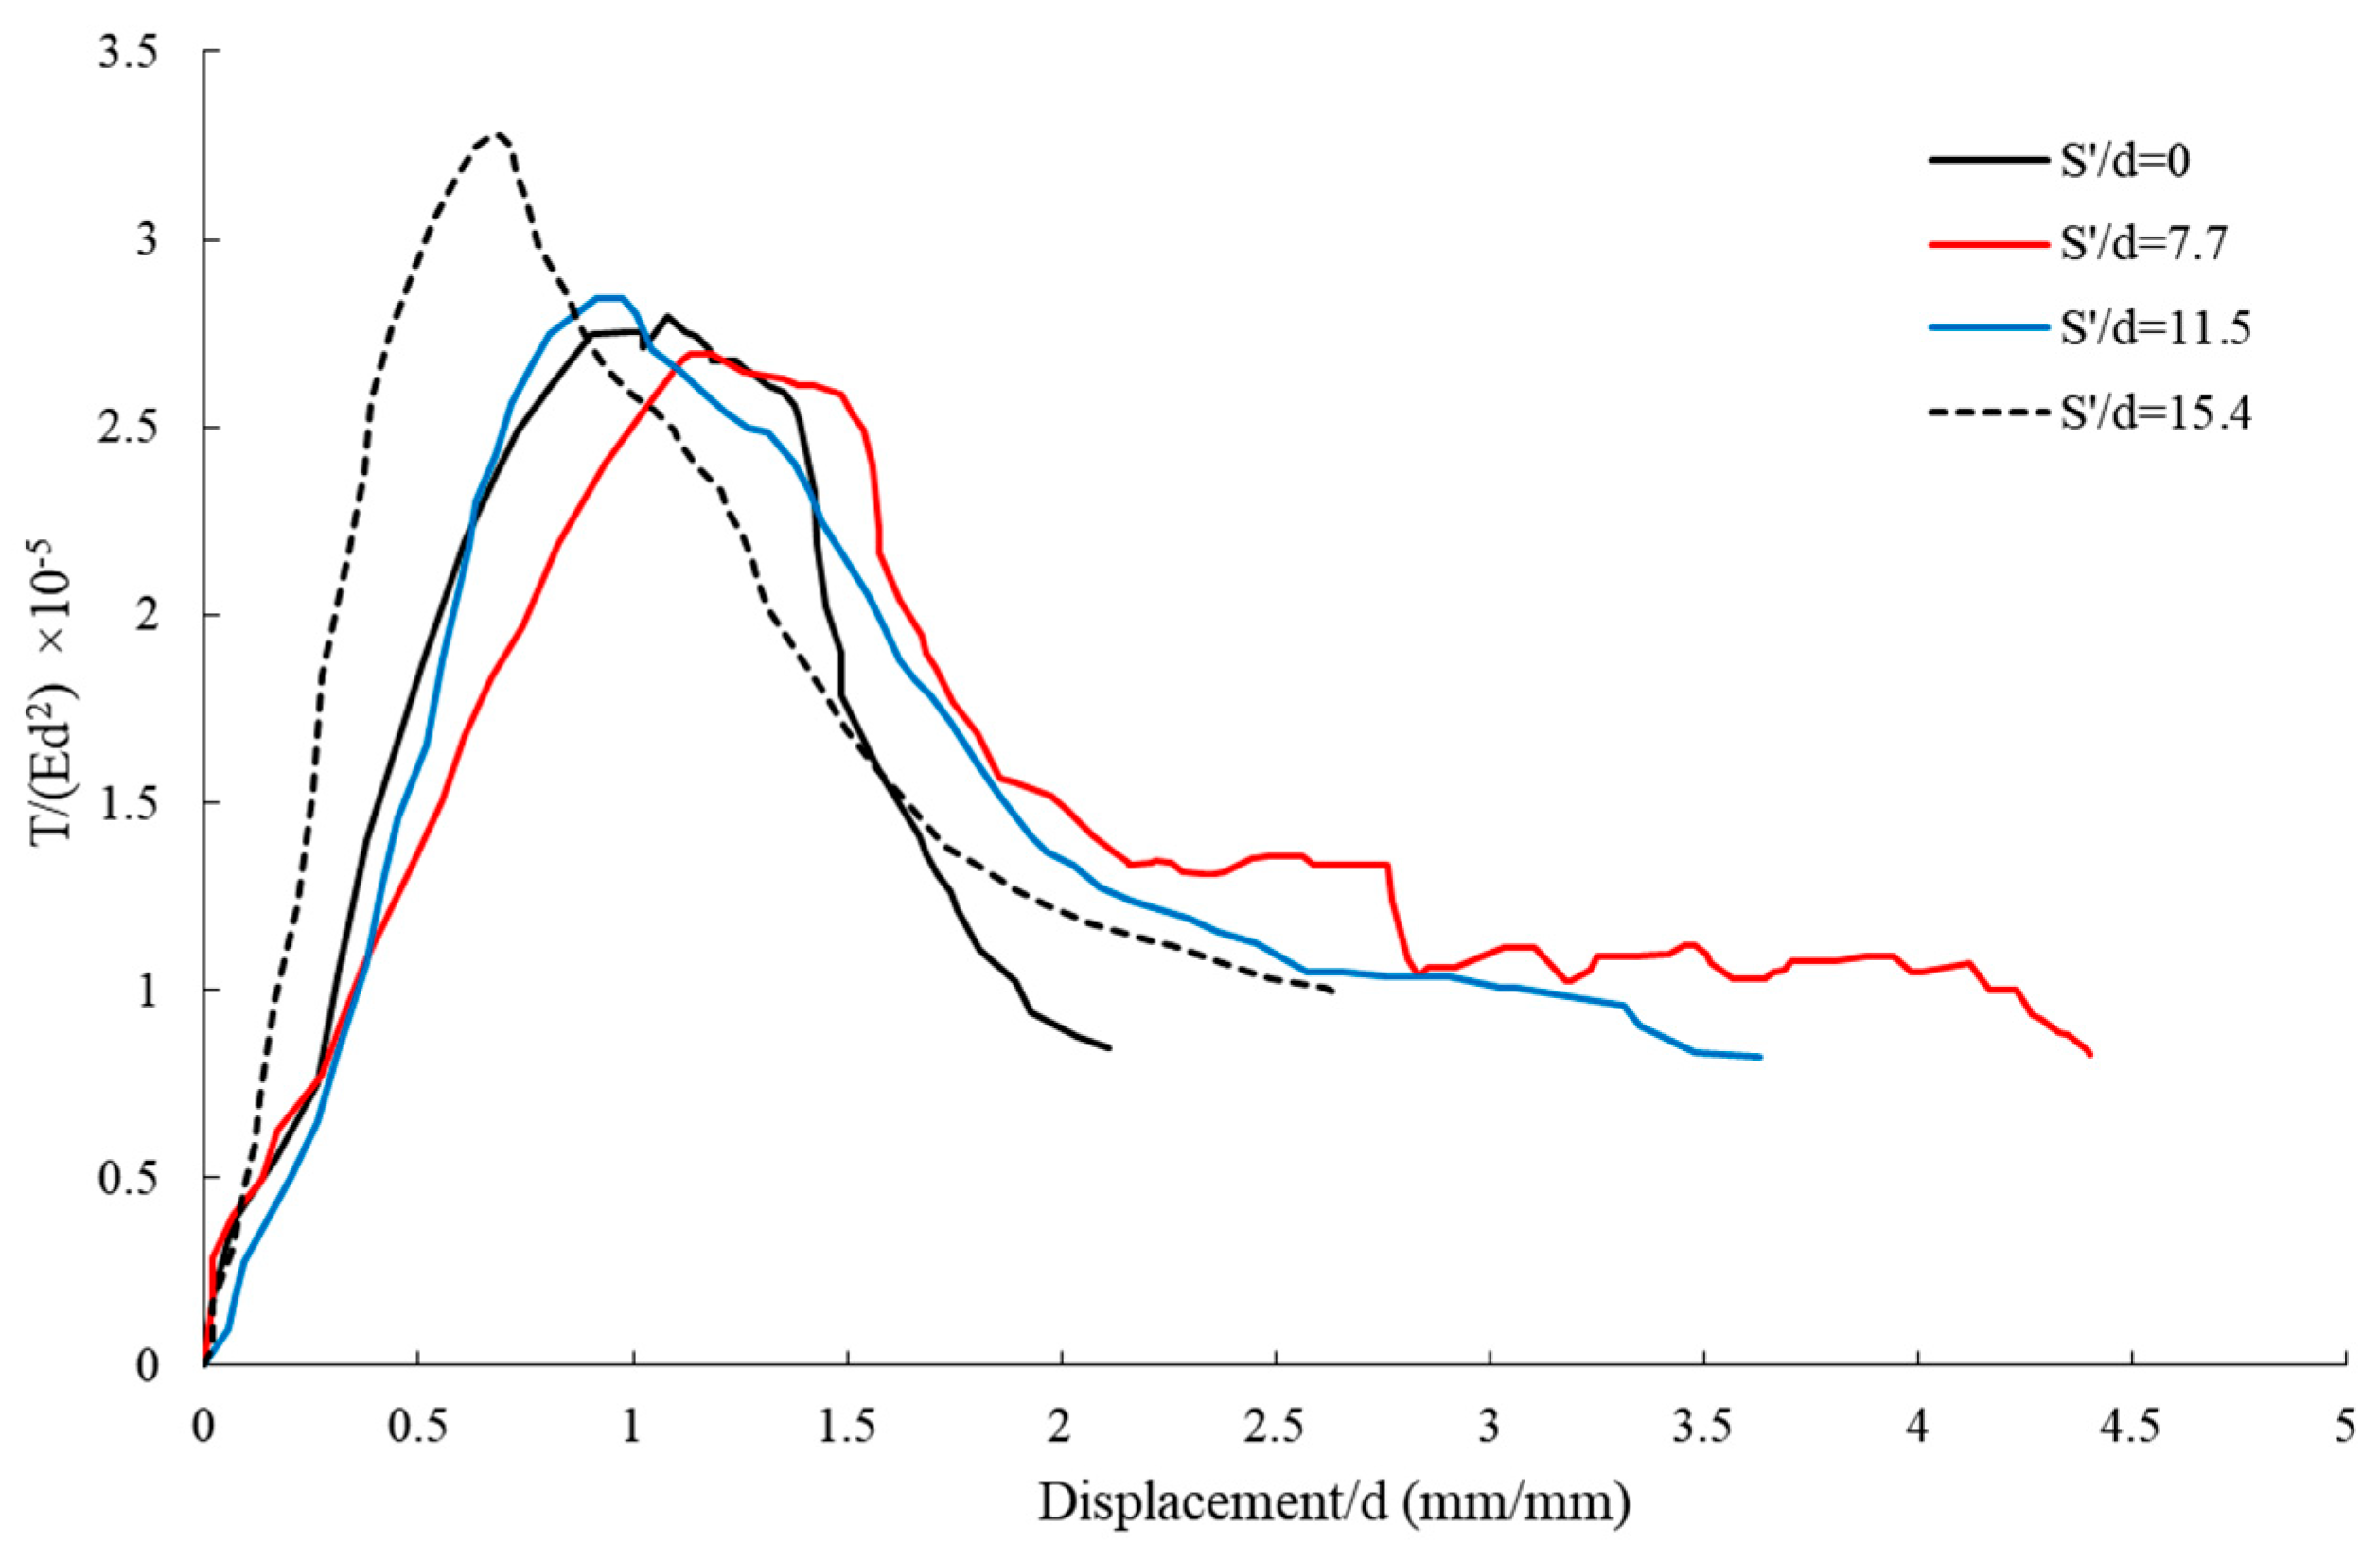
Figure 12 shows the pullout–displacement curves of a two-blade HP with a pitch of 25 mm, where all parameters are the same as those described in the previous section. The effect of geogrid plate spacing on the pullout capacity of HP is compared in this section, and the results of the experiment on this sample are discussed in the next section. The maximum dimensionless pullout capacity without geogrids is 2.795 × 10⁻⁵, while the maximum dimensionless pullout capacity with geogrids at dimensionless distances of 7.7, 11.5, and 15.4 from the ground surface is 2.750 × 10⁻⁵, 2.845 × 10⁻⁵, and 3.288 × 10⁻⁵, respectively. The geogrids were placed at dimensionless distances of 0.23, 0.35, and 0.47 from the end of the pile, respectively. The use of geogrids reduced the pullout by 6.1%, 1.8%, and 17.65%, respectively. Compared to tests without geogrids, dimensionless displacement at pullout decreased by 17.48% and 38.46% when geogrids were placed at dimensionless distances of 11.5 and 15.4 from the ground surface, respectively. However, at a dimensionless distance of 7.7, geogrids slightly increased displacement by 1.9%. The two-blade pile with a dimensionless pitch of 1.9 is one of the best examples used in this research, which, in addition to increasing the pullout capacity, also shows a significant decrease in displacement in this case.

4.2.2. Comparison of Pullout–Displacement Capacity for All Helical Piles with Different Blade Pitches

Comparison of Pullout–Displacement Capacity for All Helical Piles with Geogrids, 100 mm from the Ground Surface
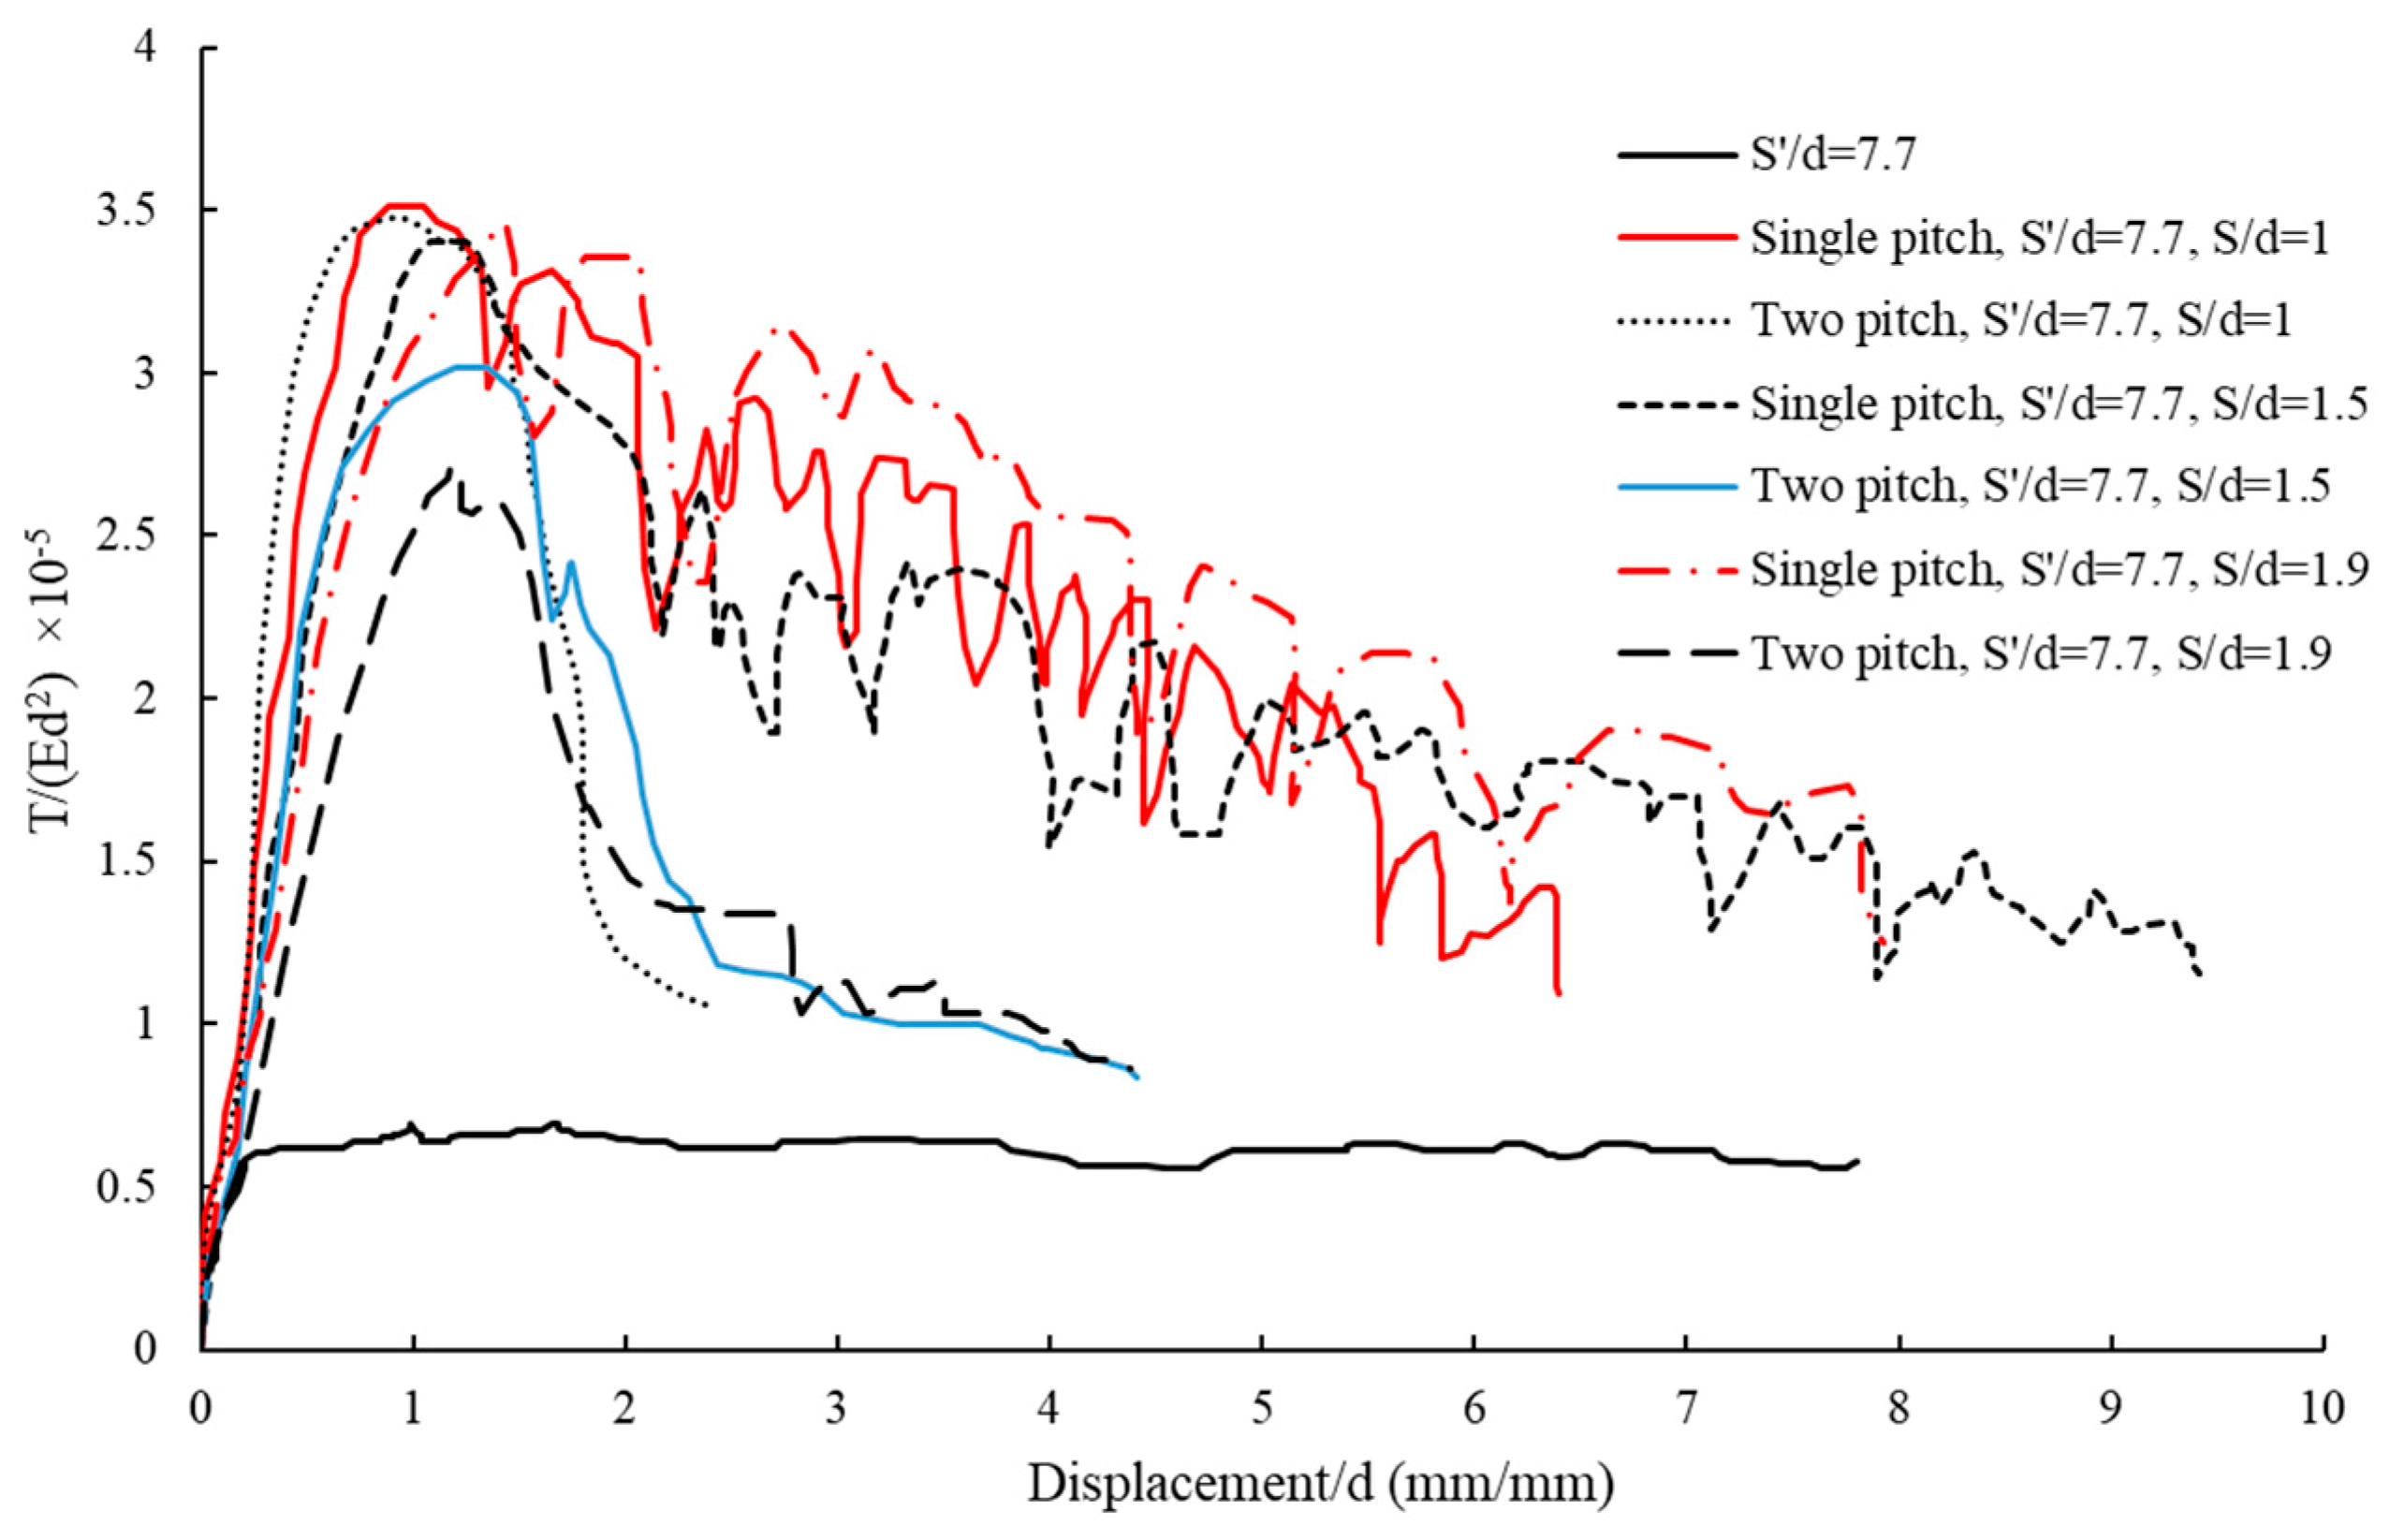
Figure 13 shows the pullout–displacement curves for all helical piles with pitch values (S) of 12.5, 20, and 25 mm, with one and two blades, where the geogrid distance from the ground surface is 100 mm, the pile diameter (d) is 12.5 cm, the pile height (L) is 600 mm, and the length of the pile buried in the soil is 430 mm. The effect of the pitch of the helical plates on the pullout capacity of this type of HP is compared. Figure 13 illustrates the impact of helical plate pitch on the pullout capacity of these helical piles. Piles with a larger pitch exhibit a higher pullout capacity. This is attributed to the increased surface area provided by the larger pitch, enhancing the friction between the pile and the surrounding soil.
Figure 13 presents the pullout–displacement curves for various helical pile configurations, including single-blade and double-blade piles with different pitch values (dimensionless pitch = 1, 1.5, and 1.9) and a geogrid placed at a dimensionless distance of 7.7 from the ground surface. By analyzing the data, valuable insights can be extracted on the pullout capacity and displacement characteristics of these piles (Table 2).
Based on Figure 13, the analysis of pullout performance reveals that double-blade helical piles with a pitch of 1 exhibit the greatest maximum dimensionless pullout capacity (3.508 × 10⁻⁵) and the lowest dimensionless displacement at maximum pullout (0.911) when the geogrid is positioned at a dimensionless distance of 7.7 from the ground surface. This is in comparison to other pile configurations, including single-blade and double-blade piles with varying pitch values.
Comparison of Pullout–Displacement Capacity for All Helical Piles with Geogrids, 150 mm from the Ground Surface
Figure 14 presents the pullout–displacement curves for various helical pile configurations, including single-blade and double-blade piles with different pitch values (dimensionless pitch = 1, 1.5, and 1.9) and a geogrid placed at a dimensionless distance of 11.5 from the ground surface. By analyzing the results from Table 3, valuable insights can be extracted on the pullout capacity and displacement characteristics of these piles. Based on the analysis of Figure 11, it is evident that helical piles with geogrids placed at a dimensionless distance of 11.5 from the ground surface offer superior pullout performance compared to regular piles. Among the helical pile configurations, single-blade piles with a pitch of 1.9 exhibit the highest maximum pullout capacity, while double-blade piles with a pitch of 1 demonstrate the lowest displacement at maximum pullout. These findings suggest that both single-blade piles with a pitch of 1.9 and double-blade piles with a pitch of 1 are favorable options for this specific geogrid placement scenario, each offering distinct advantages in terms of pullout capacity and displacement behavior.
Comparison of Pullout–Displacement Capacity for All Helical Piles with Geogrids, 200 mm from the Ground Surface
Figure 15 presents the pullout–displacement curves for various helical pile configurations, including single-blade and double-blade piles with different pitch values (dimensionless pitch = 1, 1.5, and 1.9) and a geogrid placed at a dimensionless distance of 15.4 from the ground surface. Based on the analysis of Figure 15 and Table 4, it is evident that helical piles with geogrids placed at a dimensionless distance of 15.4 from the ground surface offer superior pullout performance compared to regular piles. Among the helical pile configurations, single-blade piles with a pitch of 1.9 exhibit the highest maximum pullout capacity, while double-blade piles with a pitch of 1.9 demonstrate the lowest displacement at maximum pullout. These findings suggest that both single-blade piles with a pitch of 1.9 and double-blade piles with a pitch of 1 are favorable options for this specific geogrid placement scenario, each offering distinct advantages in terms of pullout capacity and displacement behavior.

4.3. Comparison of Maximum Pullout Capacity–Blade Pitch of HPs

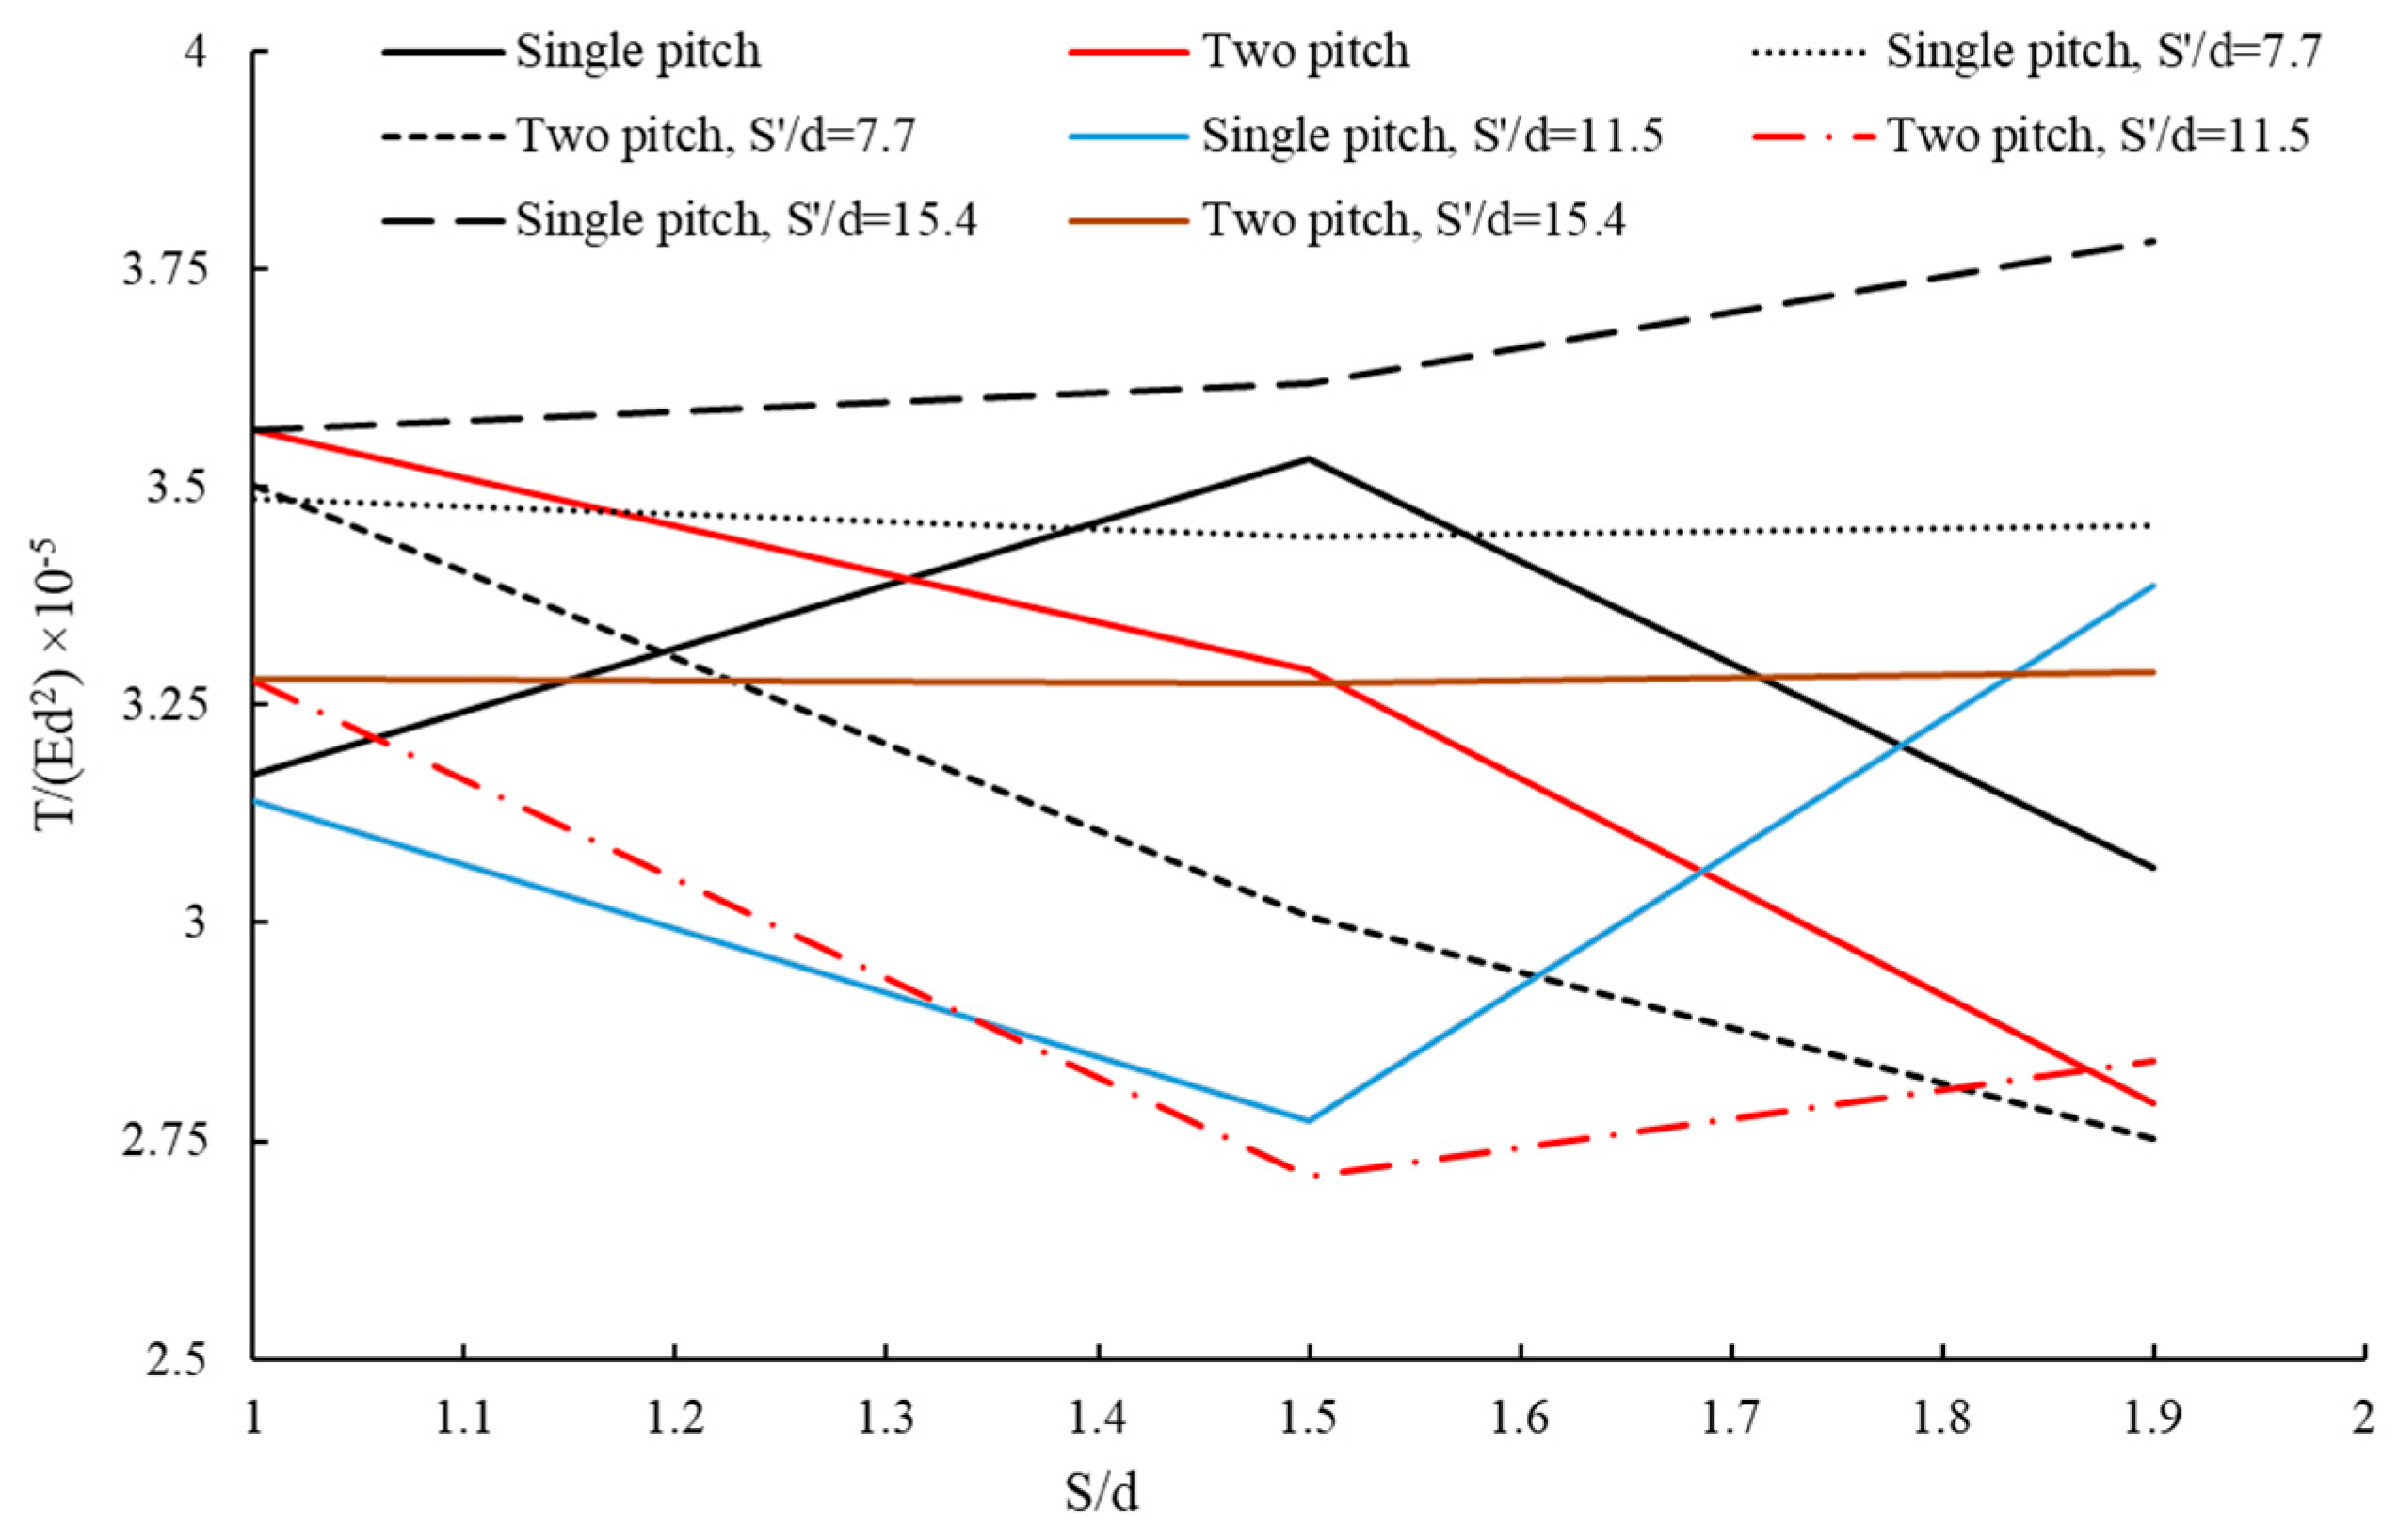
Figure 16 presents the pullout–displacement curves for various helical pile configurations, including single-blade and double-blade piles with different pitch values (dimensionless pitch = 1, 1.5, and 1.9) and geogrid placements. The single-blade helical pile with a dimensionless pitch of 1.9 and geogrid placed at a dimensionless distance of 15.4 from the ground surface achieves the highest maximum pullout capacity among all the pile configurations studied. The lowest maximum pullout capacity (dimensionless pullout force = 2.709 × 10⁻⁵) is observed for the double-blade helical pile with a dimensionless pitch of 1.5 and geogrid placed at a dimensionless distance of 11.5 from the ground surface.
Among the double-blade piles without geogrids, the one with a dimensionless pitch of 1 exhibits the highest pullout capacity (1267 N at a displacement of 6.14 mm). The double-blade helical pile with a dimensionless pitch of 1 and geogrid placed at a dimensionless distance of 7.7 from the ground surface ranks second in terms of pullout capacity (1244 N at a displacement of 8.11 mm). It is noteworthy that the double-blade helical pile with a dimensionless pitch of 1 and geogrid achieves its maximum pullout capacity at 19% less displacement compared to the double-blade helical pile with a dimensionless pitch of 1 without geogrid. Interestingly, using geogrids with this pile configuration only increases the pullout capacity by 1.8% compared to the case without geogrids.

4.4. Comparison of T m a x T  Helical Pile Performance Based on Blade Pitch and Geogrid Placement

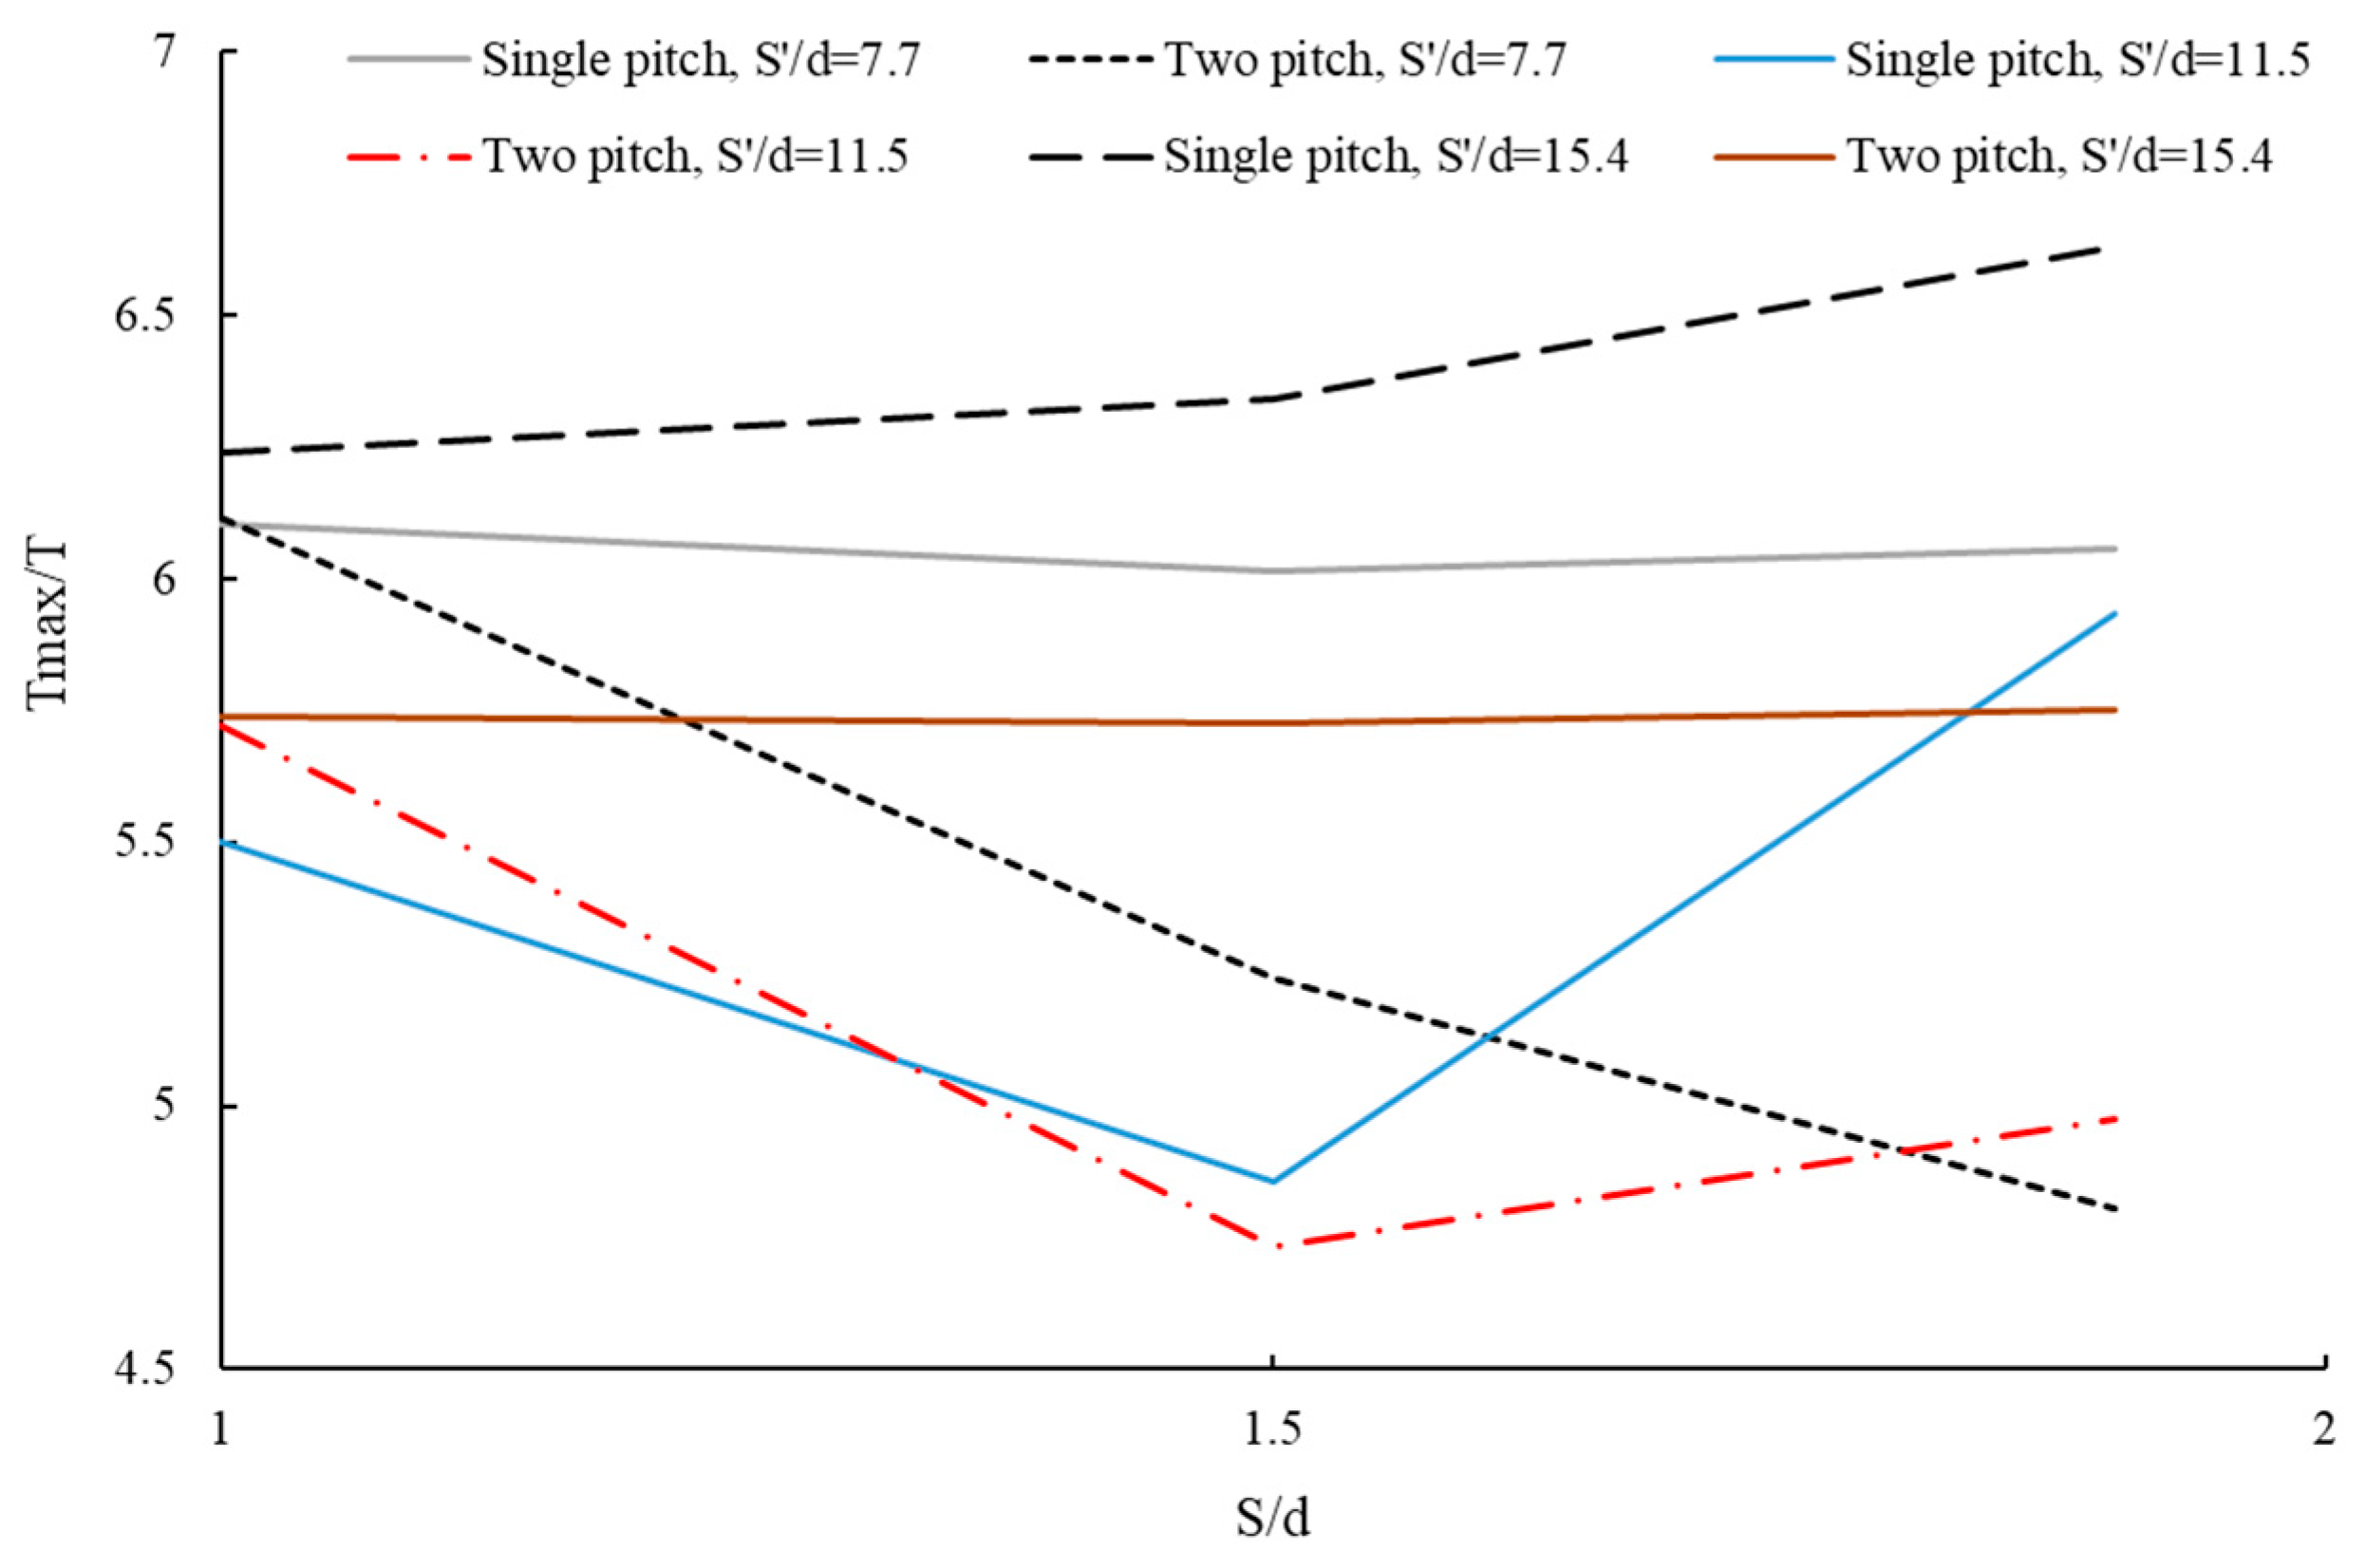
Figure 17 presents the normalized pullout capacity ratio (maximum pullout capacity of helical pile/maximum pullout capacity of regular pile) for various helical pile configurations, including single-blade and double-blade piles with different dimensionless pitches (S) and geogrid placements. The analysis considers a pile diameter (d) of 13 mm, pile height (L) of 600 mm, and an embedded pile length in the soil of 430 mm.
The minimum normalized pullout capacity ratio is 4.7, which occurs for the double-blade helical pile with a dimensionless pitch of 1.5 when the geogrid is placed at a dimensionless distance of 11.5 from the ground surface (0.35 embedment, pile engaging with soil). The maximum increase in the normalized pullout capacity ratio is 62.6%, which occurs for the single-blade helical pile with a dimensionless pitch of 1.9 when the geogrid is placed at a dimensionless distance of 15.4 from the ground surface (0.47 embedment, pile engaging with soil). The minimum normalized pullout capacity ratio for single-blade piles is 4.85, which occurs for the pile with a dimensionless pitch of 1.5 when the geogrid is placed at a dimensionless distance of 11.5 from the ground surface. The maximum normalized pullout capacity ratio for double-blade piles is 6.13, which occurs for the pile with a dimensionless pitch of 1 when the geogrid is placed at a dimensionless distance of 7.7 from the ground surface (0.23 embedment, pile engaging with soil). The best average normalized pullout capacity ratio by pitch is 6.069, which occurs when the geogrid is placed at a dimensionless distance of 15.4 from the ground surface.
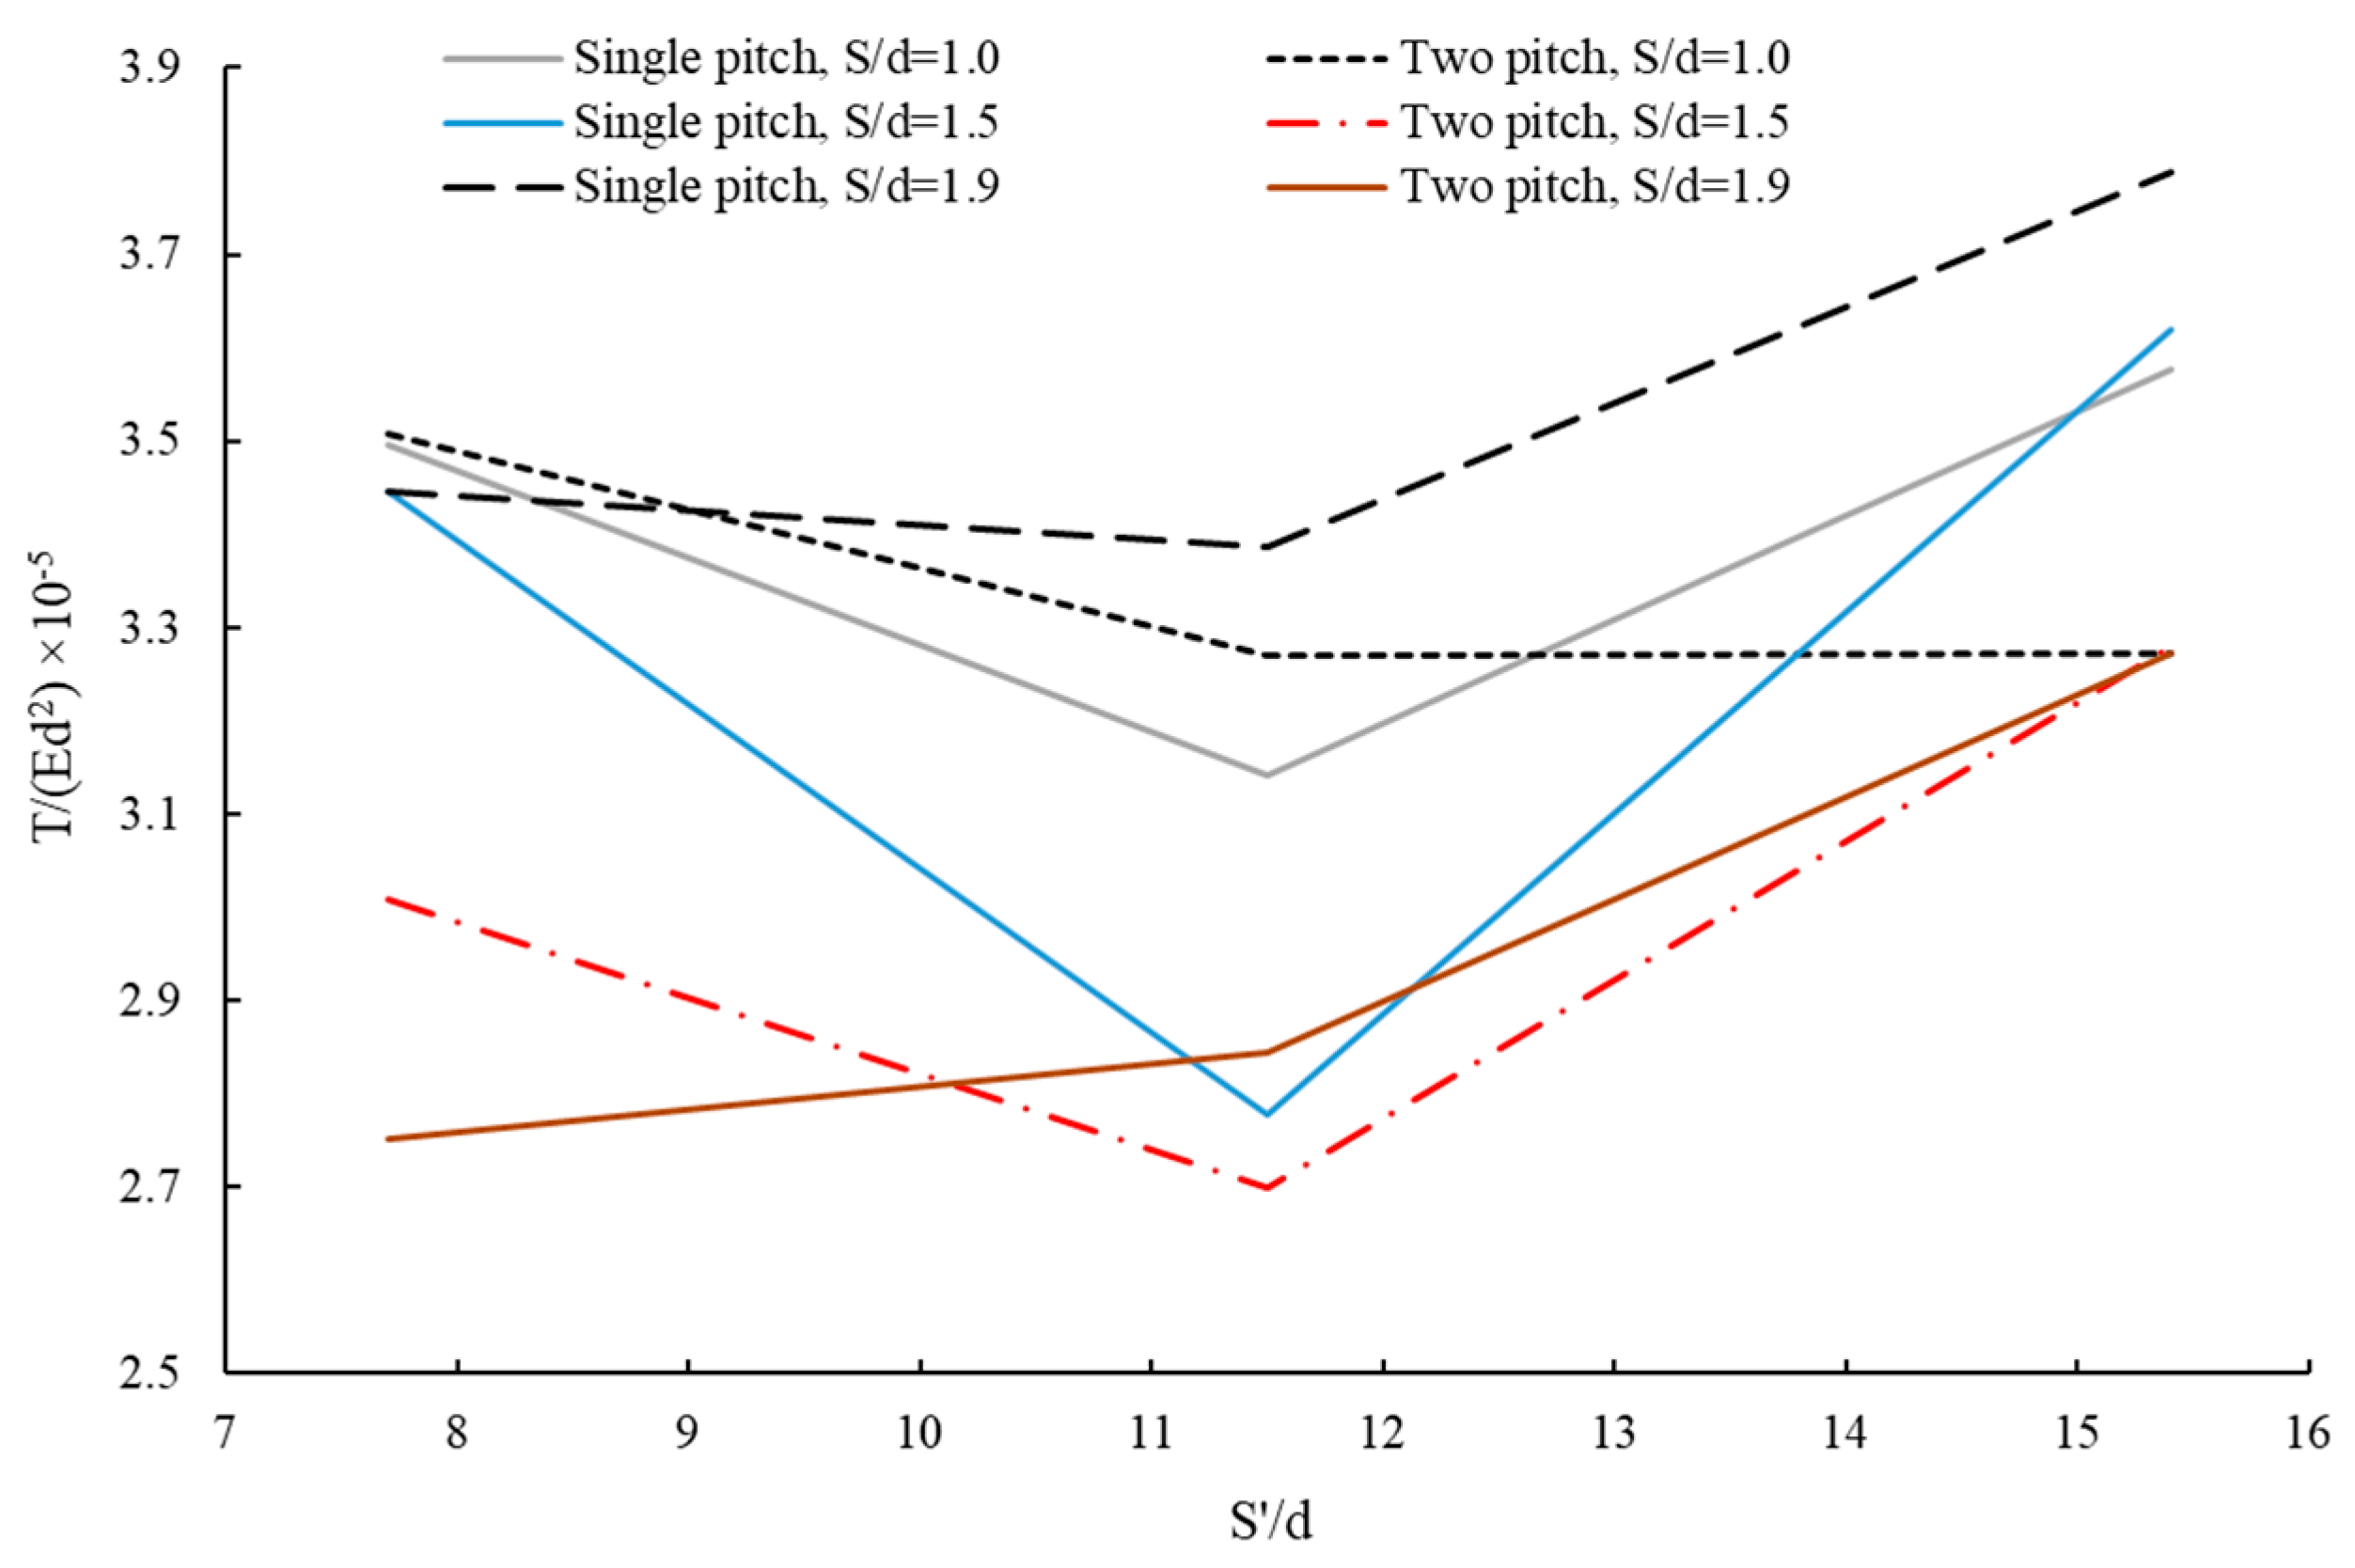
Figure 18 presents the pullout–displacement curves for various helical pile configurations, including single-blade and double-blade piles with different dimensionless pitches (pitch = 1, 1.5, and 1.9) and geogrid placements. The single-blade helical pile with a dimensionless pitch of 1.9 and geogrid placed at a dimensionless distance of 15.4 from the ground surface (0.74 embedment, pile engaging with soil) achieves the highest maximum pullout capacity (1345 N) among all the pile configurations studied. The lowest maximum pullout capacity (dimensionless pullout force = 2.709 × 10⁻⁵) is observed for the double-blade helical pile with a dimensionless pitch of 1.5 and geogrid placed at a dimensionless distance of 11.5 from the ground surface (0.35 embedment, pile engaging with soil).
Among double-blade piles, the HP with a dimensionless pitch of 1 and geogrid placed at a dimensionless distance of 7.7 from the ground surface exhibits the highest pullout capacity (1244 N) out of all double-blade piles.

4.5. Synopsis of the Results

Table 5 provides a comprehensive overview of the experimental results, highlighting the key findings regarding the behavior of single-blade and double-blade helical piles with and without geogrids. A notable observation is the significant reduction in displacement when using double-blade helical piles compared to single-blade piles. This behavior can be attributed to the increased resistance to lateral movement provided by the additional blade. The relationship between pullout capacity and the number of blades is not straightforward. While increasing the number of blades generally enhances pullout capacity in the absence of geogrids and when the pitch is equal to the central shaft diameter, this trend does not always hold true when geogrids are introduced. The incorporation of geogrids consistently leads to a reduction in displacement compared to piles without geogrids. This effect can be attributed to the reinforcement provided by the geogrid, which restricts soil movement and improves load distribution. The impact of geogrids on pullout capacity varies depending on the specific pile configuration and soil conditions. In some cases, geogrids may enhance pullout capacity, while in others; the effect may be minimal or even detrimental.

5. Limitations and Future Work

This study examined the combined application of helical piles and geogrids to enhance pullout resistance and mitigate displacement under tensile loading. The findings confirm that geogrid reinforcement can substantially improve the performance of helical piles, particularly when optimally positioned within the soil mass.
Nevertheless, several limitations must be acknowledged. First, the experiments were conducted under controlled laboratory conditions, which may not fully replicate the complexity of in situ environments where variations in soil characteristics, loading patterns, and environmental factors can influence system behavior. Second, the investigation was limited to a specific type and configuration of geogrid; therefore, the performance of alternative materials and geometries remains uncertain. Finally, the study did not address long-term behavior, such as potential geogrid degradation or changes in soil properties over time, which could impact the durability and reliability of the system.
Despite these constraints, the results offer significant insights into the potential advantages of integrating helical piles with geogrid reinforcement for foundation applications. Future research should aim to validate these findings under field conditions, explore alternative reinforcement configurations, and evaluate long-term performance to ensure practical applicability.

6. Conclusions

The experimental study investigated the behavior of helical piles embedded in geogrid-reinforced sand. The experimental variables and their values were selected based on relevant literature sources. The variables included helical plate pitch, number of helical plates, and distance of geogrid layer from soil surface. The main findings of the research are summarized as follows.
  • Replacing conventional piles with HPs significantly increases pullout capacity—by an average of 345% and up to 518% in the best configuration—highlighting the superior load transfer mechanism of helical systems for tension-resisting foundations.
  • Incorporating geogrid reinforcement improves both pullout resistance and stiffness, reducing displacement under load. The most effective configuration achieved a 62% reduction in displacement, improving overall serviceability and seismic performance.
  • Geogrid depth strongly affects reinforcement efficiency. The maximum benefit occurs when the geogrid is placed at a “non-dimensional spacing of 0.47” (approximately 15.4 times the pile diameter from the surface), where soil confinement and load transfer to the geogrid are most effective.
  • Increasing helix pitch generally improves pullout capacity by enlarging the bearing surface and enhancing soil interlock. However, this trend depends on pile configuration and geogrid placement, requiring careful optimization for specific projects.
  • For projects in dense granular soils, single-blade HPs with larger pitch ratios (≈1.9) combined with geogrid reinforcement at optimized depth provide the highest pullout capacity. Double-blade HPs are advantageous where minimizing displacement is critical, such as in seismic zones or for structures sensitive to vertical movement. Geogrid layers should be placed within the active load transfer zone (near the upper third of pile embedment) to maximize reinforcement efficiency.
  • The combined use of HPs and geogrids can deliver lighter, more economical, and more resilient foundation systems, especially in projects where uplift resistance is critical—such as transmission towers, anchored retaining structures, and offshore installations.

Author Contributions

M.E.-J.: Writing—original draft, Methodology, Investigation, Formal analysis, Data curation, Conceptualization. M.A.A.: Writing—review and editing, Validation, Supervision, Project administration, Methodology, Investigation, Formal analysis, Data curation, Conceptualization. M.B.: Writing—review and editing, Validation, Visualization, Supervision, Methodology, Investigation, Formal analysis, Conceptualization. A.A.: Writing—review and editing, Supervision, Methodology, Investigation, Formal analysis, Visualization, Conceptualization. P.N.H.: Methodology, Investigation, Formal analysis, Data curation. S.S.: Investigation, Writing—review and editing. Y.M.: Methodology, Visualization, Writing—review and editing. All authors have read and agreed to the published version of the manuscript.

Funding

This research received no external funding.

Data Availability Statement

Data will be made available on request.

Conflicts of Interest

The author has no affiliation with any organization with a direct or indirect financial interest in the subject matter discussed in the manuscript and no conflicts of interest.

References

  1. Perko, H.A. Helical Piles: A Practical Guide to Design and Installation; John Wiley & Sons: Hoboken, NJ, USA, 2009. [Google Scholar]
  2. Sakr, M. Installation and performance characteristics of high capacity helical piles in cohesionless soils. DFI J. J. Deep. Found. Inst. 2011, 5, 39–57. [Google Scholar] [CrossRef]
  3. Sakr, M. Performance of helical piles in oil sand. Can. Geotech. J. 2009, 46, 1046–1061. [Google Scholar] [CrossRef]
  4. Spagnoli, G.; Gavin, K. Helical piles as a novel foundation system for offshore piled facilities. In Proceedings of the Abu Dhabi International Petroleum Exhibition and Conference, Abu Dhabi, United Arab Emirates, 9–12 November 2015. [Google Scholar] [CrossRef]
  5. George, B.E.; Banerjee, S.; Gandhi, S.R. Helical Piles Installed in Cohesionless Soil by Displacement Method. Int. J. Geomech. 2019, 19, 04019074. [Google Scholar] [CrossRef]
  6. Wang, L.; Zhang, P.; Ding, H.; Tian, Y.; Qi, X. The uplift capacity of single-plate helical pile in shallow dense sand including the influence of installation. Mar. Struct. 2020, 71, 102697. [Google Scholar] [CrossRef]
  7. Angurana, D.I.; Yadav, J.S.; Khatri, V.N.K. Estimation of uplift capacity of helical pile resting in cohesionless soil. Transp. Infrastruct. Geotechnol. 2024, 11, 833–864. [Google Scholar] [CrossRef]
  8. Annicchini, M.M.; Schiavon, J.A.; Tsuha, C.d.H.C. Effects of installation advancement rate on helical pile helix behavior in very dense sand. Acta Geotech. 2023, 18, 2795–2811. [Google Scholar] [CrossRef]
  9. da Silva, D.M.; Tsuha, C.d.H.C. Experimental investigation on the installation and loading performance of model-scale deep helical piles in very dense sand. Can. Geotech. J. 2021, 58, 1379–1395. [Google Scholar] [CrossRef]
  10. Garakani, A.A.; Serjoie, K.A. Ultimate bearing capacity of helical piles as electric transmission tower foundations in unsaturated soils: Analytical, numerical, and experimental investigations. Int. J. Geomech. 2022, 22, 04022194. [Google Scholar] [CrossRef]
  11. Asgari, A.; Arjomand, M.A.; Bagheri, M.; Ebadi-Jamkhaneh, M.; Mostafaei, Y. Assessment of experimental data and analytical method of helical pile capacity under tension and compressive loading in dense sand. Buildings 2025, 15, 2683. [Google Scholar] [CrossRef]
  12. Cerfontaine, B.; Ciantia, M.; Brown, M.; Sharif, Y. DEM study of particle scale and penetration rate on the installation mechanisms of screw piles in sand. Comput. Geotech. 2021, 139, 104380. [Google Scholar] [CrossRef]
  13. Chen, Y.; Deng, A.; Zhao, H.; Gong, C.; Sun, H.; Cai, J. Model and numerical analyses of screw pile uplift in dry sand. Can. Geotech. J. 2024, 61, 1144–1158. [Google Scholar] [CrossRef]
  14. Asgari, A.; Bagheri, M.; Hadizadeh, M. Advanced seismic analysis of soil-foundation-structure interaction for shallow and pile foundations in saturated and dry deposits: Insights from 3D parallel finite element modeling. Structures 2024, 69, 107503. [Google Scholar] [CrossRef]
  15. Asgari, A.; Ranjbar, F.; Bagheri, M. Seismic resilience of pile groups to lateral spreading in liquefiable soils: 3D parallel finite element modeling. Structures 2025, 74, 108578. [Google Scholar] [CrossRef]
  16. Shuman, N.M.; Khan, S.; Amini, F. Settlement based load capacity curve for single helix helical pile in c-ϕ soil. Soils Found. 2023, 63, 101265. [Google Scholar] [CrossRef]
  17. Asgari, A.; Ahmadtabar Sorkhi, S.F. Wind turbine performance under multi-hazard loads: Wave, wind, and earthquake effects on liquefiable soil. Results Eng. 2025, 26, 104647. [Google Scholar] [CrossRef]
  18. Ibsen, L.B.; Asgari, A.; Bagheri, M.; Barari, A. Response of monopiles in sand subjected to one-way and transient cyclic lateral loading. In Proceedings of the Geo-Shanghai 2014 International Conference, Shanghai, China, 26–28 May 2014; pp. 312–322. [Google Scholar] [CrossRef]
  19. Fateh, A.M.A.; Eslami, A.; Fahimifar, A. Direct CPT and CPTu methods for determining bearing capacity of helical piles. Mar. Georesources Geotechnol. 2017, 35, 193–207. [Google Scholar] [CrossRef]
  20. Rao, S.N.; Prasad, Y. Uplift behavior of screw anchors in sand. I: Dry sand. J. Geotech. Eng. 1992, 118, 1474–1476. [Google Scholar] [CrossRef]
  21. Jawad, Z.H.; Shakir, R.R. Behavior of Foundation Rested on Geogrid-Reinforced Soil: A Review. IOP Conf. Ser. Mater. Sci. Eng. 2021, 1094, 012110. [Google Scholar] [CrossRef]
  22. Ahmad, H.; Mahboubi, A. Effect of the interfacial shearing stress of soil–geogrid interaction on the bearing capacity of geogrid-reinforced sand. Innov. Infrastruct. Solut. 2021, 6, 57. [Google Scholar] [CrossRef]
  23. Liu, J.; Pan, J.; Liu, Q.; Xu, Y. Experimental study on the interface characteristics of geogrid-reinforced gravelly soil based on pull-out tests. Sci. Rep. 2024, 14, 8669. [Google Scholar] [CrossRef]
  24. Wang, X.; Lu, J.; Wang, Z. Application of FRP screw anchor and geosynthetics in repairing of canal slope of expansive soils. In Proceedings of the 2010 International Conference on Mechanic Automation and Control Engineering, Wuhan, China, 26–28 June 2010; pp. 1430–1432. [Google Scholar] [CrossRef]
  25. Hasan, M.; Samadhiya, N.K. Performance of geosynthetic-reinforced granular piles in soft clays: Model tests and numerical analysis. Comput. Geotech. 2017, 87, 178–187. [Google Scholar] [CrossRef]
  26. Collin, J.G. U.S. state-of-practice for the design of the geosynthetic reinforced load transfer platform in column-supported embankments. In Soil Improvement; ASCE Library: Denver, CO, USA, 2007; pp. 1–12. [Google Scholar] [CrossRef]
  27. Le Hello, B.; Villard, P. Embankments reinforced by piles and geosynthetics—Numerical and experimental studies dealing with the transfer of load on the soil embankment. Eng. Geol. 2009, 106, 78–91. [Google Scholar] [CrossRef]
  28. Mooney, J.S.; Adamczak, S.; Clemence, S.P. Uplift capacity of helix anchors in clay and silt. In Uplift Behavior of Anchor Foundations in Soil; American Society of Civil Engineers: New York, NY, USA, 1985; pp. 48–72. [Google Scholar]
  29. Westine, P.S.; Dodge, F.T.; Baker, W. Similarity Methods in Engineering Dynamics: Theory and Practice of Scale Modeling; Elsevier: Amsterdam, The Netherlands, 2012. [Google Scholar]
  30. Sedran, G.; Stolle, D.F.; Horvath, R.G. An investigation of scaling and dimensional analysis of axially loaded piles. Can. Geotech. J. 2001, 38, 530–541. [Google Scholar] [CrossRef]
  31. Buckingham, E. On physically similar systems; illustrations of the use of dimensional equations. Phys. Rev. 1914, 4, 345. [Google Scholar] [CrossRef]
  32. Chen, J.-J.; Zhang, L.; Zhang, J.-F.; Zhu, Y.-F.; Wang, J.-H. Field Tests, Modification, and Application of Deep Soil Mixing Method in Soft Clay. J. Geotech. Geoenvironmental Eng. 2013, 139, 24–34. [Google Scholar] [CrossRef]
  33. Sakr, M.; Bartlett, F. High capacity helical piles—A new dimension for bridge foundations. In Proceedings of the 8th International Conference on Short and Medium Span Bridges, Niagara Falls, ON, Canada, 3–6 August 2010. [Google Scholar]
  34. Sprince, A.; Pakrastinsh, L. Helical pile behaviour and load transfer mechanism in different soils. In Proceedings of the Modern Building Materials, Structures and Techniques, Vilnius, Lithuania, 19–21 May 2010; p. 1174. [Google Scholar]
  35. ASTM-D422; Standard Test Method for Particle-Size Analysis of Soils. ASTM International: West Conshohocken, PA, USA, 2007.
  36. ASTM-D854; Standard Test Methods for Specific Gravity of Soil Solids by Water Pycnometer. ASTM International: West Conshohocken, PA, USA, 2023.
  37. ASTM-D3080; Standard Test Method for Direct Shear Test of Soils Under Consolidated Drained Conditions. ASTM International: West Conshohocken, PA, USA, 2012.
  38. ASTM-D4254; Standard Test Methods for Minimum Index Density and Unit Weight of Soils and Calculation of Relative Density. ASTM International: West Conshohocken, PA, USA, 2016.
  39. ASTM-D4253; Standard Test Methods for Maximum Index Density and Unit Weight of Soils Using a Vibratory Table. ASTM International: West Conshohocken, PA, USA, 2016.
  40. ASTM-D2216-19; Standard Test Methods for Laboratory Determination of Water (Moisture) Content of Soil and Rock by Mass. ASTM International: West Conshohocken, PA, USA, 2019.
  41. ASTM-D2167-15; Standard Test Method for Density and Unit Weight of Soil in Place by the Rubber Balloon Method. ASTM International: West Conshohocken, PA, USA, 2015.
  42. ASTM-D3689/D3689M; Standard Test Methods for Deep Foundation Elements Under Static Axial Tensile Load. ASTM International: West Conshohocken, PA, USA, 2022.
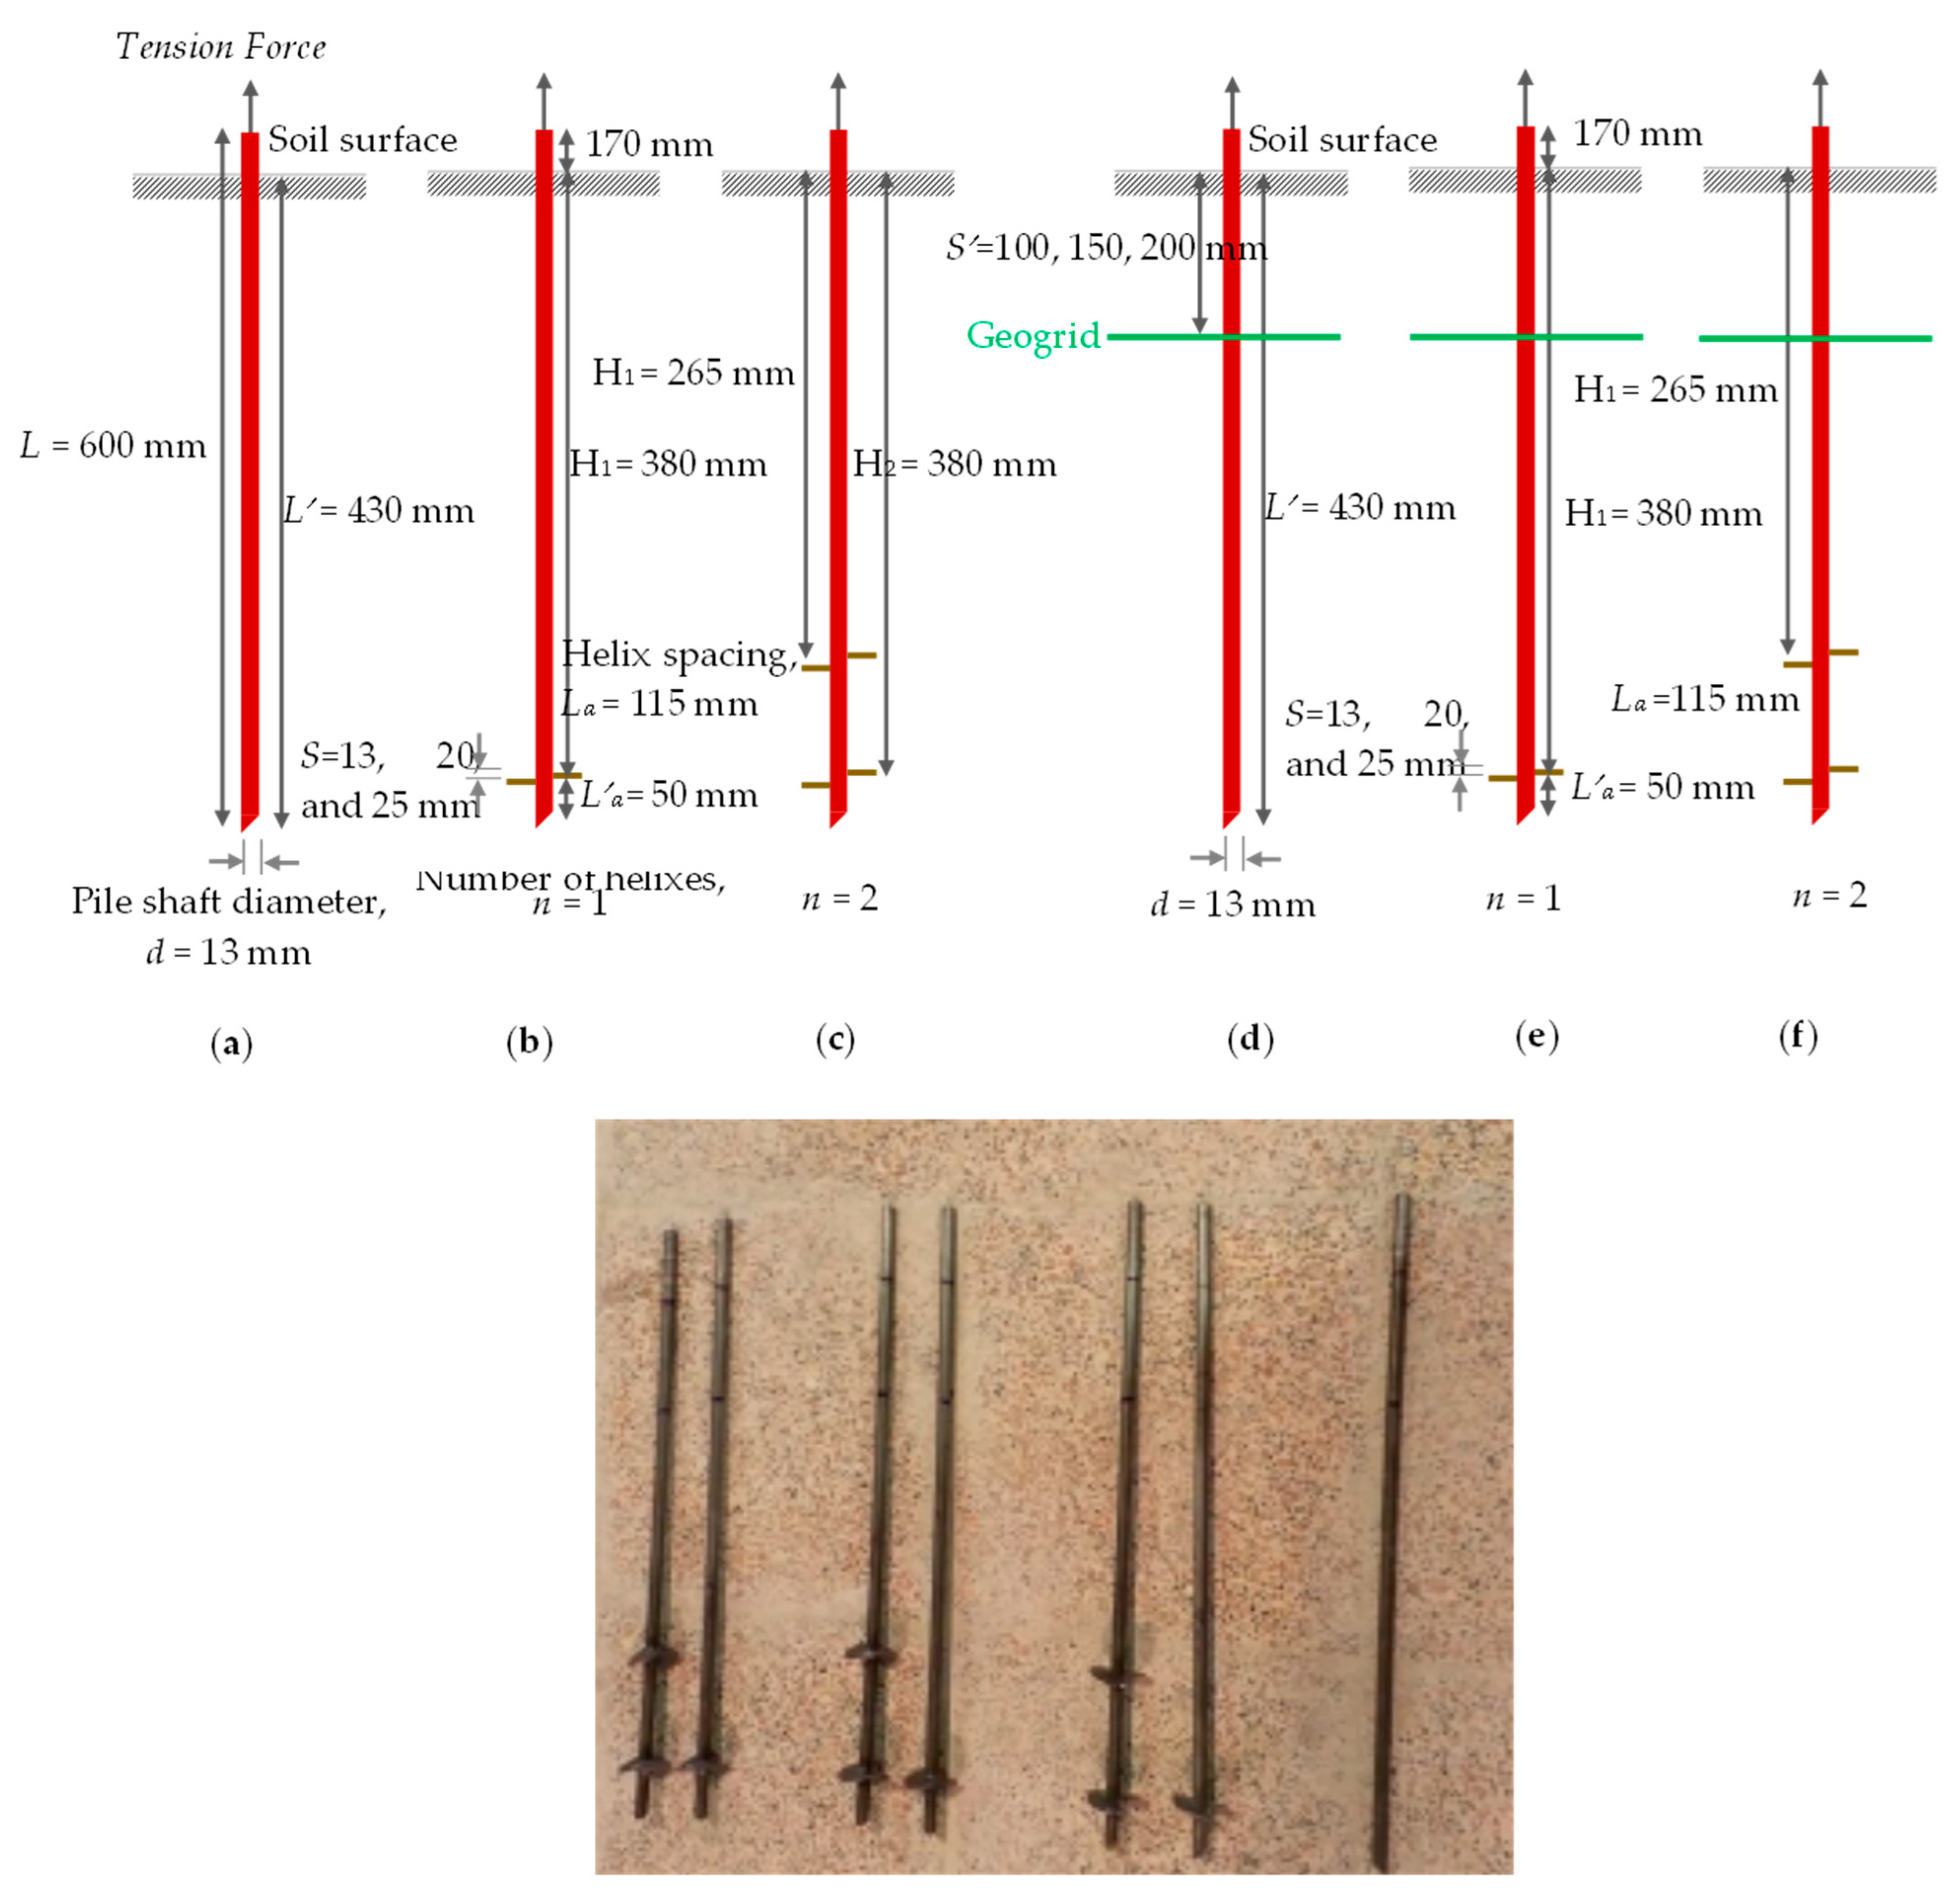
Figure 1. Schematic and real representation of helical pile configurations, with and without geogrid-reinforced soil, under axial tension. (a) Plain pile, (b) single helix HP, (c) double helixes HP, (d) plain pile with geogrid, (e) single helix HP with geogrid. (f) double helixes HP with geogrid. Note: Helix diameter: Dh = 51 mm. Spacing between the pile tip and bottom helix: La = 50 mm. Helix thickness: th = 2.5 mm. Pile shaft diameter: d = 13 mm. Elastic modulus of the pile: Ep = 2.1 × 10⁸ kPa. Spacing between helix ith and soil surface: Hi (e.g., i = 1 for the shallowest helix).
Buildings 15 02963 g001
Figure 2. Particle-size distribution curve of the sieve analysis.
Buildings 15 02963 g002
Figure 3. Geogrid model CE161B used in the experimental study.
Buildings 15 02963 g003
Figure 4. Experimental setup, instrumentation, and the soil container.
Buildings 15 02963 g004
Figure 5. Pullout load–displacement curve of conventional pile.
Buildings 15 02963 g005
Figure 6. Pullout load–displacement of CP equipped with geogrid L = 430   m m ,   d = 13   m m .
Buildings 15 02963 g006
Figure 7. Pullout load–displacement curves of single HPs with geogrid   S = 13   m m .
Buildings 15 02963 g007
Figure 8. Pullout–displacement curves of double HPs with geogrid   S = 13   m m .
Buildings 15 02963 g008
Figure 9. Pullout–displacement curve of single HPs with geogrid S = 20   m m .
Buildings 15 02963 g009
Figure 10. Pullout–displacement curve of double HPs with geogrid S = 20   m m .
Buildings 15 02963 g010
Figure 11. Pullout–displacement curve of single HPs with geogrid S = 25   m m .
Buildings 15 02963 g011
Figure 12. Pullout–displacement curve of double HPs with geogrid S =   25   m m .
Buildings 15 02963 g012
Figure 13. Pullout–displacement of HPs with geogrid S = 13 , 20 , 25   m m ,   S = 100   m m .
Buildings 15 02963 g013
Figure 14. Pullout–displacement of HPs with geogrid S = 13 ,   20 ,   25   m m ,   n = 1 ,   2 ,     S = 150   m m .
Buildings 15 02963 g014
Figure 15. Pullout–displacement of HP with geogrid S = 13 ,   20 ,   25   m m ,   n = 1 ,   2 ,     S = 200   m m .
Buildings 15 02963 g015
Figure 16. Comparison of maximum pullout capacity–blade pitch of HPs S = 13 ,   20 ,   25   m m ,   n = 1 ,   2 ,     S = 100 ,   150 ,   200   m m .
Buildings 15 02963 g016
Figure 17. Comparison of T m a x T   maximum pullout capacity–blade pitch of HPs S = 13 ,   20 ,   25   m m ,   n = 1 ,   2 ,     S = 100 ,   150 ,   200   m m .
Buildings 15 02963 g017
Figure 18. Comparison of maximum pullout capacity–distance of geogrid from the surface S = 13 ,   20 ,   25   m m ,   n = 1 ,   2 ,     S = 100 ,   150 ,   200   m m .
Buildings 15 02963 g018
Table 1. Variables in 28 laboratory tests.
Model No.Number of Blades (n)Blade Pitch (S) (mm)Geogrid Distance from the Soil Surface ( S ) (mm)
1125100
2120100
3113100
4125150
5120150
6113150
7125200
8120200
9113200
10225100
11220100
12213100
13225150
14220150
15213150
16225200
17220200
18213200
19125-
20120-
21113-
22225-
23220-
24213-
25--100
26--150
27--200
28---
Table 2. Dimensionless data of HPs for   S = 100 m m .
Pile TypeDimensionless Pitch (S/d)Dimensionless Maximum Pullout Capacity (×10−5)Dimensionless Displacement at Maximum Pullout
Conventional pile-0.7021.004
Single-blade helical pile13.4960.965
Double-blade helical pile13.5080.911
Single-blade helical pile1.53.4481.137
Double-blade helical pile1.53.0051.186
Single-blade helical pile1.93.4651.446
Double-blade helical pile1.92.751.2
Table 3. Dimensionless data of HPs for   S = 150 m m .
Pile TypeDimensionless Pitch of Blade (S/d)Dimensionless Pullout (×10−5)Dimensionless Displacement (ds/d)
Conventional pile-1.0695.051
Single-blade helical pile13.1480.818
Double-blade helical pile13.2760.507
Single-blade helical pile1.52.7790.950
Double-blade helical pile1.52.7090.584
Single-blade helical pile1.93.3910.967
Double-blade helical pile1.92.8450.909
Table 4. Dimensionless data of HPs for   S = 200 m m .
Pile TypeDimensionless Pitch of Blade (S/d)Dimensionless Pullout (×10−5)Dimensionless Displacement (ds/d)
Conventional pile-0.8633.858
Single-blade helical pile13.5771.138
Double-blade helical pile13.2830.751
Single-blade helical pile1.53.6260.837
Double-blade helical pile1.53.2800.785
Single-blade helical pile1.93.7901.134
Double-blade helical pile1.93.2880.676
Table 5. Maximum pullout capacity and corresponding displacement.
Dimensionless Geogrid Spacing (S′/d)Dimensionless Pitch of Blade (S/d)Dimensionless Displacement (ds/d)Dimensionless Pullout (×10−5)
n
210210
011.122.1580.1883.5733.1690.573
7.710.9110.9651.0043.5083.4960.702
11.510.5070.8185.0513.2763.1481.069
15.410.7511.1383.8583.2833.5770.8632
01.51.1602.083 3.2923.542
7.71.51.1861.137 3.0053.448
11.51.50.5840.950 2.7092.779
15.41.50.7850.873 3.283.626
01.91.1002.294 2.7953.070
7.71.91.2001.446 2.7503.465
11.51.90.9090.967 2.8453.391
15.41.90.6761.134 3.2883.790
Disclaimer/Publisher’s Note: The statements, opinions and data contained in all publications are solely those of the individual author(s) and contributor(s) and not of MDPI and/or the editor(s). MDPI and/or the editor(s) disclaim responsibility for any injury to people or property resulting from any ideas, methods, instructions or products referred to in the content.