1. Introduction
PC of built heritage has proved to be one of the most efficient and sustainable approaches to ensure its long-term preservation [
1,
2]. PC is a holistic discipline that aims to identify, assess, and control threats that may affect the conservation of heritage assets, with the purpose of reducing their potential impact by acting in their origin [
3,
4]. Thus, the implementation of PC strategies reduces the deterioration of assets, as well as the need for drastic or emergency interventions.
The introduction of PC strategies is not a recent phenomenon; the
Burra Charter—
ICOMOS (1979, last updated in 2013) [
5], the document
Conservation of Historic Buildings (1982, last updated 2003) [
6], and the document
The Conservation Plan: A guide to the preparation of conservation plans for places of European cultural significance (1982, last updated 2002) [
7] provided the first guidelines for their implementation. In addition to these, the document
Principles for the Analysis, Conservation and Structural Restoration of Architectural Heritage (2003) [
8], and the document
An Integrated Architecture for successful Heritage Site Management Planning (2007) are also relevant materials [
9]. From this perspective, some international projects and initiatives are noteworthy, such as Planned Conservation experiences in Lombardy, Italy [
10], the Society for the Protection of Ancient Buildings in the UK [
11], the Monitoring System for the World Heritage Site of Cuenca [
12],
Monumentenwacht in Belgium and the Netherlands [
13], preventive planned conservation strategies for Romanesque Routes in Portugal [
14], and the European Heritage Care Project [
15], among others.
Based on these documents and previous experiences, successful implementation of PC is composed of a set of areas: active follow-up, damage detection and assessment, maintenance, risk analysis, and dissemination and valorisation. Active follow-up involves conducting regular inspections of the building for evaluating relevant parameters like environmental conditions, material properties or geometry changes, among others. Technologies such as IoT sensors, thermography, GPR, and laser scanning have demonstrated great support for continued monitoring and analysis. Damage detection and assessment focus on identifying deterioration and adverse conditions affecting the asset’s conservation status. Visual inspections, supported by computational tools, are particularly effective in distinguishing between structural and non-structural damage. Maintenance requires systematic planning of work methodologies and technical resources for the appropriate preservation of the asset, considering its characteristics and conservation status. Risk analysis is essential for identifying potential deterioration factors and hierarchisation of the established monitoring strategies. It is crucial to consider various types of risks, including environmental factors, usage-related factors, and technical or construction-related vulnerabilities, among others. Finally, dissemination and valorisation aim to foster social awareness of the asset to enhance recognition of its heritage significance and cultural impact. This requires a thorough understanding of the asset, considering its geometric and historical dimensions, involving activities such as conducting 2D-3D surveys, and compiling and organising documentary, bibliographical, and iconographic sources. Today, multiple digital resources (websites, social media, etc.) facilitate broader access to this kind of information, complementing conventional dissemination methods. Additionally, a comprehensive knowledge of current state of conservation of the asset is essential for planning a building’s level of use; this may be derived from the above methods.
Management of all the disciplines involved in a PC project is complex, often resulting in poor interaction between them. Thus, implementing a common data environment (CDE) based on the use of digital models to centralise information ensuring interaction and communication between disciplines, is of particular interest, as discussed in the next section.
1.1. State-of-the-Art Digital Models for Preventive Conservation
The use of digital models in PC has been addressed mainly through methodologies based on building information modelling (BIM), namely historical BIM (HBIM) [
16,
17]. Their use is predominant when dealing with architectural scale, while methodologies based on geographic information systems (GIS) have been reserved for the study of larger-scale contextual factors [
18]. It should be noted that there is a growing trend to explore the possibilities derived from workflows that integrate HBIM and GIS [
19,
20,
21,
22], usually constrained by working scale restrictions.
Among projects leveraging HBIM–GIS interoperability, a common objective is the analysis of risks in heritage sites [
23], occasionally extending to existing damage from prior events [
19]. Other HBIM–GIS initiatives concentrate on characterization for conservation and maintenance actions [
24]. Notably, the “Virtual Historic Dublin” project acknowledges these tools’ potential for knowledge dissemination in education and cultural tourism [
25]. A similar approach was taken by the project led by Barrile, V. [
26], exploring HBIM–GIS interoperability for heritage management and, significantly, its public dissemination through virtual reality models. A significant study on the Seville Cathedral has employed HBIM for heritage information management, aiming at PC of heritage assets, particularly highlighting its utility for damage recognition and assessment [
27]. To enable active follow-up, developing an easily implementable HBIM strategy for reporting and monitoring damage evolution over time is crucial [
28]. Among the reviewed literature, the study conducted on the University of Salamanca library stands out as arguably the most complete [
29]. It proposes an HBIM methodology encompassing active follow-up, damage detection and assessment, risk analysis, and maintenance. This holistic approach aligns closely with the objective of the present work of achieving integrated PC, differing from conventional strategies that address mainly isolated PC areas.
In recent years, some research has addressed the use of GIS on a detailed architectural scale as an alternative to HBIM modelling for heritage information management [
30,
31,
32]. When dealing with the geometrical dimension of architectural heritage, BIM tools present better capabilities in terms of 3D modelling than GIS, but these advantages are counterbalanced when we refer to the semantic dimension of the data. The data structure used in BIM software is based on standardised formats specifically designed to optimise the data management of buildings, defining classes, entities, and parameters according to the data format used, both proprietary (RVT, PLN, etc.) and open (IFC, COBie, etc.). However, when it comes to historic buildings, there are often problems in adapting their requirements to this native data structure. Non-generic construction elements present in historic buildings are not defined in the native libraries or in the most common data formats [
33], and the data structure does not consider relevant parameters in the PC of historic buildings [
34]. Although it is possible to modify and extend these data structures [
35], the procedure is complex compared with the data management options provided by GIS, increasing costs in terms of human and economic resources. In a GIS environment, workflows involving the creation of a new data structure, or linking to external databases in an efficient way, are common, adapting them to the requirements of the project and discarding data that are not useful for the conservation project. A GIS approach can be interoperable with different data formats and address all scales of analysis required by PC, from the territorial to the architectural [
32]. Likewise, GIS allows the analysis and web-publication of technical parameters, monitoring, and damage diagnosis, among other activities [
36,
37]. Thus, GIS provides a flexible and versatile data development environment for the creation of a management platform for architectural heritage.
Returning to the geometric dimension of the data, it is necessary to reflect on the level of detail (LOD) and the degree of accuracy required for a PC digital model. The dominant trend is the use of scan-to-HBIM workflows which, starting from point clouds obtained by photogrammetry, laser scanning, etc., result in 3D models with a high level of detail [
38,
39]. The geometric accuracy obtained through a point cloud is currently unparalleled, having great strengths in specific tasks such as construction and structural pathology analysis, material analysis, or precision modelling, among others. However, these workflows imply the availability of significant human, material, and economic resources that are not available to all heritage stakeholders. Furthermore, while recognising the advantages of using detailed 3D models, there are many PC tasks that do not require such a degree of accuracy, and simplified spatial data models may be sufficient. Thus, research proposing automatic [
40] and semi-automatic [
41] procedures for 2D and 3D modelling is considered relevant. This research assumes this approach and applies it to make digitisation processes in the field of heritage more accessible.
1.2. Existing Gaps and Objective of the Research
Current literature and practice reveal three critical limitations that hinder the effective application of digital models for PC. Firstly, most existing research proposals have failed to address different PC areas in a holistic manner. This fragmented approach has led to a significant loss of information and poor communication between PC areas. Secondly, current digital modelling methods—typically H-BIM workflows—require substantial time, expertise, and financial resources, making them largely inaccessible to low-profile institutions and stakeholders. Moreover, digital models are sometimes developed with a degree of geometric detail that is unnecessary for most management tasks, leading to inefficient use of resources. Finally, the data structures defined in current BIM standards (both geometric and semantic) are not fully suited to the specific needs of heritage domain. They often rely on generic parameters and do not adequately represent complex historic architectural elements. Furthermore, these standards typically depend on proprietary software environments, limiting interoperability, transparency, and long-term usability.
In response to these limitations, the main objective of this research is to propose and validate a method to develop a CDE for integrated management through GIS-based digital models. Specifically, this CDE is aimed at optimising PC of heritage systems in complex contexts (different owners and stakeholders, various uses and typologies, etc.).
In that sense, the research aims to offer an integrated and centralised approach that consolidates all relevant aspects of PC within a unified CDE framework. This is achieved through the design of a robust relational database structure that enables effective coordination, data integration, and decision-making across complex heritage scenarios.
To overcome the constraints of traditional modelling methods, this research aims to test the validity of semi-automated methods for the generation of simplified 2D and 3D-GIS entities using different remote sensing data sources and procedural modelling, to reduce costs and increase scalability.
Another objective of the research is to enhance the collaborative work capabilities of the CDE. To this end, the spatial database has been conceived to be compatible with the most used GIS platforms—both proprietary and open-source—to ensure flexibility, openness, and long-term usability. As part of this last objective, the current research also explores the potential of cloud-based GIS platforms to support access and exchange of information among diverse user profiles (technicians, stakeholders, researchers, tourists, etc.).
Taking the aforementioned aspects into account, this research paper is structured as follows. The case study is briefly introduced in
Section 2; the methodological approach corresponding to the proposed procedure is explained in
Section 3; the achieved results and subsequent discussion are included in
Section 4 and
Section 5; and finally,
Section 6 lays out the main conclusions drawn from the research.
2. Case Study
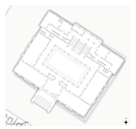
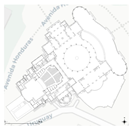
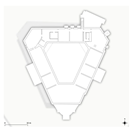
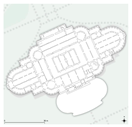
This research was conducted based on a case study of Spanish architectural modern heritage: the pavilions of the 1929 Ibero-American Exhibition in Seville.
The 1929 Ibero-American Exhibition in Seville (Spain), hereinafter referred to as EIAS-29, was held with the aim of promoting cultural, economic, and technological exchange between countries in the Ibero-American context, enhancing their common values and reinforcing the links between Spain and the Americas [
42,
43]. From its initial conception in 1909, various factors, including governmental apathy, financial and administrative problems, and even the influence of international events such as the Great War, delayed it until 1929 [
44,
45,
46]. During this period, the number of participating countries also changed. Finally, around twenty nations participated in the event, including the representation of colonial territories of the time, different regions and provinces of Spain, public entities, and mainly national companies [
47].
EIAS-29 had a fundamental impact on the necessary transformation of the city of Seville at the beginning of the 20th century, resulting in the creation of new infrastructures and the improvement of public services. New urban developments were carried out, and modifications were made to the existing urban fabric and the provision of public leisure spaces for the city [
48,
49]. The supply of hotel accommodation in the city also increased considerably [
50]. Until the 1992 Universal Exposition in Seville, no other event in the city had resulted in such a significant urban transformation [
51].
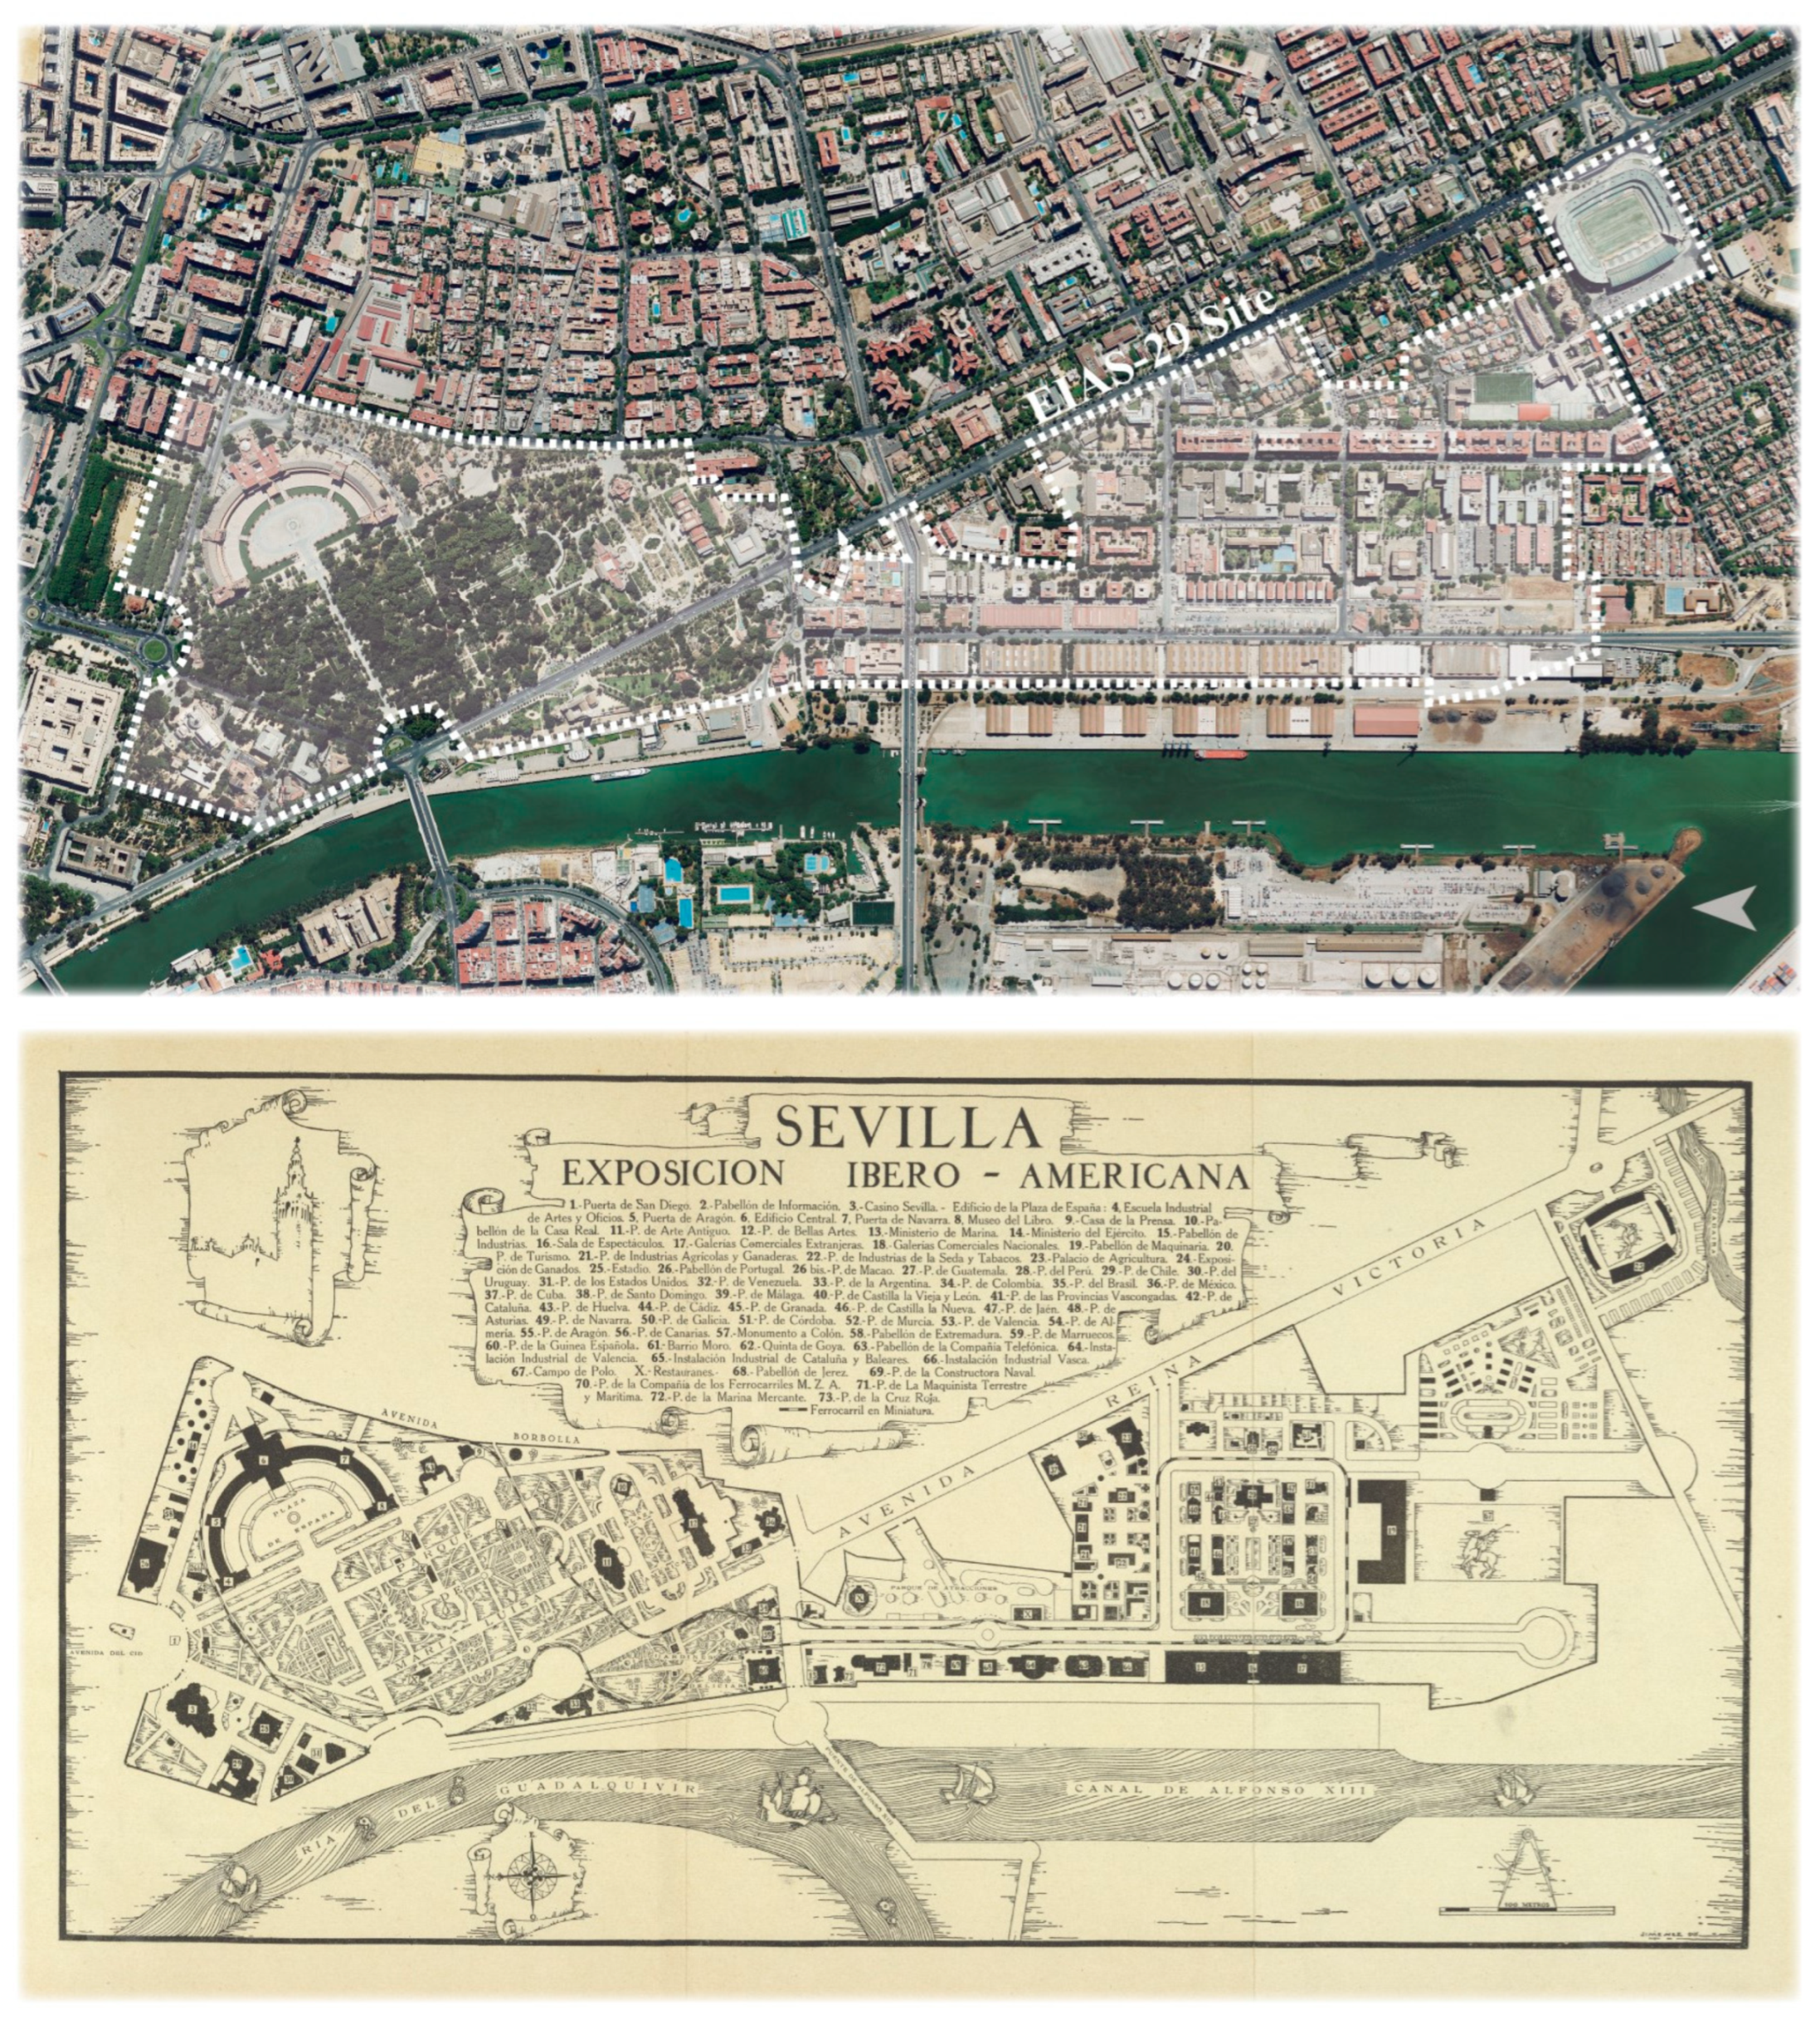
The EIAS-29 site occupied an area of approximately 1.32 km
2, where 117 buildings were constructed [
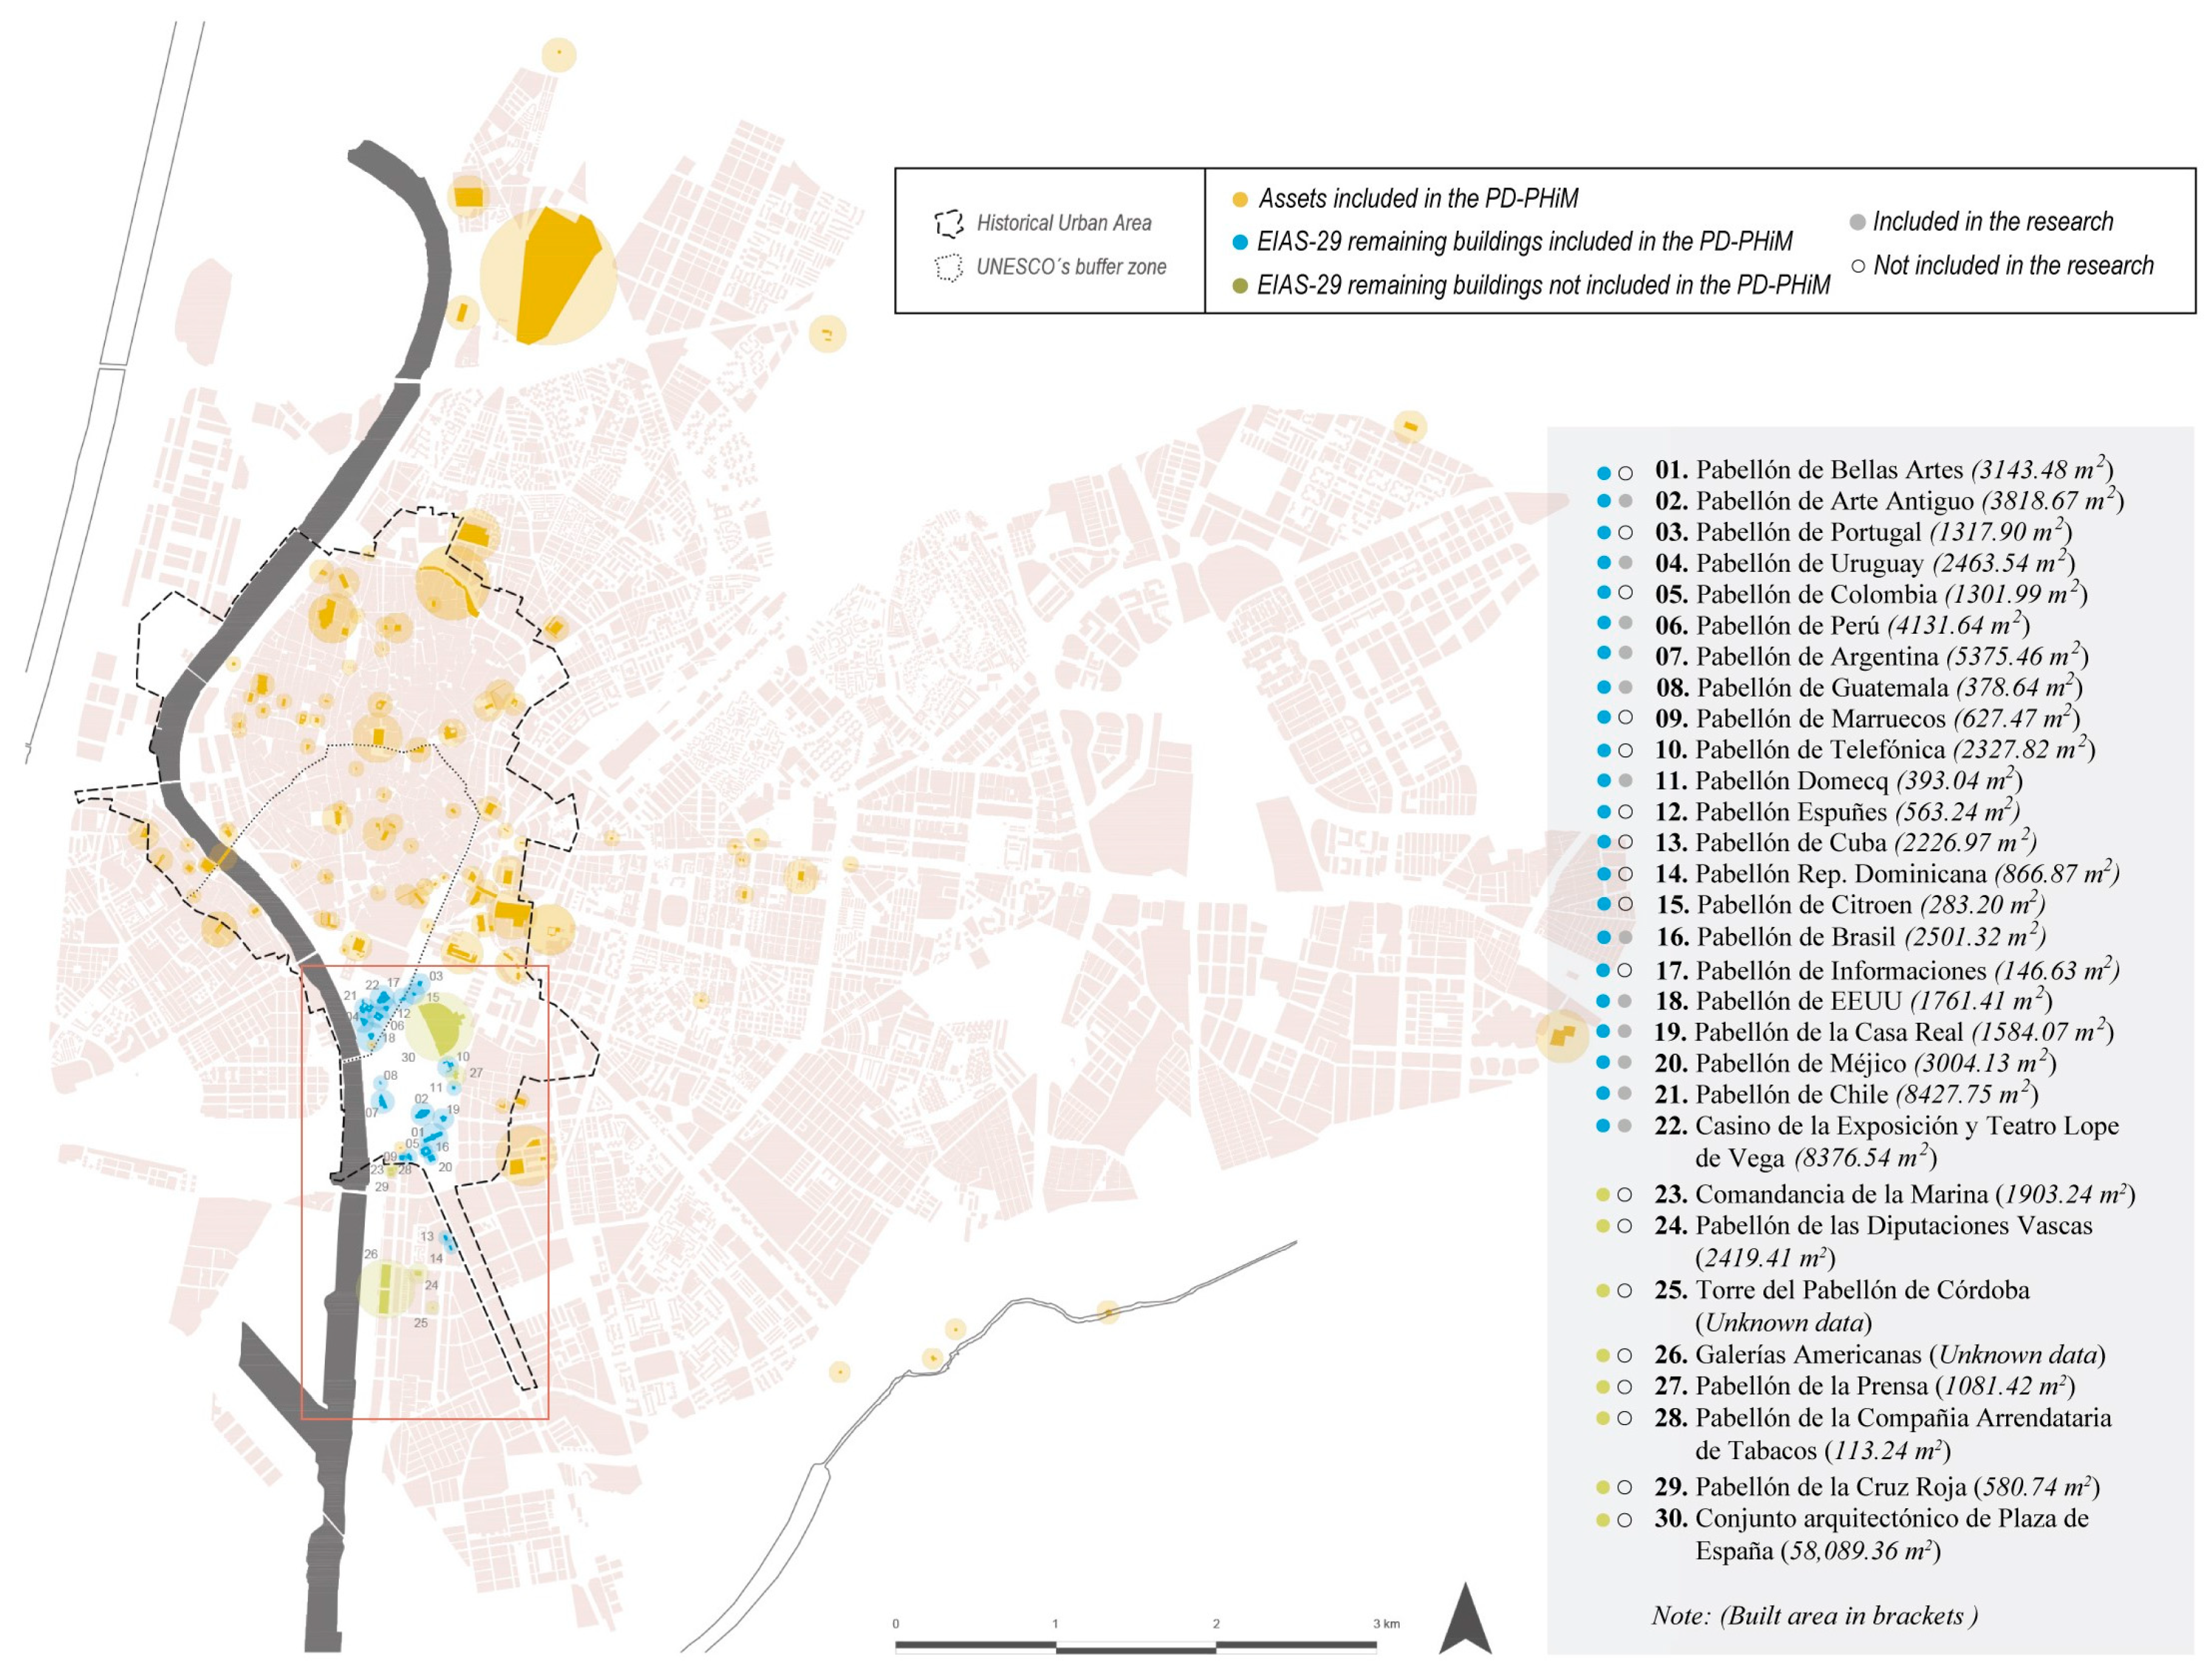
52], of which only 30 remain today (excluding residential buildings both public and private, as well as sports, auxiliary, and logistical buildings), mainly due to the ephemeral nature of many (
Figure 1).
Most of the Ibero-American pavilions were built in the northern sector of the exhibition, linked to the Parque de María Luisa and its surroundings, where two of the most representative spaces of EIAS-29 have been preserved: the Plaza de España and the Plaza de América. In the southern section, most of the regional pavilions were located, as well as those of public and private entities. An amusement park and a miniature railway that covered the entire complex were also built but were demolished shortly after EIAS-29 was closed in June 1930 (
Figure 2).
The buildings that remain are mostly owned by the municipal government, although in some cases, they have been temporarily transferred to other entities for different uses [
53]. Their location in the city allows them to be understood as a complex heritage system, with a prominent presence in the historic urban landscape of Seville [
54]. They are also within the legal delimitation of the historic urban area as well as the UNESCO buffer zone declared in the city of Seville (
Figure 1).
The buildings of EIAS-29 present particular architectural characteristics, with a clear preference for the reinterpretation of historical architectural styles. There is a predominant use of eclectic regionalist and historicist styles, associated with a neo-colonial narrative that seeks to reinforce the notion of a shared Hispano-American identity, albeit interpreted through each participating country’s own nationalist and Americanist lens in their respective pavilions [
46].
Their heritage value is high, with some of them designated as Assets of Cultural Interest (BIC, the highest level of protection granted in Spain) or included in regional protection catalogues. Given their municipal ownership and significant heritage value, many of them are included in the current Management Plan for Heritage Municipal Buildings of Seville (PD-PHiM), which establishes the framework for the conservation of municipal heritage until 2030 [
55]. The PD-PHiM is an innovative and relevant document for this research, as it strongly advocates for the implementation of cross-cutting strategies based on the use of digital models (GIS and BIM) to optimise PC processes.
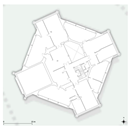
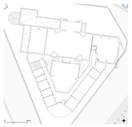
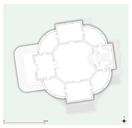
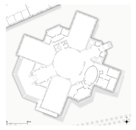
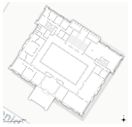
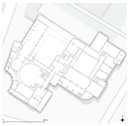
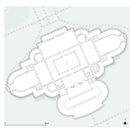
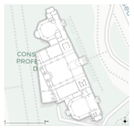
Of the 30 buildings that remain, only 12 are considered in this study (
Table 1), having selected those for which working materials (such as planimetry, historical documents, technical data, etc.) were available, with access permission granted, inclusion in the PD-PHiM, and preferably with uses open to the public.
This complex heritage system is considered at multiple scales in this research, to develop a GIS-based framework able to address PC strategies that go from the scale of the entire heritage system to building elements or movable assets.
3. Methodology
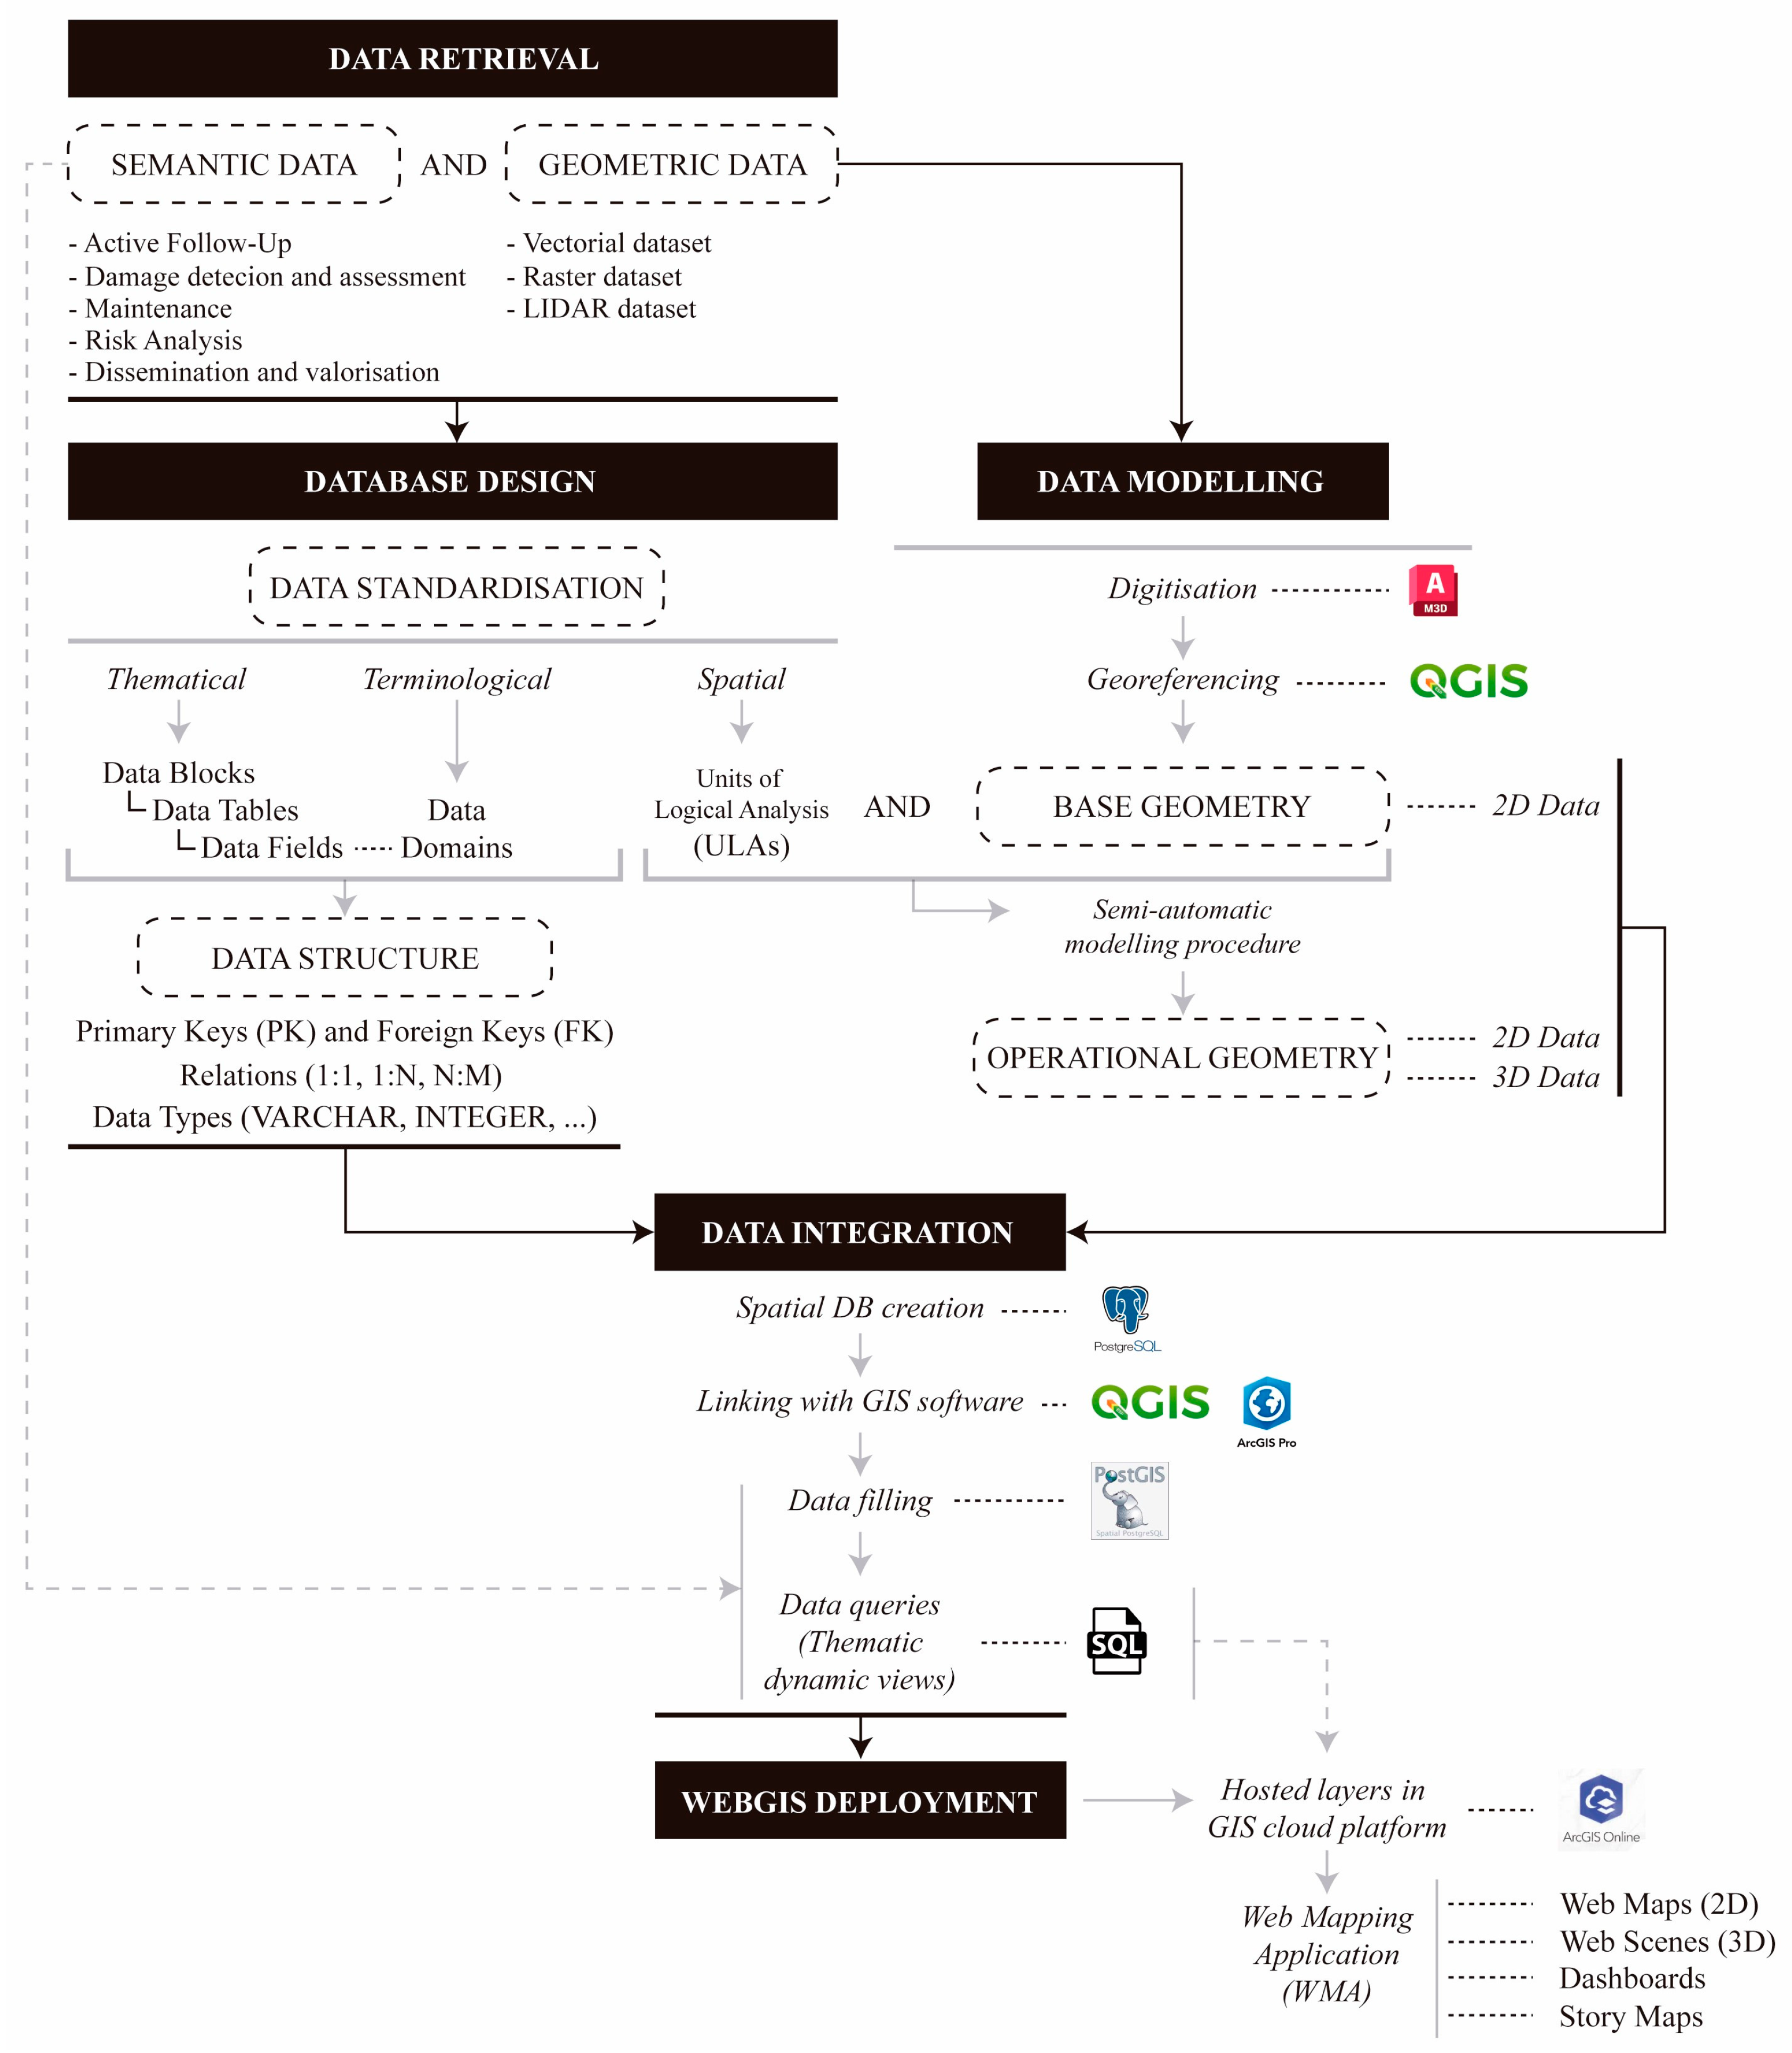
This section presents the proposed procedure for the integration of heterogeneous PC data for the management of heritage systems in a GIS-based CDE. It is an experimental procedure that has been tested in a specific case study, consisting of several phases (
Figure 3). The first part of this section includes details about the collection of data used (Data Retrieval). Secondly, the established standardisation criteria are described, as well as the relational structure of the database (Database Design). Next, strategies are proposed to create a 2D and 3D geo-referenced model of the case study that serves as a geometrical basis for the retrieved semantic information (Data Modelling). Then, the integration of the collected data into the CDE is described (Data Integration). The spatial data have been published as open data in a GIS cloud environment, accessible to a wide range of users (WebGIS deployment). To illustrate some phases of the methodology, the Pabellón de EEUU is used as a representative example.
3.1. Data Retrieval
The data used in this research can be divided into two categories: semantic (
Table 2) and geometric (
Table 3).
The semantic data correspond mainly to information related to the PC areas addressed by the proposed spatial database, including active follow-up (a), damage detection and assessment (b), maintenance (c), risk analysis (d), and dissemination and valorisation (e). These data were obtained from fieldwork and simulations conducted with different tools in the EIAS-29 pavilions. During data collection, the standardisation strategies detailed in
Section 3.2 have been implemented to ensure data integrity and quality for data management and analysis. In addition to the information related to these disciplines, the database includes complementary content which is detailed in
Section 3.2.
The geometric data are those used mainly in the 2D and 3D-GIS modelling procedures detailed in
Section 3.3. These models provide the spatial component to the semantic data. Included in this category are EIAS-29 planimetries and technical drawings of the buildings in different file formats, point clouds, and digital elevation models (DEMs). These data come from different sources (public and private repositories, institutional sources, building administrators, among others). The digitisation work conducted on the planimetry of the buildings of EIAS-29 is remarkable, having vectorized, georeferenced, and where possible, dated a significant number of historical documents that were only scanned or hand-drawn. Comprising a wide range of buildings with different uses and administrators, the availability of these documents involved communication with numerous agents, underlining the need to centralise these data on a single platform to facilitate their access and study.
3.2. Database Design
The database has been built around a relational model, using the PostgreSQL relational database management system (RDBMS). This was chosen over other alternatives such as MySQL, Oracle, MariaDB, or SQL Server for its capability to use spatial data through the PostGIS extension which, among other advantages, allows working with 2D and 3D geometries. PostgreSQL and PostGIS meet OGC (Open Geospatial Consortium) standards and can be integrated with open-source GIS software such as QGIS and proprietary software such as ESRI ArcGIS Pro. The initial approach of this research considers the interoperability of the database with both software platforms. In the case of ArcGIS Pro, a number of restrictions have to be considered regarding versions of the RDBMS used, as well as the types of geometry to be used [
63]. In addition, it requires additional licences and the deployment of a specific virtual work environment [
64]. All this makes the integration process more complex, but it is worthwhile in order to use its 3D capabilities and the GIS Cloud platform “ArcGIS Online”. QGIS software presents some limitations when working with complex 3D geometries, however, its interoperability at the semantic and geometric level with PostgreSQL is very accurate.
Table 4 summarize the key aspects of the spatial database oriented to interoperability with these GIS platforms.
It should be noted that the use of standardised ontologies for the cultural heritage domain has not been adopted for the design of the semantic structure of the DB. Despite being very useful tools for heritage documentation and data exchange, ontologies such as CIDOC-CRM are too generalised in their approach in relation to the level of detail needed to address the complete management of the different PC areas. This results in the necessity to create specific extensions for each PC area [
65,
66], whose integration into a single data model is complex and difficult to implement. Furthermore, unlike PostgreSQL, an ontology-based approach is generally not well-suited for the operational management of dynamic data (e.g., real-time data from active follow-up) or for the automated execution of large-scale queries.
3.2.1. Data Standardisation
The design of the database is based on a set of standardisation criteria that address the terminological, thematic, and spatial dimensions of the information. This section develops the conceptualisation of this standardisation process and its specific development for the case study.
Thematical Standardisation
First, the contents of the database are defined and categorised thematically. The purpose of the design of these categories is to provide a comprehensive approach to the PC that makes it possible to centralise in a CDE most of the relevant parameters when dealing with the conservation of a heritage asset. This thematic organisation follows the conceptual principles proposed for the development of the Municipal Historical Heritage Information System of Seville (SIPHiM) [
53], developing a compatible thematic structure. Accordingly, the proposed CDE is structured into four main blocks (A, B, C, and D), each comprising several related sections (A.X, B.X, C.X, and D.X). These sections consist of one or more data tables and are made up of various fields (see
Figure 4).
The core of information related to the different areas of the PC discussed in
Section 1.1 is the main block of the DB (C), requiring additional data of different nature to complement it (A, B and D). Block A is dedicated to the detailed identification of entities in the database. These entities comprise the different agents involved in the PC process (technicians, craftsmen, employees, companies, etc.), the specific conditions of the building and its context, as well as the identification of the technical reports derived from the areas of block C. Block B refers to the characterisation of the building in its different construction systems and components. Finally, block D contains the geometric information of the building and, therefore, the spatial dimension of the database. Thus, it is divided into two main sections: base geometry and operational geometry. The first provides a 2D visual geometric reference of the buildings. The second includes geometric entities to which the semantic information of the rest of the database blocks have been linked. The PC area relating to “Dissemination and Valorisation” constitutes a thematic section transversal to all the blocks, including its own fields complemented by contents from the other blocks.
Table A1 includes a list of the fields defined in the main block C. These fields are organised in different related tables (see
Section 3.2.2). The data type chosen has taken into consideration the interoperability with GIS software (mainly QGIS and ArcGIS Pro), ensuring a correct reading and content management.
Table A1 does not contain fields that are used as unique identifiers (PKs) or foreign keys (FKs) within the database, discussed in
Section 3.2.2.
Terminological Standardisation
Terminological standardisation defines the domains of the attributes that make up the database, i.e., the set of possible values that an attribute can take. This normalisation process applies to all the thematic categories defined in the database but is of special relevance in certain sections of the B and C blocks.
Regarding block B, a typological definition of all the architectural, constructive and spatial components that make up the buildings studied was carried out. This definition is specific for historic buildings, and in particular for those located in the geographical area of the region of Andalusia (Spain), taking as a reference the
Thesaurus of the Andalusian Historical Heritage [
67]. For this purpose, we followed the terminological standardisation criteria established and tested in previous research [
32], which define a glossary of primary elements (i.e., structure), sub-elements (e.g., vertical structure,) and components (e.g., columns) in a historic building, assigning them unique standardised identifiers. Regarding block C, a glossary was also generated for each of the areas of the PC, where standardised terms are determined to define deficiencies in the building [
56], maintenance tasks [
59], types of risks and vulnerabilities [
62], technical essays and testing [
32], among others.
Table A1 includes examples of the terminological standardisation established for the fields defined in block C.
This process of terminological standardisation is fundamental in order to ensure the quality and integrity of the data, allowing multi-scale filtering and queries within the complex system of the EIAS-29, relating different buildings to each other or different parts of a single building.
Spatial Standardisation
Spatial standardisation establishes a relational hierarchy to define the spatial entities that make up the model, from the totality of the heritage system down to the movable assets contained in each building. The different levels of detail are defined as units of logical analysis (ULA), defining a total of five (ULA-0 to ULA-4). The system establishes a correlation between the different ULAs, linking the entities defined at each level of detail with the one they belong to in the ULA immediately above.
The spatial entities defined by this normalisation criterion integrate the so-called operational geometry of the block D in the database, providing a spatial dimension to the semantic information collected. In this way, the thematic information related to the different PC areas is linked to specific ULAs depending on the requirements of each of them (
Figure 5).
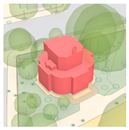
ULA-0: Heritage System (SEIA_). This represents the heritage system of the EIAS-29 as a whole. All pavilions are considered as a single entity in 2D and 3D. This level is only used for dissemination and enhancement purposes.
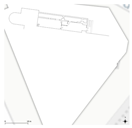
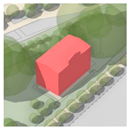
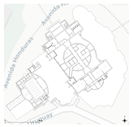
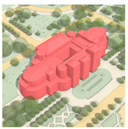
ULA-1: Pavilions (SEIA_ZZZ_). This level corresponds to each of the EIAS-29 pavilion as a whole. Each pavilion is identified as a single 2D and 3D entity. The Pabellón de EEUU is identified as “SEIA_PEU_”. This level was used in the current research for dissemination and valorisation purposes, although it could be used to perform risk analysis considering urban and territorial parameters.
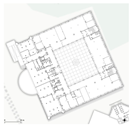
ULA-2: Areas (SEIA_ZZZ_PX_00). It defines the different areas that make up the pavilions. Each of these spaces is located at its corresponding level in the building (e.g., ground floor as “PB”). This level of detail has been tested including contents related to active follow-up and maintenance tasks.
ULA-3: Architectural elements (A00_SEIA_ZZZ_PX_00). It allows the identification of each of the architectural elements of the building in line with the terminological standardisation established in block B of the database. At his level, 2D and 3D entities represent the geometry of the building in a simplified way. For example, the simplified representation of a load-bearing wall as a 2D/3D entity is linked to the data related to its corresponding component of type “structure” as well as to the component of type “coatings, finishing, and decorative elements”. This level of detail allows the linking of damage assessment data to each element identified in block B, as well as active follow-up and dissemination purposes. It was tested with the first two.
ULA-4: Movable assets (M00_SEIA_ZZZ_PX_00). Finally, this level of detail identifies the movable assets contained in the building, both temporarily and permanently. Although it is contemplated in the methodological approach, the PC of movable assets presents a specificity that goes beyond the objectives of this research, centred on spaces and architectural elements. However, an analysis has been conducted to assess the risks to which a movable asset may be exposed, depending on its nature and the characteristics of the space (ULA-2) in which it is located.
Each spatial entity, defined according to the normalisation criteria, was assigned a unique identifier that captures the relationships between the various ULAs and the parameters specific to each level of detail (
Table 5).
Figure 5.
Spatial hierarchy for the multiscale definition and its correspondence with PC areas. Grey dots indicate the possibility of including data for that PC area and ULA in the DB, while black dots indicate that data relating to that PC area and ULA are included.
Figure 5.
Spatial hierarchy for the multiscale definition and its correspondence with PC areas. Grey dots indicate the possibility of including data for that PC area and ULA in the DB, while black dots indicate that data relating to that PC area and ULA are included.
3.2.2. Data Structure
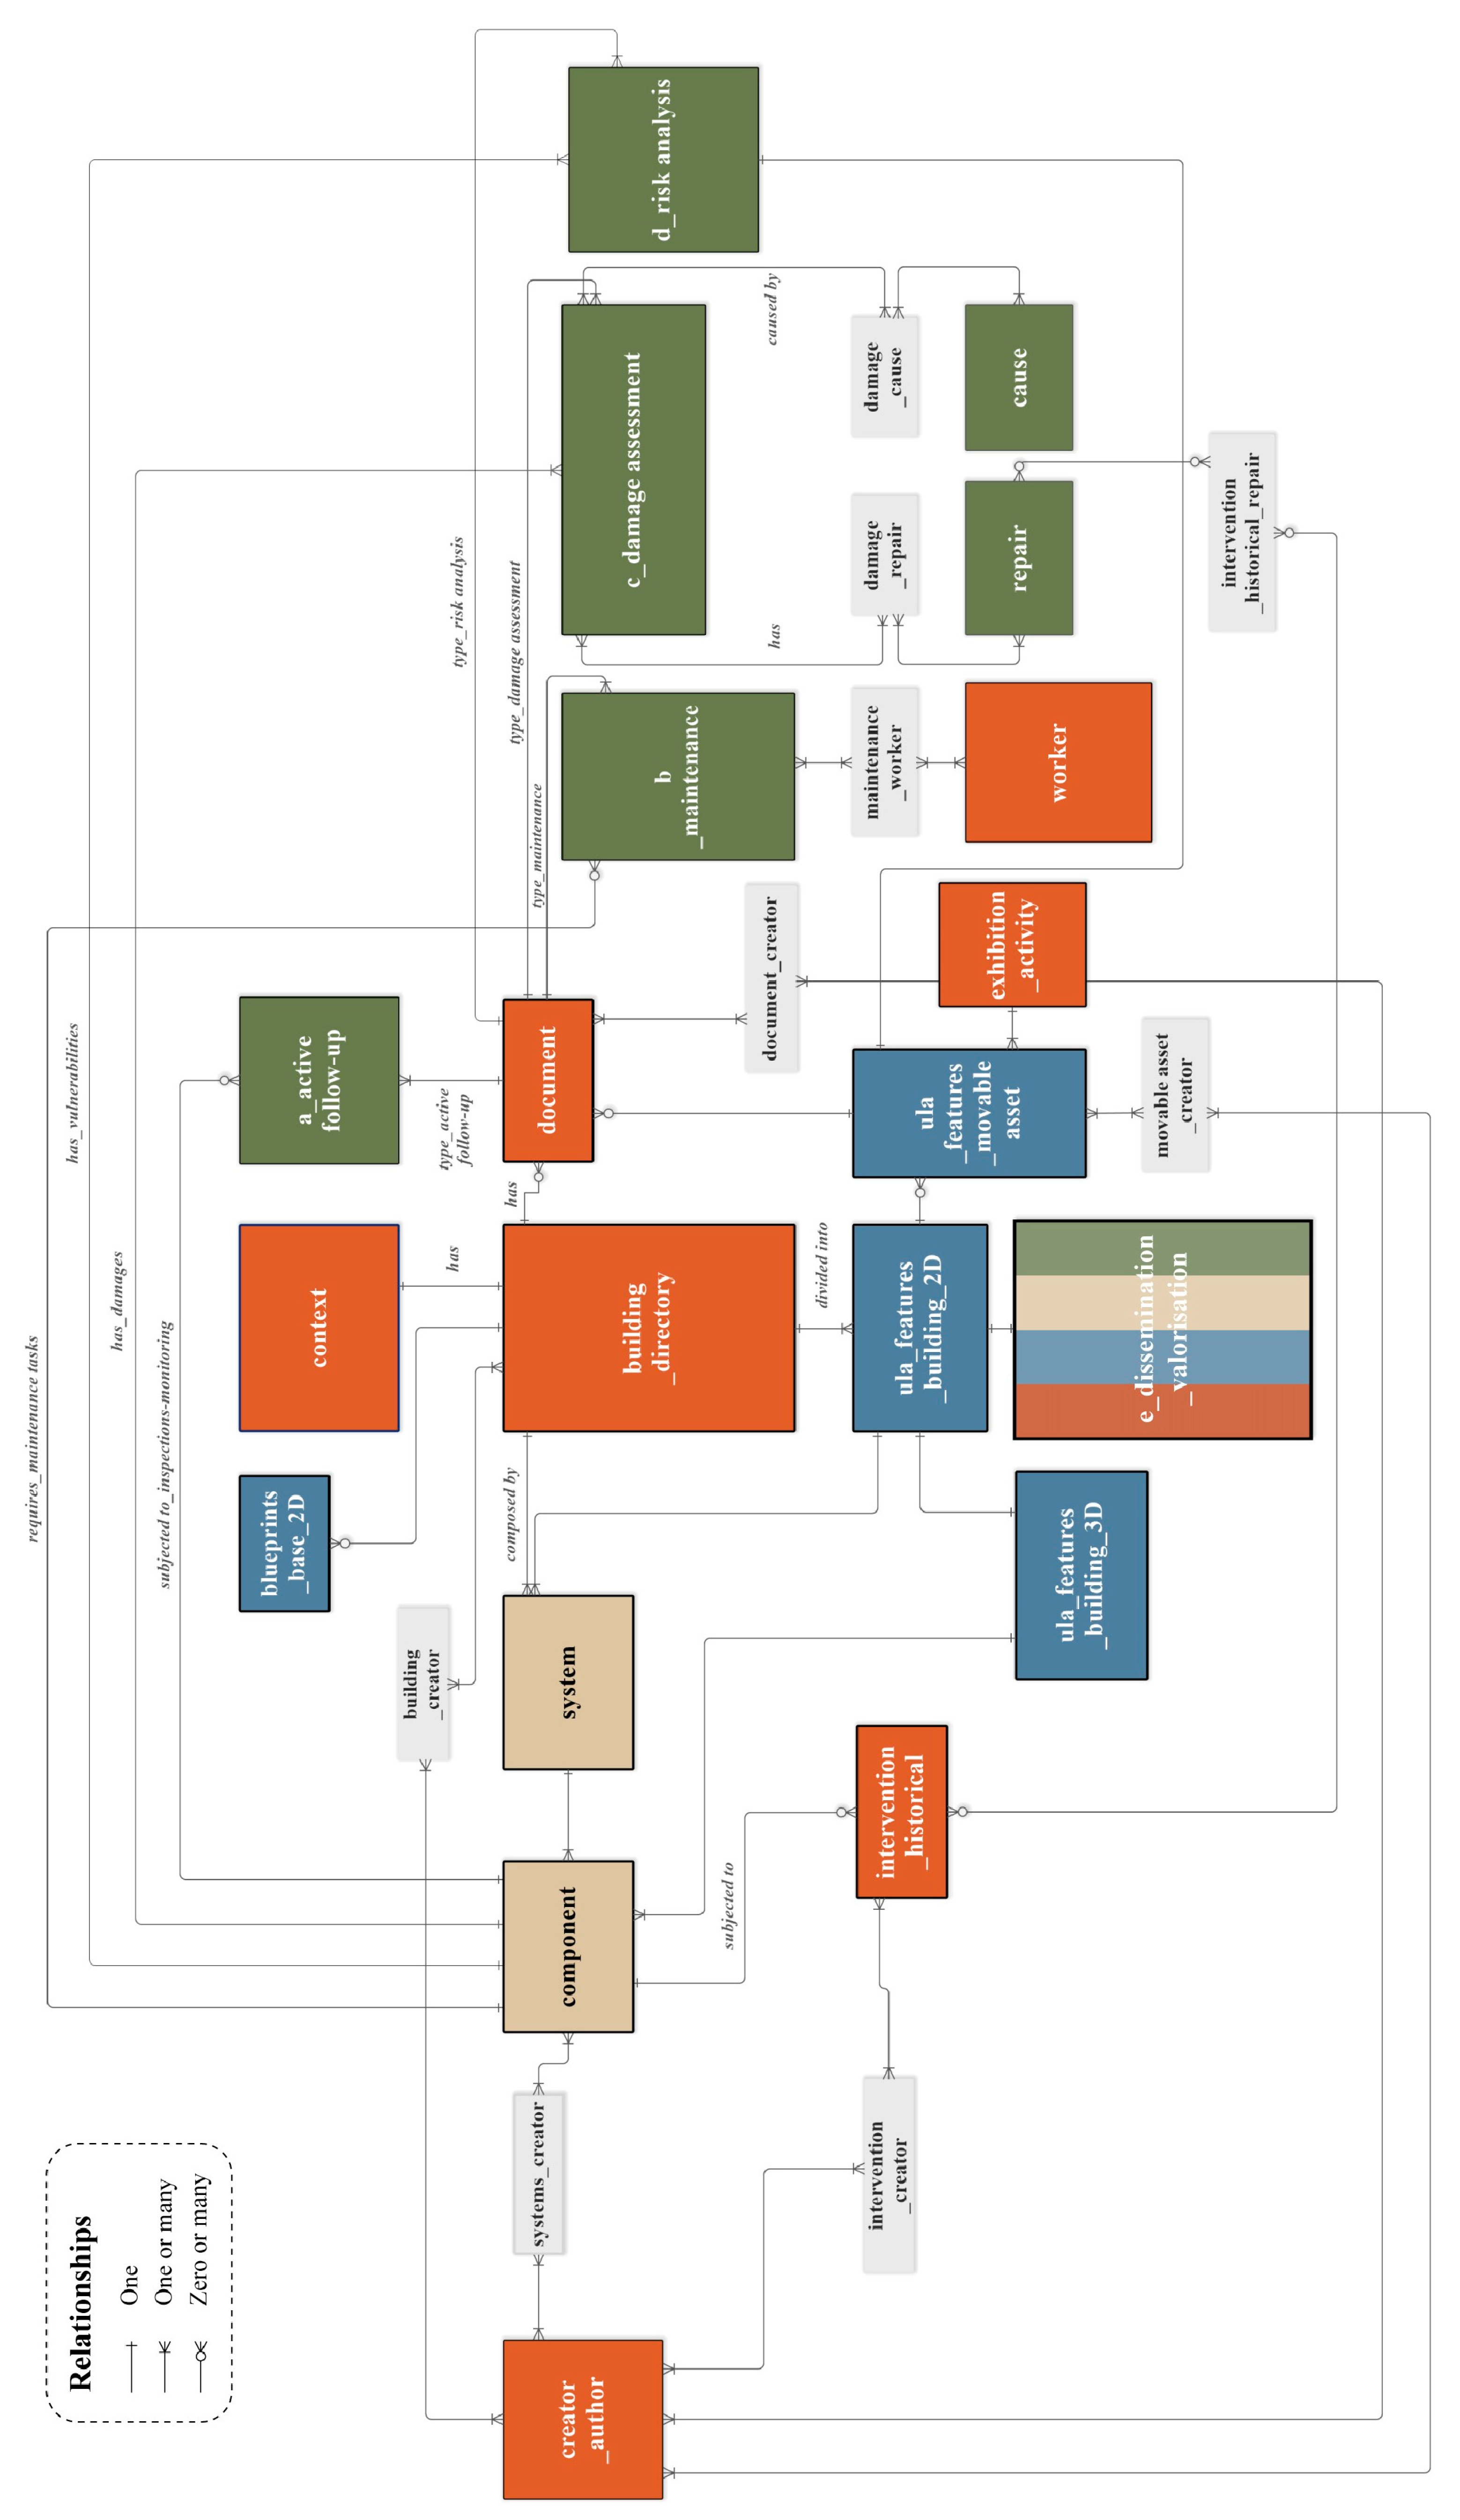
Standardisation criteria enabled the definition of a relational database, organised according to the entity relationship (ER) diagram shown in
Figure 6. The ER diagram shows the different tables that make up the thematic blocks in the previous section. Likewise, the relationships between the different tables and their attributes have been established. Normal forms (NFs) have been considered in the design, defining primary keys (PKs) and foreign keys (FKs), avoiding data redundancy, and considering impacts of partial and transitive dependencies.
The database is designed to use defined ULAs to join the semantic data included in the tables of the different PC areas. This action has been carried out through the creation of customised queries between tables and the subsequent creation of dynamic views. The usual data flow to query the information of the different PC areas is carried out through the tables of block B, which define the different spatial and architectural components of the building. Thus, a single spatial entity (such as a defined ULA 2D or 3D) can access the data of the corresponding components that have been considered in the data retrieval work for each PC area. Additionally, secondary joins can be made to the rest of the complementary tables that integrate the database, extending the information of the main tables. The ULAs defined are linked to a specific building, identified in its corresponding table. In this way, the management of data from different buildings is carried out efficiently, making it possible to filter, establish comparisons and carry out various analyses.
Table A1 includes the PostgreSQL data types defined for each information field of block C. These data types have been chosen to guarantee the interoperability of the information with the most frequently used GIS software: QGIS and ArcGIS Pro. This is because some common PostgreSQL data types such as INTERVAL or ENUM may be incompatible with these GIS tools.
3.3. Data Modelling
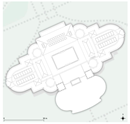
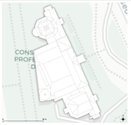
The database contains all spatial entities in the block “Geometry (D)”. The base geometry (D.1) is formed by the retrieved 2D planimetry of each of the pavilions. This planimetry has been vectorised, updated, and georeferenced by the authors.
The operational geometry (ULAs) that make up the D.2 section is two-dimensional and three-dimensional. The modelling process differs for each, but they are linked and share unique identifiers. The 2D features corresponding to each ULA were drawn manually using AutoCAD Map 3D v.2024 software. These 2D polylines were drawn on the mentioned geo-referenced base planimetry, ensuring their correct geographic location. Finally, the 2D features of each ULA were exported to shapefile files with multipolygonal geometry with Z coordinates for later importing in the PostgreSQL database. Interoperability with QGIS and ArcGIS Pro of these 2D entities is complete.
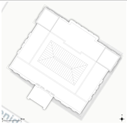
In the case of the 3D features, each ULA has its specific modelling procedure. The whole 3D modelling framework was conducted using ArcGIS Pro v.3.3 tools. For ULA-0 and ULA-1 features, a semi-automatic modelling procedure proposed by the authors [
31] have been used. This consists of using open data (LIDAR point clouds datasets from Spanish institutions and 2D vectorial cadastral data) to obtain a LOD2 model of the EIAS-29 pavilions with “Multipatch” geometry. Regarding ULA-2 and ULA-3 3D features, the equivalent 2D features have been used as a basis for the 3D modelling. The procedure consists of using a customised procedural fill (RPK file format) of ArcGIS Pro software to symbolise geometry of polygonal type with Z-coordinates as entity LOD 1 and LOD2. By applying this procedural fill, it was possible to semi-automatically control parameters for modelling complex geometries (domes, arcs, vaults, among others) as well as simple extrusions. Thus, a simplified three-dimensional representation of the different spaces (ULA-2) and architectural elements (ULA-3) that make up the buildings was achieved. However, these entities are still planar geometry, but with a 3D representation, so they must be converted to fully three-dimensional entities. For this purpose, the “Layer 3D to Feature Class” geoprocessing tool is used to transform the polygonal geometries to “Multipatch” geometry. Although “Multipatch” is not a fully interoperable geometry type with PostgreSQL—which interprets it as “Polygon”—it is chosen because it is the only geometry type that allows for publication of 3D entities in ArcGIS Online platform. QGIS is also not fully interoperable with “Multipatch”, as it detects only its planar geometry, which it interprets as geometry type “Polygon”. However, both PostgreSQL and QGIS are able to read the associated semantic information, i.e., the defined PKs and FKs, which are essential for querying and joining with other related tables in the database. These limitations are assumed in the framework of the research, as the integration with QGIS is limited to working in 2D and with ArcGIS Pro in 2D and 3D. Thus, except for 3D visualisation, the database functionalities are equivalent for both GIS software, as the semantic information that can be linked to 2D and 3D geometric entities is the same.
Figure 7 summarises the different modelling workflows described. The modelling of ULA-4 entities is not among the objectives of the current study.
3.4. Data Integration
The PostgreSQL database (v.15.5) was built using the graphical user interface (GUI) pgAdmin4 v8.12. Considering the ER diagram and the standardisation criteria proposed, different tables were created, defining attributes and their data types. Primary keys (PKs) and foreign keys (FKs) were established to set up the corresponding relationships. To ensure data consistency, a domain restriction method for specific attributes using ‘CHECK CONSTRAINT’ in PostgreSQL was implemented according to the terminological standardisation criteria. These domains can be modified if it is necessary to revise or add new terms. The generation of unique identifiers for the registers defined in table [components], [ula_features_building_2D] and [ula_features_building_3D] is handled automatically via database triggers that generate auto-incrementing values, according to the criteria discussed in
Section 3.2.1.
To work with spatial data, the PostGIS v.3.4 extension is created in the DB, allowing it to store and efficiently manage the geometry types MultipolygonZ and MultipointZ, among others.
After creating the database in PostgreSQL, it was linked to QGIS and ArcGIS Pro for filling in the geometric and semantic information. Regarding QGIS, the integration is omplete, allowing DB reading and editing capabilities after creating and configuring a connection. In the case of ArcGIS Pro, integration is more complex. The direct connection allows only reading capabilities of the DB information, as well as queries and joins. The edition was enabled by registering the DB as an “Enterprise Geodatabase”, for which additional licenses of ArcGIS Enterprise and ArcGIS Server v.11.3 are required.
At this point, it is worth noting that PostgreSQL automatically generates additional tables in the database, beyond those shown in
Figure 6, when the PostGIS extension is enabled. For instance, to consider the different standardised referencing systems with which the database can work. Also, in the process of integration with ArcGIS Pro, new tables and schemas are created in the database.
The 2D geometric information is added to the DB using “PostGIS Shapefile Import/Export Manager”. Thus, the corresponding base and operational geometry (block D) created is introduced into the database as independent tables for each included file. The merging of all these tables and integration into the specific tables to store the geometry in the DB is done through SQL scripts that automate the process of layer standardisation. The correct integration is visualised through QGIS and ArcGIS Pro, defining specific symbology styles and organising the different floor levels. The 3D geometry is created in ArcGIS Pro following the process mentioned in
Section 3.3., and exported to the linked PostgreSQL DB, once the editing permissions have been enabled. Although PostgreSQL and its PostGIS extension allow to include several types of geometries in different columns of the same DB table, this possibility has been restricted, as ArcGIS Pro cannot read tables that include different geometries, although QGIS can.
The introduction of semantic data from the different PC areas has been carried out manually in the DB. No automation method has been used for this process, although the future use of data entry forms linked to ArcGIS Pro and QGIS to optimise the process will be considered.
The DB query procedure is automated by creating thematic dynamic views through SQL scripts, which are automatically updated when changes are generated in the DB (
Table 6). These views allow consulting the information associated with each ULA defined in the building, both in 2D and 3D. The dynamic views are a versatile and flexible tool that allows modifications and variations depending on the information required.
After completing the integration process, there is a bidirectional flow of information between the PostgreSQL database and QGIS-ArcGIS Pro. Thus, the content of the database can be edited and queried both from the pgAdmin GUI and from the GIS software used. At the same time, if the PostgreSQL database is hosted on a server that is part of a network (e.g., research laboratory or departments of a public administration, among others), it can be accessed by users with the appropriate permissions, enabling collaborative work on a local level. Likewise, through virtual private network (VPN) connections, authorised users can access the database remotely. In this context, the database is currently editable and updatable by users with the necessary access rights, either through local network connections or via secure remote access. Finally, the content of the DB has been uploaded to the “ArcGIS Online” platform to make it accessible at the query and visualisation level, with limited editing capabilities, as discussed in the next section.
3.5. WebGIS Deployment
The cloud-based platform ArcGIS Online serves as the WebGIS environment for publishing the database content. The information layers representing the dynamic views created for both 2D and 3D entities are published from ArcGIS Pro as hosted feature and scene layers on the platform. These layers are hosted on ESRI servers, so they are independent of the original database, which means that edits made to these layers in ArcGIS Online are not synchronised with the PostgreSQL database hosted on the local server. This limitation implies that the layers hosted in ArcGIS Online are mainly used to visualise, query and perform spatial analysis using the content of the database. Thus, editing from ArcGIS Online involves a rigorous updating protocol by the administrator of the local PostgreSQL DB. This can be done manually or through automatic synchronisation scripts in Python (with ArcGIS API for Python) that periodically update the information in the local DB. Similarly, the information published in ArcGIS Online is updated from the local DB manually or automatically overwriting the hosted layers.
These limitations can be addressed by using the ArcGIS Enterprise platform instead of ArcGIS Online [
68]. In ArcGIS Enterprise, the layers are published as a feature service, acting as a direct view to the PostgreSQL DB and directly saving any edits made. The use of this platform as a WebGIS environment is considered as a line of future work, being not possible to fully implement in this research due to technical and administrative limitations.
After publishing the content, a Web mapping application (WMA) was created with ArcGIS Experience Builder, integrating 2D and 3D GIS models. The WMA integrates different geographic web services as web maps, web scenes, story maps and dashboards which have been developed based on the DB contents uploaded. This WMA was shared with users, technicians and stakeholders, defining privacy ranges for each specific content and type of user.
4. Results
This section illustrates the information management and analysis capabilities provided by the proposal, in relation to the different areas of PC listed in
Section 1.1. This section focuses on the actions derived from the compatibility and bidirectionality of the PostgreSQL DB hosted on a local server with ArcGIS Pro (2D and 3D-GIS models) and QGIS (2D-GIS model). From the dynamic views created and imported in these software (see
Table 6), statistical analyses were carried out using the native tools of ArcGIS Pro and the “Data Plotly” plugin in QGIS, and spatial queries useful for the implementationof the different PC areas were developed. The information provided by the dynamic views created was complemented with data from other related auxiliary tables.
These data visualisation and analysis capabilities can be extrapolated to the developed WebGIS environment, but to avoid duplication of results in the article, only the capabilities of this environment for ‘dissemination and valorisation’ are reported in
Section 4.5.
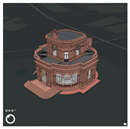
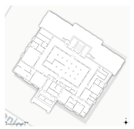
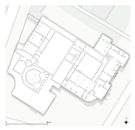
It should be noted that to illustrate the results of this research, one of the buildings in EIAS-29, the Pabellón de EEUU, has been chosen as a representative example of ULAs 2, 3, and 4. On the ground floor, museum use predominates, with several indoor and outdoor exhibition spaces. On the first floor, the main use is administrative and educational, mainly offices and classrooms.
4.1. Active Follow-Up
The integration of the DB with ArcGIS Pro and QGIS offers an optimal working environment for managing different active follow-up tasks. Each inspection and task carried out has been stored in the DB as an independent record, associated with the corresponding space (ULA-2), architectural element (ULA-3), or movable asset (ULA-4). The information to be included may be alphanumeric (description of the work carried out, equipment used, etc.), temporal (date and performance of the work, duration, etc.), graphical (representative images, charts, etc.), or hyperlinks to the detailed results of the task stored externally. In professional practice, active follow-up tasks are essential to complement the analysis and diagnosis carried out in the damage assessment, risk analysis, and maintenance areas. Thus, a CDE such as the one proposed in this research facilitates access to the data by agents who do not necessarily participate in all areas but require these data to complement their work.
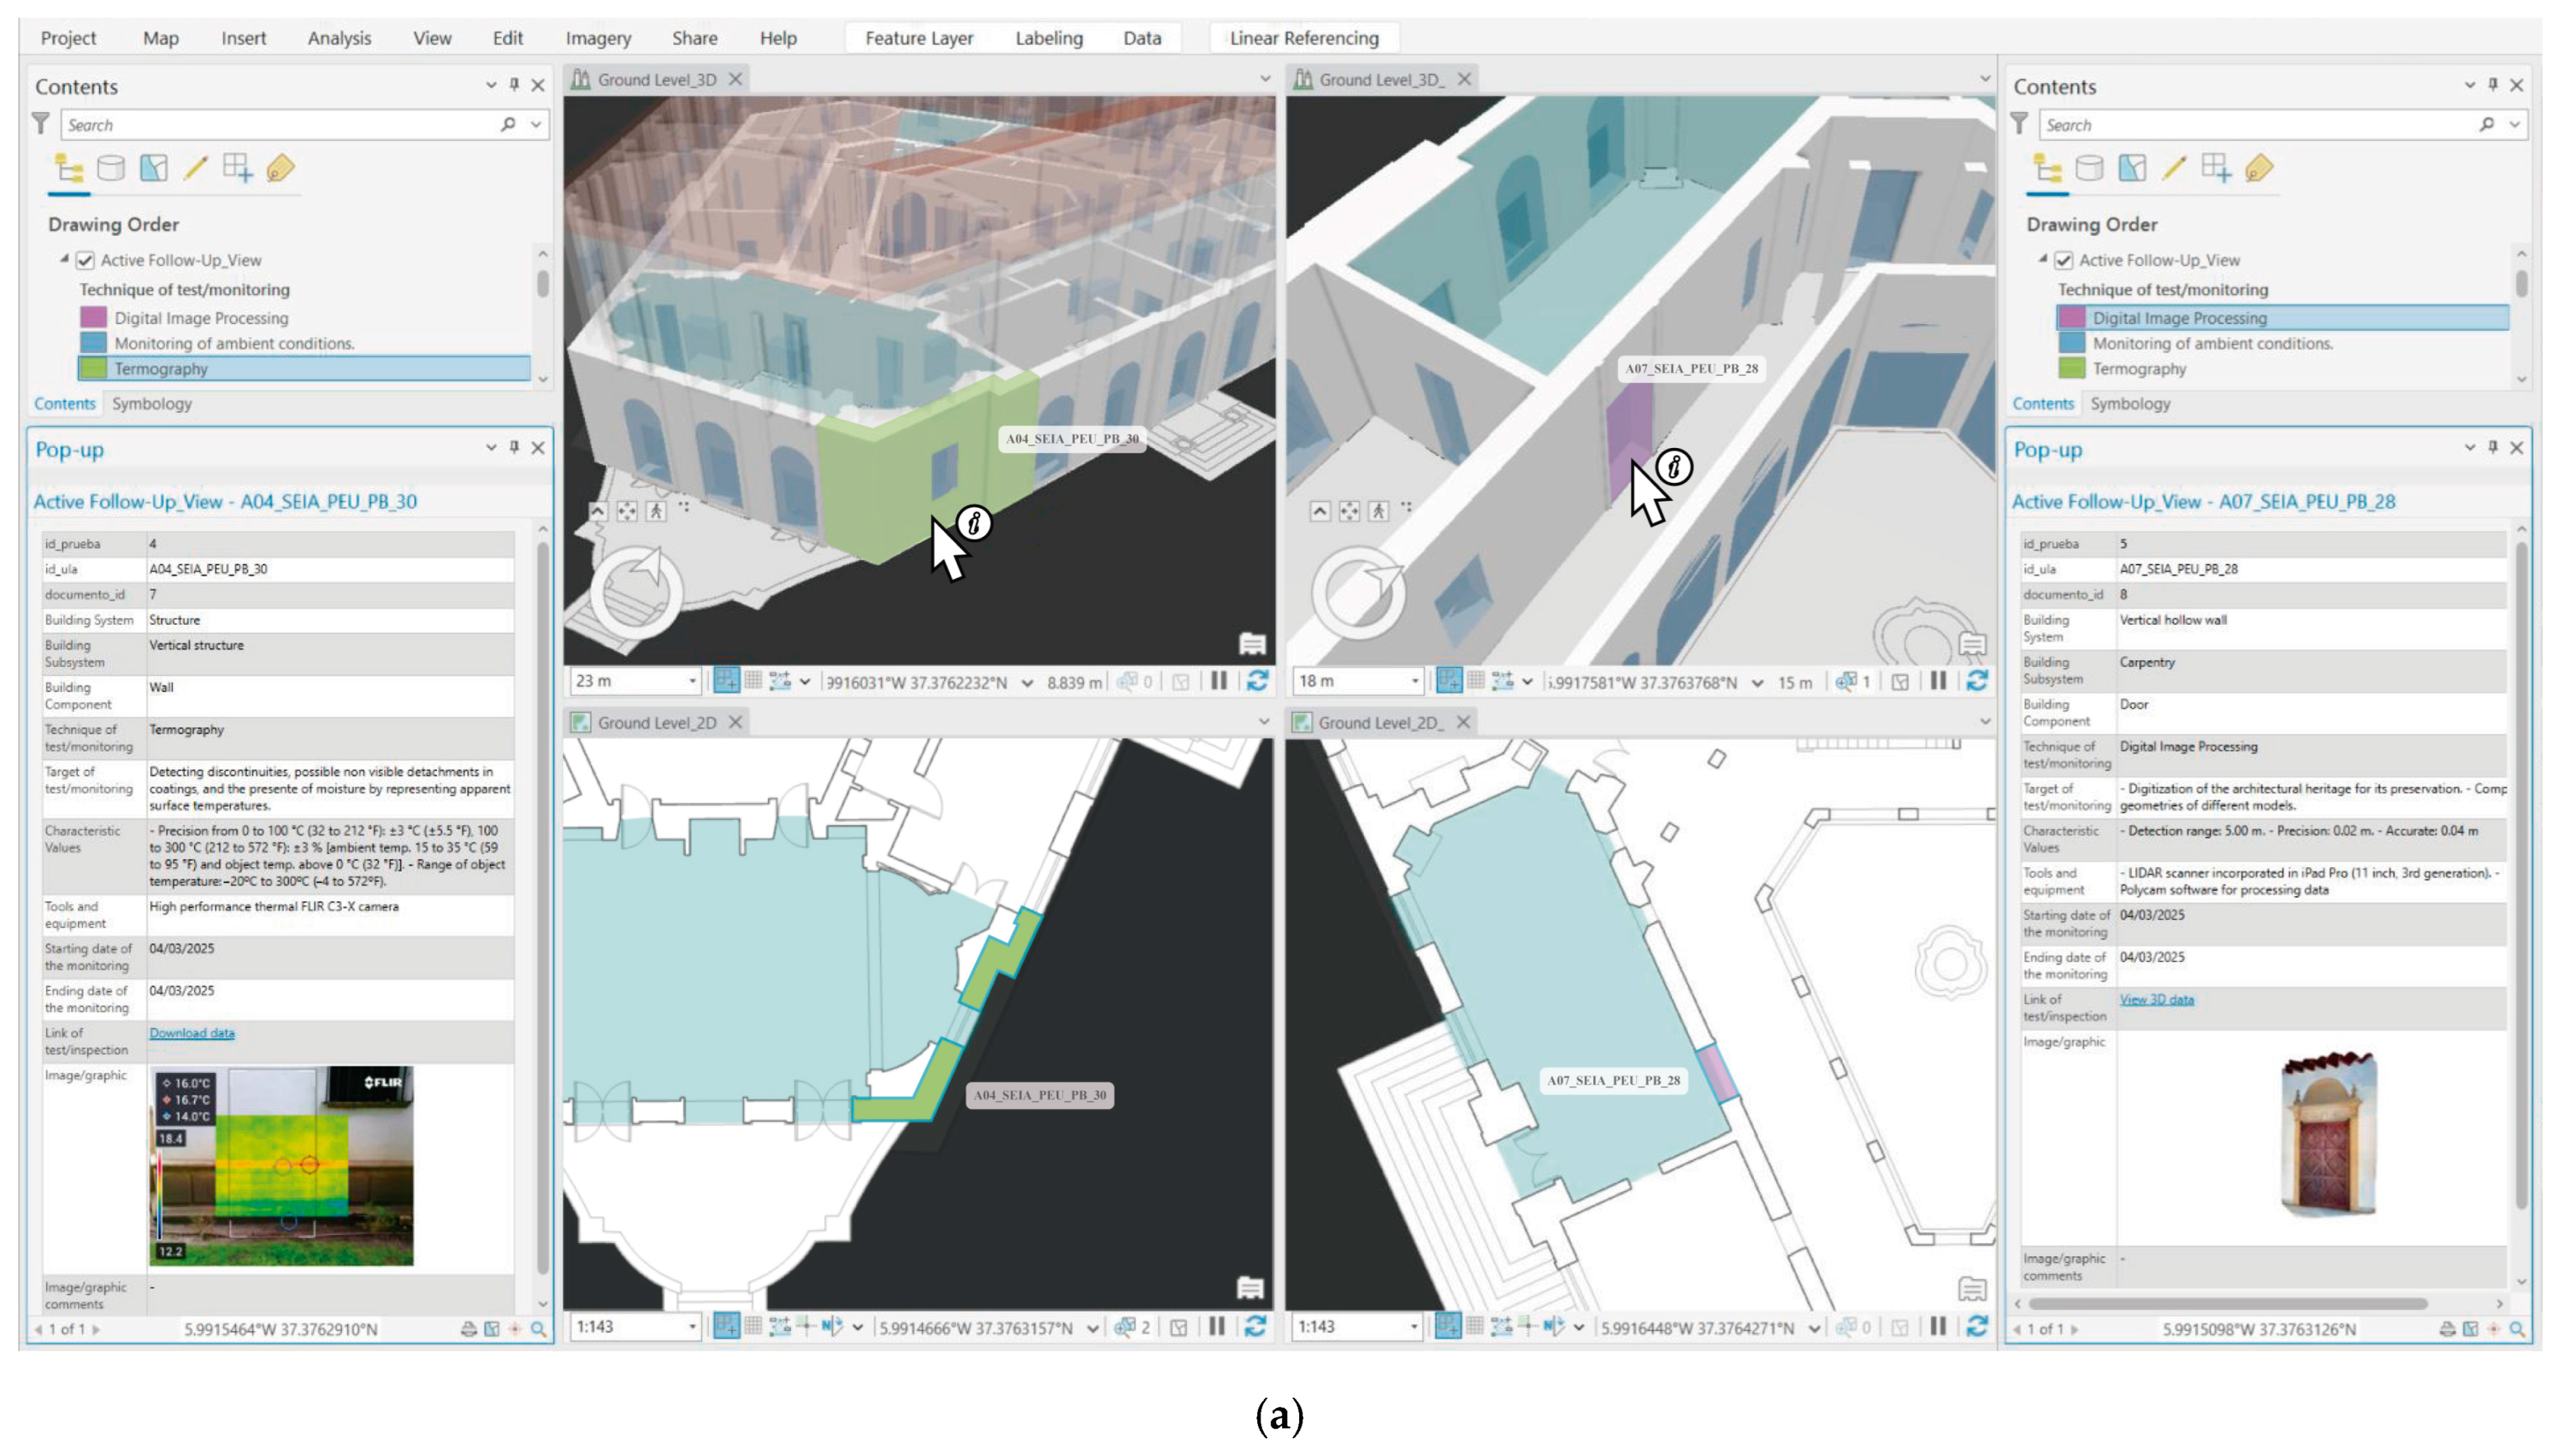
This contribution includes results from three types of active follow-up tasks: thermography (
Figure 8a), digital image processing (
Figure 8a), and monitoring of hygrothermal conditions (
Figure 8b). Regarding thermography, its management from the 2D-3D GIS model makes it possible to spatially identify the architectural element analysed, putting it in relation with the rest of the architectural elements as well as with external variables easily accessible as GIS data that may affect its thermal behaviour (hygrothermal conditions, solar radiation, prevailing winds, etc.). In addition, a temporal traceability of the thermal behaviour of an element throughout the year can be performed thanks to the temporal data associated with the DB record. This data is very useful for damage assessment specialists to check hypotheses about the origin of deficiencies in the building.
With regard to digital image processing, the GIS model becomes an alternative to efficiently manage detailed 3D point cloud surveys. This is because the GIS model does not include the point cloud directly but provides access via a hyperlink included in the attributes of its corresponding DB record. This hyperlink leads to a platform that stores the point cloud on an external server and allows its detailed visualisation. In this way, the model only shows relevant information of the survey performed (including a preview of it), saving the resources and storage capacity required by the inclusion of the point cloud. Point clouds are useful for the documentation and dissemination of the building but can also be used to assess the degree of deterioration of an architectural element over time, among other possibilities.
Finally, data from periodic monitoring of indoor environmental conditions can be analysed using data engineering tools provided by the GIS software. Similar to digital image processing, the massive monitoring data have not been entered into the DB but are accessible through a hyperlink to the platform that hosts them. Thus, the massive data collected for this research were not entered in real time into the DB but have been uploaded a posteriori into the GIS project for analysis. However, the future introduction of an additional table in the DB to collect the data in real time may be considered, linking to the corresponding record in the specific table [a_active follow-up]. With regard to the capabilities provided by GIS software for the analysis of these data,
Figure 8b shows how an evaluation of the temperature and relative humidity conditions of a space was carried out, comparing these with the recommended reference values. These are exhibition rooms, which have hosted art collections composed of objects made of different materials. Thus, by knowing the material nature of the exhibits and the corresponding reference values, it is possible to check whether the indoor environmental conditions have been optimal during the exhibition time. This data can be cross-checked with the data in the [b_maintenance] table to see whether non-compliance with the reference values is due, for example, to problems with the HVAC equipment. Access to monitoring data is also essential to assess the level of riskposed to the art collection by exposure to unfavourable environmental conditions; these data are included in the [d_risk analysis] table.
4.2. Damage Detection and Assessment
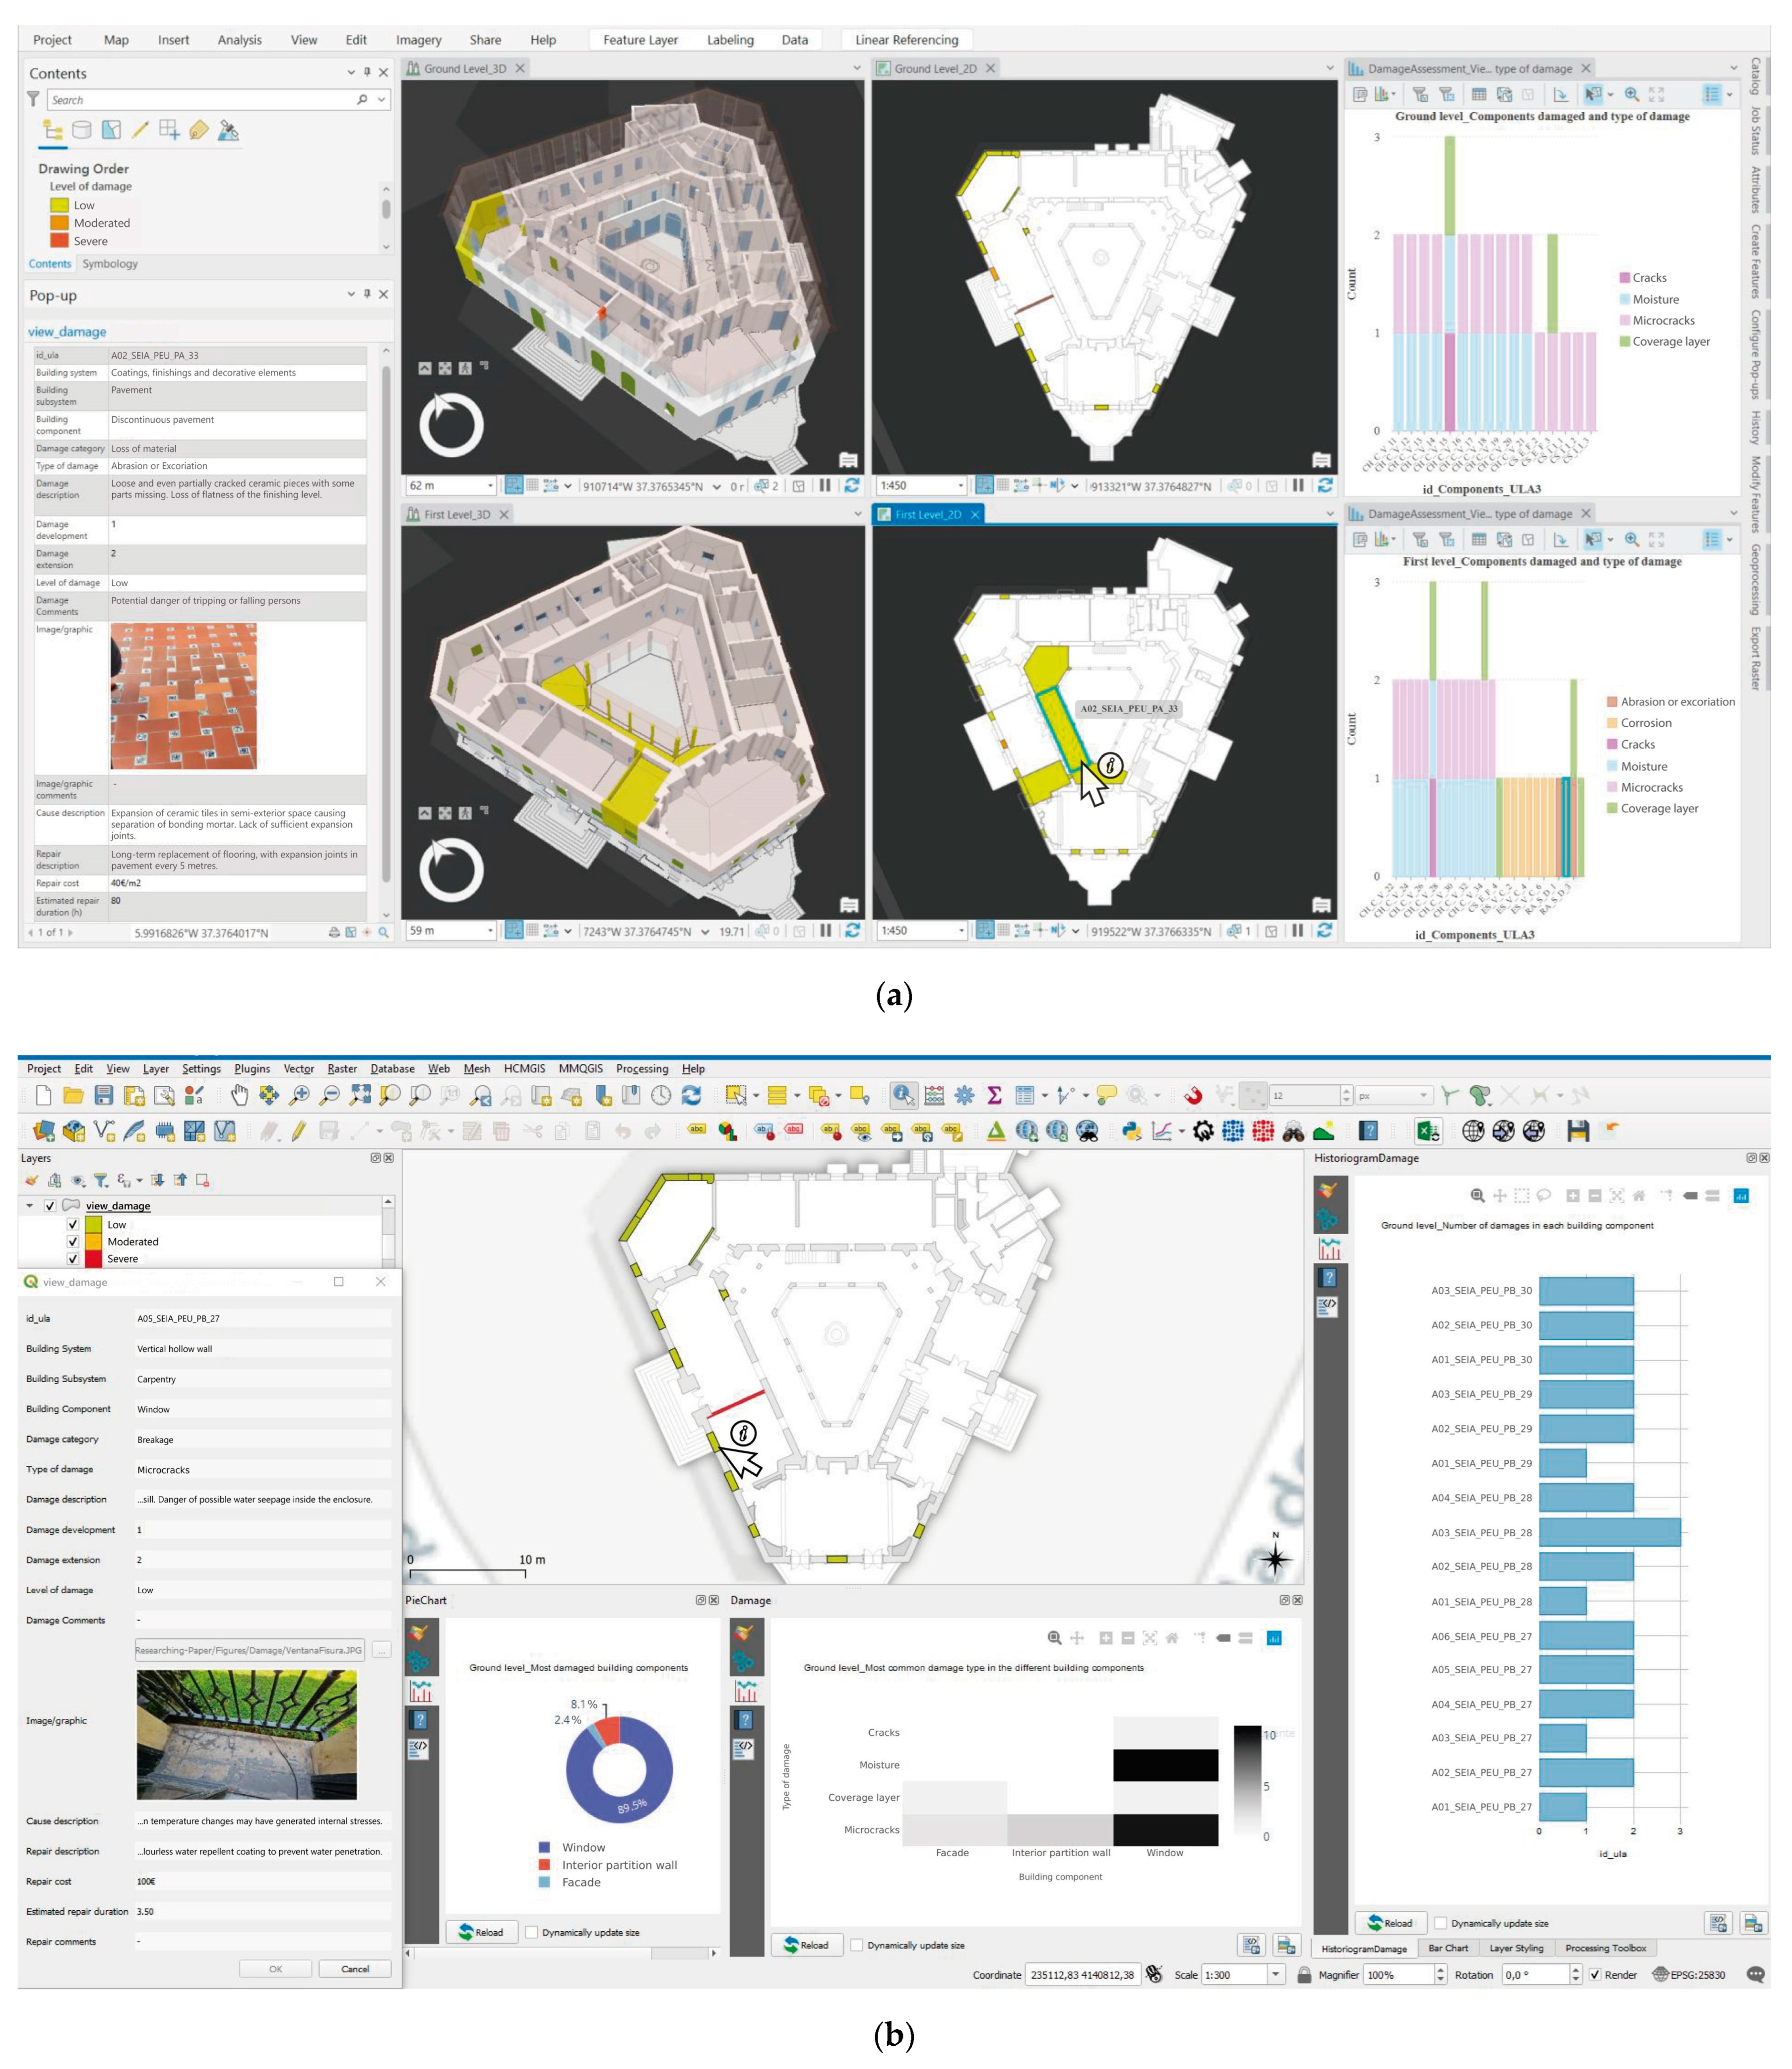
In order to validate the proposed spatial DB in this PC area, damage inspection was carried out on the different floors of the west wing of the pavilion. The DB adds proven value to the work of the damage assessment and detection technicians in the different phases of the inspection: fieldwork and office work. On the one hand, the 2D-3D GIS model provides a geometric basis for carrying out the damage inspection during fieldwork (in situ), identifying the damaged architectural elements (ULA-3), documenting the damage by means of images, and creating a linked record in the DB with specific data on the identified deficiency. The alphanumeric data collection enables categorisation of damage, identifying its possible cause, and proposing repairs (including their cost and estimated duration). Using established damage assessment criteria [
56], the technician can include the extent and development of the damage, resulting in a level of severity of the existing damage (
Figure 9a,b). In this way, the technician can establish a hierarchy of actions to be carried out on the building, providing approximate data on the economic cost, as well as the time needed for the repairs. This information is transferred to the building administrators, who can introduce these repairs as part of the maintenance tasks in the [b_maintenance] table, scheduling them when the spaces are not in use, considering data from the [e_dissemination_valorisation] and [exhibition_activity] tables.
Most of the data defining each record (damage) in the DB are terminologically standardised through domains, so that subsequent office analysis is facilitated. ArcGIS Pro and QGIS offer similar statistical analysis tools to obtain an overview of the state of conservation of the building elements and to detect common trends and patterns. In
Figure 9a, an analysis of all damaged elements is illustrated, showing the type of damage they present. In
Figure 9b, the studied section of the building is analysed as a whole, to determine which types of architectural element present most damage, as well as which type of damage is most frequent in each type of element.
Another of the advantages of working with a 2D-3D GIS model is the ability to relate the damage detected in an architectural element with the rest of the elements of the building and its context, helping to identify the causes of the damage. Thus, in
Figure 9a, it can be observed that all the windows on the west facade of the building show micro-cracks and damp in the woodwork. These microcracks may have their origin in the drastic changes in temperature that this facade undergoes throughout the day due to its orientation. The moisture may be caused by the proximity of this facade to the river. These hypotheses can be contrasted with results of works in the table [a_active follow-up] as well as with external spatial data on solar radiation, prevailing winds, hygrothermal data, etc.
4.3. Risk Analysis
The framework of this research uses the 2D-3D GIS model as a complementary tool to assess the level of risk to which different types of materials are subject depending on the exhibition areas of the pavilion in which they are located. For this purpose, in parallel to this research, a risk assessment was carried out based on the NTP 330 method [
50,
51], which calculates the level of risk according to a series of related vulnerability parameters, including the level of deficiency, the level of exposure, the level of probability, and the level of consequences. These parameters are related through weighted matrices, resulting in a final risk level. The starting point is detecting existing deficiencies in the exhibition space that may increase the level of risk related to the following factors (RF): relative humidity, temperature, atmospheric pollution, degree of illumination, organisms, maintenance, theft and vandalism, and fire. Next, the probability of a damaging event occurring to the movable asset is estimated and, considering the expected magnitude of the consequences, the risk associated with each of the identified deficiencies is assessed. Finally, an overall risk level is calculated. The assessment covers three types of collections (ULA-4), according to the predominant materials in each of them: metals (VISNP); stones, ceramics, and glass (VISP); and textiles, paper, parchment, leather, leather, wood, horn, and ivory (VOFP). The results of the application of the NTP330 method to the case study are detailed in the literature [
62].
In the table [d_risk analysis] of the DB, only the numerical values corresponding to each of the evaluation parameters have been introduced, implemented in the dynamic view created. These numerical values are specific to each of the exhibition rooms (ULA-2), as each of them has particular characteristics in relation to the RFs. The 2D-3D GIS model provides a graphical output to the risk assessment results.
Figure 10a,b shows how the risk levels are different in each exhibition space for the VOFP and VISNP collections. The graphs generated in ArcGIS Pro from the DB information (
Figure 10a), provide a direct comparison between the three types of collections, being able to detect which is the most vulnerable type of collection in the building as a whole, as well as to detect which spaces are more suitable for hosting one type of collection or another.
Focusing the analysis on the VOFP collection,
Figure 10a,b shows the level of risk posed by the exposure of pieces in each room of the building. The predominant materials are of an organic, fibrous and porous nature. For this reason, the areas of highest risk (level 4) are the galleries corresponding to the inner courtyard of the building, as they are outdoor spaces that do not offer sufficient protection against RF such as temperature, relative humidity or atmospheric pollutants. The rooms with a moderate risk level (level 3) are indoors, but do not offer sufficient protection against RF such as fire, as they do not have fire detection systems. Finally, rooms with a low risk level (level 1) have sufficient conditions to mitigate most RFs.
The advantages of centralising the information in a single DB are demonstrated again. Building administrators and exhibition curators can jointly use this data to choose how to distribute the pieces of the collection in the building, determine visiting hours, maximum capacity, etc.; this information is included in the tables [e_dissemination_valorisation] and [exhibition_activity]. They can also be used to adapt the tasks in the [b_maintenance] table to the characteristics of the collection. Access to the data derived from the tables [a_active follow-up] and [c_damage assessment] is essential to detect deficiencies in the building that influence the calculation of the risk analysis.
4.4. Maintenance
The maintenance tasks corresponding to a full year of use of the Pabellón de EEUU have been included in the DB. The total productive maintenance (TPM) method, focused on the autonomous maintenance of the building and based on the active participation of all users (workers and temporary occupants), was used to determine the tasks to be carried out. Specific information on the application of the TPM method to the case study is available in the literature [
59].
Each maintenance task is included as an independent record in the [b_maintenance] table linked to the corresponding space (ULA-2). This table includes alphanumeric data to describe and categorise the tasks, temporal data to chronologically locate the task and its estimated duration, as well as data to check its degree of completion, the degree of priority or the approximate economic cost. The dynamic view created allows bringing information of interest from other tables such as [worker], univocally identifying the building staff in charge of carrying out the task, and from the [components] and [systems] tables, linking the task to the primary elements, sub-elements and components that integrate the building, defined according to the terminological standardisation criteria. Images documenting the result of the task are also included.
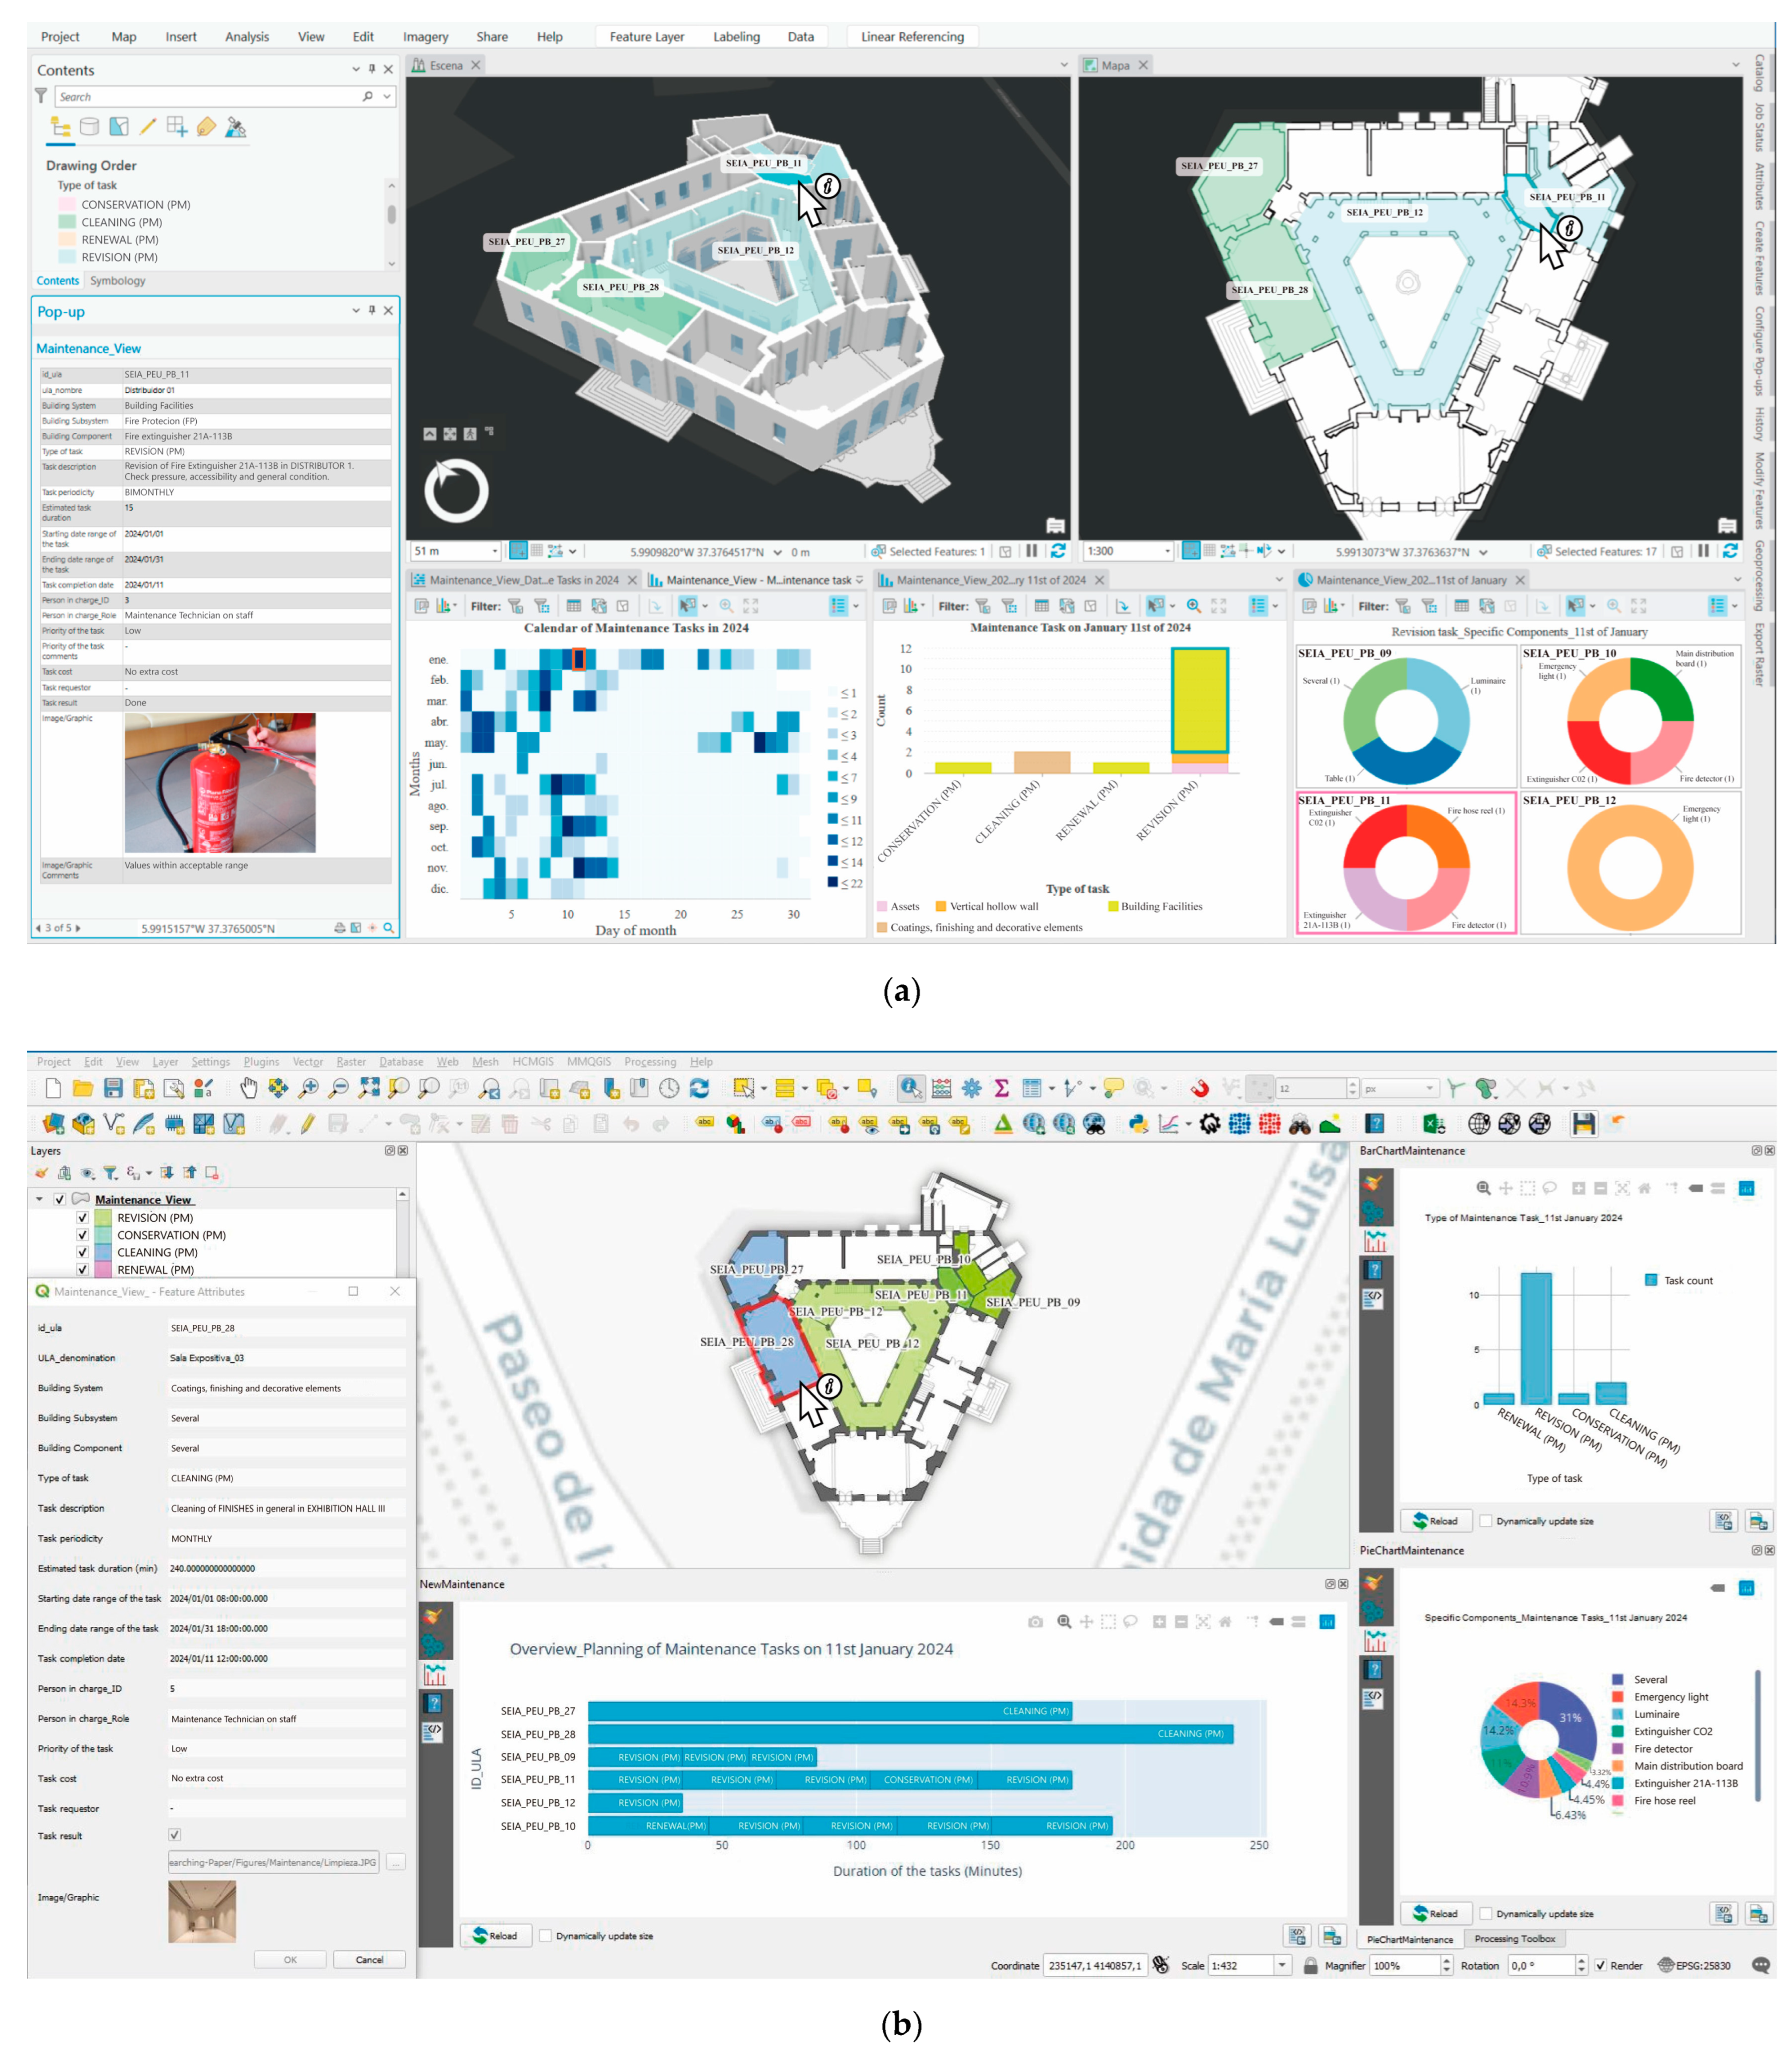
In this context, the use of the 2D-3D GIS model adds functionalities that supports the maintenance planning of the building by its administrators. The analytical capabilities of ArcGIS Pro and QGIS have made it possible to create interactive graphs from the DB data linked to the spatial model, which provide an overview of the maintenance volume in different time ranges (
Figure 11a,b): annual, weekly, and daily. Similarly, thanks to the creation of domains, the categorised attributes have made it possible to analyse the type of tasks to be performed in a specific time range, or to identify and quantify the number of elements that require some maintenance action in each building space selected in the model (
Figure 11a). Another capability is illustrated in
Figure 11b, where we can calculate the total duration of the maintenance tasks in each of the spaces for a specific date, useful for optimally organising the work of staff in the building.
The centralised control of the maintenance work in its temporal and spatial dimensions through the GIS model allows managers to correctly coordinate with the normal use of the building and the activities that take place in it [e_dissemination_valorisation]. The relevance of cross-checking the data corresponding to this PC area with the rest to ensure the correct implementation of a building PC strategy has already been highlighted in the previous sections.
4.5. Dissemination and Valorisation
Semantic information was collected from the whole EIAS-29 (ULA-0) and from each of the pavilions (ULA-1) to be introduced as records in the DB. This information is integrated in the table [e_dissemination_valorisation] and was complemented with data from other tables of the DB to generate the corresponding dynamic view. The semantic content collected mainly comprises general descriptive information on the heritage characteristics of each record, its uses and activities, levels of heritage protection in the Spanish legal context, a compilation of bibliographic documentation of interest, and representative images.
At the same time, in this case, the 2D and 3D geometry becomes a fundamental resource for knowledge and research into the pavilions. The centralisation in the same CDE of the 2D planimetry of each of the buildings as well as the 3D models created ensures their accessibility for any interested user and makes their periodic updating easier.
Table A2 shows all the 2D (63 floorplans in total, organised by height levels) and 3D data (12 models LOD2 and 2 models LOD4) included in the DB. In addition, historical cartography of the EIAS-29 has been geo-referenced, contextualising the exhibition site and its pavilions in the current urban environment, which is very useful for the study of the evolution of the city and the location of the remaining elements of the EIAS-29.
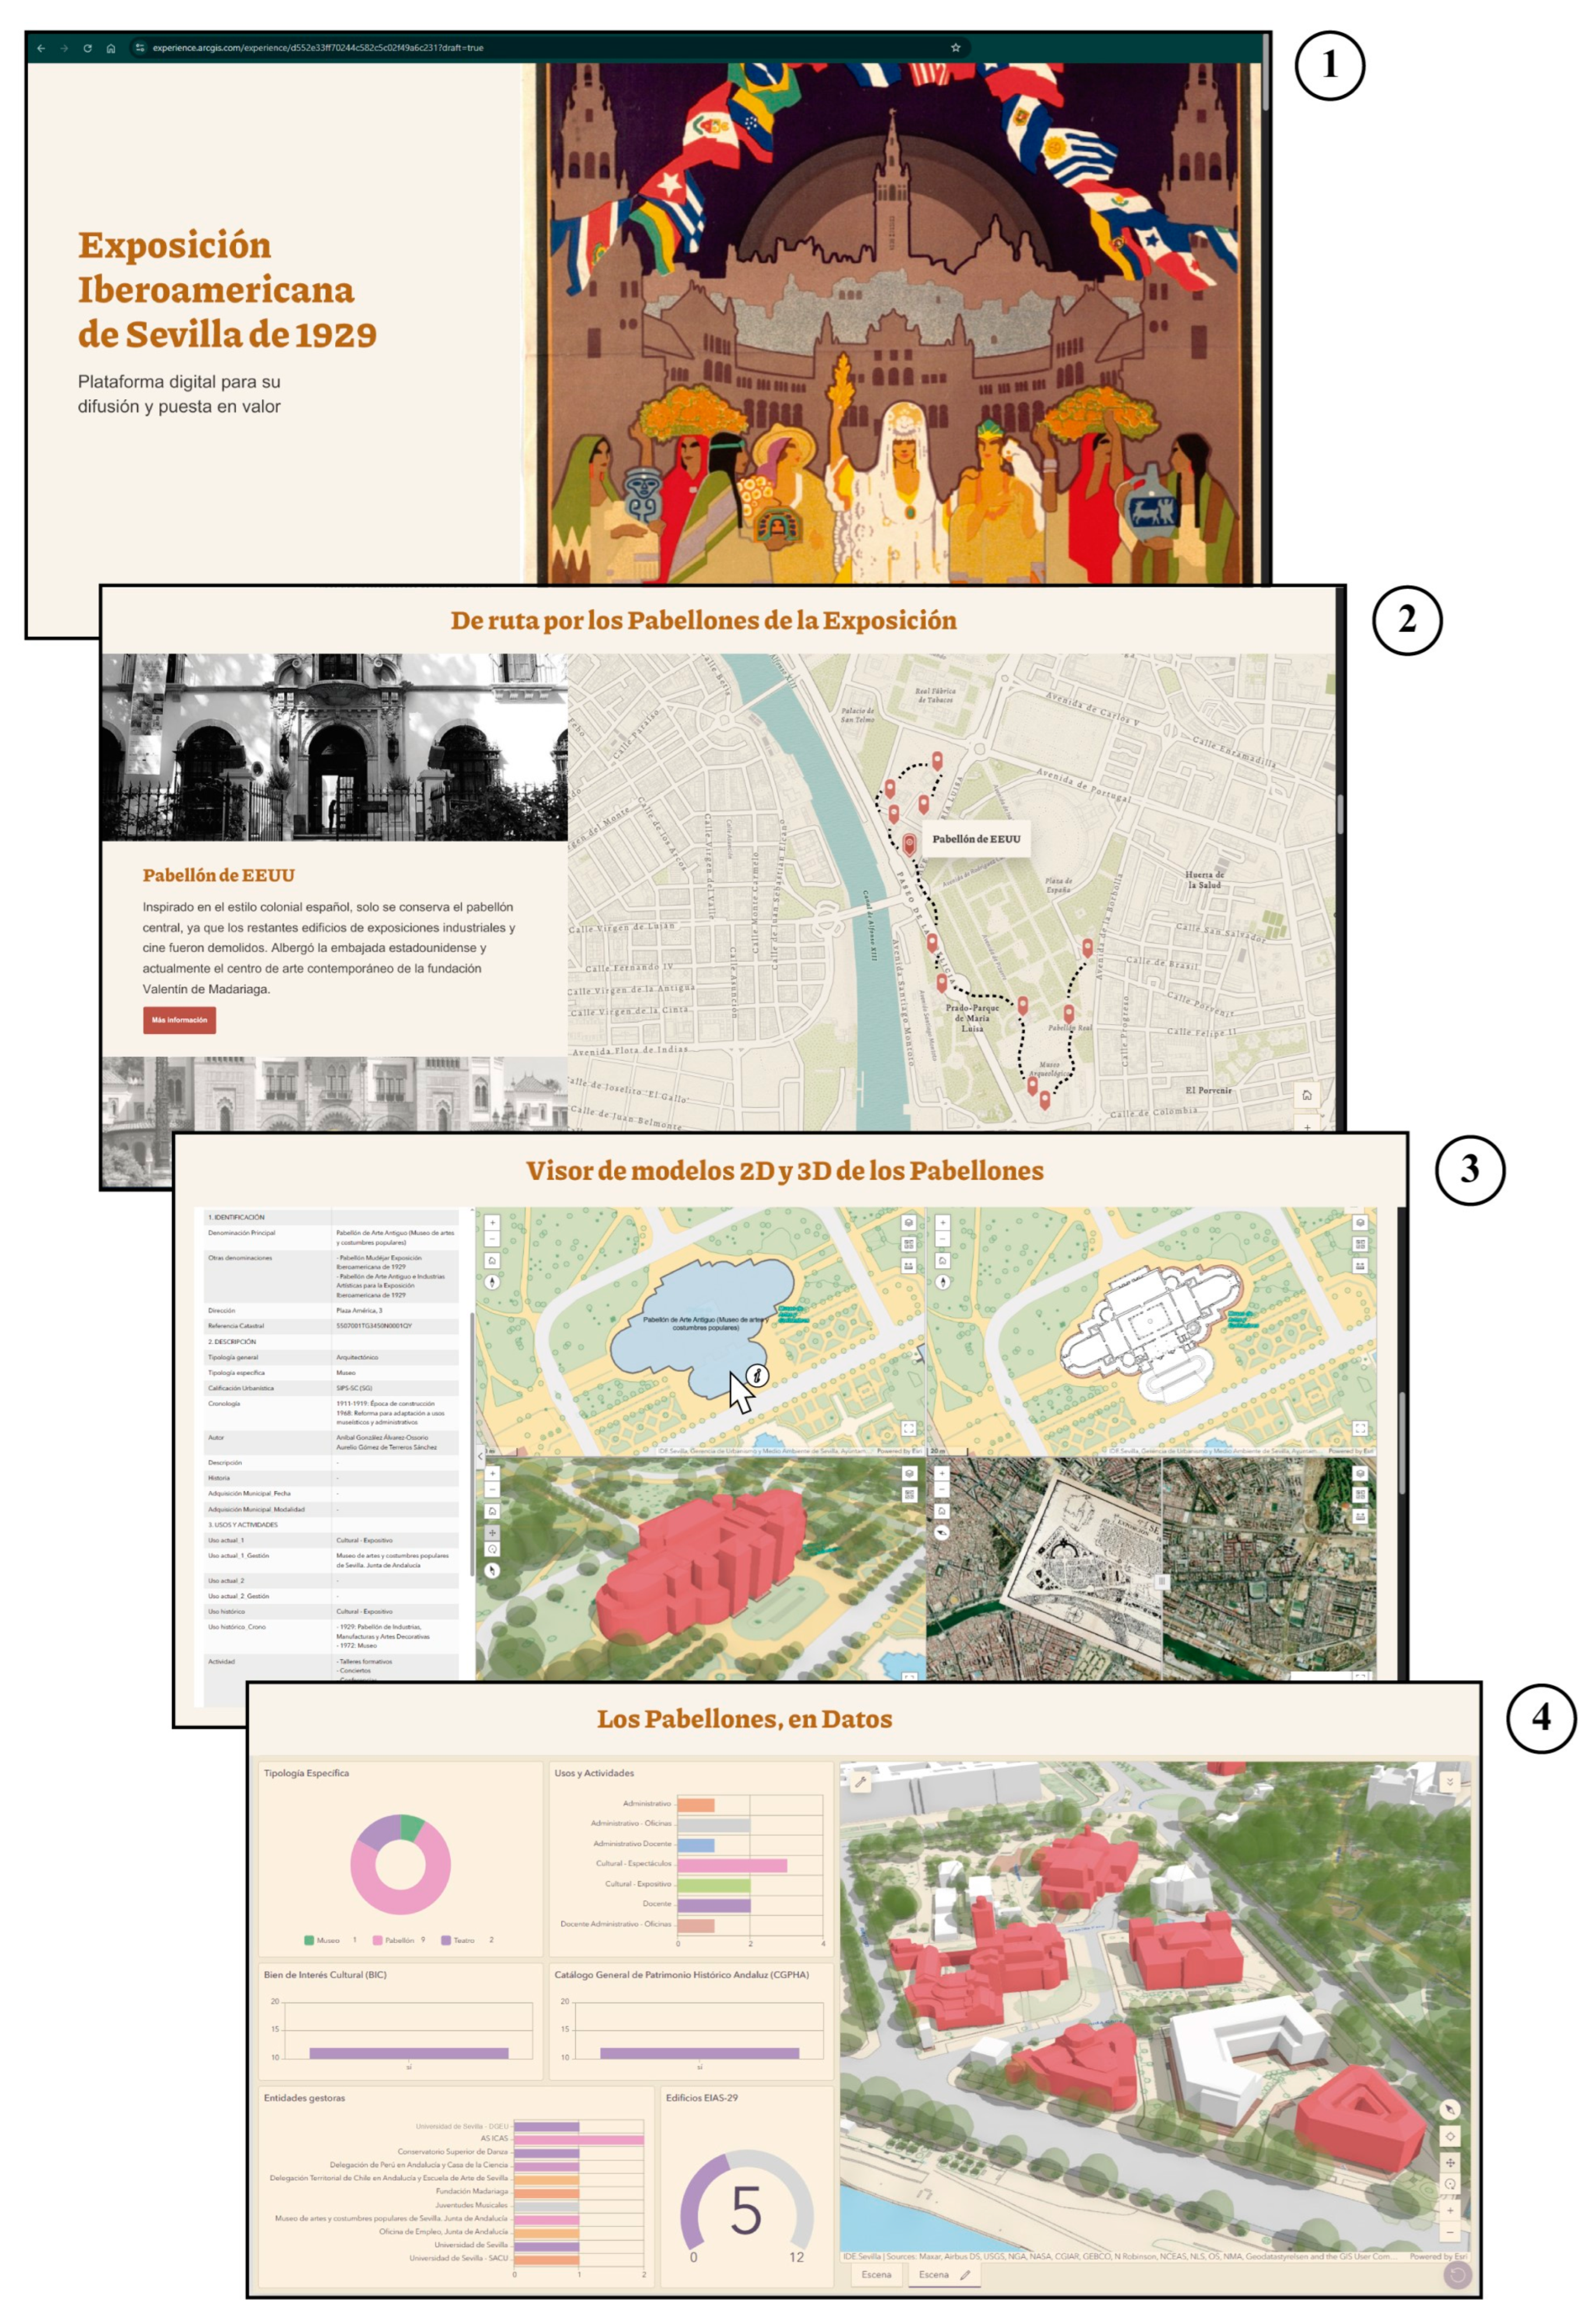
These geometric and semantic data are the core of the web mapping application (WMA) developed for this PC area, which is integrated by different geographic web services, including 2D web maps, 3D web scenes, story maps, and dashboards.
Figure 12 shows some results of this integration. The story map was used for planning a map tour around the 12 EIAS-29 pavilions considered in this research, giving a general overview of the exhibition and of each pavilion. The 2D web maps and 3D web scenes were included in a viewer where a user can query the semantic data of the table [view_dissemination_valorisation] for each pavilion, display the different level floorplans included, navigate in a 3D environment and swipe the georeferenced historic cartography over orthoimages. Finally, thanks to the terminological standardisation that has made it possible to generate domains for the corresponding DB fields, the semantic data of the pavilions for this PC area have been analysed and are included in a dashboard integrated in the WMA. The graphs resulting from the analysis are linked to the 3D web scene, allowing users to filter all the 3D GIS models according to criteria they establish.
5. Discussion
This research demonstrates that GIS-based methodologies can offer valuable opportunities for PC of heritage assets, particularly in contexts where traditional digital approaches such as HBIM may be challenging to implement due to resource constraints. Rather than seeking to replace these established methods, our approach provides an alternative or complementary pathway that leverages GIS tools to manage heritage information effectively at different scales.
5.1. Methodological Innovation and Practical Value
A core strength of this methodology lies in its flexibility and integration capabilities, which address the limitations frequently encountered in previous studies that often deal with PC areas in a fragmented manner. By designing a robust relational database structure and establishing a CDE, this research achieves an unprecedented integration of five key PC areas: active follow-up, damage detection and assessment, risk analysis, maintenance, and dissemination and valorisation. The conceptualization of ULAs is a fundamental innovation that enables flexible, multi-scale information management, bridging the gap between large-scale territorial analyses and detailed building-level management. The database proposal—including the standardisation criteria and data structure tailored for heritage domain—addresses challenges noted in literature regarding the adaptation of digital modelling methods to historic buildings, where non-standard architectural elements and unique conservation parameters often complicate the use of traditional BIM standards. In that sense, the proposal also enhances data management efficiency, avoiding the inclusion of irrelevant predefined parameters typically found in existing BIM standards.
Furthermore, the methodology’s adoption of simplified 2D and 3D-GIS models generated through semi-automated procedures (LOD2 from public remote sensing data and LOD4 from geo-referenced CAD drawings) significantly reduces the cost and technical barriers associated with heritage digitisation. This resource-efficient alternative to traditional CAD/BIM methods makes PC methodologies more accessible to institutions with limited resources, proving particularly useful in contexts where a high level of geometric fidelity is not required. While these models possess less geometric detail than those generated via CAD/BIM, they were found to be sufficient for managing data across the different PC areas and scales. It is acknowledged that this approach is not intended as a replacement for CAD/BIM, which offers significant geometric strengths. A potential future direction involves developing strategies for interoperability to incorporate CAD/BIM geometries into the proposed CDE.
5.2. System Robustness, Interoperability and Usability
The system’s robustness and interoperability are underscored by commitment to software independence and long-term sustainability. Although some parts of the 3D modelling process are performed using ArcGIS Pro, all semantic and geometric data are stored in generic formats within PostgreSQL/PostGIS, which adhere to OGC standards. This ensures that the methodology remains robust against future software upgrades or changes in platform preferences, thereby addressing one of the principal limitations commonly observed in custom-built heritage management systems. The use of open standards not only allows integration with both proprietary (ArcGIS Pro) and open-source software (QGIS) but also provides flexibility for adapting the system to diverse technological environments. However, it must be noted that certain advanced 3D visualisation functions, particularly those related to “Multipatch” geometries, still depend on proprietary tools, which may not be available or affordable in all institutional and private contexts.
Regarding usability, a crucial consideration for implementing this methodology as a practical management tool is the level of technical skill required. While designing and managing the relational database and GIS workflows demands advanced knowledge of spatial data management, the proposed system has been structured to accommodate users with varying levels of expertise. For less technically advanced users, the integration of WebGIS platforms, such as ArcGIS Online, enables the creation of intuitive dashboards and web applications. These interfaces allow stakeholders—including building administrators, heritage managers, and policymakers—to visualise, query, and generate reports from the data without requiring direct interaction with complex GIS or database environments. It has also proved valuable for supporting fieldwork, albeit requiring careful control for updating the main database. Future work will focus on expanding and refining these user-friendly interfaces to further reduce technical barriers and enhance accessibility for a broader range of users.
5.3. Implementation Effort and Limitations
Another important practical consideration concerns the time required to set up and operate the system. For the case study of EIAS-29, the initial development of the PostgreSQL/PostGIS database structure and the configuration of the GIS workflows required approximately three to four months, considering the design, testing, and integration phases. Once the system was established, the time needed to model the EIAS-29 pavilions —including data collection, vectorisation, semantic data entry, and the creation of simplified 2D-3D models—ranged from one to two weeks for the 12 pavilions in LOD2 including its context, and approximately two weeks per pavilion in LOD4. This duration depended significantly on the availability and quality of existing documentation. Buildings with more complex geometries or limited existing data required additional manual processing and field surveys. These timeframes highlight the considerable initial investment necessary for system development but also indicate the efficiency gains achieved for subsequent modelling tasks once the infrastructure and workflows are in place.
While the proposed GIS-based methodology has demonstrated promising results in managing PC data for the pavilions of EIAS-29, several limitations should be noted affecting both the specific case study and the broader scalability. For the EIAS-29 pavilions, the availability and quality of geometric and semantic data were critical to the success of this research. In other heritage sites, similar levels of documentation may not exist, potentially limiting the applicability of the methodology without additional data acquisition efforts. The modelling of 3D geometries relied partially on semi-automatic methods using public LIDAR data, DEMs, and cadastral information specific to Spain. In other regions, equivalent open datasets may be unavailable or have lower resolution, reducing the feasibility of replicating these workflows without proprietary data or extensive field surveys. Additionally, it should be noted that the proposed database schema and ULAs were tailored to architectural typologies and construction systems prevalent in Andalusian heritage. Applying this structure to sites with different architectural traditions may require adaptation, mostly regarding terminological standardisation. Lastly, WebGIS deployment is subject to limitations in collaborative editing and real-time synchronisation between cloud services and local databases, which could become more significant when managing larger or multi-site heritage systems. Solutions for enhanced WebGIS collaboration include utilising ArcGIS Enterprise or adopting open-source architectures.
Another significant challenge in replicating this approach across other heritage systems concerns navigating the complex landscape of diverse stakeholders, including owners, managers, and users, each operating with distinct interests and within different policy frameworks. In the case of the EIAS-29 study, this complexity was relatively well addressed, largely because most of the pavilions were municipally owned and stakeholder collaboration was strong. This facilitated both access to the assets themselves and to associated data. By contrast, heritage systems characterised by more fragmented ownership structures or undocumented administrative contexts may present considerable obstacles to implementing a unified CDE. Developing a shared management strategy in such contexts necessitates not only the alignment of these varied perspectives but also the reconciliation of existing individual policies, all while articulating a cohesive vision that fosters standardisation and improves the efficiency of PC processes.
Despite these limitations, the proposed methodology provides a solid foundation that can be adapted and expanded to fit diverse heritage contexts, making it a valuable starting point for future developments.
6. Conclusions
This research demonstrates the viability of implementing a GIS-based methodology as a CDE for the PC of complex heritage systems, exemplified through the case study of the pavilions of the EIAS-29. The proposed spatial database successfully integrates heterogeneous data from diverse PC areas, supporting multi-scale analysis and offering a flexible and interoperable tool for heritage management.
The results confirm that simplified 2D and 3D-GIS models, coupled with well-structured relational databases, can effectively support PC tasks without necessarily resorting to more demanding modelling techniques such as HBIM. This approach provides a resource-efficient alternative, particularly beneficial for stakeholders with limited economic or technical capacities, while still ensuring sufficient detail for technical inspections, risk assessments, and informed decision-making processes.
Furthermore, the methodology fosters collaborative workflows among stakeholders, enhancing accessibility, transparency, and dissemination of heritage data. The development of a WebGIS environment extends the usability of the spatial database, facilitating broader engagement from professionals, researchers, and the public.
Future work could focus on improving the data input process, which was carried out manually in the current study. Developing DB-linked forms with user-friendly interfaces for each PC area would make data entry during fieldwork easier. Configuring the database to accept real-time data inputs, such as from monitoring tasks, would enable action plans based on continuously updated risk evaluations. The integration of machine learning and deep learning techniques also holds significant potential. These could leverage the database’s graphic content for automated damage analysis or trend detection in monitoring data, and their results could inform database updates, potentially automating the generation of maintenance tasks or simulating future risk scenarios.
Moreover, the replicability of the proposed method could be further assessed by integrating it within existing spatial data infrastructures (SDIs), leveraging their established frameworks for spatial data sharing and standardisation. In this regard, this strategy not only promotes more efficient and collaborative heritage management but it also aligns with the fundamentals of the UN 2030 SDGs, particularly in terms of digitisation for promoting smart and sustainable cities.
The outcomes of this study contribute to advancing the digital transformation of heritage conservation practices, providing a practical framework that balances technical requirements, cost efficiency, and the holistic needs of preserving cultural heritage in complex urban environments.
