Article

Seismic Safety Analysis of Nuclear Power Plant Pumping Stations Using the Compact Viscous-Spring Boundary via Maximum Initial Time-Step Method

1
College of Civil Engineering and Architecture, Dalian University, Dalian 116622, China
2
Department of Civil and Hydraulic Engineering, Dalian University of Technology, Dalian 116024, China
*
Author to whom correspondence should be addressed.
Buildings 2025, 15(16), 2951; https://doi.org/10.3390/buildings15162951
Submission received: 28 July 2025 / Revised: 13 August 2025 / Accepted: 19 August 2025 / Published: 20 August 2025
(This article belongs to the Section Building Structures)

Abstract

Pumping station structures are widely employed to supply circulating cooling water systems in nuclear power plants (NPPs) throughout China. Investigating their seismic performance under complex heterogeneous site conditions and load scenarios is paramount to meeting nuclear safety design requirements. This study proposes and implements a novel, efficient, and accurate viscous-spring boundary methodology within the ANSYS 19.1 finite element software to assess the seismic safety of NPP pumping station structures. The Maximum Initial Time-step (MIT) method, based on Newmark’s integration scheme, is employed for nonlinear analysis under coupled static–dynamic excitation. To account for radiation damping in the infinite foundation, a Compact Viscous-Spring (CVs) element is developed. This element aggregates stiffness and damping contributions to interface nodes defined at the outer border of the soil domain. Implementation leverages of ANSYS User Programmable Features (UPFs), and a comprehensive static–dynamic coupled analysis toolkit is developed using APDL scripting and the GUI. Validation via two examples confirms the method’s accuracy and computational efficiency. Finally, a case study applies the technique to an NPP pumping station under actual complex Chinese site conditions. The results demonstrate the method’s capability to provide objective seismic response and stability indices, enabling a more reliable assessment of seismic safety during a Safety Shutdown Earthquake (SSE).

1. Introduction

Amidst escalating depletion of conventional energy resources and mounting environmental challenges, nuclear power has emerged as a pivotal clean energy solution, experiencing substantial advancement within China’s energy sector in recent years. Ensuring the safe and reliable operation of nuclear power plants (NPPs) critically depends on their supporting maritime infrastructure. This encompasses essential facilities such as circulating cooling water systems and protective coastal/offshore structures, which constitute vital safeguards for plant integrity. The pumping station structures are widely employed to supply circulating cooling water systems in nuclear power plants (NPPs) throughout China. Damage to the pumping station structure during an earthquake will impact the circulating cooling water system and may even result in a nuclear accident [1]. Consequently, pumping station structures warrant classification as nuclear safety-related facilities. Seismic resilience of critical NPP infrastructure has remained a primary research focus over the past decade, particularly intensified following the Fukushima Daiichi accident [2,3,4]. Existing seismic assessment methodologies predominantly address reactor containment structures [5,6], nuclear-grade piping systems [7], seismically isolated safety facilities [8], intake structures protecting pumping stations [9], and concrete drainage culverts [10]. In contrast, published research specifically addressing the seismic performance of NPP pumping station structures under complex site conditions and coupled loadings during seismic events remains notably limited.
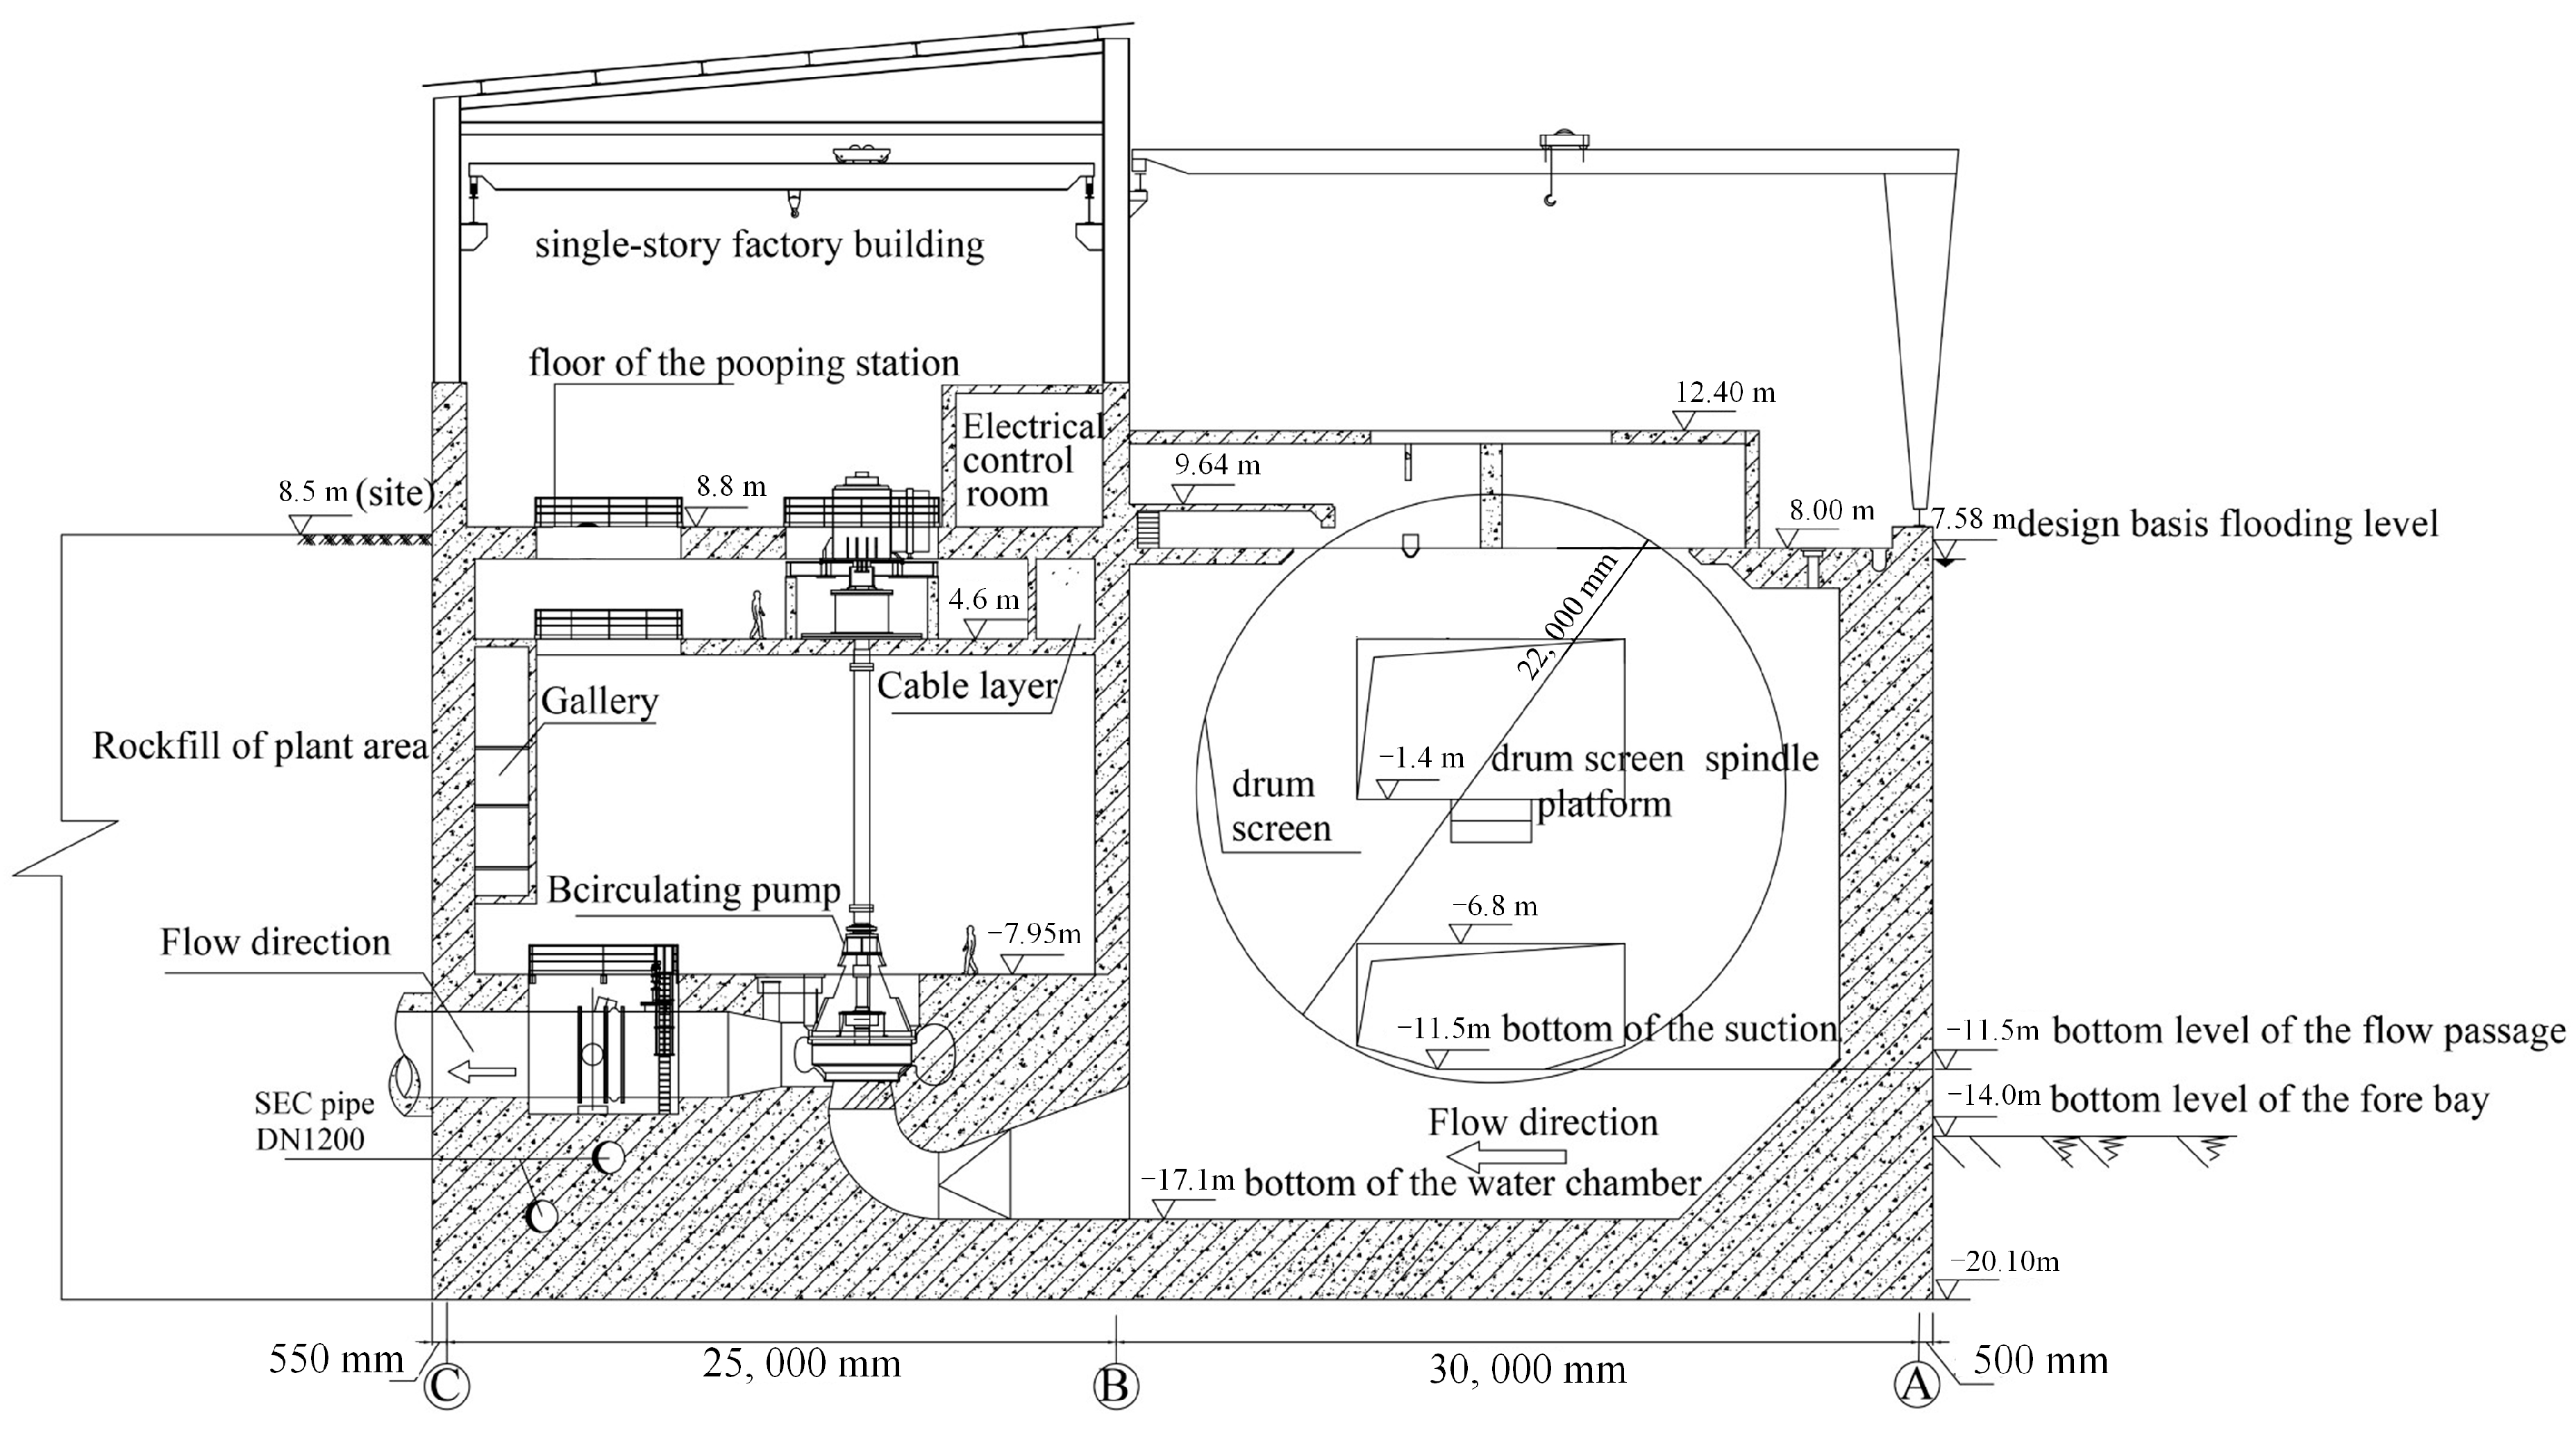
The pumping station structure in NPPs always consists of a single-story factory building above ground and an underground reinforced concrete box-foundation, of which the underground part has one side facing the fore bay, as shown in Figure 1. Consequently, it experiences coupled static–dynamic loading during earthquakes. The finite element (FE) method stands as a cornerstone methodology in civil engineering for simulating structural and geotechnical mechanics. Its unparalleled versatility enables the modeling of complex geometries, heterogeneous materials, coupled multi-physics loadings, and intricate nonlinear material responses. A fundamental limitation arises, however, when applying the FE method to unbounded domains, such as soil foundations. Accurately capturing wave propagation phenomena, particularly radiation damping, necessitates an impractically large soil mesh, leading to prohibitive computational demands [11]. To retain the inherent strengths of FE analysis while circumventing this critical constraint for seismic structure–soil interaction problems, researchers have developed specialized techniques. These include hybrid simulation approaches, the Damping Solvent Stepwise Extraction (DSSE) method, and advanced absorbing/side boundary models.
Hybrid simulation methodologies achieve enhanced accuracy by strategically partitioning the problem domain: the FE method resolves the localized domain encompassing the structure and adjacent near-field irregularities, while unbounded media are modeled via either the boundary element (BE) method [12] for direct wave propagation analysis or the Scaled Boundary Finite Element (SBFE) method [13] for computationally efficient semi-analytical solutions. Unfortunately, the BE method poses certain limitations in solving complicated practical engineering problems owing to its reliance on the fundamental solution for many cases [14,15]. When the hybrid FE-SBFE method is applied to a time-domain analysis, its inherently global spatiotemporal solution formulation imposes significant practical constraints. Geometric configuration and material homogeneity requirements stemming from scaling center selection restrict application to complex real-world systems [16,17]. To circumvent these limitations, Yin et al. [18] pioneered a three-dimensional Damping Solvent Stepwise Extraction (DSSE) framework capable of modeling large-scale structural systems founded upon unbounded viscous-spring soil domains with full nonlinear seismic response capabilities. However, the stepwise extraction approximation inevitably accumulates errors with each incremental extraction, causing the dynamic stiffness to eventually deviate from the true infinite ground dynamic stiffness. Side boundary models trace their origins to the late 1960s, approximating radiation damping by emulating wave propagation theory through differential operators engineered to suppress spurious wave reflections at truncated domain interfaces.
Regulatory frameworks for seismic design of nuclear power plants (NPPs) in China [19] mandate the implementation of wave-absorbing boundaries—including viscous [20], viscoelastic [21], and transmitting [22] boundaries—for safety analysis of nuclear structures. However, contemporary seismic assessment of pumping station infrastructure demands unprecedented analytical sophistication to address advanced constitutive modeling of nonlinear material behaviors, complex multi-excitation scenarios, and high-fidelity structure–soil interaction. Compounding these challenges, the diminishing availability of ideal sites necessitates deployment on heterogeneous geological strata, substantially increasing computational complexity. Consequently, developing an integrated computational methodology enabling efficient yet rigorous static–dynamic coupled analysis has become critically imperative for reliable safety evaluation.
This research presents an integrated computational methodology for static–dynamic coupled analysis of nuclear pumping station structures, incorporating a novel viscous-spring boundary within ANSYS. The approach develops a Compact Viscous-Spring (CVs) element to model radiation damping in unbounded domains, while establishing a time-domain solution framework through synthesis of the Maximum Initial Time-step (MIT) method with the implicit Newmark integration scheme. Implementation leverages ANSYS User Programmable Features (UPFs) to embed the methodology’s computational kernel, creating an extensible simulation platform. Validation via two case studies precedes application to a pumping station under actual site seismic conditions, demonstrating the framework’s efficacy in resolving complex soil–structure interaction phenomena critical for nuclear safety assessment.

2. The Compact Viscous-Spring Boundary Based on MIT Method

This section establishes a time-domain computational framework for static–dynamic coupled systems through integration of the Maximum Initial Time-step (MIT) method with a novel Compact Viscous-Spring (CVs) boundary model.
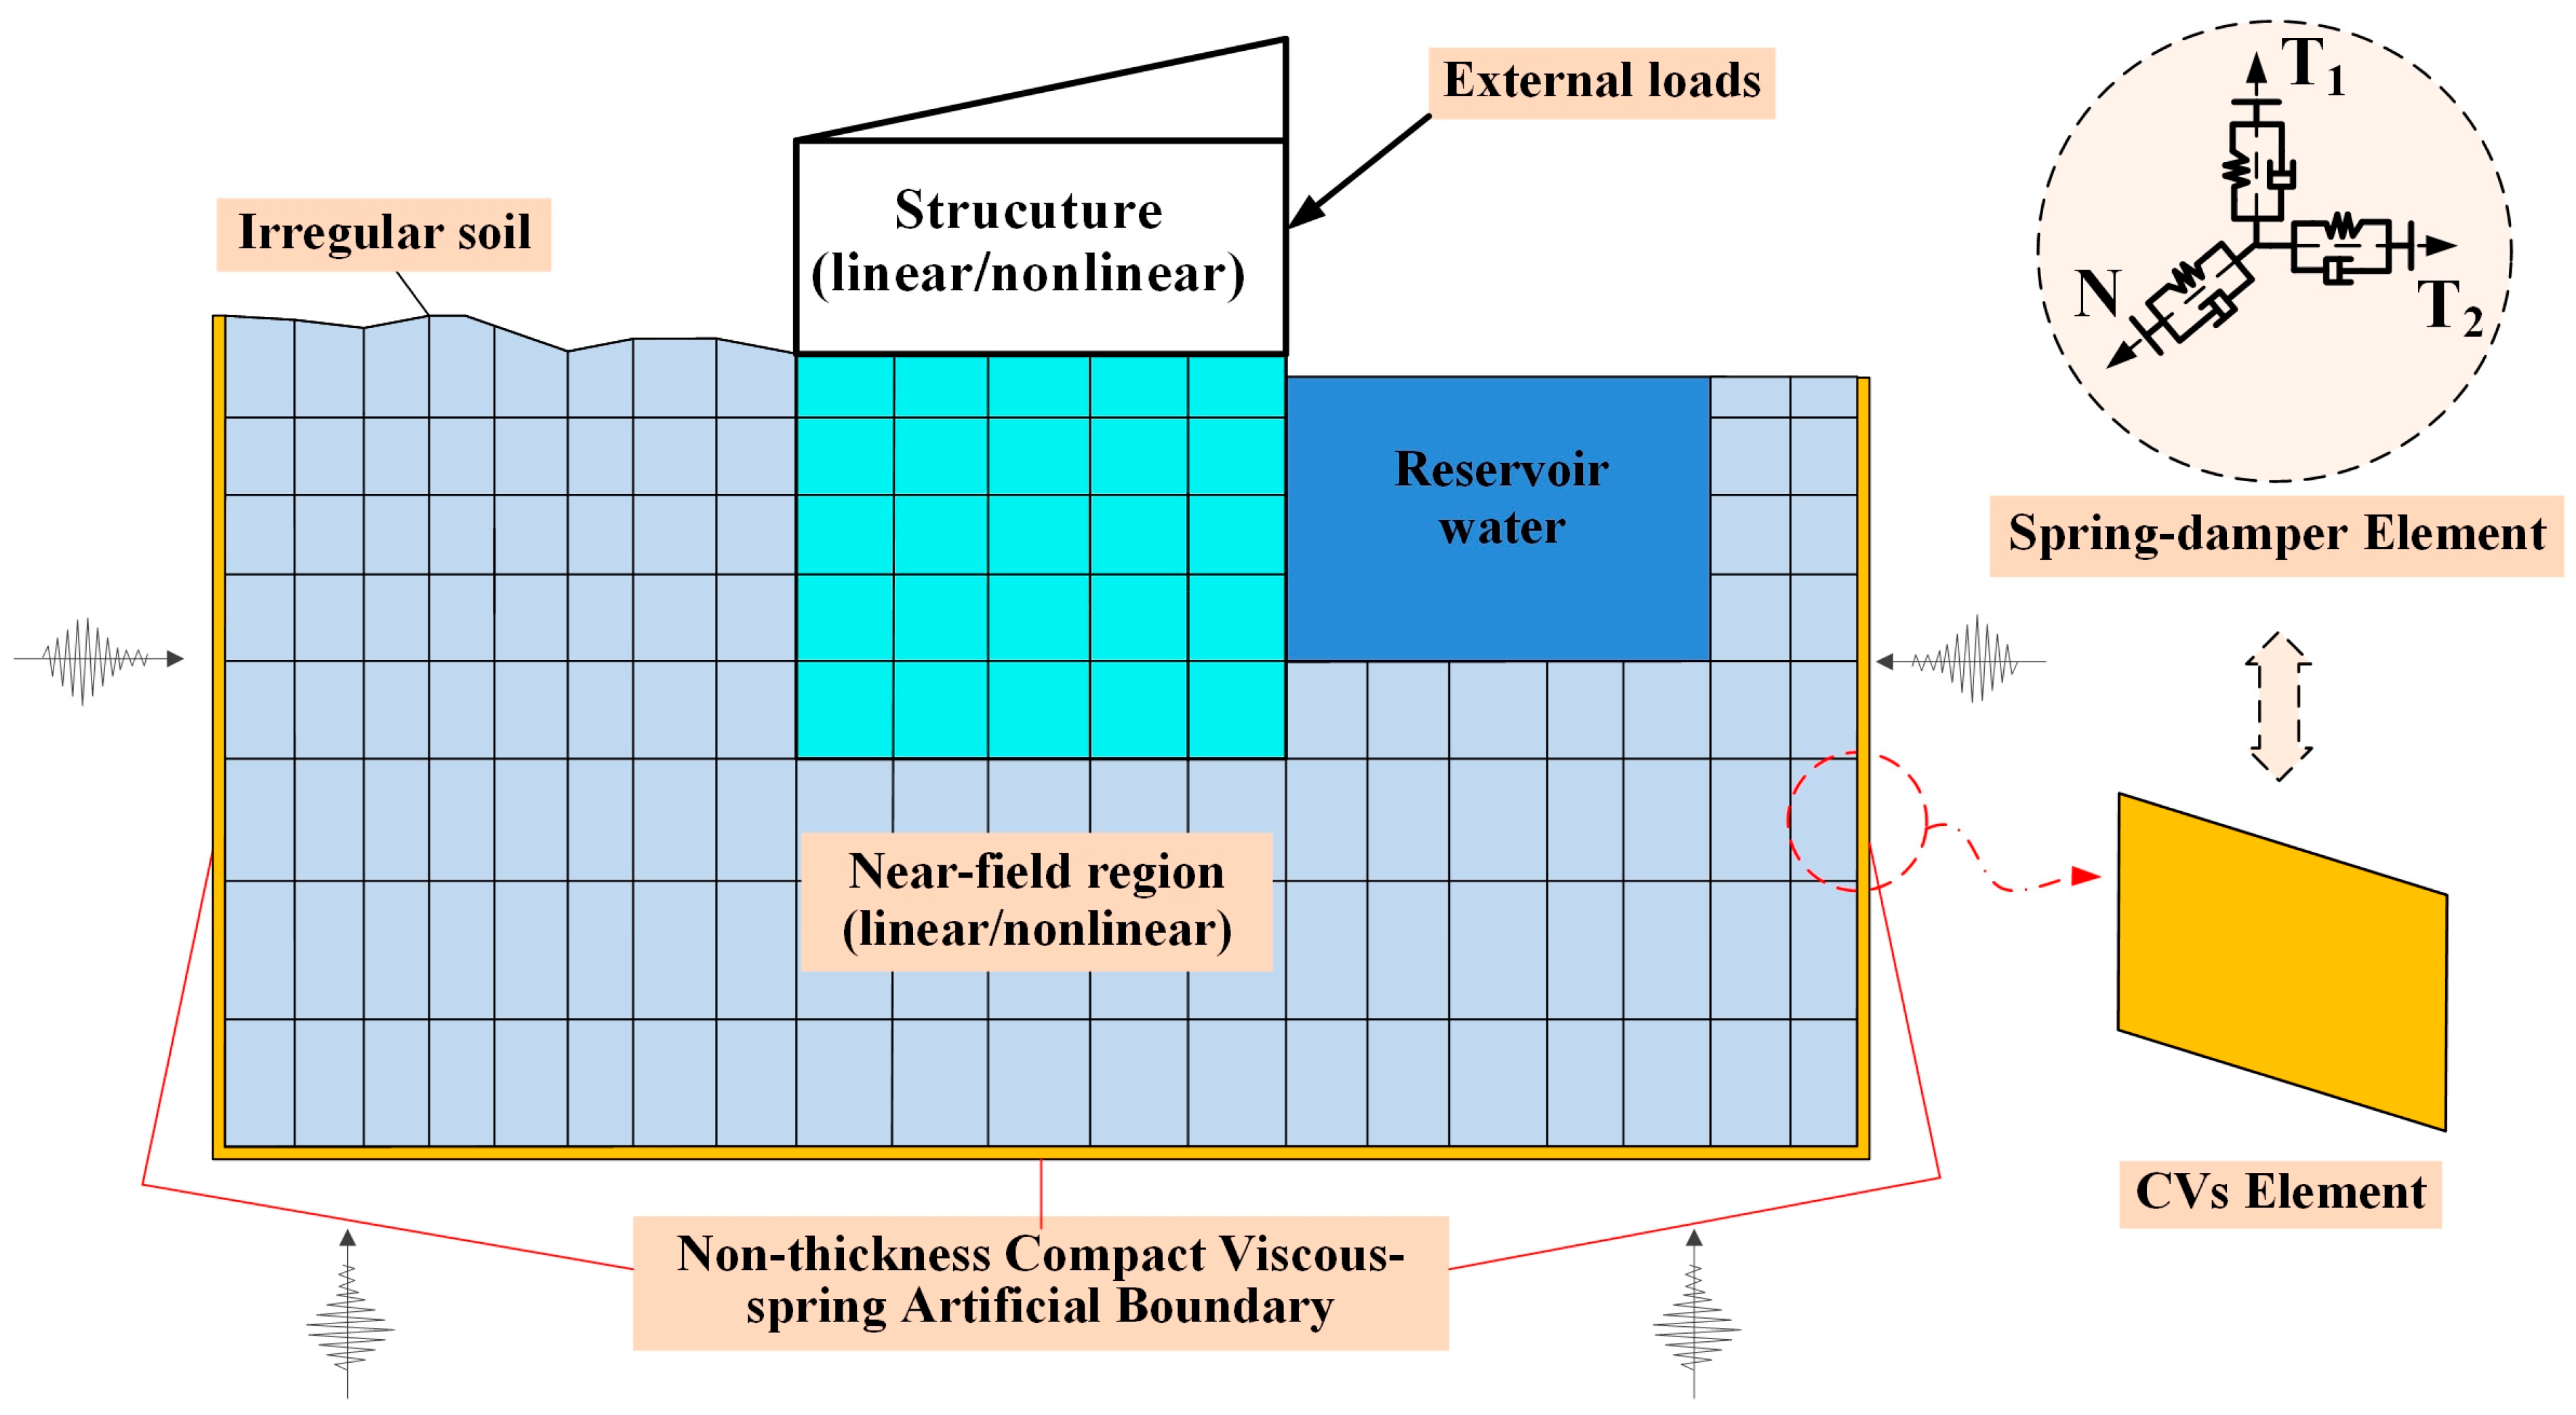
Figure 2 schematically depicts the static–dynamic coupled analysis framework employing the viscous-spring boundary methodology. This configuration utilizes solid elements to discretize near-field domains with geological complexity, while nonlinear structural systems exhibiting constitutive complexity and geometric irregularity are characterized through specialized finite elements. And the entire system is also excited by the static loads from rockfill or reservoir water and the seismic motion from the far field. As mentioned above, the viscous-spring artificial boundary condition consists of introducing the viscous dashpots and springs at the outer boundary to attenuate both outgoing and reflected waves based on the theory of wave propagation, resulting in negligible amplitudes when reaching the outer boundary. Consequently, wave energy attenuation within this formulation yields near-field motions equivalent to an unbounded domain’s free-field response. The methodology delivers enhanced solution fidelity and broadband frequency stability in modeling radiation damping mechanisms—attributes enabling seismic performance assessment for critical infrastructure.
Conventional viscous-spring artificial boundary necessitates a discrete spring-damper element at each boundary node, as schematically illustrated within the dashed enclosure in Figure 2. The parameters of the physical items on the nodes can be obtained from Equation (1).
K B N = α N G R i = 1 l A i ,               C B N = ρ c p i = 1 l A i K B T = α T G R i = 1 l A i ,                 C B T = ρ c s i = 1 l A i
where K and C are the stiffness and damping of the physical items, respectively. The subscripts N and T denote the normal and tangential, respectively. These parameters derive from fundamental properties: shear modulus G, mass density ρ, and seismic wave propagation velocities (cp: P-wave, cs: S-wave). Geometric considerations include R (radial distance from boundary node to wave source) and Ai (area associated with node i, where subscript i indexes the number of areas around the node). αN and αT are the modified coefficients, respectively. Through parameter analysis and some example tests, the numerical solution only slightly varies with the change in the modified parameters around the recommended value: αN = 1.33 and αT = 0.67 [21].
Considering the soil–structure dynamic interaction model as a complete system only under the seismic excitation, the dynamic equilibrium is governed by the following:
M s s 0 0 M b b u ¨ s u ¨ b + C s s C s b C b s C b b + C b u ˙ s u ˙ b + K s s K s b K b s K b b + K b u s u b = 0 F b
where [K], [C], and [M] represent the stiffness matrix, damping matrix, and mass matrix, respectively. { u ¨ } ,   u ˙ , and {u} represent acceleration, velocity, and displacement, respectively. The subscript s denotes nodes inside bounded soil, and b denotes the nodes on the outer boundary; {Fb} is the equivalent nodal load vector, that is, F b = K b u b f + C b u ˙ b f + R b f , where   R b f quantifies the interaction load arising from free-field excitation when physical components achieve complete dissipation of scattered wave energy.
Although the conventional model can simulate the dynamic characteristics of the pumping station structure, disastrous results will be obtained from multi-load excitation. This is due to several significant limitations of the viscous-spring boundary in finite element analysis. For example, it fails to adequately account for static–dynamic coupling effects, particularly in nonlinear scenarios involving material nonlinearity, geometric nonlinearity, or contact nonlinearity. Secondly, the determination of spring-damping coefficients becomes significantly challenging when dealing with complex heterogeneous materials characterized by spatial variations in material properties and anisotropic behavior. Furthermore, the implementation of spring elements proves to be computationally cumbersome and time-consuming. Most critically, this approach demands substantial computational resources, with the spring elements occupying extensive memory storage and requiring prolonged computation time during matrix operations. These inherent constraints collectively restrict the scope of practical implementation and computational efficiency, particularly when analyzing large-scale engineering structures or conducting sophisticated dynamic simulations. Based on this, the authors develop the Compact Viscous-Spring (CVs) boundary model based on the MIT method for static–dynamic coupled analysis.

2.1. The CVs Element

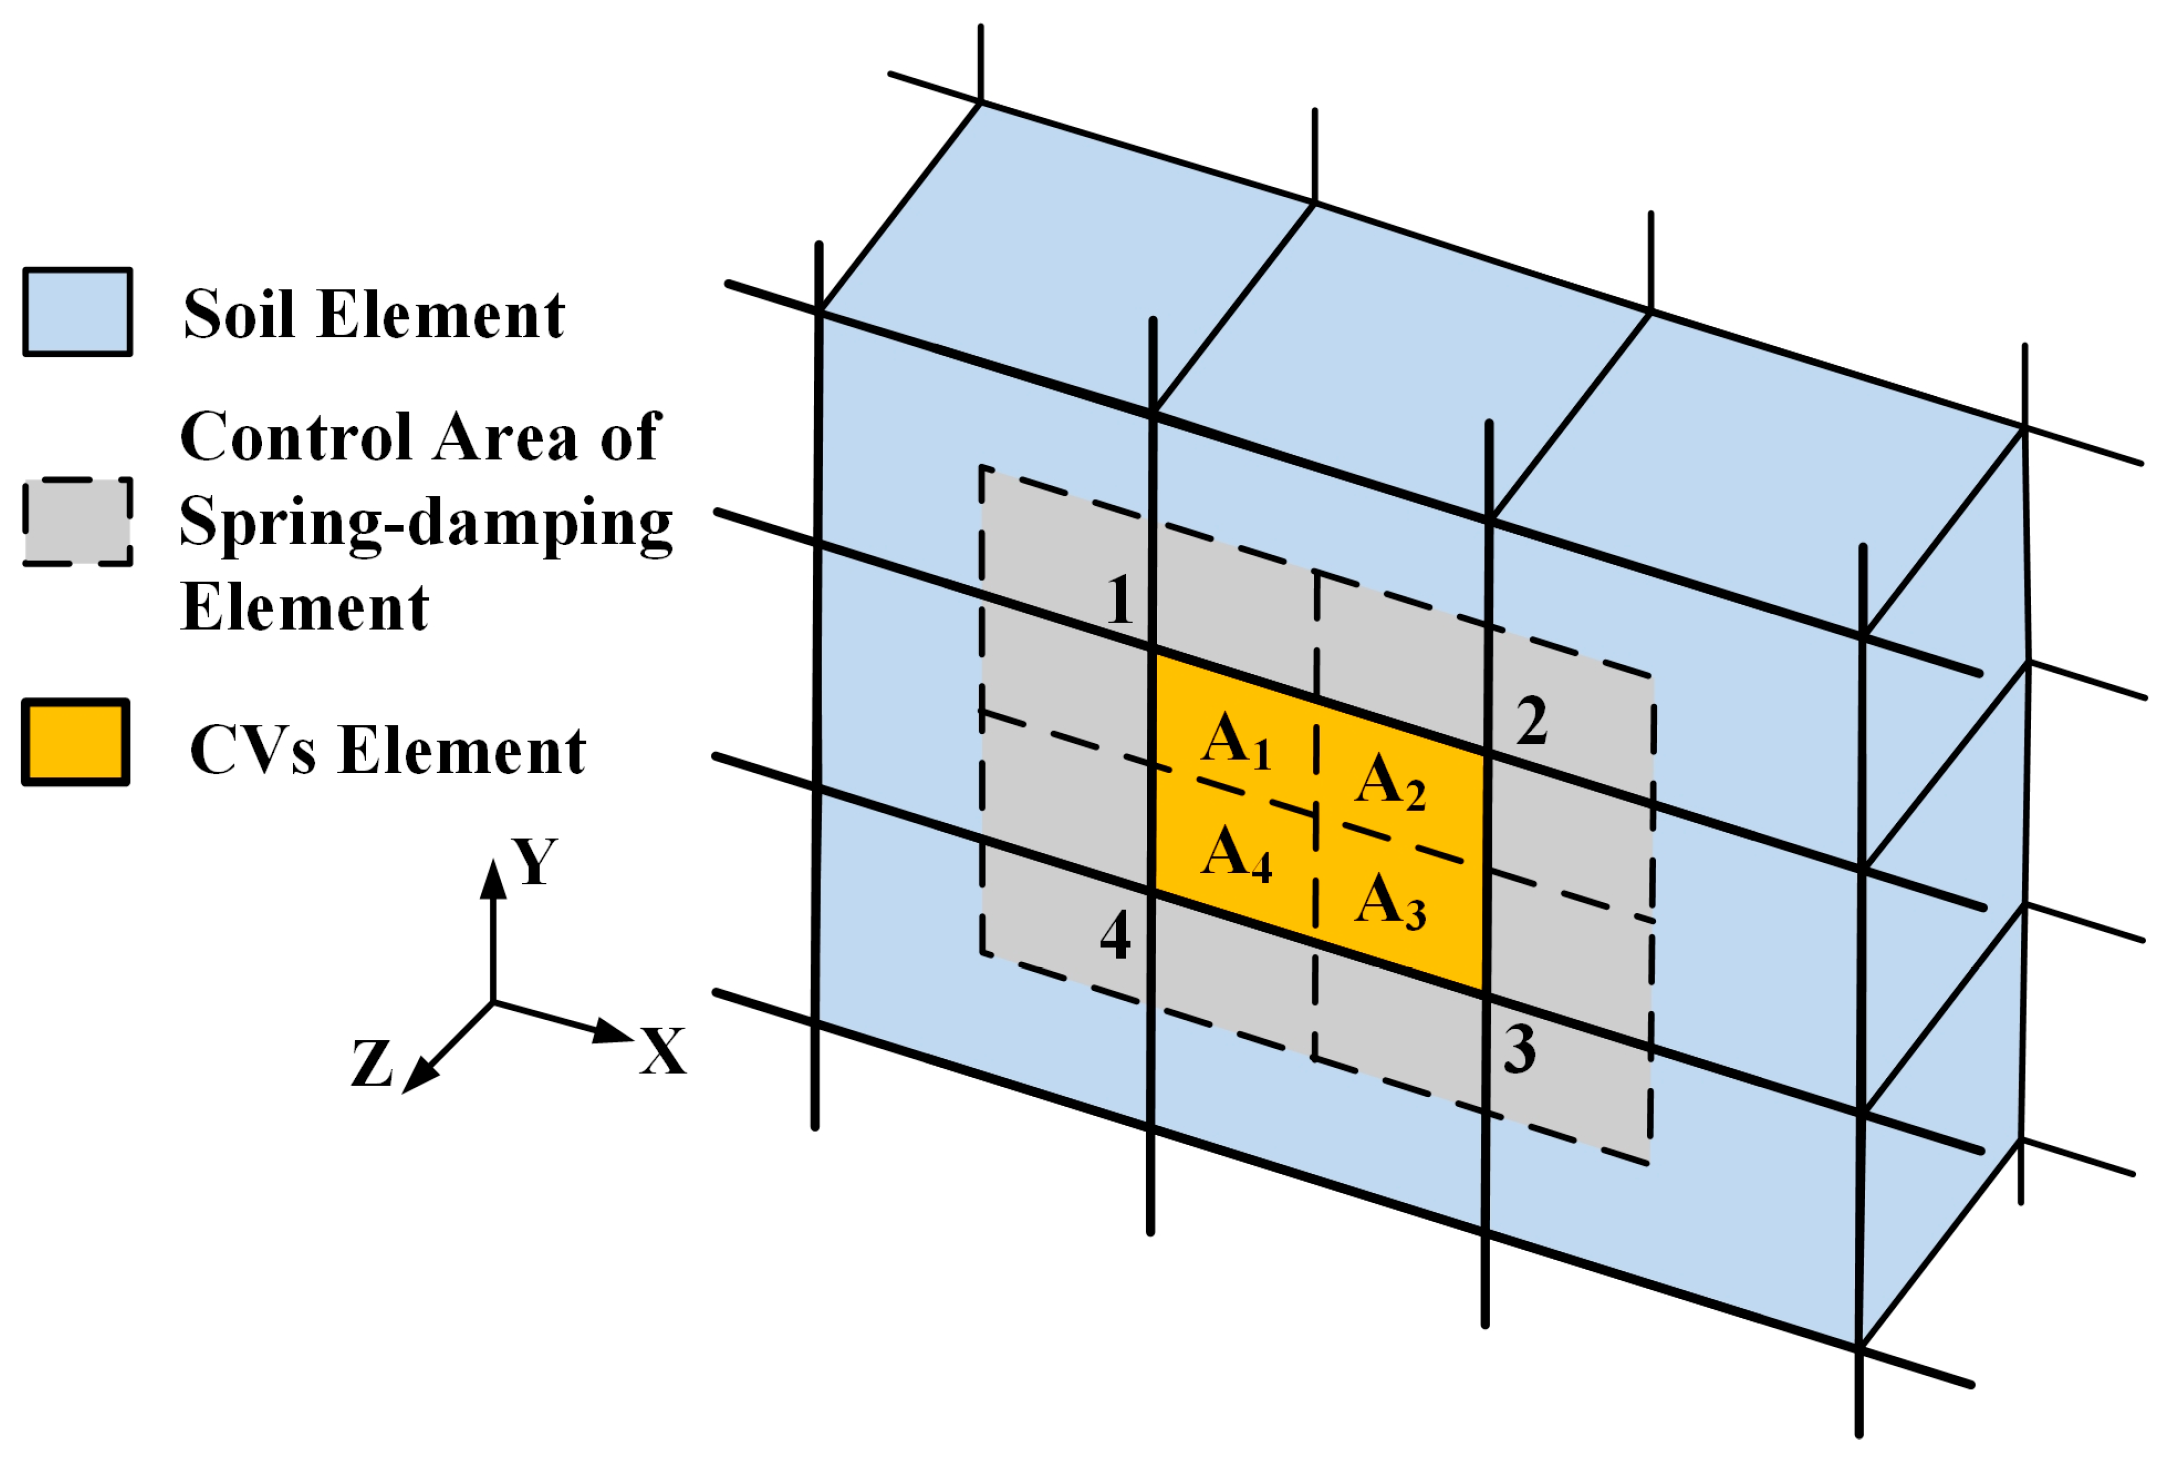
Figure 3 illustrates the enhanced implementation viscous boundary formulation featuring a non-thickness Compact Viscous-Spring (CVs) interface element for soil–structure systems. This boundary element directly interfaces with the existing nodal topology at soil–structure interfaces and lateral boundaries. Near-field domains are discretized using solid elements capturing complex geostratigraphic configurations, while the complete assembly is subjected to simultaneous static geostatic pressures and far-field seismic excitation.
Figure 3 presents the geometric configuration of a non-thickness CVs interface element featuring a quadrilateral topology with four nodes. According to theoretical deduction, a viscous-spring artificial boundary is a simulation of external boundary stress conditions, so the established CVs element is only a correction of the total stiffness matrix and damping matrix, and the element itself has no displacement function and elastic stiffness matrix. Consequently, stiffness and damping contributions from adjacent domains are accumulated at corresponding nodes, yielding a diagonal element matrix. This formulation maintains structural analogy to conventional finite element stiffness and damping matrices, permitting direct assembly into the global system matrix.
The element matrix for the CVs element is defined as follows:
[ K B e ] = d i a g ( k B T A 1 , k B T A 1 , k B N A 1 , k B T A 2 , k B T A 2 , k B N A 2 , k B T A 3 , k B T A 3 , k B N A 3 , k B T A 4 , k B T A 4 , k B N A 4 )
[ C B e ] = d i a g ( c B T A 1 , c B T A 1 , c B N A 1 , c A 2 , c A 2 ,                               c B N A 2 , c B T A 3 , c B T A 3 , c A 3 , c B T A 4 , c B T A 4 , c B N A 4 )
with
k B T = α T G R ,             c B T = ρ c s     k B N = α N G R ,             c B N = ρ c p
Adopting the fundamental postulate of perfect scattered wave energy dissipation within CVs elements, the resultant wavefield superposition manifests as equivalent nodal forces applied at boundary nodes, thereby simulating seismic excitation input. This equivalence yields the CVs element’s nodal load formulation:
F b e = K B e { u b f e } + [ C B e ] { u ˙ b f e } + { R b f e }
where the superscript “e” denotes the physical parameter of CVs element.

2.2. The MIT Method

Figure 2 depicts the static–dynamic coupled analysis system undergoing simultaneous seismic ground motions and sustained static loading regimes. Thus, Equation (1) of motion can be rewritten as follows.
M s s 0 0 M b b u ¨ s u ¨ b + C s s C s b C b s C b b + C b u ˙ s u ˙ b + K s s K s b K b s K b b + K b u s u b = F a F b
where {Fa} represents the static loads vector. After the coupled loads are applied, the Newmark implicit integration [23] can be introduced to solve the time-domain recursively. The basic assumptions of the node velocity and displacement at any time step Δt are as follows:
u ˙ s ( t + Δ t ) u ˙ b ( t + Δ t ) = u ˙ s ( t ) u ˙ b ( t ) + ( 1 β ) Δ t u ¨ s ( t ) u ¨ b ( t ) + β Δ t u ¨ s ( t + Δ t ) u ¨ b ( t + Δ t )
u s ( t + Δ t ) u b ( t + Δ t ) = u s ( t ) u b ( t ) + u ˙ s ( t ) u ˙ t ( t ) Δ t + ( 0.5 α ) Δ t 2 u ¨ s ( t ) u ¨ b ( t ) + α Δ t 2 u ¨ s ( t + Δ t ) u ¨ b ( t + Δ t )
where α and β are the constants of Newmark implicit integration, respectively.
By substituting Equations (8) and (9) into the equation provided by Equation (7), an expression containing only the terms at the end of the time step t + Δt can be obtained, with similar terms appropriately merged. The expression is expressed as follows:
K s s d K s b d K b s d K b b d + K b d ¯ u s ( t + Δ t ) u b ( t + Δ t ) = F a d F ¯ b d
with
K s s d K s b d K b s d K b b d + K b d ¯ = K s s K s b K b s K b b + K b ¯ + a 0 M s s 0 0 M b b + a 1 C s s C s b C b s C b b + C b ¯
F a d F ¯ b d = F a F ¯ b + M s s 0 0 M b b a 0 u s ( t ) u b ( t ) + a 2 u ˙ s ( t ) u ˙ b ( t ) + ( a 3 + 1 ) u ¨ s ( t ) u ¨ b ( t )                                                                             + C s s C s b C b s C b b + C b ¯ a 1 u s ( t ) u b ( t ) + ( a 4 + 1 ) u ˙ s ( t ) u ˙ b ( t ) + a 5 u ¨ s ( t ) u ¨ b ( t )
where  a 0 = 1 α Δ t 2 ;   a 1 = β α Δ t ;   a 2 = 1 α Δ t ;   a 3 = 1 2 α 1 ;   a 4 = β α 1 ;   a 5 = 0.5 Δ t ( β α 2 ) ;   a 6 = Δ t ( 1 β ) ;   a 7 = β Δ t .
Since the response of strong earthquake excitation at the initial time has not yet begun, that is, u ¨ s ( 0 ) = u ¨ b ( 0 ) = u ˙ s ( 0 ) = u ˙ b 0 = u ˙ s 0 = u b ( 0 ) = 0. Therefore, the right term in Equation (12) is only the static load term is not 0. By substituting Equations (11) and (12) into Equation (10), one obtains the structure motion expression as
K s s K s b K b s K b b + K b ¯ u s u b + a 0 M s s 0 0 M b b u s u b + a 1 C s s C s b C b s C b b + C b ¯ u s u b = F a 0
At the same time, it is assumed that the initial time step Δt is maximized, that is, tends to infinity.
l i m Δ t a 0 = l i m Δ t 1 α Δ t 2 = 0
l i m Δ t a 1 = l i m Δ t ( β α Δ t ) = 0
Then, Equation (13), which introduces the effect of the maximum initial time-step, can be rewritten as follows.
K s s K s b K b s K b b + K b ¯ u s u b = F a 0
Generally, the linear static equilibrium equation is shown as follows:
[ K ] { u } = { F }
It can be seen that Equation (16) and the linear static equilibrium Equation (17) are consistent except for some differences in boundary stiffness. The rigid constraint is often used in static analysis, while the CVs artificial boundary is employed in dynamic analysis. In general, the Saint-Venant principle governs static loading scenarios, confining structural influence to near-field foundation regions. When the range of the foundation is large, the above static–dynamic coupled algorithm is similar to the static analysis results. Therefore, assuming the maximum value of the initial time step in the dynamic analysis, the initial step can be equivalent to the static analysis under the coupling of static and dynamic loads, so that coupling analysis of static and dynamic calculations can be realized, which is defined as the MIT method. Furthermore, the stress state induced by static loading provides the initial condition for subsequent dynamic analysis, ensuring solution stability throughout transient response simulation.
It is worth noting that the algorithm is also suitable for nonlinear static and dynamic coupled analysis and is easy to implement in various types of implicit finite element software (e.g., ANSYS), which can avoid the need for traditional load case operations and simplify the post-processing process. It has high operability and is suitable for engineering applications.

2.3. ANSYS Implementation for Static–Dynamic Coupled Analysis

To improve the operability of the CVs boundary based on the MIT method for static–dynamic coupled analysis, it is necessary to implement embedding in commercial FE software ANSYS, which is widely used in the nuclear power engineering field.
This implementation integrates User Programmable Features (UPFs), script-driven ANSYS Parametric Design Language (APDL), and the Graphical User Interface (GUI) to establish a comprehensive static–dynamic coupled analysis toolkit. The CVs element is embedded via UPF’s user-defined element API (UserElem), while the MIT method is operationalized through APDL scripting. Analysis workflow control is achieved through a parameterized APDL input file that automates finite element modeling and solution sequencing. Post-processing utilizes either APDL or GUI to interpret seismic analysis results stored in binary .rst files.
Implementation requires initial development of core computational subroutines using UPF’s C/FORTRAN API. These custom routines must be compiled and linked to the ANSYS executable prior to execution—platform-specific compilation procedures are documented in the official literature [24].
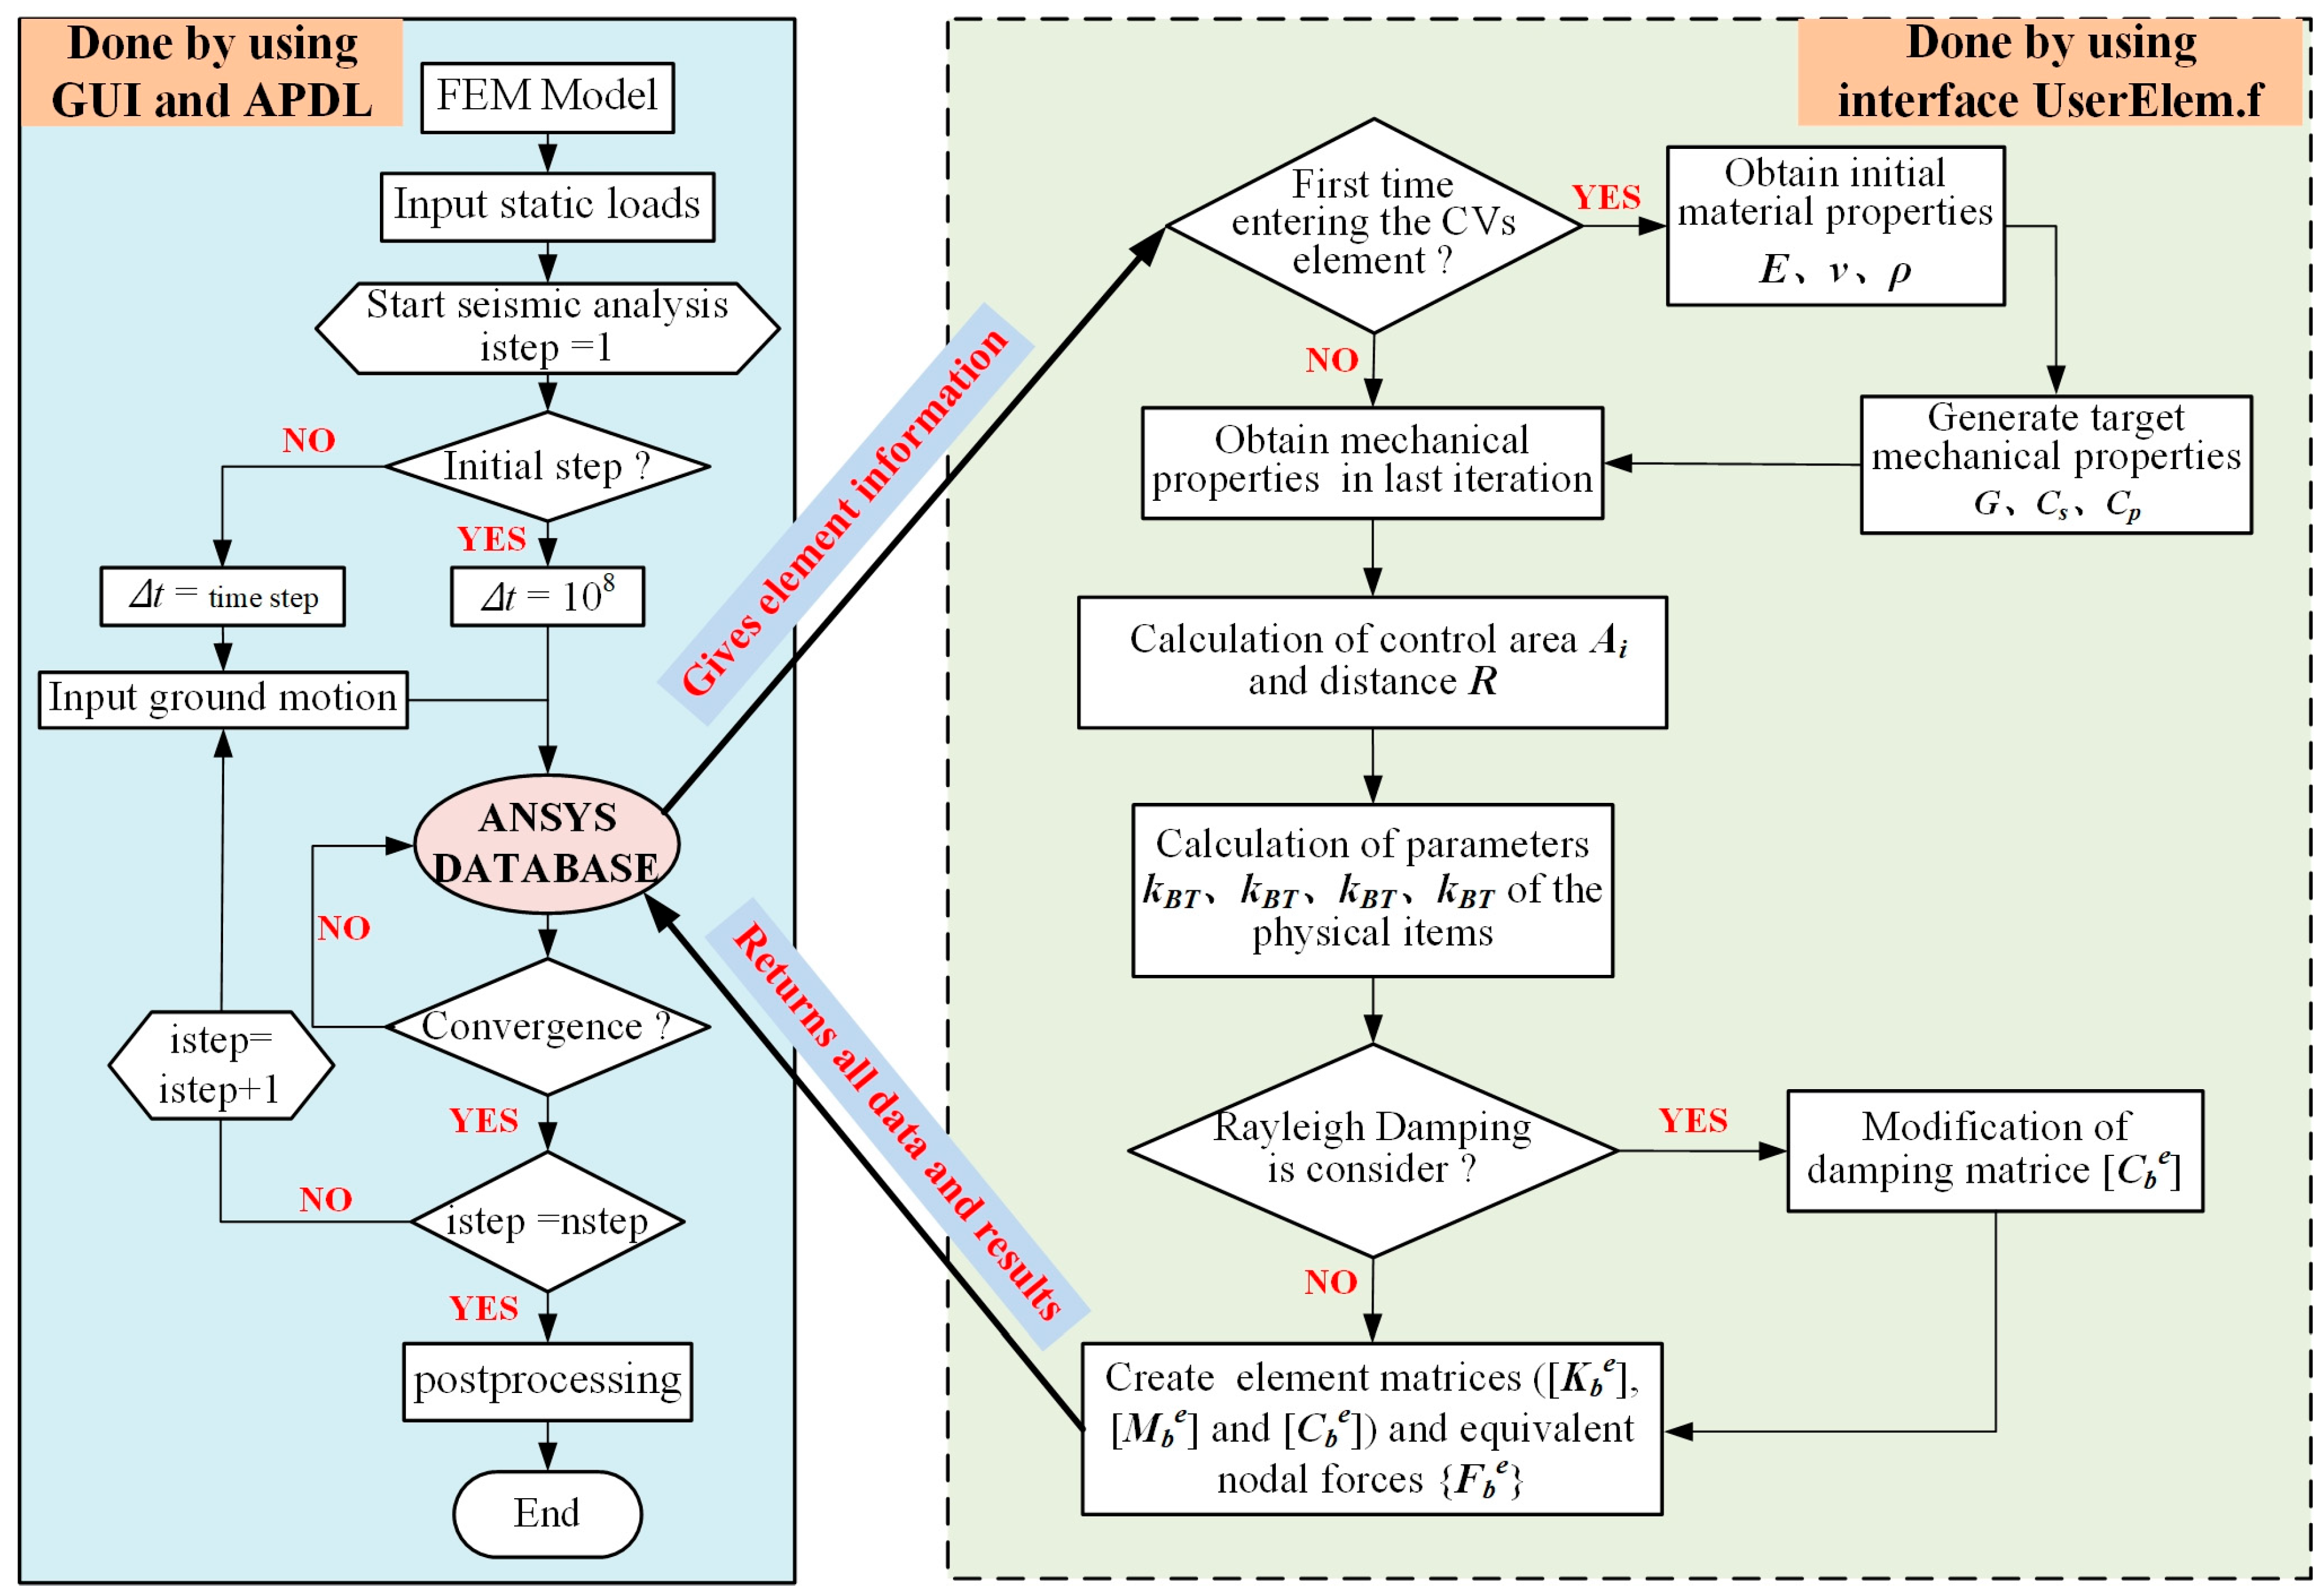
Figure 4 presents the computational workflow, with UPF-dependent processes delineated within dashed boundaries. Key implementation stages are subsequently elaborated:
(1) Pre-processing. The FE model is established using the ANSYS Preprocessor. The CVs element can be first established by the standard element with the same topology as the user element to be discretized. Then the EMODIF command is used to replace the standard element with the user element.
(2) Solution. After entering the solution phase of the static–dynamic coupled analysis, the static load vector is applied to the structures. Then, the initial time-step is set to 108, which is obtained through sensitivity analysis, and any larger value has little effect on the result. And the ANSYS database provides all the information of the CVs element into the interface subprogram UserElem.f, and performs the following steps:
a. Check whether the CVs element subroutine is entered for the first time. If “Yes”, use the material parameters to generate the final element material mechanical parameters. Then enter step “b”; if “No”, the material mechanics parameters of the previous iteration will be directly obtained and enter step “b”.
b. Determine Ai for node i within the CVs elements and compute the distance R from the boundary node to the scattered wave source. Then, equivalent coefficients kBN, kBT, cBN, and cBT are obtained by Equation (5), and then judge whether Rayleigh damping is generally considered that structural damping is
[ C ] = α [ M ] + β [ K ]
α and β represent Rayleigh damping proportionality coefficients. Per ANSYS documentation, defining these parameters (ALPHA/BETA commands) introduces supplemental damping in user-defined elements. Therefore, the CVs element damping matrices are exclusively calculated using Equation (18). If “No”, it means that the element has not considered damping and enters step “c”; if “Yes”, minor modifications are needed as follows:
[ C b e ] = [ C b e ] β [ K b e ]
c. Compute and assemble the element-level matrices (stiffness, damping, mass) and equivalent nodal load vector. Subsequently, return all generated data to update the superordinate database.
If calculation results do not meet the convergence conditions, enter the next equilibrium iteration step; if they meet, enter the next load step until the end of the seismic analysis.
(3) Post-processing. Conveniently, all results of the pumping station structure can be processed with standard ANSYS. Plotting results is unnecessary since the CVs elements serve as an artificial boundary. Crucially, the computed motion of the entire system represents the total amplitude.

3. Case Study

Applying the presented coupling methodology, we investigate the effects of soil–structure interaction, complex site conditions, and multi-load excitation for a three-dimensional pumping station structure under combined strong ground motion and static loads. All numerical simulations are performed in a user-defined ANSYS domain using UPFs and the APDL programming application.

3.1. Geometry Modeling of the Studied Pumping Station Structure and Site Condition

The pumping station structure (HPX) in China considered for this study is divided into two parts above and below ground, as described in Figure 1. The above-ground part is mainly a single-story steel structure workshop on the pumping station, with dimensions (length × width × height) of 103 m × 23 m × 15 m. The underground part is a reinforced concrete box-foundation, which is divided into a pump room with dimensions (length × width × depth) of 93 m × 23 m × 17 m and a drum screen compartment with dimensions (length × width × depth) of 93 m × 31 m × 17 m. Each pump station is divided into left and right parts, and a 20 mm wide shockproof seam is set in the middle. The pumping station provides cooling water for the important plant water system and the circulation of the cooling water system in the NPPs. In the case of failure, it is responsible for supplying cooling water to the nuclear island to discharge waste heat. Therefore, the safe operation of the pump station is crucial to the safety of the NPPs.
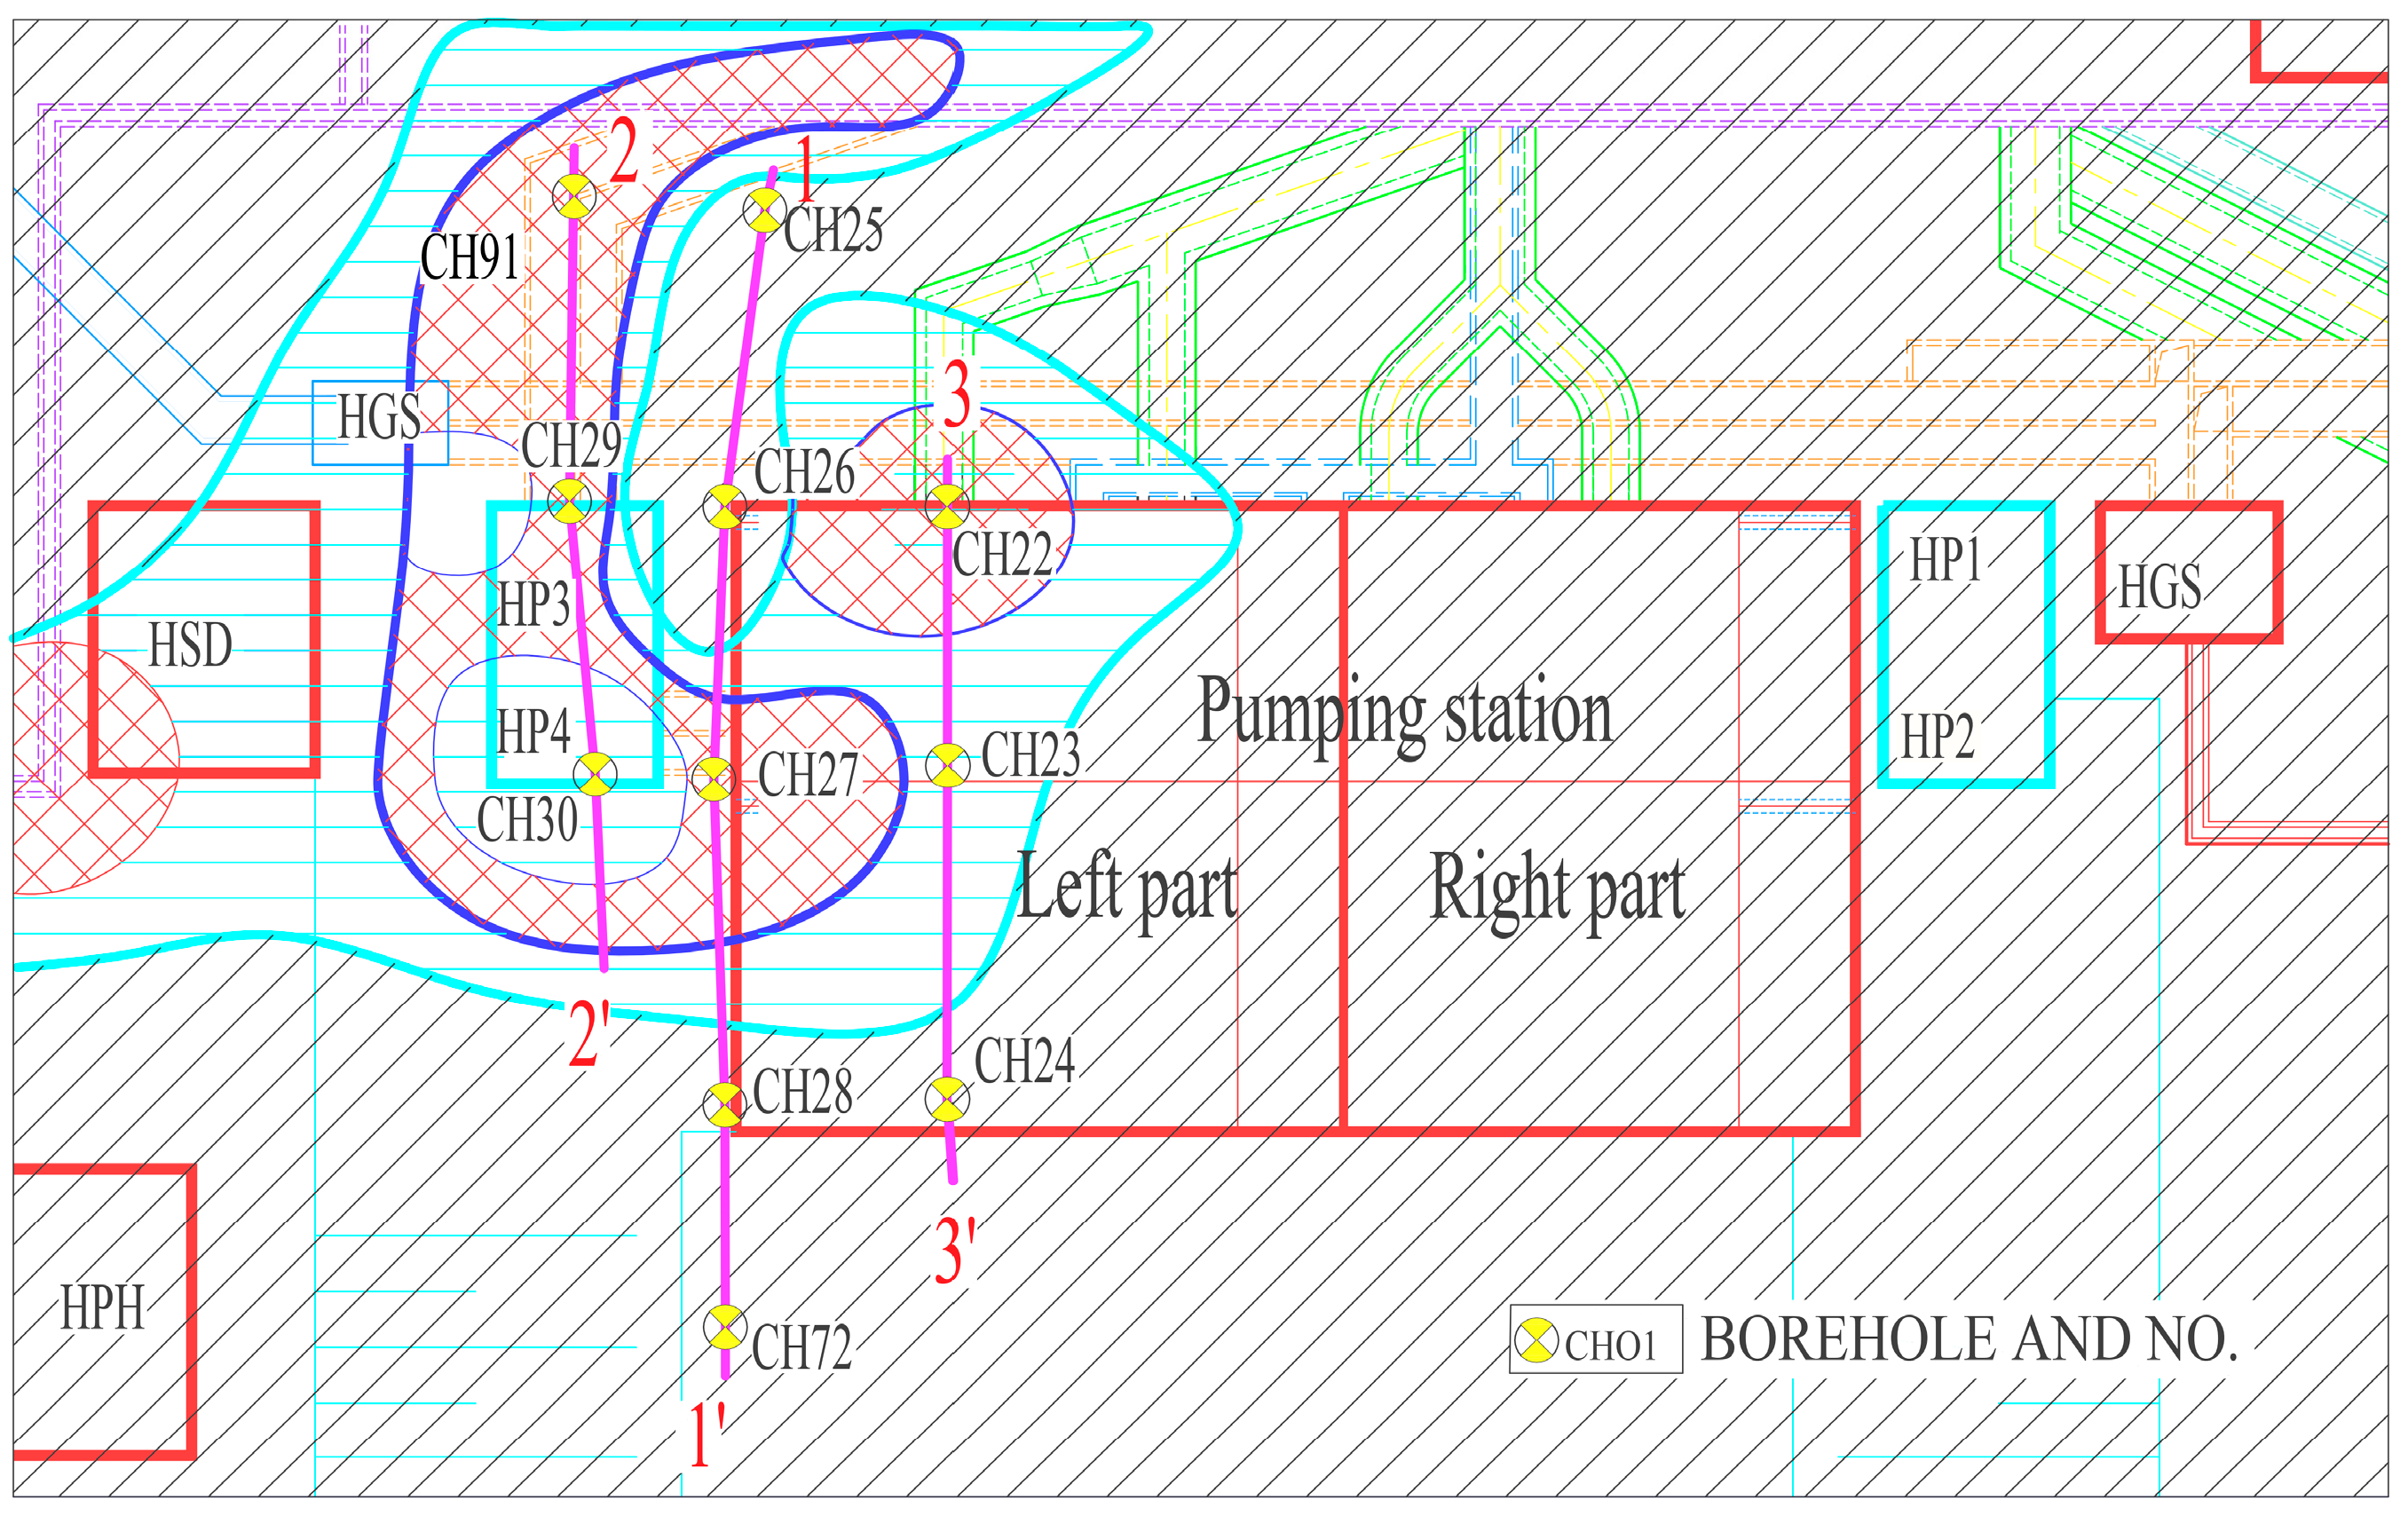
According to the on-site geological survey report, the pumping station structure is founded on the slightly weathered granite with an area of about 80% of the raft foundation and the highly weathered granite with an area of about 20%, and the depth of the highly weathered granite is large, as described in Figure 5. From the site slice map of the pumping station structure (at the elevation of −24.00 m below the box base elevation), it can be seen that the right section exhibits greater homogeneity, while the left section comprises exposed weathered granite and overlying soil layers. In addition, the local area is moderately weathered or strongly weathered granite, and the buried depth is large. The moderately weathered or highly weathered bedrock has an elevation of approximately −65.0 to −43.0 m in the CH23, CH27, CH29, CH30, and other boreholes, resulting in the bedrock surface being undulating and unevenly weathered. It is also mixed with completely weathered and slightly weathered granite; thereby, the heterogeneity characteristic of the site soil is prominent, and geological conditions are complex. This study investigates the effect of these complex site conditions on the seismic SSI analysis results of the pumping station structure subjected to the static–dynamic coupled excitation.

3.2. Finite Element Calculation Model and Parameters

The FE model implementing static–dynamic coupling in the soil–structure system (Figure 6) utilizes SOLID185 elements to simulate the pumping station’s key components, including bottom plate, water chamber, and circulating water pump station, based on as-built configurations. The SOLID185 element features advanced reduced integration techniques [25] and excellent mesh adaptability, making it the preferred choice in ANSYS for handling nonlinear materials and complex geometries. The soil domain is also modeled by a solid element, which is finely meshed in the heterogeneous part and is mainly used to describe the spatial distribution of xenoliths, in which the purple solid elements represent slightly weathered granite, the red solid elements correspond to moderately weathered granite, and the blue solid elements denote highly weathered gneiss. For the upper steel frame between the pumps, the ratio of its self-weight to the mass of the lower concrete structure is about 1/147, less than 0.01, so the coupled calculation between the steel frame and the lower concrete structure is not performed. The self-weight of the steel frame is equivalent to setting particles on the column and modeled by mass element (MASS 21), which is used to simulate two rows of red particles between he pumps in Figure 6. Similarly, the auxiliary equipment of the pumping station (drum mesh and circulating pump) is simulated by MASS 21. And the viscous-spring artificial boundary is modeled by the CVs elements. To meet the requirements of SSI, the soil domain extends from the structural edge outwards in two horizontal directions and downwards along the vertical axis, and the size of the model is 168 m (length) × 157 m (width) × 85 m (height). The resulting soil–structure interaction model comprises 149,593 elements and 129,205 nodes. Mesh refinement throughout the domain ensures 4–8 nodes per wavelength for wave propagation requirements, with average element sizes of 1.0 m for the structure and 3.0 m for the foundation.
The pumping station structure is cast with C40 concrete, and the material parameters for the pumping station structure–soil interaction system are provided in Table 1.

3.3. Load Conditions

The circulating water pumping station structure of NPP, being a seismic category I structure, supplies water for the circulating cooling water (CRF) system. Its structural analysis incorporates code-specified loads: gravity, earth pressure, fixed equipment loads (modeled with mass elements), hydrodynamic pressure (via Westergaard assumption at 1.60 m water level), and seismic excitation.
Among them, the hydrostatic pressure includes the pressure on the inlet channel, the water chamber, and the external wall of the structure. The fixed equipment pressure is considered by applying mass elements at the location of the equipment. Seismic input employs the NRC RG1.60 design spectrum (5% damping) and time–history acceleration (Figure 7) with 0.18 g horizontal PGA, 0.12 g vertical PGA, 28.0 s duration, and 0.01 s time step [26].

4. Numerical Results

Two representative case studies validate the proposed methodology’s computational accuracy, numerical efficiency, and implementation correctness. After that, an engineering application, seismic safety analysis of the pumping station structure in China mentioned in Section 3, considering the actual site conditions, reveals the merits of the proposed implementation in ANSYS to simulate the system of a sophisticated structure and unbounded soil interaction subjected to multi-load coupled excitation.

4.1. Verification

4.1.1. Scattering Field Analysis

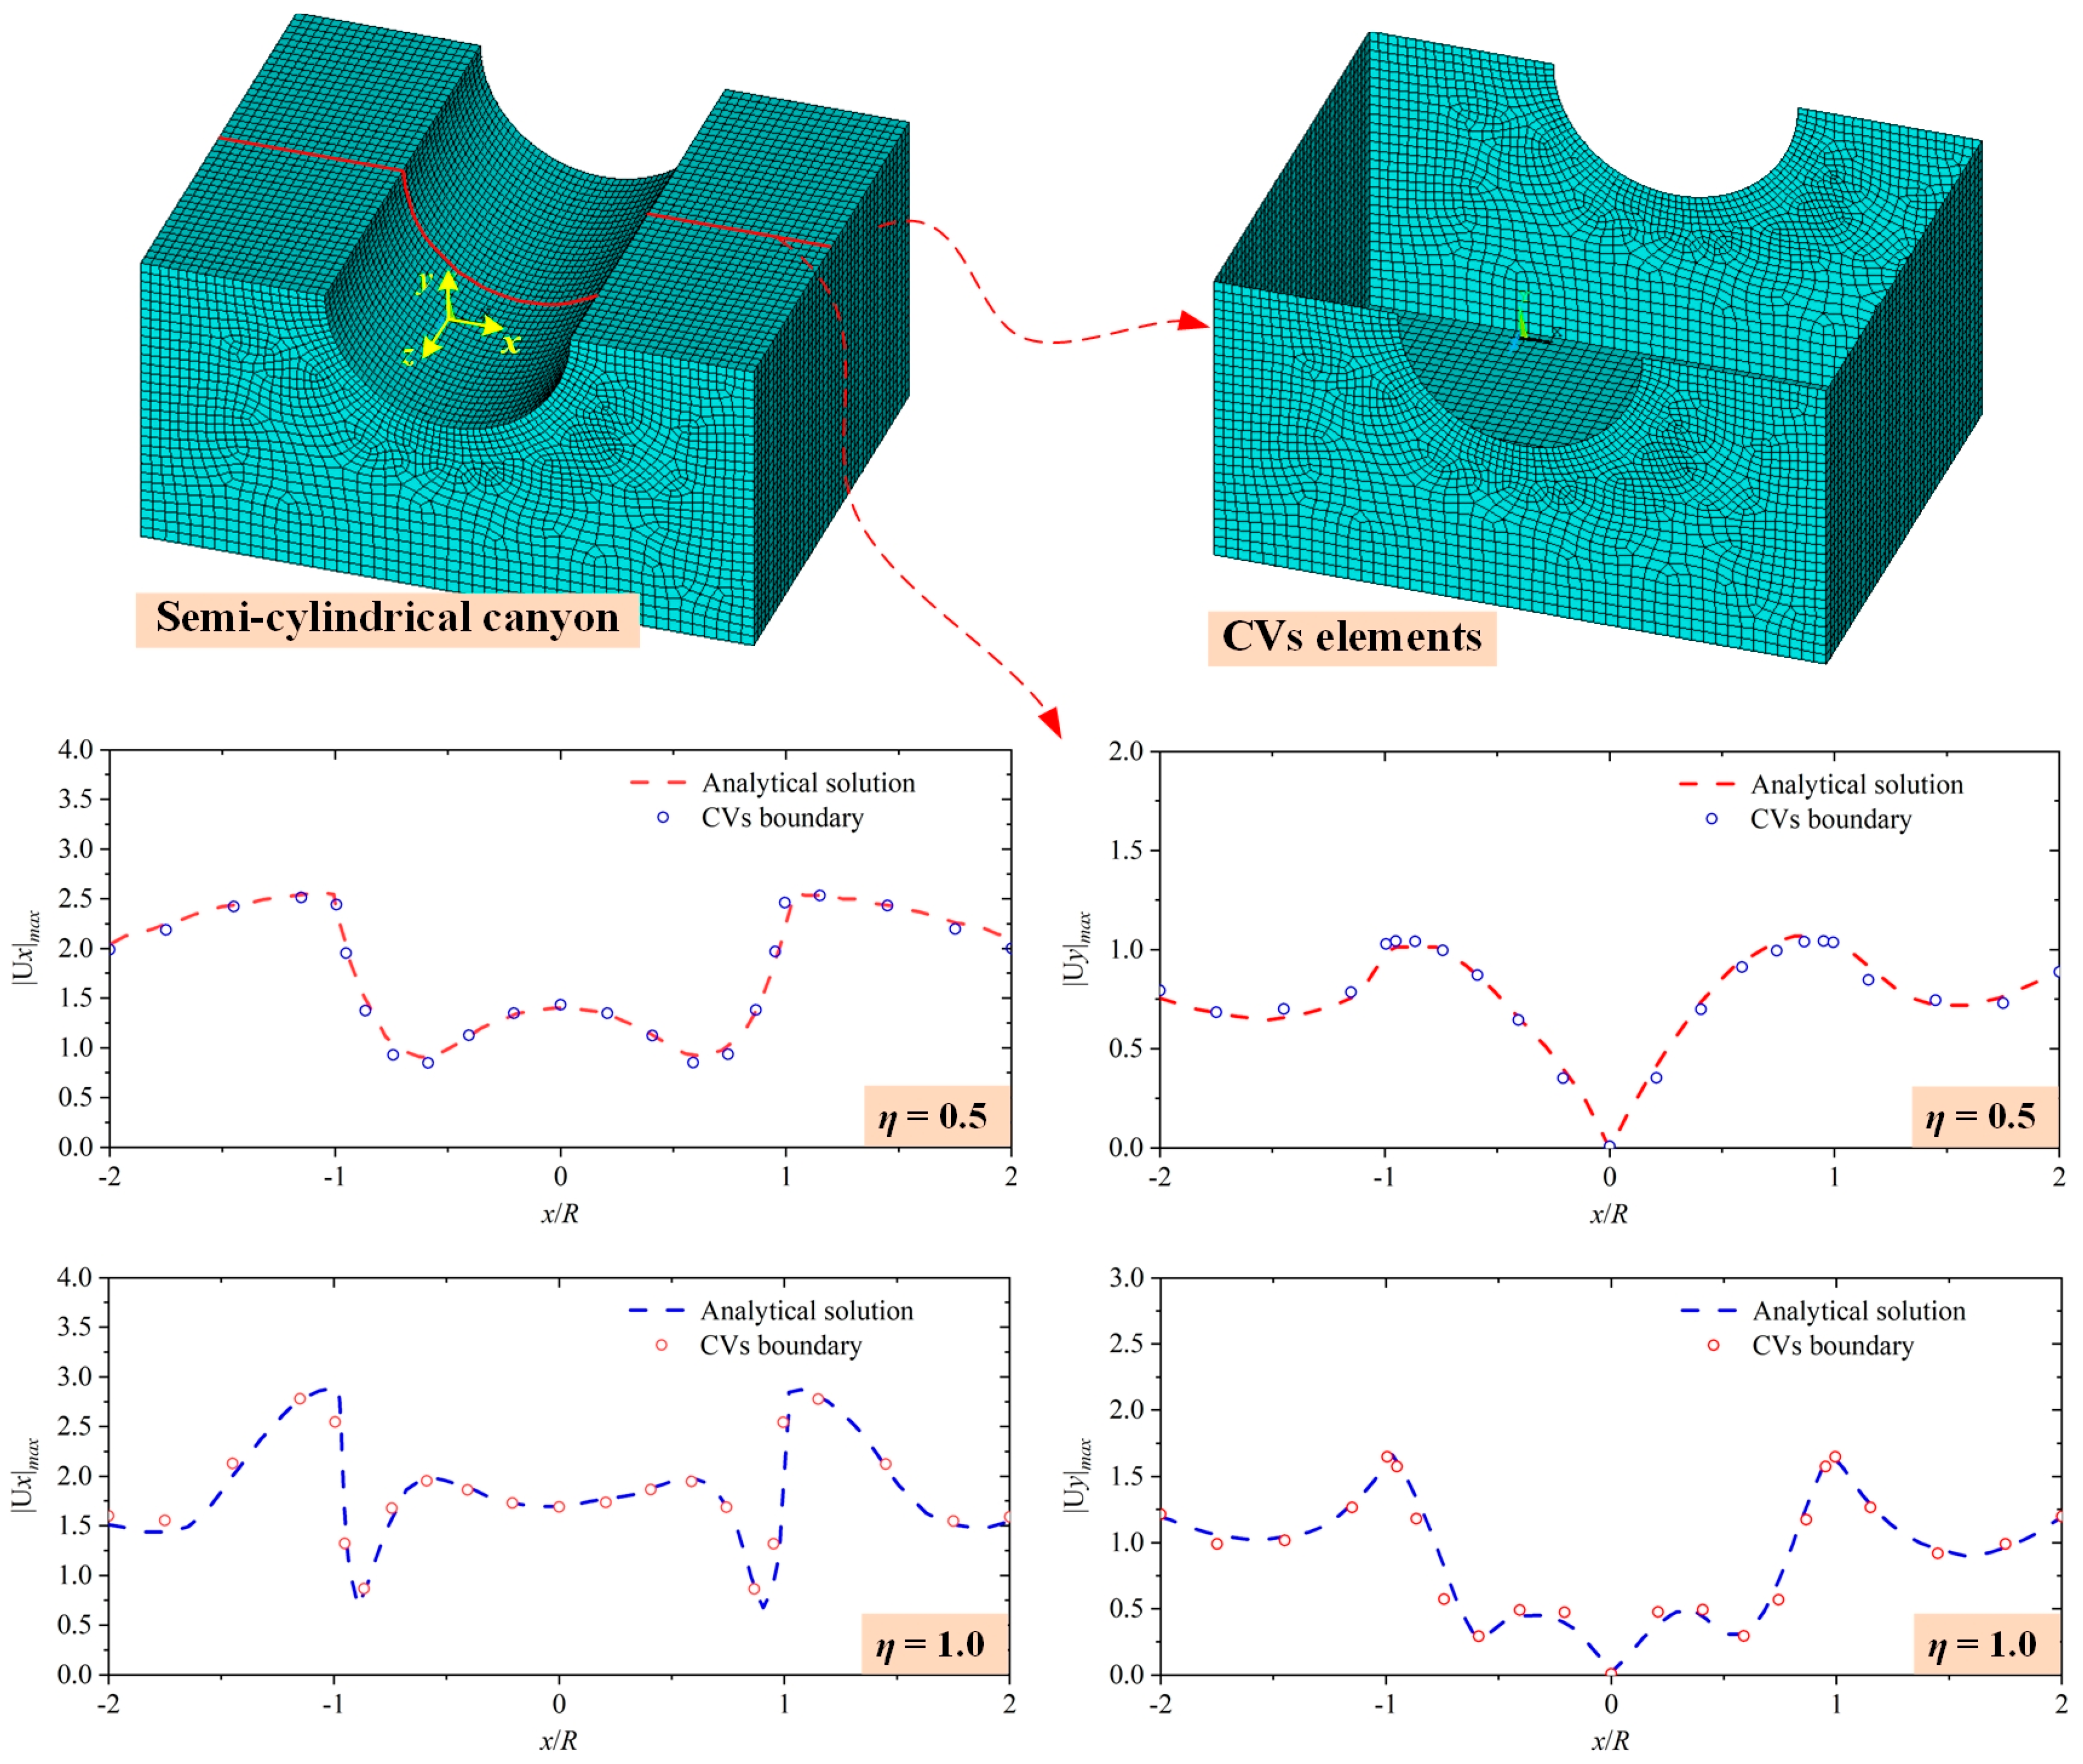
Due to the pumping station structure is semi-underground, the scattering field of the three-dimensional semi-cylindrical canyon model is studied in this paper, as shown in Figure 8. The radius of the valley R is 210 m, and the range of the finite computation area is 1050 m (x) × 525 m (y) × 800 m (z). The mass density ρ is 2700 kg/m3, shear modulus of Medium G is 5.292 GPa, shear wave velocity cs is 1400 m/s, and Poisson’s ratio v is 1/3.
The excitation of the half-space is assumed to consist of an infinite train of plane SV waves with frequency w. For validation against the analytical solution [27], the dimensionless frequency is defined as η = 2 R/λ = w R/πcs, where λ is the wavelength of incident harmonics.
Figure 8 presents displacement amplitudes |Ux| and |Uy| as functions of normalized distance x/R for vertical wave incidence, analyzing two dimensionless frequencies: η = 0.5 and 1.0. The dotted lines are analytic solutions, and the discrete dots are numerical solutions obtained by the CVs boundary in this paper. It can be clearly seen that the CVs boundary model achieves excellent agreement with the analytical solution, confirming that the ANSYS implementation accurately captures valley-induced seismic wave modulation. This validation establishes the method’s viability for soil–structure interaction dynamics analysis.

4.1.2. Static–Dynamic Coupled Analysis

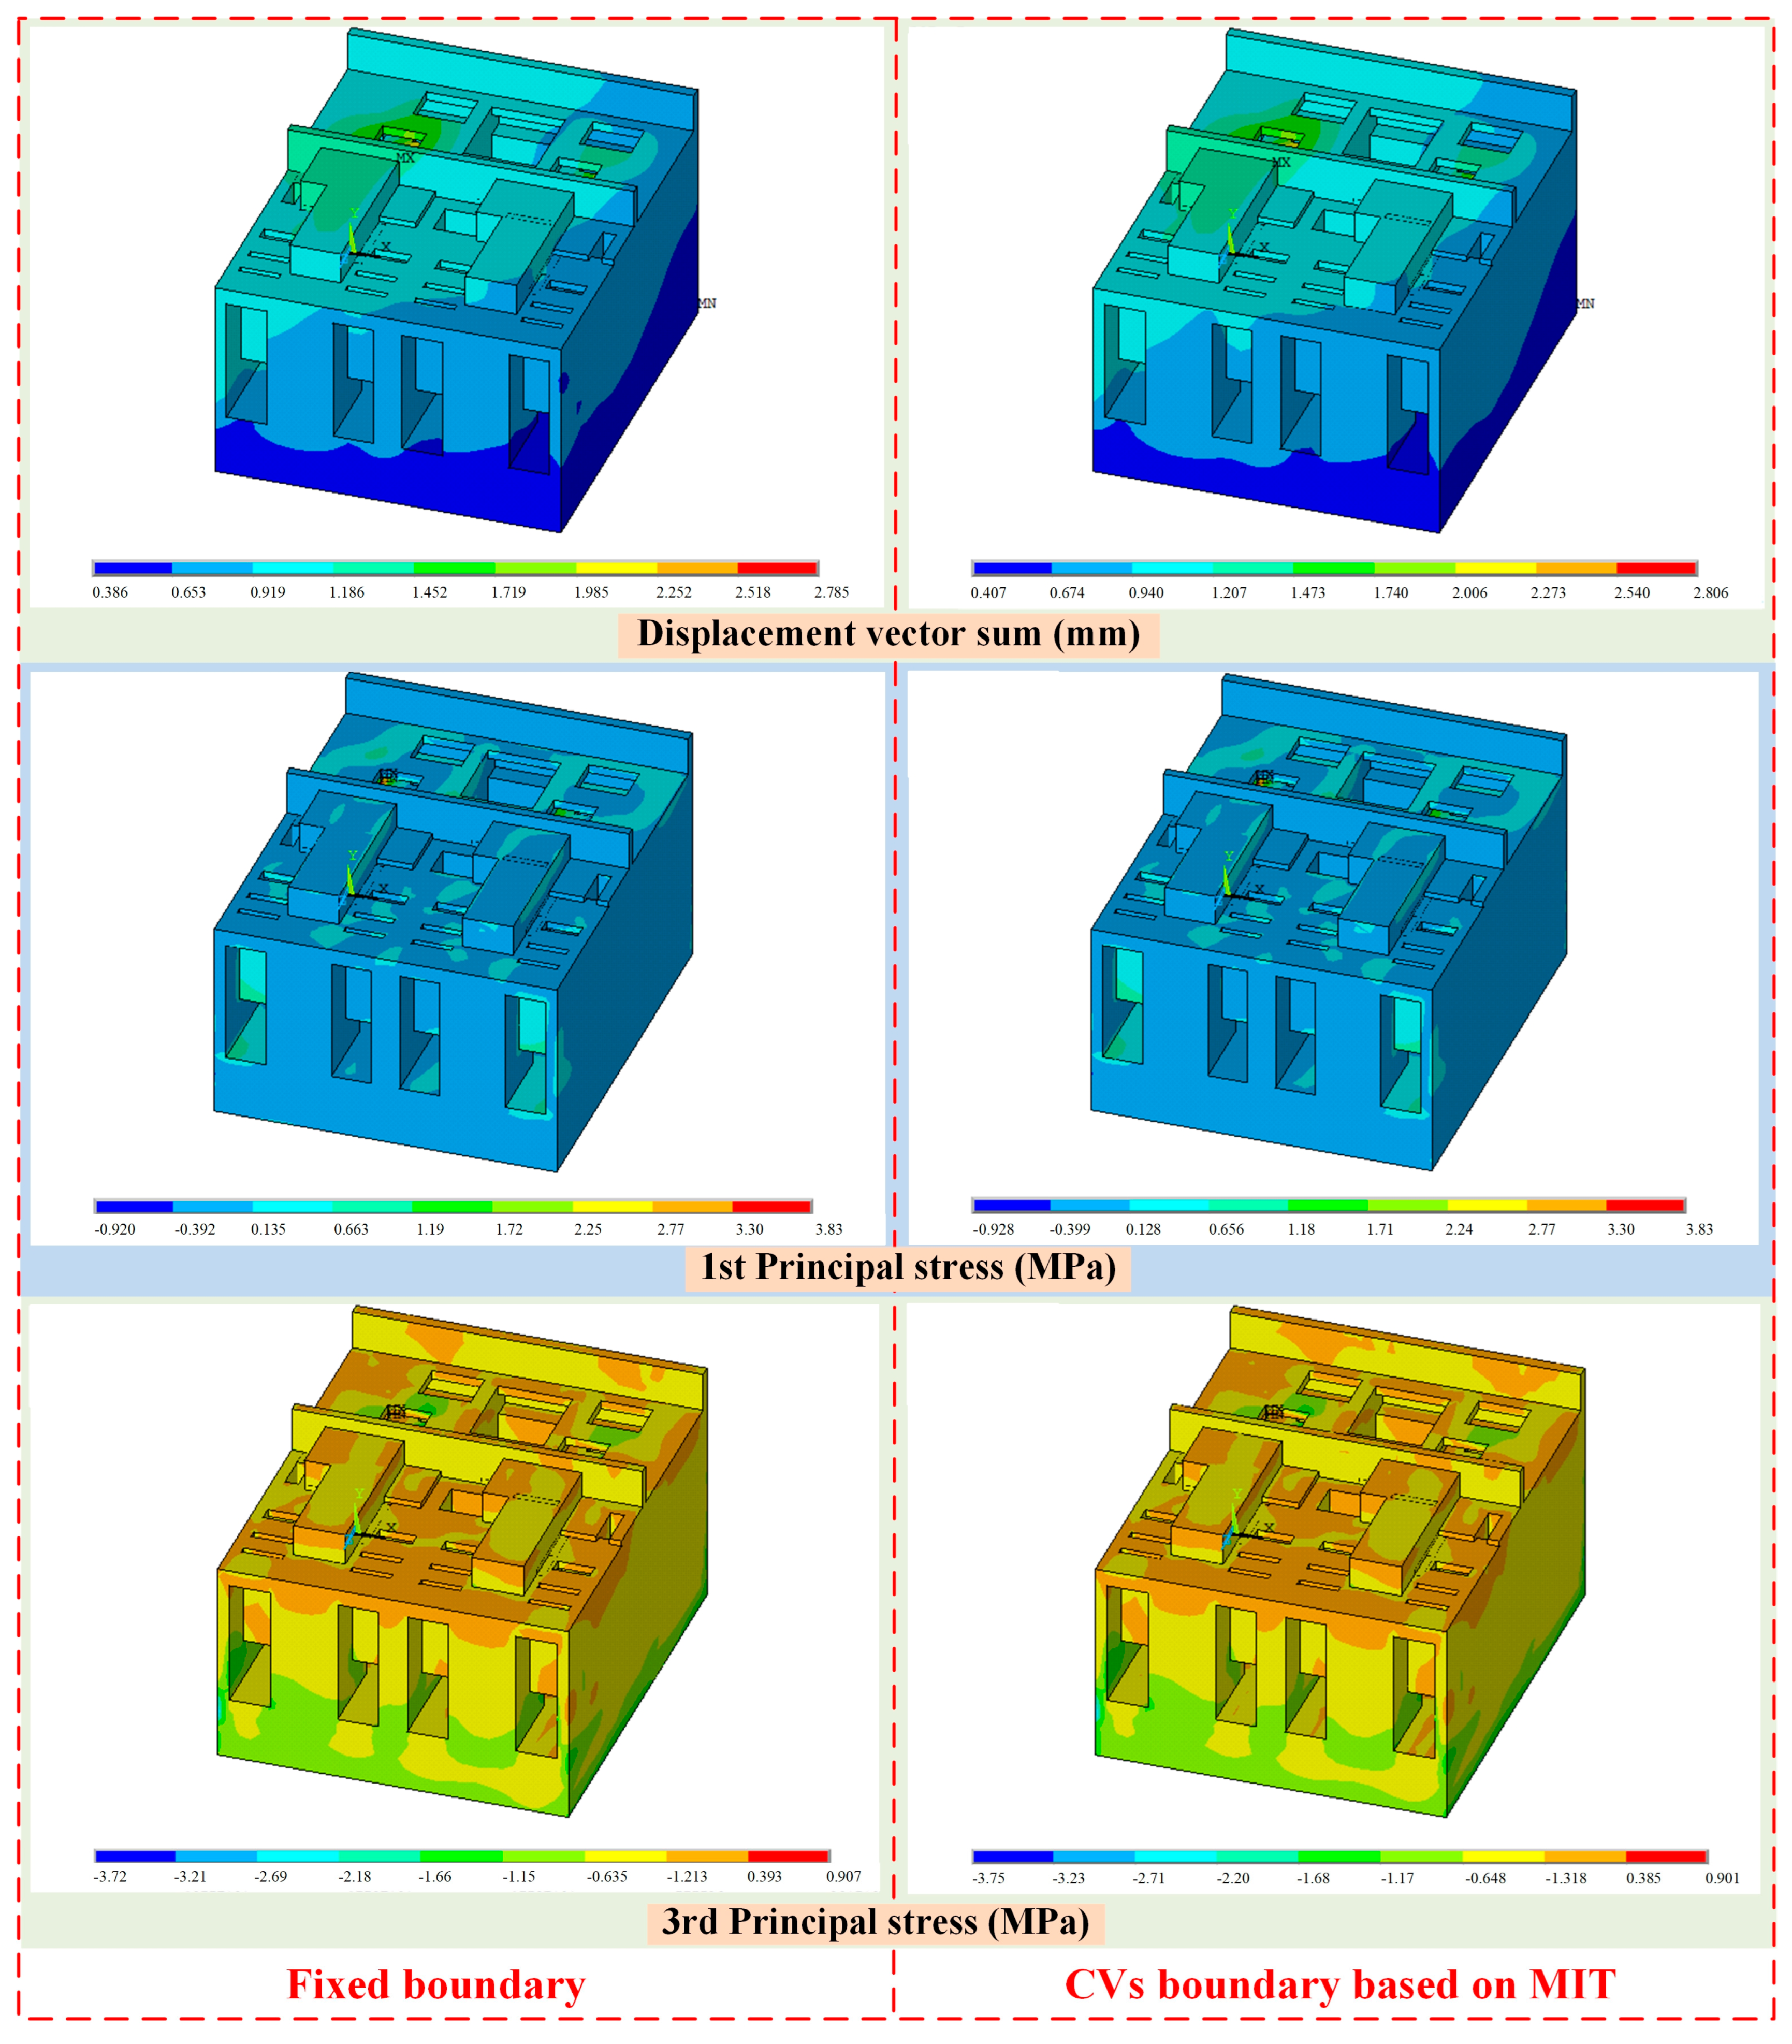
Verification of the MIT method’s accuracy and applicability employs two comparative calculation models (Figure 6): a fixed boundary for static analysis and a CVs boundary for static–dynamic coupled analysis. The gravity and hydrostatic pressure are considered in the two calculation models, and the initial time-step size is set as 1 × 10⁸ s in the CVs boundary model. Figure 9 subsequently contrasts resultant displacement fields and principal stress distributions across these boundary configurations.
It can be seen from Figure 9 that the total displacement and principal stress distribution of the pumping station structure by two distinct boundary models are basically the same, and there are only differences in numerical values. The maximum total displacement obtained by the proposed model is 2.806 mm, while the maximum total displacement obtained by the fixed boundary model is 2.785 mm, and the relative error is 0.75%. The proposed model yields a third principal stress of −3.75 MPa versus −3.72 MPa for the fixed boundary model, indicating a 0.81% relative deviation. And the first total displacement by using the proposed model has nearly no error as compared with the fixed boundary model. The maximum first principal stress obtained by both models is 2.61 MPa.
Therefore, the difference between the two models in displacement and stress distribution and values is small, which shows that the CVs boundary based on the MIT method is reliable and effective for the problem of static and dynamic coupled analysis. Furthermore, the proposed implementation in ANSYS can continue to solve the subsequent dynamic time steps in the seismic analysis, so as to avoid the accuracy loss caused by different static and dynamic calculation analysis models.

4.2. Seismic Safety Analysis of Pumping Station

The seismic safety evaluation of the pumping station mentioned in Section 3 is carried out based on the CVs boundary using the MIT method. To facilitate comparative analysis, the case where C20 plain concrete is used to replace poor-quality bedrock through excavation and backfill has been additionally considered. In addition, the calculation of one load step requires 16 s in the seismic analysis, performed on a PC with an Intel® Core™ i7-8750H CPU (2.20 GHz) and 8 GB RAM. For larger-scale models, utilizing the GPU acceleration feature in ANSYS can significantly enhance simulation efficiency while simultaneously reducing hardware costs and energy consumption. GPU solvers excel at handling complex simulation tasks. For instance, in aerodynamic simulations with over 100 million elements, GPU solvers can achieve speedups of 5 times, and with multiple GPUs, this can increase to 30 times. Additionally, GPUs can reduce energy consumption by over 75% compared to CPUs.

4.2.1. Stress Analysis

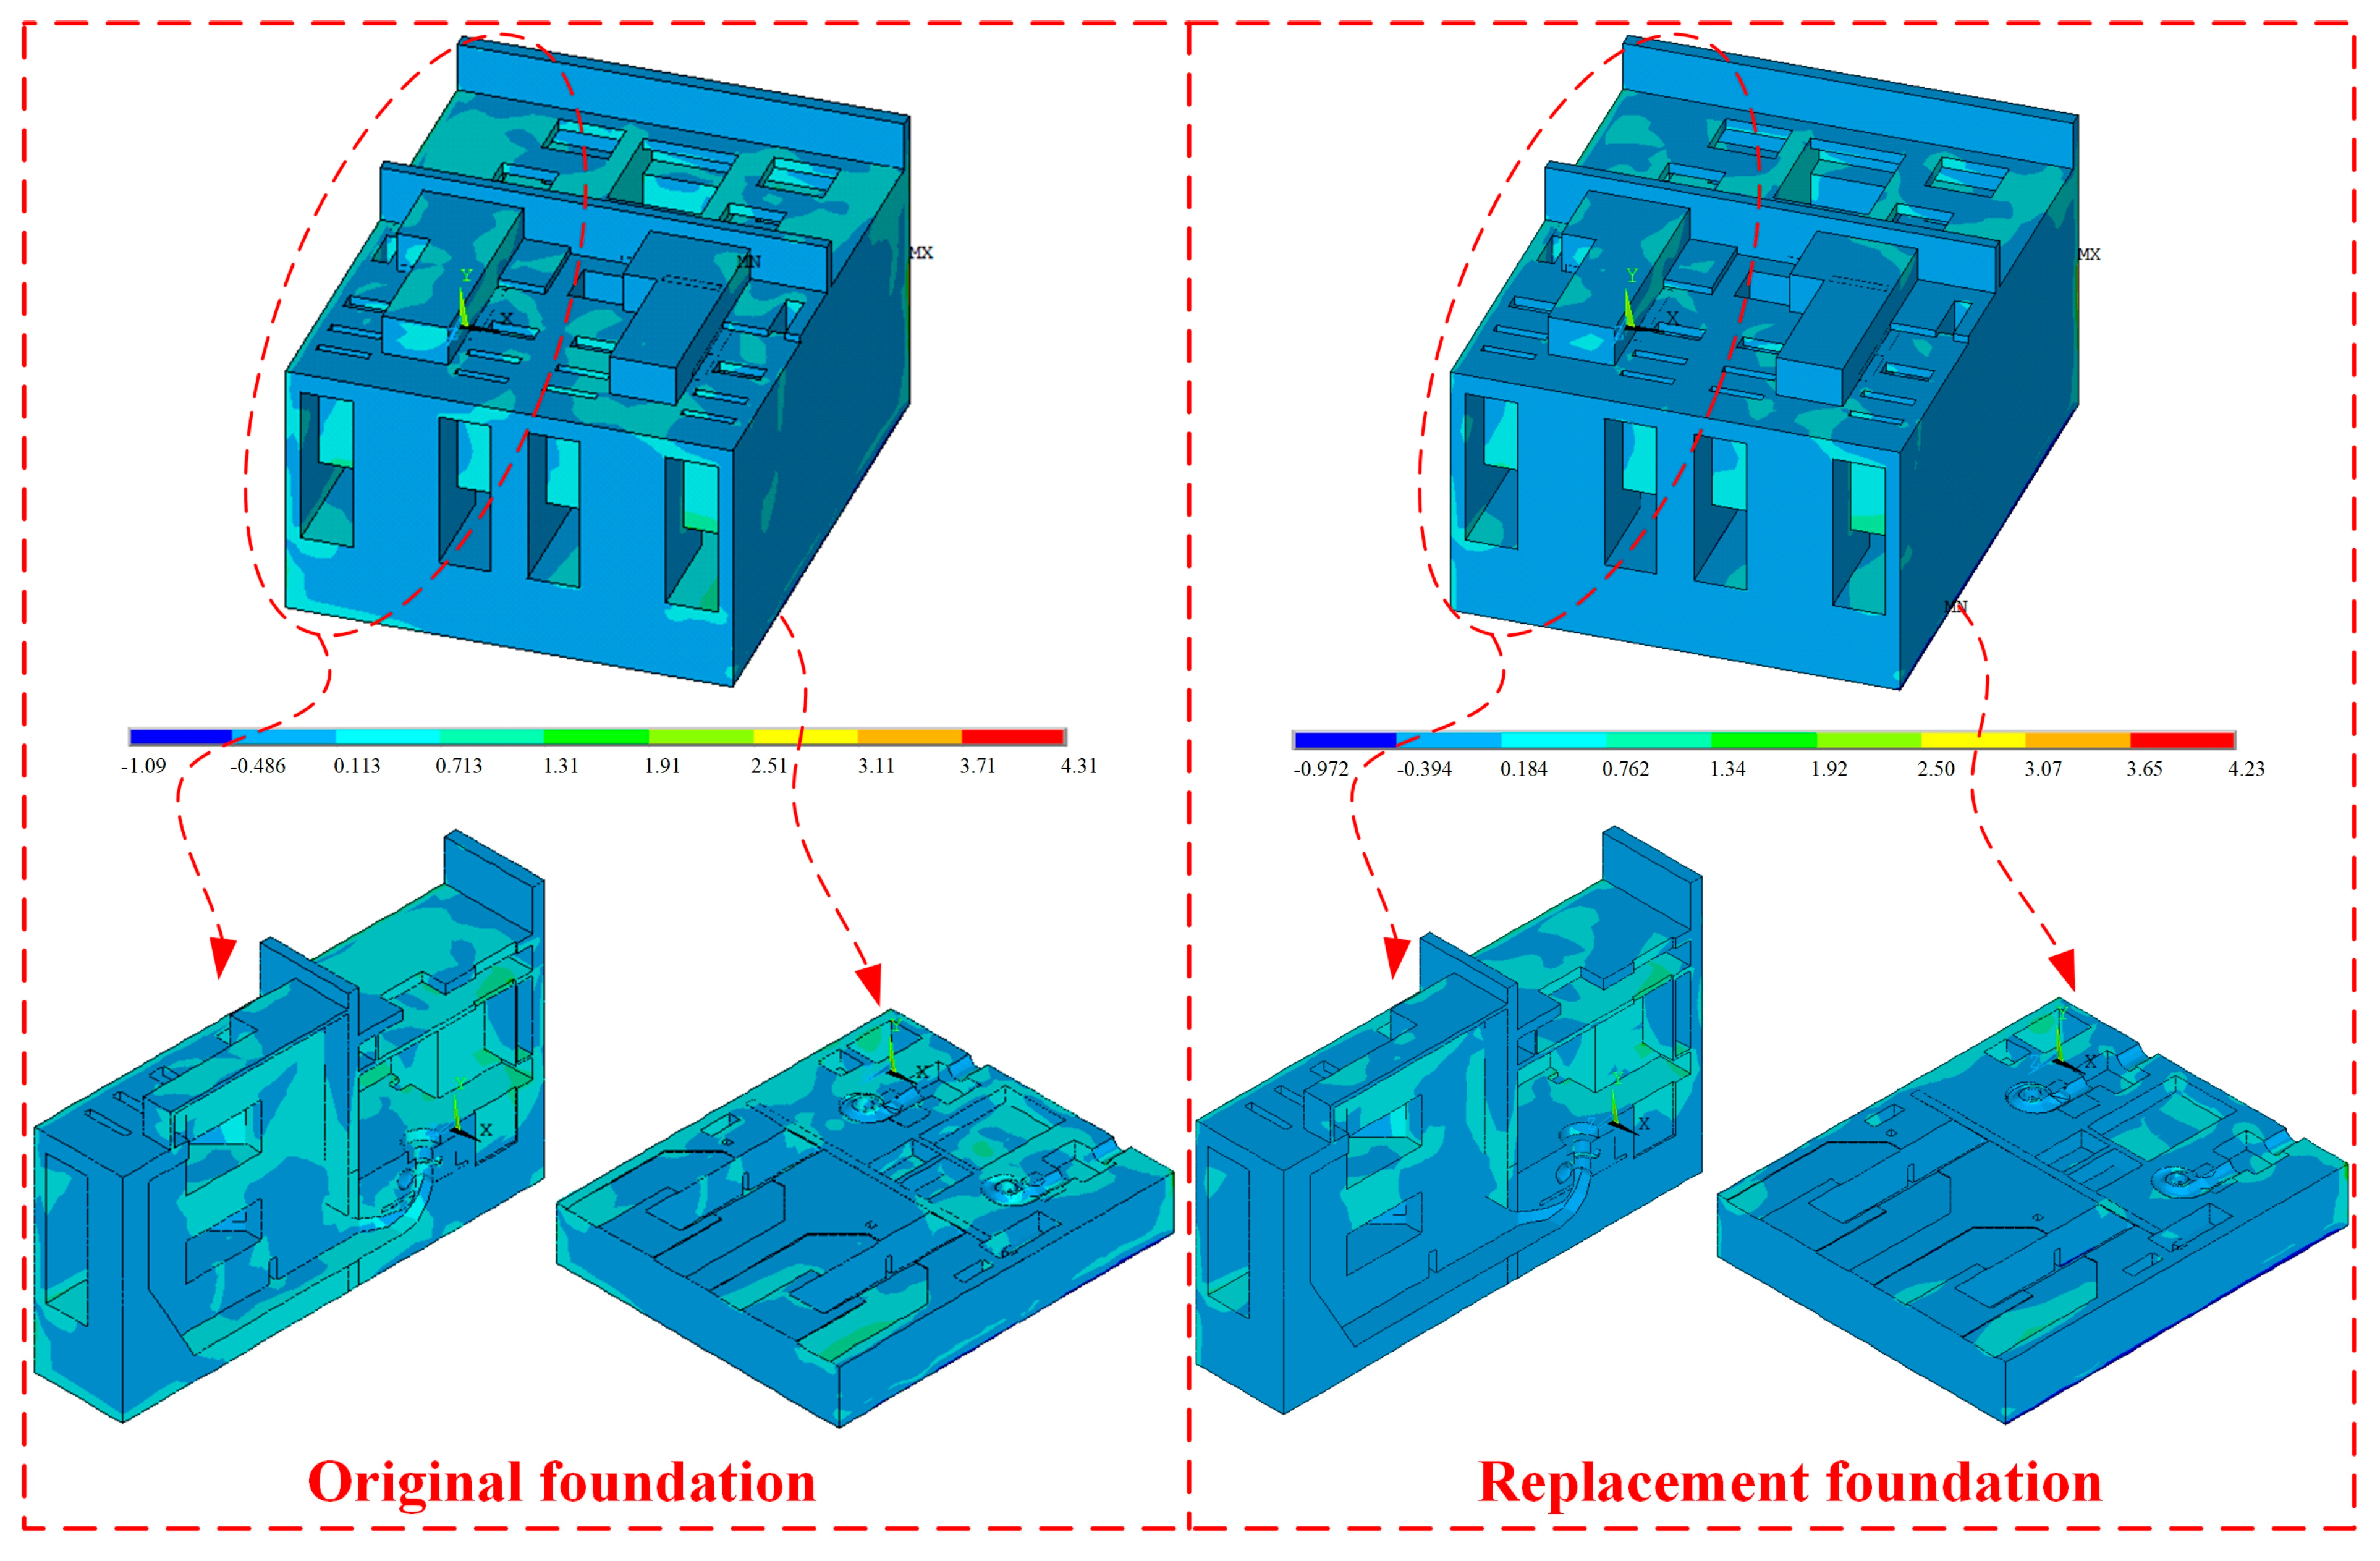
Figure 10 illustrates the first principal stress distributions in the pumping station structure under original versus replacement foundation conditions, revealing fundamentally similar stress patterns where most structural locations exhibit about 1.0 MPa below concrete tensile strength. Critical stress concentrations emerge at the water chamber base, floor–wall junctions, and wall–backfill interfaces, identifying vulnerable zones requiring reinforcement. Quantitatively, original foundation stress consistently exceeds replacement values, with peak magnitudes measuring 4.31 MPa (original foundation) versus 4.23 MPa (replacement foundation).
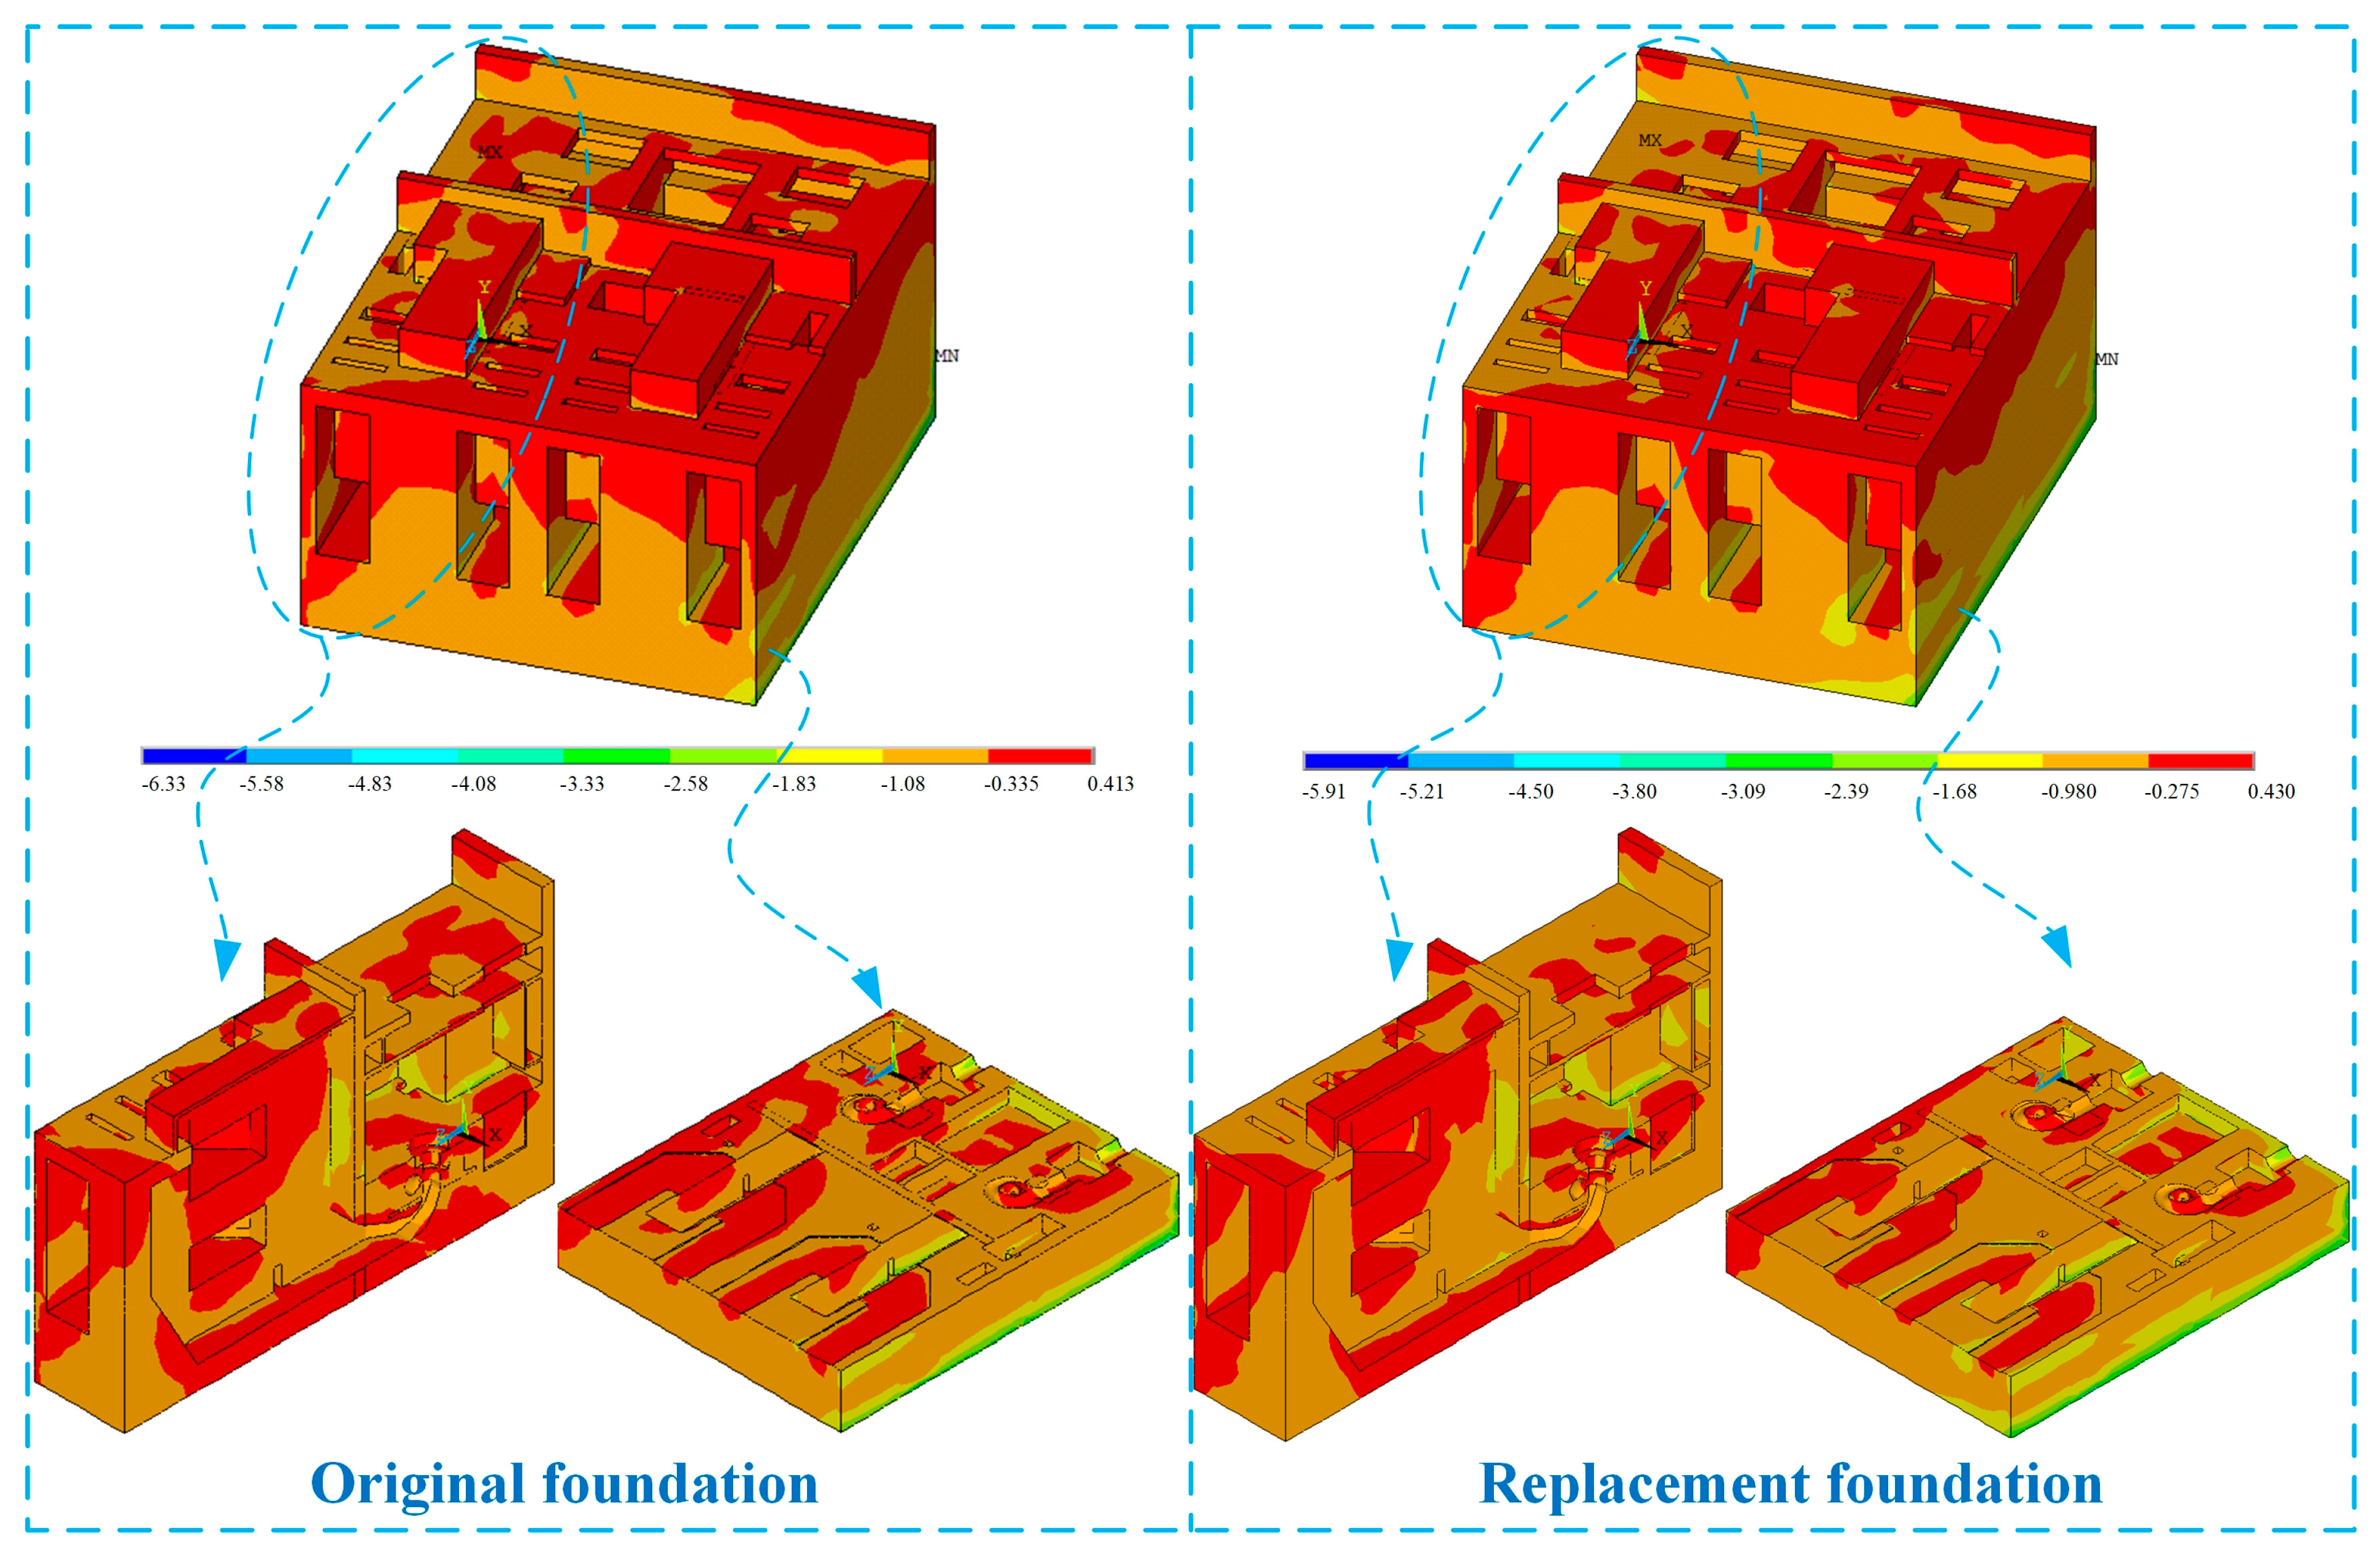
Figure 11 compares third principal stress distributions in the pumping station structure under original versus replacement foundation conditions, showing fundamentally similar patterns with overall lower stresses in upper structural regions. Most locations exhibit about −1.0 MPa, while critical concentrations occur at the foundation base slab and floor–wall junctions. Original foundation stresses consistently exceed replacement values, evidenced by minimum magnitudes of −6.33 MPa (original foundation) versus −5.91 MPa (replacement foundation), both within concrete compressive strength limits.
Therefore, the influence of foundation replacement on the stress value and distribution of the pump station structure is not obvious, which is mainly due to the thickness of the foundation bottom slab being large and the overall rigidity being good, so the existence of local heterogeneous bedrock has little influence on the stress distribution of the structure.

4.2.2. Acceleration Response Analysis

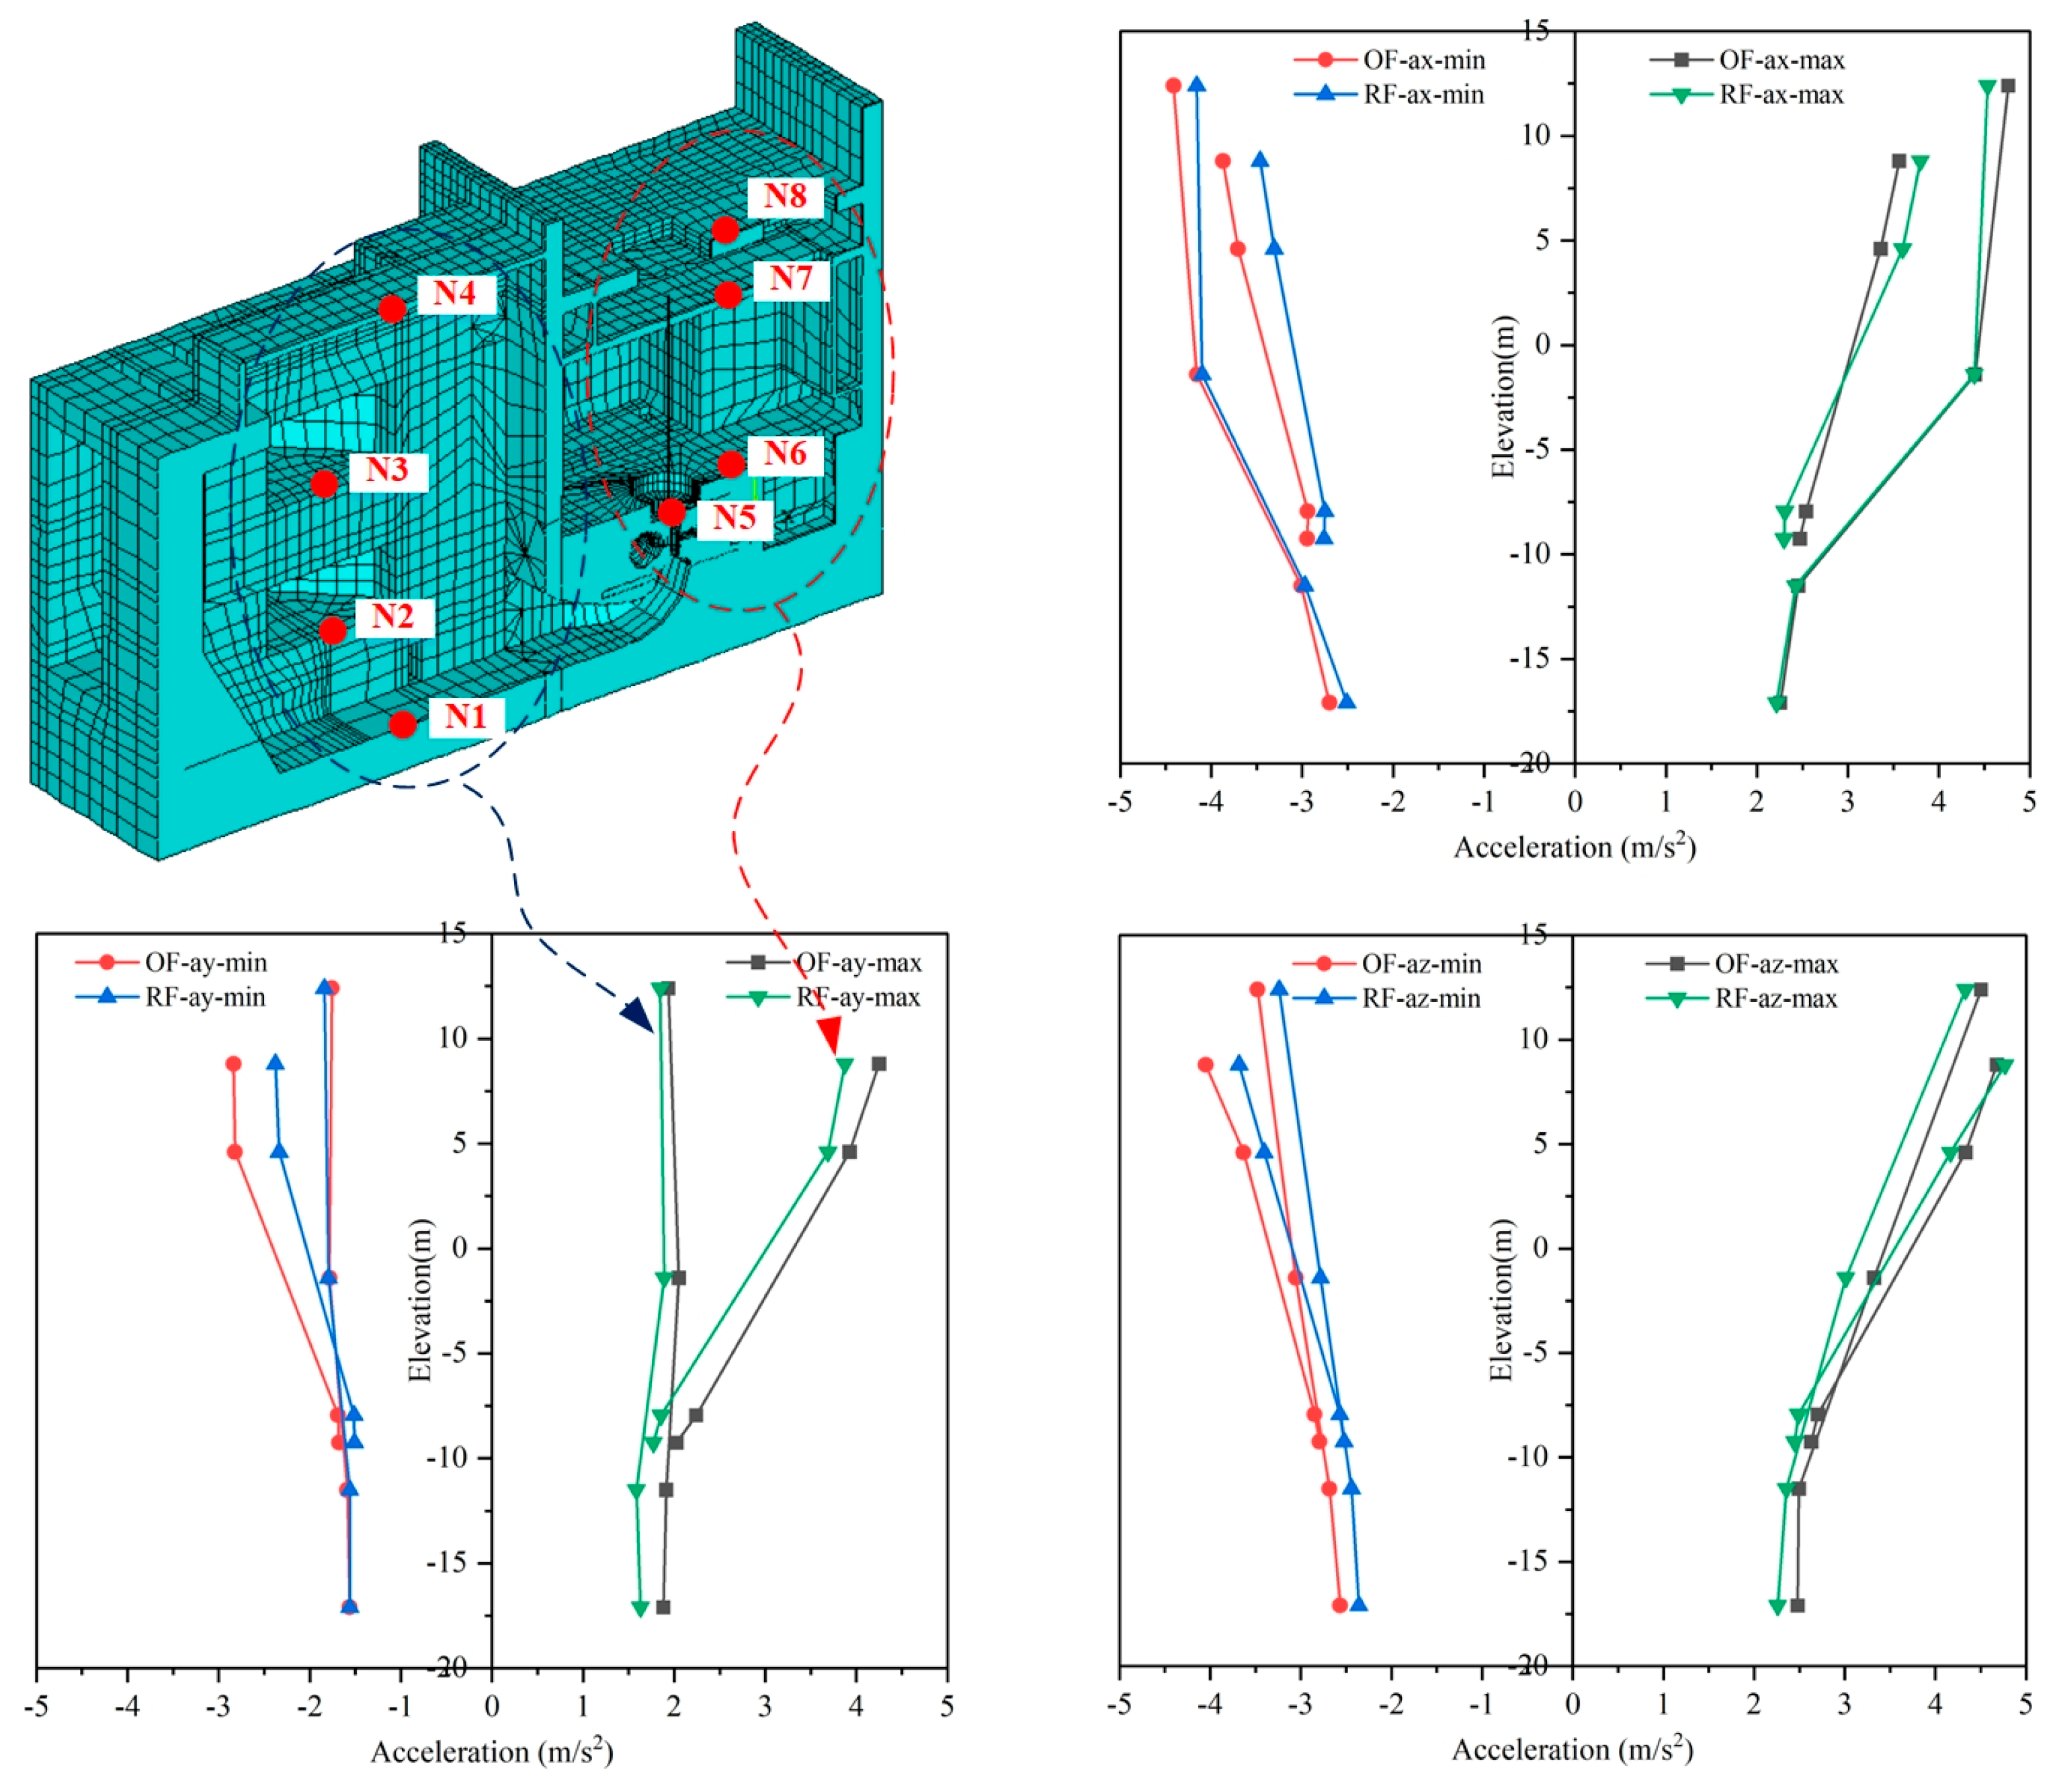
To evaluate foundation condition effects on the pumping station structure, Figure 12 presents peak acceleration measurements across elevations, where “OF-ax” denotes horizontal acceleration under original foundation conditions and “RF-ay” indicates vertical acceleration under replacement foundation conditions, with key monitoring points N1-N4 (drum screen compartments) and N5–N8 (pump room) annotated at respective elevations for comparative analysis.
Overall, acceleration amplitude increases with depth in three directions, and the variation law of acceleration amplitude is basically the same under the two foundation conditions. However, the acceleration values of the replacement foundation are smaller than those of the original foundation. In the horizontal direction x, the acceleration values for the original foundation and replacement foundation are 4.76 m/s2 and 4.54 m/s2 at the top key point N4 in the drum screen compartments, respectively. In contrast, the acceleration values for the original foundation and replacement foundation are 3.87 m/s2 and 3.80 m/s2 at the top key point N8 in the pump room, respectively. Obviously, the acceleration values of the pump room are smaller than those of the drum screen compartments due to the backfill reducing the vibration in the pump room. In the horizontal direction z, the acceleration values of the pump room and the drum screen compartments show a small difference under different foundations due to the same side being supported by backfill. However, vertically (y-direction), acceleration exhibits marginal elevation-dependent amplification in drum screen compartments versus significant amplification in pump rooms. The acceleration values for the original foundation and replacement foundation are 1.94 m/s2 and 1.84 m/s2 at the top key point N4, respectively. In contrast, the acceleration values for the original foundation and replacement foundation are 4.25 m/s2 and 3.87 m/s2 at the top key point N8, respectively. This is mainly due to the large internal space of the pump room, resulting in a larger acceleration response of the upper floor.

4.2.3. Displacement Response Analysis

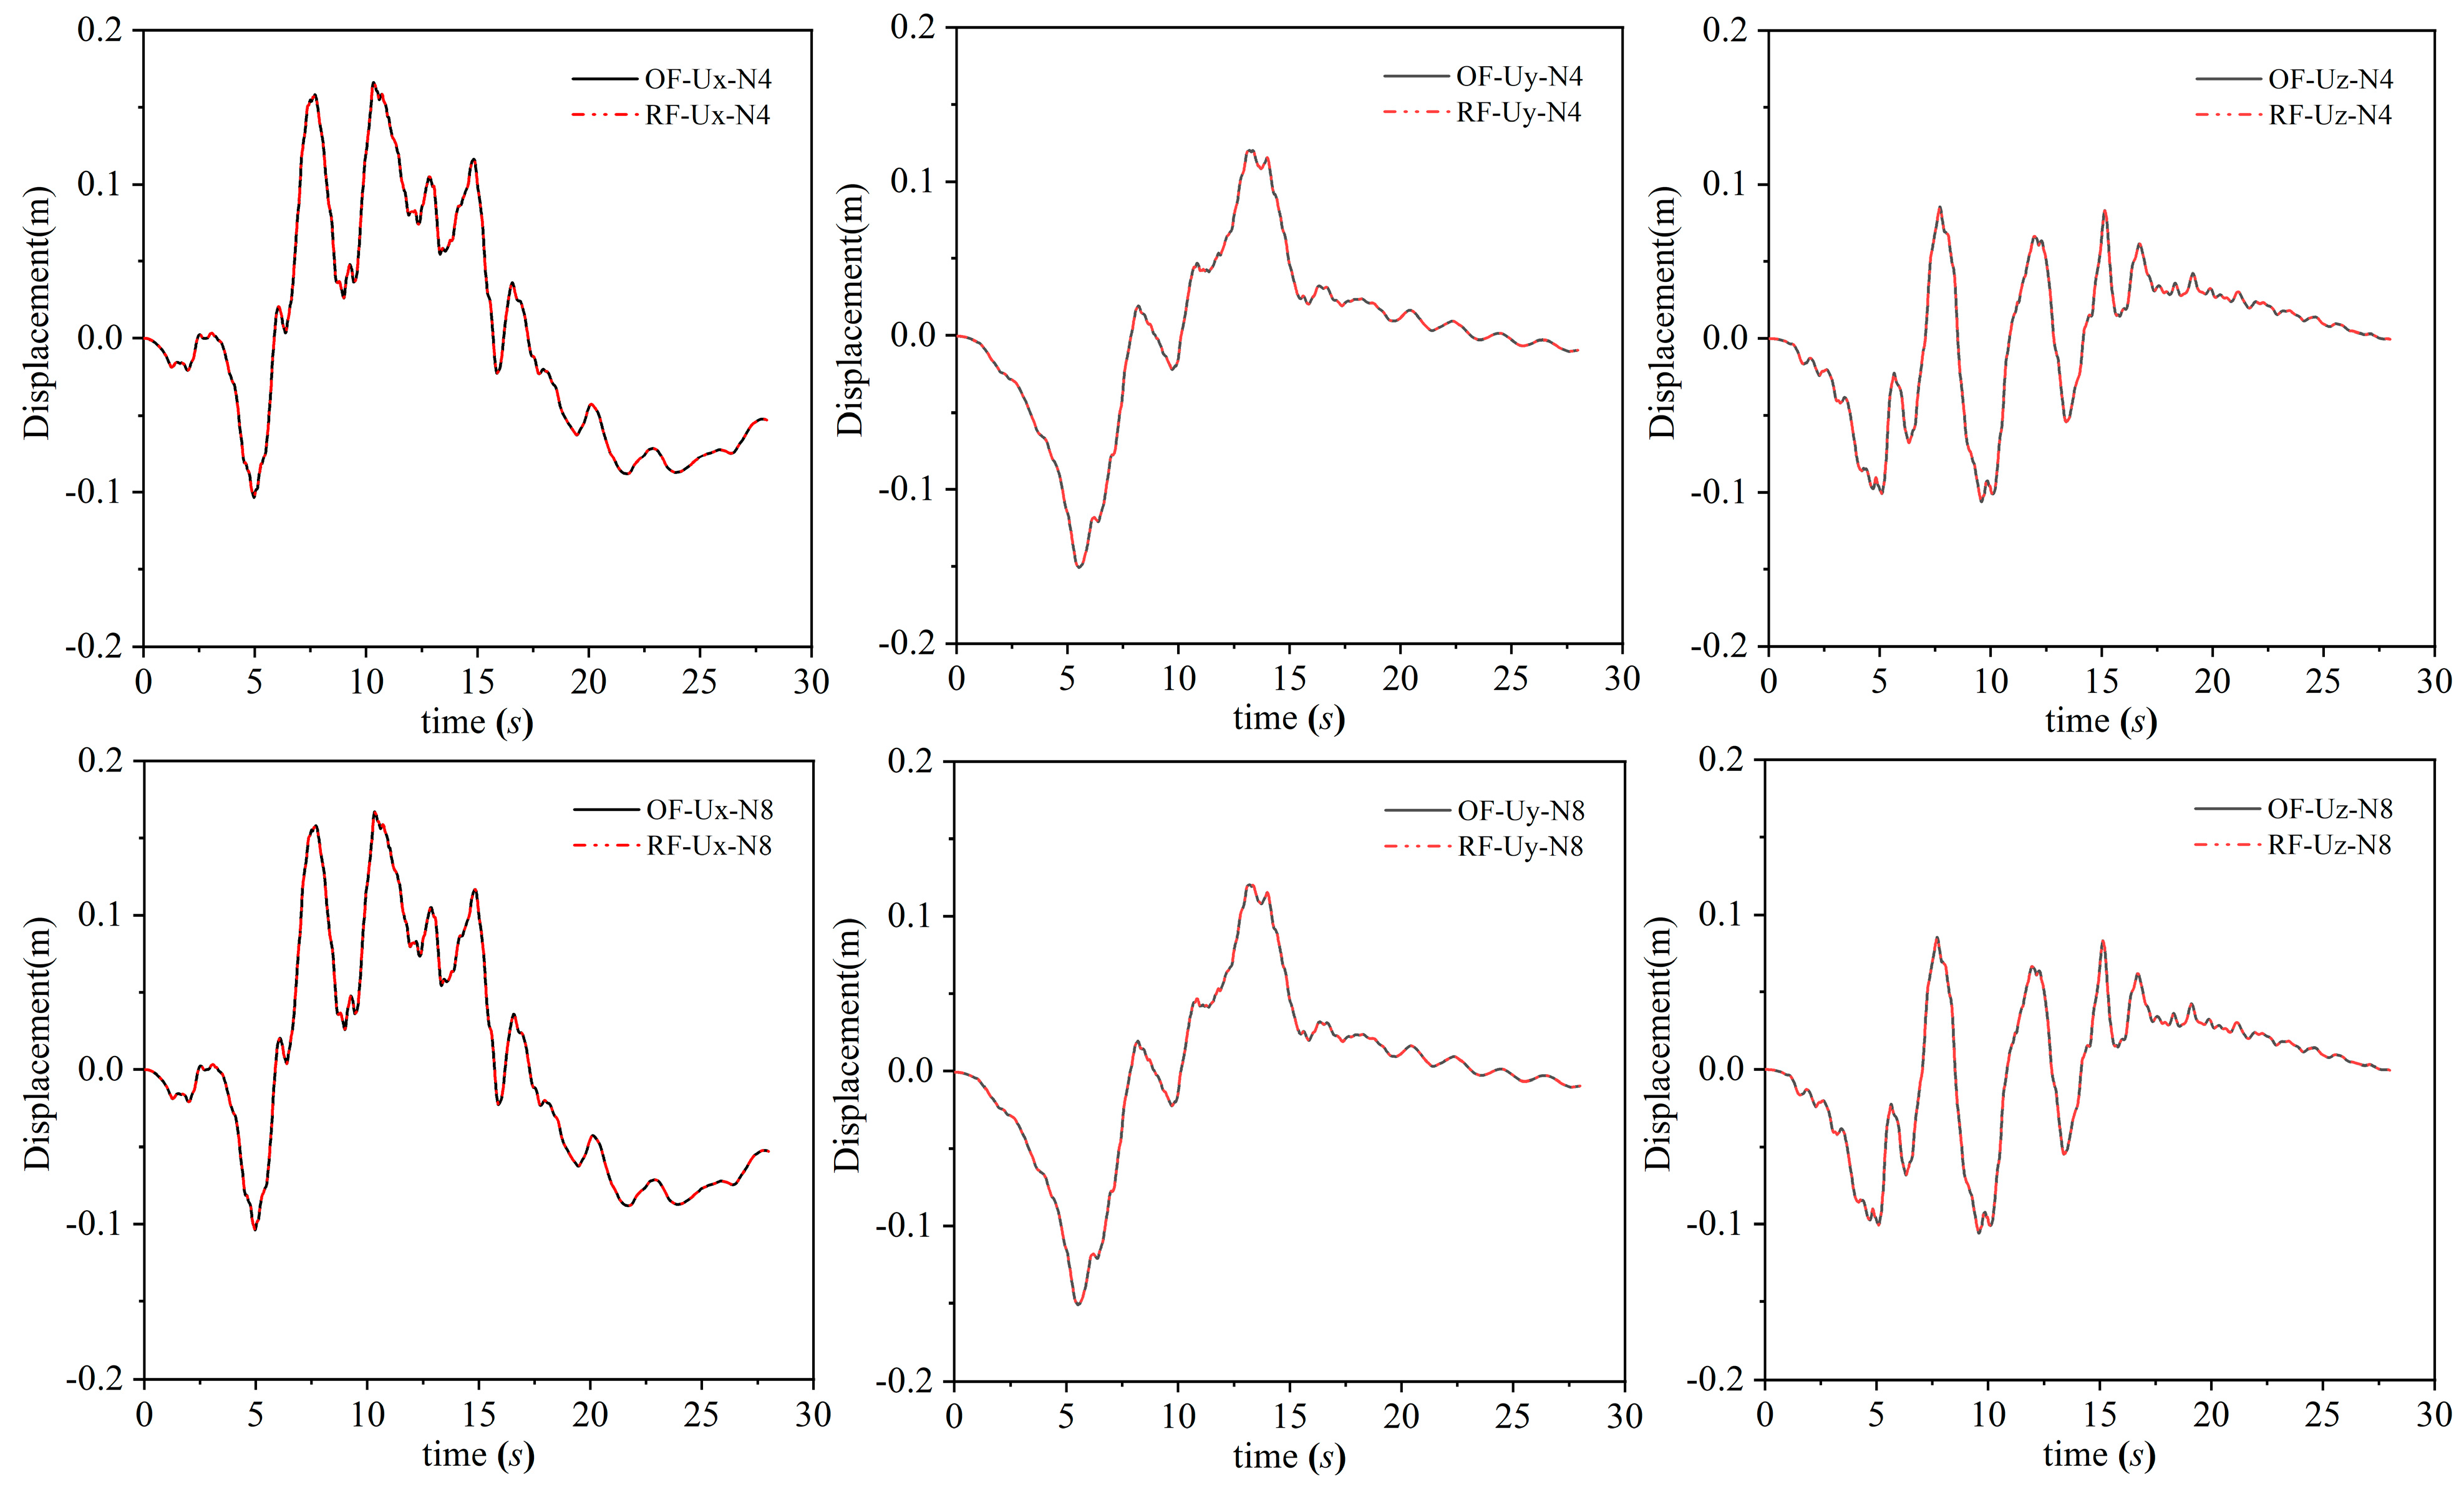
Figure 13 analyzes time–history displacements at key points N4 (drum screen top) and N8 (pump room top) under both foundation conditions, revealing similar structural oscillation patterns with minor amplitude variations: horizontal displacements at N4 measure 0.165 m (original) versus 0.164 m (replacement) in the x-direction, while N8 shows 0.167 m versus 0.166 m—a pattern mirrored in the z-direction. Vertically, N4 amplitudes register 0.151 m versus 0.150 m and N8 0.152 m versus 0.151 m. Increased foundation stiffness marginally reduces displacements without significantly affecting overall structural performance.

4.2.4. Seismic Stability Analysis

The pumping station structure should maintain sufficient stability during the earthquake, so anti-sliding and anti-overturning check is required, according to the specification [28]. And the safety factor of the anti-sliding and anti-overturning stability is 1.1 under the combined action of the operational limit safety earthquake and the static loads.
The safety factors of the pumping station structure can be calculated according to Equations (20) and (21) [29], respectively.
K s = ( μ P + P H ) / P H
K q = M k q / M q
where Ks and Kq are the safety factors of anti-sliding stability and anti-overturning stability, respectively. μ is the friction coefficient between the bottom plate and the foundation soil, which is determined by the test, and the value is 0.550 in this paper. P is the vertical value of all loads acting on acting on the pumping station structure to the sliding surface of the foundation, including the weight of the structure and equipment, the vertical seismic force, and buoyancy. P H is the horizontal value of all loads acting on the front wall of the pumping station structure, including horizontal seismic force, hydrodynamic pressure, and dynamic earth pressure. M k q and M q are the sum of the anti-overturning and overturning bending moments on the bottom of the foundation, respectively.
The minimum safety factors under different foundations are shown in Table 2.
It can be seen from Table 2 that the pump station structure has good anti-sliding and anti-overturning, both of which meet the requirements of the code and have enough safety guarantee under the condition of two types of foundation. In addition, safety margins exhibit negligible variation between original and replacement foundations.

5. Summaries and Conclusions

This study develops a novel CVs boundary based on MIT for static–dynamic coupled time-domain analysis, introducing non-thickness CVs elements to model radiation damping via viscous-spring artificial boundaries for soil–structure interaction, while formulating the MIT method through Newmark implicit integration characteristics to resolve boundary value problems in coupled systems.
Addressing practical needs for coupled FE modeling in complex engineering structures, a systematic ANSYS implementation framework for the MIT-based CVs boundary is presented, where UserElem API realizes CVs elements while APDL executes the MIT method. Validation via analytical benchmark cases confirms the solution’s reliability and effectiveness for static–dynamic coupled analyses.
Finally, the pumping station structure subjected to multi-load excitation was comprehensively evaluated from the discussion of structural stress, response, deformation, and seismic stability, and the influence of local non-homogeneity was also revealed. The principal findings are summarized as follows:
(1)
The influence of foundation replacement on the stress value and distribution of the pump station structure is not obvious. The principal tensile stress of the bottom of the water chamber, the corner of the floor to the wall, and the contact surface between the wall and backfill are larger and need to be reinforced. In contrast, the principal compressive stress meets the strength requirements of concrete.
(2)
Acceleration amplitudes increase with depth in both horizontal and vertical orientations, exhibiting consistent trends across foundation conditions. Structural acceleration variations primarily stem from pump station internal geometry and backfill interactions, while displacement amplitudes exhibit negligible variation.
(3)
The pump station structure has good anti-sliding and anti-overturning and has enough safety guarantees under the condition of two types of foundation.
(4)
The measured xenolith may have a slight influence on the seismic response and foundation safety of the pumping station structure.
(5)
Leveraging ANSYS’s advanced solvers and comprehensive features, including its extensive element library and robust pre-/postprocessing capabilities, this methodology demonstrates superior computational efficiency and modeling versatility for complex engineering applications.
The proposed method for soil–structure dynamic interaction analysis shows significant potential for application in NPPs. This study focuses primarily on the seismic response analysis of pumping station structures to provide technical support for their design. Although the model is capable of nonlinear analysis, its application to beyond-design-basis seismic scenarios will be addressed in subsequent research.
Author Contributions

Methodology, X.Y.; Software, J.L.; Validation, M.Z.; Investigation, J.Z.; Data curation, W.Y.; Writing—original draft, X.Y.; Funding acquisition, X.Y. All authors have read and agreed to the published version of the manuscript.

Funding

This research was funded by the National Natural Science Foundation of China, grant number 52108437, the Dalian University Special Program for Disciplinary Development (Interdisciplinary Youth Project), grant number DLUXK-2025-QNLG-006, and the National Natural Science Foundation of China, grant number U1839202.

Data Availability Statement

Data will be made available on request.

Conflicts of Interest

The authors declare that they have no known competing financial interests or personal relationships that could have appeared to influence the work reported in this paper.

References

  1. Ha, J.G.; Kim, D.S. Evaluation of seismic behavior of soils under nuclear containment structures via dynamic centrifuge test. Nucl. Eng. Des. 2014, 277, 64–75. [Google Scholar] [CrossRef]
  2. Nour, A.; Cherfaoui, A.; Gocevski, V.; Leger, P. Probabilistic seismic safety assessment of a CANDU 6 nuclear power plant including ambient vibration tests: Case study. Nucl. Eng. Des. 2016, 304, 125–138. [Google Scholar] [CrossRef]
  3. Genn, S. Safety goals for seismic and tsunami risks: Lessons learned from the Fukushima Daiichi disaster. Nucl. Eng. Des. 2014, 280, 449–463. [Google Scholar] [CrossRef]
  4. Kong, X.; Lin, G. Research advances on engineering structural seismic safety of nuclear power plant. Strat. Stud. CAE 2013, 15, 62–74. [Google Scholar]
  5. Orekhov, V.V. Analysis of interaction between structures and saturated soil beds subject to static and seismic effects. Soil Mech. Found. Eng. 2015, 52, 68–73. [Google Scholar] [CrossRef]
  6. Zhou, Z.; Wei, X. Seismic Soil-Structure Interaction Analysis of Isolated Nuclear Power Plants in Frequency Domain. Shock. Vib. 2016, 2016, 6127895. [Google Scholar] [CrossRef]
  7. Prasad, M.H.; Reddy, G.R.; Dubey, P.N.; Srividya, A.; Verma, A.K. Reliability estimation of structures under stochastic loading-A case study on nuclear piping. Nucl. Eng. Des. 2013, 254, 185–193. [Google Scholar] [CrossRef]
  8. Kumar, M.; Whittaker, A.S.; Kennedy, R.P.; Johnson, J.J.; Kammerer, A. Seismic probabilistic risk assessment for seismically isolated safety-related nuclear facilities. Nucl. Eng. Des. 2017, 313, 386–400. [Google Scholar] [CrossRef]
  9. Zhou, Y.; Xu, B.; Pang, R.; Zou, D.; Kong, X. Stochastic seismic response and stability reliability analysis of a vertical retaining wall in front of the pumping station of a nuclear power plant using the probability density evolution method. Nucl. Eng. Des. 2018, 334, 110–120. [Google Scholar] [CrossRef]
  10. Qu, Y.Q.; Zou, D.G.; Kong, X.J.; Xu, B.; Yu, X. A flexible various-scale approach for soil- structure interaction and its application in seismic damage analysis of the underground structure of nuclear power plants. Sci. China Technol. Sci. 2018, 61, 1092–1106. [Google Scholar] [CrossRef]
  11. Onitsuka, S.; Iijima, T.; Yamada, T.; Yoshimura, S. Seismic analysis of nuclear power plants by using three-dimensional finite element models: A review. J. Nucl. Sci. Technol. 2018, 56, 1–16. [Google Scholar] [CrossRef]
  12. Beer, G. The Boundary Element Method with Programming: For Engineers and Scientists; Springer Vienna: Tivoligasse, Vienna, 2008. [Google Scholar]
  13. Wolf, J.P. The Scaled Boundary Finite Element Method; John Wiley & Sons: Chichester, UK, 2003. [Google Scholar]
  14. Rizos, D.; Wang, Z. Coupled BEM-FEM solutions for direct time domain soil-structure interaction analysis. Eng. Anal. Bound. Elem. 2002, 26, 877–888. [Google Scholar] [CrossRef]
  15. Romero, A.; Galvín, P. A BEM-FEM using layered half-space Green’s function in time domain for SSI analyses. Eng. Anal. Bound. Elem. 2015, 55, 93–103. [Google Scholar] [CrossRef]
  16. Schauer, M.; Langer, S. Large scale simulation of wave propagation in soils interacting with structures using FEM and SBFEM. J. Comput. Acoust. 2011, 19, 75–93. [Google Scholar] [CrossRef]
  17. Schauer, M.; Rodriguez, G.R. A coupled FEM-SBFEM approach for soil-structure-interaction analysis using non-matching meshes at the near-field far-field interface. Soil Dyn. Earthq. Eng. 2019, 121, 466–479. [Google Scholar] [CrossRef]
  18. Yin, X.; Li, J.; Wu, C.; Lin, G. ANSYS implementation of damping solvent stepwise extraction method for nonlinear seismic analysis of large 3-D structures. Soil Dyn. Earthq. Eng. 2013, 44, 139–152. [Google Scholar] [CrossRef]
  19. GB50267-2019; Code for Seismic Design of Nuclear Power Plants. China Architecture and Building: Beijing, China, 2019.
  20. Lysmer, J.; Kuhlmeyer, R.L. Finite dynamic model for infinite media. J. Eng. Mech. 1969, 95, 859–878. [Google Scholar] [CrossRef]
  21. Liu, J.; Du, Y.; Du, X.; Wang, Z.; Wu, J. 3D viscous-spring artificial boundary in time domain. Earthq. Engin. Engin. Vib. 2006, 5, 93–102. [Google Scholar] [CrossRef]
  22. Liao, Z.P.; Wong, H.L. A transmitting boundary for the numerical simulation of elastic wave propagation. Int. J. Soil Dyn. Earthq. Eng. 1984, 3, 174–183. [Google Scholar] [CrossRef]
  23. Newmark, N.M. A Method of Computation for Structural Dynamics. ASCE J. Eng. Mech. Div. 1959, 85, 67–94. [Google Scholar] [CrossRef]
  24. ANSYS Incorporated. Programmer’s Manual for ANSYS, ANSYS Release 11.0; ANSYS Incorporated: Canonsburg, PA, USA, 2007. [Google Scholar]
  25. Nascimbene, R. An Arbitrary Cross Section, Locking Free Shear-flexible Curved Beam Finite Element. Int. J. Comput. Methods Eng. Sci. Mech. 2013, 14, 90–103. [Google Scholar] [CrossRef]
  26. U.S. Nuclear Regulatory Commission. Regulatory Guide 1.60: Design Response Spectra for Seismic Design of Nuclear Power Plant; U.S. Nuclear Regulatory Commission: Washington, DC, USA, 2014.
  27. Wong, H.L. Effect of surface topography on the diffraction of P, SV, and Rayleigh waves. Bull. Seismol. Soc. Am. 1982, 72, 1167–1183. [Google Scholar]
  28. NB/T 25002; Code for Design of Maritime Structures of Nuclear Power Plants. National Energy Board of China: Beijing, China, 2011.
  29. NB/T25046-2015; Code for Hydraulic Design of Nuclear Power Plants. National Energy Board of China: Beijing, China, 2019.
Figure 1. Section of pumping station structure.
Buildings 15 02951 g001
Figure 2. The static–dynamic coupled analysis system.
Buildings 15 02951 g002
Figure 3. Sketch diagram of three-dimensional CVs element.
Buildings 15 02951 g003
Figure 4. Flowchart of ANSYS implementation for static–dynamic coupled analysis.
Buildings 15 02951 g004
Figure 5. Site condition of pumping station: slice map at −24.00 m elevation.
Buildings 15 02951 g005
Figure 6. Finite element model of pumping station structure and soil condition.
Buildings 15 02951 g006
Figure 7. RG1.60 design response spectra (5%) and input acceleration time history.
Buildings 15 02951 g007
Figure 8. The FE model of semi-circular canyon and amplification patterns induced by incident SV waves.
Buildings 15 02951 g008
Figure 9. Total displacement and principal stress of pumping station structure with different boundaries.
Buildings 15 02951 g009
Figure 10. The 1st principal stress of pumping station structure under different foundation conditions (MPa).
Buildings 15 02951 g010
Figure 11. The 3rd principal stress of pumping station structure under different foundation conditions (MPa).
Buildings 15 02951 g011
Figure 12. Peak acceleration profiles versus elevation under different foundation conditions.
Buildings 15 02951 g012
Figure 13. The displacement time history at key points N4 and N8 under different foundation conditions.
Buildings 15 02951 g013
Table 1. Material parameters of pumping station structure–soil interaction system.
ParametersSlightly Weathered GraniteModerately Weathered GraniteHighly Weathered GneissConcrete
Weight r (kN/m3)26.0025.4019.6024.00
Elastic modulus E (GPa)23.972.000.48642.25
Poisson’s ratio vd0.230.260.280.17
Dynamic elastic modulus Ed (GPa)33.0611.402.4332.50
Dynamic shear modulus Gd (GPa)12.313.980.8313.89
Dynamic Poisson’s ratio vd0.340.430.470.20
Compressed wave velocity cp (m/s)428735962618-
Shear wave velocity cs (m/s)20971237628-
Table 2. Minimum safety factors under different foundation conditions.
Foundation TypeKsKqCode Requirement
Original foundation1.921.751.1
Replacement foundation2.031.881.1
Disclaimer/Publisher’s Note: The statements, opinions and data contained in all publications are solely those of the individual author(s) and contributor(s) and not of MDPI and/or the editor(s). MDPI and/or the editor(s) disclaim responsibility for any injury to people or property resulting from any ideas, methods, instructions or products referred to in the content.