Article

A Sustainable Hybrid Approach to Improve Footing Bearing Capacity Using EICP and Inclined Micropiles

Chair of Research and Studies in Strengthening and Rehabilitation of Structures, Department of Civil Engineering, College of Engineering, King Saud University, P.O. Box 800, Riyadh 11421, Saudi Arabia
*
Author to whom correspondence should be addressed.
Buildings 2025, 15(16), 2915; https://doi.org/10.3390/buildings15162915
Submission received: 17 July 2025 / Revised: 8 August 2025 / Accepted: 12 August 2025 / Published: 18 August 2025
(This article belongs to the Section Building Structures)

Abstract

This study investigates an innovative and sustainable hybrid approach combining enzyme-induced carbonate precipitation (EICP) with inclined micropile reinforcement systems for improving the soil bearing capacity of existing footings. The research evaluated two distinct EICP implementation methods across eleven experimental configurations, including three micropile inclination angles (90°, 105°, and 120°) for improving the bearing capacity of a square footing. The first method (method M1) involved injecting 150 mL of EICP solution through each of the eight perforated micropiles with a 21-day curing period, while the second method (method M2) employed staged injections around the footing totaling 1200 mL over two days with a 21–22-day curing period. Results demonstrated that the micropile-confined system combined with the EICP treatment significantly enhanced bearing capacity, with effectiveness increasing proportionally to pile inclination angles. While the EICP injection method M1 caused a 32% to 83% increase, method M2 exhibited 66% to 125% enhancement in bearing capacity for different micropile inclinations. Based on experimental validation, an analytical procedure was developed for predicting the bearing capacity of footings. This hybrid technique not only ensures structural effectiveness but also represents a sustainable, eco-friendly alternative to conventional ground improvement methods by reducing reliance on energy-intensive or chemically hazardous processes.

1. Introduction

In response to increasing sustainability concerns, modern ground improvement practices are evolving to incorporate innovative and environmentally friendly alternatives to traditional methods. The prevalent use of ordinary Portland cement (OPC) poses significant sustainability challenges, primarily due to its energy-intensive production process, which contributes approximately 7% of global CO2 emissions, along with notable releases of sulfur and nitrogen. Over the past decade, researchers have focused on developing eco-friendly binders as viable substitutes for OPC, addressing the construction industry’s urgent need to implement sustainable practices while ensuring structural integrity and performance. This shift towards alternative ground improvement methods reflects a growing recognition of the environmental impact associated with conventional techniques [1,2].
One promising alternative to OPC is microbial-induced carbonate precipitation (MICP), which involves the utilization of bacteria (Sporosarcina pasteurii) and urea hydrolysis to achieve soil cementation. Hadi et al. [3] employed MICP to consolidate sand columns simulating cement mortar conditions. The results showed that higher bacterial cell counts and longer incubation periods significantly enhanced urease activity and calcite deposition, which was confirmed by SEM and XRD analysis [3]. MICP has been proposed as a means to achieve substantial reductions in CO2 emissions [4,5]. Research indicates that MICP can effectively address geotechnical challenges such as slope stability, erosion control, prevention of under-seepage, improved bearing capacity (BC), tunneling support, and mitigation of seismic settlement in granular soils. However, the practical implementation of MICP faces limitations including: (i) need for multiple treatment cycles, (ii) reduced effectiveness in fine-grained soils, (iii) stringent environmental requirements for bacterial viability, and (iv) complex field implementation procedures [6,7,8,9,10,11].
Enzyme-induced carbonate precipitation (EICP) represents an evolution in bio-inspired ground improvement, addressing many of MICP’s limitations by utilizing free urease enzymes obtained from plant sources [12]. In contrast to MICP, the urease enzymes utilized in EICP are approximately 12 nm in size and water-soluble [7], which improves the enzyme solution’s ability to infiltrate soil pores. The use of free enzymes also removes the necessity for supplying nutrients to sustain bacterial growth, simplifying the application process in the field and lowering treatment expenses [12]. Moreover, since EICP does not involve the use of living organisms, it is unaffected by the cellular processes or metabolic rates typical of microbial life [13]. In a recent study, EICP-modified sand was tested to study the effect of different parameters on the shear strength and permeability of the treated sand and optimizing the EICP treatment procedure [14]. The authors reported an increase in unconfined compressive strength and a reduction in permeability of sand.
Recent research has demonstrated significant advances in bio-mediated soil improvement techniques through various approaches. Wen [15] investigated the strength properties of high liquid limit soil mixed with bioenzyme and 4% cement or lime. The test results showed that adding up to 0.6% bioenzyme significantly enhanced shear strength, cohesion, and internal friction angle, with cement-treated specimens outperforming lime-treated ones. Zhao et al. [16] developed an innovative biomimetic method combining poly-acrylic acid hydrogel networks with EICP, achieving soil strengths up to 4.8 × 10³ kPa and 96% ammonium removal efficiency through a root-mimicking structure. Building on microbial approaches, another study [17] explored the diversity of Sporosarcina-like bacterial strains in biocementation applications, expanding our understanding of microbial communities in soil treatment. Further, Ghasemi and Montoya [18] examined the effects of treatment chemistry on the properties of soil, providing insights into the optimization of bio-mediated soil improvement processes. Zhang et al. [19] explored the use of EICP for cementing sands using various injection methods and rates. The test results revealed that the proposed parallel injection method, especially at a higher injection rate, improved cementation uniformity, reduced clogging, and led to stronger bonds with better hydraulic conductivity. Xue et al. [20] investigated the use of soybean-based EICP to stabilize recycled sand obtained from construction waste. The results show that, while low-temperature curing reduced surface clogging and minimized strength reduction, the additional calcite precipitation at the surface obstructed the treatment’s effectiveness. Despite a slight strength reduction in coarse recycled sand, the soybean-based EICP demonstrated promising potential for improving recycled sand as a fill material. Xu et al. [21] evaluated the effectiveness of EICP in enhancing wind erosion resistance of desert sand by applying a binder coating. The test results showed that EICP treatment significantly improved the wind erosion resistance of desert sand, with optimal conditions for an enzyme–cementation ratio of 1.082, solution concentration of 1.282 mol/L, and spraying volume of 8.7 L/m2, leading to a substantial increase in calcite crystals and stronger particle bonding. Liu et al. [22] compared EICP and MICP for stabilizing red mud against wind erosion, highlighting the benefits of using chitosan. Chitosan enhances calcium carbonate nucleation in EICP, improving soil strength and engineering properties more significantly than MICP. The results show that combining chitosan with EICP leads to superior wind erosion resistance. Together, these studies highlight the evolving nature of bio-based soil stabilization techniques, from biomimetic composites to microbial applications, offering promising sustainable alternatives to traditional soil improvement methods.
A study [23] has shown through life cycle assessment (LCA) that EICP is a sustainable alternative to OPC for soil stabilization. It was shown that EICP treatment results in approximately 90% lower abiotic depletion potential and 3% lower global warming potential compared to PC. A comparative analysis also revealed that EICP performs better environmentally at lower target compressive strengths, making it a viable low-carbon solution for light-to-moderate soil stabilization needs. Another study [24] has also shown through LCA that EICP is potentially more sustainable than water application for dust control, particularly as watering frequency increases. With further development focused on preventing EICP process emissions and reducing production costs, EICP could become more viable for soil stabilization.
Besides the ground improvement methods, micropiles have emerged as an effective solution for various foundation challenges, such as underpinning existing foundations resting on difficult soils and for carrying additional loads. They can be classified into two types: those that directly resist loads and those that strengthen the soil to form a hybrid support system [25]. Key design parameters, including pile inclination, length, and spacing, significantly influence the performance of micropiles in improving the load-carrying capacity of foundations, particularly in renovated structures. Micropiles have demonstrated their effectiveness in improving ground conditions, boosting bearing capacity, and minimizing settlement, particularly for strengthening existing foundations [26,27,28,29]. These small-diameter drilled piles, filled with grout and reinforced with steel, have been extensively studied as structural elements. Besides experimental investigations, numerical studies have also been conducted, though they often face modeling challenges. For instance, a study on the ultimate bearing capacity (UBC) of two closely spaced strip footings on granular soil [30] showed that artificially restricting horizontal and rotational movements can unrealistically increase UBC, whereas applying realistic boundary conditions revealed no such enhancement.
In related studies, researchers have explored various techniques for strengthening buildings. Thyman and Johnson [31] investigated methods such as steel tube piles and soil injection, emphasizing the importance of early assessment and method selection. Motlagh et al. [32] focused on seismic retrofitting techniques, including compaction grouting, underpinning, and micropiles, specifically for foundations in active seismic zones. Additionally, Bruce et al. [33] provided a comprehensive step-by-step process for designing micropiles, covering aspects such as feasibility assessment, data review, loading combinations, corrosion protection, and seismic considerations.
This research plays a key role in advancing sustainable ground improvement methods, providing substitutes to conventional methods and addressing environmental concerns. By incorporating innovative techniques like MICP, EICP, and micropiles, civil engineers can improve soil properties, enhance stability, and promote the long-term durability of infrastructure projects in a more sustainable way. The present study introduces a novel ground improvement technique combining EICP with micropile confinement to enhance the bearing capacity of existing footings. While past studies have investigated micropiles alone [25,26,27,28,29] or focused on EICP primarily for wind erosion control [21,22] or unconfined compressive strength (UCS) enhancement in laboratory specimens, this study uniquely explores the integrated use of EICP injection through inclined micropiles and direct surface injection. This combined and practical approach for bearing capacity enhancement of existing footings has not been reported previously. A square footing placed on sand and confined by micropiles spaced at 0.33B (where B is the footing size) and having inclinations of 90°, 105°, and 120° were subjected to quasi-static loading, which was applied in equal increments. In the first method of EICP treatment, the EICP was injected into the soil through the perforations in piles, while in the second method of application, 50 mL syringes were employed to inject the solution of EICP for two consecutive days, at specified injecting points around the footing. SEM examination was used to verify the cementation of sand by the EICP solution.

2. EICP: Theoretical Framework

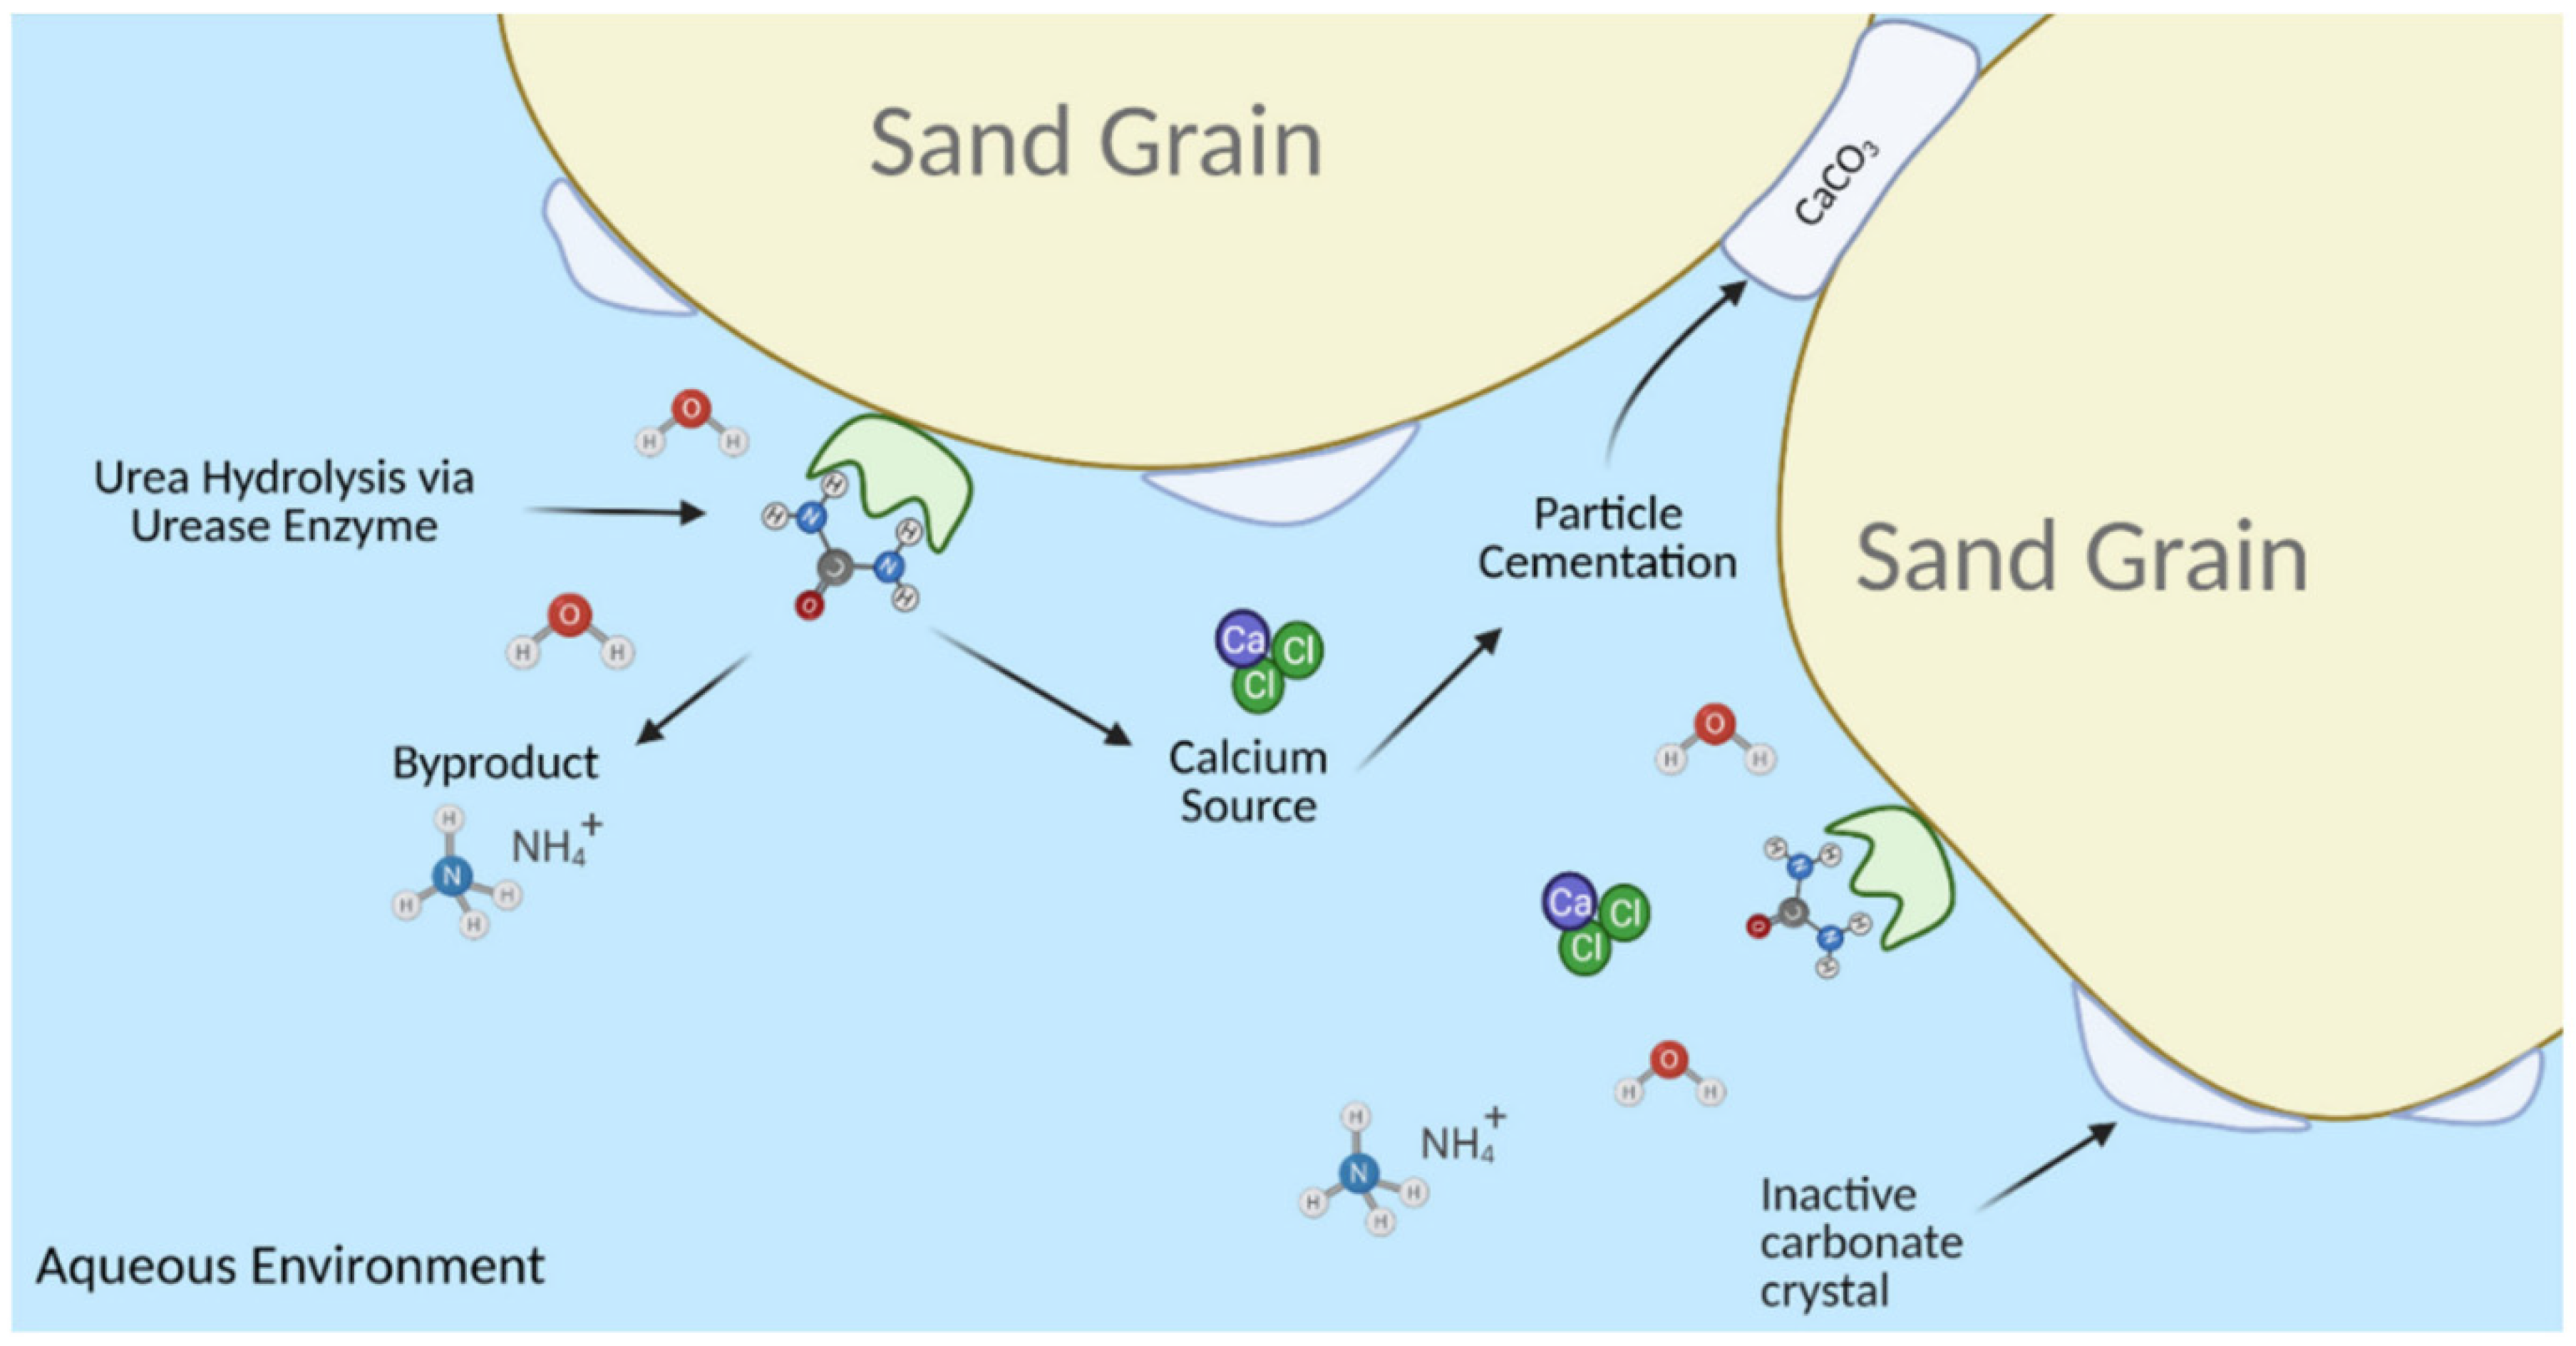
Urease-assisted carbonate mineralization, irrespective of the enzyme source, entails the hydrolysis of urea by urease. This chemical process yields ammonia (NH3) and carbamate, which are unstable and undergo further decomposition to release an additional ammonia molecule and carbonic acid (H2CO3), as demonstrated in Equation (1) [34]. When water is present, the reaction products interact to generate bicarbonate, ammonium, and hydroxide ions, as depicted in Equations (2) and (3) [35].
H 2 N C O N H 2 + 2 H 2 O u r e a s e H 2 C O 3 + 2 N H 3
H 2 C O 3 H C O 3 + H +
N H 3 + H 2 O N H 4 + + O H
The generation of hydroxide ions from the reaction (Equation (3)) causes a pH increase, which consequently facilitates the release of carbonate ions, as illustrated in Equation (4).
H C O 3 + O H C O 3 2 + H 2 O
This entire sequence of events can be summarized by Equation (5) and visualized in Figure 1.
C O ( N H 2 ) 2 ( s ) + 2 H 2 O urease   enzyme   2 N H 4   ( a q ) + + C O 3   ( a q ) 2
The pH increase, together with the dissolved Ca2+, creates favorable circumstances for ion fusion, resulting in the formation of calcium carbonate, as described in Equations (6) and (7).
C a C l 2 ( s ) H 2 O C a           ( a q ) 2 + + 2 C l           ( a q )
C a             ( a q ) 2 + + C O         3 ( a q ) 2 p r e c i p i t a t i o n   C a C O 3 ( s )
The comprehensive process of EICP is succinctly outlined in Figure 2. Carbonate formation occurs through the provision of carbonate ions and alkalinity generated by urea hydrolysis.
Active calcium carbonate crystals accumulate at the contact points between soil grains, effectively binding them together and enhancing soil cementation. Nevertheless, it is important to note that carbonate formation can also occur at locations other than sand particle contacts, leading to the formation of inactive crystals that have no contribution to the cementation of soil particles (Figure 2). However, when the sand is well graded, the inactive crystals reduce as the grain to grain contact locations are enhanced in the well-graded sand.

3. Materials

3.1. Sand

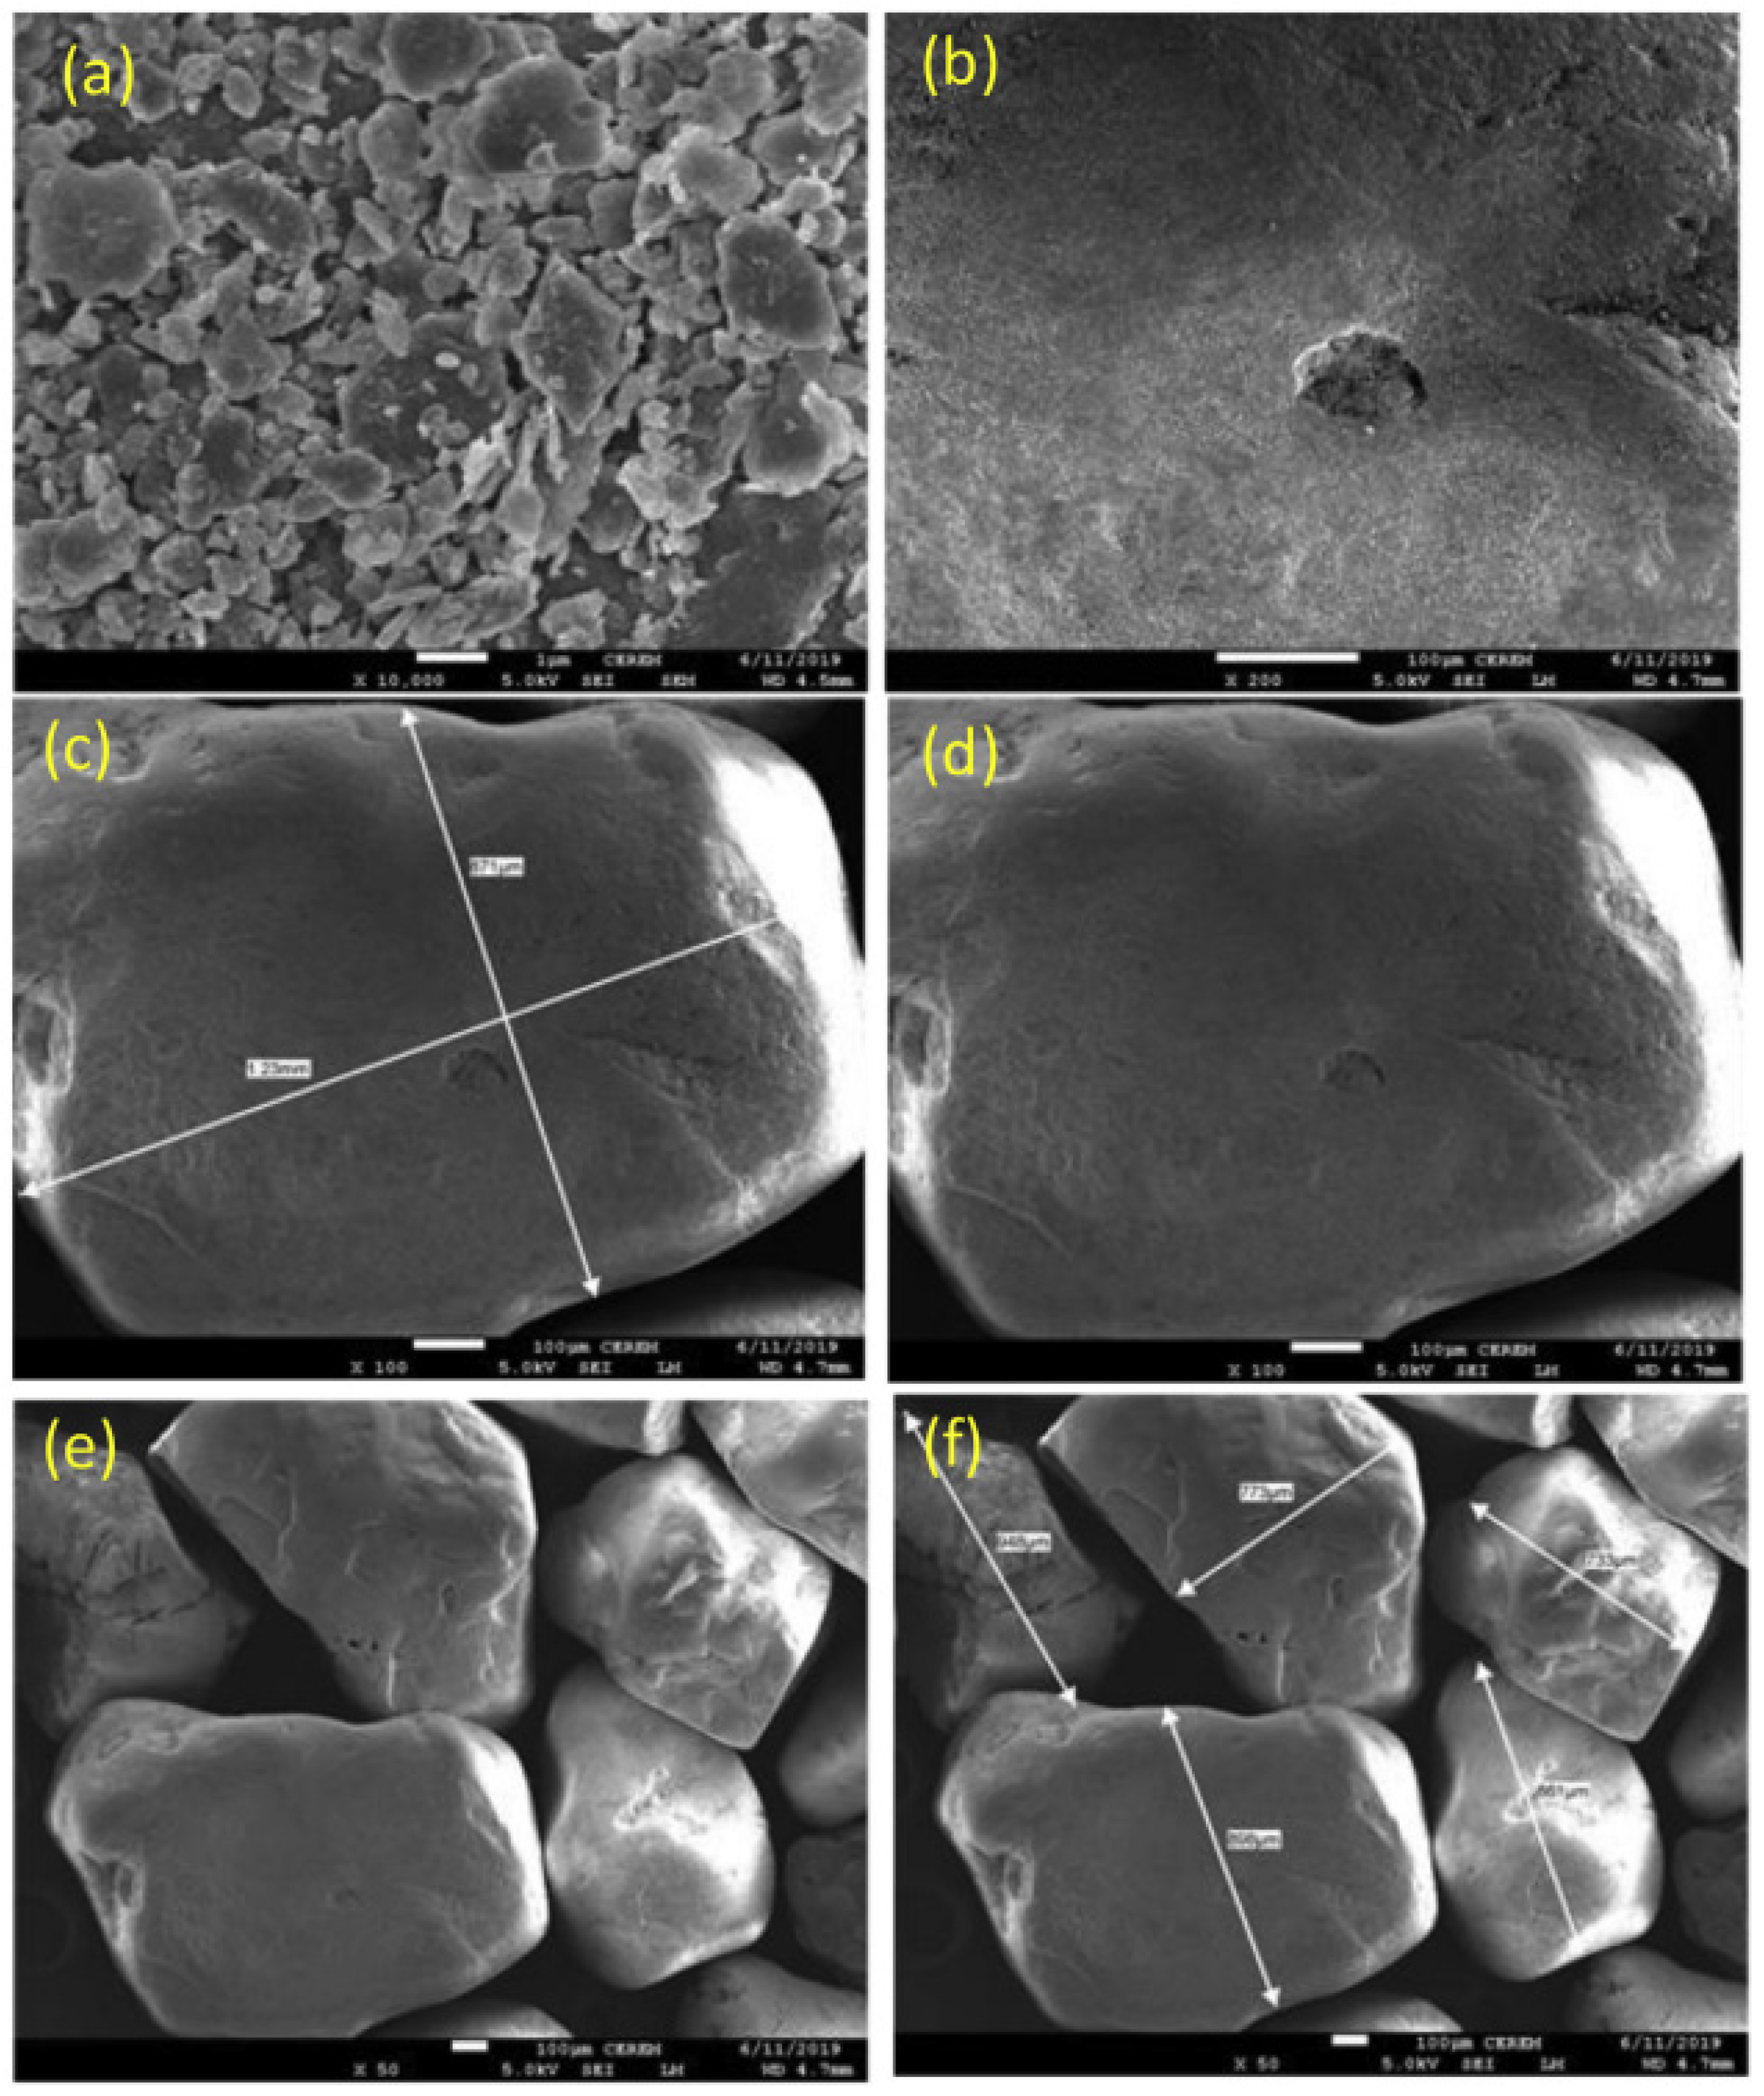
The sand used in the experiments was sourced from the Alrasheed plant, located in Riyadh. While the engineering properties of Alrasheed sand are similar to the Ottawa 20/30 sand, there are minor variations, particularly in the grain size distribution, with Alrasheed sand containing a slightly higher percentage of coarse particles. The minimum and maximum void ratios of sand are 0.61 and 0.84, respectively. The minimum and maximum dry densities are 1.44 g/cm3 and 1.65 g/cm3, respectively. The uniformity coefficient and specific gravity of the sand are 1.41 and 1.65, respectively. Moreover, 10% of the sand particles are finer than 0.46 mm (D10), and 60% are finer than 0.65 mm (D60). Additionally, Figure 3 provides SEM images of Alrasheed sand, showcasing grain shape, size, and surface texture at various levels of magnification [36].

3.2. EICP Solution Preparation

Almajed et al. [37] found that a mixture of 1 M urea, 0.67 M CaCl2, and 3 g/L urease enzyme was the optimal composition for EICP treatment of soil stabilization, achieving high precipitation mass and efficiency. They also observed increased strength of the soil due to the CaCO3 content of over 3%. In a later study, they discovered that the addition of non-fat powdered milk to the EICP solution resulted in remarkably strong sand specimens with unconfined compressive strength ranging from 1.6 to 1.8 MPa even at low carbonate content (<1.4%). Thus, the EICP solution employed was prepared using 1 M/L urea, 0.67 M/L CaCl2·2H2O, 3 g/L urease enzyme, and 4 g/L non-fat dry milk.

4. Test Setup and Procedures

4.1. Test Matrix

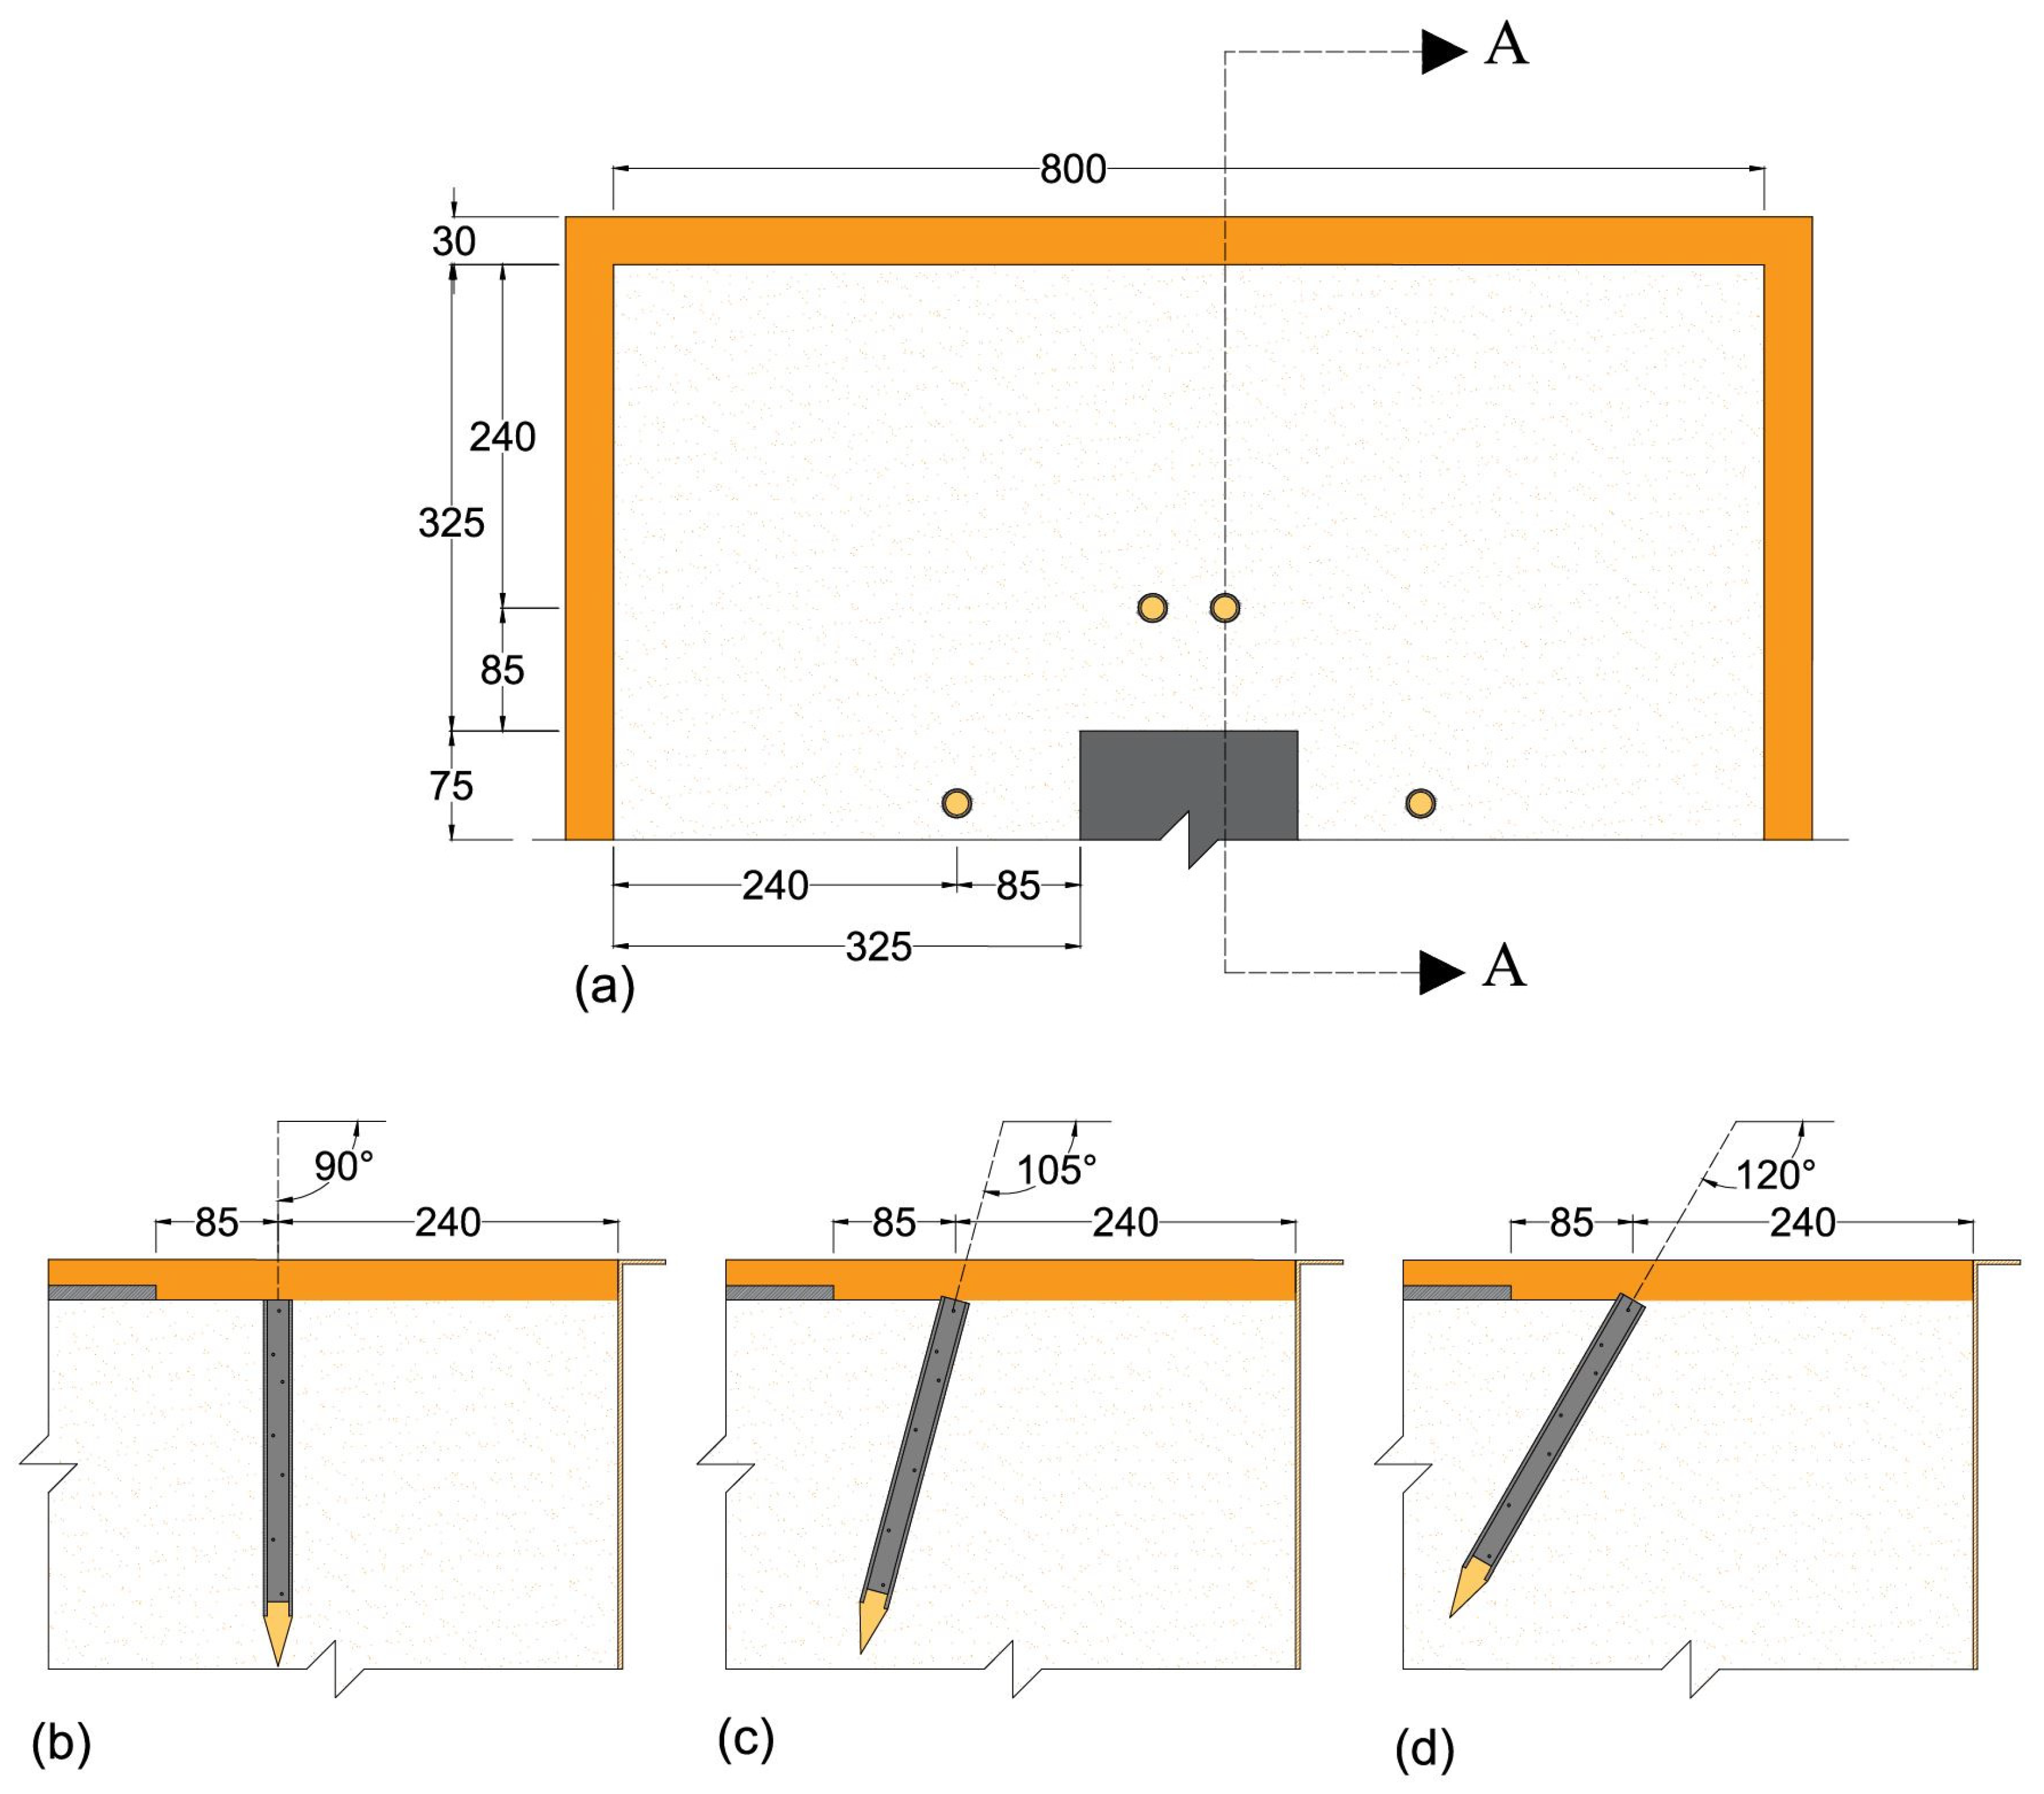
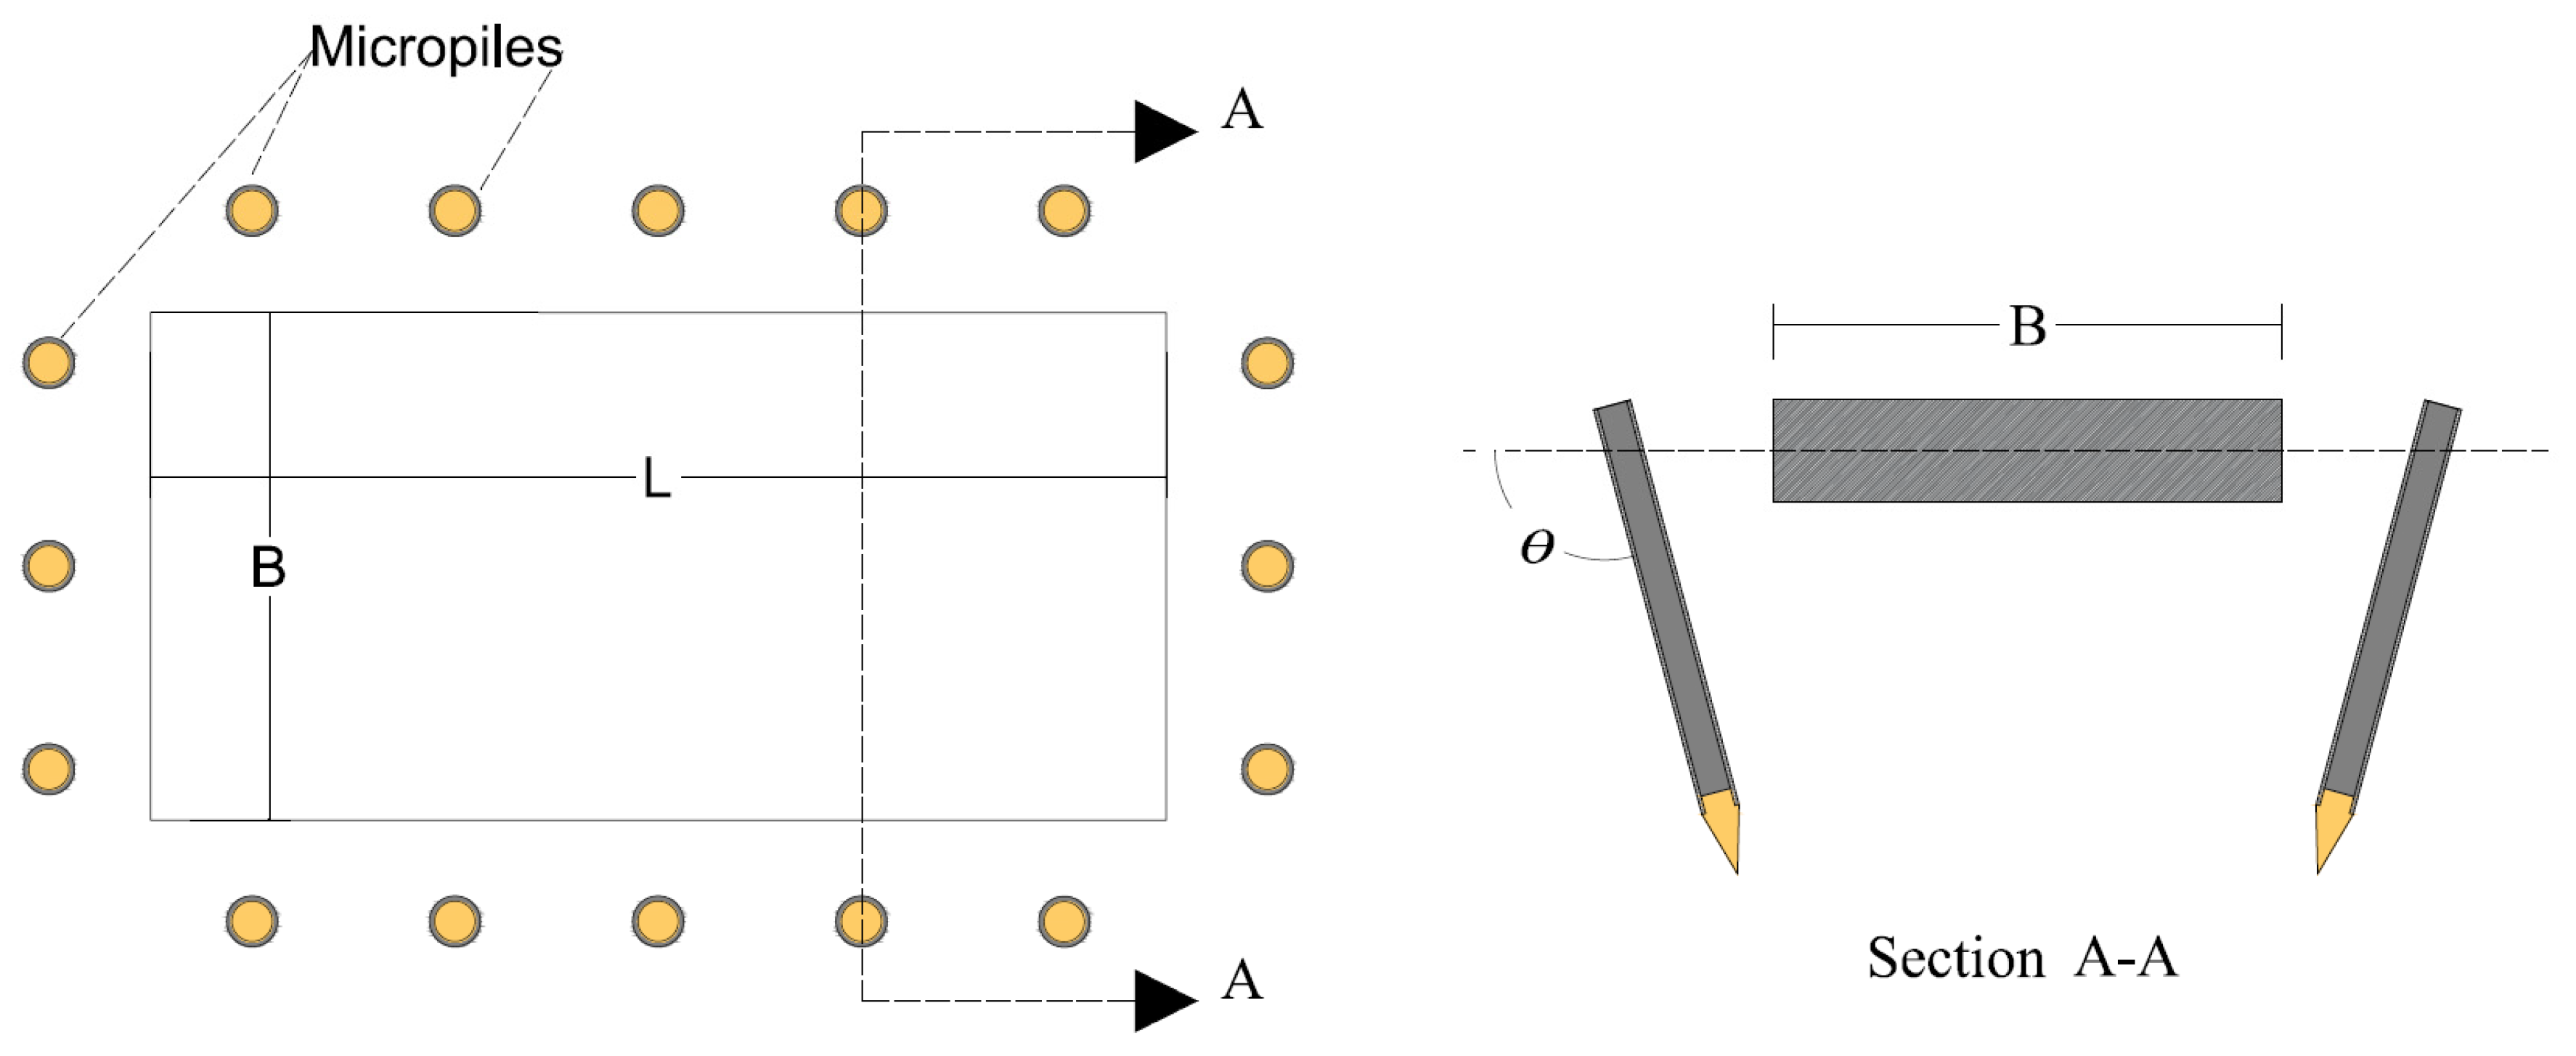
In the authors’ previous study [38], the bearing capacity of a 150 mm square footing supported on sand was investigated by confining the footing with inclined micropiles placed at different spacings around the footing. The current study extends the concept of footing confinement using micropiles spaced at 0.33B, with further enhancement of bearing capacity achieved through the injection of an EICP solution into the soil. This solution was injected either through perforations in the hollow micropiles (method of EICP injection M1) or directly into the surrounding soil using syringes (method of EICP injection M2). Three micropile inclinations (90°, 105°, and 120°) were considered, following the approach of the previous study [38]. It is important to note that the pile inclination was measured with the horizontal (Figure 4), as this approach was useful for developing a model of confinement provided by micropiles. A zero inclination indicates no confinement, while confinement increases with the angle of inclination. This relationship continues to rise as the angle increases, but starts to decrease after reaching a certain angle, becoming zero again at 180°. The micropile inclination in experiments was varied up to 120° because the micropiles near the footing corner meet at their tips. Further increases in inclination could be considered for shorter pile lengths.
Further bearing capacity enhancement of the footing was also examined by EICP injection into the surrounding soil alone (method of injection M2), without the use of micropiles. Thus, a total of eleven footings involving single tests were tested, which included a control footing and remaining confined by micropiles and/or EICP treated by different methods. The experimental test matrix is presented in Table 1, and the schematic diagrams of the test setup, which depict the steel plate footing supported on sand inside a steel tank and confined by sloping piles, are provided in Figure 4.

4.2. Micropile Details

The micropiles of 250 mm length were prepared using PVC pipes of outer diameter of 21 mm for the stem and with a wooden tip, as illustrated in Figure 5. For the tests T5 to T7 (Table 1), perforated micropiles were used, whereas for T2 to T4 and T8 to T10 non-perforated piles were used. To ensure the smooth flow of the EICP solution from perforations into the sand, randomly distributed 2 mm diameter holes were drilled in PVC micropiles. Additionally, the PVC micropile surfaces were abraded with 80-grit sandpaper to enhance roughness, ensuring a frictional characteristic similar to that of concrete micropiles, as illustrated in Figure 5.

4.3. Test Setup

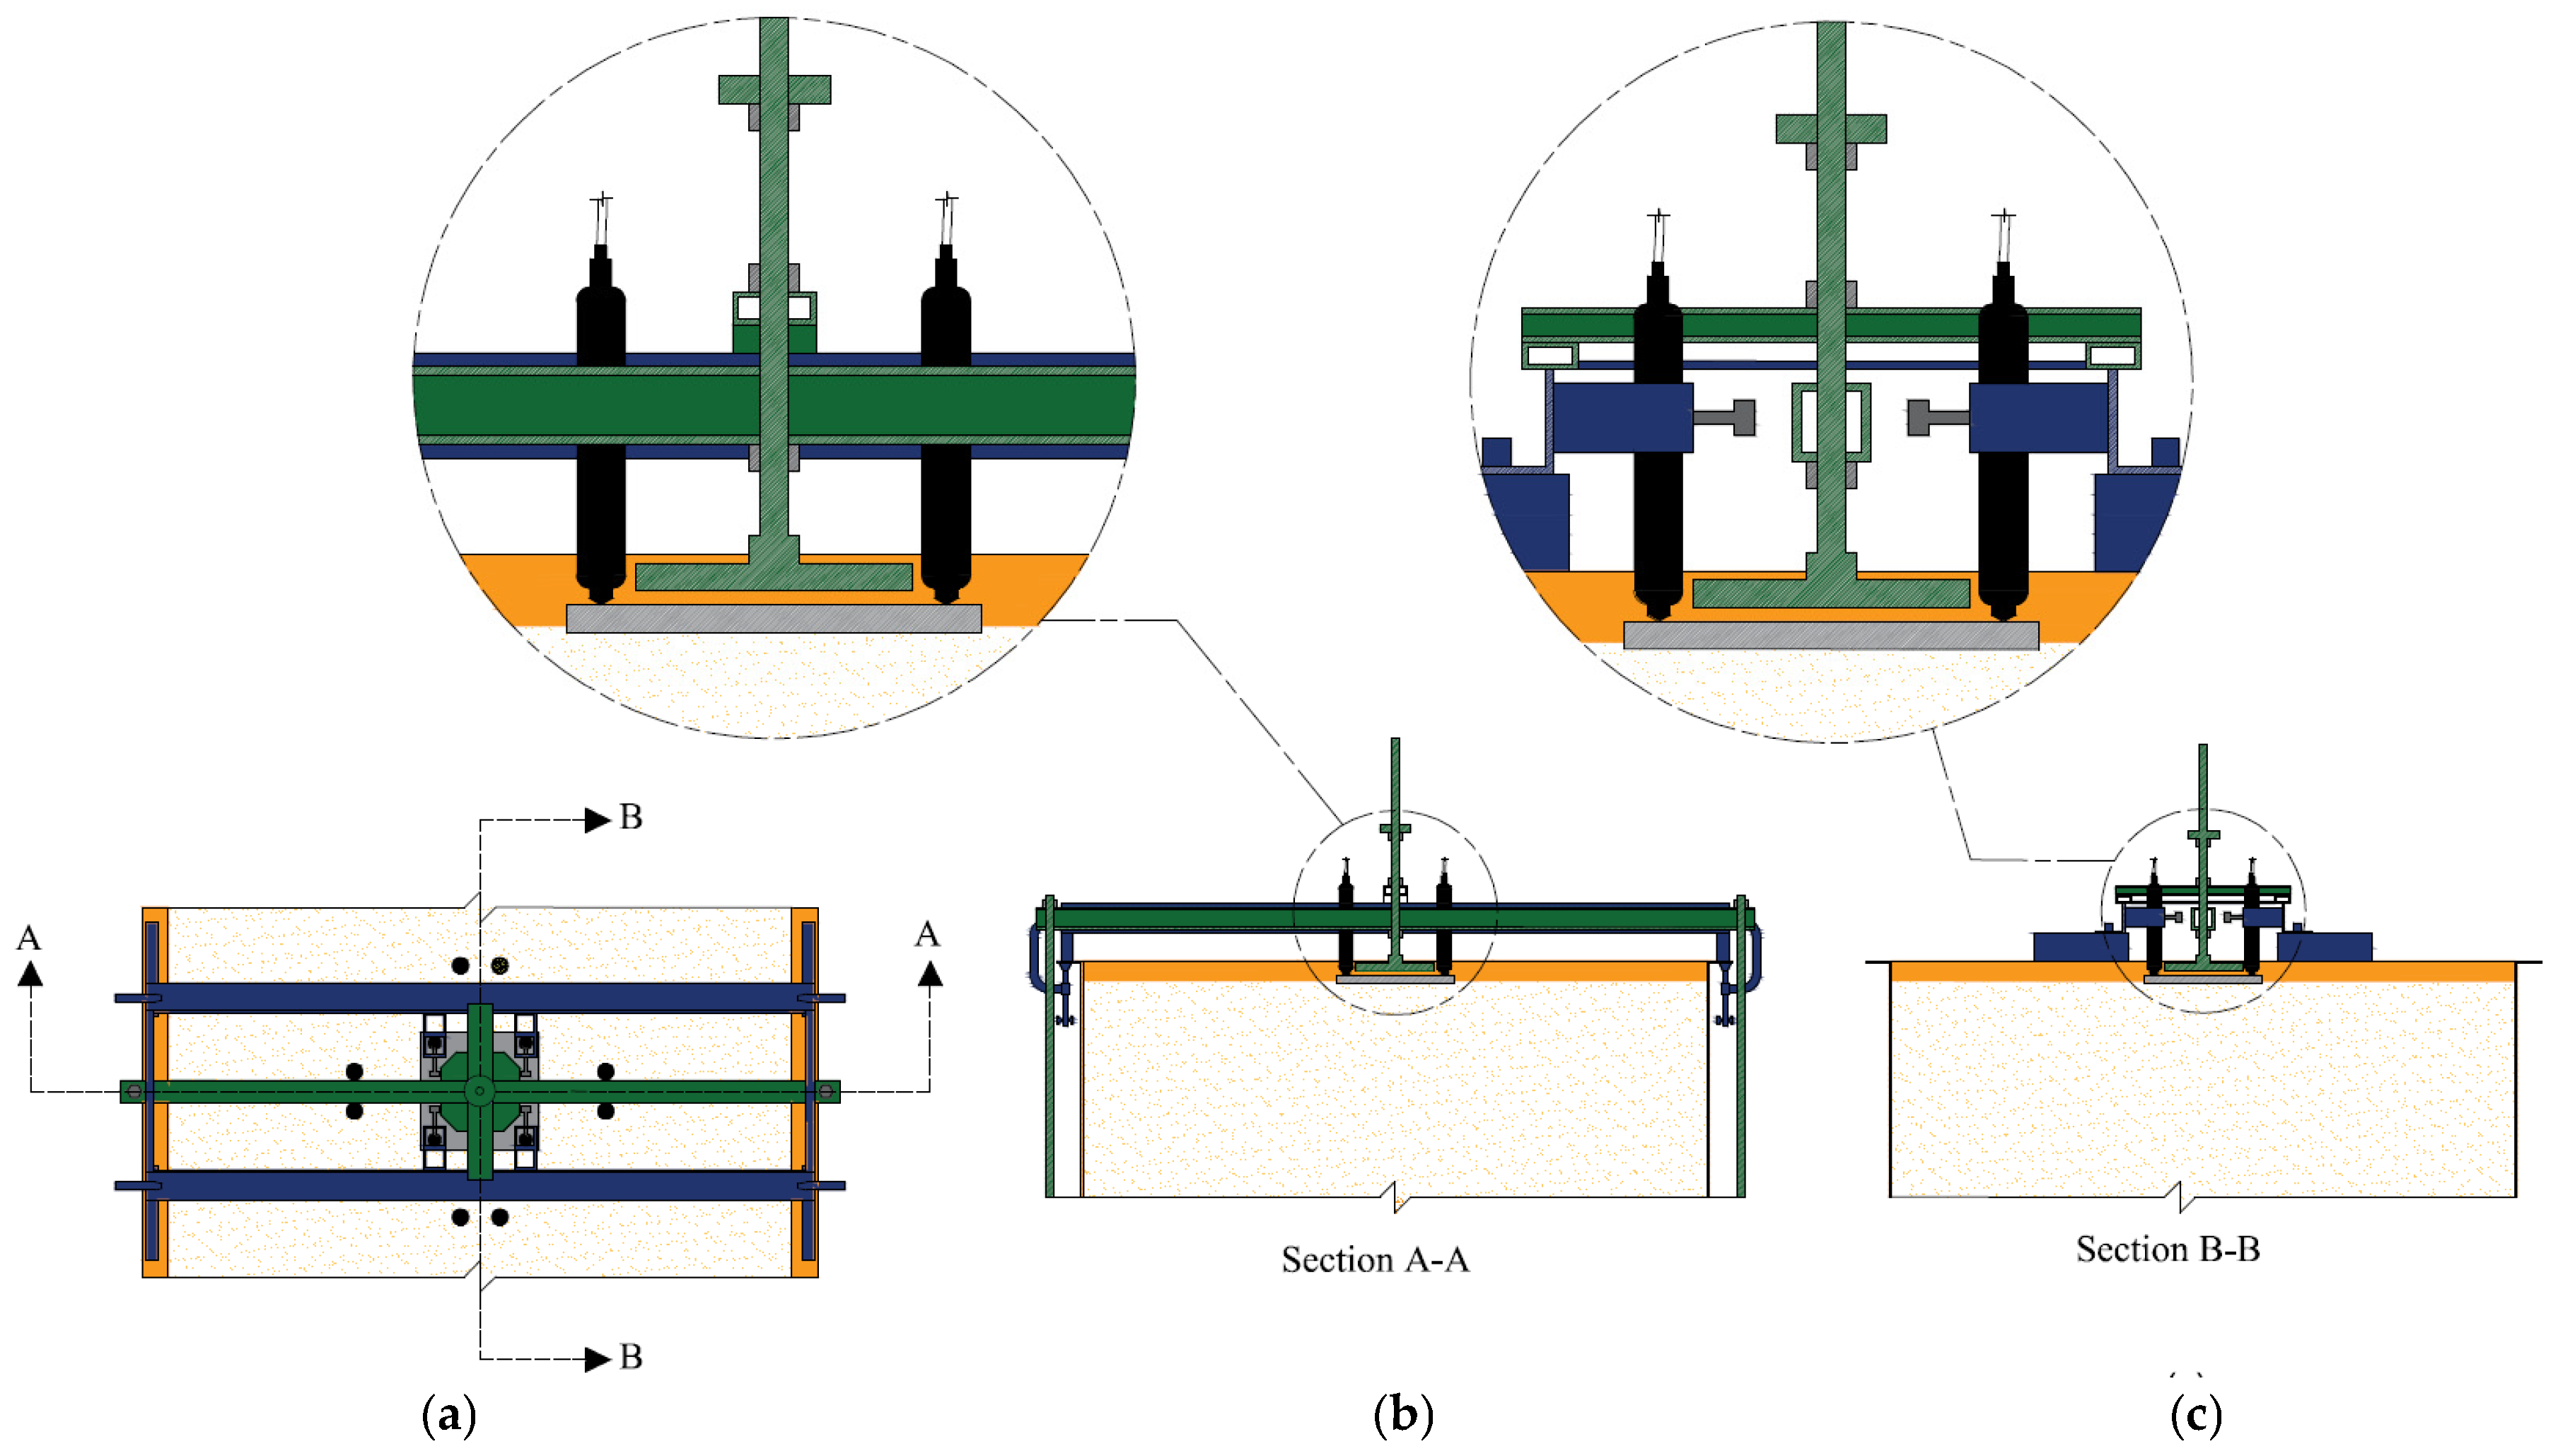
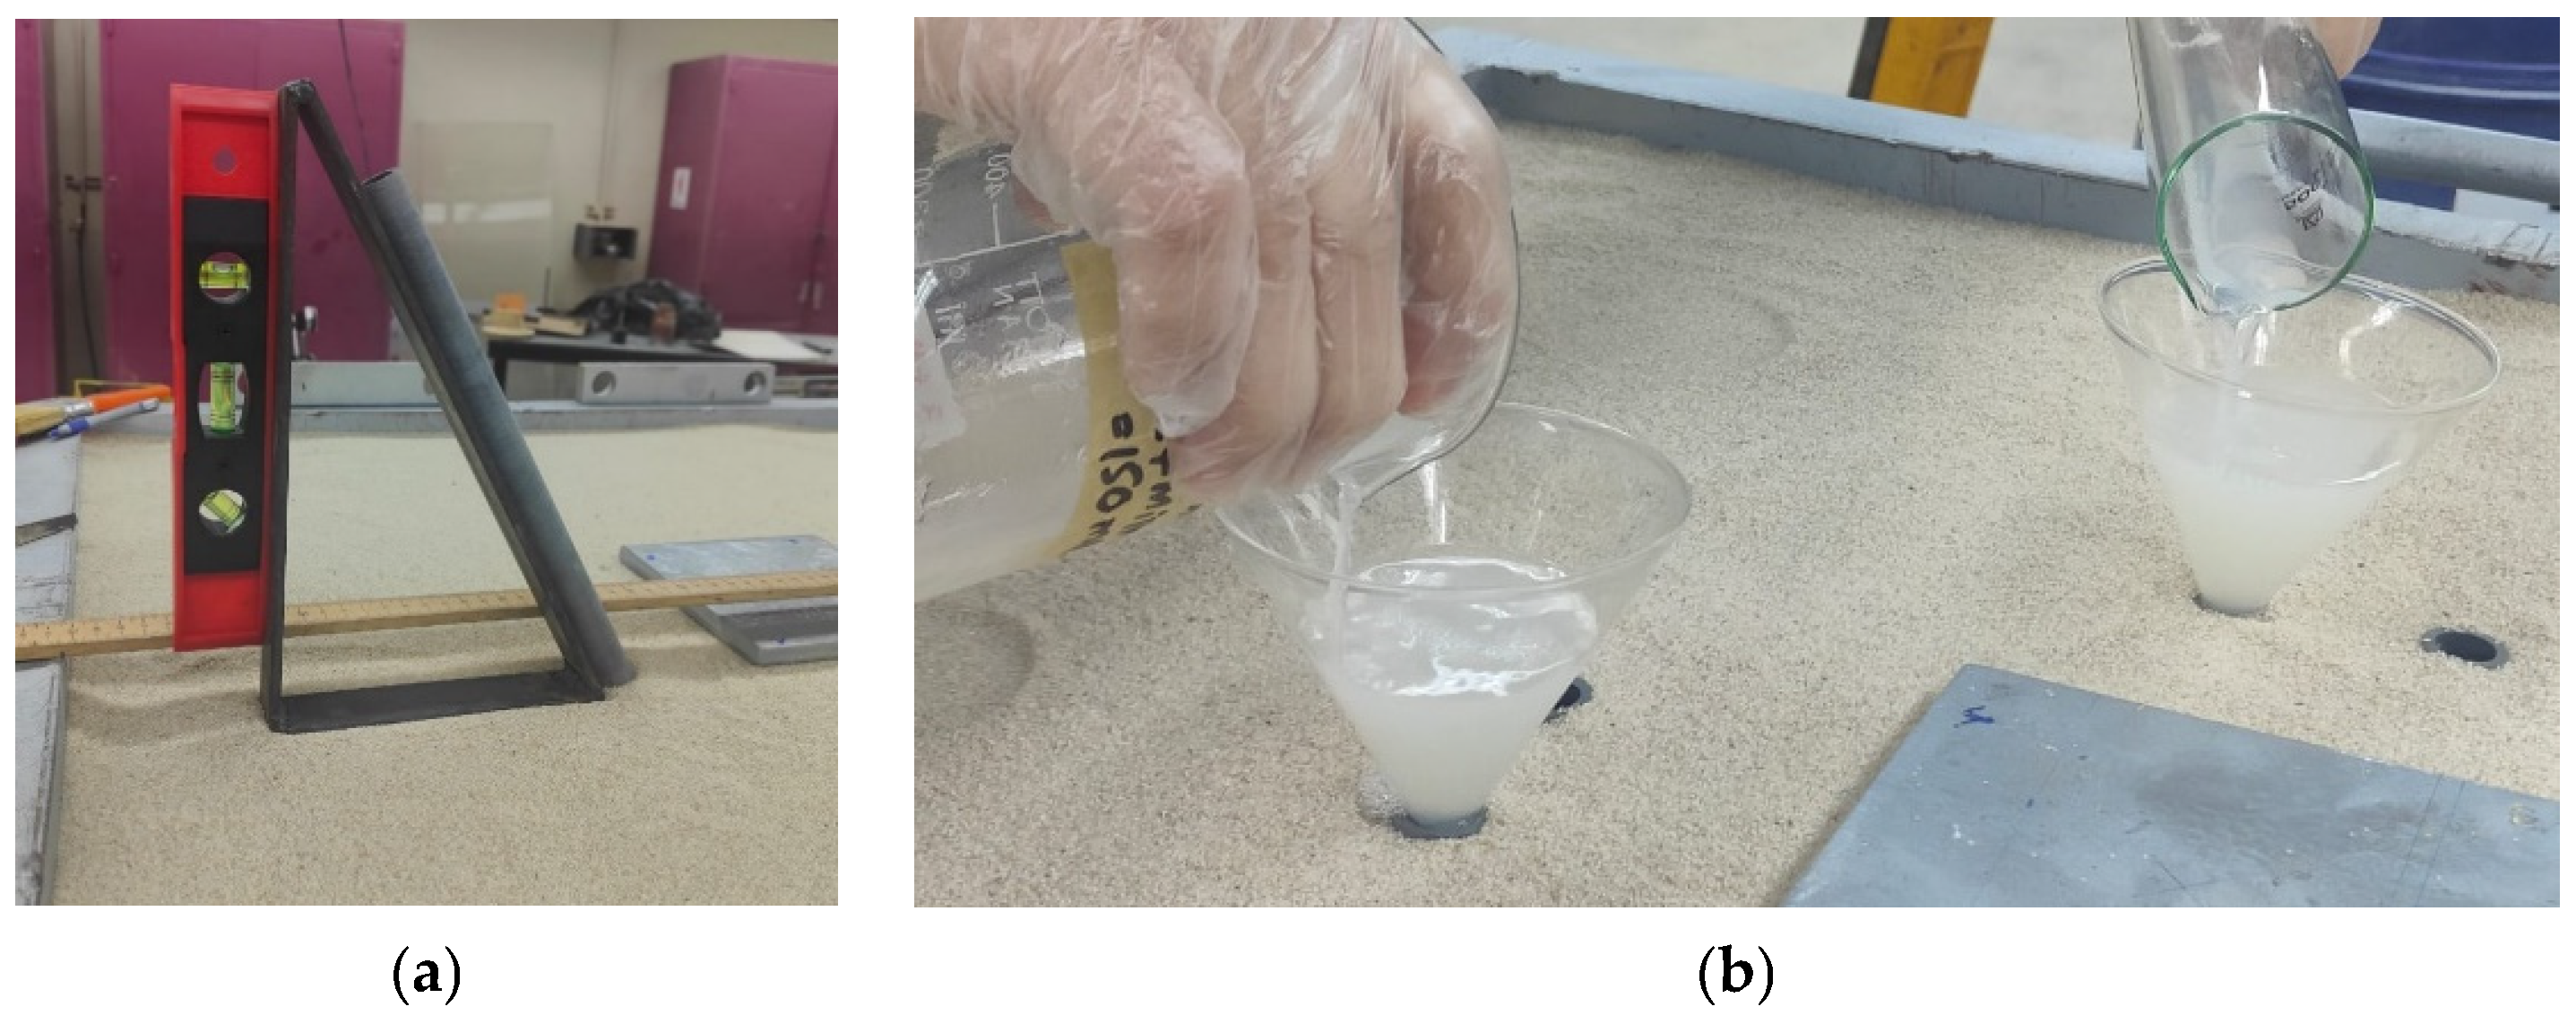
The test setup included a steel tank of 800 mm × 800 mm × 600 mm (depth) in size, a 150 mm square steel plate for footing, micropiles, a settlement measuring system, and a loading assembly. The test tank was filled with sand using the “raining” method by dropping the sand from an average height of 750 mm. The tank was filled in two stages. In the first stage, the tank was filled up to its half-depth, and the filling was completed in the second stage [38]. Consistency in relative density was achieved by repeating the same raining method procedure to fill the tank, ensuring that the sand was poured from the same height for all tests. Two to three measurements for the relative density of sand were taken for each test, and the average of all measurements was 0.51 ± 0.04. The square footing (i.e., steel plate) was placed at the center of the sand bed. The schematic diagrams of the test setup are provided in Figure 6. To provide confinement, micropiles were positioned at designated angles (Table 1) around the footing with the aid of an adjustable angular guide, as depicted in Figure 7a.
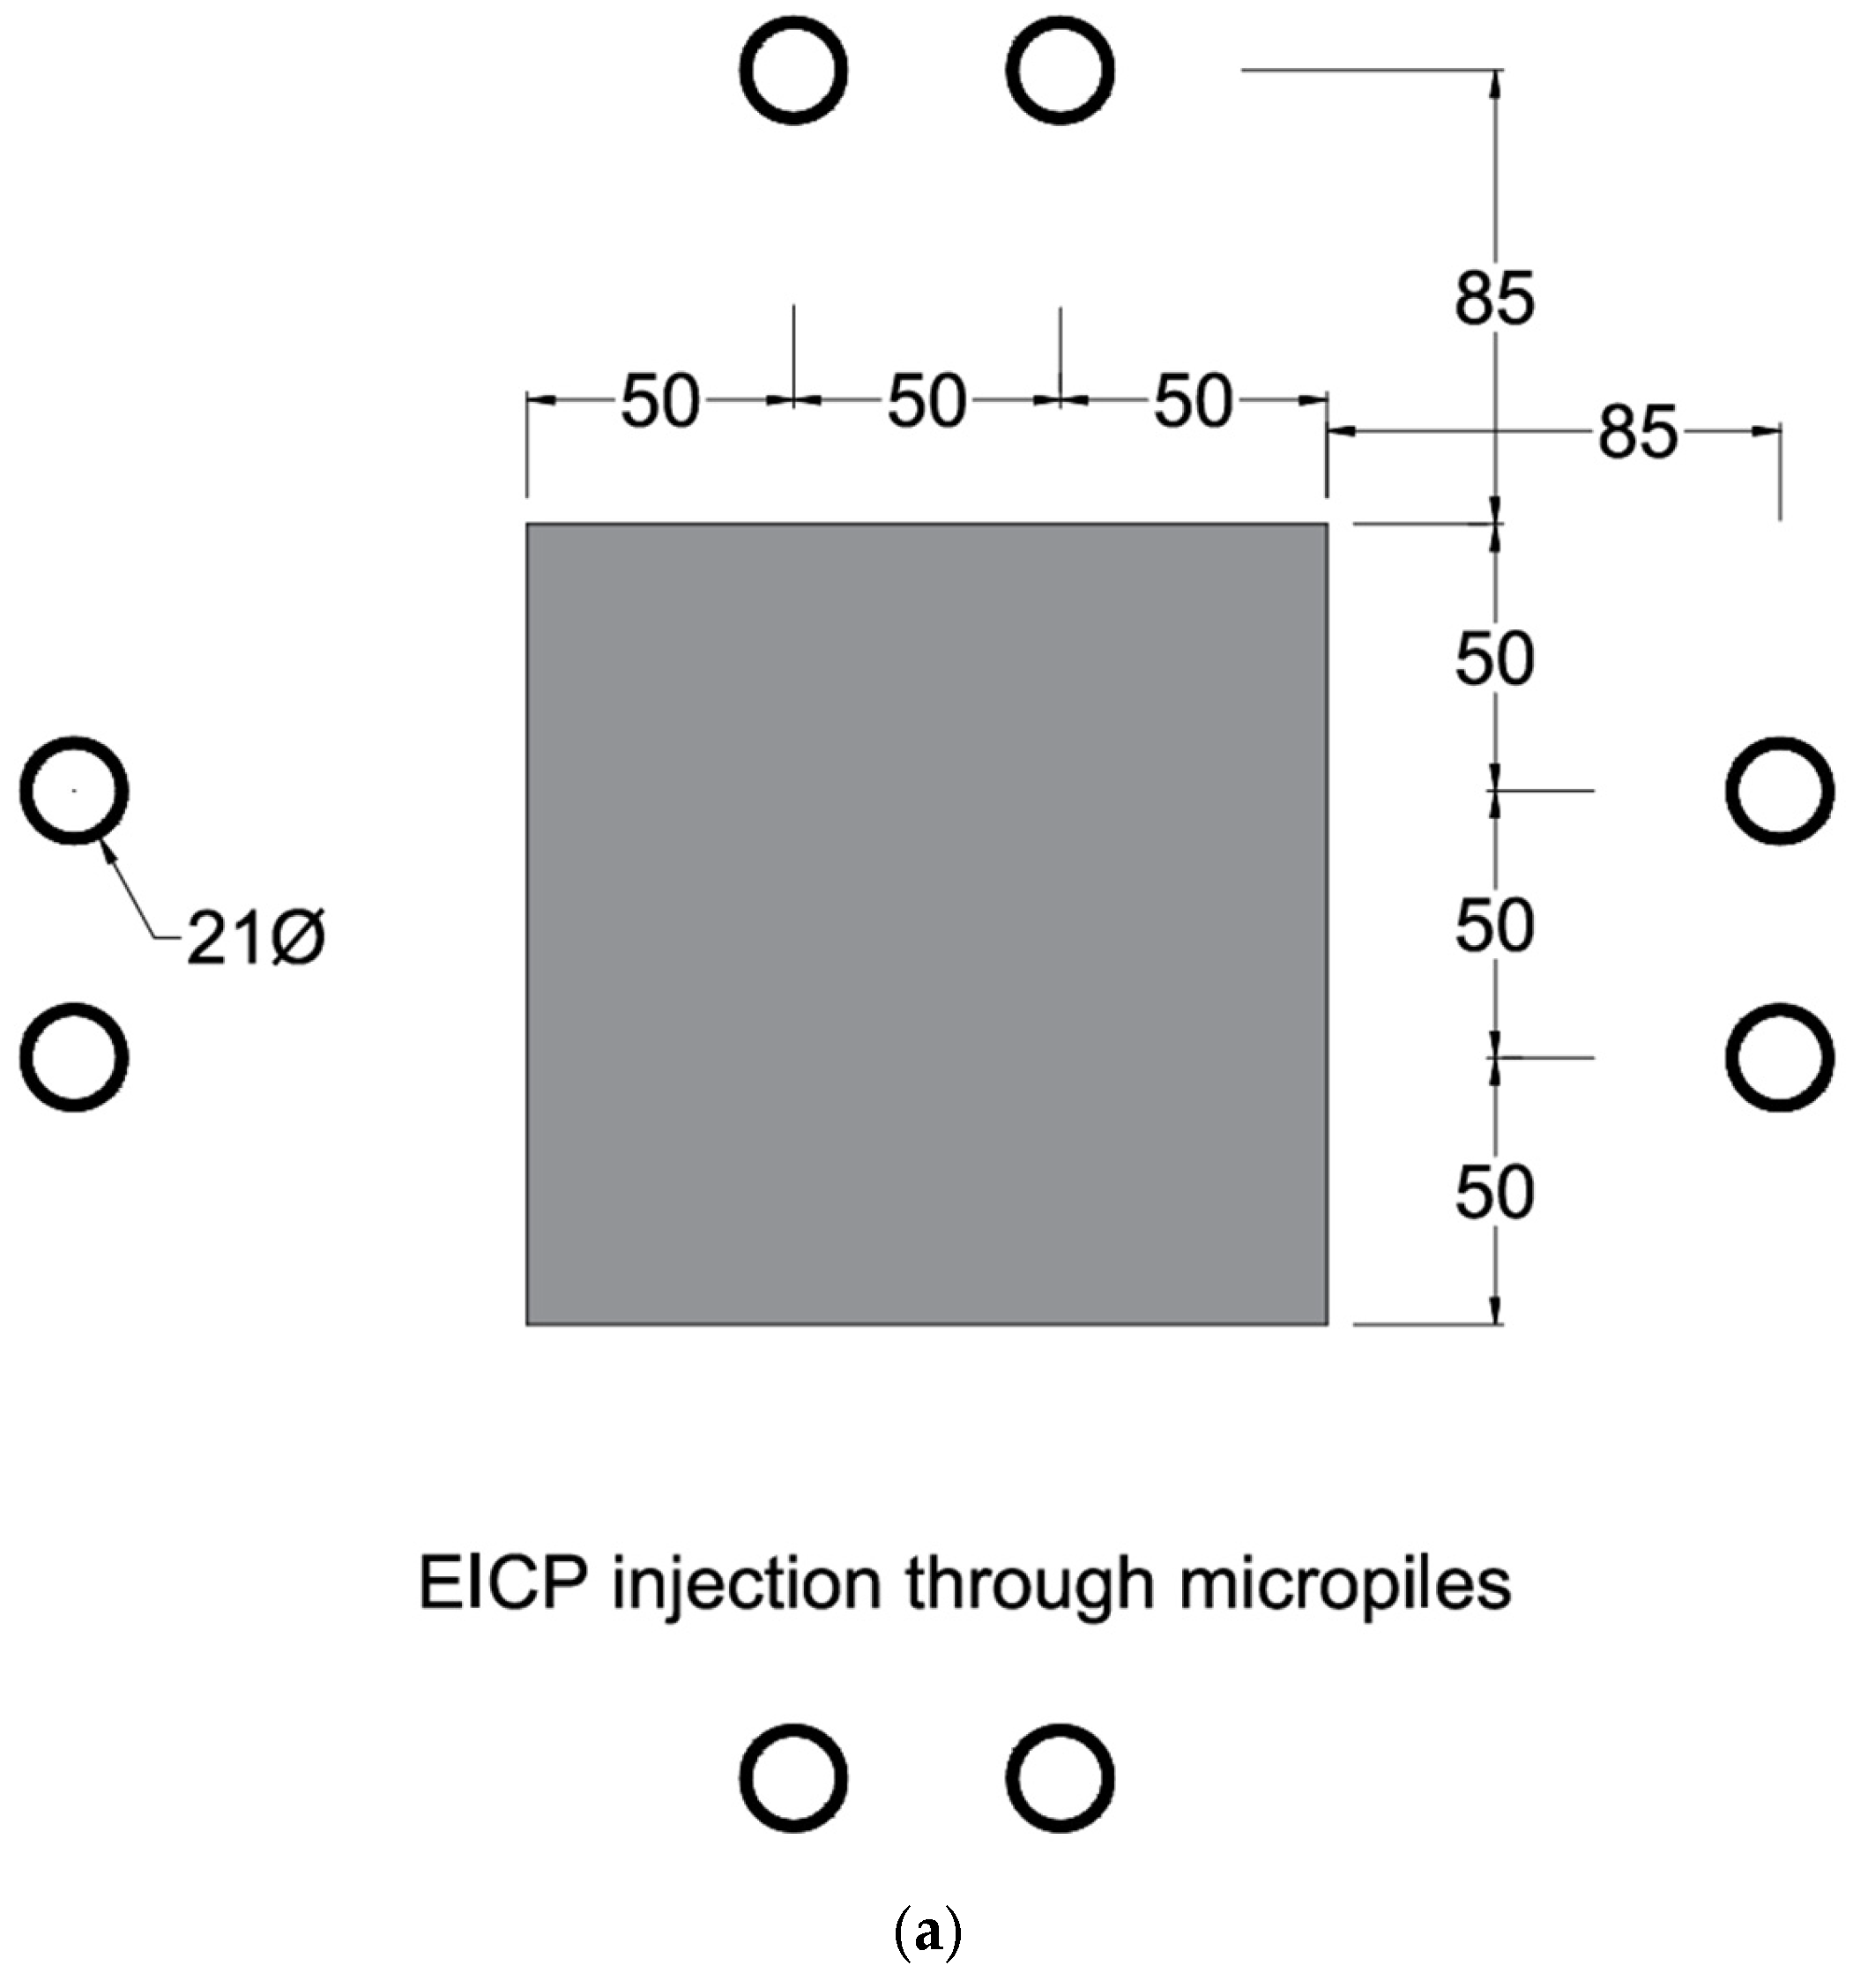
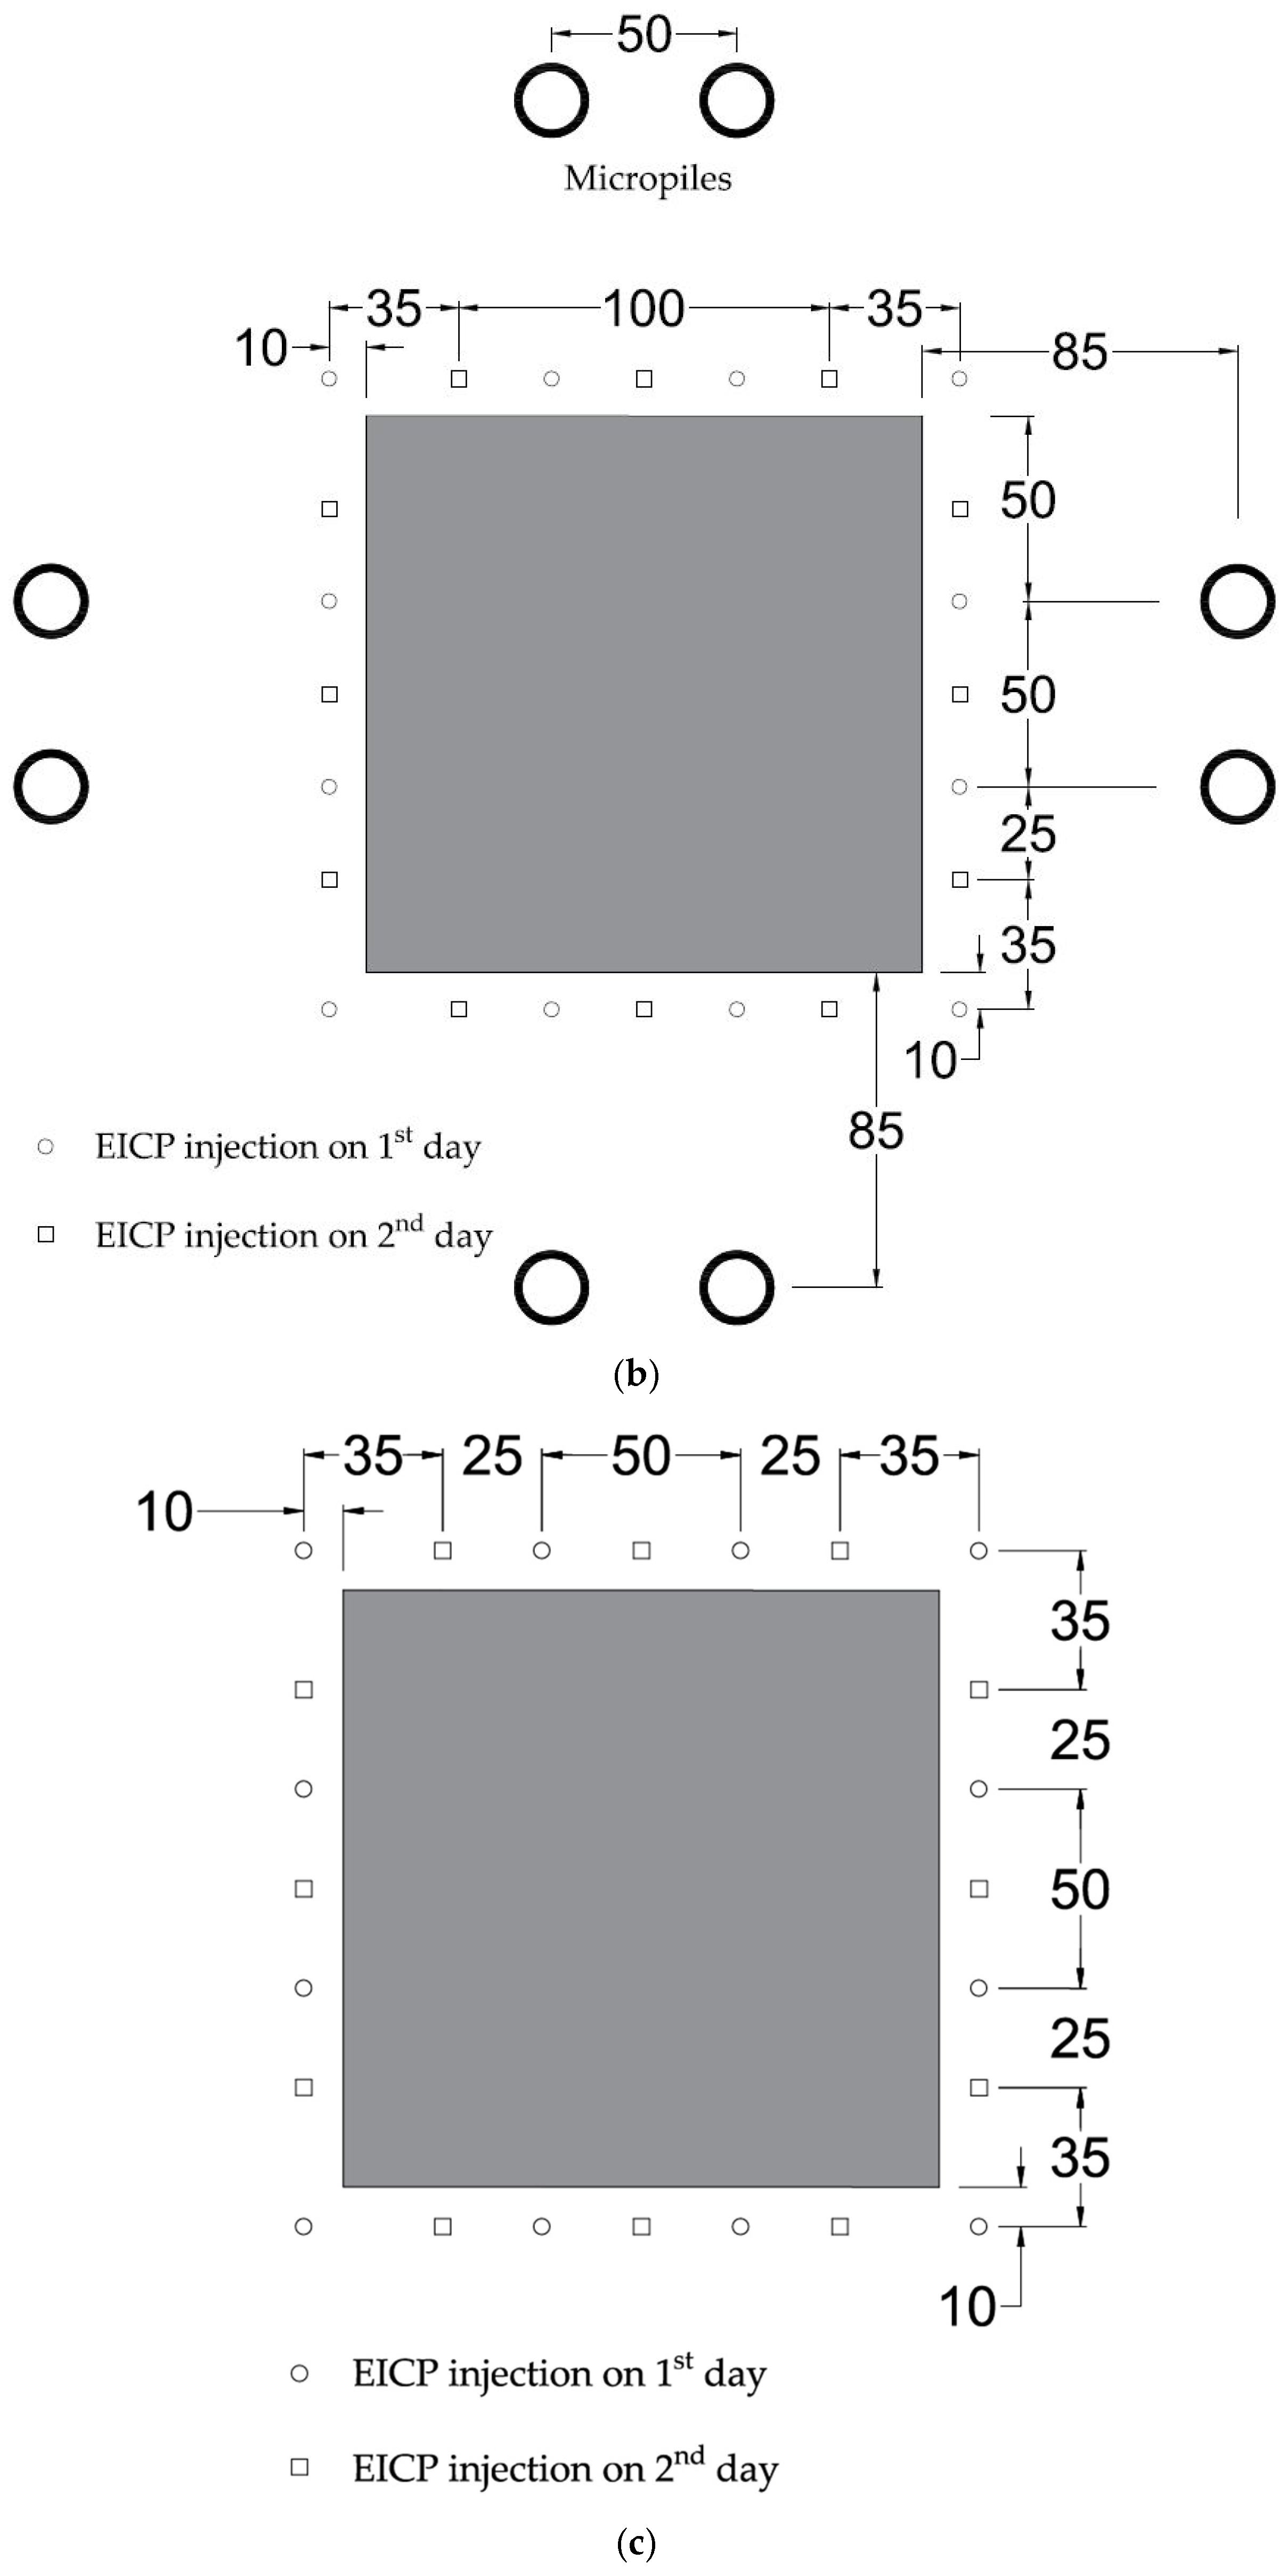
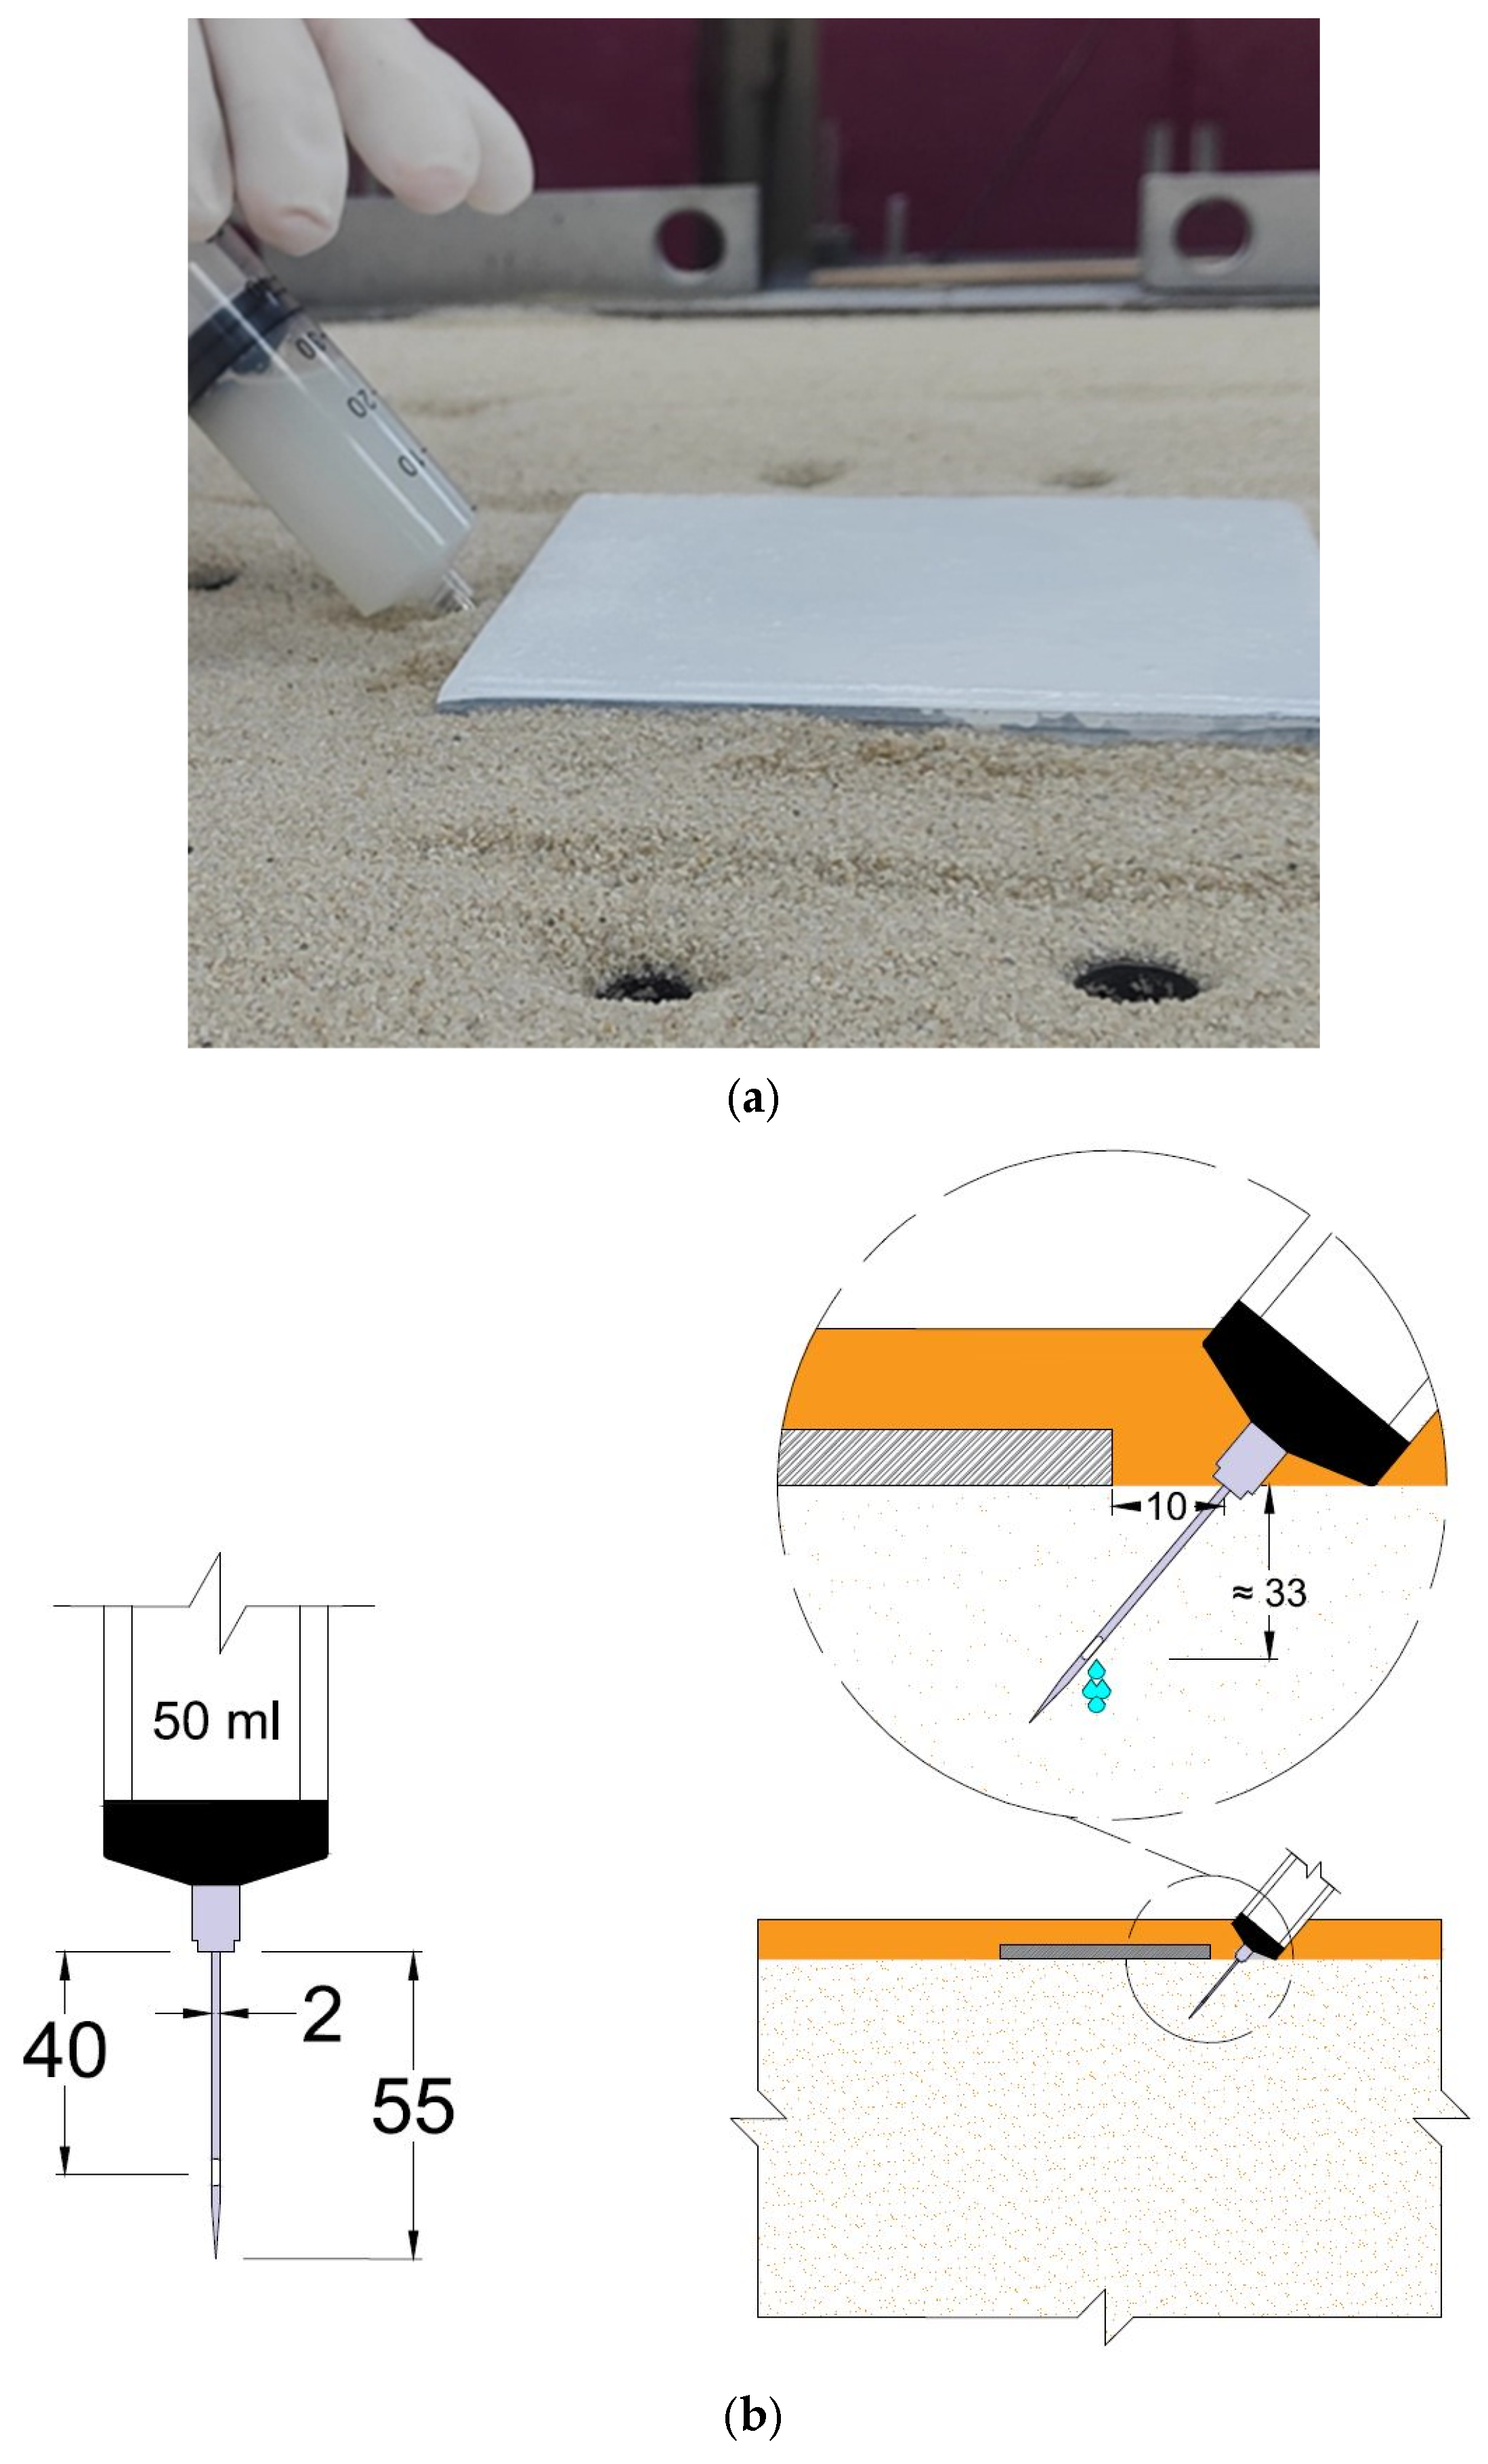
Two methodologies were employed for the EICP treatment of the soil, as indicated in Table 1. In the first method (method M1), 150 mL of EICP solution was injected into each of the 8 perforated micropiles, as illustrated in Figure 7b, and was left to cure for 21 days. In the second method (method M2), EICP solution of the same volume and composition was injected at 24 locations around the footing on two consecutive days, covering twelve locations on each day. The locations of EICP injection using methods M1 and M2 are illustrated in Figure 8. The EICP solution in method M2 was surface-applied using a 50 mL syringe. The injection was carried out by fully inserting the needle into the soil from the top surface at an angle between 50° and 60° relative to the horizontal plane. The needle, which was 55 mm long and closed at the end, had two outlet holes located at 35 mm and 45 mm from the top end on opposite sides. This arrangement allowed the solution to be delivered at an approximate vertical depth of 33 mm beneath the edge of the footing, as shown in Figure 9. The figure, however, simplifies this by showing a single hole at an average distance of 40 mm from the top of the needle. Since the solution readily percolated through the sand, multiple injection depths were not considered. The injection approach ensured sufficient distribution of the treatment solution within the target zone influenced by the footing load. Each day, 50 mL of EICP solution was injected at 24 designated points (Figure 9), resulting in a total of 1200 mL of solution over the two-day period, with a curing time of 21–22 days. In method M1, 150 mL of EICP solution was injected through each micropile over approximately 90 s, with infiltration visually monitored to ensure complete delivery. In method M2, 50 mL of solution was injected from a syringe in 30 s per location. In both methods, injection was performed sequentially, two micropiles at a time in M1 and two surface locations in M2, until all designated points were treated. A consistent injection rate and volume were maintained to promote spatial uniformity.
The 21-day curing period was selected based on prior literature, which commonly reports curing durations between 14 and 28 days for achieving sufficient UCS [36,39,40]. One study [39] showed that calcium carbonate precipitation increased significantly for up to 7 days but remained almost unchanged thereafter, while another [40] indicated that UCS continued to improve for up to 28 days, with only marginal gains beyond 21 days.
Once the loading assembly and LVDTs were in place, the load was gradually increased in 10 kg increments every 10 min. Testing was halted when settlement measurements exceeded 20 mm. A data logger was used to capture the readings of settlement. Before proceeding with the next test, the tank was emptied and the setup reset.

5. Test Results and Discussion

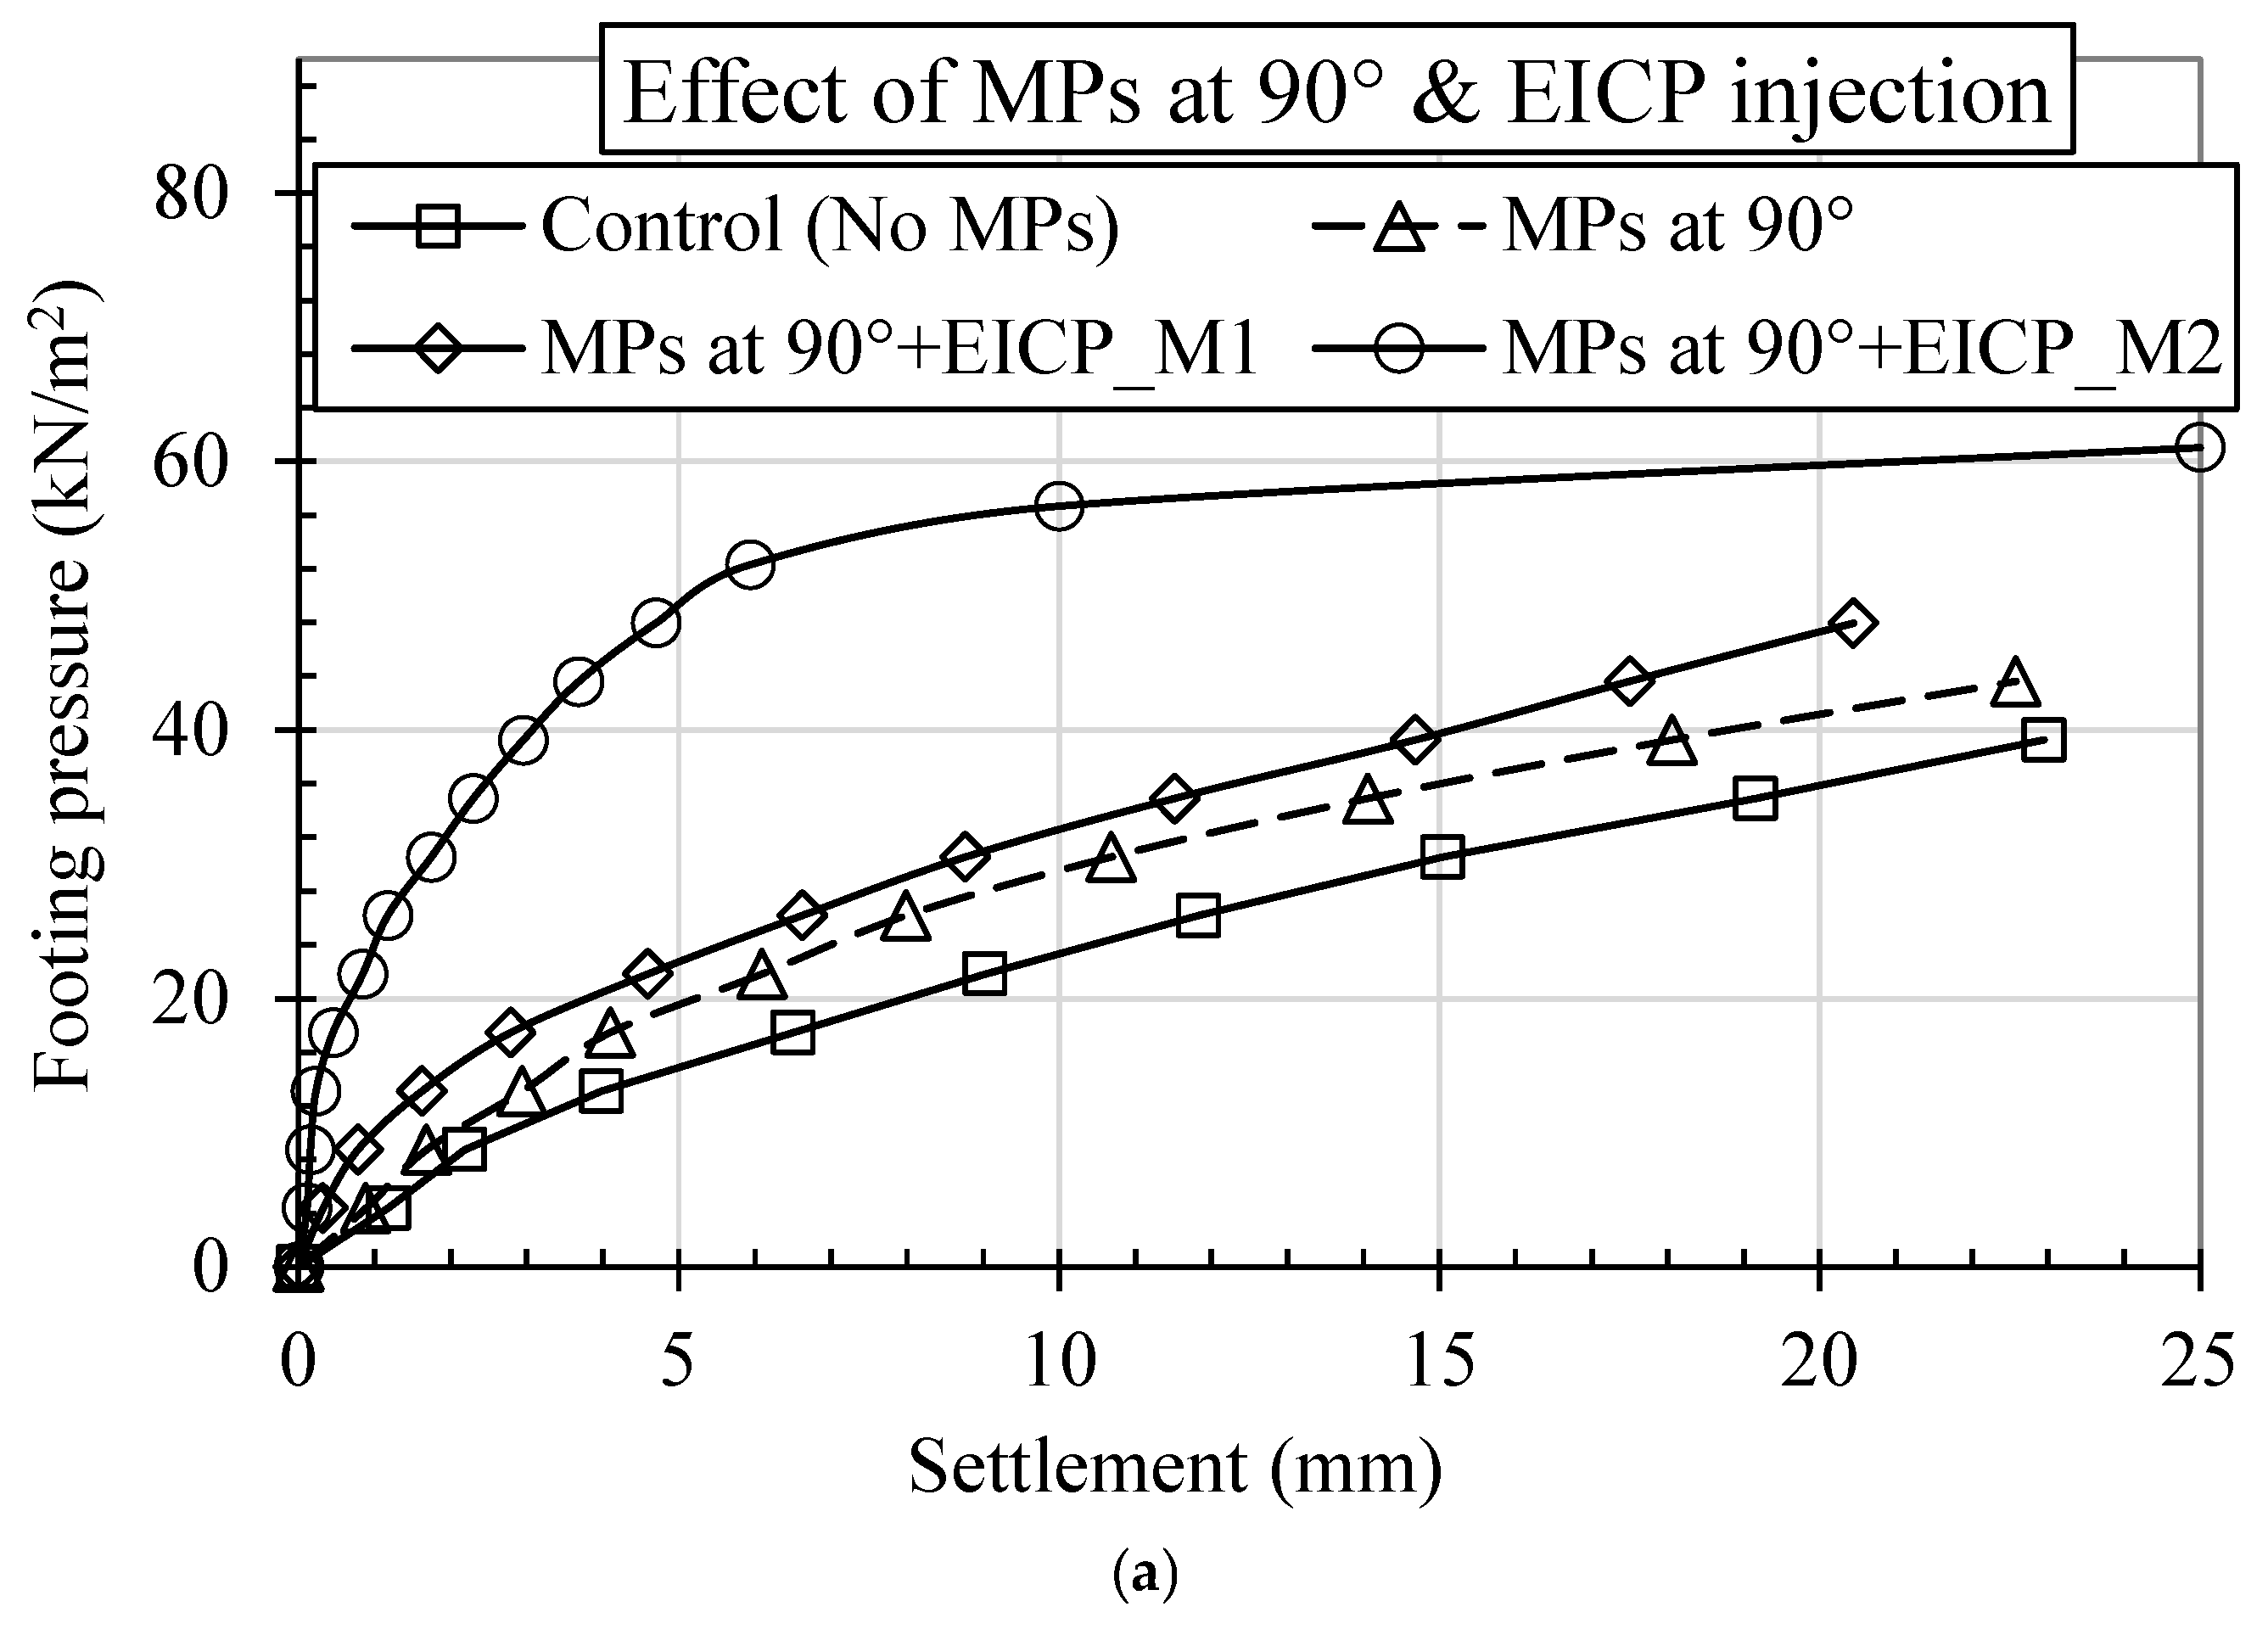
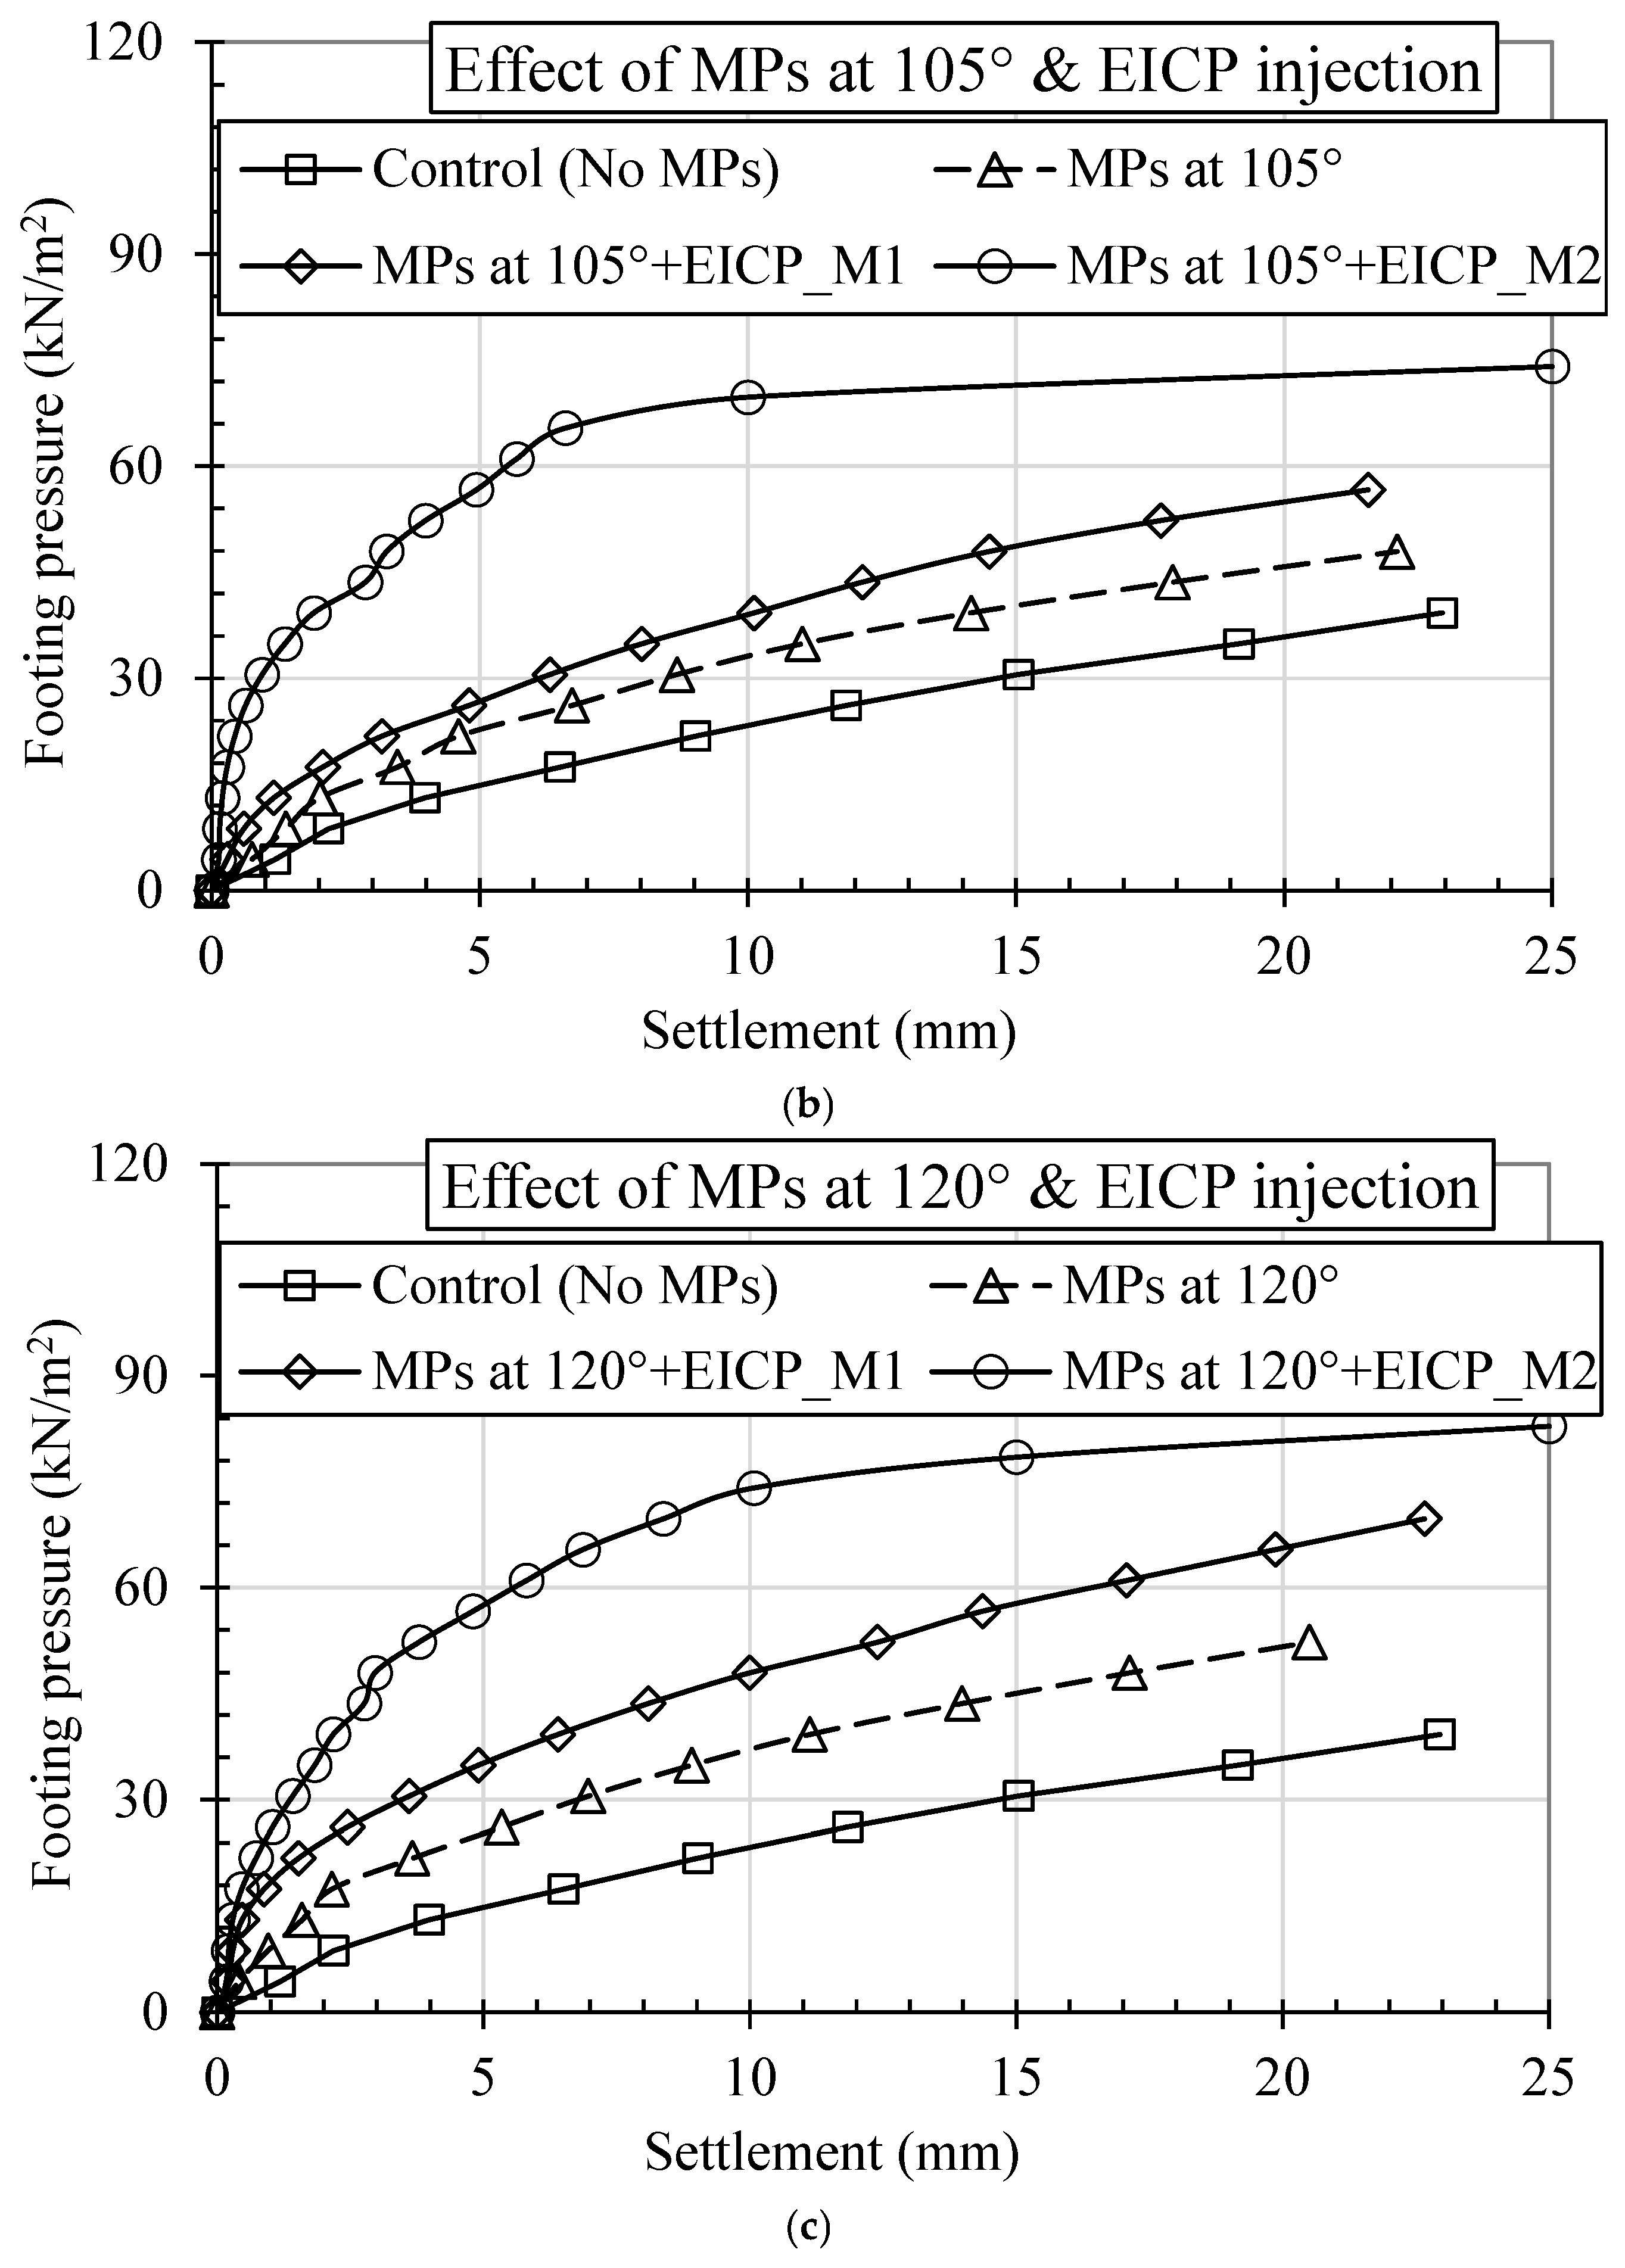
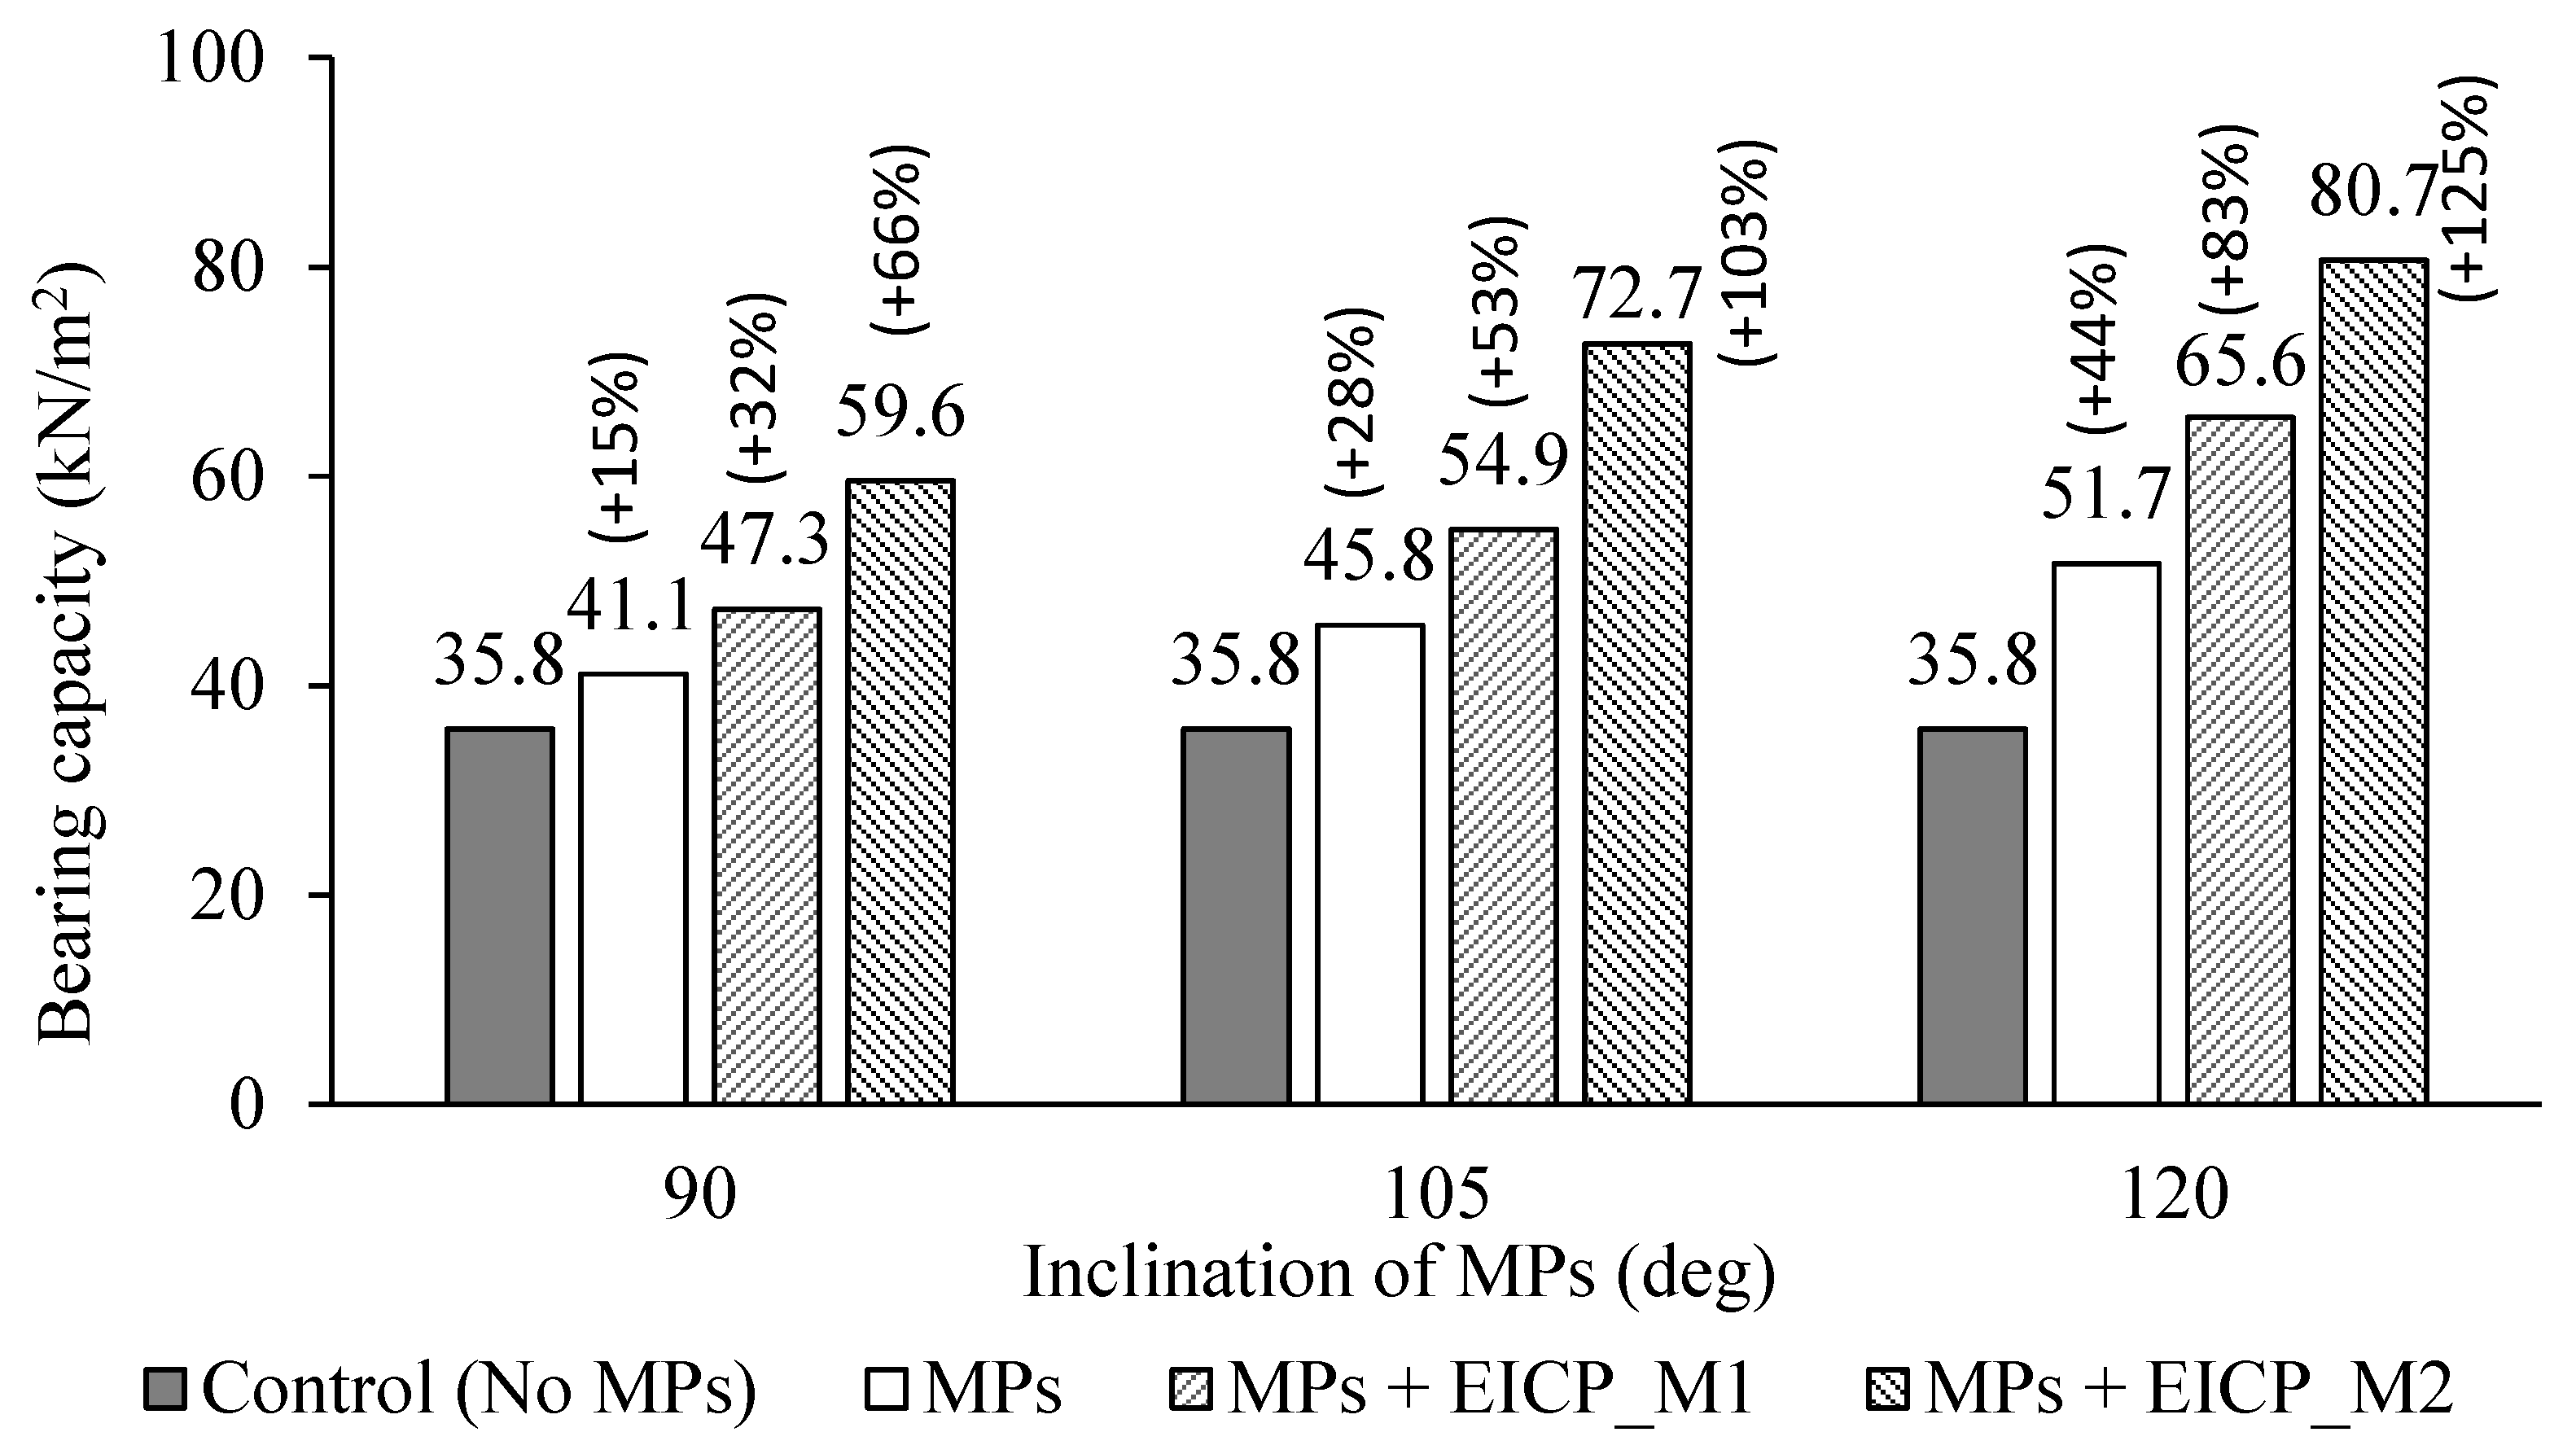
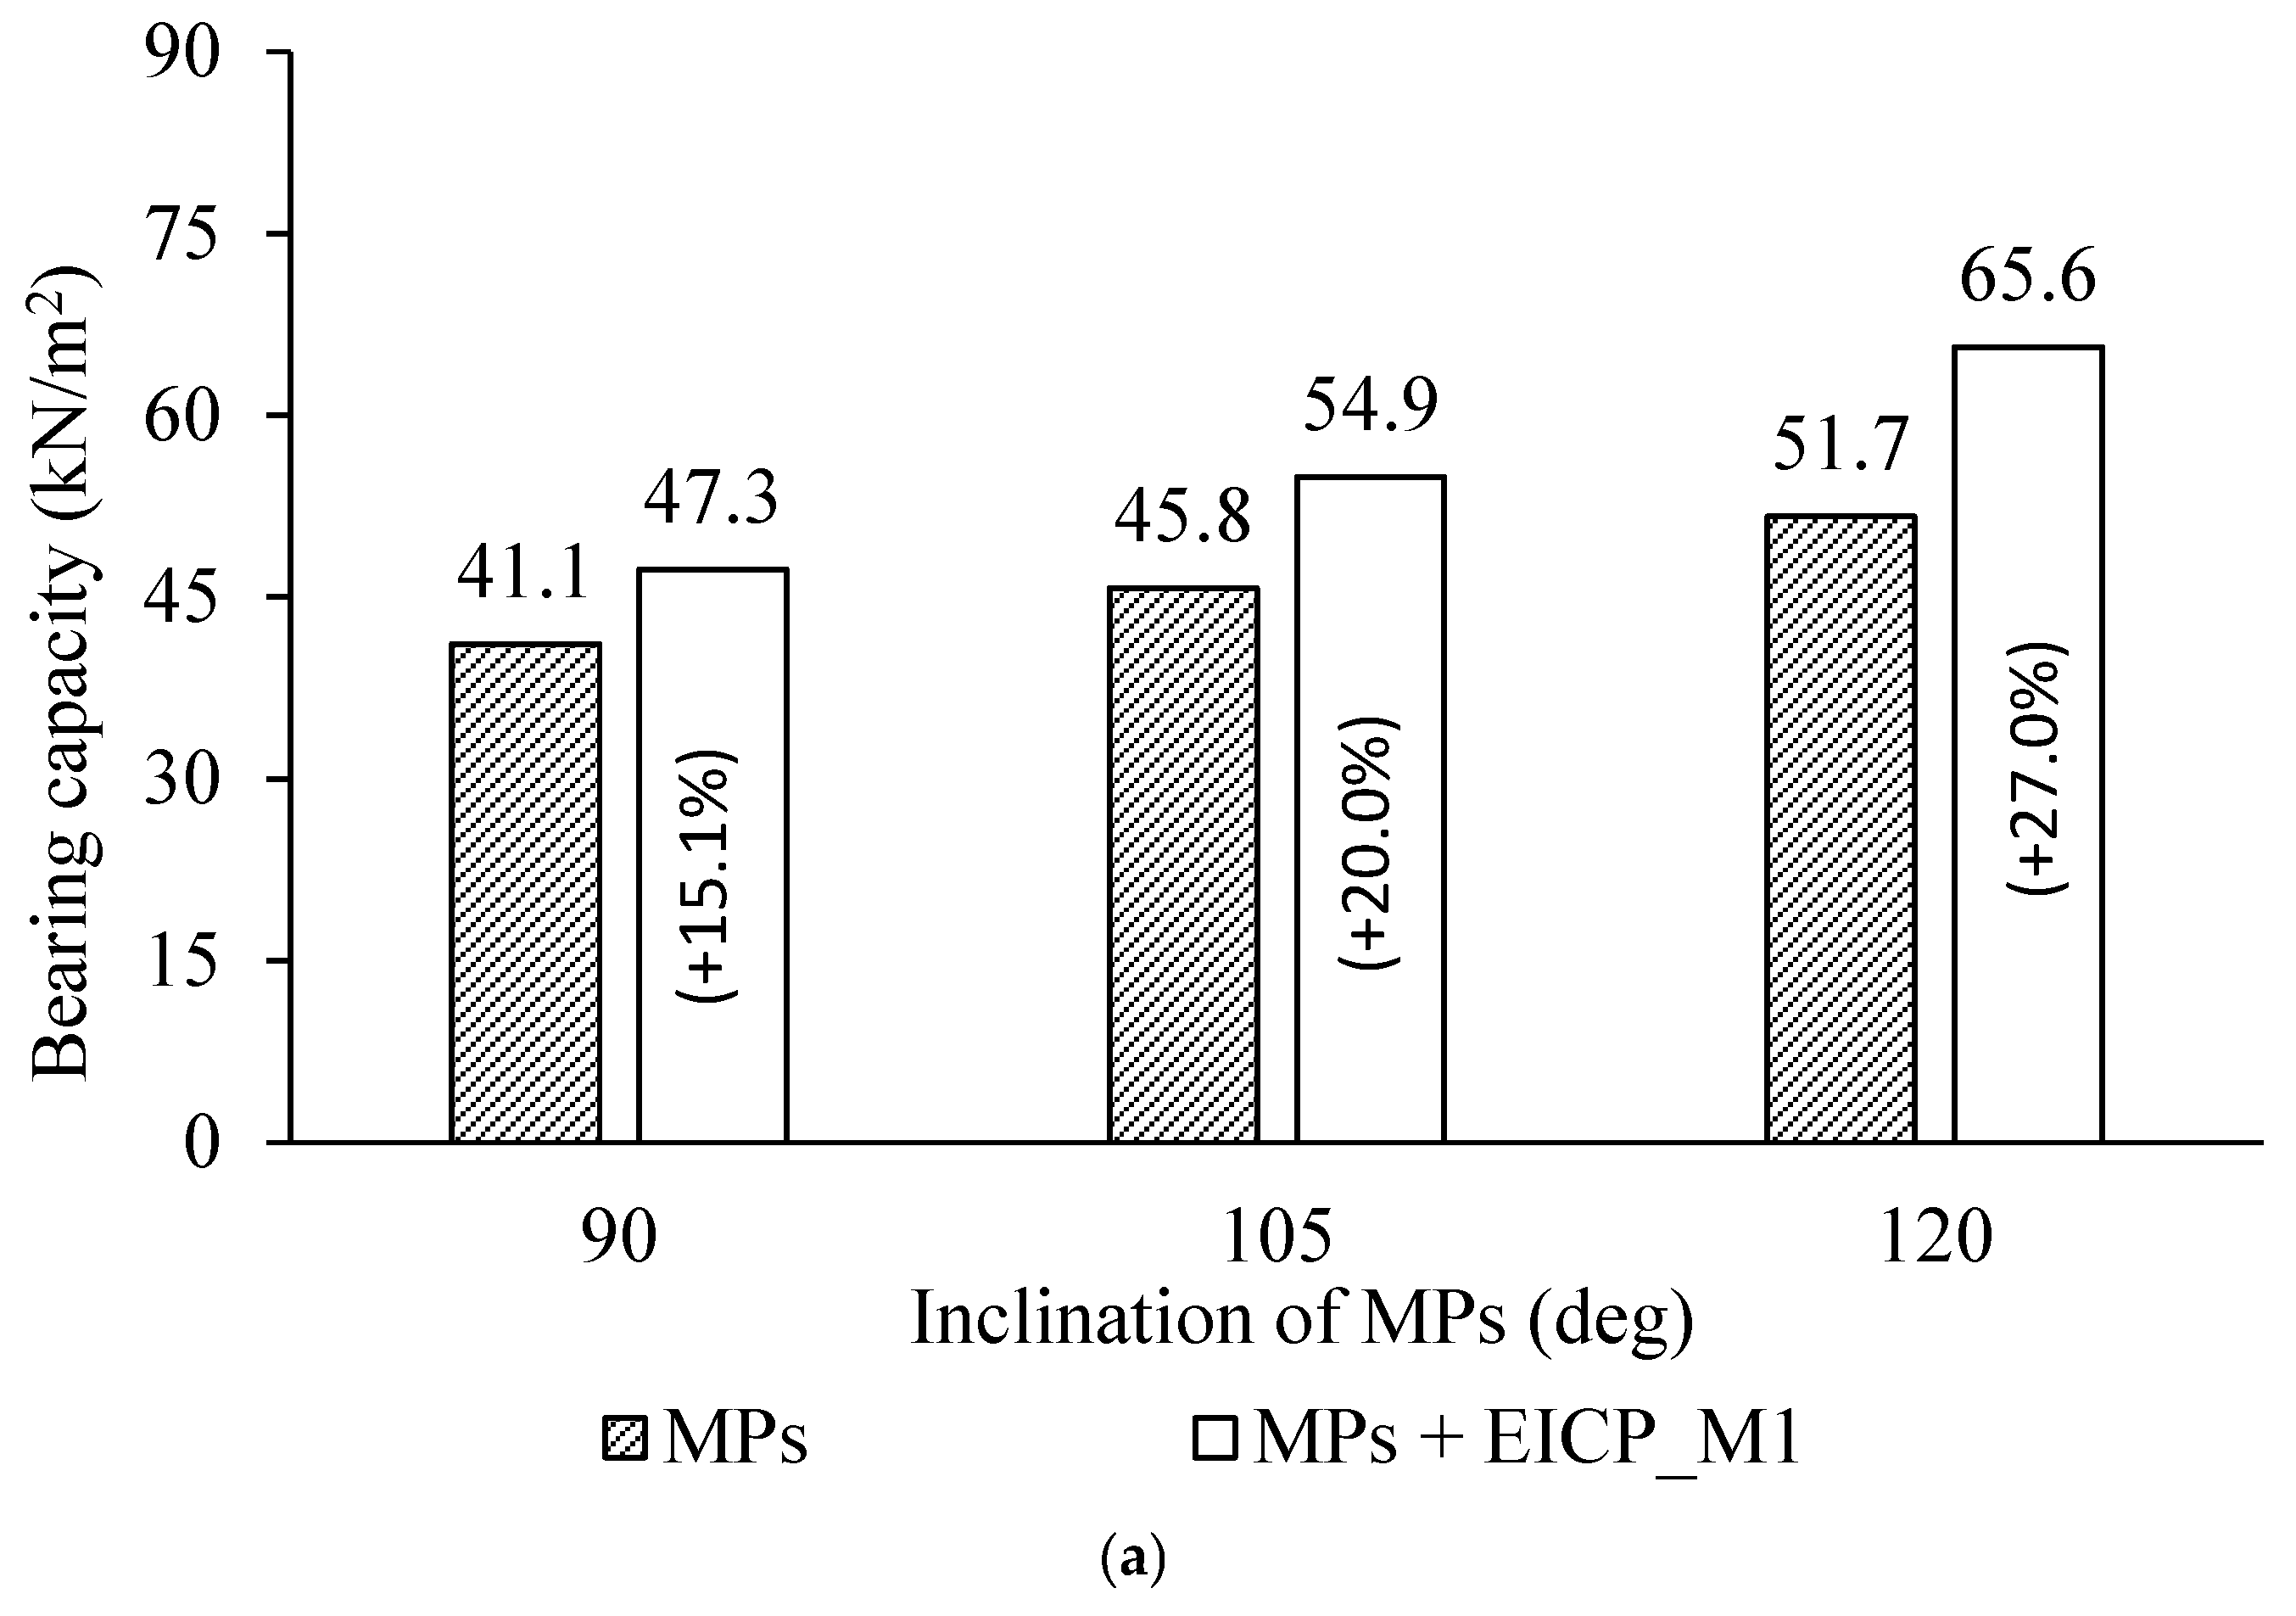
The prime objective of this study was to examine the combined effects of micropiles and EICP, taking into consideration micropile inclination and the method of injecting EICP into the soil. Figure 10a–c illustrate the effect of different methods of EICP injection on footing pressure–settlement curves for the three micropile inclinations of 90°, 105°, and 120°, respectively. The influence of micropile inclinations on footing pressure–settlement curves for the two methods of EICP injection, M1 and M2, is compared in Figure 11a,b, respectively. The footing pressure–settlement curve of EICP injection using method M2 is also plotted in Figure 11b. The footing pressure–settlement curve of the control footing is also added in Figure 10 and Figure 11. The bearing capacity of the footings, obtained corresponding to 20 mm settlement, for different schemes of micropile inclinations along with different methods of EICP injection is compared in Figure 12. The bearing capacities of control footing (no micropiles and no EICP) and micropiles without EICP treatment are also plotted in Figure 12. Bearing capacity enhancement for the two methods of EICP treatment is shown in Figure 13. Figure 14 illustrates the bearing capacity enhancement due to the enhancement in the angle of inclination of micropiles for the two methods of EICP treatment. For EICP treatment method M2, Figure 15 illustrates the breakup of bearing capacity enhancement due to EICP treatment and micropile addition for different inclinations.
The major outcomes of these tests and observations made of these figures are:
  • Irrespective of the micropiles’ inclination, the pattern of footing pressure variation with settlement is similar for both EICP injection methods.
  • As the angle of inclination of the micropiles increases, the rate of footing pressure increase with settlement also rises. Additionally, EICP injection significantly amplified this rate, with method M2 of EICP injection showing a much higher increase in footing pressure as settlement progresses. Furthermore, as the footing pressure increases, the rate of increase in settlement increases. This increase in settlement at higher loads is more pronounced with method M2 of EICP injection, likely due to the sudden collapse of the solidified sand clumps (Figure 10 and Figure 11).
  • The incorporation of EICP through micropiles (method M1) significantly enhanced the load-bearing capacity of the footing, with a notable increase observed as the inclination angle of the micropiles increased. Compared to the control, the bearing capacity improvements for footings confined by EICP-injected micropiles at inclinations of 90°, 105°, and 120° were 32%, 53%, and 83%, respectively (Figure 12). In contrast, without EICP injection, the increases were only 15%, 28%, and 44% at the same inclination angles, as seen from Figure 12 [38]. It is evident that the load-bearing capacity enhancement achieved by combining EICP (injected through micropiles) with micropiles is significantly higher compared to the incorporation of micropiles alone. The EICP injection of soil through micropiles (method M1) caused 15%, 20%, and 27% increases in the bearing capacity of footings (compared to the footing with micropiles alone) for inclinations of 90°, 105°, and 120°, respectively (Figure 13a). The substantial enhancements observed for EICP-injected micropiles are credited to the combined effect of soil confinement by the micropiles (which enhances with the enhancement in micropile’s angle of inclination) and the calcification process, which intensifies with increasing pile inclination. Notably, the EICP solution incorporated with micropiles at 120° exhibited a much higher effect compared to the EICP solution incorporated at 90°. This can be attributed to the closer or beneath-the-footing sand cementation that occurs at a 120° inclination, whereas the cementation at a 90° inclination is not as close. The use of EICP offers a low-carbon, bio-mediated alternative to traditional cement-based ground improvement, contributing to environmental sustainability.
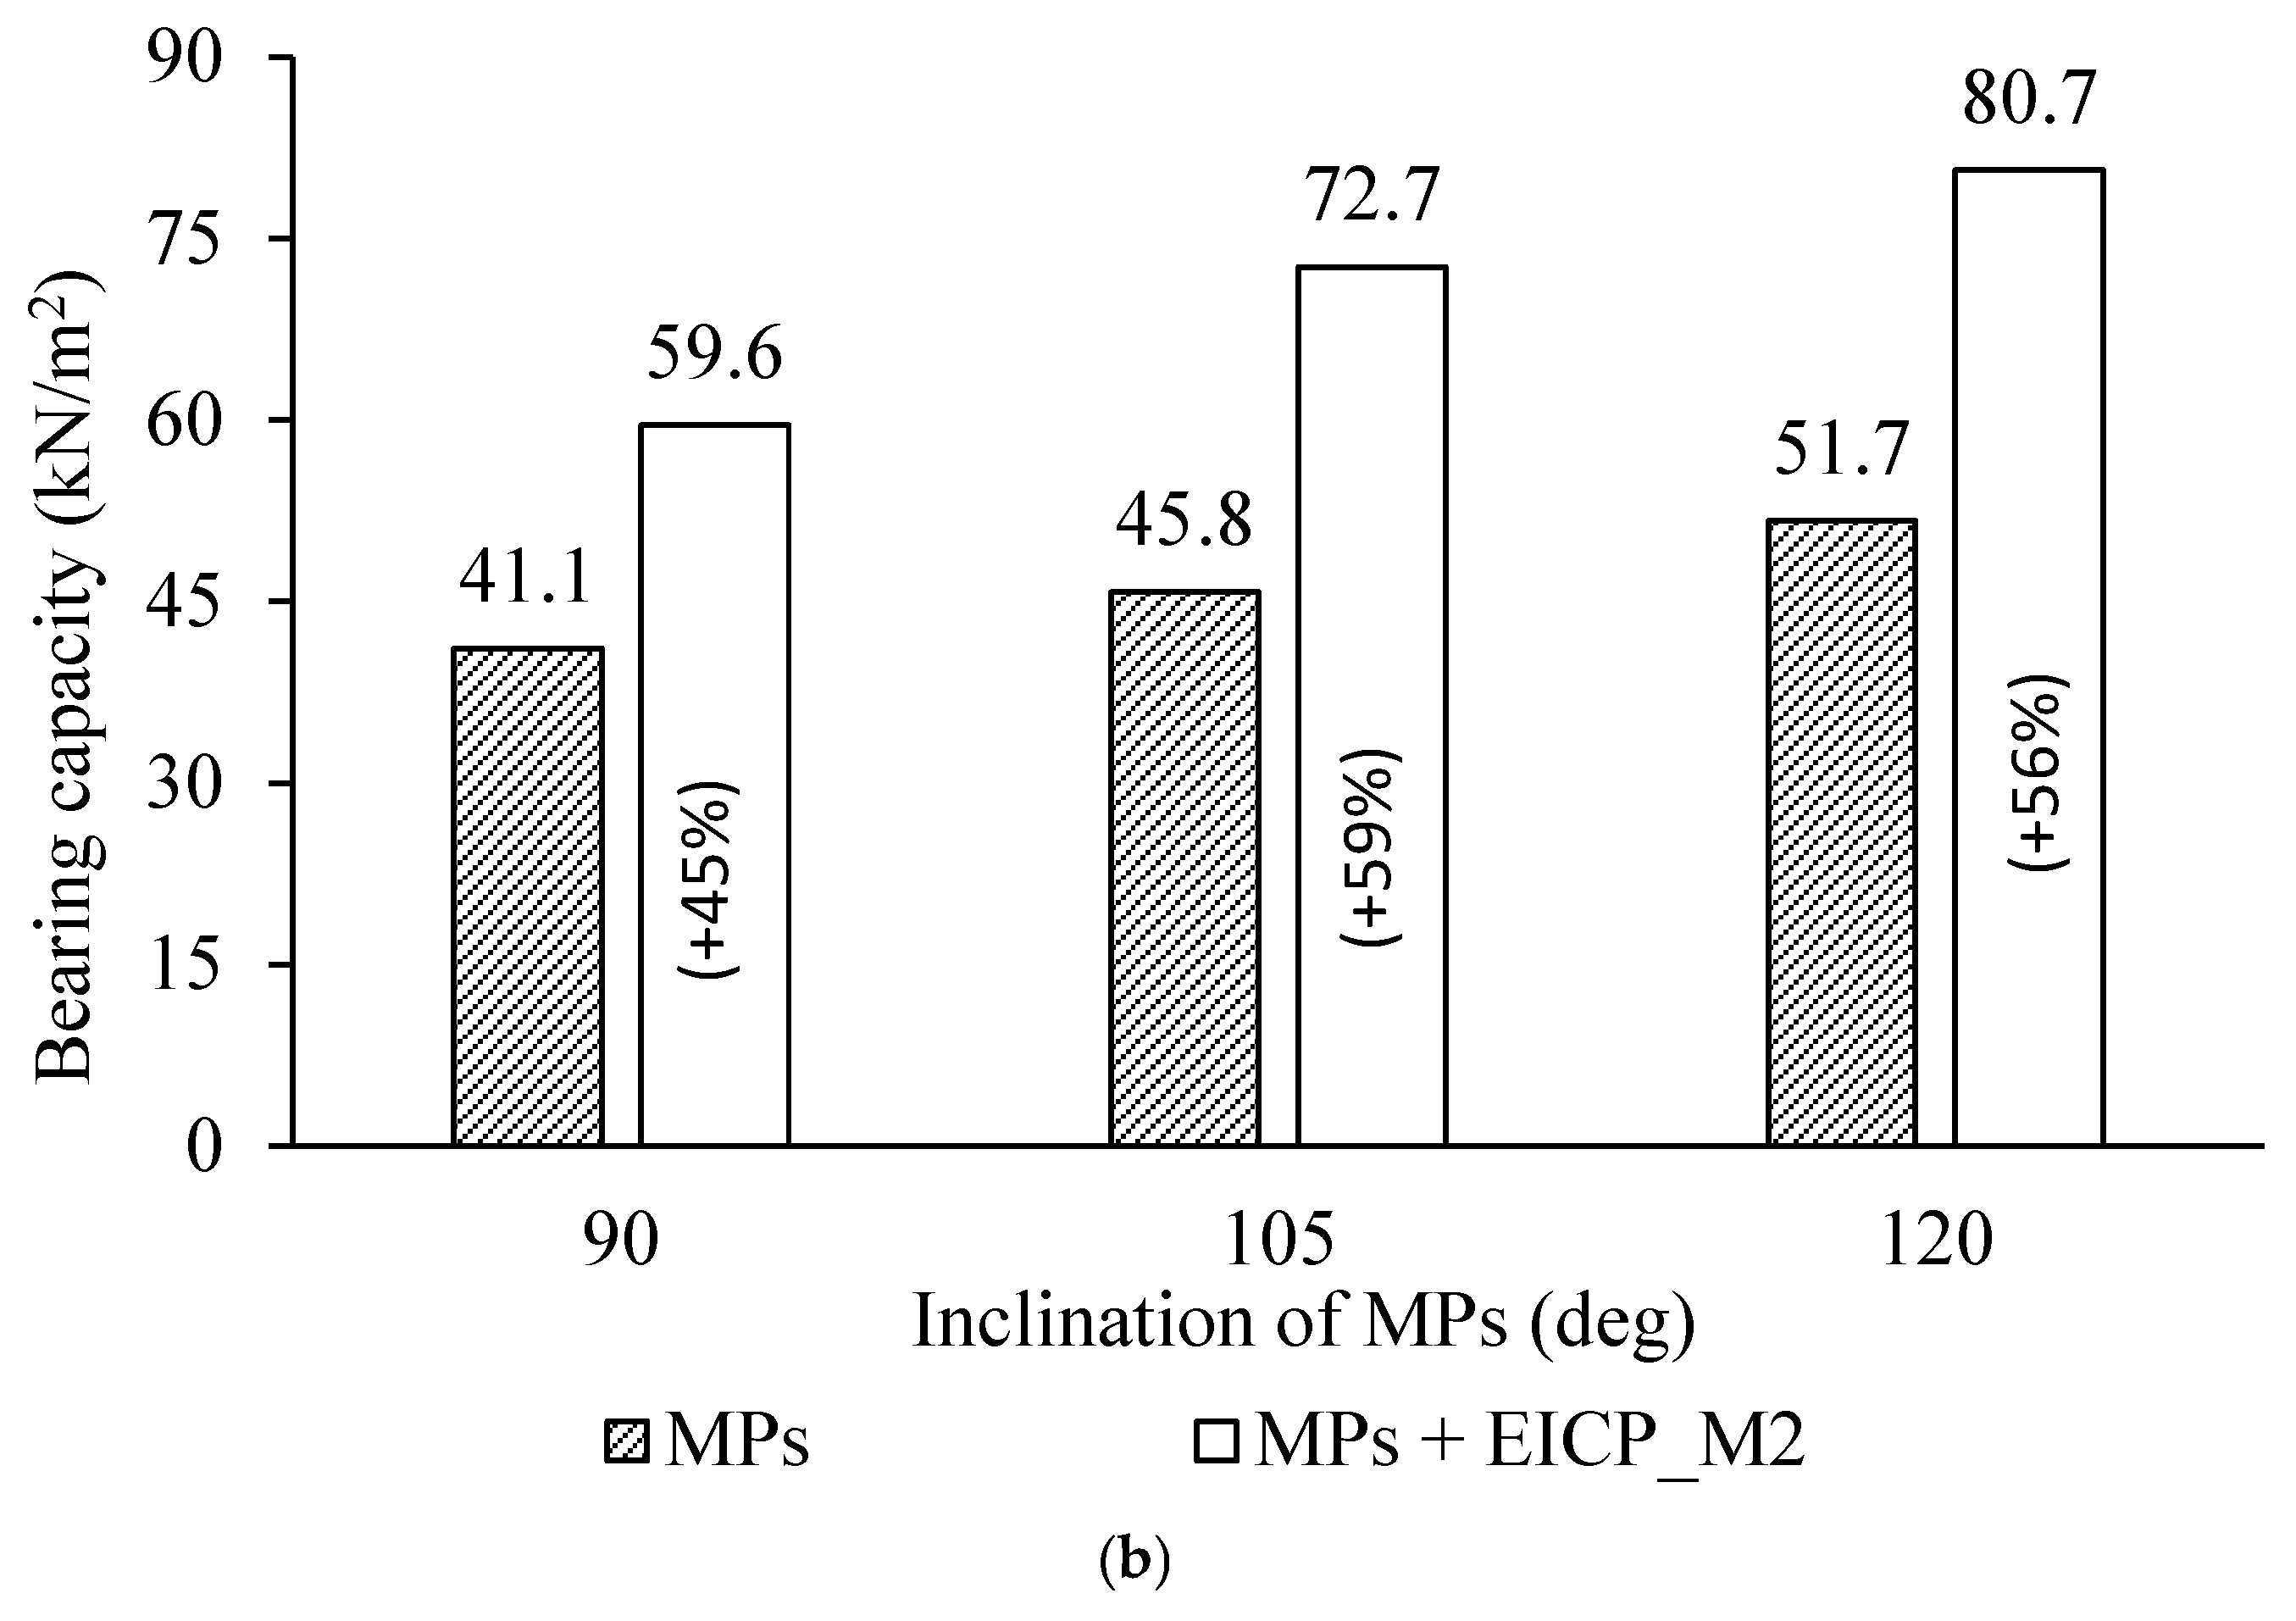
  • A similar trend (similar to method M1) is observed for EICP injected around the footing (method M2), but the enhancement in bearing capacity of the footing is much higher as compared to method M1. Compared to the control, the bearing capacity improvements for footings confined by EICP treatment using method M2 for micropile inclinations of 90°, 105°, and 120° were 66%, 103%, and 125%, respectively (Figure 12). In contrast, for EICP treatment using method M1, the increases were only 32%, 53%, and 83% at the same inclination angles (Figure 12). It is evident that the load-bearing capacity enhancement achieved by combining EICP treatment using method M2 with micropiles is significantly higher compared to the incorporation of micropiles alone. The EICP injection of soil (method M2) caused 45%, 59%, and 56% increases in the bearing capacity of footings (compared to the footing with the micropiles alone) for inclinations of 90°, 105°, and 120°, respectively (Figure 13b). The substantial enhancements observed for EICP-injected micropiles are attributed to the combined effect of soil confinement provided by the micropiles and the calcification process, which is not related to the pile inclination, as the injection is directly into the soil surrounding the footing.
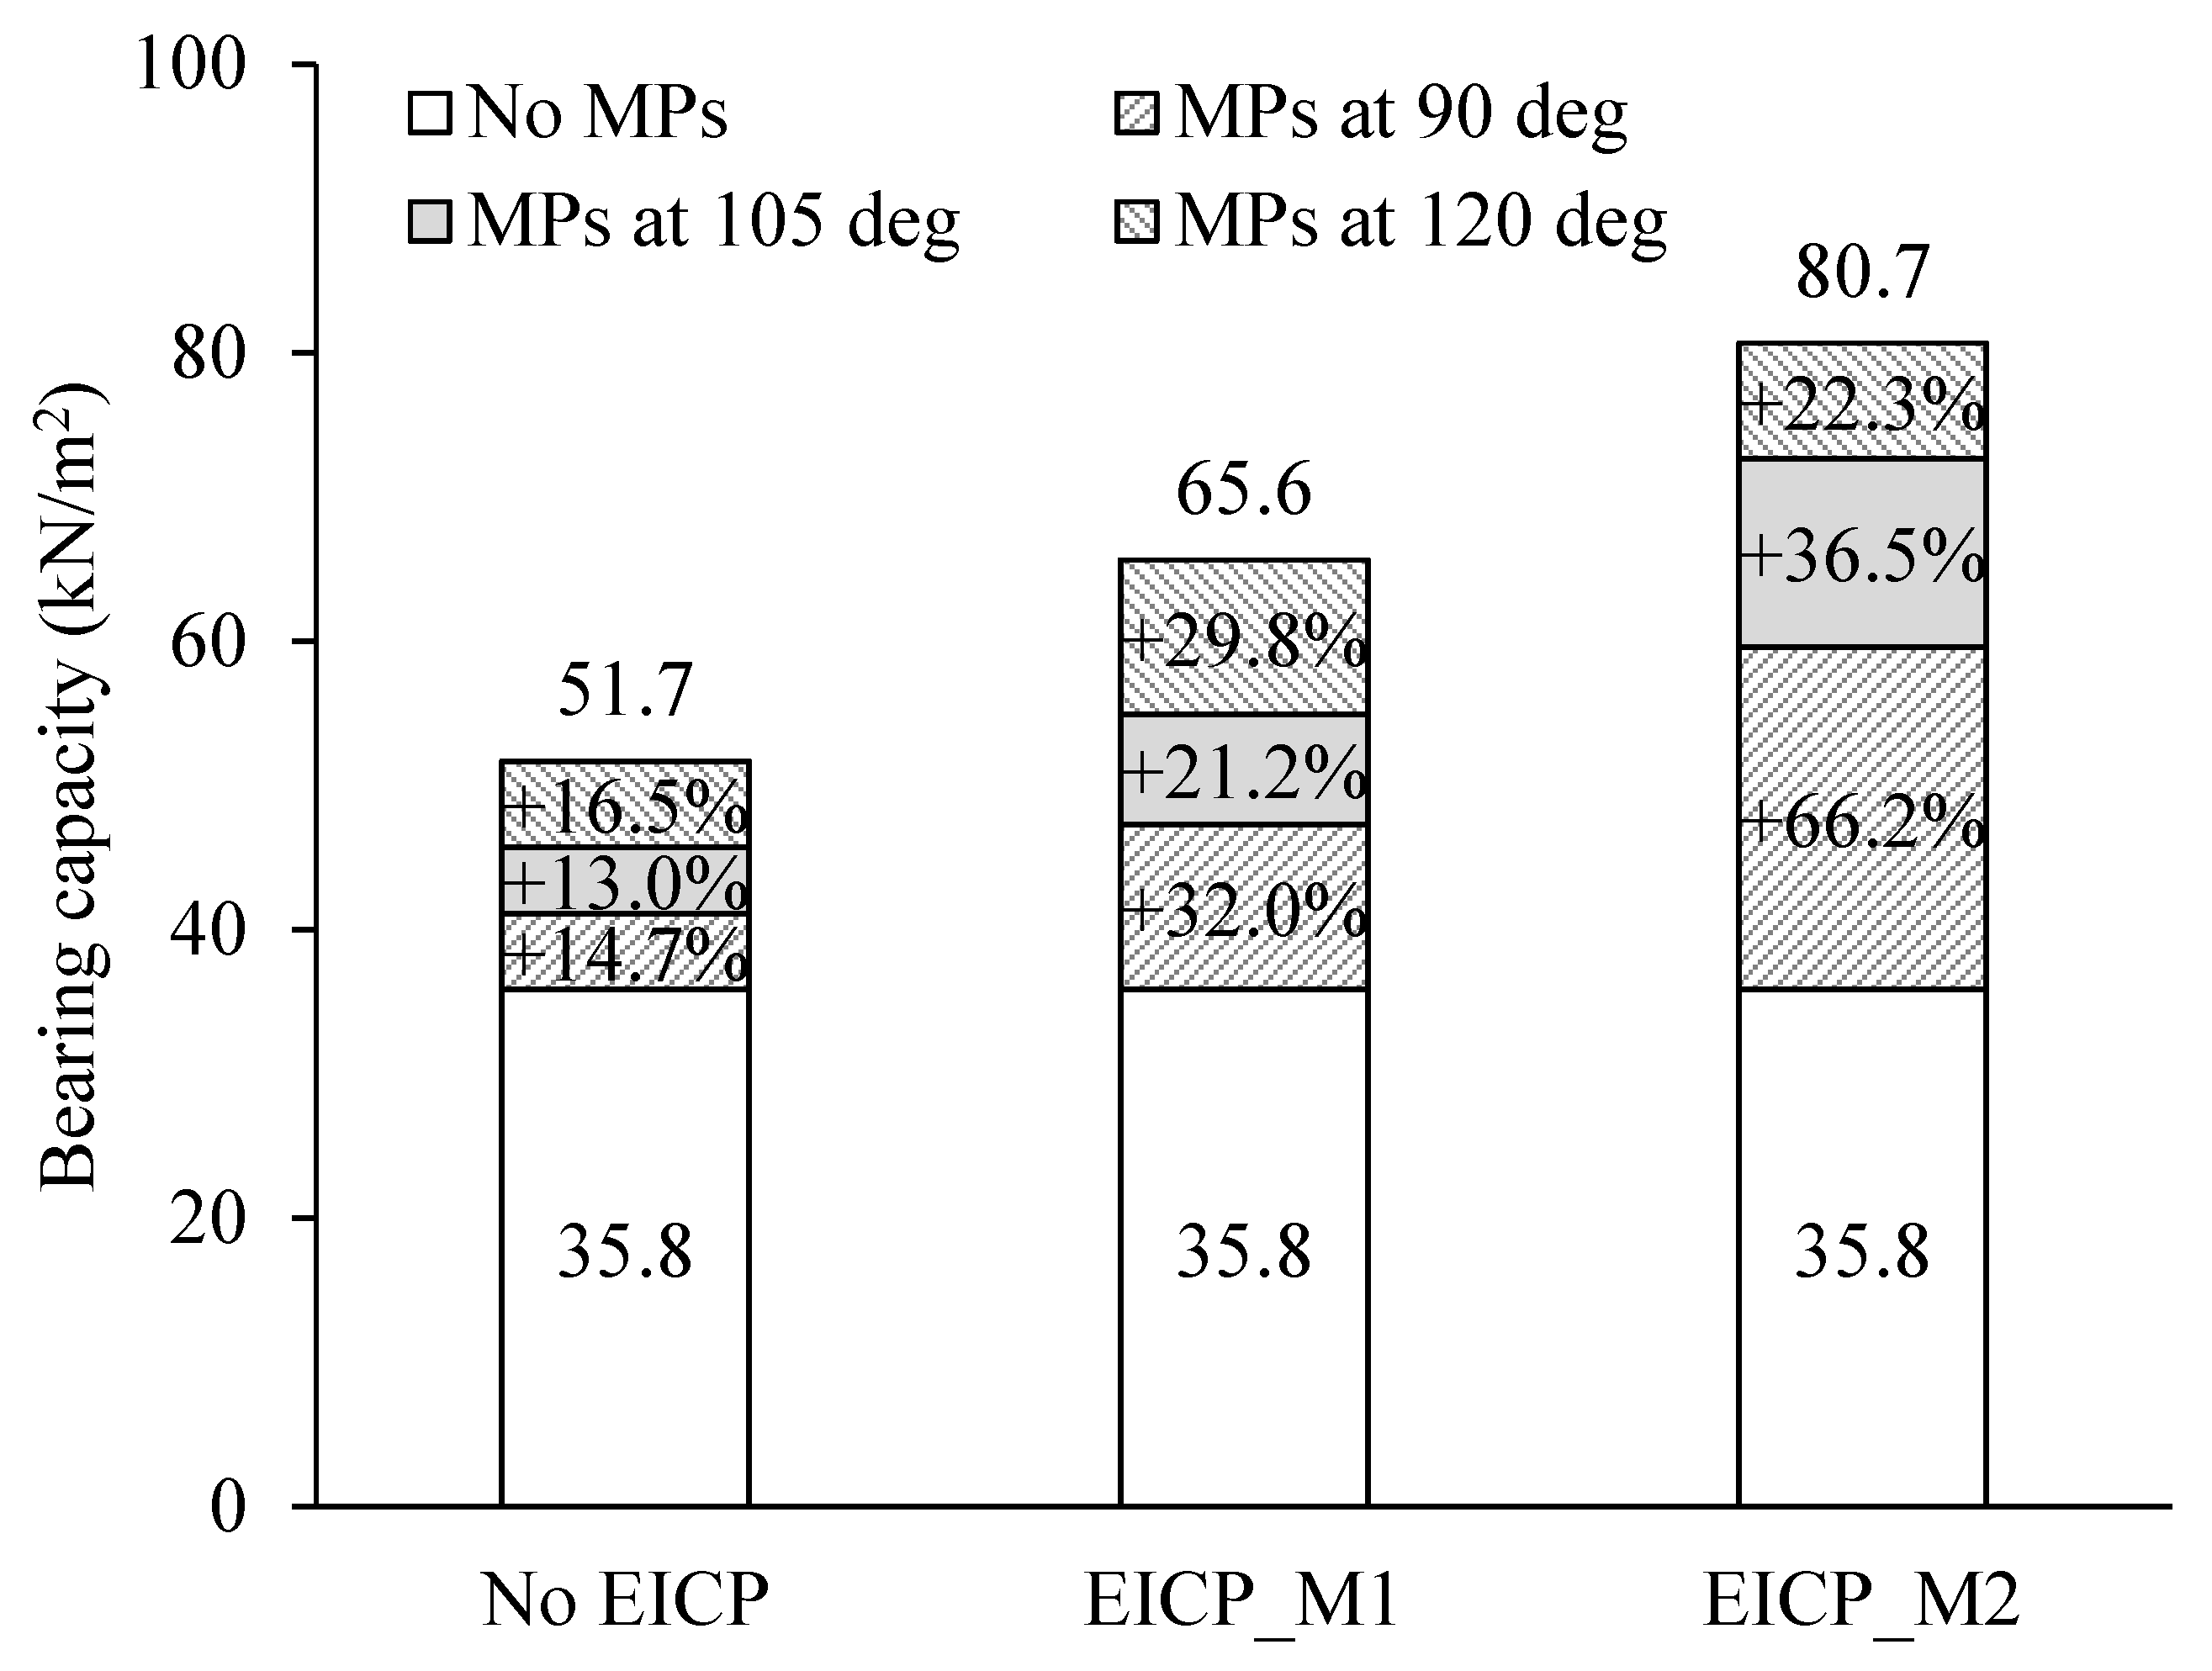
  • It is observed from Figure 14 that, for micropiles alone (without EICP), the bearing capacity increased by 14.7%, 13.0%, and 16.5% for micropile inclinations of 90°, 105°, and 120°, respectively. When EICP treatment was applied using method M1, the bearing capacity increases were 32.0%, 21.2%, and 29.8% for the same inclination angles (Figure 14). For EICP treatment using method M2, the bearing capacity increases were 66.2%, 36.5%, and 22.3% for 90°, 105°, and 120° micropile inclinations, respectively (Figure 14).
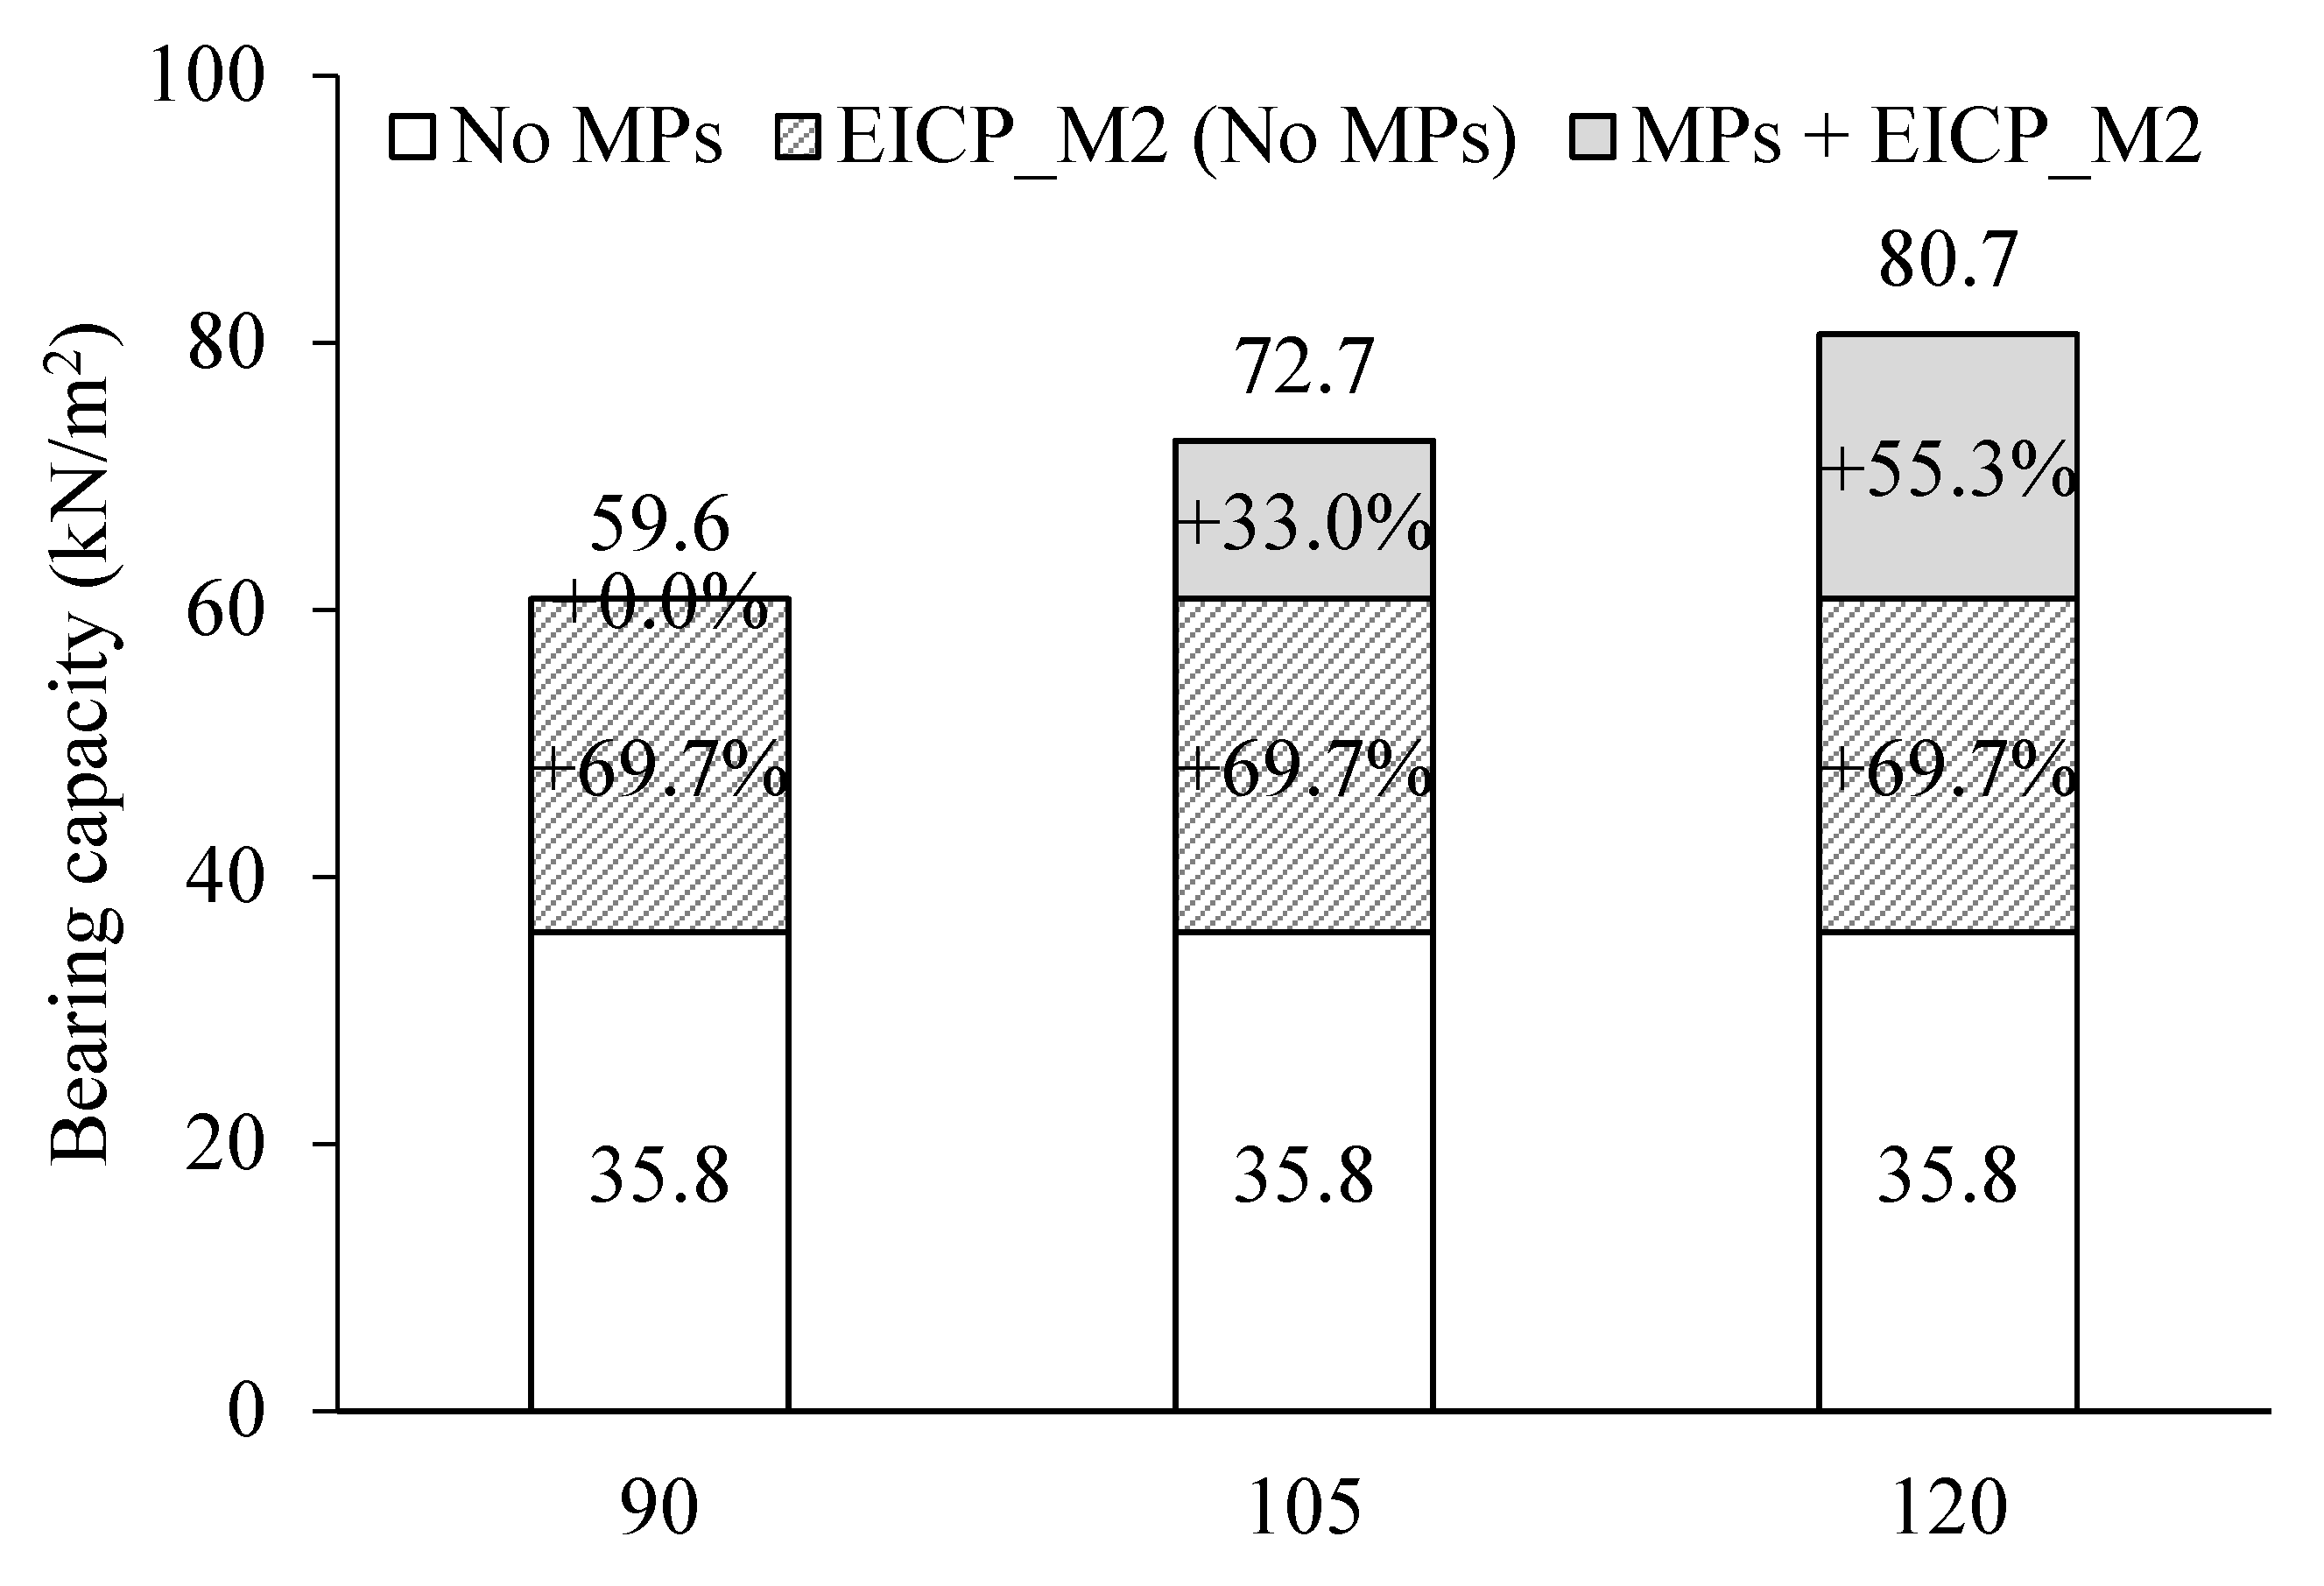
  • The bearing capacity enhancement due to EICP treatment using method M2 was quite significant at 69.7%, as it increased the bearing capacity to 60.8 kN/m2. However, when combined with vertical micropiles, the bearing capacity slightly decreased to 59.6 kN/m2. Although this represents a marginal reduction of 1.2 kN/m2, the plotted increase beyond EICP treatment M2 is shown as 0% in Figure 15 due to the negligible difference and the value indicated on the plot corresponds to the EICP treatment combined with vertical micropiles (59.6 kN/m2) rather than EICP treatment M2 alone (60.8 kN/m2). The similarity in BC values between the EICP treatment method M2 and its combination with vertical micropiles suggests that the micropiles had almost no additional effect on improving the bearing capacity. This is likely because the failure mechanism was dominated by the sudden collapse of the calcified sand columns formed by EICP, possibly due to shear band formation or the brittle nature of the calcified columns. The micropiles, being positioned away from the footing, did not provide confinement initially due to little expansion of the surrounding soil due to calcification. Moreover, at failure, the sudden soil expansion due to the collapse of calcified sand columns could not be prevented by the vertical micropiles. This highlights the need for placing vertical micropiles closer to the footing or alternative confinement strategies to enhance the performance of EICP-treated soils in similar scenarios for sustainable solutions to ensure both efficiency and reliability. Nevertheless, the provision of micropiles to EICP-treated sand caused 33.0% and 55.3% enhancement for micropile inclinations of 105° and 120°, respectively (Figure 15).
Although method M2 of EICP treatment proves to be significantly more effective than method M1, it may be better suited for smaller footings and loose sand. This is because the EICP injected from the ground surface may not penetrate deeply enough to have a substantial effect on the soil beneath the footing. In contrast, EICP injection through micropiles (method M1) can reach much deeper layers, even extending below the tip of the micropiles. As a result, method M1 is likely to be more efficient for larger footings, where deeper soil reinforcement is required to improve load-bearing capacity.
In the authors’ previous study [36], using the same sand and an EICP solution identical to E2 of that study [36], UCS exceeded 800 kPa after 14 days of curing. Although the current study employed a longer curing period (21 days), the volume of EICP solution per unit volume of sand was considerably lower. Additionally, in the earlier study, moisture was preserved by covering the samples with damp cloths during the first 7 days, likely promoting more effective strength development. In contrast, the surrounding dry sand in the current study may have caused moisture loss from the treated zone, potentially hindering UCS gain. Similar observations have been reported in other studies: Sun et al. [39] showed significant UCS gain in sand after 16 days of curing, and Lee and Kim [40] reported strength increases in clayey sand even after just 7 days, both attributed to a higher volume of EICP solution per unit volume of soil, and more favorable curing conditions, which stand in contrast to the present study.

6. SEM Analysis

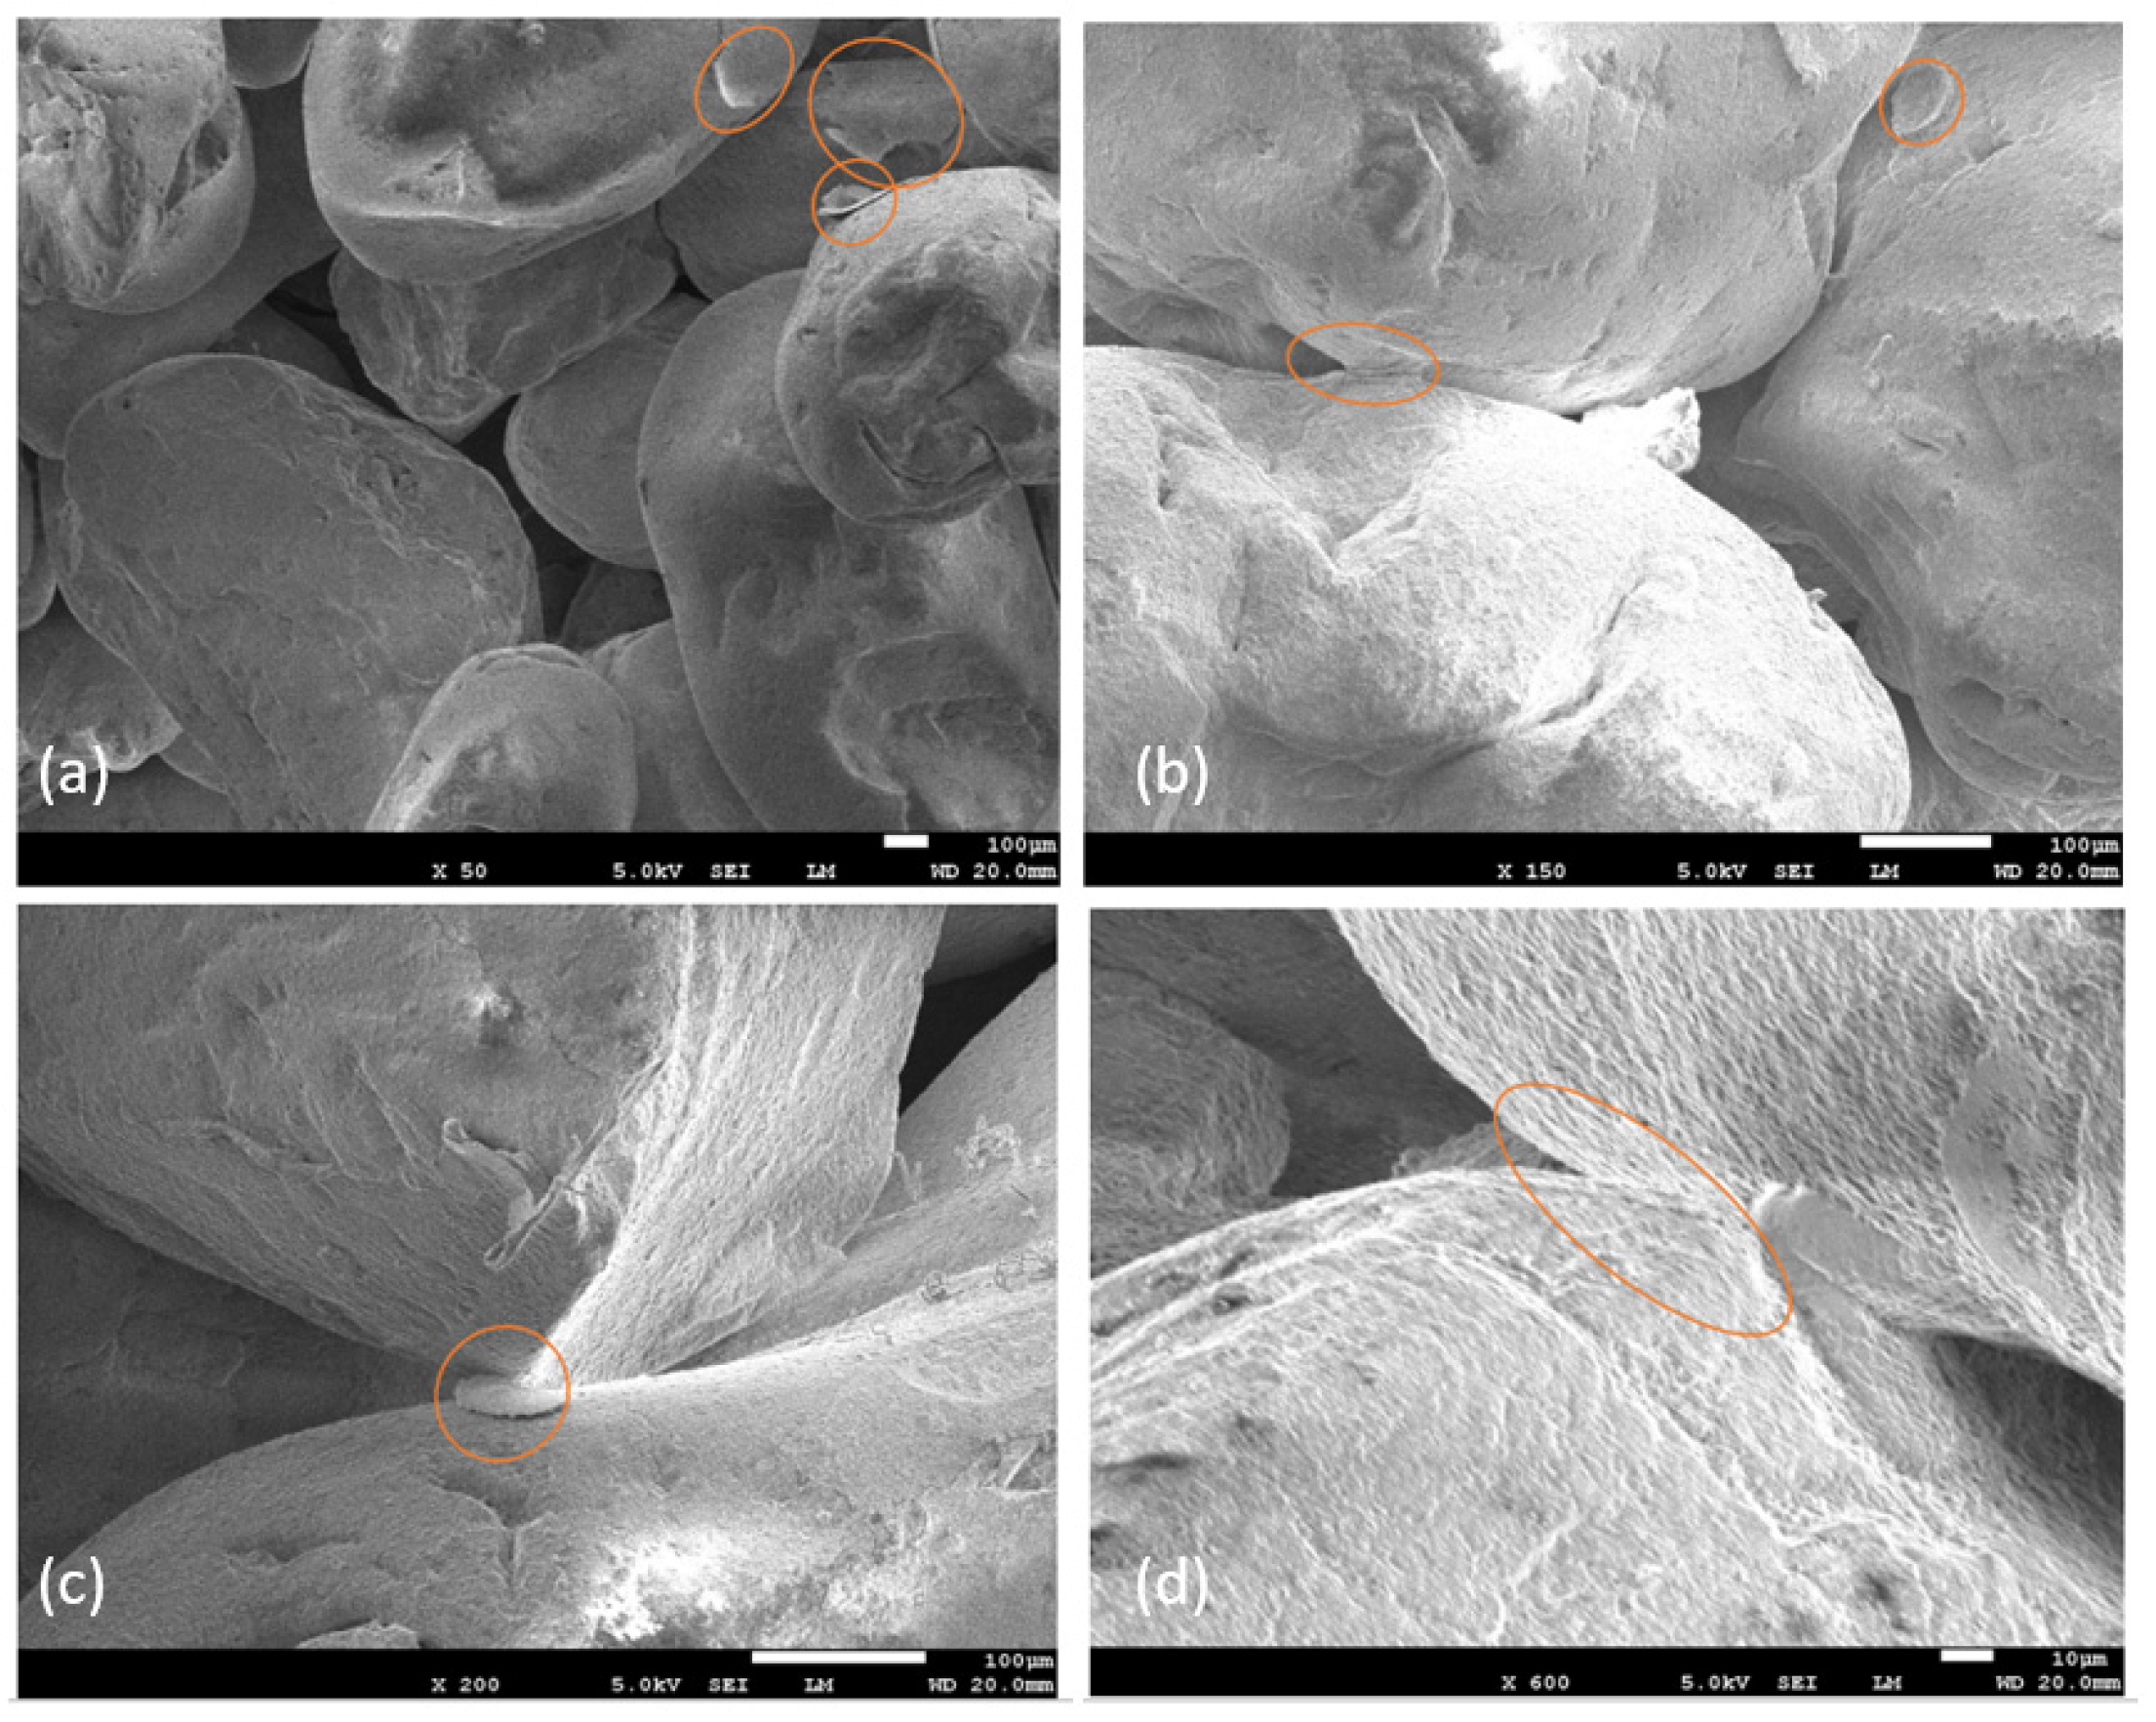
Referring to Figure 3, SEM images illustrate untreated Alrasheed sand at various magnification levels, providing insights into its surface texture and particle morphology. Comparing these untreated SEM images with the SEM images after EICP treatment in this study, as shown in Figure 16, significant calcite cementation is observed at particle contact points. This calcite acted as a binder between particles, explaining the bearing capacity enhancement due to the treated sand. The relatively low degree of cementation observed can be attributed to the limited quantity of EICP solution used in relation to the size of the test tank, the volume of Alrasheed sand utilized, and the specific testing methodology employed.
In Figure 17, the post-test photographs are visually depicted for method M1 of EICP treatment, with Figure 17a highlighting the settlement of the footing after the removal of the loading and LVDT assemblies. Additionally, Figure 17b illustrates the cementation of EICP-treated sand around the micropiles and footing within the test tank. Figure 17c details the EICP cementation around a micropile, and Figure 17d depicts EICP-treated sand extracted from around the micropile. These figures verify the presence of cementation around the micropiles. The bond between the sand particles is clearly visible in these photographs.
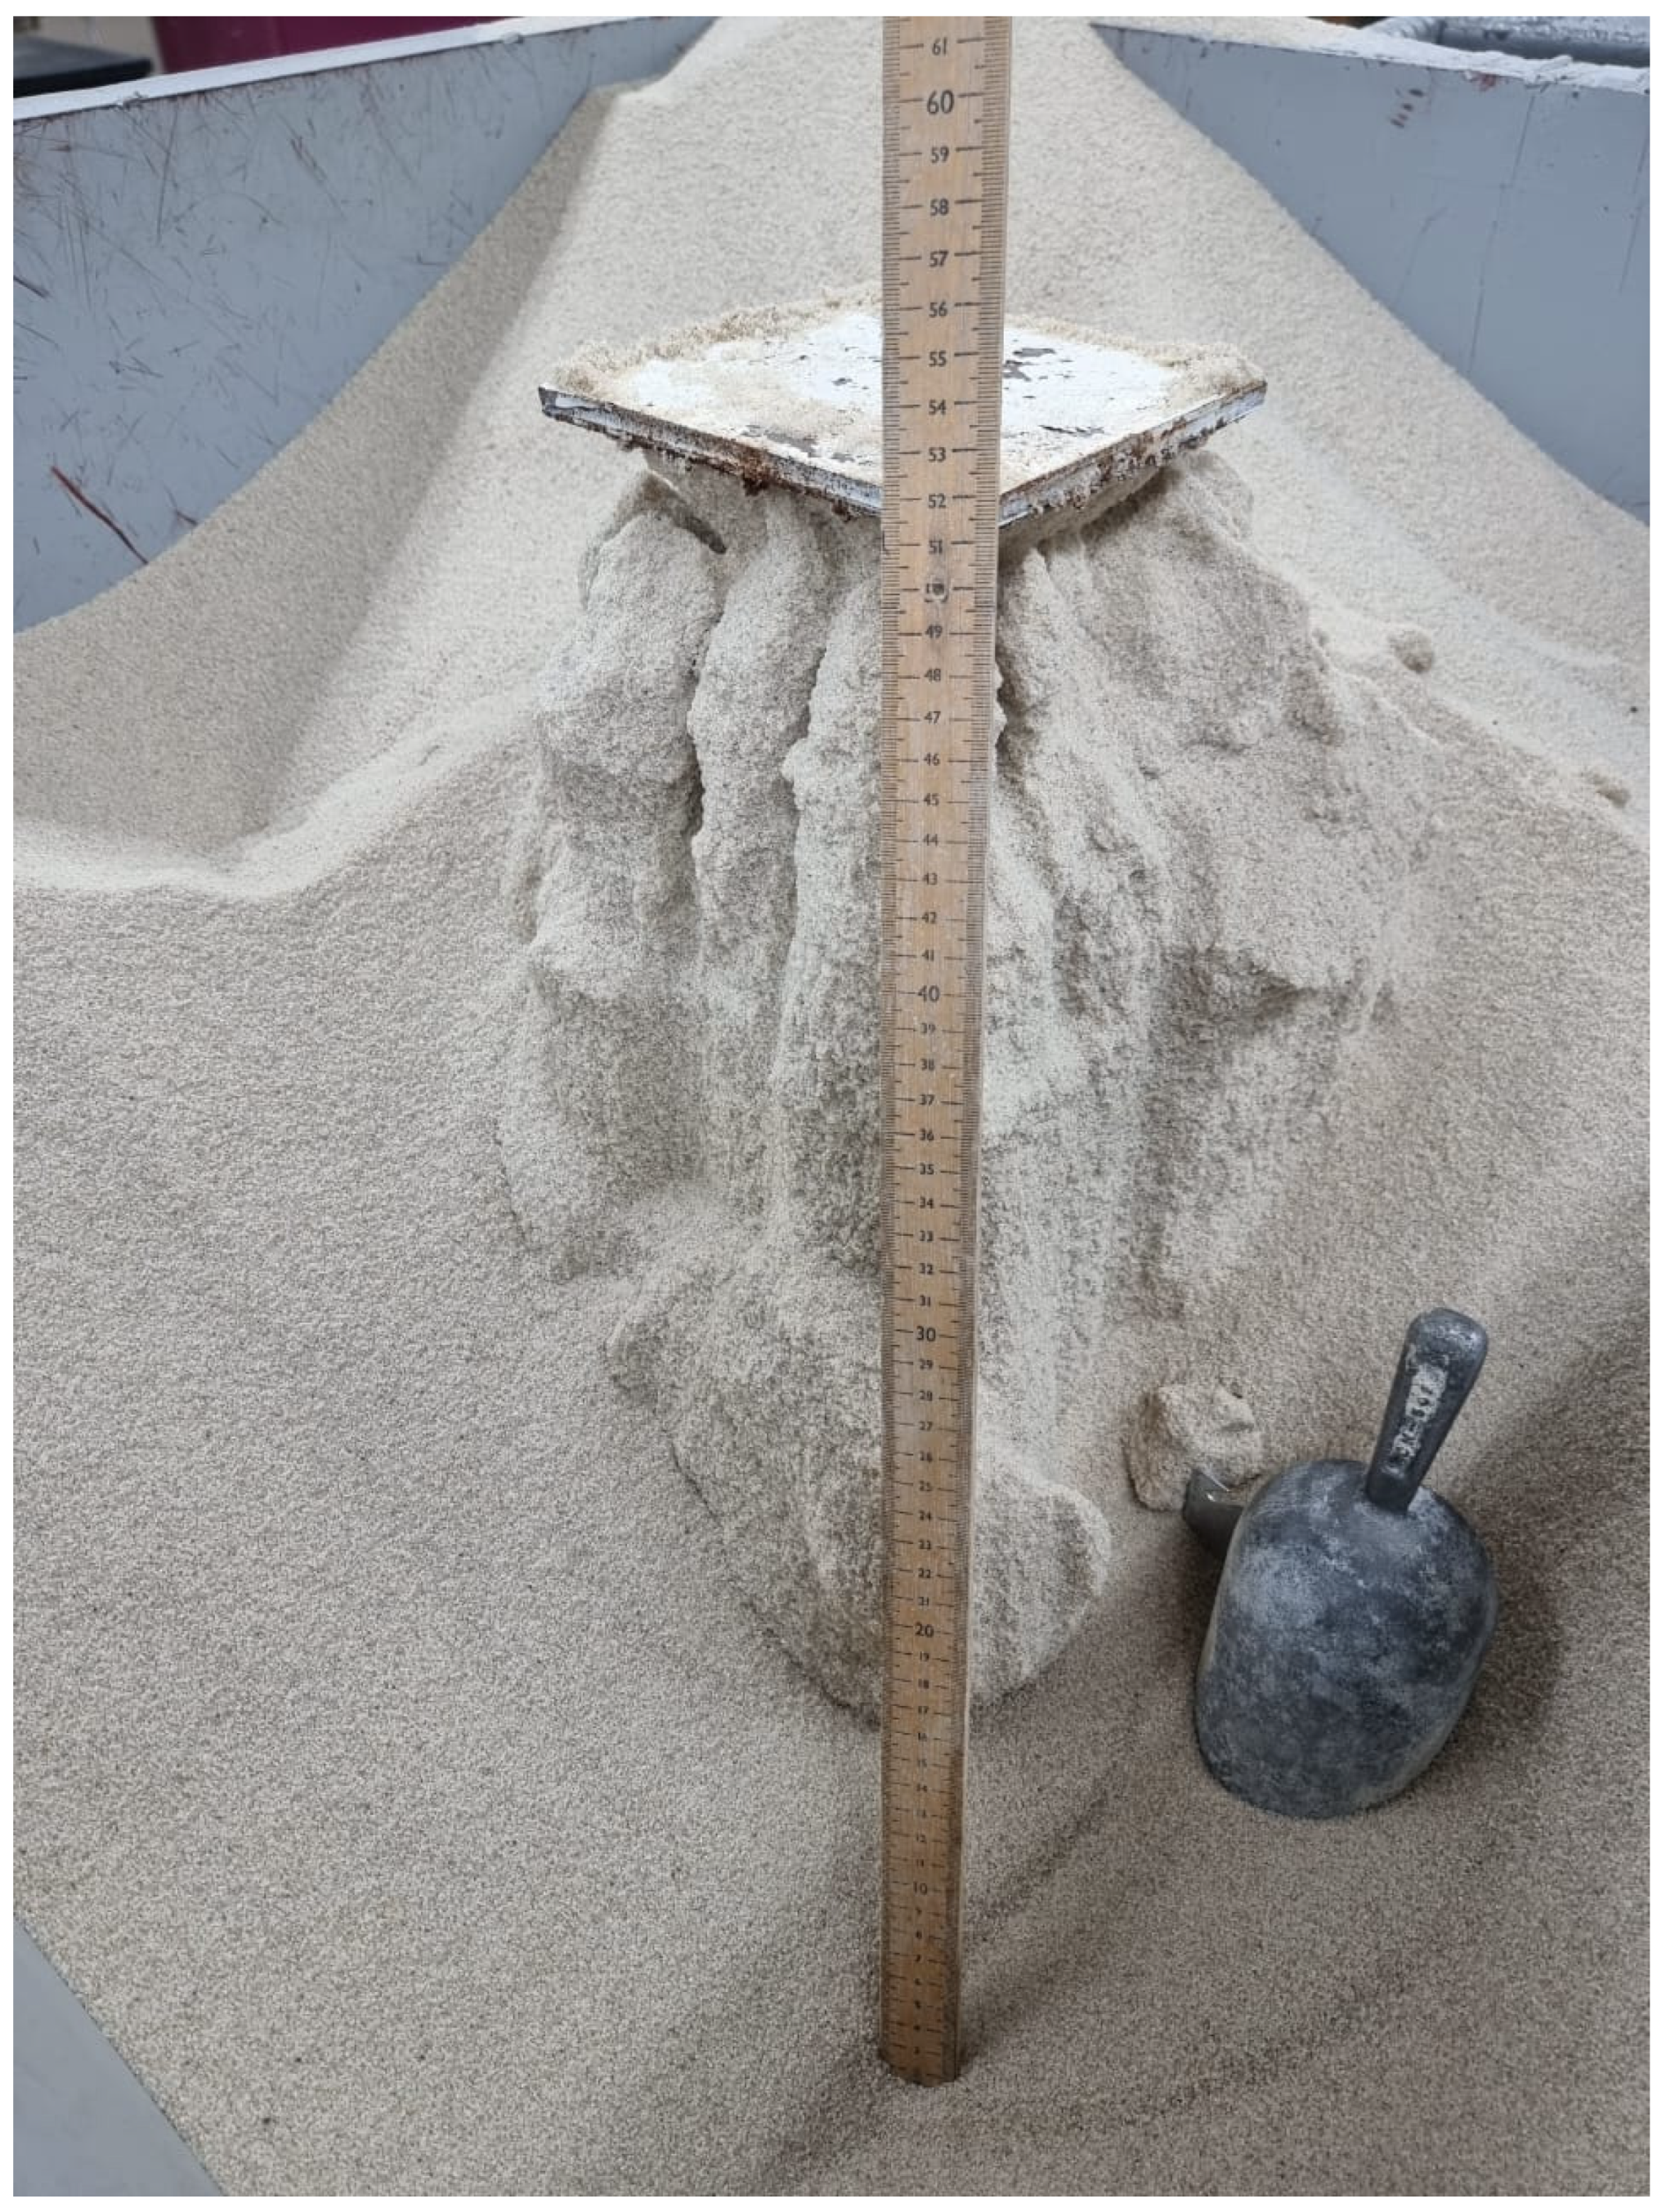
Figure 18 illustrates the post-test photographs of the footing for method M2 of EICP treatment with micropiles, with Figure 18a highlighting the settlement of the footing after the removal of the loading. Moreover, Figure 18b shows the EICP-treated sand under the footing, which verifies the presence of cementation, indicating a good bond between the sand particles. Figure 19 shows the cementation of sand under the footing for test T11 (i.e., method M2 without micropiles), which indicates that the calcification decreased with an increase in depth. Moreover, sand columns of calcified sand are observed almost down to the bottom of the tank (approximately 500 mm below the footing).
It is worth mentioning that quantitative measurements of calcification were not conducted in this study. This remains a limitation, as such data would have provided a more direct assessment of the extent of biocementation achieved through EICP.

7. Bearing Capacity Prediction of Footings

For a rectangular footing of width B and length L resting on soil, the ultimate bearing capacity of the footing can be estimated from [41]:
p u = c N c F c d c ζ c + q N q F q d q ζ q + 1 2 γ B N γ F γ d γ ζ γ
where c and are the shear strength parameters of soil, i.e., cohesion and angle of internal friction, γ is the soil’s unit weight, q is the effective soil stress at the footing’s base, N c , N q , and N γ are bearing capacity factors, S c , S q , and S γ are form factors, d c , d q , and d γ are depth factors, ζ c , ζ q , and ζ γ are the soil compressibility factors.
While the above Vesic formula [41] is generally applied to uniform soils, the use of the formula to model the EICP-treated soil is a simplification. The calcified system is modeled by representing the overall improved strength of the treated zone. The verification of this approach would ideally require a detailed analysis, possibly through numerical modeling or extensive experimental validation, to directly compare the formula’s predictions with the actual bearing capacity of the heterogeneous treated soil. This is recommended for future studies to validate the formula’s use in this context.
The confinement provided by micropiles (Figure 20) to the soil was considered by modifying the relative density (RD) of soil, D r , which was replaced by k D r , where k was predicted using the following models [38]:
k = 0.015 B s α 3 + 1                                 for   Model 1 0.1 0.17 s B α 3 + 1       for   Model 2
where s is micropile spacing, α (= θ π / 2 ) is the micropile’s inclination with the vertical in radians, θ is the micropile’s inclination with the horizontal in radians. Both models were shown to predict the value of the parameter k equally well. Thus, Model-1 is used in this study.
The magnified angle of internal friction of soil due to the presence of confining micropiles is estimated in degrees from:
= 8.33   k   D r + 31.1
The above equation was developed in the previous study [38] based on the experimental data of the study as well as data from the literature [42]. The cohesion introduced by the calcification of sand by EICP can be estimated in kN/m2 from:
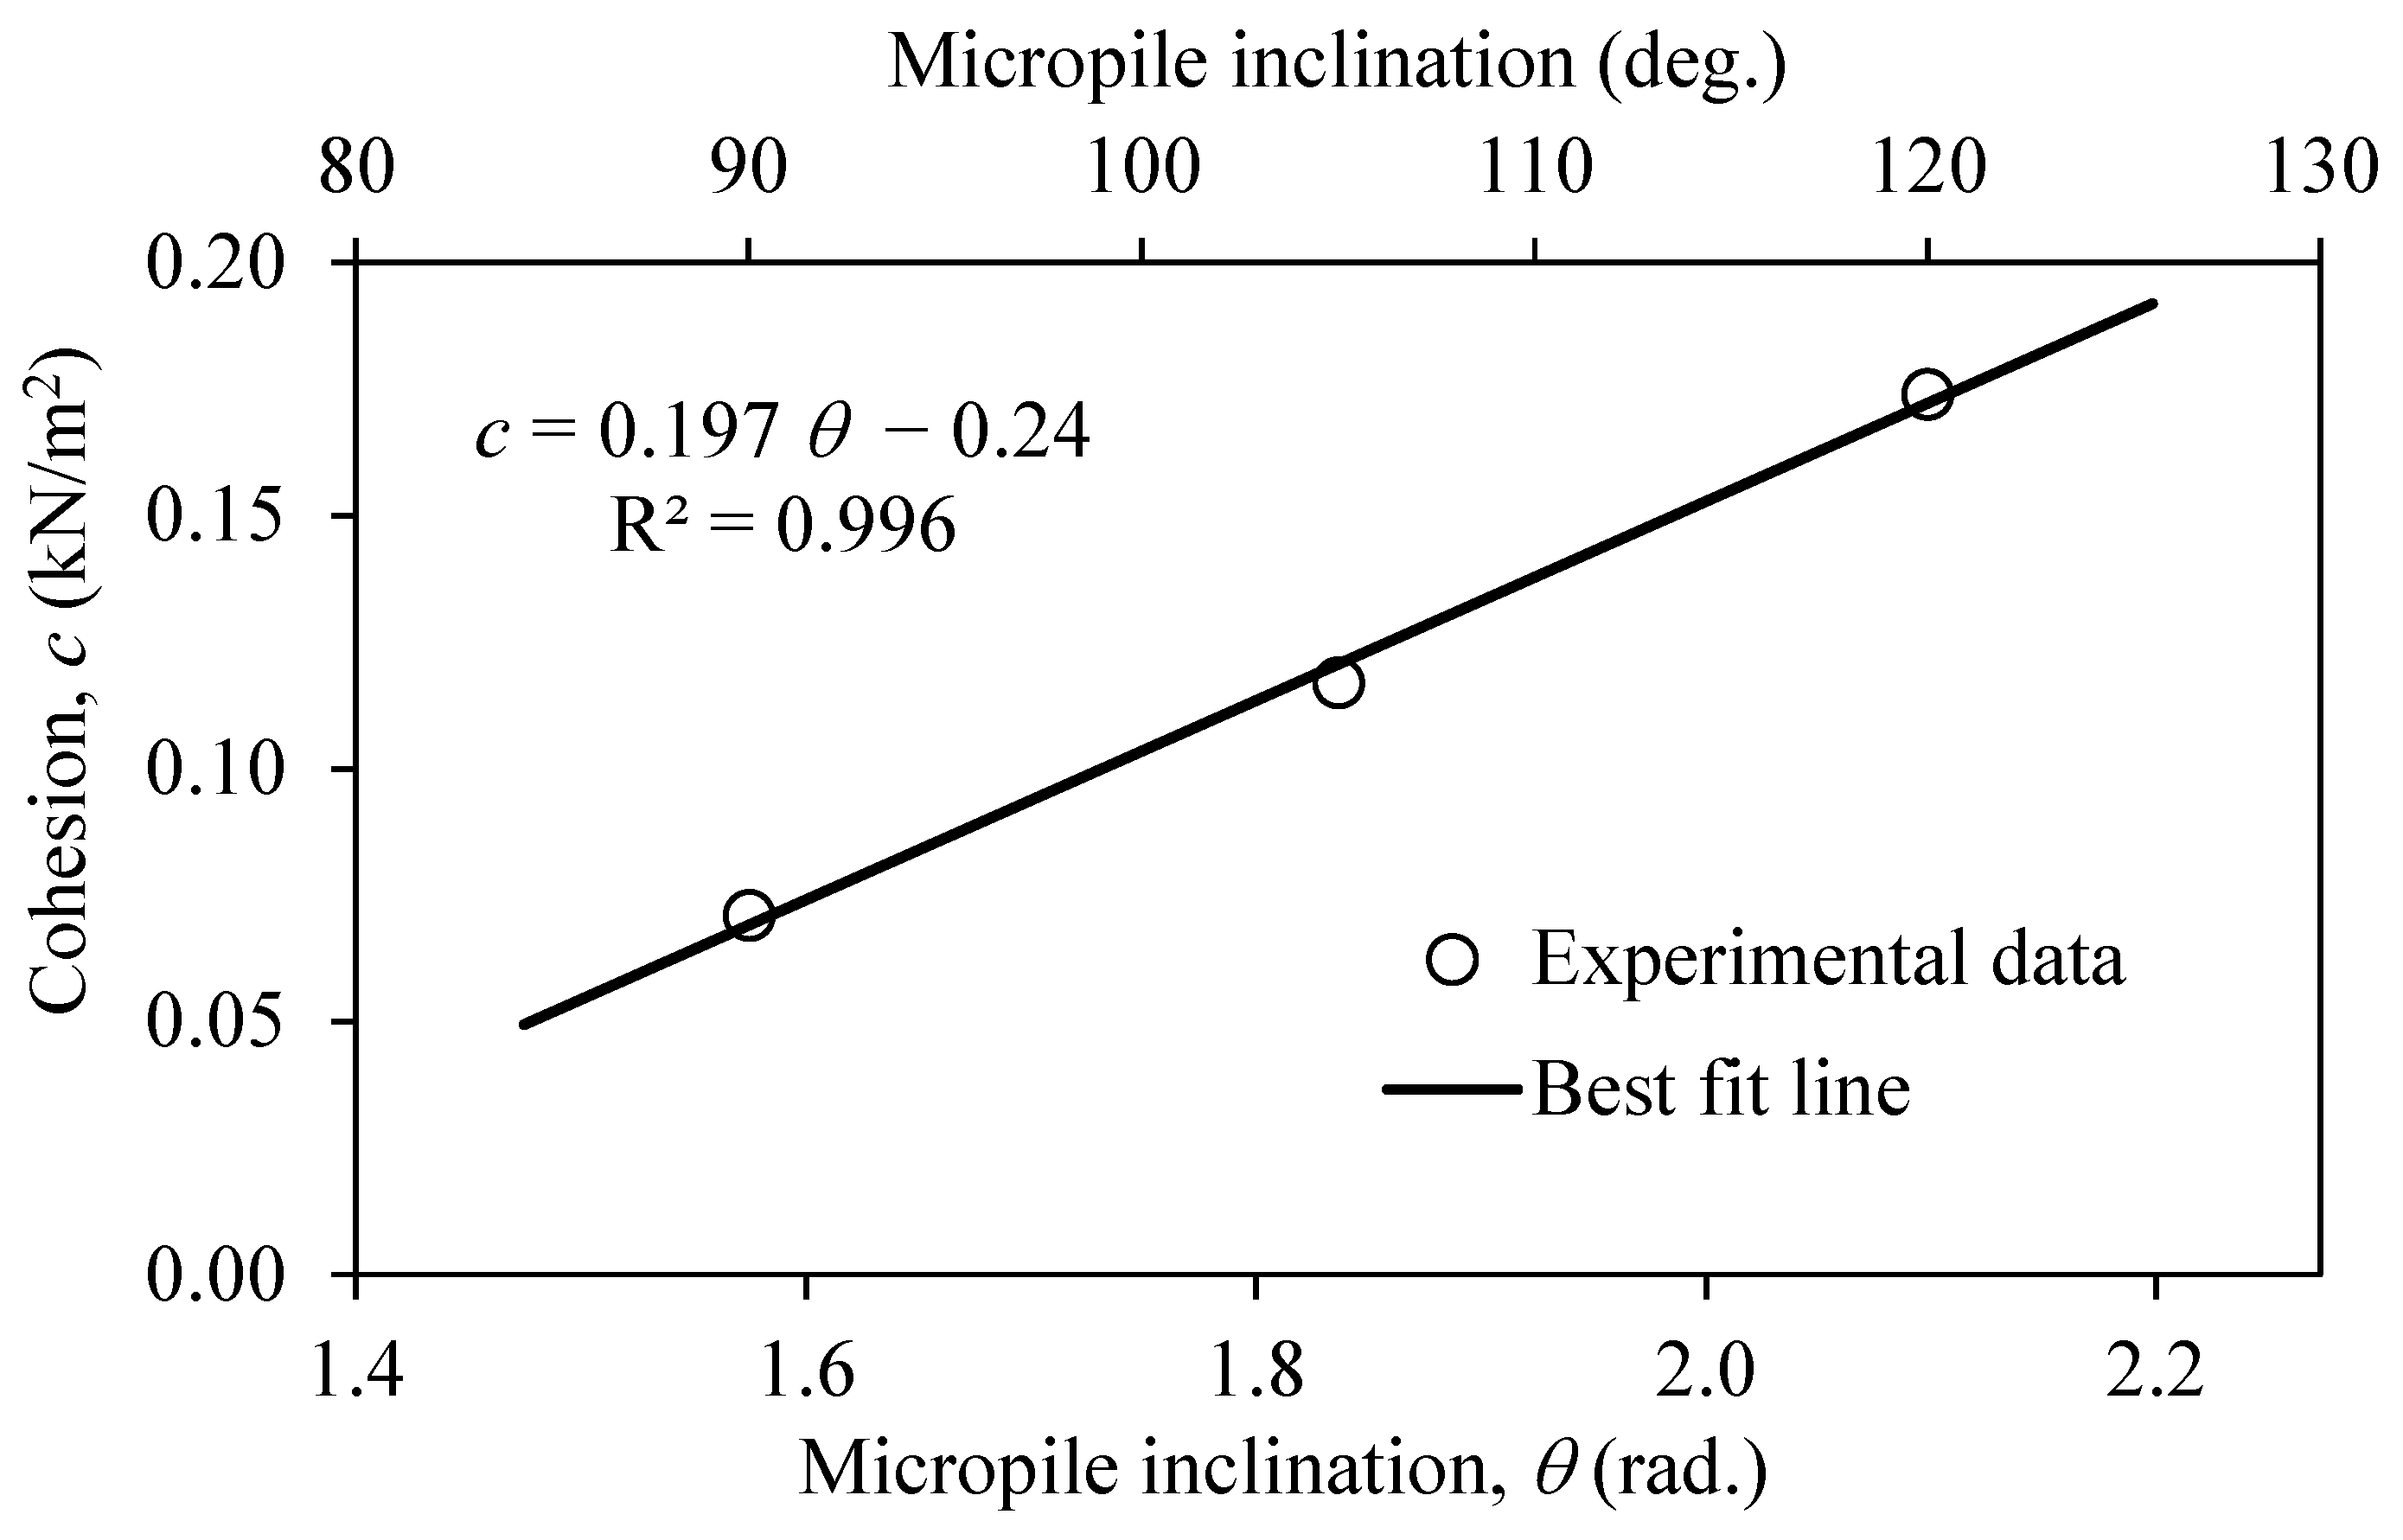
c = 0.197 θ 0.24               for   injection   of   EICP   through   MPs   Method M 1 0.31         for   EICP   injection   into   soil   around   the   footing   ( Method   M 2 )
where θ in the above equation is in radians. The above models are developed based on the experimental data of this study, as indicated in Figure 21 for method M1. Although the cohesion for EICP treatment using method M1 is dependent on the angle of inclination of the micropiles as the EICP was injected through micropiles, for method M2, the cohesion is independent of the micropile inclination. It is worth noting that the cohesion predictions of the current study are specific to the EICP treatment methods used, including concentration, quantity, curing age, and procedure. Any deviation from these treatment parameters will require a separate cohesion estimation based on the modified method employed. Generalizing this equation for general use would require extended parametric study to incorporate other variables, which is recommended for future studies.
Analyzing the failure mechanisms for method M2, like shear band formation or the brittle characteristics of the calcified columns, was not possible with our current experimental setup and data. This is recommended for future studies.
Using the predicted values of cohesion and the angle of friction, the ultimate bearing capacity of rectangular footings confined by micropiles and treated with the two EICP methods can be evaluated using Equation (8). The bearing capacity estimation procedure follows the approach outlined in the previous study [38], with the addition of cohesion, an aspect not considered in the earlier work, to assess the bearing capacity of the square footings tested in this study. The predicted bearing capacity, calculated using the modified RD from Equation (9) and shear strength parameters from Equations (10) and (11) (as reported in the table), is compared with experimental results in Table 2. The prediction error falls within a narrow range of −1.8% to +3.9%. This will help in the practical adoption of sustainable soil reinforcement strategies with confidence.
No sensitivity analysis or uncertainty quantification of model parameters was performed in this study. As the bearing capacity prediction model is semi-empirical and calibrated specifically for the sand and EICP conditions used in this study, its applicability may be limited outside the tested range. It is recommended that practical field considerations, such as other soil types, EICP treatment volume, treatment depth, scale effects, and environmental by-products should be addressed in future studies.

8. Conclusions

The major conclusions derived from the study are:
  • Regardless of micropile inclination, both EICP injection methods (M1 and M2) were observed to exhibit similar patterns of footing pressure variation with settlement, indicating that the basic load–settlement behavior remains consistent across treatment approaches.
  • An increase in micropile inclination was found to lead to a higher rate of footing pressure increase with settlement. EICP treatment significantly amplifies this effect, with method M2 demonstrating a steeper rise in footing pressure as settlement increases.
  • Incorporating EICP through micropiles (method M1) was found to significantly improve the load-bearing capacity of footings, with higher gains observed at increased micropile inclinations. The single tests showed bearing capacity increases of 32%, 53%, and 83% for micropile inclinations of 90°, 105°, and 120°, respectively, compared to the control. This enhancement is attributed to a combination of soil confinement from micropiles and intensified calcification at higher inclinations. The use of EICP offers a low-carbon, bio-mediated alternative to traditional cement-based ground improvement, contributing to environmental sustainability.
  • EICP treatment method M2 provided greater bearing capacity improvements compared to method M1, with increases of 66%, 103%, and 125% for micropile inclinations of 90°, 105°, and 120°, respectively. These gains result from a combination of micropile confinement and uniform calcification around the footing, which appeared to be unaffected by micropile inclination due to direct injection into the surrounding soil. This method, requiring fewer materials and less energy-intensive processes, reinforces the potential of sustainable biogeotechnical solutions.
  • EICP treatment method M2 with vertical micropiles indicated no improvement in bearing capacity. This is because the failure mechanism is dominated by the sudden collapse of calcified sand columns formed by EICP treatment, and the vertical micropiles, located farther from the footing, fail to provide confinement. The lack of initial soil expansion due to calcification also prevents them from providing confinement. This highlights the need for closer vertical micropile placement or alternative confinement strategies in such cases for sustainable solutions to ensure both efficiency and reliability.
  • Although method M2 showed superior performance in improving bearing capacity for small footings and loose sand, its limited penetration depth may reduce its effectiveness for larger footings and denser sands. In such cases, method M1’s ability to reinforce deeper soil layers offers a more efficient solution for enhancing load-bearing capacity. Tailoring sustainable treatment strategies based on site conditions is essential for maximizing both environmental and structural benefits.
  • SEM images of EICP-injected sand indicate calcite cementation at particle contact points, which acted as a binder between particles, explaining the bearing capacity enhancement due to the treated sand. The post-test photographs of the cementation of EICP-treated sand around the micropiles and footing further verify the calcification of sand.
  • The predicted bearing capacities, based on modified reduction factors and shear strength parameters, showed good agreement with experimental results. The prediction error falls within a narrow range of −1.8% to +3.9%, demonstrating the potential reliability of the proposed models. Further validation with a larger dataset would be required to confirm the model’s reliability for practical adoption of sustainable soil reinforcement strategies with confidence.

Author Contributions

Conceptualization, H.A. and A.A.; methodology, H.A., A.A. and E.K.; validation, H.A. and E.K.; formal analysis and investigation, H.A. and E.K.; resources, A.A. and Y.A.-S.; data curation, H.A., E.K. and A.A.; writing—original draft preparation, H.A., A.A. and E.K.; Writing—review and editing, H.A. and Y.A.-S.; visualization, H.A. and A.A.; supervision, A.A. and Y.A.-S.; funding acquisition, Y.A.-S. All authors have read and agreed to the published version of the manuscript.

Funding

This research was funded through Ongoing Research Funding program—Research Chairs (ORF-RC-2025-0400), King Saud University, Riyadh, Saudi Arabia.

Data Availability Statement

All data and models generated or used during the study appear in the article.

Acknowledgments

The authors gratefully acknowledge the funding received through Ongoing Research Funding program—Research Chairs (ORF-RC-2025-0400), King Saud University, Riyadh, Saudi Arabia.

Conflicts of Interest

The authors declare no conflicts of interest.

References

  1. Arab, M.G.; Alsodi, R.; Almajed, A.; Yasuhara, H.; Zeiada, W.; Shahin, M.A. State-of-the-art review of enzyme-induced calcite precipitation (EICP) for ground improvement: Applications and prospects. Geosciences 2021, 11, 492. [Google Scholar] [CrossRef]
  2. Wani, K.S.; Mir, B.A. Effect of microbial stabilization on the unconfined compressive strength and bearing capacity of weak soils. Transp. Infrastruct. Geotechnol. 2021, 8, 59–87. [Google Scholar] [CrossRef]
  3. Hadi, S.; Abbas, H.; Almajed, A.; Binyahya, A.; Al-Salloum, Y. Biocementation by Sporosarcina pasteurii ATCC6453 under simulated conditions in sand columns. J. Mater. Res. Technol. 2022, 18, 4375–4384. [Google Scholar] [CrossRef]
  4. Whiffin, V.S. Microbial CaCO3 Precipitation for the Production of Biocement. Ph.D. Thesis, Murdoch University, Perth, Australia, 2004. [Google Scholar]
  5. Omoregie, A.I.; Wong, C.S.; Rajasekar, A.; Ling, J.H.; Laiche, A.B.; Basri, H.F.; Ouahbi, T. Bio-based solutions for concrete infrastructure: A review of microbial-induced carbonate precipitation in crack healing. Buildings 2025, 15, 1052. [Google Scholar] [CrossRef]
  6. Feng, D.; Yu, Y.; Wang, J.; Fang, C.; Liang, S. Experimental study on shear and disintegration resistance of MICP-treated residual granite soil. Environ. Earth Sci. 2024, 83, 179. [Google Scholar] [CrossRef]
  7. Hamed Khodadadi, T.; Kavazanjian, E.; van Paassen, L.; DeJong, J. Bio-Grout Materials: A Review. In Grouting 2017; American Society of Civil Engineers: Reston, VA, USA, 2017; pp. 1–12. [Google Scholar] [CrossRef]
  8. Valencia-Galindo, M.; Sáez, E.; Ovalle, C.; Ruz, F. Evaluation of the effectiveness of a soil treatment using calcium carbonate precipitation from cultivated and Lyophilized bacteria in soil’s compaction water. Buildings 2021, 11, 545. [Google Scholar] [CrossRef]
  9. Li, M.; Wen, K.; Li, Y.; Zhu, L. Impact of oxygen availability on microbially induced calcite precipitation (MICP) treatment. Geomicrobiol. J. 2018, 35, 15–22. [Google Scholar] [CrossRef]
  10. Al-Thawadi, S. High Strength in-Situ Biocementation of Soil by Calcite Precipitating Locally Isolated Ureolytic Bacteria. Ph.D. Thesis, Murdoch University, Perth, Australia, 2008. [Google Scholar]
  11. Ivanov, V.; Chu, J. Applications of microorganisms to geotechnical engineering for bioclogging and biocementation of soil in situ. Rev. Environ. Sci. Bio/Technol. 2008, 7, 139–153. [Google Scholar] [CrossRef]
  12. Nemati, M.; Voordouw, G. Modification of porous media permeability, using calcium carbonate produced enzymatically in situ. Enzym. Microb. Technol. 2003, 33, 635–642. [Google Scholar] [CrossRef]
  13. Hoang, T.; Alleman, J.; Cetin, B.; Ikuma, K.; Choi, S.G. Sand and silty-sand soil stabilization using bacterial enzyme–induced calcite precipitation (BEICP). Can. Geotech. J. 2019, 56, 808–822. [Google Scholar] [CrossRef]
  14. Yuan, L.; Li, G.; Liu, J.; Wang, P.; Liu, C.; Zhang, J. Study on Mechanical Properties of Sandy Soil Solidified by Enzyme-Induced Calcium Carbonate Precipitation (EICP). Buildings 2024, 14, 1977. [Google Scholar] [CrossRef]
  15. Wen, C. Laboratory Investigations on the Effectiveness of Bio-Enzyme on the Strength of Cement or Lime Treated High Liquid Limit Soil. Int. J. Geosynth. Ground Eng. 2024, 10, 96. [Google Scholar] [CrossRef]
  16. Zhao, Z.; Hamdan, N.; Shen, L.; Nan, H.; Almajed, A.; Kavazanjian, E.; He, X. Biomimetic hydrogel composites for soil stabilization and contaminant mitigation. Environ. Sci. Technol. 2016, 50, 12401–12410. [Google Scholar] [CrossRef]
  17. Graddy, C.M.R.; Gomez, M.G.; Kline, L.M.; Morrill, S.R.; DeJong, J.T.; Nelson, D.C. Diversity of sporosarcina-like bacterial strains obtained from meter-scale augmented and stimulated biocementation experiments. Environ. Sci. Technol. 2018, 52, 3997–4005. [Google Scholar] [CrossRef]
  18. Ghasemi, P.; Montoya, B.M. Effect of treatment solution chemistry and soil engineering properties due to microbially induced carbonate precipitation treatments on vegetation health and growth. ACS EST Eng. 2022, 2, 2196–2205. [Google Scholar] [CrossRef]
  19. Zhang, Q.; Ye, W.; Liu, Z.; Wang, Q.; Chen, Y. Influence of injection methods on calcareous sand cementation by EICP technique. Constr. Build. Mater. 2023, 363, 129724. [Google Scholar] [CrossRef]
  20. Xue, Y.; Arulrajah, A.; Chu, J.; Horpibulsuk, S. Soybean urease-based EICP stabilization of washed recycled sands derived from demolition wastes cured at low temperatures. Constr. Build. Mater. 2024, 434, 136735. [Google Scholar] [CrossRef]
  21. Xu, J.; Li, X.; Liu, Y.; Li, Z.; Wang, S. Evaluation of wind erosion resistance of EICP solidified desert sand based on response surface methodology. Constr. Build. Mater. 2024, 447, 138119. [Google Scholar] [CrossRef]
  22. Liu, P.; Chen, Y.; Zhang, Y.; Cheng, Y. Application of chitosan in EICP treatment for stabilization of red mud against wind erosion. Constr. Build. Mater. 2025, 465, 140164. [Google Scholar] [CrossRef]
  23. Raymond, A.J.; Purdy, C.; Fox, T.; Kendall, A.; DeJong, J.T.; Kavazanjian, E., Jr.; Martin, K. Life cycle sustainability assessment of enzyme-induced carbonate precipitation (EICP) for fugitive dust control. Acad. J. Civ. Eng. 2019, 37, 600–607. [Google Scholar] [CrossRef]
  24. Alotaibi, E.; Arab, M.G.; Abdallah, M.; Nassif, N.; Omar, M. Life cycle assessment of biocemented sands using enzyme induced carbonate precipitation (EICP) for soil stabilization applications. Sci. Rep. 2022, 12, 6032. [Google Scholar] [CrossRef]
  25. Sabatini, P.J.; Armour, T.; Groneck, P.; Keeley, J.W.; Tanyu, B. Micropile Design and Construction (Reference Manual for NHI Course 132078) (No. FHWA-NHI-05-039). United States. Department of Transportation. Federal Highway Administration. Available online: https://rosap.ntl.bts.gov/view/dot/50231/dot_50231_DS1.pdf (accessed on 15 July 2025).
  26. Juran, I.; Bruce, D.A.; Dimillio, A.; Benslimane, A. Micropiles: The state of practice. Part II: Design of single micropiles and groups and networks of micropiles. Proc. Inst. Civ. Eng.-Ground Improv. 1999, 3, 89–110. [Google Scholar] [CrossRef]
  27. Sadek, M.; Shahrour, I. Influence of the head and tip connection on the seismic performance of micropiles. Soil Dyn. Earthq. Eng. 2006, 26, 461–468. [Google Scholar] [CrossRef]
  28. Babu, G.L.S.; Murthy, B.S.; Murthy, D.S.N.; Nataraj, M.S. Bearing capacity improvement using micropiles: A case study. In GeoSupport 2004: Drilled Shafts, Micropiling, Deep Mixing, Remedial Methods, and Specialty Foundation Systems; American Society of Civil Engineers: Orlando, FL, USA, 2004; pp. 692–699. [Google Scholar] [CrossRef]
  29. Han, J.; Ye, S.-L. A field study on the behavior of a foundation underpinned by micropiles. Can. Geotech. J. 2006, 43, 30–42. [Google Scholar] [CrossRef]
  30. Salari, M.; Lezgy-Nazargah, M.; Shafaie, V.; Rad, M.M. Numerical study of the ultimate bearing capacity of two adjacent rough strip footings on granular soil: Effects of rotational and horizontal constraints of footings. Buildings 2024, 14, 1653. [Google Scholar] [CrossRef]
  31. Thyman, M.; Johansson, B. Strengthening of Buildings for Storey Extension. Master’s Thesis, Chalmers University of Technology, Gothenburg, Sweden, 2013. [Google Scholar]
  32. Motlagh, P.A.; Pak, A. Comparison of Seismic Retrofitting Methods for Existing Foundations in Seismological Active Regions. Int. J. Struct. Constr. Eng. 2014, 8, 536–541. [Google Scholar]
  33. Bruce, D.A.; Cadden, A.W.; Sabatini, P.J. Practical advice for foundation design–micropiles for structural support. In Contemporary Issues in Foundation Engineering; American Society of Civil Engineers: Austin, TX, USA, 2005; pp. 1–25. [Google Scholar] [CrossRef]
  34. Zimmer, M. Molecular mechanics evaluation of the proposed mechanisms for the degradation of urea by urease. J. Biomol. Struct. Dyn. 2000, 17, 787–797. [Google Scholar] [CrossRef]
  35. Krajewska, B. Urease-aided calcium carbonate mineralization for engineering applications: A review. J. Adv. Res. 2018, 13, 59–67. [Google Scholar] [CrossRef]
  36. Almajed, A.; Abbas, H.; Arab, M.; Alsabhan, A.; Hamid, W.; Al-Salloum, Y. Enzyme-Induced Carbonate Precipitation (EICP)-Based methods for ecofriendly stabilization of different types of natural sands. J. Clean. Prod. 2020, 274, 122627. [Google Scholar] [CrossRef]
  37. Almajed, A.; Khodadadi Tirkolaei, H.; Kavazanjian, E., Jr. Baseline investigation on enzyme-induced calcium carbonate precipitation. J. Geotech. Geoenviron. Eng. 2018, 144, 04018081. [Google Scholar] [CrossRef]
  38. Abbas, H.; Almajed, A.; Kotwal, E.; Al-Salloum, Y. Bearing capacity enhancement of footings using confining inclined micropiles: Experimental and analytical investigation. Case Stud. Constr. Mater. 2025, 22, e04184. [Google Scholar] [CrossRef]
  39. Sun, X.; Miao, L.; Wu, L. Applicability and theoretical calculation of enzymatic calcium carbonate precipitation for sand improvement. Geomicrobiol. J. 2020, 37, 389–399. [Google Scholar] [CrossRef]
  40. Lee, S.; Kim, J. An experimental study on enzymatic-induced carbonate precipitation using yellow soybeans for soil stabilization. KSCE J. Civ. Eng. 2020, 24, 2026–2037. [Google Scholar] [CrossRef]
  41. Vesić, A.S. Analysis of ultimate loads of shallow foundations. J. Soil Mech. Found. Div. 1973, 99, 45–73. [Google Scholar] [CrossRef]
  42. Tsukada, Y.; Miura, K.; Tsubokawa, Y.; Otani, Y.; You, G.-L. Mechanism of bearing capacity of spread footings reinforced with micropiles. Soils Found. 2006, 46, 367–376. [Google Scholar] [CrossRef]
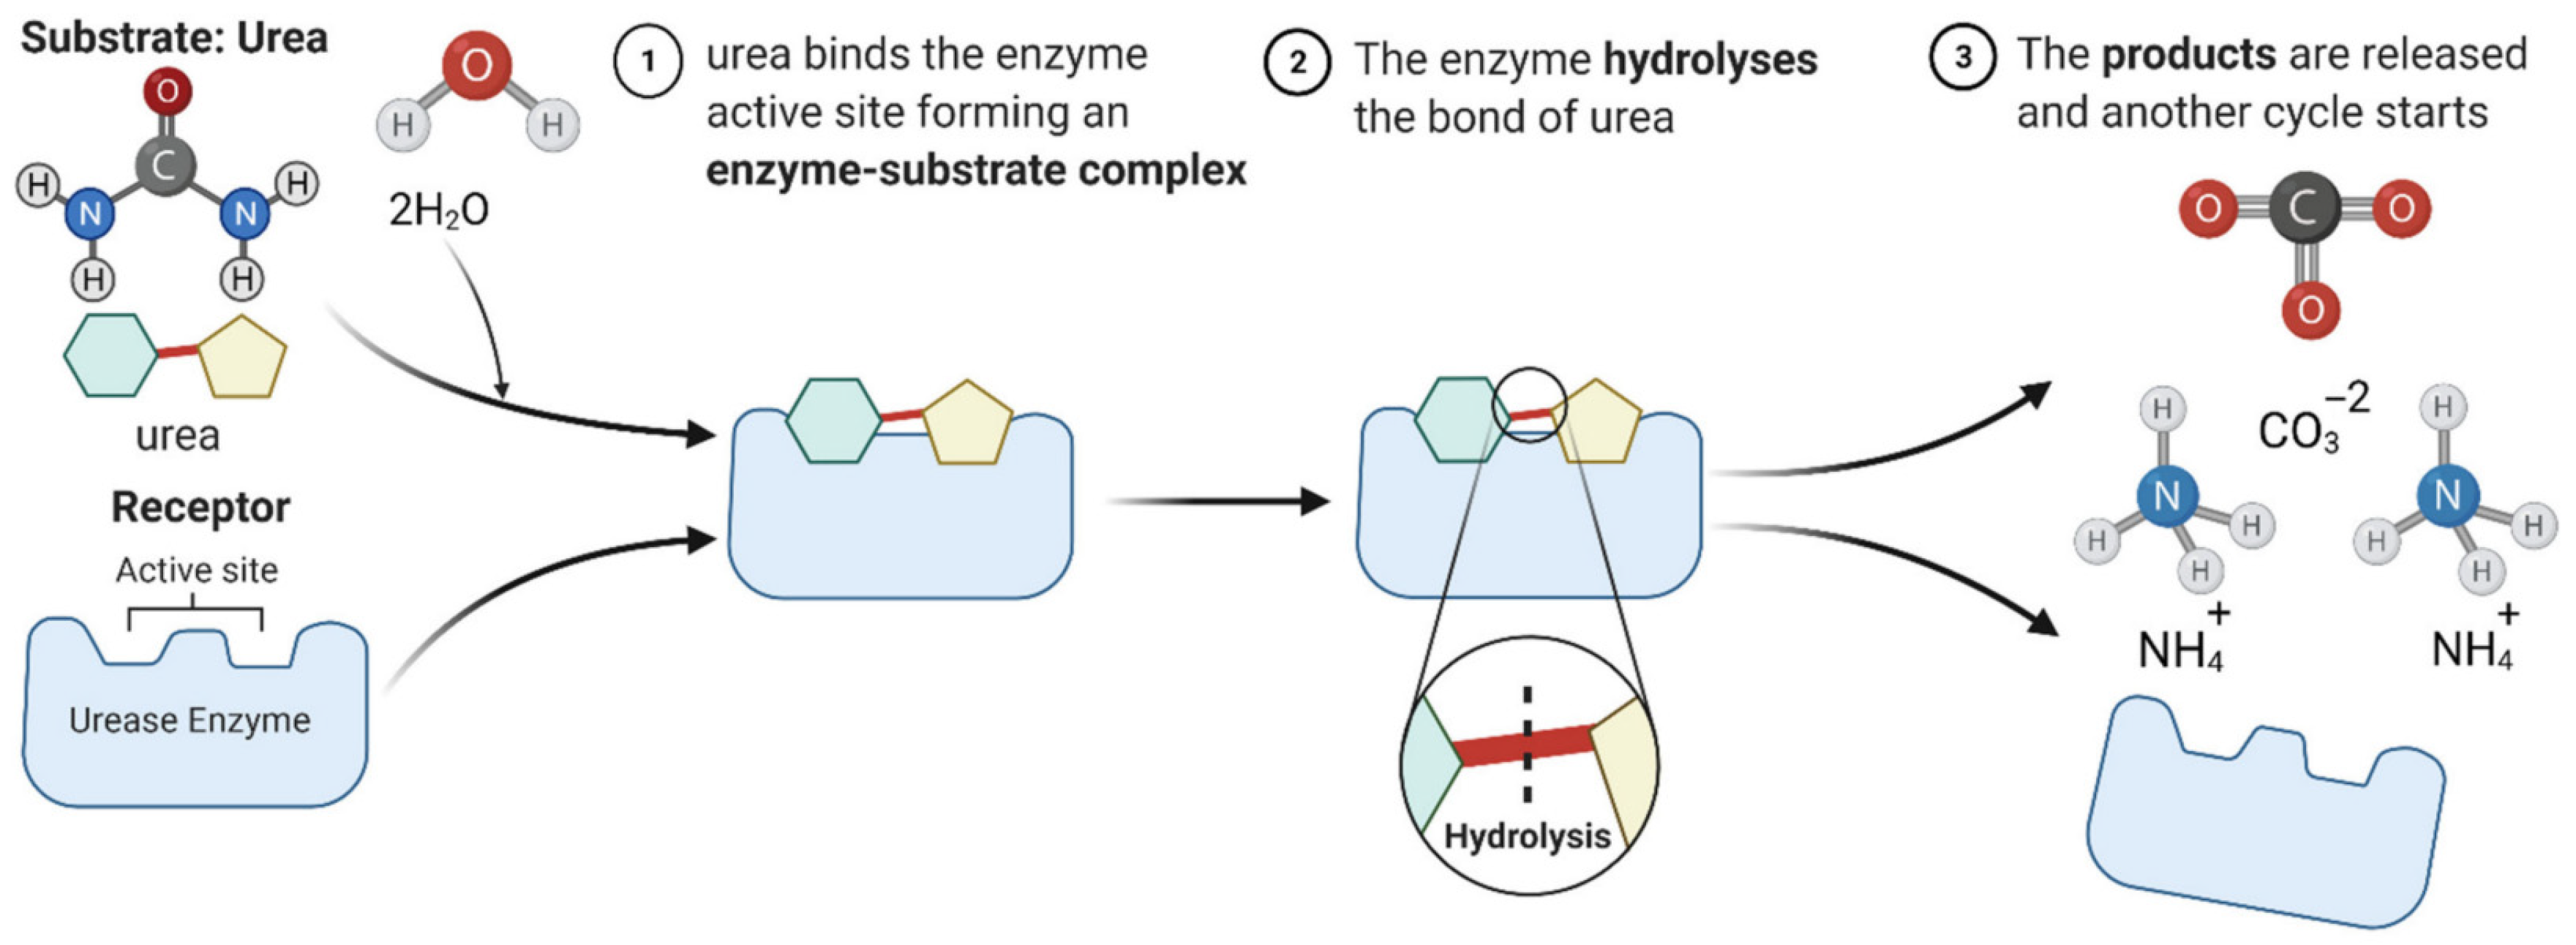
Figure 1. Diagram illustrating the process of urea hydrolysis utilizing the urease enzyme [1].
Buildings 15 02915 g001
Figure 2. Summary of EICP for bio-inspired calcite precipitation [1].
Buildings 15 02915 g002
Figure 3. SEM images of Alrasheed sand, illustrating grain shape, size, and surface texture at different magnification levels of: (a) 10,000×; (b) 200×; (c,d) 100×; and (e,f) 50× [36].
Buildings 15 02915 g003
Figure 4. Schematic diagrams of a square footing supported on sand and confined by micropiles: (a) Plan; (bd) Sections along A-A for micropiles provided at different slopes (Unit: mm).
Buildings 15 02915 g004
Figure 5. Schematic diagram of perforated micropiles (Unit: mm) and surface texture.
Buildings 15 02915 g005
Figure 6. Schematic diagrams of the test setup showing: (a) Plan; (b,c) Sections A-A and B-B, respectively.
Buildings 15 02915 g006
Figure 7. (a) Installation of micropiles at defined slope; and (b) EICP treatment (Method M1) by pouring EICP solution into the piles.
Buildings 15 02915 g007
Figure 8. EICP solution injecting plan for: (a) method M1 (Tests T5 to T7); (b) method M2 with micropiles (Tests T8 to T10); and (c) method M2 without micropiles (Test T11) (Unit: mm).
Buildings 15 02915 g008aBuildings 15 02915 g008b
Figure 9. EICP treatment (Method M2) by injecting solution through 50 mL syringes: (a) photograph and (b) schematic sketch showing EICP injection details with dimensions (Unit: mm).
Buildings 15 02915 g009
Figure 10. Effect of different methods of EICP injection on footing pressure–settlement curves for micropiles at: (a) 90°; (b) 105°; and (c) 120°.
Buildings 15 02915 g010aBuildings 15 02915 g010b
Figure 11. Effect of micropile inclinations on footing pressure–settlement curves for different methods of EICP injection: (a) Method M1 and (b) Method M2.
Buildings 15 02915 g011
Figure 12. Bearing capacity comparison for different schemes of micropile inclinations along with different methods of EICP injection.
Buildings 15 02915 g012
Figure 13. Bearing capacity enhancement for different micropile inclinations for EICP treatment methods: (a) M1; and (b) M2.
Buildings 15 02915 g013aBuildings 15 02915 g013b
Figure 14. Bearing capacity enhancement with the increase in the micropile inclination for different methods of EICP treatment.
Buildings 15 02915 g014
Figure 15. Bearing capacity enhancement with EICP treatment method M2 and micropiles for different inclinations.
Buildings 15 02915 g015
Figure 16. SEM images of Alrasheed sand treated with EICP solution in test tank at magnifications of: (a) 50×; (b) 150×; (c) 200×; and (d) 600× (Note: encircled areas show calcification at contact points of sand particles).
Buildings 15 02915 g016
Figure 17. In method M1 of EICP treatment: (a) settlement of the footing after completion of load application; (b) cementation of sand around piles in the test tank; (c) cementation around a micropile; and (d) a view of the treated sand removed from around a micropile.
Buildings 15 02915 g017
Figure 18. In method M2 of EICP treatment with micropiles: (a) Settlement of the footing after completion of load application and (b) Cementation of sand beneath the footing.
Buildings 15 02915 g018
Figure 19. Cementation of sand beneath the footing in test T11, i.e., method M2 without micropiles.
Buildings 15 02915 g019
Figure 20. A rectangular footing confined by equally spaced sloping micropiles.
Buildings 15 02915 g020
Figure 21. Prediction of cohesion for EICP injection through MPs (Method M1).
Buildings 15 02915 g021
Table 1. Test matrix.
Test IDProcedure of Enhancing Bearing CapacityAngle of Micropiles with Horizontal, θ in Deg (Radians)EICP Injection Method 1Curing Time (Days)
T1Unreinforced (Control)0° (0)--
T2Micropiles90° (π/2)--
T3Micropiles105° (7π/12)--
T4Micropiles120° (2π/3)--
T5Micropiles + EICP90° (π/2)M121
T6Micropiles + EICP105° (7π/12)M121
T7Micropiles + EICP120° (2π/3)M121
T8Micropiles + EICP90° (π/2)M221
T9Micropiles + EICP105° (7π/12)M221
T10Micropiles + EICP120° (2π/3)M221
T11EICP-M221
1 M1 and M2: EICP solution application methods.
Table 2. Prediction of bearing capacity of square footing tested in this study.
Test ID (EICP Treatment Method)Angle of MPs with Horizontal, θ in Deg (Radians)RD Modification Factor, k Modified RD of Sand, k D r Estimated Shear Strength ParametersBearing Capacity (kN/m2)Error in Prediction
c (kN/m2) (deg) Exp.Pred.
Equation (9) Equation (11)Equation (10) Equation (8)
T1 (-)-1.000.51 *0.0035.3535.836.4+1.5%
T5 (M1)90° (π/2)1.170.600.0036.0947.347.1−0.4%
T6 (M1)105° (7π/12)1.280.650.0036.5254.955.3+0.7%
T7 (M1)120° (2π/3)1.410.720.0037.1065.665.5−0.2%
T11 (M2)-1.000.510.3135.3560.861.9+1.8%
T8 (M2)90° (π/2)1.170.600.3136.0959.661.9 **+3.9%
T9 (M2)105° (7π/12)1.280.650.3136.5272.772.9+0.3%
T10 (M2)120° (2π/3)1.410.720.3137.1080.779.2−1.8%
* Experimental value of average RD of all tests; ** Predicted by ignoring MPs.
Disclaimer/Publisher’s Note: The statements, opinions and data contained in all publications are solely those of the individual author(s) and contributor(s) and not of MDPI and/or the editor(s). MDPI and/or the editor(s) disclaim responsibility for any injury to people or property resulting from any ideas, methods, instructions or products referred to in the content.