Article

Finite Element Analysis of Vertical Bearing Performance in RC Slab–Column Joints: Effects of Bottom Reinforcement and Concealed Beams

1
School of Civil Engineering and Architecture, Nanchang University, Nanchang 330031, China
2
Design and Research Institute, Nanchang University, Nanchang 330047, China
*
Authors to whom correspondence should be addressed.
Buildings 2025, 15(16), 2905; https://doi.org/10.3390/buildings15162905
Submission received: 22 July 2025 / Revised: 9 August 2025 / Accepted: 14 August 2025 / Published: 16 August 2025
(This article belongs to the Special Issue Seismic and Durability Performance of Steel Connections)

Abstract

The vertical load-bearing performance of slab–column joints is significantly affected by bottom reinforcement and concealed beams, but existing studies remain insufficient in analyzing their influence mechanisms. To address this, the effects of bottom reinforcement, concealed beam width, and punch-to-span ratio on the mechanical properties of joints are systematically investigated in this study through finite element analysis. Validating 2 experimental models and establishing 13 parametric models, the results shows that adding bottom reinforcement can enhance the late-stage bearing capacity and ductility of joints; increasing the ratio of top-to-bottom reinforcement improves bearing capacity but reduces ductility; a wider concealed beam leads to better bearing capacity and ductility performance of the joint; and under the same concealed beam width, a larger punching–span ratio reduces bearing capacity but improves ductility. This study reveals the critical role of bottom reinforcement and concealed beams in joint performance, providing a theoretical basis for optimizing design.

1. Introduction

Reinforced concrete flat slabs are a structural load-bearing system composed of columns and slabs; they are widely used due to their advantages, such as their ability to transmit force directly, simplify construction, and reduce building height. However, the slab–column joint is prone to failure under the combined action of shear force and bending moment, leading to progressive collapse accidents. Therefore, the study of the mechanical behavior and load-bearing performance of slab–column joints has become key to solving this problem.
The study of slab–column joints can be traced back to the early 20th century. Talbot [1] conducted systematic experimental investigations involving over 200 slab–column joint specimens, through which he pioneered the formulation of the punching shear capacity calculation formula, laying a crucial foundation for subsequent research in this field. Recent research findings indicate that the failure modes of slab–column joints can be primarily categorized into three fundamental types: punching shear failure, combined flexural–shear failure, and flexural failure [2]. Extensive experimental and theoretical analyses have demonstrated that the key parameters affecting the load-bearing capacity of joints include the punch–span ratio, the longitudinal reinforcement ratio, concrete strength grade, punching shear reinforcement measures (such as shear studs or steel sections), slab thickness, and cross-sectional column dimensions [3,4]. Based on existing research, scholars worldwide have developed various theoretical models for calculating the bearing capacity of slab–column joints [5]. However, current studies still present several limitations: First, systematic investigations remain scarce regarding the influence of bottom reinforcement configuration and concealed beam arrangement on joint performance. Second, the failure mechanisms and computational methods for bearing capacity require further refinement. Moreover, a comprehensive analysis of the collaborative working mechanism between top and bottom slab reinforcement is still lacking [6]. While some studies indicate that adding concealed beams can significantly enhance both the load-bearing capacity and ductility of joints [7], there remains a paucity of in-depth quantitative analyses on the influence mechanisms of concealed beam parameters (such as the coupling effects between beam width and shear span ratio) [8]. Current research methodologies for slab–column joints primarily focus on experimental testing and finite element simulation analysis. Experimental studies have demonstrated that the incorporation of stirrups can effectively enhance the punching shear capacity of slab–column joints [9]. This conclusion has been further validated through comparative tests conducted on joint specimens with four distinct stirrup configurations [10]. Building upon these findings, it can be reasonably hypothesized that the implementation of concealed beams with stirrups may similarly improve both the load-bearing capacity and stiffness characteristics of slab–column joint systems. With the rapid development of computer technology, the finite element analysis method has become an important approach for investigating the mechanical behavior of slab–column joints. Currently, general-purpose finite element software programs such as ABAQUS and ANSYS are widely used in this field, and the reliability of their analytical results has been verified by numerous scholars [11,12,13]. In this study, a refined finite element analysis model is established based on the three-dimensional solid degenerated virtual laminated element theory, with particular focus on examining the influence of bottom reinforcement arrangement and concealed beam configuration on the mechanical performance of slab–column joints. It should be specifically noted that this modeling approach, by incorporating virtual laminated element technology, can more accurately simulate the collaborative working behavior between concrete and the reinforcement. The validity of this method has been thoroughly verified in previous research [14,15,16].
The current body of research on the parametric analysis of slab–column joint members has significant limitations: Firstly, the selection of parameters only focuses on the top reinforcement rate and the punch–span ratio. In the field of reinforcement research, focus is only given to the impact of changes in the top reinforcement rate of the slab on the performance of the member, with no examination of the role of the bottom bar, meaning that the underlying mechanisms cannot be explored. There is also no systematic comparison of the two conditions, i.e., the increase in bottom reinforcement and the absence of bottom reinforcement. Secondly, research on the influence of concealed beams on joint performance remains inadequate. Existing studies generally indicate that concealed beams can enhance the load-bearing capacity of members, yet they lack in-depth quantitative analysis regarding the specific extent of such enhancement and the degree to which variations in the width of concealed beams exert an impact.
To address the research gaps mentioned above, a detailed investigation is conducted in this study. First, the reliability of the VFEAP finite element simulation method is verified using two slab–column joint tests. Then, using the punch–span ratio, bottom reinforcement, and concealed beams as key parameters, 13 finite element models of slab–column joints without web reinforcement are designed to compare the effects of adding bottom reinforcement and varying the proportion of reinforcement on the joint at the top and bottom of the slab. Finally, by varying the width of the concealed beam and the punch–span ratio, we systematically evaluate how these parameters influence the damage process and failure morphology of the slab–column joint members. The results demonstrate that adding bottom reinforcement and concealed beams effectively enhances the vertical load-bearing capacity of slab–column joints. Furthermore, increasing the proportion of reinforcement at the top and bottom of the slab and increasing the width of concealed beams improve the ultimate load-bearing capacity to varying degrees. These findings provide valuable insights to address the research gaps identified in this field.

2. Finite Element Simulation

2.1. Test Description

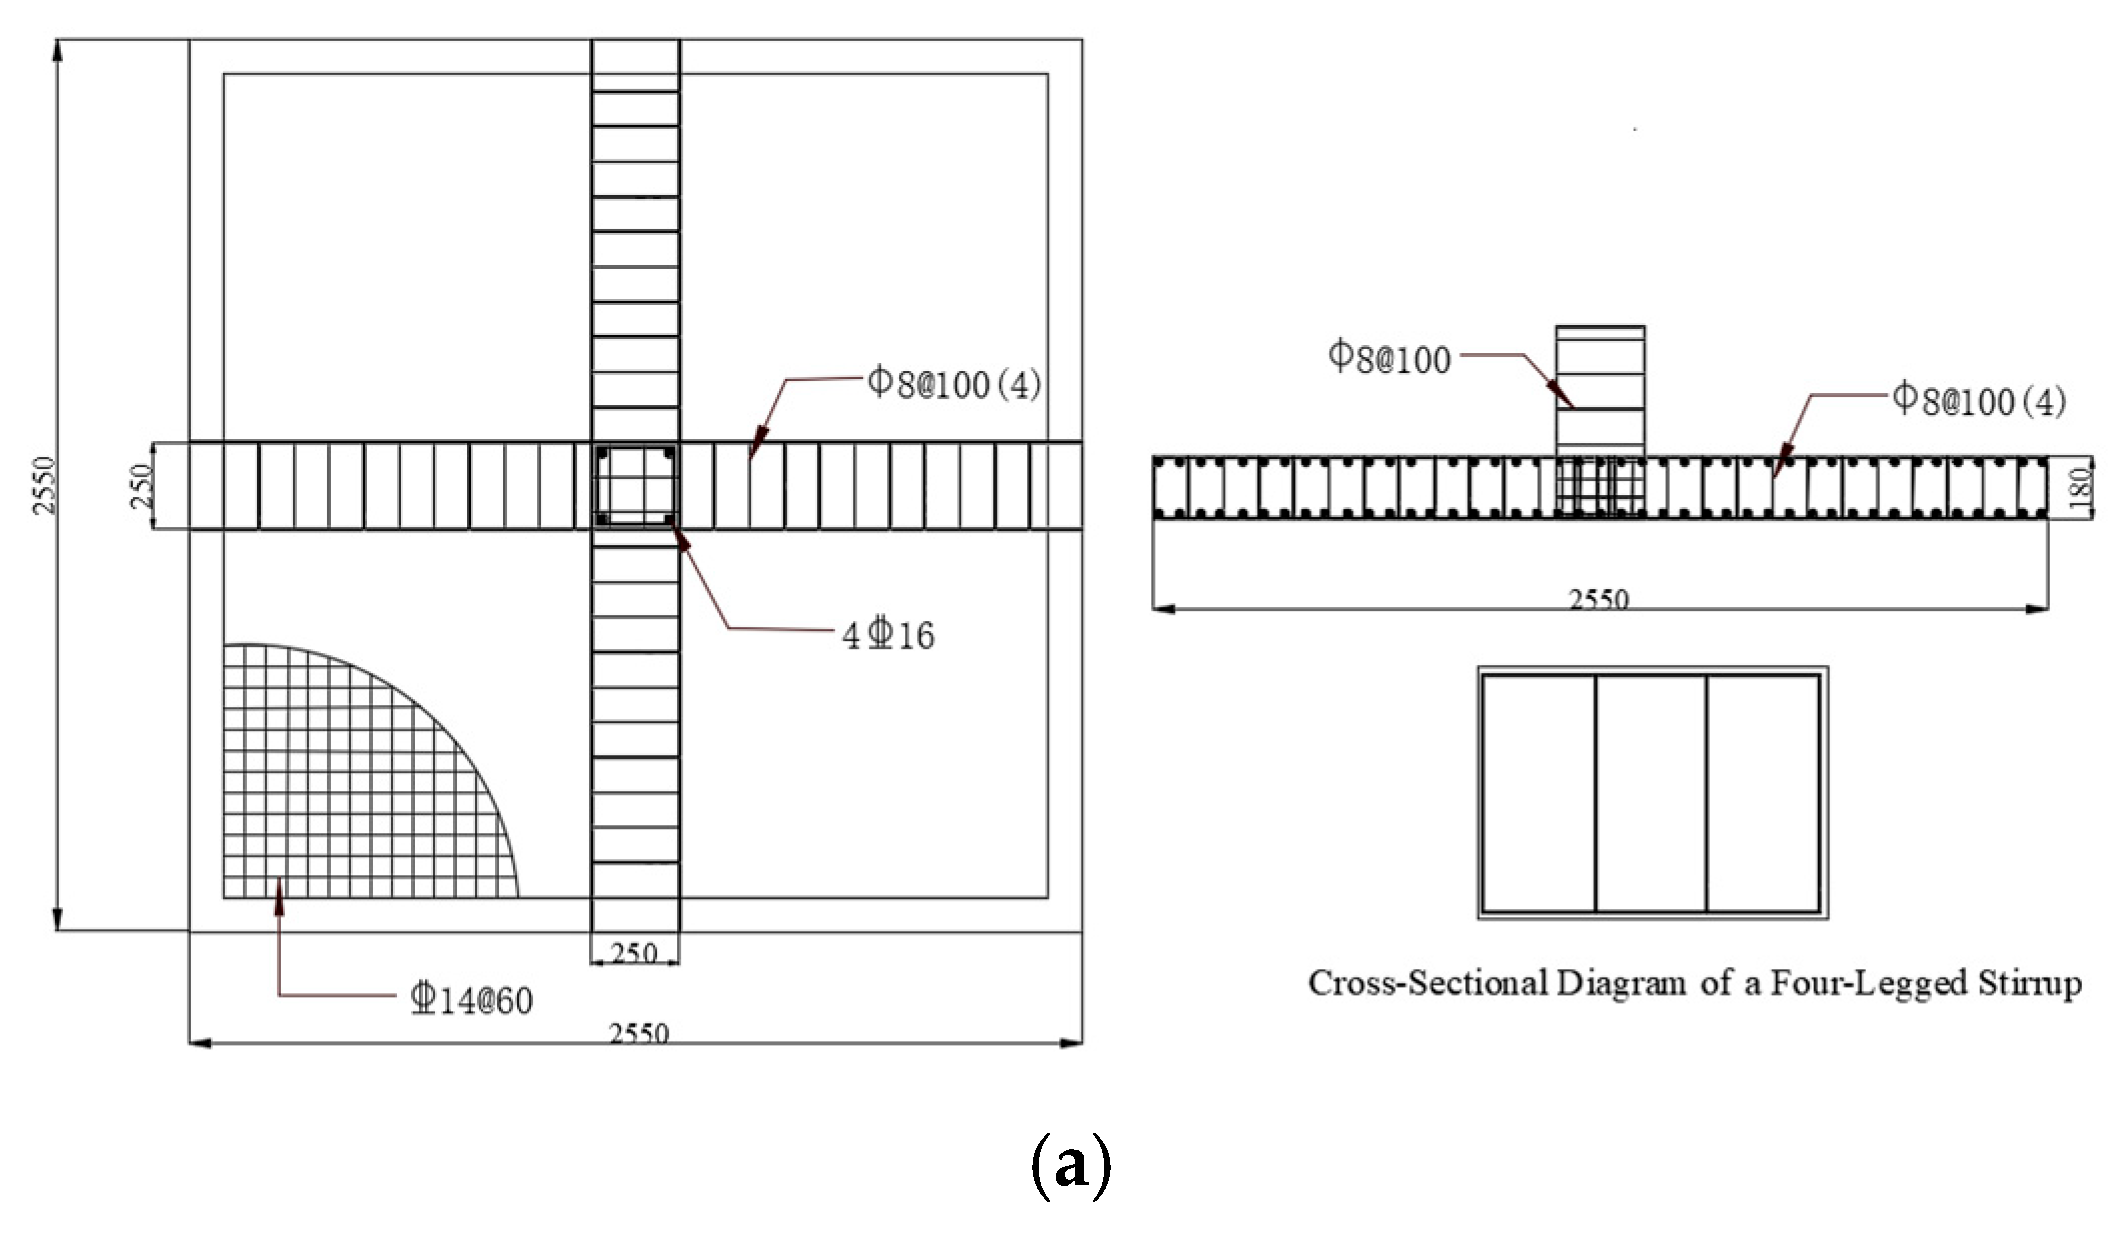
The finite element model was developed to simulate two specimens tested by the laboratory of Hunan University [17]. The experimental program consists of a full-size of slab–column connection. The slab dimensions were 2550 × 2550 × 180 mm with a square column of 250 × 250 × 300 mm, and the effective slab thickness was 150 mm. Information on the dimensions and reinforcement layout of the slab is shown in Figure 1a. The reinforcement was placed at the top of the slab, and the ratios of specimens were determined based on spacing, being 0.86% (120 mm) and 1.73% (60 mm), respectively. The boundary of the slab was selected at the position of the line of contra-flexure; the support was considered as simple support during testing; and concentric loading was adopted. The details of the support and loading are shown in Figure 1b. HRB400 steel reinforcement and C30 and C70 concrete were selected for the specimens; their mechanical properties obtained from material testing are shown in Table 1. The displacement measurement points of the specimens are shown in Figure 2.

2.2. Methodology

A nonlinear analytical approach is employed in this study, based on the three-dimensional solid degenerated virtual laminated element theory [19] and integrated with the VFEAP finite element calculation program [20], to analyze the loading process and failure mechanism of slab–column joint components. The structural system is initially discretized into independent elements, followed by modeling using a degenerated isoparametric element formulation [21]. By defining geometric parameters and material properties, this approach enables different component-representing blocks to coexist within a single element, thereby simplifying the modeling process and improving modeling efficiency. These blocks are categorized into solid and virtual blocks. Solid blocks possess actual component attributes, while virtual blocks represent non-existent regions defined through the introduction of “virtual nodes” and “virtual zones.” Their combination achieves coordinated deformation among components within the element. This finite element method can effectively simulate the structural stress conditions in practical engineering applications, and its validity has been verified in numerous studies [22,23,24,25].

2.2.1. Element Types and Division

This study employs a three-dimensional degenerate virtual laminated solid element [19] derived from a conventional 20-node hexahedral isoparametric element. The evolved virtual laminated element is obtained by defining virtual nodes and virtual domains within the original conventional element. Compared to conventional elements, the evolved elements can accommodate different types of structural components, reduce the total element count, and improve computational efficiency. The three-dimensional degenerate virtual laminated solid element is shown in Figure 3.
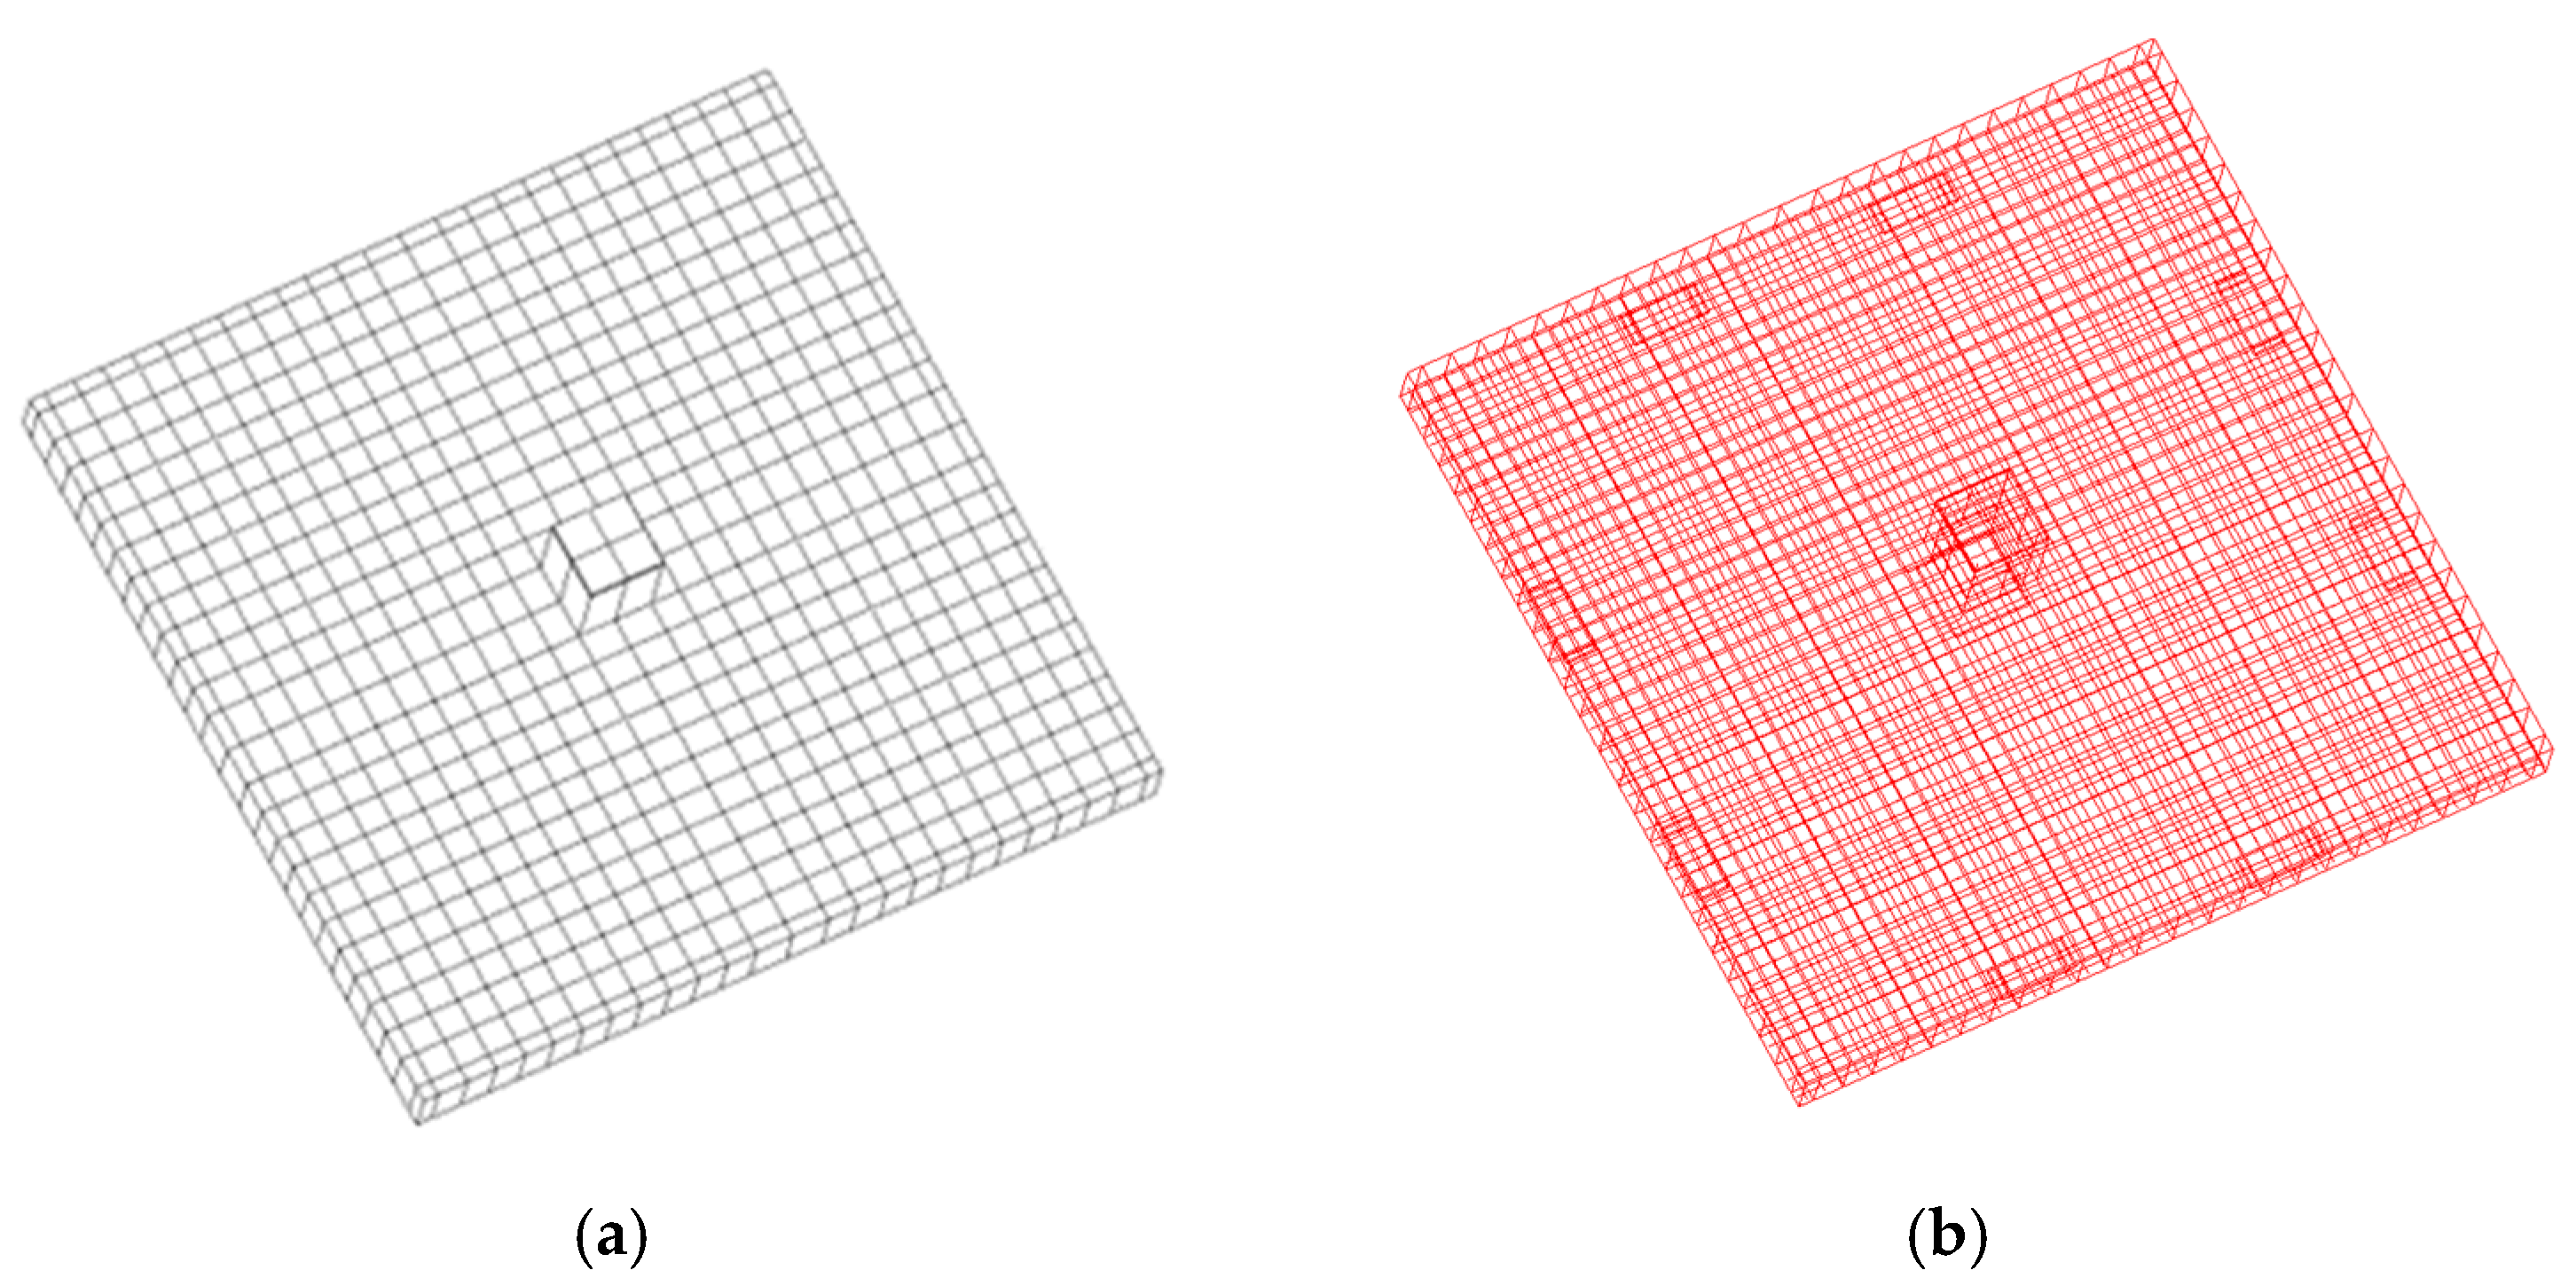
To validate the finite element analysis of the specimens using the above element modeling approach, the specimens were divided into multiple virtual laminated elements, and different components and materials were defined by parameter modifications. The reinforcement bar was inserted at three nodes, which could be completed by entering the relative position in the element. To ensure accuracy in the simulation, a predominant element size of 100 × 100 mm was adopted. The mesh division of the concrete and reinforcement mesh model is shown in Figure 4.

2.2.2. Constitutive Relationships of the Materials

Concrete
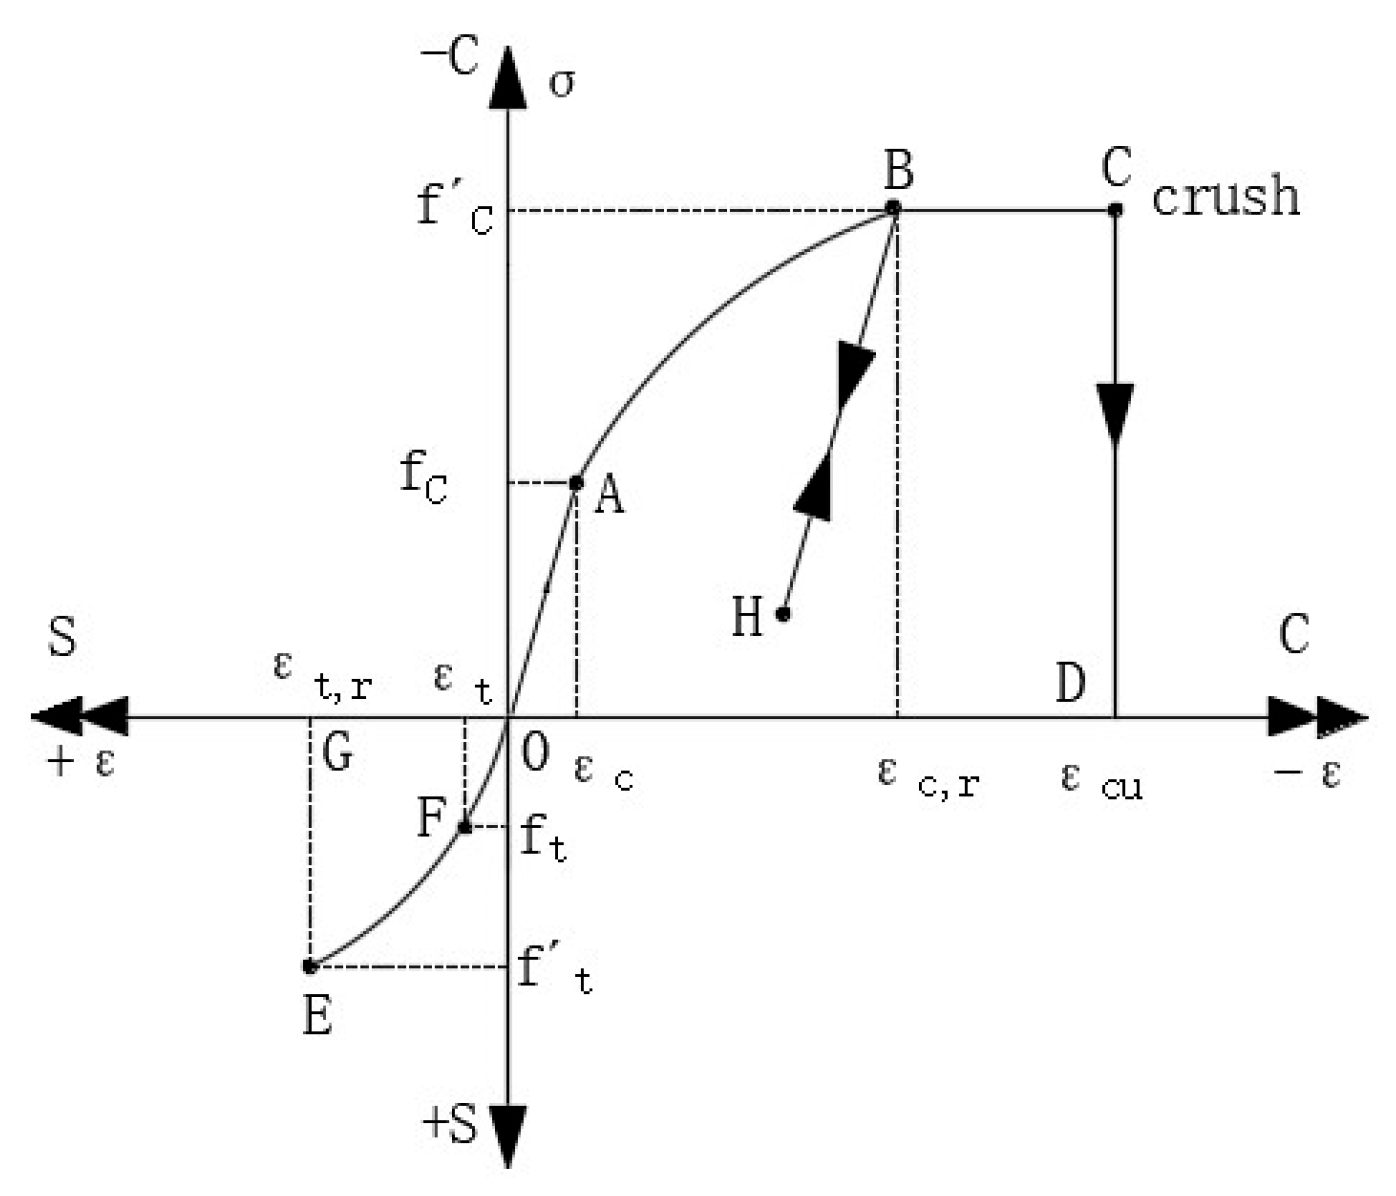
For the elastoplastic incremental constitutive model of concrete, the generalized hardening model proposed by Ohtani and Chen was employed [26]. The multiple hardening plasticity model incorporates three strengthening parameters ( σ c , σ b c , σ t ), effectively overcoming the limitations of elastoplastic constitutive models that employ a single hardening parameter. Moreover, it accurately predicts plastic volumetric changes, ensuring consistency with the mechanical behavior of concrete. The three hardening parameters are determined from the stress–strain curves obtained under uniaxial compression, equi-biaxial compression, and uniaxial tension. The idealized uniaxial stress–strain curve and the idealized equi-biaxial compression curve of concrete are shown in Figure 5 and Figure 6, respectively.
Rebar
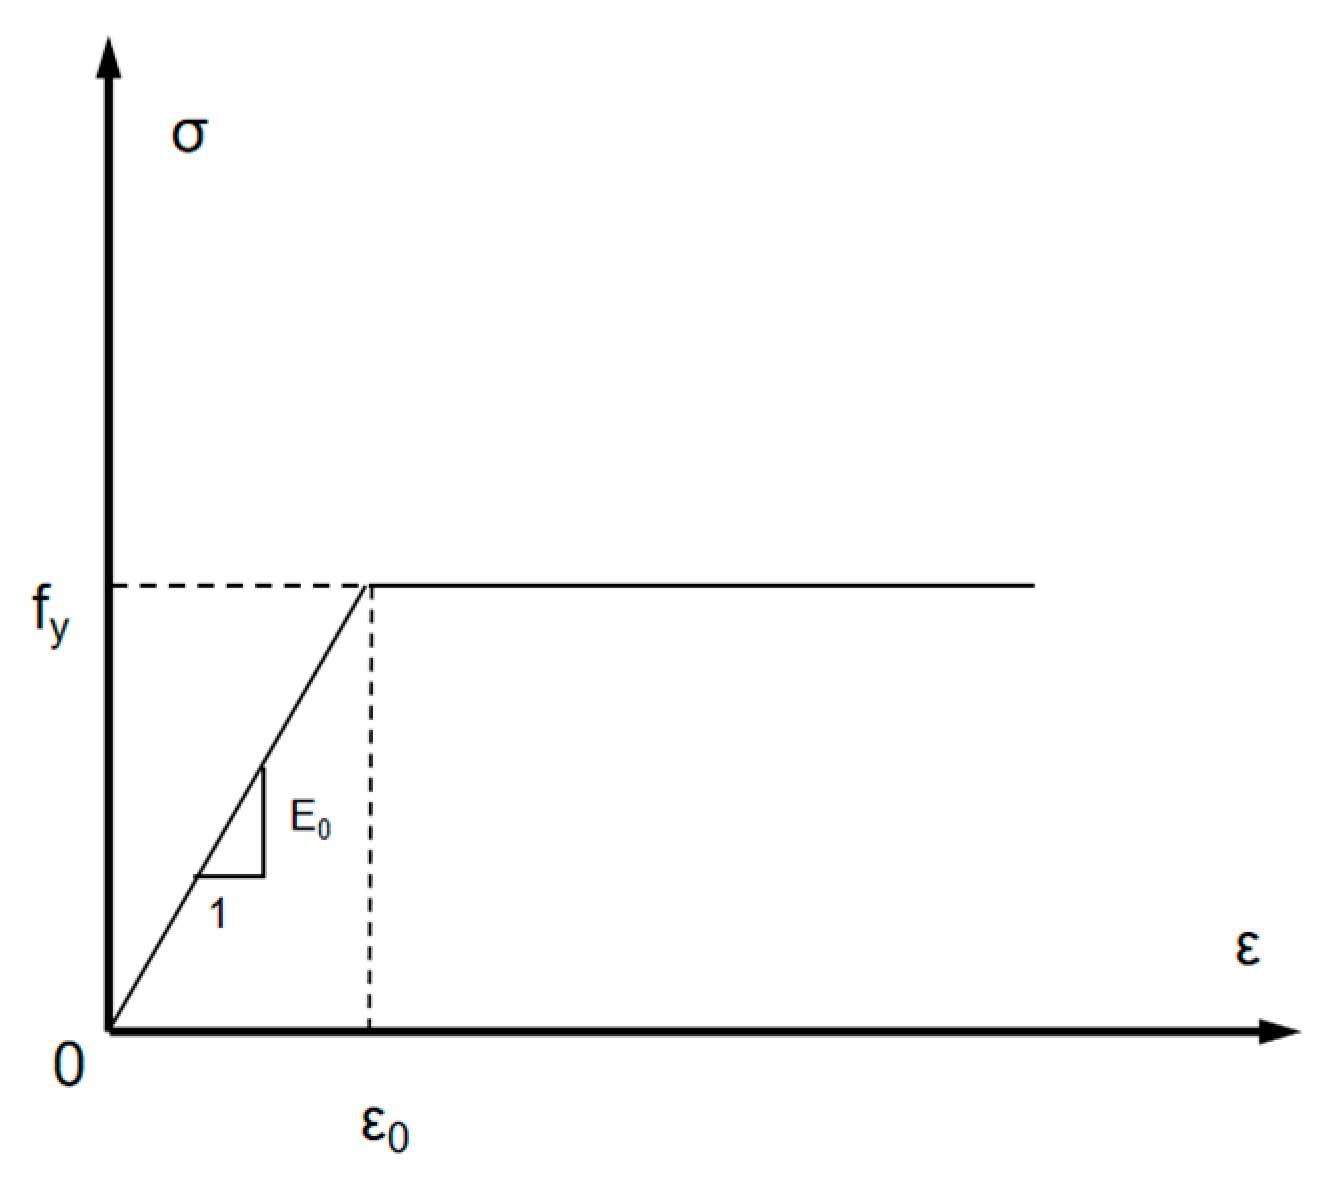
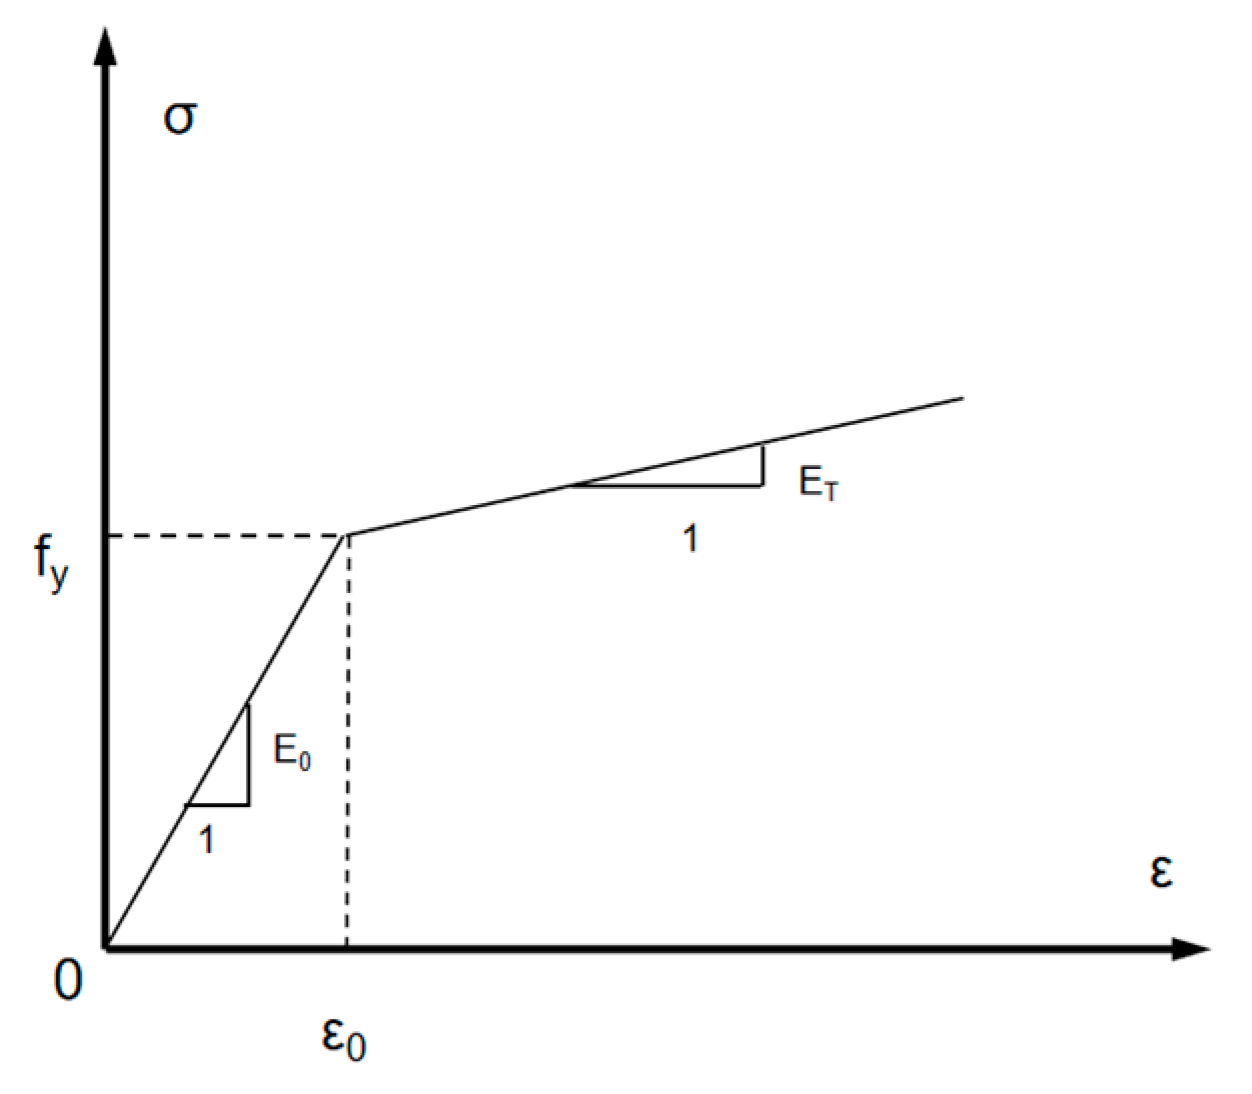
The Mises isotropic hardening model is adopted for the constitutive model of steel bars. A bilinear constitutive relationship is employed for high-strength steel bars, while an ideal elastoplastic model is adopted for the ordinary steel rebar. This is because steel bars only bear axial tensile force or compression and adopt a uniaxial constitutive relationship. Therefore, when considering material nonlinearity, calculations can be performed using the total strain theory. The constitutive models of steel bars are shown in Figure 7 and Figure 8.

2.2.3. Loading and Boundary Conditions

The FE models were loaded by applying concentrate at the column head using the step stiffness method [27]. To prevent local failure, a steel loading plate adopted in the FE model covered the entire width of the column head. The model is supported on eight steel plates, two at each side. The steel loading plate at the column head was restrained in the X and Y directions to accurately measure vertical displacement. At the support location, X-direction steel plates restrained horizontal X and vertical Z movements, while Y-direction plates restrained horizontal Y and vertical Z movements. This constraint configuration ensured inward rotation of the model during loading.

2.3. Validation of the FE Model

2.3.1. Crack Pattern

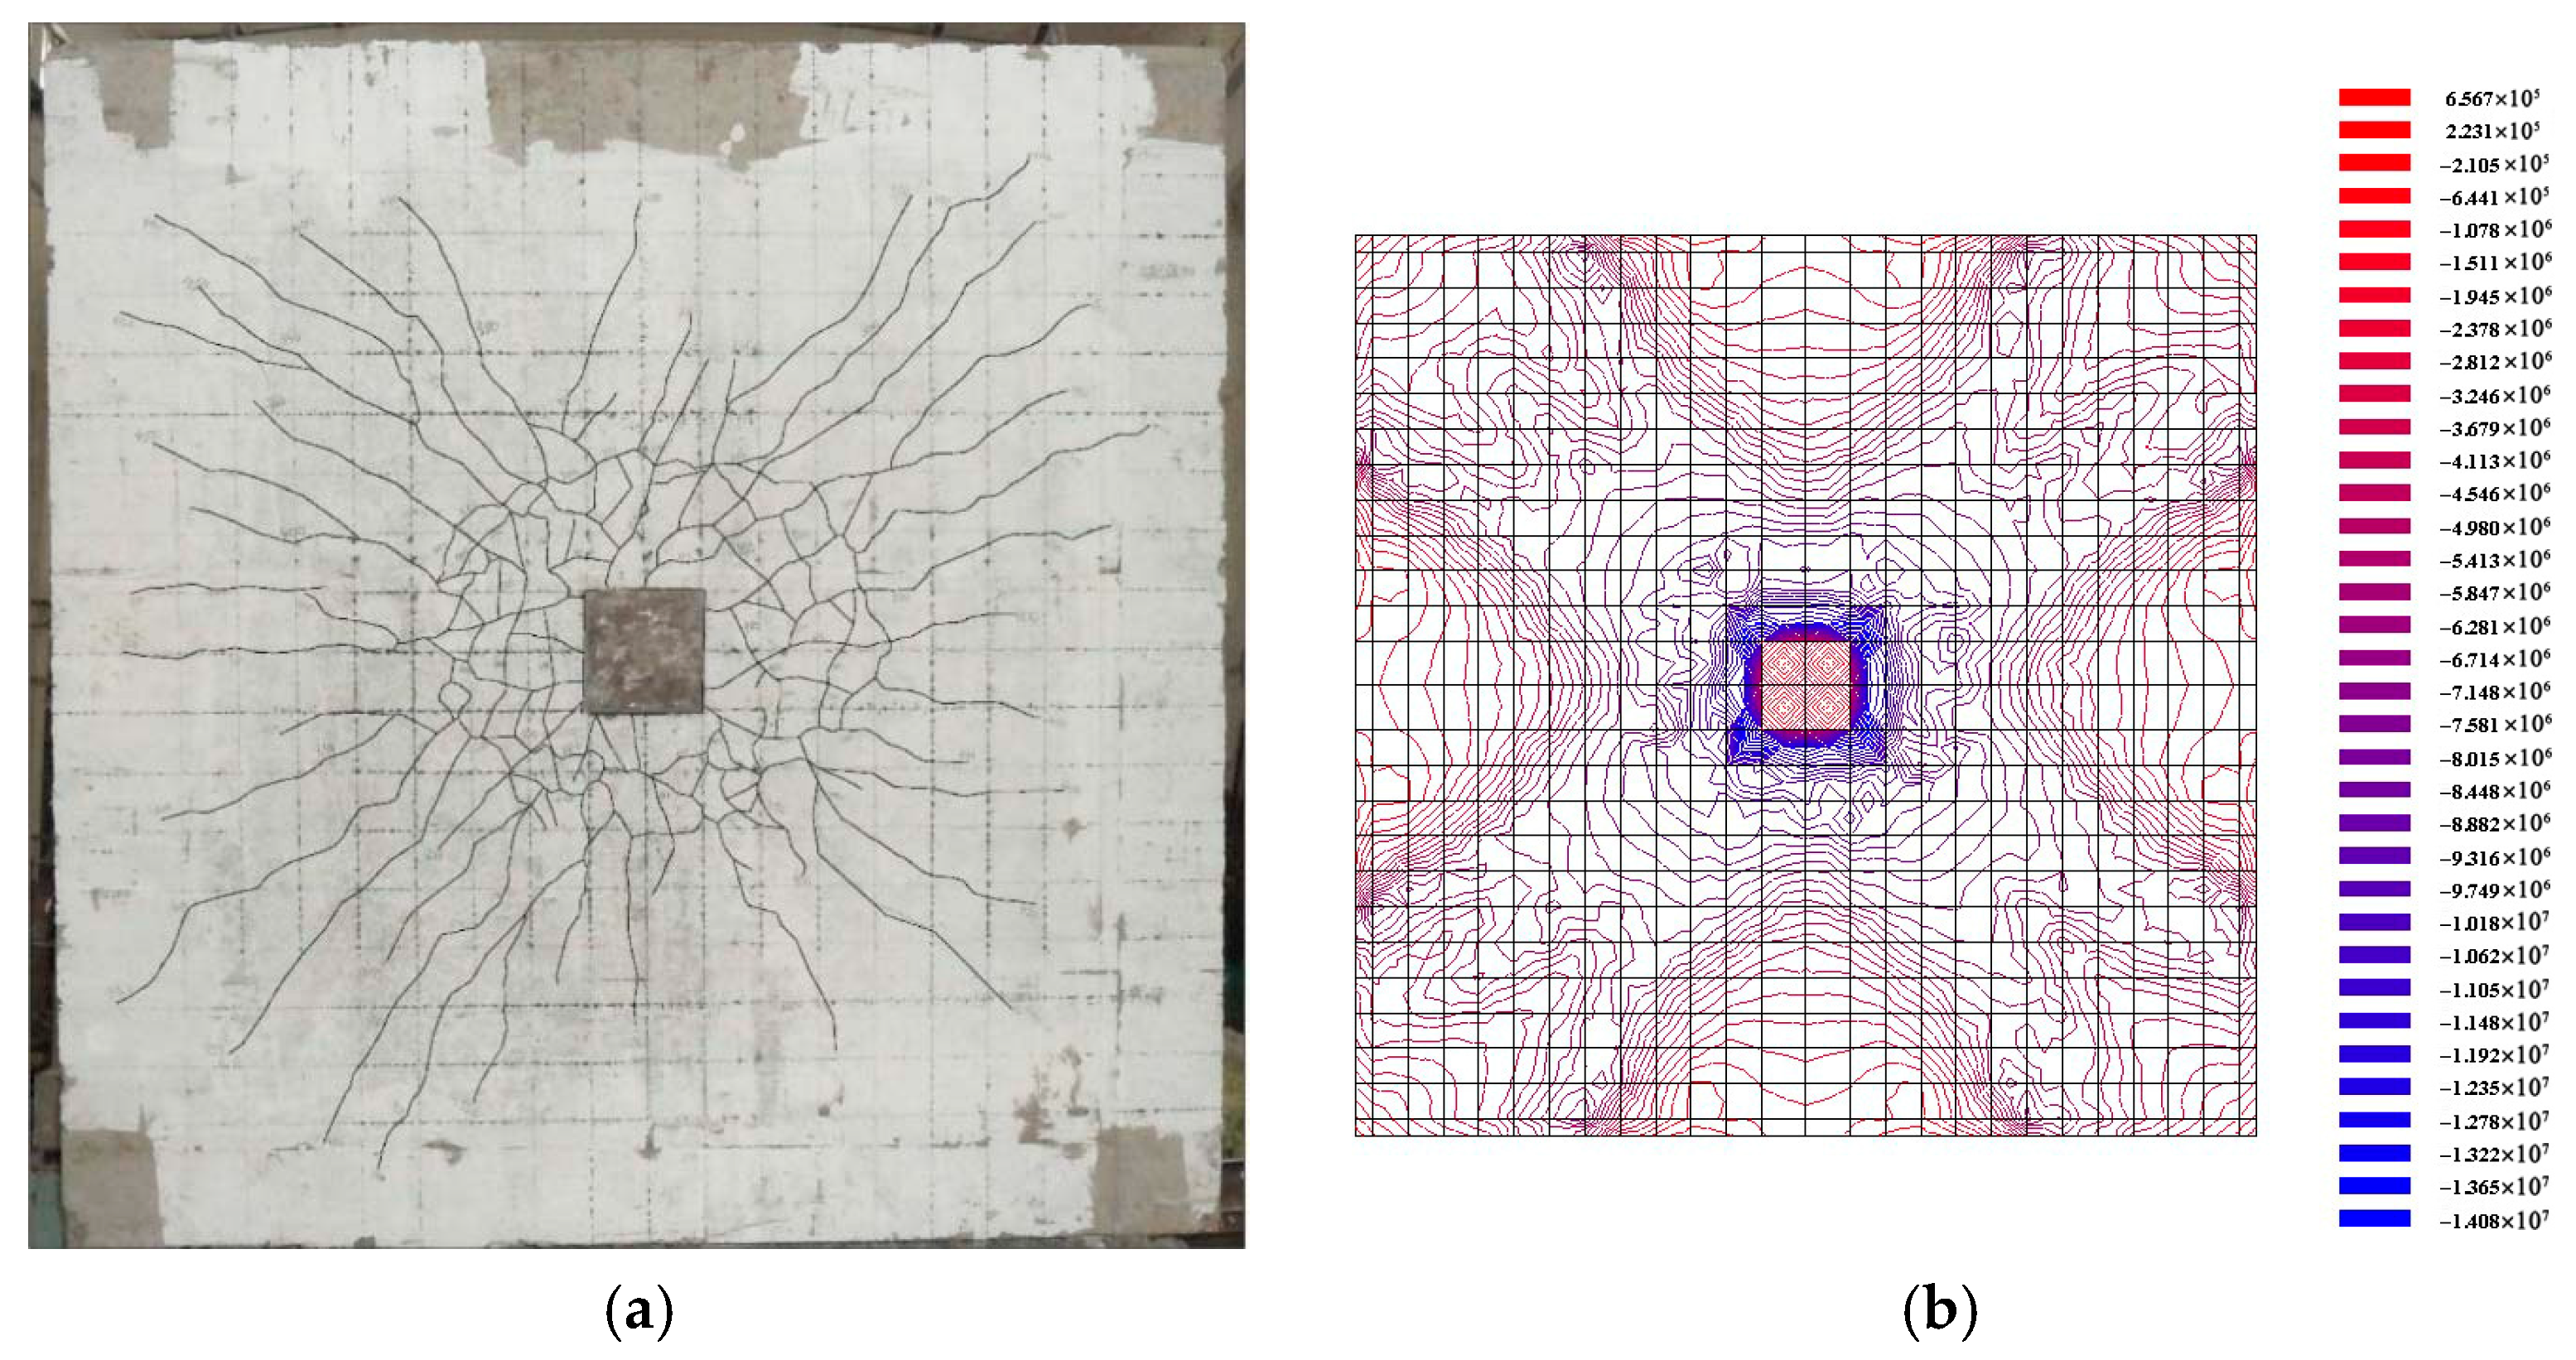
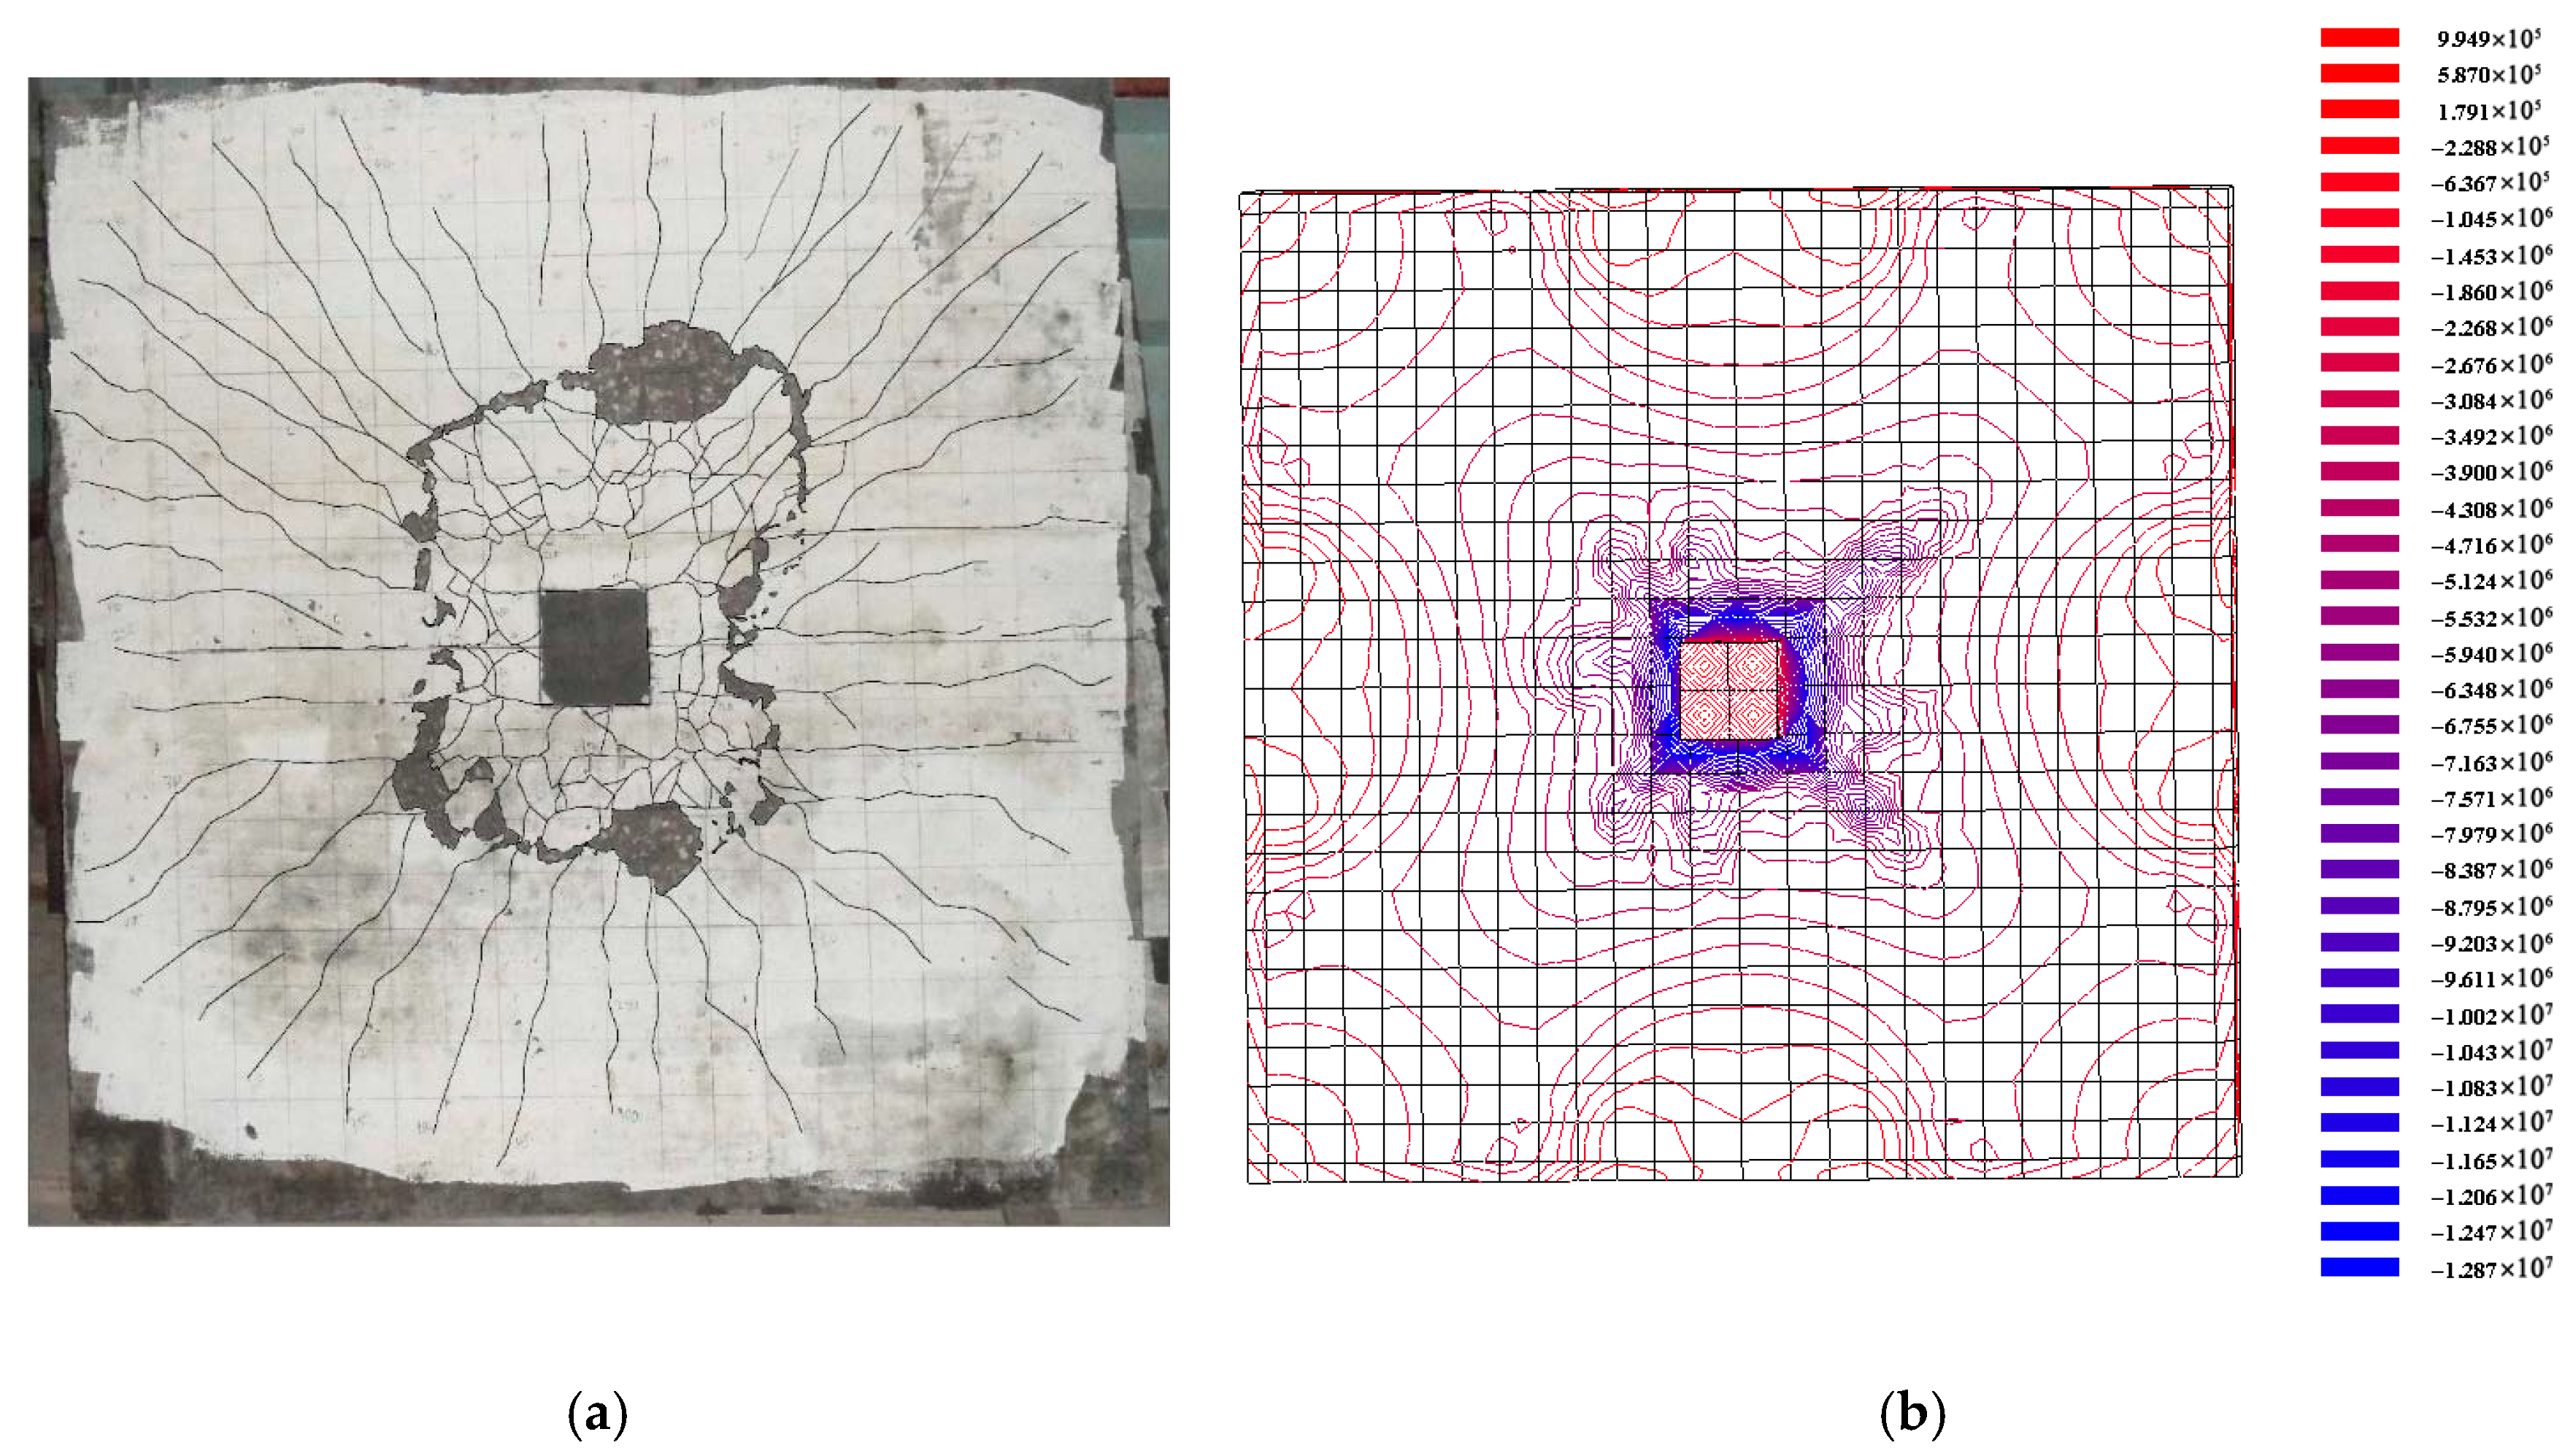
Figure 9 and Figure 10 compare the damage cracking patterns of specimens with their corresponding finite element stress contours. In Figure 9, specimen C7-30-3 exhibits radially distributed test cracks, with staggered and dense cracks near the column head. The main crack on the slab surface expands in an X shape along the direction from the column head to the corner of the slab. The corresponding stress contours show that the stress near the column head is concentrated and the gradient changes significantly, which is consistent with the multidirectional crack characteristics observed in the test; meanwhile, the X-shaped distribution of the stress concentration area on the slab surface is highly consistent with the development path of the main crack. In Figure 10, the cracks in specimen C7-70-1 extended radially along the column perimeter, and the cracks within 300 mm of the column head a dense and accompanied by concrete crushing and spalling. Finite element analysis shows that there is a significant stress concentration and gradient mutation in this area, which corresponds exactly to the location of crushing damage in the concrete. Additionally, the stress contour of the slab surface is uniformly dispersed, which is in good agreement with the radial crack pattern observed in the test.

2.3.2. Load–Displacement Response

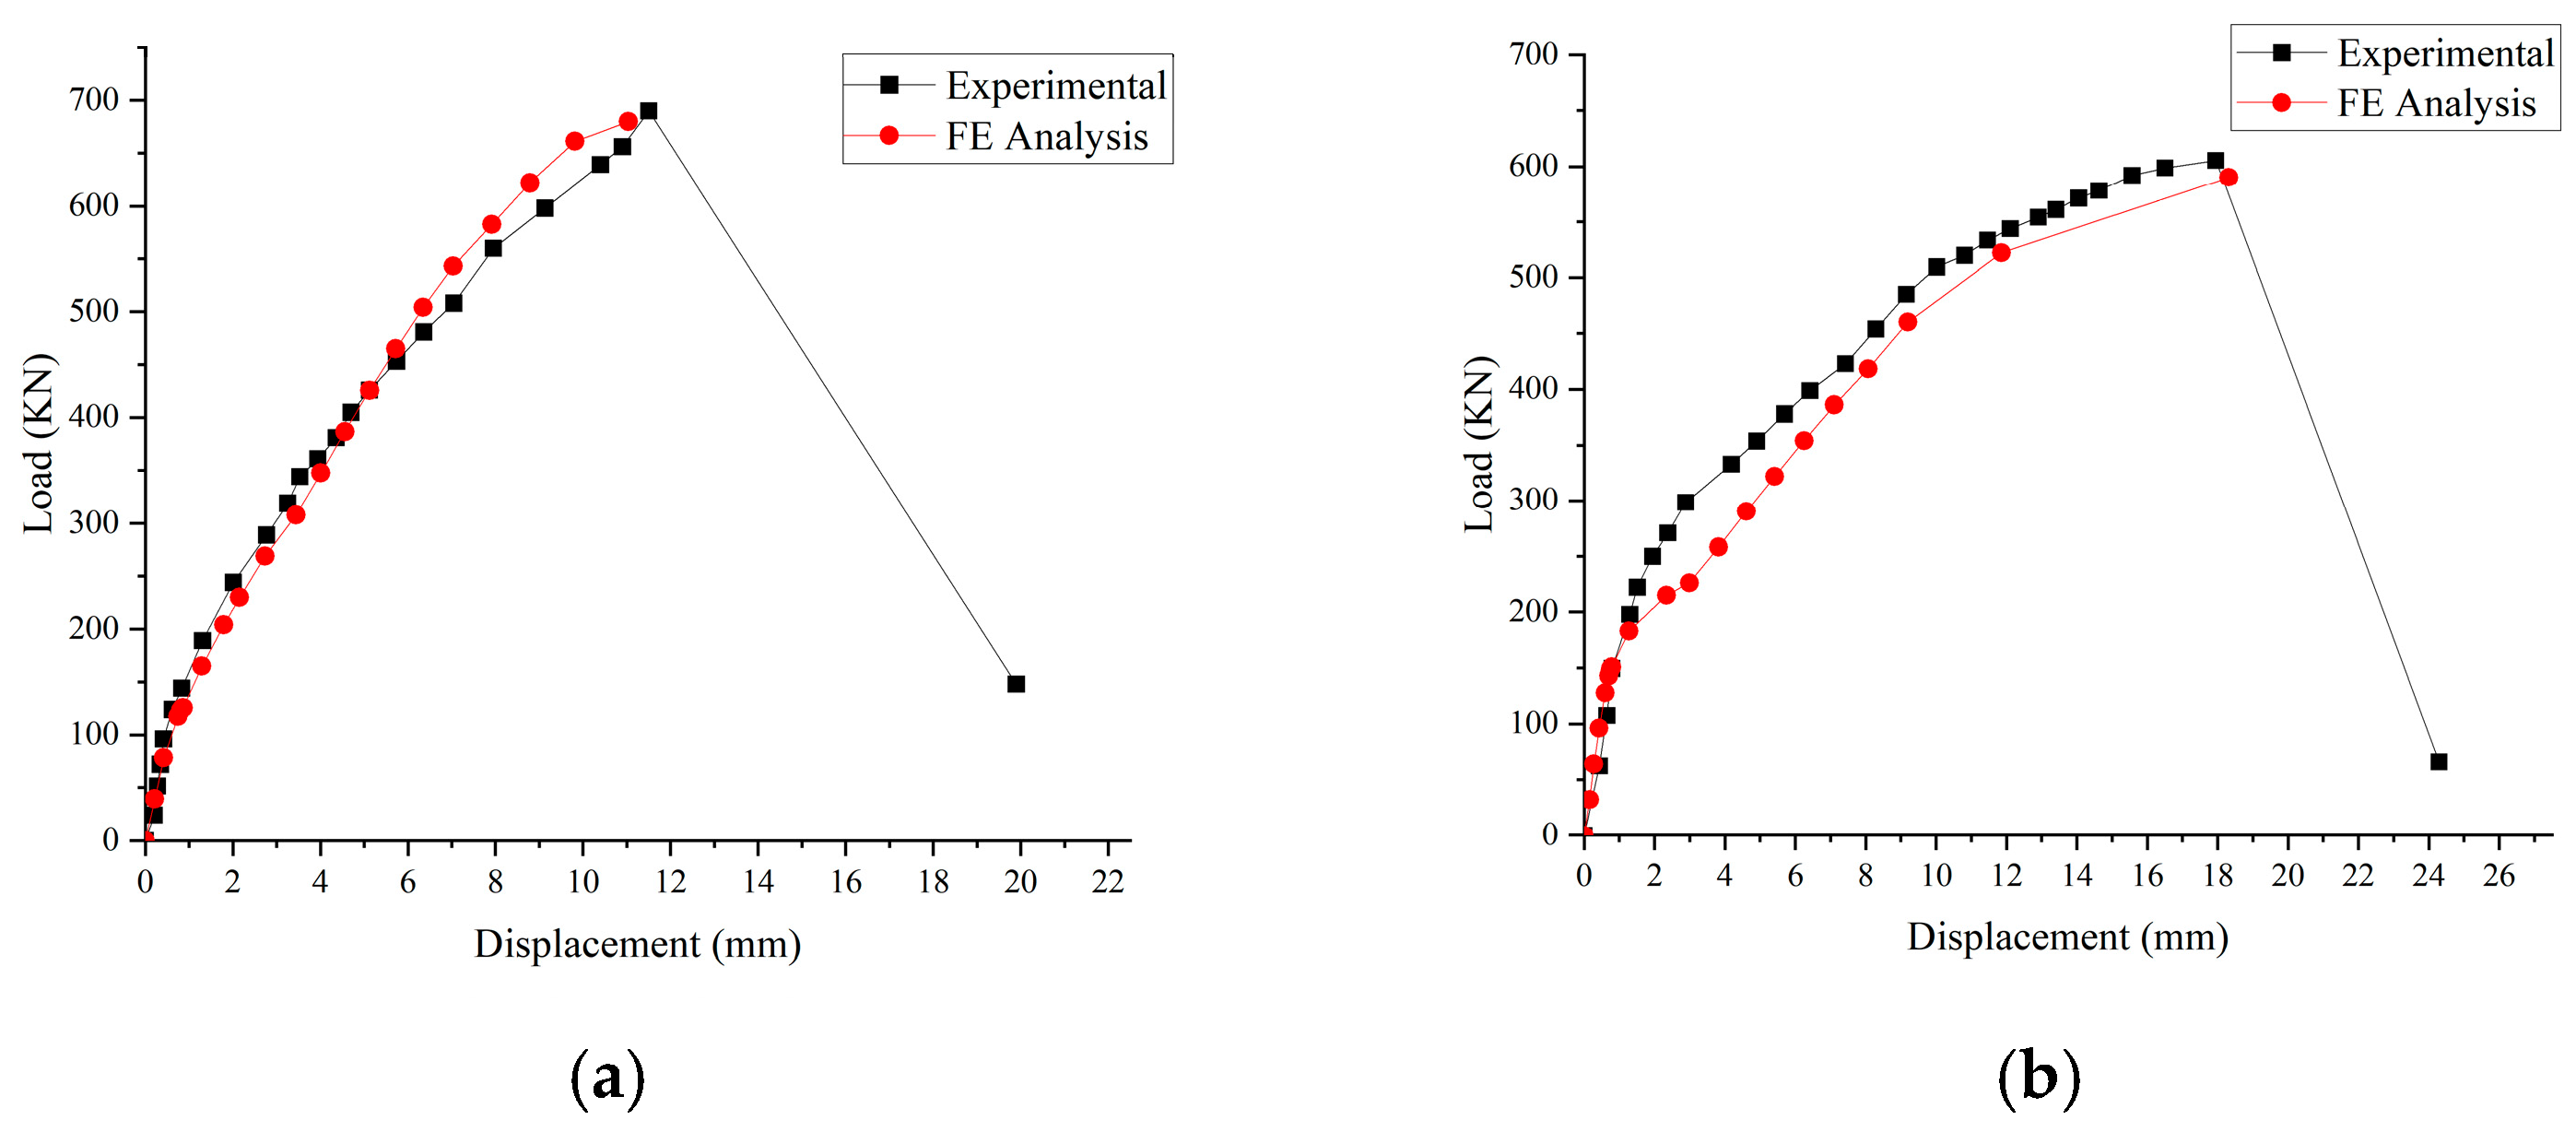
The load–displacement curves obtained from numerical simulation were derived by monitoring the displacement at the center of the specimen below the column head and the load at the loading point. Figure 11a,b present the comparative load–deflection curves of specimens C7-30-3 and C7-70-1, respectively. The results demonstrate good agreement between the experimental and numerical curves in terms of overall shape, ultimate load capacity, and corresponding displacement. Notably, the experimental curves display an unloading descending branch after reaching the peak load, whereas the finite element simulation fails to replicate this physical process. In Table 2, the discrepancies between experimental and simulated values are systematically summarized for key parameters, including failure load and ultimate deflection.
Figure 12a,b present the load–deflection curves from the experimental tests and FE simulations for specimens C7-30-3 and C7-70-1 at the mid-span of the slab. In order to enhance the reliability of the data, the experimental values were averaged from adjacent measurement points. The results demonstrate good agreement in overall trends between the experimental and simulated curves, though minor deviations are observed for specimen C7-70-1. These discrepancies primarily originate from experimental uncertainties including variations in material properties, differences in loading conditions, the effects of boundary constraints, and measurement errors. The consistent agreement in key curve characteristics validates the effectiveness of the FE model in predicting the specimens’ mechanical behavior.
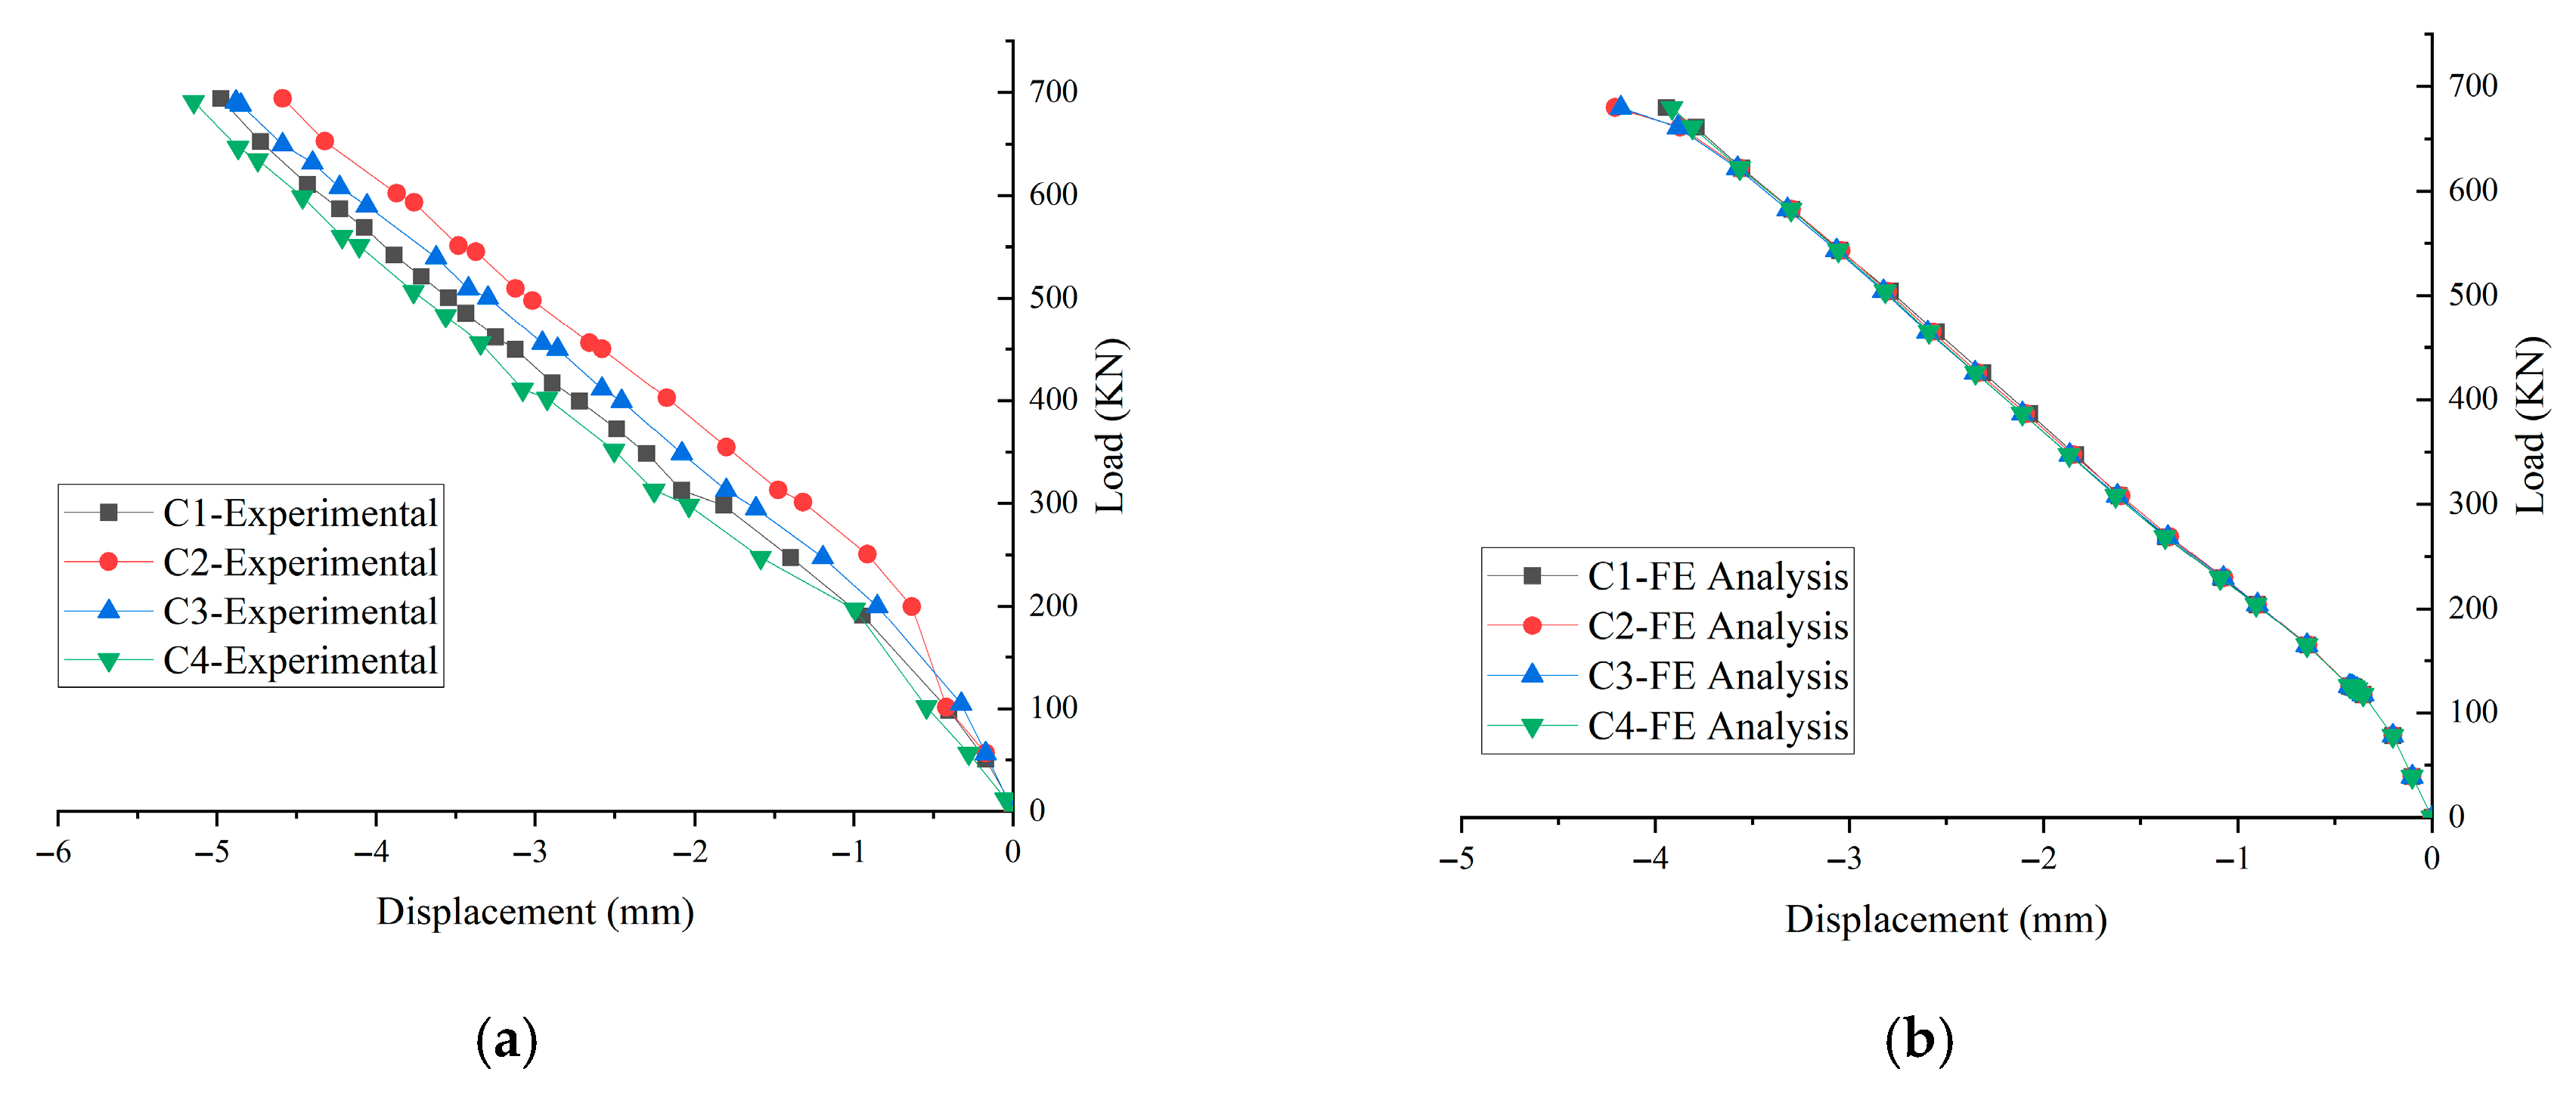
Figure 13 and Figure 14 compare the load–deflection test and finite element simulation results for the slab corners of specimens C7-30-3 and C7-70-1, respectively. The finite element simulation results show negative displacement in the load–deflection curves of the four corners, with the trends basically coinciding, indicating that the structure undergoes symmetric buckling deformation of the slab corners under the loading condition. Although the test curves do not completely coincide, the overall deformation trend is consistent with the simulation results, mainly due to the fact that it was difficult to ensure that the test conditions met the idealized assumptions of the finite element simulation. Comprehensive analysis shows that the numerical simulation results of the two groups of specimens are in good agreement with the test phenomena.

3. The Parametric Study

3.1. Modeling and Parameterization

In order to investigate the influence of the bottom reinforcement and the concealed beam on the vertical bearing performance of the slab–column joint, 13 slab–column joint specimens with different combinations of punch-to-span ratios, reinforcement forms and concealed beam widths are analyzed based on numerical simulation methods in Section 2, taking the bottom reinforcement parameters and the concealed beam widths as the main variables. The specific parameter configuration of each specimen is detailed in Table 3.
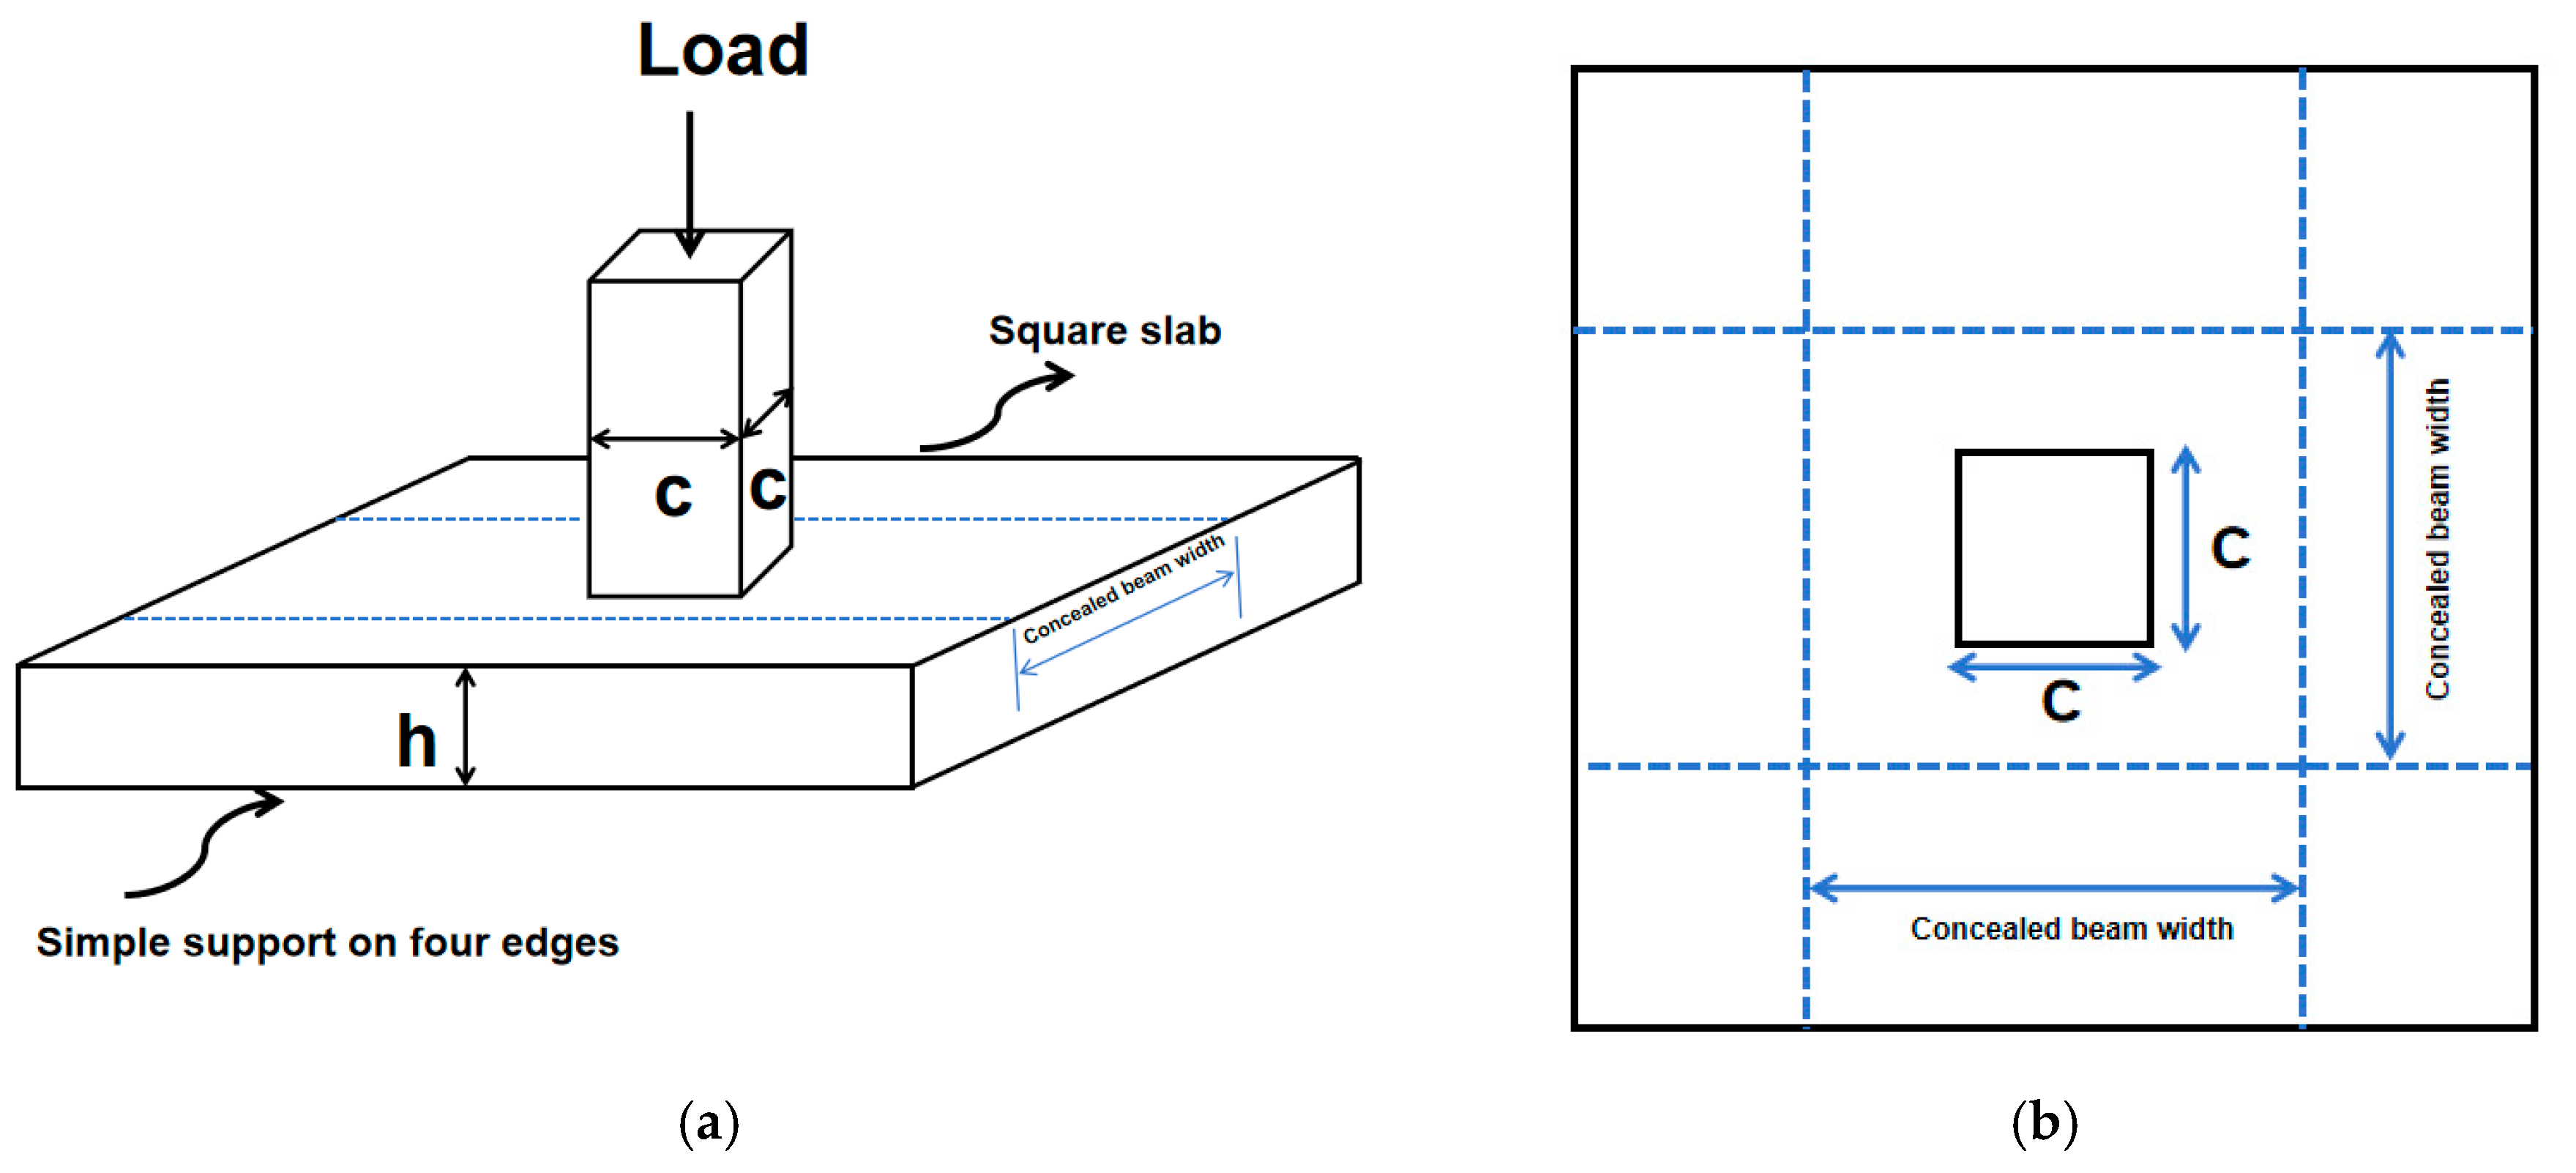
The names of the finite element slab–column joint specimens were defined in the format of “single/double-layer reinforcement, punching–span ratio, ratio of top to bottom reinforcement, concealed beam width”, and single-layer reinforcement and members without concealed beams were simplified. The study of the bottom reinforcement was carried out from two directions: comparing the bearing performance of slab–column joints with and without bottom reinforcement under the same punch–span ratio, and analyzing the variation patterns of bearing capacity and ultimate displacement in the slab–column joint with different top-to-bottom reinforcement ratios. In the impact analysis of the bottom reinforcement, selected three groups of specimens for comparison: SJ-7 and DJ-7-1, SJ-9 and DJ-9-1, and SJ-11 and DJ-11-1. In the impact analysis of the top-to-bottom reinforcement ratio, one group of specimens was selected for comparison: DJ-11-1, DJ-11-1.5, and DJ-11-2. Diagrams of the model of the three-dimensional loading schematic and the plan layout are shown in Figure 15.
In this study of the influence of the concealed beam, an orthogonal symmetric layout was adopted with the concealed beam width as the variable parameter. Four different cases were designed: no concealed beam (0 mm), standard width (C, 250 mm), 3 times slab thickness width (C+3 h, 790 mm), and 4 times slab thickness width (C+4h, 970 mm). According to the requirements of the “Code for Design of Concrete Structures,” corresponding stirrup configurations were applied: four-limb stirrups (250 mm), six-limb stirrups (790 mm), and eight-limb stirrups (970 mm), with specific details shown in Figure 16. The influence of concealed beams was analyzed from two aspects: Under the same punching shear–span ratio (λ = 7), the performance differences in four slab–column joint specimens with varying concealed beam widths (DJ-7-1, DJ-7-1-250, DJ-7-1-790, and DJ-7-1-970) were compared. Under different punching shear–span ratios (λ = 7, 11, 13), the mechanical behavior of specimens with the same concealed beam width (790 mm) (DJ-7-1-790, DJ-11-1-790, and DJ-13-1-790) was investigated.

3.2. Simulation Analysis

The materials, boundary conditions, and loading of the model were set according to the requirements after completing modeling, and the vertical load-bearing performance of the slab–column joint was comprehensively analyzed through the damage pattern diagrams, load–displacement curves, stress contour diagrams, and stress curves of the reinforcement. In order to clearly observe the details, the damage pattern diagram is enlarged to observe the damage pattern diagram of some slab–column joints during the loading process (see Figure 17 as an example of member DJ-7-1): when loaded to the limit state, the slab surface is bent and deformed, the corners of the slab are warped all around, and the heads of the columns have sunk inwards, which is a sign of punching out of the slab surface. The stress contour diagram can reflect the stress distribution in the loading of the model, and an example stress contour diagram of the bending damage member DJ-11-1 is shown in Figure 18.
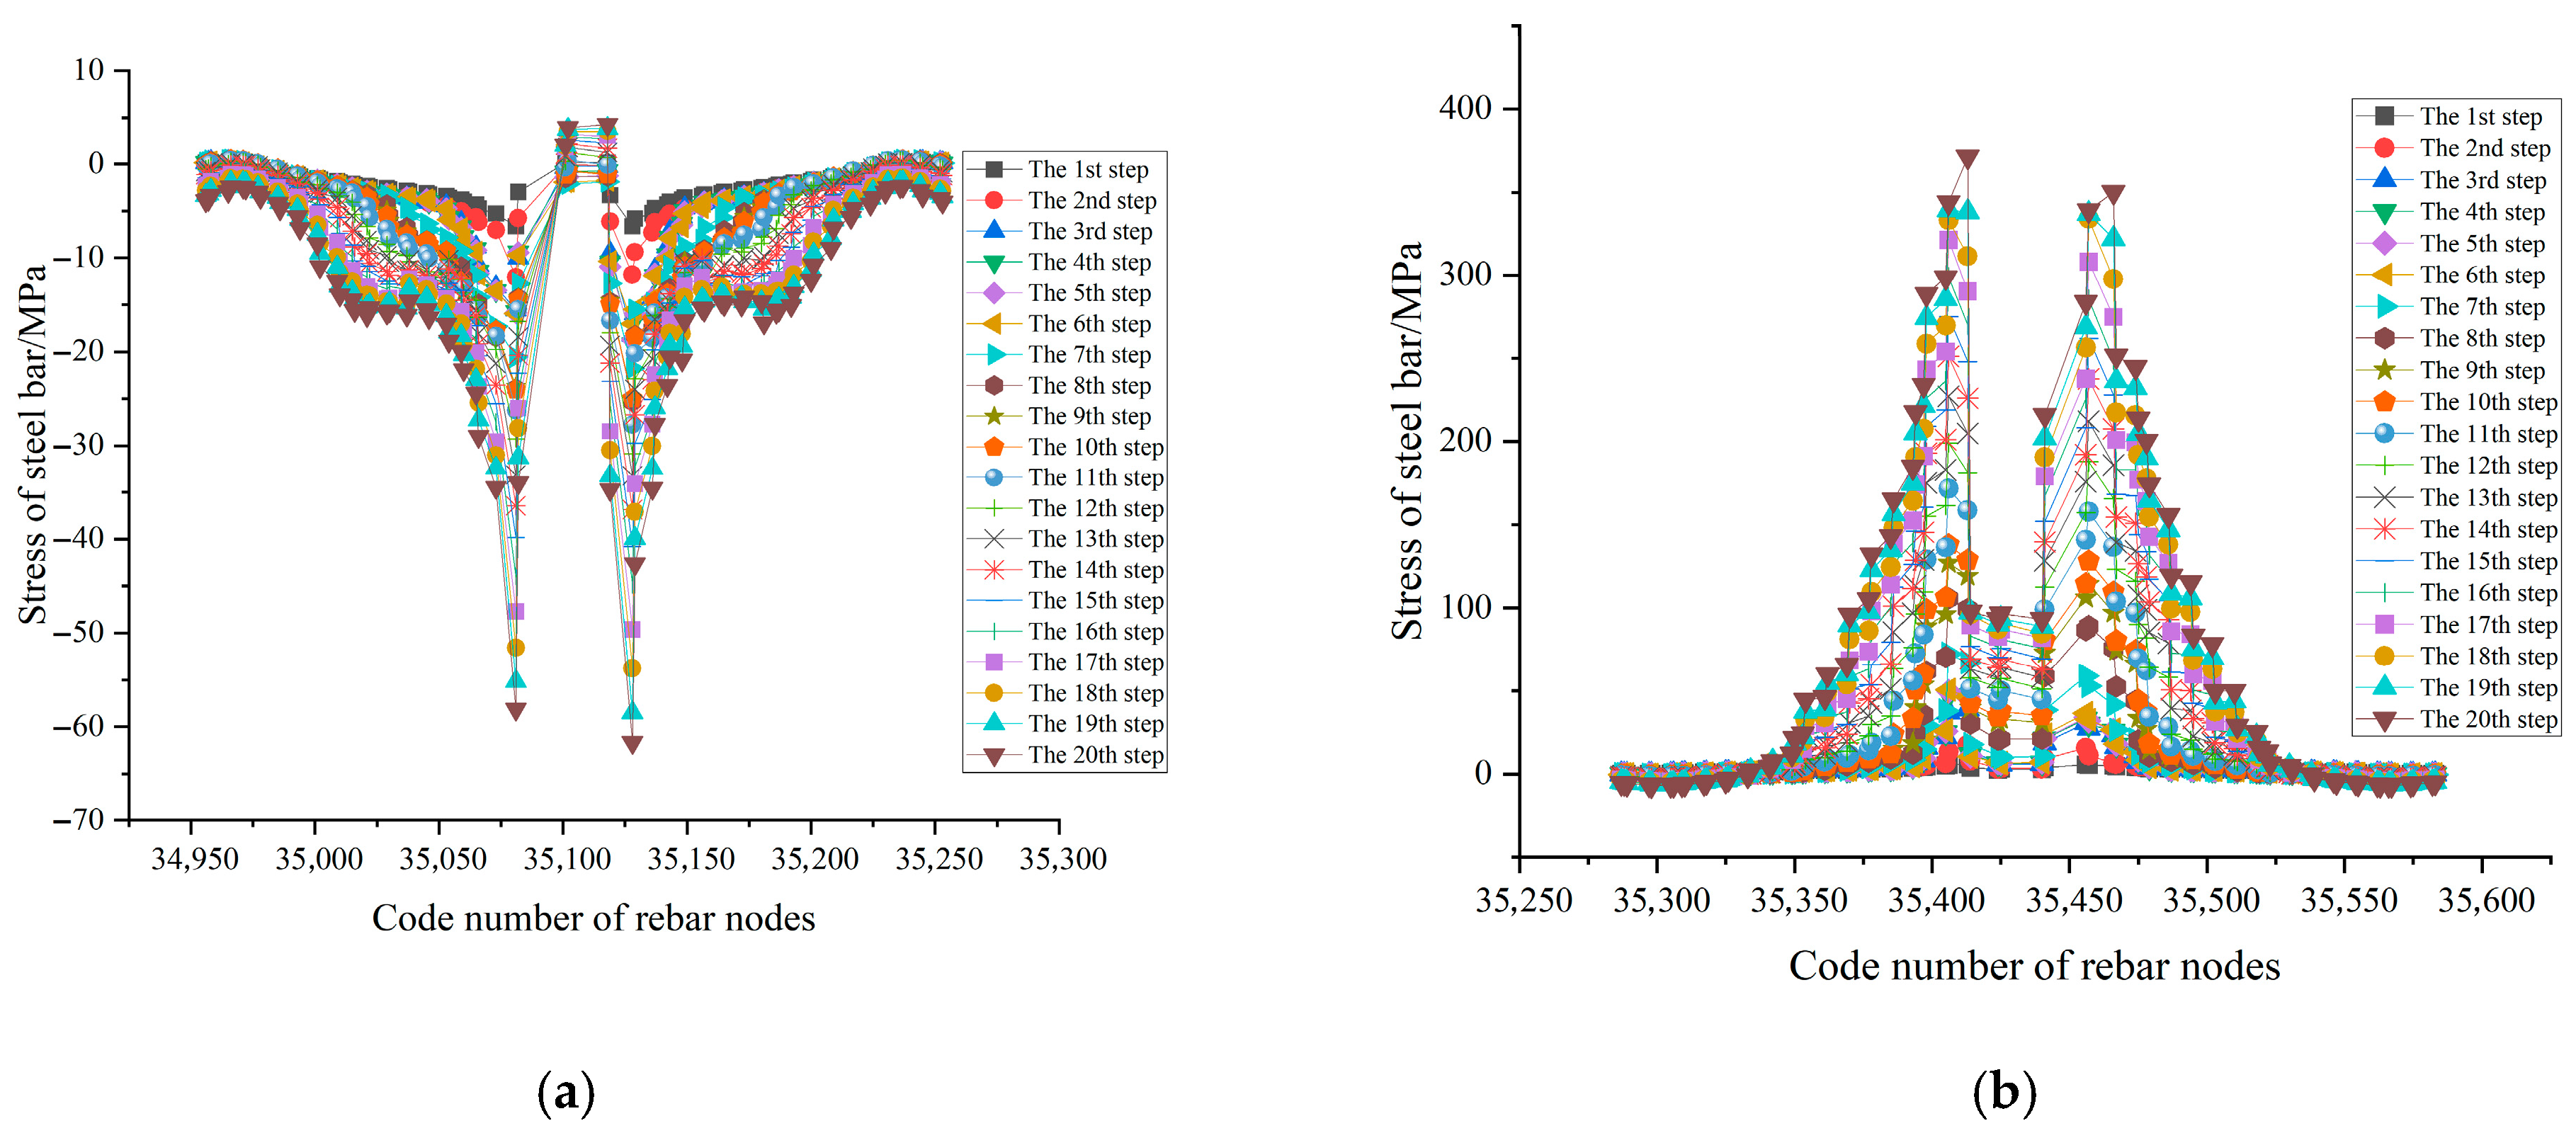
The reinforcement stress through the column head was measured for the analysis. Only the top slab reinforcement stresses were analyzed for specimens with single-layer reinforcement, while both the top and bottom reinforcement stresses were analyzed for double-layer-reinforced specimens. Yielding of the top slab reinforcement near the column head signified flexural failure. The bottom reinforcement of the slab was mainly compressed, the top reinforcement of the slab was mainly tensed, and a transition from tension to compression occurred at the support region. The failure mode of the slab–column joint was determined by combining the stress contour diagrams, vertical displacement measurements, and reinforcement stress data. Representative stress curves (DJ-11-1) are presented in Figure 19.

3.3. Discussing the Results

The numerical simulation results of the 13 specimens and the judgment of the failure mode are shown in Table 3, which briefly describes the key features of the finite element simulation specimens from the initial loading to the occurrence of the failure, including cracking load, ultimate load, failure characteristics, the characteristics of the stress contour plot, the yielding of steel reinforcement, and the combination of the above characteristics of the slab–column joints to judge the failure mode.

3.3.1. Failure Mechanism Analysis of Slab–Column Joints

The numerical simulation results (Table 4) show that increasing the bottom reinforcement reduced the cracking loads of slab–column joints, but enhanced the ultimate loads. This is because in the earliest stage of loading, the bottom reinforcement shifts the neutral axis, causing stress redistribution and reducing the effective tensile area, thereby decreasing the cracking load. However, in the later loading stage, the bottom reinforcement begins to play a role in increasing the ultimate load and displacement of the double-layer reinforced joint. Additionally, the increased bottom reinforcement promotes the formation of plastic hinges at the slab surface, shifting the failure mode from punching shear to flexural failure.
It was also found that increasing the width of the concealed beams can improve both the cracking load and the ultimate load, which is due to the fact that the concealed beam stirrups can effectively restrain the concrete and enhance the cooperative work between the reinforcement and the concrete. Stress contour analysis shows that, with the increase in the width of the concealed beam, the distribution range of the ring cracks around the column expands, and the failure mode of the specimen is gradually changed from brittle punching failure to ductile bending failure, which can delay the occurrence of punching failure and improve the overall performance of the joints.
Increasing the reinforcement ratio at the top and bottom of the slab can simultaneously enhance both the cracking load and the ultimate load. This is attributed to the fact that a higher reinforcement ratio elevates the neutral axis of the cross-section, thereby increasing the effective tensile area of concrete in the tension zone. Furthermore, when other parameters remain unchanged, an increase in the punching shear–span ratio reduces the ultimate load and shifts the failure mode of the member from punching shear failure toward flexural failure.

3.3.2. Influence of the Bottom Reinforcement

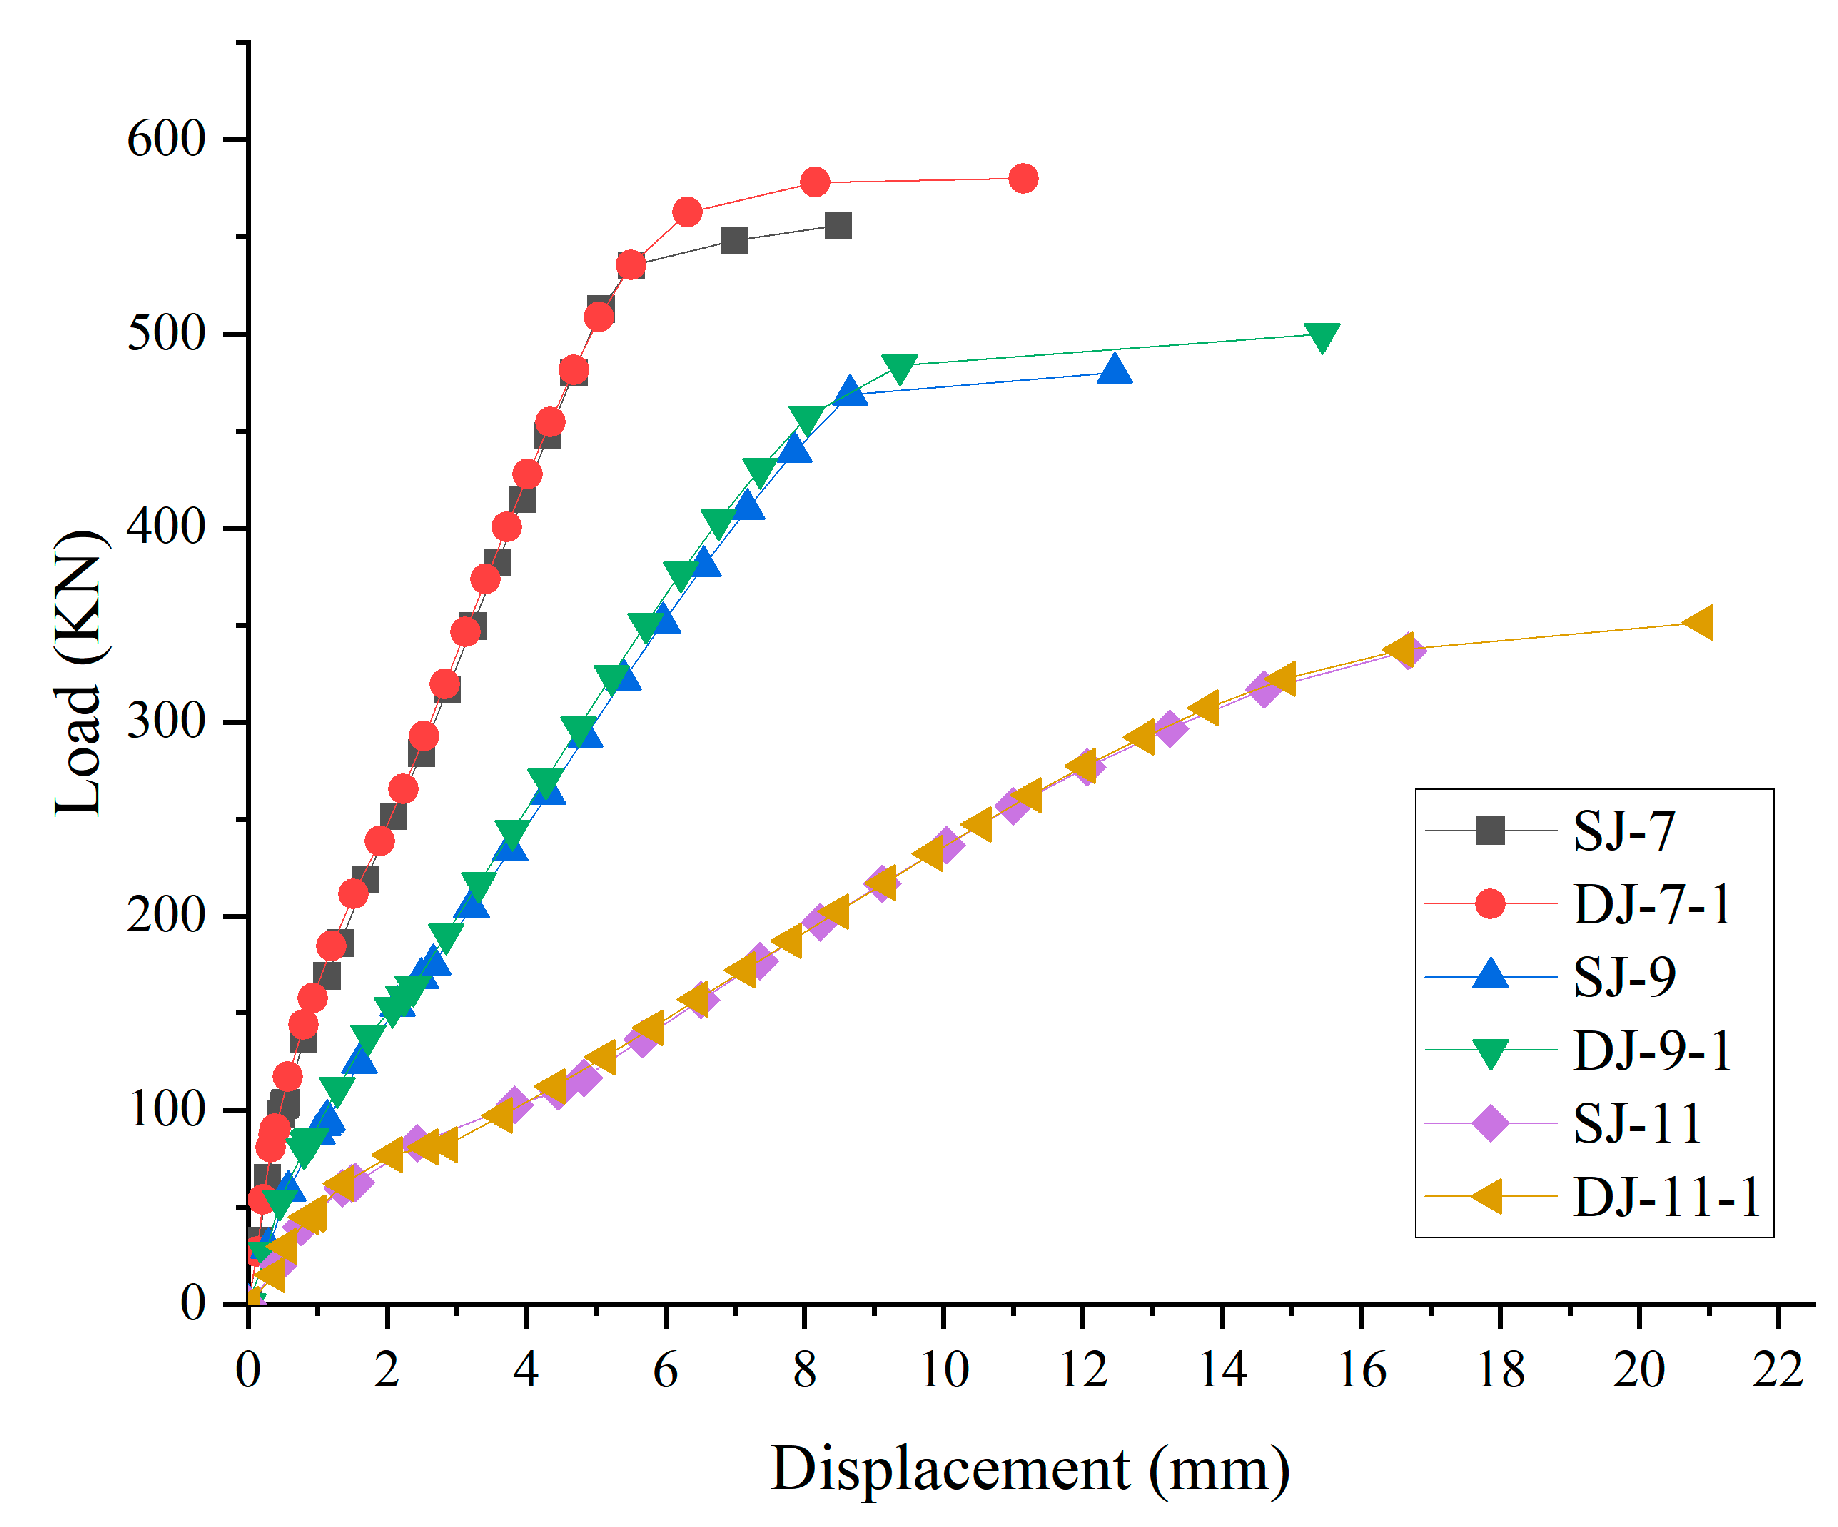
Figure 20 compared the load–displacement curves at the column center of the finite element models with and without bottom reinforcement under three different punch–span ratios. In the initial loading stage, all three models exhibited similar mechanical responses, undergoing crack initiation and propagation phases where the bottom reinforcement had not yet engaged in load-bearing. As the loading increased and cracks propagated into the compression zone, the bottom reinforcement began to contribute to the load-carrying capacity. The experimental data demonstrate significant performance advantages for specimens with bottom reinforcement at the final state. For the three punch–span ratios, the ultimate load-bearing capacities increased from 555.74 KN, 480.01 KN, and 336.72 KN to 580.12 KN, 499.89 KN, and 351.32 KN, representing improvements of 4.39%, 4.14%, and 4.33%, respectively. Concurrently, the ultimate displacements increased by 31.3%, 23.91%, and 25.32%. Notably, the load–displacement curves of both single-layer and double-layer reinforcement models exhibited distinct punching shear–span ratio effects: as the punch–span ratio increased, the ultimate load-bearing capacity gradually decreased, while the ultimate displacement correspondingly increased.

3.3.3. Influence of Reinforcement Ratios Between Top and Bottom

According to the finite element results of the DJ-11-1, DJ-11-1.5, and DJ-11-2 specimens (as shown in Figure 21), the top and bottom reinforcement ratios have a significant effect on the performance of the slab–column joints under the condition of the same punch-to-span ratio. With the increase in reinforcement ratio, the performance of the specimens shows obvious variation: the cracking load and ultimate bearing capacity are increased simultaneously, in which the bearing capacity of the specimen with a 1.5:1 reinforcement ratio is increased by 15.29% compared with that of the specimen with a 1:1 ratio, and the specimen with a 2:1 ratio is increased by 10.58% compared with that of the specimen with a 1.5:1 ratio. However, this improvement in strength accompanies reductions in ultimate displacement and ductility. In terms of failure mechanism, this rule of change originates from the influence of the reinforcement ratio on crack development—after cracks appear at the top of the slab in the early stage of loading, the higher reinforcement ratio at the top of the slab can effectively slow down the extension of the cracks to the compression zone, increase the height of the compression zone of the concrete, and thus improve the punching resistance. The experimental results confirm that although increasing the proportion of reinforcement at the top and bottom of the slab can significantly improve the load-carrying capacity, it will sacrifice the ductility performance of the member. Therefore, it is necessary to achieve a balance between load-carrying capacity and ductility according to the actual needs in the engineering design.

3.3.4. Influence of the Width of Concealed Beams

The finite element results (Figure 22) reveal the significant influence pattern of concealed beams on the mechanical properties of slab–column joints. By comparing and analyzing the load–deflection curves under the four working conditions of concealed beam widths of 0, 250, 790, and 970 mm, and keeping the punch-to-span ratio, material strength, and reinforcement ratio constant, a clear effect of size is found on the performance of the members. With the increase in the concealed beam width from 0 mm to 970 mm, the ultimate load capacity of specimen DJ-7-1-970 reaches 883.56 KN, which is 55.51% higher than that of specimen SJ-7-1 (568.19 KN) without concealed beams. Meanwhile, the ultimate displacement increases from 11.15mm to 15.26mm, and the ductility index increases up to 154.12%. This phenomenon indicates that the increase in the width of the concealed beam not only improves the load-carrying capacity by enhancing the section bending stiffness, but also significantly improves the plastic deformation capacity of the component by improving the stress distribution mechanism. The quantitative relationship established from the experimental data shows that the width of the concealed beams is positively correlated with the performance of the joints within the studied parameter range, with the maximum width (970 mm) configuration achieving optimal synergistic enhancement of the load-carrying capacity and ductility, which provides an important basis for parameter optimization in performance-based joint design.

3.3.5. Influence of Punch–Span Ratio

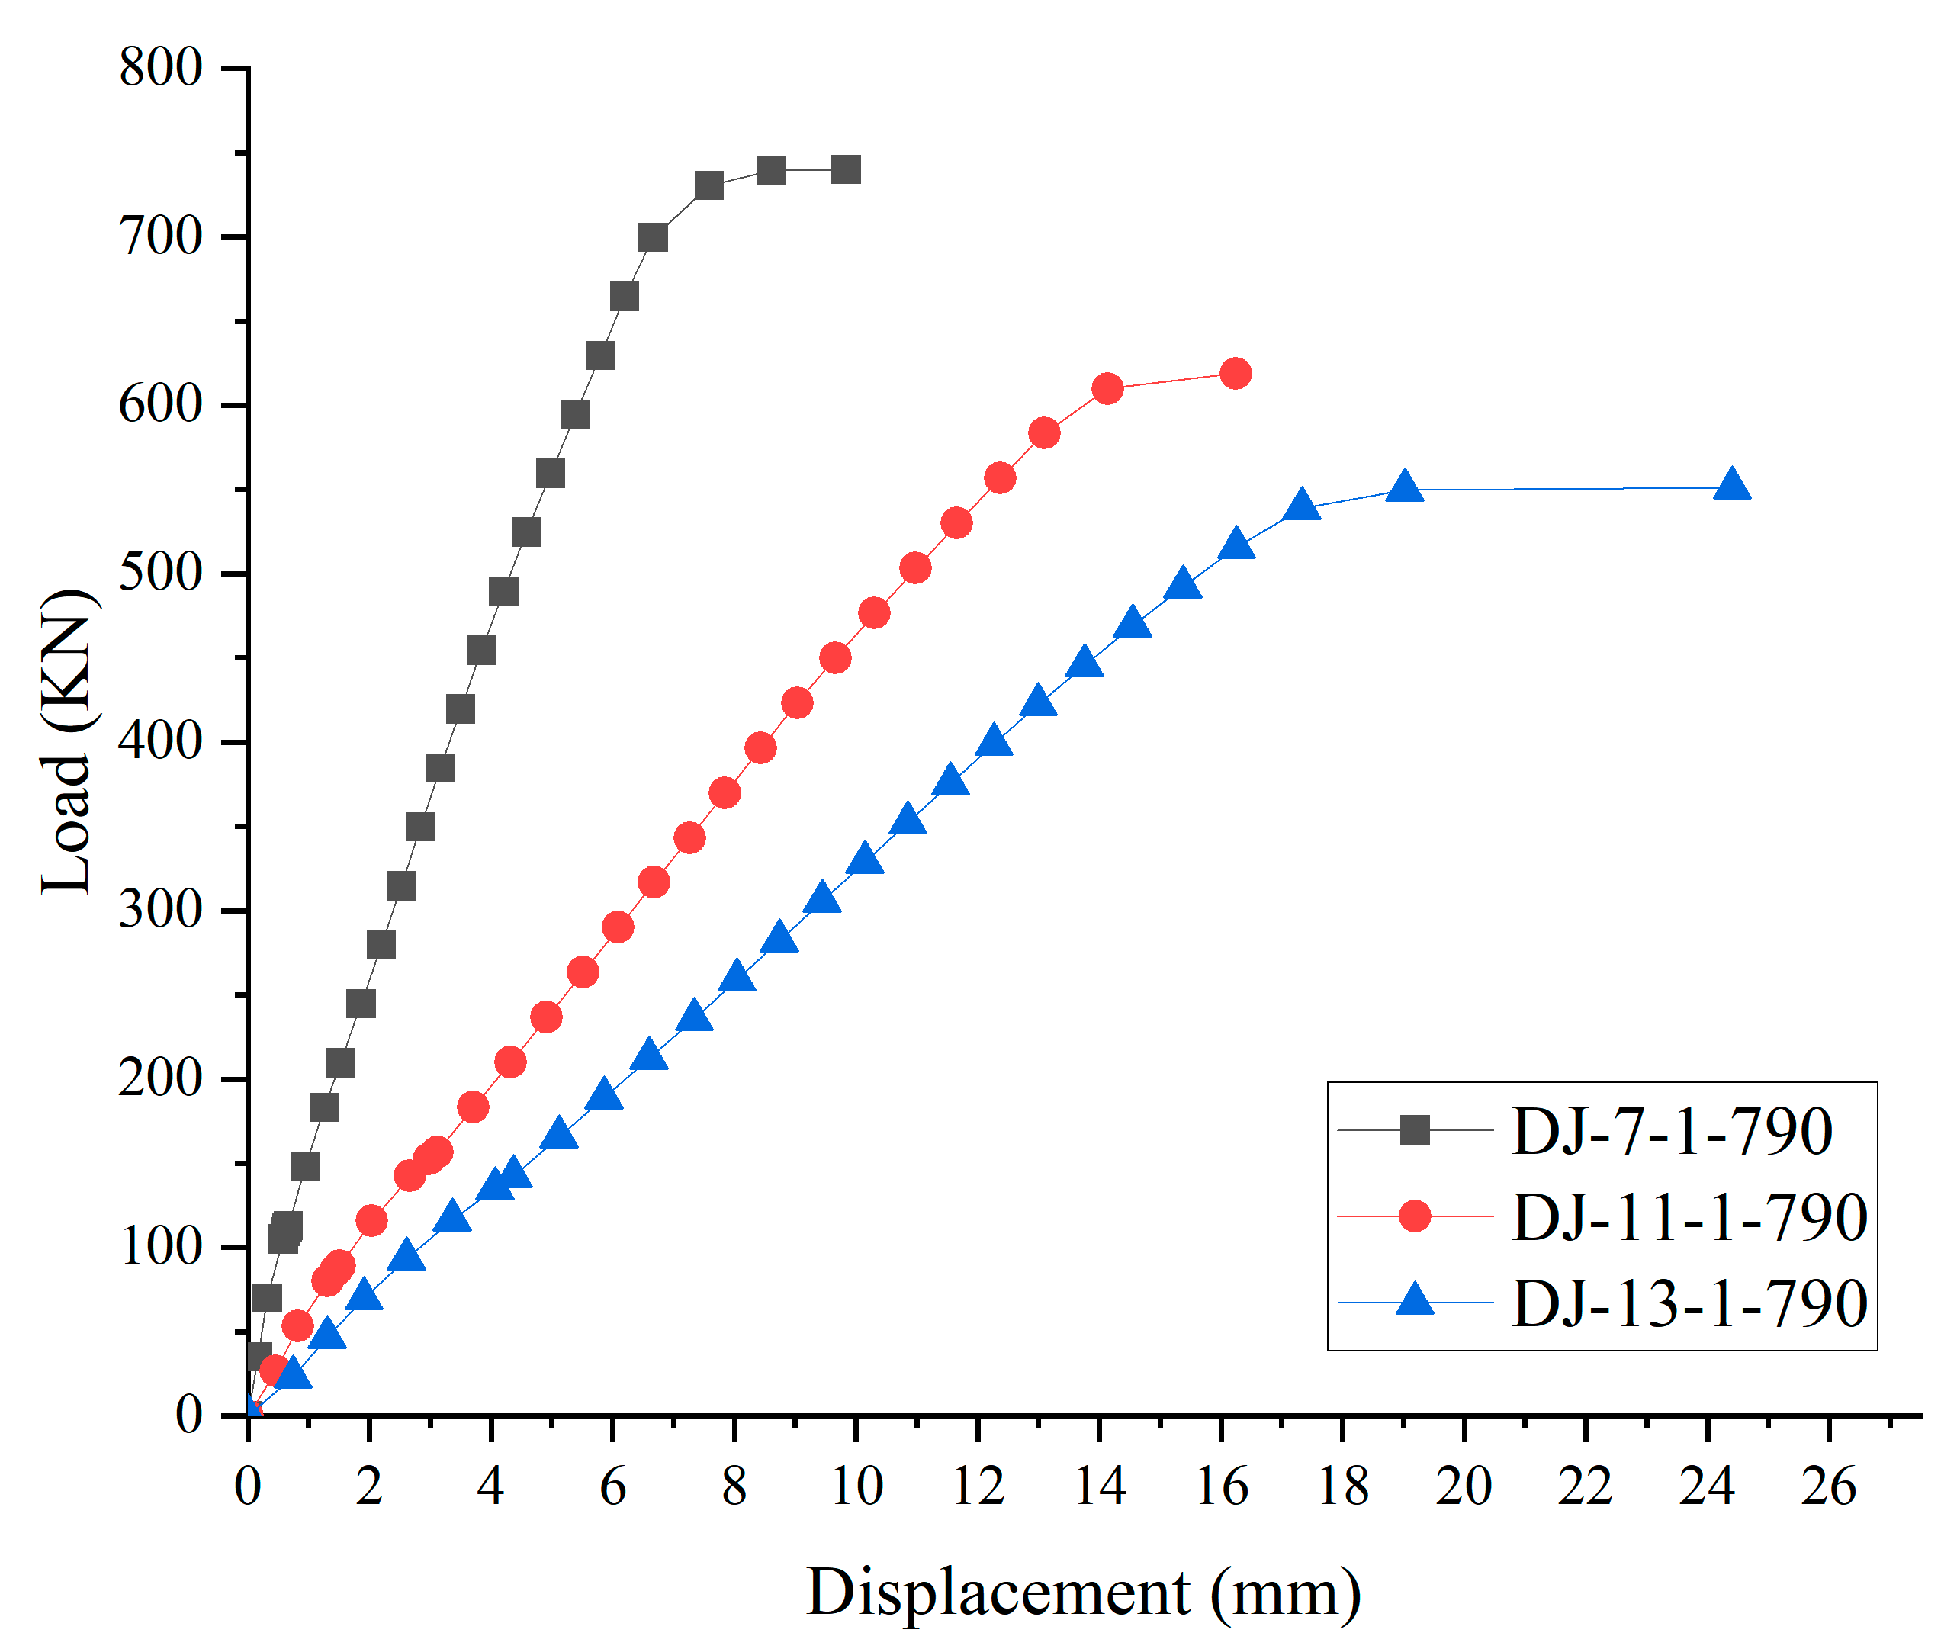
The finite element results in Figure 23 demonstrate that the punching shear–span ratio (λ) significantly influences the behavior of slab–column joints when the concealed beam width, concrete strength grade, and longitudinal reinforcement ratio are kept constant. Through the comparative analysis of three groups of specimens, DJ-7-1-790 (λ = 1.0), DJ-11-1-790 (λ = 1.5), and DJ-13-1-790 (λ = 2.0), it is found that, with the increase in the punching–span ratio from 1.0 to 2.0, the members show a clear pattern of change in the mechanical properties: the ultimate load-carrying capacity decreases in turn from 739.98kN (λ = 1.0) to 618.94kN (λ = 1.5) and 551.28kN (λ = 2.0), decreases of 16.3% and 10.9%, respectively; at the same time, the ultimate displacement increases from 9.84mm to 16.25mm and 24.41mm, and the ductility performance increases by 65.14% (λ = 1.0 → 1.5) and 50.22% (λ = 1.5 → 2.0), respectively. This experimental phenomenon reveals the intrinsic correlation mechanism between the punching–span ratio and the joint performance: a smaller punching–span ratio is favorable for improving the member’s punching shear bearing capacity, while a larger punching–span ratio significantly improves the joint’s deformation capacity. Based on this, in the actual engineering design, the seismic performance of the joints can be optimized by reasonably controlling the parameters of the punch–span ratio to meet structural safety requirements and achieve the optimal balance between load-carrying capacity and ductility.

4. Conclusions

In this paper, the vertical bearing capacity of an RC slab–column joint model was investigated to verify the accuracy of the VFEAP procedure. Using bottom reinforcement and concealed beams as key parameters, the influence of various working conditions (including the presence or absence of bottom reinforcement, variations in concealed beam width, and different punching–span ratios under the same concealed beam width) on the failure modes and deformation curves of slab–column joints were systematically investigated. This research provides in-depth insights into the variation patterns of vertical bearing capacity. The main findings are as follows:
(1) The validity of the proposed nonlinear analysis method for three-dimensional solid degenerated virtual laminated elements has been verified. The simulation results show good agreement with experimental data, providing a reliable analytical tool for studying the performance of slab–column joints. It is recommended that this method is employed for refined performance evaluation of joints in practical engineering design.
(2) The configuration of the bottom reinforcement can significantly improve the joint failure mode, facilitating the transition from brittle punching shear failure to ductile flexural failure. The bottom reinforcement effectively enhances both the load-bearing capacity and ductility of slab–column joints during later loading stages by forming a plastic hinge mechanism at the slab surface, thereby altering the failure pattern. For optimal performance, it is recommended that a reinforcement ratio within the range of 1.2–1.5 is maintained between the top and bottom steel during the design, which ensures adequate bearing capacity while preserving favorable ductility characteristics.
(3) The optimization of concealed beam parameters can significantly enhance joint performance. Increasing the concealed beam width effectively delays the initial cracking time in slab–column joint components while improving both stiffness and ductility. Experimental results demonstrate that a concealed beam width of 970 mm increases bearing capacity by 55.51% and ductility by 154.12% compared to joints without concealed beams. The punching–span ratio shows remarkable influence on joint performance—under identical concealed beam width conditions, larger punching–span ratios correspond to reduced bearing capacity but improved ultimate-state ductility. For critical joints, wide concealed beam designs are recommended, in addition to maintaining punching–span ratios between 0.3 and 0.35 to achieve optimal balance between load-bearing capacity and ductility performance.
(4) Future research should further investigate the influence of reinforcement arrangement forms (e.g., radial reinforcement) on damage mode transitions; explore the optimized values of concealed beam widths under different concrete strength grades; establish a joint design methodology that takes into account the damage mode transitions; and propose quantitative performance-based design indices.

Author Contributions

X.W.: writing—review and editing, writing—original draft, visualization, validation, software, methodology, investigation, formal analysis, data curation, conceptualization. Y.J.: resources, project administration, methodology, funding acquisition, conceptualization. G.W.: supervision, project administration, methodology, conceptualization. G.C.: visualization. Y.L. and N.K.: validation. All authors have read and agreed to the published version of the manuscript.

Funding

The authors gratefully acknowledge the research grant provided by the National Natural Science Foundation of China (No. 51268004(2013.01-2016.12) and No. 52268050(2023.01-2026.12)).

Data Availability Statement

Data will be made available on request.

Conflicts of Interest

The authors confirm that there are no conflicts of interest.

References

  1. Talbot, A.N. Reinforced Concrete Wall Footings and Column Footings. In Charge of Theoretical & Applied Mechanics; University of Illinois: Champaign, IL, USA, 1925. [Google Scholar]
  2. Zheng, S.; Du, Y.; Liang, Z. Research progress of punching shear performance of reinforced concrete slab-column joints. J. Archit. Civ. Eng. 2024, 41, 52–68. [Google Scholar] [CrossRef]
  3. Jiang, M.; Shi, Q.; Jing, X. State-of-the-art on punching shear capacity of concrete slab -column connections. China Civ. Eng. J. 2024, 57, 1–18. [Google Scholar] [CrossRef]
  4. Li, Y.; Li, Y.; Zhou, D.; Yan, W. Experimental Study on Post-Punching Mechanical Performance of Flat Slab-Column Joints with Drop Panel and Embedded Beam. Earthq. Eng. Eng. Dyn. 2025, 40, 178–186. [Google Scholar] [CrossRef]
  5. Zheng, W.; Wang, G.; Wang, Y. Research Progress in Bearing Capacity Calculation Methods of Slab-Column Connections. J. Harbin Inst. Technol. 2022, 54, 1–7. [Google Scholar] [CrossRef]
  6. Zhang, J. Research on Punching Strength of Side Slab-Column Joints of RC Slab-Column Structures with Hidden Beams; South China University of Technology: Guangzhou, China, 2019. [Google Scholar]
  7. Kang, S.-M.; Na, S.-J.; Hwang, H.-J. Punching Shear Strength of Reinforced Concrete Transfer Slab-Column Connections with Shear Reinforcement. Eng. Struct. 2021, 243, 112610. [Google Scholar] [CrossRef]
  8. Wang, J.; Gong, C.; Tan, X. Research on Flexural Performance of Edge Joint of Column-Slab Structure with Steel Concealed-Beam. Struct. Eng. 2024, 40, 50–60. [Google Scholar] [CrossRef]
  9. De Oliveira, V.H.D.; de Lima, H.J.N.; Melo, G.S. Punching Shear Resistance of Flat Slabs with Different Types of Stirrup Anchorages Such as Shear Reinforcement. Eng. Struct. 2022, 253, 113671. [Google Scholar] [CrossRef]
  10. Shatarat, N.; Salman, D. Investigation of Punching Shear Behavior of Flat Slabs with Different Types and Arrangements of Shear Reinforcement. Case Stud. Constr. Mater. 2022, 16, e01028. [Google Scholar] [CrossRef]
  11. Li, W.; Li, Z.; Chen, H.; Zhou, Y.; Mansour, W.; Wang, X.; Wang, P. Effects of Concrete-Stirrup Interaction on Shear Behavior of RC Beams under Varying Shear Span-Depth Ratio Scenarios. Structures 2024, 61, 106071. [Google Scholar] [CrossRef]
  12. Tang, M. Study on Seismic Behavior of RC Slab-Column Connections; Hunan University: Changsha, China, 2021. [Google Scholar]
  13. Zhao, J.; Yi, W. Calculation and Study on Punching Bearing Capacity of Slab-Column Joints without Shear Reinforcement. Build. Struct. 2019, 49, 120–123. [Google Scholar] [CrossRef]
  14. Liu, Y.; Deng, J.; Jia, Y.; Wu, G.; Ke, N.; Wei, X. A Study on the Bearing Performance of an RC Axial Compression Shear Wall Strengthened by a Replacement Method Using Local Reinforcement with an Unsupported Roof. Buildings 2024, 14, 2926. [Google Scholar] [CrossRef]
  15. Wei, X.; Lu, L.; Ke, N.; Jia, Y.; Wu, G. A Study on the Effects of Punch-to-Span Ratio and Longitudinal Reinforcement Eigenvalues on the Bearing Capacity of RC Slab–Column Connections. Buildings 2024, 14, 208. [Google Scholar] [CrossRef]
  16. Jia, Y.; Lu, L.; Wu, G.; Liu, Y.; Mo, X. Spatial Nonlinear Simulation Analysis on the Temperature Shrinkage Effect of a Super-Long Frame Structure Considering the Construction Process. Processes 2022, 10, 1874. [Google Scholar] [CrossRef]
  17. Hong, F. Experimental Study on Punching Shear Failure of Reinforced Concrete Slabs-Column Connection; Hunan University: Changsha, China, 2015. [Google Scholar]
  18. GB 50010-2010; Code for the Design of Coagulation Structures. Construction Science and Technology. Standardization Administration of China (SAC): Beijing, China, 2015; pp. 28–30.
  19. Lin, D.; Zhang, J.; Xiang, Y.; Xu, X. Virtual Layered Module Method and Its Application in Bridge Construction Application in Bridge Engineering. Chin. Civ. Eng. J. 1998, 31, 1–8. [Google Scholar] [CrossRef]
  20. Xu, X.; Guo, Y.; Shen, Y. Nonlinear Finite Element and Programming; Zhejiang University Press: Hangzhou, China, 1993. [Google Scholar]
  21. Xu, X.; Lin, D. Physical Degradation Unit Series. Chin. J. Solid Mech. 2001, 22, 1–12. [Google Scholar]
  22. Lu, L. Three-Dimensional Nonlinear Analysis of Time-Varying Fire Behavior of RC Frame Structures Considering the Spatial Coordinated Interaction of Beam-Slab-Column; Nanchang University: Nanchang, China, 2025. [Google Scholar]
  23. Zhan, M. Study on Load-Carrying Mechanism to Resist Progressive Collapse of RC Structures Considering Cast-in-Place Slab; Nanchang University: Nanchang, China, 2021. [Google Scholar]
  24. Deng, J. Research on Normal Section Bearing Capacity of RC Vertical Members Strengthened by Enclosure Method and Unbraced Local Reinforcement Replacement Method Considering Stress Lag; Nanchang University: Nanchang, China, 2023. [Google Scholar]
  25. Hu, Q. Simulation Study on Continuous Collapse of PC Frame Structure Considering Spatial Synergy; Nanchang University: Nanchang, China, 2023. [Google Scholar]
  26. Willam, K. Plasticity in Reinforced Concrete. Comput. Methods Appl. Mech. Eng. 1982, 31, 363. [Google Scholar] [CrossRef]
  27. Bergan, P.; Holand, I.; Soreide, T. Use of Current Stiffness Parameter in Solution of Nonlinear Problems, Energy Methods in Finite Element Analysis; John Wiley & Sons: Hoboken, NJ, USA, 1979. [Google Scholar]
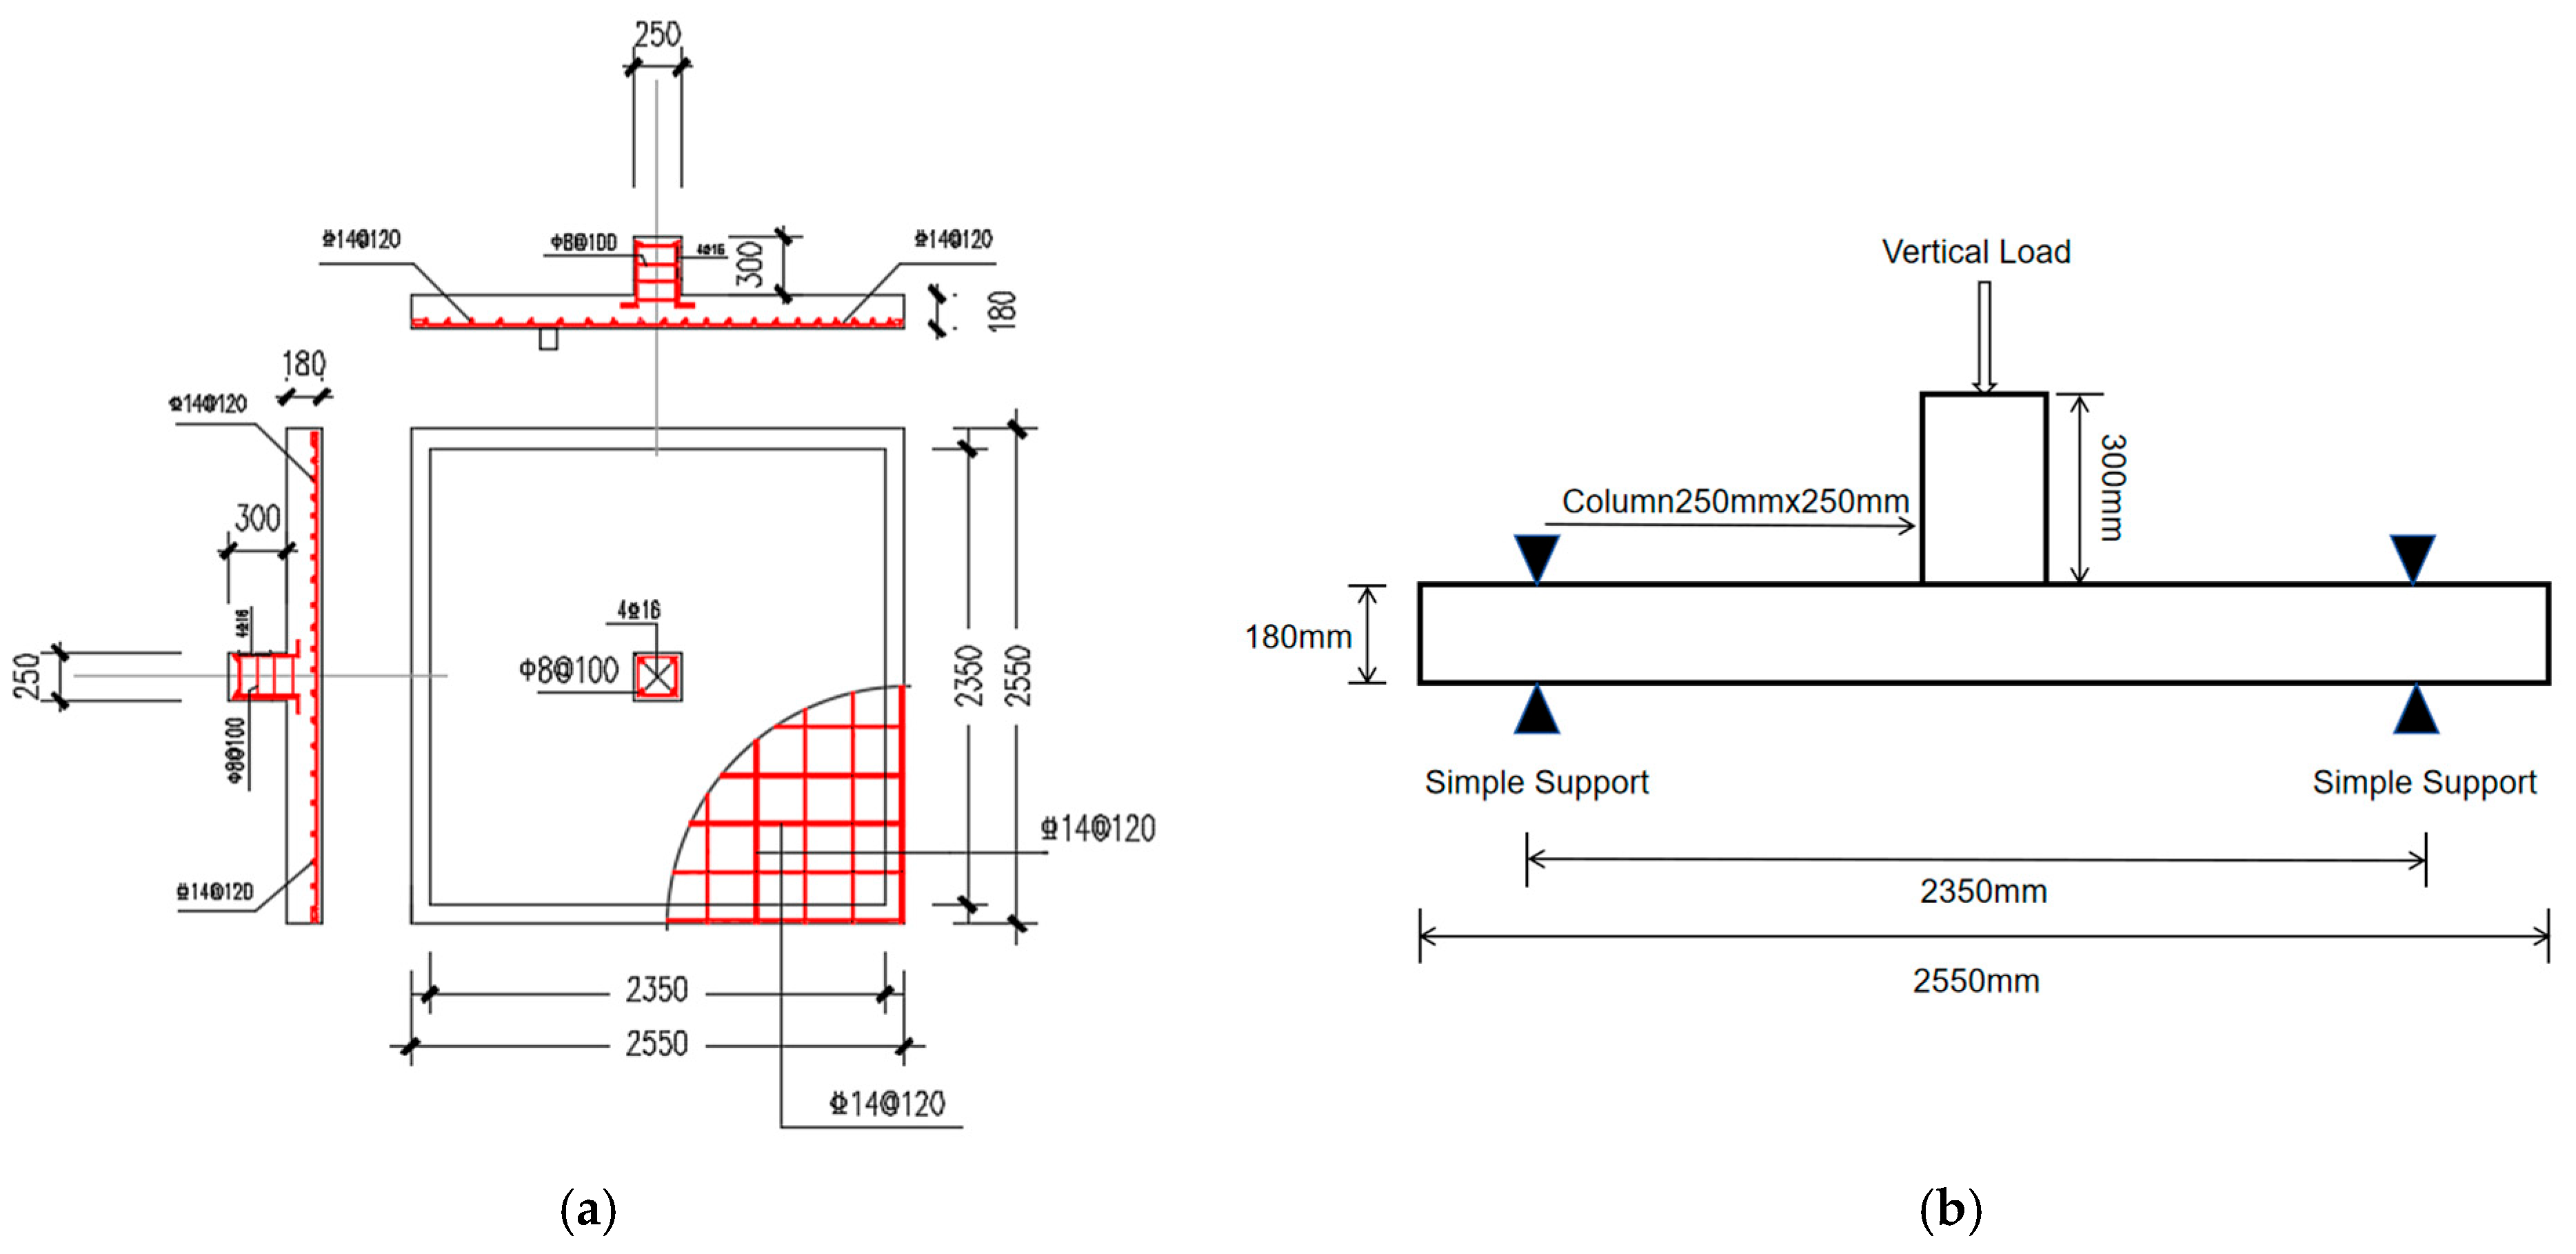
Figure 1. Dimensions and boundary conditions of specimens: (a) Details on the dimensions and reinforcement. (b) The boundary conditions and loading mode.
Buildings 15 02905 g001
Figure 2. Layout of specimen displacement measurement points and numbering.
Buildings 15 02905 g002
Figure 3. The three-dimensional degenerate virtual laminated solid element.
Buildings 15 02905 g003
Figure 4. Mesh division: (a) Concrete mesh model. (b) Rebar mesh model.
Buildings 15 02905 g004
Figure 5. Idealized uniaxial stress–strain curve of concrete.
Buildings 15 02905 g005
Figure 6. Idealized equi-biaxial compression curve of concrete.
Buildings 15 02905 g006
Figure 7. Ideal elastic–plastic model.
Buildings 15 02905 g007
Figure 8. Linear reinforced elastic–plastic model.
Buildings 15 02905 g008
Figure 9. Comparison of the damage pattern diagram of C7-30-3 with stress contour diagrams: (a) Diagram of the test damage pattern. (b) Contour plot of the third principal stress of the simulated member.
Buildings 15 02905 g009
Figure 10. Comparison of the damage pattern diagram of C7-70-1 with stress contour diagrams: (a) Diagram of the test damage pattern. (b) Contour plot of the third principal stress of the simulated member.
Buildings 15 02905 g010
Figure 11. Central load–displacement response of the slab: (a) C7-30-3; (b) C7-70-1.
Buildings 15 02905 g011
Figure 12. Load–displacement response in the middle of the slab: (a) C7-30-3; (b) C7-70-1.
Buildings 15 02905 g012
Figure 13. Load–displacement response in the corner of the slab: (a) Experimental load–displacement curve diagram of C7-30-3. (b) Simulated load–displacement curve diagram of C7-30-3.
Buildings 15 02905 g013
Figure 14. Load–displacement response in the corner of the slab. (a) Experimental load–displacement curve diagram of C7-70-1. (b) Simulated load–displacement curve diagram of C7-70-1.
Buildings 15 02905 g014
Figure 15. Schematic diagram of loading of finite element simulation: (a) Schematic diagram of 3D loading of simulated components. (b) Schematic diagram of the plan view of simulated components.
Buildings 15 02905 g015
Figure 16. Detailed diagram of the reinforcement of the slab–column joint component with concealed beam: (a) C (250 mm); (b) C+3 h (790 mm); (c) C+4 h (970 mm).
Buildings 15 02905 g016aBuildings 15 02905 g016b
Figure 17. Enlarged diagram of the loading failure mode of DJ-7-1.
Buildings 15 02905 g017
Figure 18. Stress contour diagram of DJ-11-1 (third principal stress).
Buildings 15 02905 g018
Figure 19. Stress curve diagram of DJ-11-1: (a) The bottom reinforcement of the slab. (b) The top reinforcement of the slab.
Buildings 15 02905 g019
Figure 20. Load–displacement curves of slabs with and without bottom reinforcement under different punch–span ratios.
Buildings 15 02905 g020
Figure 21. Load–displacement curves under different top/bottom reinforcement ratios.
Buildings 15 02905 g021
Figure 22. Load–displacement curves under different concealed beam widths.
Buildings 15 02905 g022
Figure 23. Load–displacement curves of specimens with concealed beams under different punch– span ratios.
Buildings 15 02905 g023
Table 1. The mechanical properties of steel reinforcement and concrete [18].
SpecimensConcrete Compressive Strength (MPa)Concrete Tensile Strength (MPa)Reinforcement
Yield Strength (MPa)
Reinforcement Ultimate Strength (MPa)
C7-30-335.562.82453.6611
C7-70-170.113.69453.6611
Table 2. Comparison between the test results and the finite element analysis results (at the center of the slab).
SpecimensMechanical PropertyExperimentalFE AnalysisDeviation
C7-30-3ultimate load (KN)690.01679.121.60%
ultimate displacement(mm)11.5011.034.26%
C7-70-1ultimate load (KN)605.50590.132.61%
ultimate displacement (mm)17.9518.311.97%
Table 3. Details of the model in the numerical study.
SpecimensL/mma/mmh0λConcrete StrengthTop Reinforcement of the SlabBottom Reinforcement of the SlabConcealed Beam width/mm
SJ-725502501507C3014@60-0
DJ-7-125502501507C3014@6014@600
DJ-7-1-25025502501507C3014@6014@60250
DJ-7-1-79025502501507C3014@6014@60790
DJ-7-1-97025502501507C3014@6014@60970
SJ-931502501509C3014@60-0
DJ-9-131502501509C3014@6014@600
SJ-11375025015011C3014@120-0
DJ-11-1375025015011C3014@12014@1200
DJ-11-1.5375025015011C3014@8014@1200
DJ-11-2375025015011C3014@6014@1200
DJ-11-1-790375025015011C3014@6014@60790
DJ-13-1-790375025015013C3014@6014@60790
a: Square column head size; h0: square column head size; λ: punch–span ratio. The naming of specimens follows the format “A-B-C-D”, where A: DJ (double-layer reinforcement) or SJ (single-layer reinforcement); B: punching shear–span ratio; C: ratio of top to bottom reinforcement (omitted for single-layer reinforcement); D: concealed beam width (omitted if no concealed beam is present).
Table 4. Numerical simulation results and failure mode determination.
SpecimensCracking Load/KNUltimate Load/KNFailure CharacteristicsStress Contour Plot CharacteristicsReinforcement Yield ConditionFailure Mode
SJ-7103.7555.75Sunken column headNo plastic hinge lineUnyieldedPunching shear
DJ-7-190.2580.1Sunken column headNo plastic hinge lineNeither the top nor the bottom of the slab has yieldedPunching shear
DJ-7-1-250100.2599.5Sunken column headThe column circumference 1/2 damage is obvious; no plastic hinge line UnyieldedPunching shear
DJ-7-1-790113.1774.9Sunken column head3/4 of the column circumference was significantly damaged; no plastic hinge line UnyieldedPunching shear
SpecimensCracking load/KNUltimate load/KNFailure characteristicsStress contour plot characteristicsReinforcement yield conditionFailure mode
DJ-7-1-970124.1883.6Sunken column headAround the column is clearly damaged; no plastic hinge line UnyieldedPunching shear
SJ-995.1480.1Sunken column headNo plastic hinge lineUnyieldedPunching shear
DJ-9-184.9499.9Sunken column headPartial plastic hinge linesNeither the top nor the bottom of the slab has yieldedFlexural–punching
SJ-1162.9336.7Column head crushed by inward sinking Obvious plastic hinge linesYieldFlexural
DJ-11-147.1351.4Column head crushed by inward sinkingObvious plastic hinge linesBottom of slab not yielding; top of slab yieldingFlexural
DJ-11-1.554.7405Column head crushed by inward sinkingObvious plastic hinge linesBottom of slab not yielding; top of slab yieldingFlexural
DJ-11-258.2447Column head crushed by inward sinkingPlastic hinge lines are evidentBottom of slab not yielding; top of slab yieldingFlexural
DJ-11-1-79089.1618.9Sunken column headPlastic hinge lines are evidentUnyieldedFlexural–punching
DJ-13-1-790142.3551.3Sunken column headPlastic hinge lines are evidentUnyieldedFlexural–punching
Plastic hinge lines: idealized lines of concentrated plastic deformation formed in reinforced concrete slab–column joints under ultimate loads. These lines represent the failure mechanism where bending moments exceed the section’s capacity, leading to the formation of a kinematic collapse mechanism.
Disclaimer/Publisher’s Note: The statements, opinions and data contained in all publications are solely those of the individual author(s) and contributor(s) and not of MDPI and/or the editor(s). MDPI and/or the editor(s) disclaim responsibility for any injury to people or property resulting from any ideas, methods, instructions or products referred to in the content.