Article

Effects of Carbonation Conditions and Sand-to-Powder Ratio on Compressive Strength and Pore Fractal Characteristics of Recycled Cement Paste–Sand Mortar

School of Transportation and Civil Engineering, Nantong University, 9 Seyuan-ro, Chongchuan Gu, Nantong 226019, China
*
Authors to whom correspondence should be addressed.
Buildings 2025, 15(16), 2906; https://doi.org/10.3390/buildings15162906 (registering DOI)
Submission received: 21 July 2025 / Revised: 10 August 2025 / Accepted: 15 August 2025 / Published: 17 August 2025

Abstract

This study investigates the influence of carbonation duration and sand-to-powder ratio on the compressive strength and pore structure of recycled cement paste–sand (RCP-S) mortar. Specimens incorporating four different sand contents were subjected to carbonation for 1 and 24 h. Fractal dimensions, ranging from 2.60159 to 3.86742, indicated increased pore complexity with extended carbonation exposure. Mercury intrusion porosimetry (MIP) and scanning electron microscopy (SEM) were employed to characterize pore features, including volume, surface area, and diameter. A Menger sponge-based fractal model was applied to compute the fractal dimensions and investigate their relationships with microstructural parameters and mechanical performance. Results showed that prolonged carbonation markedly reduced macropores and large capillary pores, enhanced fine pore content, and improved overall pore connectivity. Fractal analysis revealed that Segments I and IV exhibited the most significant fractal characteristics. The fractal dimension demonstrated exponential correlations with pore diameter; quadratic relationships—with superior statistical performance—with porosity, surface area, and pore volume; and a power–law relationship with compressive strength. These findings highlight the potential of fractal parameters as effective indicators of pore structure complexity and mechanical performance. This study offers a quantitative basis for optimizing pore structure in recycled cementitious materials, promoting their sustainable application in construction.

1. Introduction

Ordinary Portland cement (OPC) concrete remains one of the most widely used construction materials globally. However, its production is associated with high energy consumption and significant carbon dioxide (CO2) emissions. The cement industry alone accounts for approximately 8% of global annual CO2 emissions [1,2], primarily due to the calcination of limestone during clinker production, which contributes nearly 60% of the sector’s total emissions [3,4,5]. These emissions are widely recognized as a major contributor to anthropogenic climate change. Therefore, reducing clinker consumption and implementing CO2 capture during production are essential measures for advancing carbon neutrality and meeting the 1.5 °C climate target set by the Paris Agreement.
Construction activities such as building demolition, road rehabilitation, and concrete production inevitably generate large volumes of waste concrete. This material is often processed into recycled aggregates, from which recycled cement paste (RCP) can be recovered. Recycled cement paste typically contains residual hydrated and unhydrated phases, including calcium hydroxide (Ca(OH)2, CH), calcium silicate hydrate (C–S–H, Ca5Si6O16(OH)·4H2O), ettringite, and unreacted cement clinker. To improve its mechanical properties for engineering applications, sand is commonly added to form recycled cement paste with sand (RCP-S), a composite material with enhanced applicability. Under carbonation conditions, the active components in RCP-S react with CO2 to form calcium carbonate (CaCO3, predominantly as calcite) and amorphous silica gel (SiO2·nH2O). These carbonation products effectively occupy internal pore spaces, refine the microstructure, and contribute to long-term CO2 sequestration [6,7]. Additionally, the SiO2·nH2O generated exhibits pozzolanic reactivity, enabling further reaction with CH to form secondary C–S–H gel during continued curing, thereby enhancing microstructural connectivity [8,9]. The precipitation of CaCO3 also provides nucleation sites for the formation of additional hydration products, further improving mechanical strength [10]. These mechanisms collectively suggest that carbonated RCP-S can partially restore the binding capacity of recycled cementitious systems and offer promise as a sustainable substitute for conventional binders in construction applications [11].
The use of recycled sand in the form of RCP-S mortar provides a dual environmental benefit. First, it reduces the need for natural sand extraction, thereby conserving natural resources and minimizing energy-intensive aggregate mining processes. Second, by utilizing recycled fine materials instead of cement or clinker-based binders, it contributes to a direct reduction in CO2 emissions associated with cement manufacturing. These benefits are particularly significant given that cement production accounts for nearly 8% of global CO2 emissions. Therefore, RCP-S mortar offers a sustainable approach to both waste valorization and embodied carbon reduction in concrete construction. Recycled cement paste with sand (RCP-S) mortar, primarily derived from waste concrete and construction debris, has garnered increasing attention in recent years due to its environmental benefits and potential contributions to sustainable construction practices. Previous studies have demonstrated that RCP-S can serve as a partial substitute for cement in concrete mixtures, effectively reducing CO2 emissions and decreasing the reliance on virgin raw materials for cement production [6,7]. Research has also focused on the physicochemical properties of RCP-S mortar produced under various processing and treatment regimes. Findings suggest that optimizing particle size distribution and enhancing the surface reactivity of the recycled micro-powders can substantially improve both the mechanical strength and durability of the resulting composites. Among the key factors affecting the performance of RCP-S mortar, the sand-to-powder ratio plays a particularly critical role in governing its pore structure. An appropriate increase in this ratio has been shown to promote matrix densification, reduce the prevalence of large capillary pores, and consequently enhance compressive strength and durability characteristics [12]. Given its widespread availability, low cost, and favorable environmental profile, RCP-S mortar represents a promising strategy for valorizing construction waste while mitigating the ecological footprint of conventional concrete production [13]. Furthermore, recent advances have explored various modification techniques—such as alkali activation and thermal treatment—to improve the reactivity and cementitious behavior of RCP-S mortar. These approaches have demonstrated potential to further expand the material’s applicability and support the development of sustainable alternatives to traditional cement-based materials [14].
Although carbonation has been shown to promote microstructural densification in cement-based materials [15], recycled cement paste (RCP) often retains residual sand particles. This retention arises from physicochemical adhesion, particle size heterogeneity, and electrostatic interactions, all of which may negatively impact the material’s mechanical performance. As a result, achieving sufficient strength in RCP-based composites for structural applications remains a critical challenge. Addressing this issue requires a more comprehensive understanding of the interrelationship between micropore characteristics and the mechanical behavior of RCP composites.
The strength characteristics of RCP-S composites are intrinsically linked to their pore structure, as deformation, damage, and failure may occur across multiple length scales, including macro-, meso-, micro-, and nanoscales. Pores are typically classified into gel pores (<10 nm), fine capillary pores (10–50 nm), medium capillary pores (50–100 nm), large capillary pores (100 nm–10 μm), and macropores (>10 μm). Each category of pore plays a distinct role in determining the strength, density, and permeability of the material, all of which are crucial to its overall performance. Accurate characterization of these pore structures is essential for elucidating the material’s behavior. Several techniques are available for pore structure analysis, including scanning electron microscopy (SEM), nuclear magnetic resonance (NMR), nitrogen adsorption/desorption (NAD), small-angle X-ray scattering (SAXS), and mercury intrusion porosimetry (MIP) [16,17,18,19]. Scanning electron microscopy is effective for identifying the geometry and distribution of pores larger than 10 μm, while NMR and NAD are more suitable for analyzing pores smaller than 0.1 μm. Small-angle X-ray scattering (SAXS) is particularly valuable for studying pores smaller than 30 nm. Among these, MIP offers a broad pore size characterization range, from 0.005 μm to 750 μm, enabling a comprehensive analysis of the pore structure. Despite its wide applicability, MIP has recognized limitations. First, the high pressure involved in the intrusion process may damage the pore structure, leading to inaccurate results. Second, ink-bottle-shaped pores can cause measurement artifacts and misrepresentation of true pore connectivity [20,21]. To address these issues, solvent-exchange pretreatment has been proposed and shown to be effective in minimizing pore collapse and improving measurement accuracy during MIP testing [22,23]. This approach has been particularly beneficial for the characterization of RCP-S mortar. With the incorporation of solvent-exchange pretreatment, MIP has been shown to reduce measurement artifacts and remains a practical method for characterizing the pore structure of RCP-S mortar across a wide pore size range [24].
Previous research has demonstrated that recycled cement paste with sand (RCP-S) mortar exhibits a wide range of irregular pore diameters and morphologies, resulting in highly complex pore structures. In conventional Euclidean geometry, pore dimensions are defined using integer-based measures, which limits the accurate characterization of such irregular features. To overcome this, fractal theory, initially proposed by Mandelbrot, has been increasingly applied to describe the pore structures of cement-based composites with greater precision. The use of fractal dimensions enables the quantification of pore geometry complexity through mathematical approaches, thereby addressing the limitations inherent in traditional geometric descriptors. Fractal dimensions have been shown to align well with the heterogeneous and multiscale characteristics of real material systems. Recent studies [25] have confirmed that pore area, volume, and shape exhibit pronounced fractal behavior and are closely associated with the macroscopic performance of cementitious materials.
The pore network within an RCP-S composite is inherently disordered, making it difficult to fully characterize using conventional parameters such as total porosity, cumulative pore volume, or pore size distribution. To address this challenge, fractal analysis offers an effective framework for quantifying and comparing the structural complexity of composite pore networks. It has been reported that cementitious composites contain numerous pores and microcracks spanning multiple scales, which collectively form sponge-like porous structures. The Menger sponge model, a mathematical construct developed to represent fractal porous materials, has proven especially relevant for simulating adsorption, diffusion, and transport processes in such systems [26,27,28]. Due to the similarity between the fractal characteristics of the Menger sponge and the measurement principles underlying MIP, this model provides a useful analytical tool for simulating and interpreting the pore structures of RCP-S mortar composites.
In earlier research, Khelafi et al. [29] investigated the hydration behavior and interfacial characteristics of reclaimed cement slurry and mortar using various microscopic characterization techniques. Their findings provided valuable theoretical insights for optimizing mix proportions and pretreatment methods. Sui et al. [30] reported that waste concrete powder subjected to thermal treatment at 700 °C exhibited optimized particle size distribution and enhanced hydration activity. This treatment yielded the highest activity index among the tested samples, suggesting its potential as an efficient mineral admixture for mortar.
Although relatively few studies have focused specifically on RCP-S, a number of investigations on RCP offer important references for understanding RCP-S behavior. For example, Zhao et al. [31] employed a machine learning model to analyze MIP data from 204 RCP composite specimens and successfully predicted their compressive strengths. Kong et al. [32] examined the microstructure, hydration process, and mechanical performance of composites containing recycled micro-powders. Similarly, Hoang [33] applied a hybrid machine learning model to predict the compressive strength of roller-compacted concrete incorporating recycled aggregates, demonstrating that the gradient boosting algorithm could achieve strength predictions with less than 8% error. Several additional studies have explored the effects of recycled aggregates on concrete performance. Li et al. [34] investigated how recycled aggregates influence strength, durability, and workability, while Khan et al. [35] compared the effects of different types of recycled aggregates on mechanical performance, long-term durability, and economic viability. Hossain et al. [36] analyzed the sustainability of recycled aggregate concrete by evaluating aggregate properties, mix design, and curing conditions, as well as assessing its environmental impact. Wang et al. [37] studied the influence of recycled fine aggregates on strength, crack resistance, and durability, and Kumar et al. [38] reviewed how recycled concrete aggregates affect the microstructure and mechanical properties of concrete. In addition, Clark et al. [39] evaluated the applicability of fractal models for describing the pore structure of recycled concrete and discussed their relationship with material performance, although fractal theory was not explicitly applied in their modeling.
However, existing research has predominantly focused on concrete-based systems, whereas the evolution mechanisms of pore fractal characteristics in RCP-S mortar—particularly under high sand-to-powder ratios—remain insufficiently understood. To address this knowledge gap, the present study investigates the mechanical properties and pore structures of RCP-S mortar subjected to varying carbonation durations and sand-to-powder ratios. Compressive strength testing and mercury intrusion porosimetry (MIP) were conducted to assess porosity, pore volume, pore diameter, and fractal characteristics in both RCP-S mortar and RCP micro-powder specimens. To calculate fractal dimensions, the Menger sponge model was applied, and appropriate curve segments were selected for dimensional analysis. Regression analyses were performed to quantify the relationships between fractal dimensions and pore structure parameters, followed by multiple function fitting to evaluate the observed correlations. A mathematical model was subsequently developed to link pore structural characteristics with compressive strength, and its statistical significance was verified using t-tests and F-tests.
Compared with existing studies on recycled cementitious materials, the innovations of this work lie in two aspects. First, it introduces a coupled parameter system involving both carbonation time and sand-to-powder ratio, allowing systematic control of microstructural densification in RCP-S mortar. This contrasts with prior studies that typically vary only one factor. Second, this study employs a fractal modeling approach based on the Menger sponge to quantify pore structure complexity, enabling a deeper understanding of how carbonation-induced densification mechanisms influence strength development. These advantages provide new insight into designing low-carbon, high-performance recycled cement mortar through process parameter optimization.
2. Materials and Experimental Methods

2.1. Experimental Materials

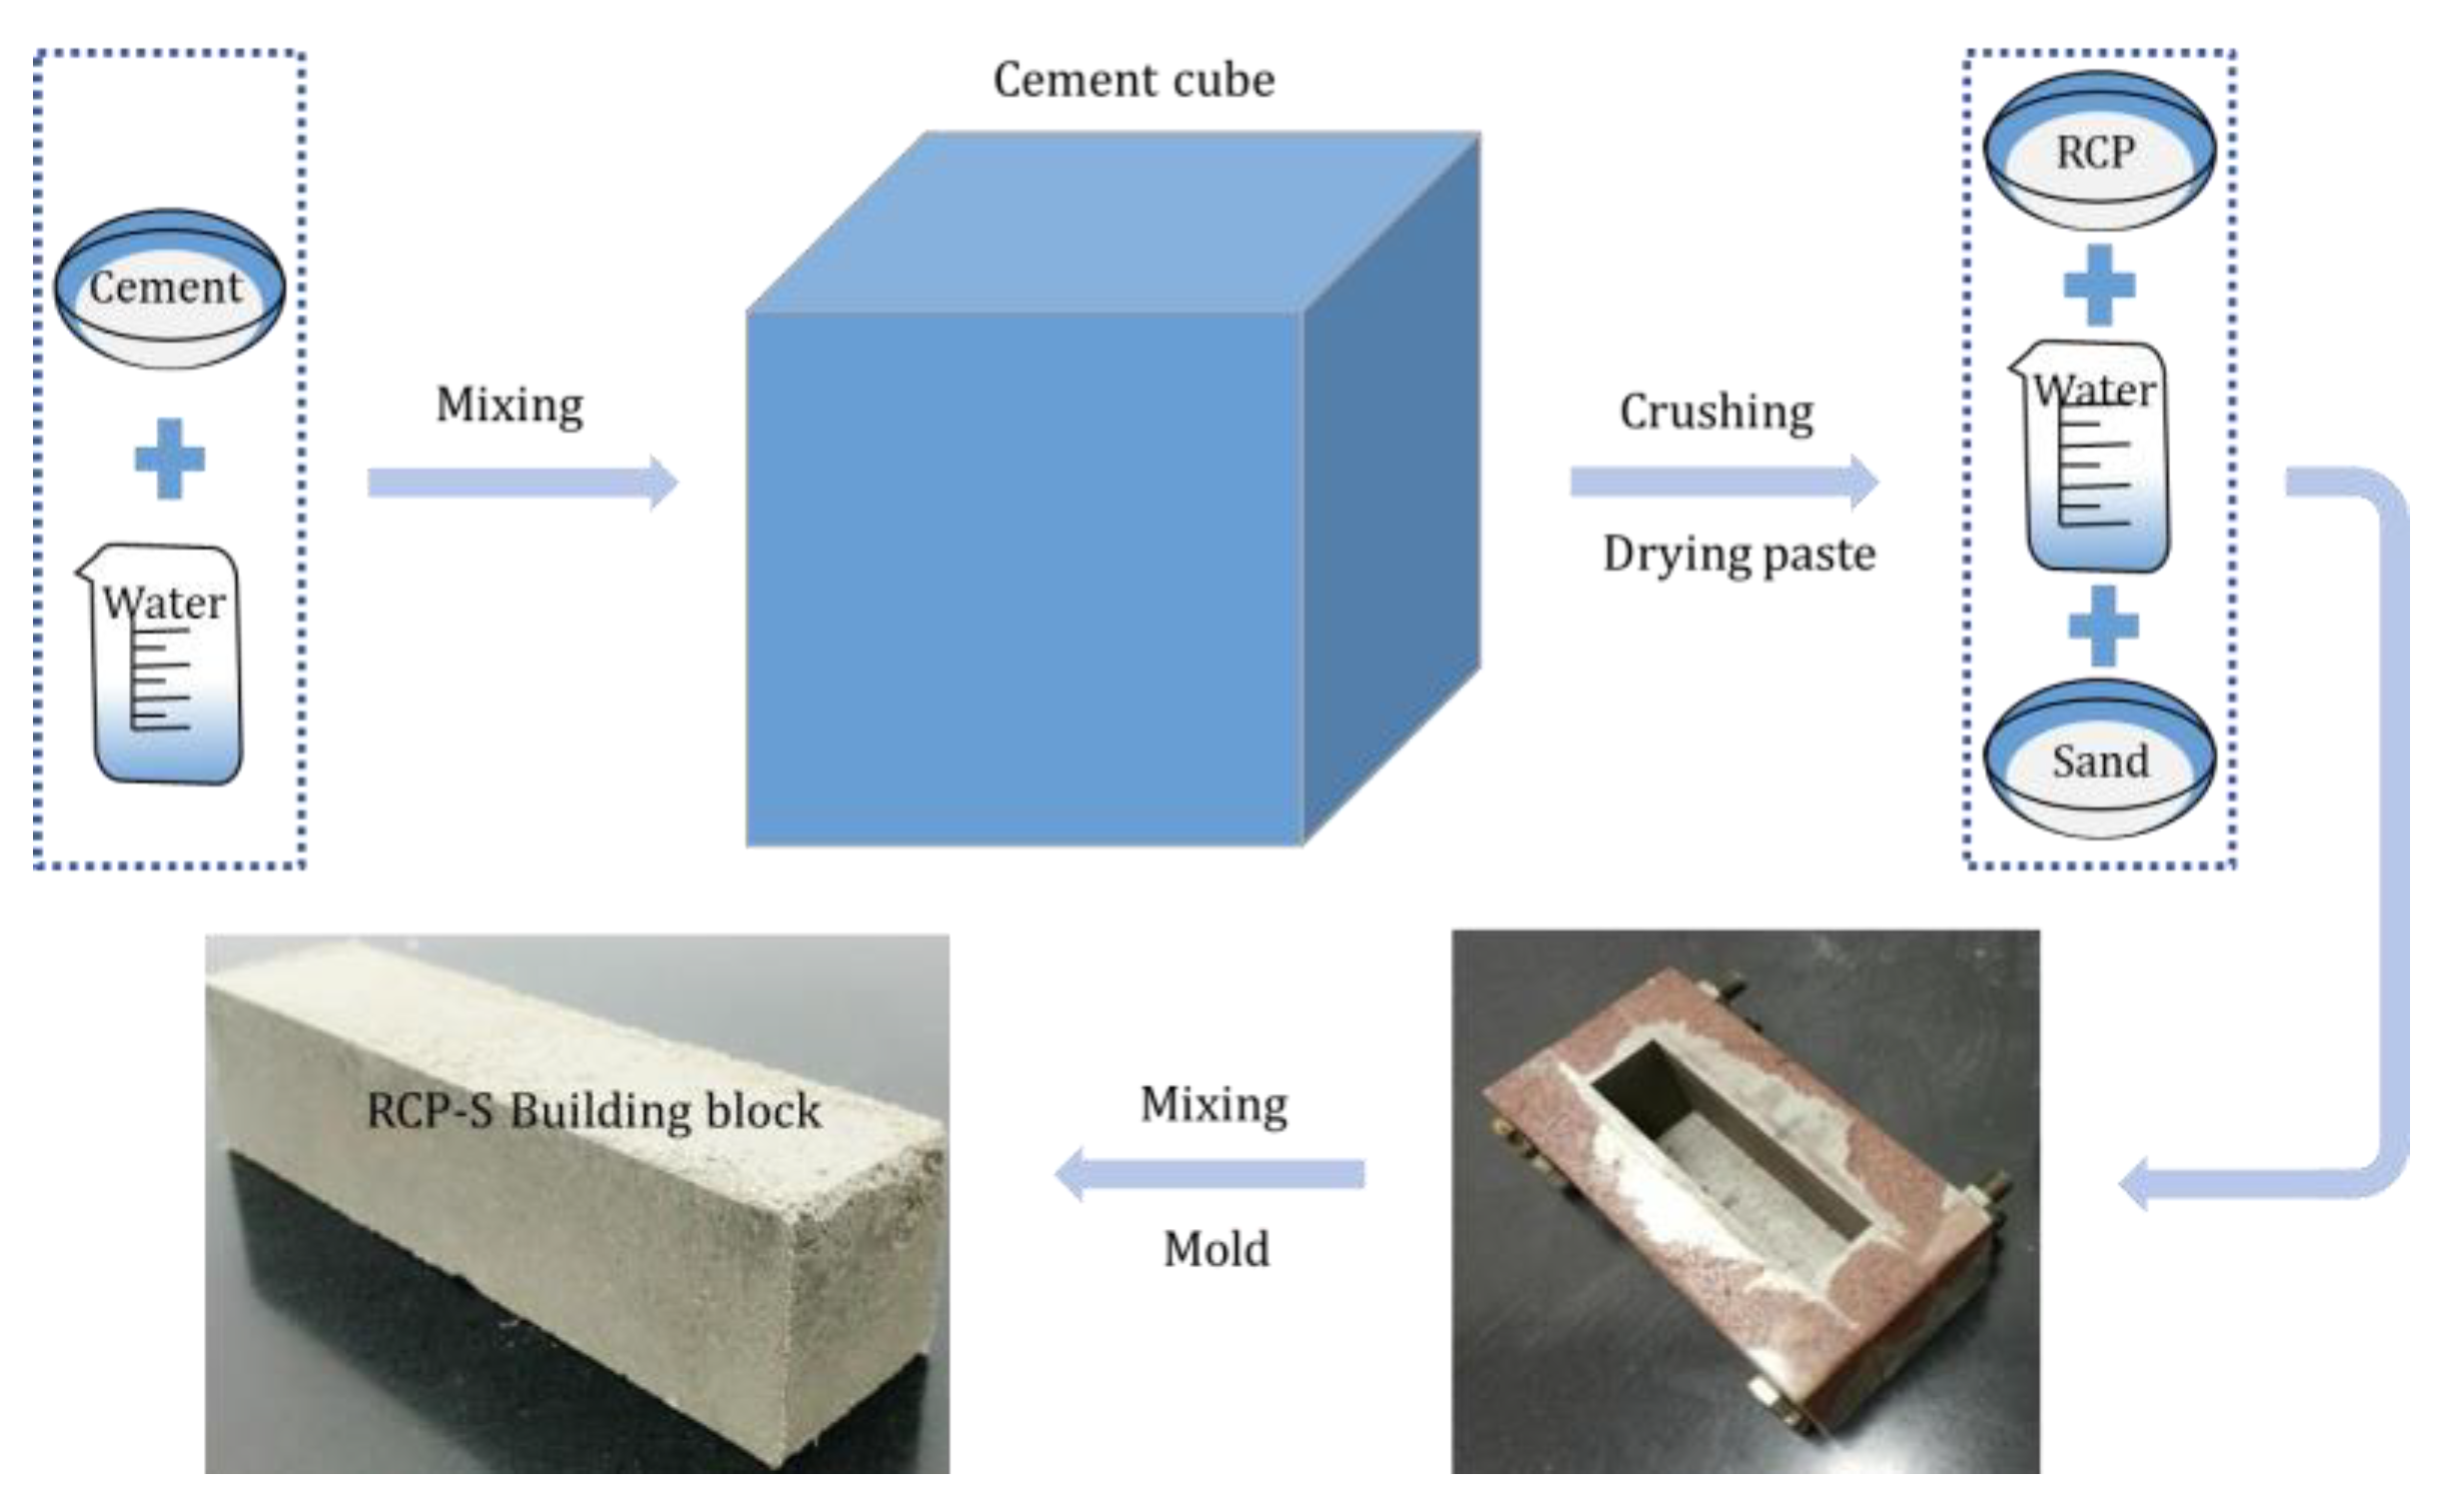
The RCP-S used in this study was prepared in the laboratory by mixing P·II 42.5 cement with deionized water at a water-to-cement ratio of 0.5. Cement cubes were cast, cured under standard conditions for 24 h, and then demolded, crushed, and subjected to steam curing at 60 °C for 30 days to ensure a hydration degree above 90%. The hydrated fragments were subsequently oven-dried at 60 °C for 10 h and ground using a Micron-MZ10 vibrating mill (Qingdao Maikelong Powder Technology Equipment Co., Ltd.) for 2 h to obtain the RCP powder. The resulting RCP powder exhibited a median particle size (D50) of approximately 17.6 μm and a Blaine fineness of about 420 m2/kg. The chemical composition and basic physical properties of the cement are summarized in Table 1 and Table 2, as determined in accordance with ASTM C188-17 [40], ASTM C1437 [41], and ASTM C109/C109M-16a standards [42].
The fine aggregate employed in the mortar specimens was Liuhe River sand from Nanjing, with a particle size of less than 1.25 mm. This sand was processed through washing, drying, and sieving prior to use. River sand was selected instead of standard sand to better simulate the typical composition of actual RCP-S. The choice of a particle size below 1.25 mm was based on two main considerations: first, this size is appropriate for screening waste concrete, facilitating separation without yielding excessive coarse particles; second, it is suitable for the dimensions of the test specimens, whose minimum cross-sectional size was 30 mm.
Carbonation was performed using high-purity carbon dioxide gas (99.5%), which was supplied by Nanjing Changyuan Industrial Gas Co., Ltd.

2.2. Preparation and Curing Methods

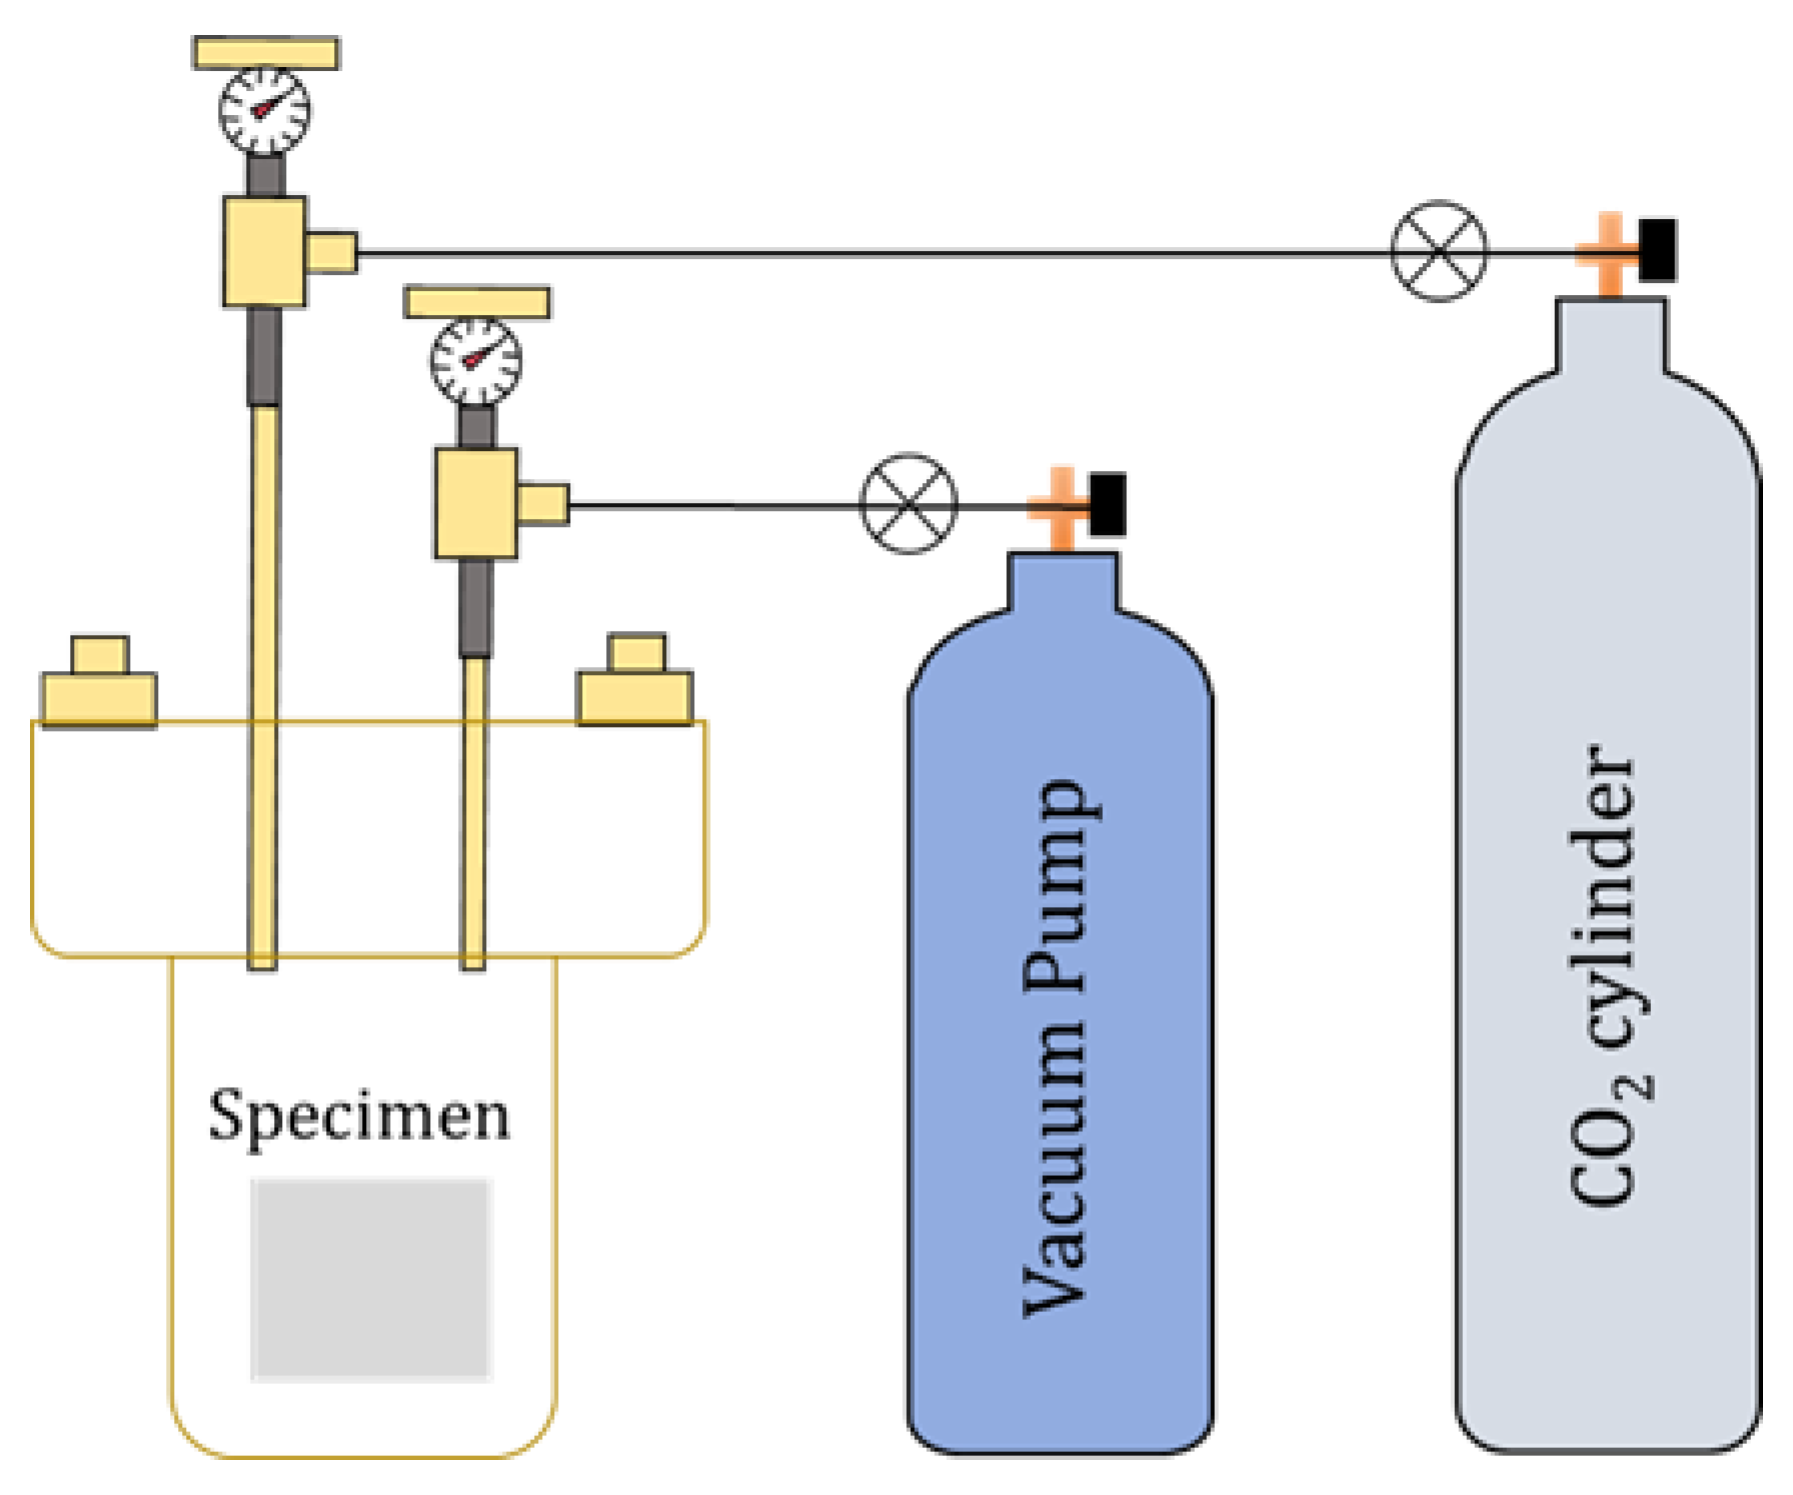
Figure 1 illustrates the procedure used to prepare the RCP-S mortar specimens. Initially, cement cubes were cast using a water-to-cement ratio of 0.5 and P·II 42.5 cement. These cubes were cured at 20 ± 2 °C under a relative humidity of 95% for 24 h. After demolding, the cubes were crushed to obtain particles with a maximum diameter of 10 mm. The resulting fragments were immersed in water and then subjected to steam curing at 60 °C for 30 days to ensure that the hydration degree of P·II 42.5 cement reached at least 90%, thereby satisfying the conditions required for simulating RCP-S mortar. The hydrated particles were oven-dried at 60 °C for 10 h and subsequently ground for 2 h using a Micron-MZ10 vibrating mill to produce the RCP-S powder. This powder was then mixed with fine sand at sand-to-powder ratios of 0, 1, 1.5, and 2, using a constant water-to-powder ratio of 0.3. The mixtures were compacted into 120 × 30 × 30 mm molds using a compression testing machine at 20 MPa for 60 s. After demolding, the specimens were transferred to a curing chamber maintained at 20 ± 3 °C and 70% relative humidity, where they remained for approximately 48 h until reaching a constant mass. This preparation method has been widely employed in pore structure studies of cementitious materials to preserve the integrity of delicate gel and capillary pore networks [22]. The application of isopropanol effectively replaces pore water while minimizing shrinkage and avoiding continued hydration. Subsequent vacuum drying enhances the removal of residual solvents, particularly from finer pores. Previous studies have confirmed that this combined protocol maintains accessibility to pores at the nanometer scale and yields MIP data comparable to those obtained through cryogenic drying techniques [23]. Therefore, the test results obtained in this study are considered to represent the intrinsic pore structure of the materials with minimal artifacts introduced during sample preparation. Each specimen was subjected to carbonation prior to testing. Figure 2 presents a schematic diagram of the carbonation apparatus. During the carbonation process, the temperature inside the chamber was recorded every minute, with an accuracy of ±0.4 °C.
The carbonation process was carried out as follows. First, a wire mesh was placed at the bottom of the carbonation chamber, and the pre-cured RCP-S mortar specimens were arranged within the carbonation kettle, ensuring adequate spacing between samples. The kettle was then positioned in a stirred water tank maintained at 20 ± 1 °C to facilitate rapid cooling. Second, the intake valve was closed, and a vacuum pump was used to evacuate the kettle to a pressure of −0.09 MPa, after which the exhaust valve was closed. Third, high-purity carbon dioxide gas (99.5%) was introduced into the chamber at an injection rate of 0.1 MPa per minute until the target pressure of 0.4 MPa was reached. This injection rate was selected to avoid excessive supersaturation and to ensure uniform CO2 diffusion, as recommended in related carbonation studies [23]. The intake valve remained open to maintain a stable internal pressure throughout the carbonation period. Finally, once the predetermined carbonation duration was achieved, the intake valve was closed, and the exhaust valve was opened to gradually release the pressure to atmospheric level. The specimens were then removed for subsequent testing.
Previous research has shown that the degree of cement carbonation approaches 50% after one hour of exposure, and that the strength of recycled concrete powder increases at a slower rate when the carbonation time exceeds 24 h or the applied pressure surpasses 0.4 MPa [43]. Considering the safety constraints of the equipment, operational feasibility, and practical applicability, a CO2 pressure of 0.4 MPa and carbonation durations not exceeding 24 h were adopted in this study. Accordingly, four groups of specimens with sand-to-powder ratios of 0, 1, 1.5, and 2 were carbonated for either 1 or 24 h to investigate the influence of sand content and carbonation duration on pore structure and mechanical properties.
To minimize the influence of external factors and better isolate the effects of carbonation duration and sand-to-powder ratio, all specimens were prepared using identical raw materials, mixing proportions, and curing methods. The carbonation process was conducted under tightly controlled environmental conditions, with a constant temperature of approximately 20 degrees Celsius, relative humidity maintained at 70 percent, high-purity carbon dioxide at 99.5 percent, and a fixed pressure of 0.4 MPa, ensuring consistent exposure across all samples. Although interactions between pore structure evolution and mechanical performance may exist, this study was designed to examine each variable independently. Future research will explore these coupled effects through factorial experiments and multivariable analysis.
The parameters associated with each mortar specimen are summarized in Table 3. The specimen nomenclature follows a consistent format: the first number denotes the sand-to-powder ratio, the second indicates the applied CO2 pressure (in MPa), and the third represents the carbonation time (in hours). For example, P0-0.4-24 refers to a pure recycled cement paste specimen carbonated under 0.4 MPa pressure for 24 h, while P1-0.4-24 refers to an RCP-S mortar specimen with a sand-to-powder ratio of 1 under the same pressure and duration. The 1 h duration was selected to capture the early-stage carbonation behavior, while the 24 h duration represents a more complete reaction [43]. These two time points were chosen based on existing literature, which indicates that carbonation progresses rapidly within the first few hours and slows significantly after 24 h. Although intermediate durations such as 12 or 48 h were not included in this study, we acknowledge their potential value and will consider them in future work.
In this study, a non-carbonated control group and the P0-0.4-1 sample were not included. This decision was based on findings from previous carbonation studies, which have shown that at a carbonation duration of 1 h, the reaction is still in its incipient stage, with negligible formation of CaCO3 or other crystalline products. Therefore, specimens subjected to 1 h carbonation, particularly those in the P1–P2 series, can effectively reflect the pre-carbonation microstructure and strength characteristics. This approach has also been adopted in prior research to characterize baseline conditions of recycled cementitious composites before carbonation proceeds significantly [24].

2.3. Test Methods

2.3.1. Dry Shrinkage

Dry shrinkage in cementitious composites is primarily driven by the loss of water from fine pores—particularly gel pores smaller than 10 nm—rather than from larger capillary voids. These nanoscale pores generate higher capillary tension during drying, which significantly contributes to volumetric deformation [44,45,46]. As a result, the pore structure at the nanoscale plays a critical role in controlling shrinkage behavior. Excessive volumetric deformation can lead to temperature- or shrinkage-induced cracking, which in turn may cause leakage, reinforcement corrosion, and other structural deficiencies. These effects compromise the overall integrity, load-bearing capacity, and long-term durability of concrete structures. Compared to conventional cement-based materials, RCP-S mortar typically exhibits higher porosity and greater water absorption, making it more susceptible to shrinkage-related deformation [44,45,46]. Given these characteristics, the internal structure of RCP-S mortar is likely to be affected by volume changes that occur both during carbonation and subsequent dry curing. When the expansion or shrinkage of the material exceeds certain limits, cracking may occur, potentially reducing structural performance. Therefore, further investigation is warranted to quantify the volumetric deformation of RCP-S mortar following carbonation and drying, in order to better understand its impact on mechanical stability and durability.
(1)
Volume Change
During the carbonation process, the hardened RCP-S powder within the mortar specimens reacts with carbon dioxide to form calcium carbonate (CaCO3), amorphous silica gel (SiO2·nH2O), and free water. The volume mismatch between reactants and products induces volumetric changes in the specimens. When such deformation remains below a critical threshold, it has minimal impact on the overall performance of the material. However, exceeding this threshold can lead to cracking, thereby compromising mechanical strength and durability. To quantify these changes, the dimensions of each RCP-S mortar specimen—including length, width, and height—were measured before and after carbonation using a dial gauge with a precision of 0.1 mm. Two specimens were selected from each group for this analysis.
(2)
Shrinkage Testing
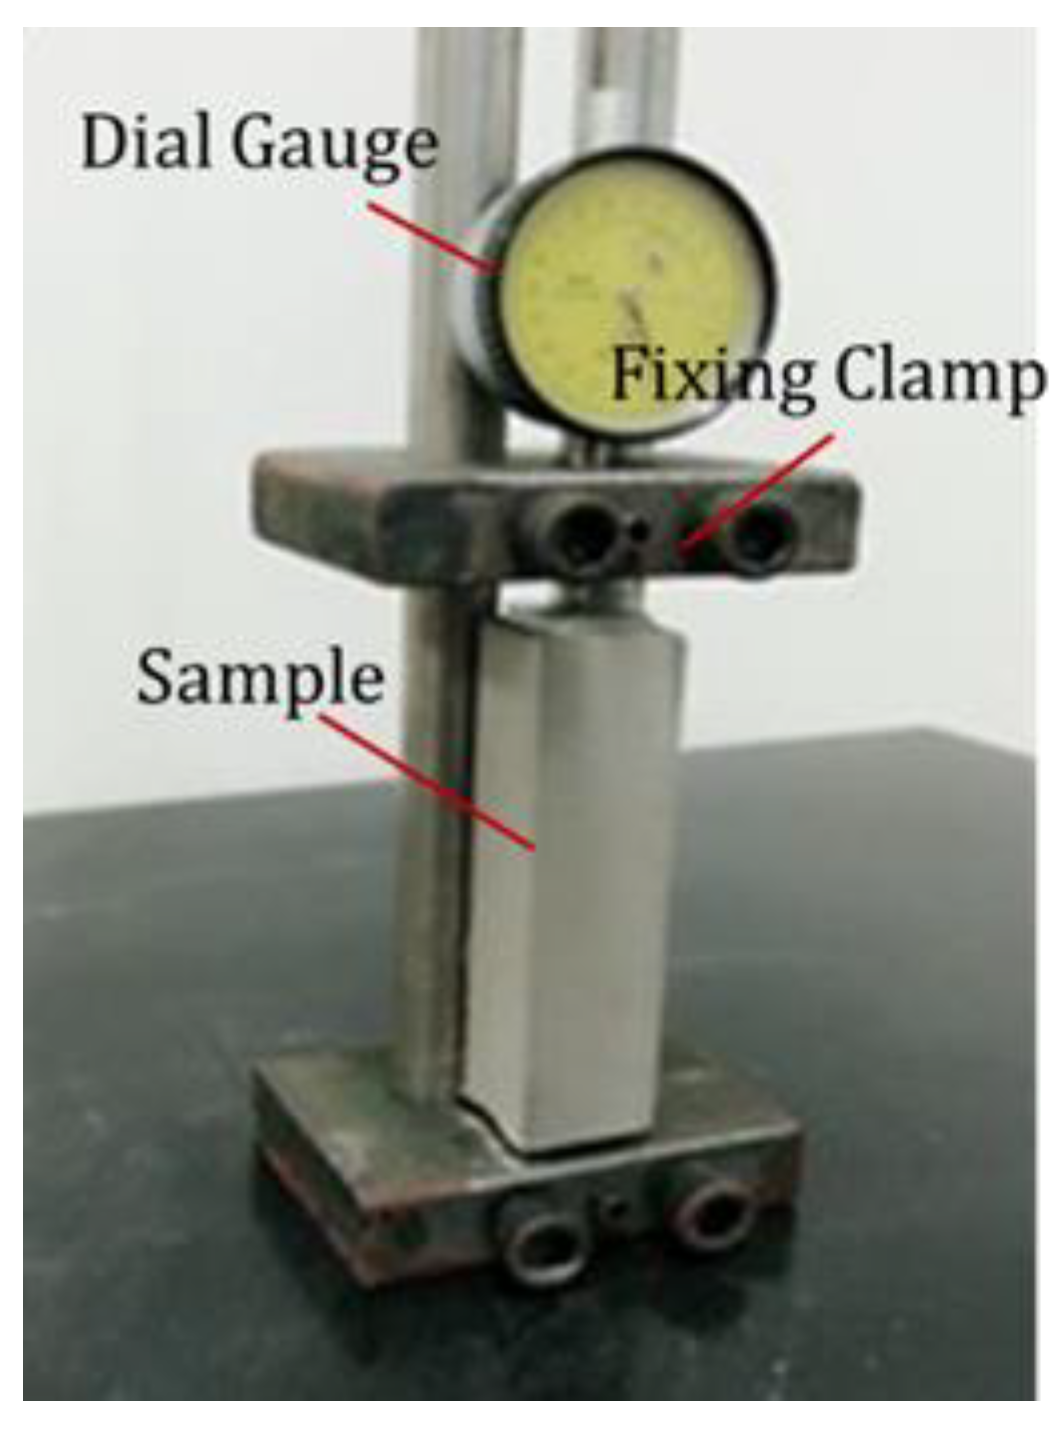
The shrinkage testing in this study was conducted using the direct measurement method proposed by the Japan Concrete Institute. This method involves direct contact between a dial gauge and the specimen surface to determine absolute length changes. The initial length (L0) of each mortar specimen was measured immediately after carbonation using a caliper. The specimen was then placed in a custom-designed shrinkage measurement apparatus, as illustrated in Figure 3. This device consisted of acrylic plates fixed to both ends of the specimen to prevent the dial gauge from damaging the surface, thereby minimizing potential measurement errors. The assembled measurement setup was transferred to a controlled curing chamber maintained at 20 ± 3 °C and 50 ± 4% relative humidity. The curing time was recorded from the moment the specimen was introduced into the chamber. At each designated time interval t, the specimen length (Lₜ) was recorded using the dial gauge. The dry shrinkage strain at time t was then calculated with a precision of 0.01 using the following expression:
S t = L 0 L t L 0   ×   100
Here, St is the linear drying shrinkage rate (%), L0 is the initial length of the mortar specimen measured after demolding and 24 h standard curing (mm), and Lt is the length at a given age during the drying process (mm).
Three specimens were selected from each group for shrinkage testing. As an example, for specimens carbonated for 24 h under a CO2 pressure of 0.4 MPa, dry shrinkage measurements were performed on the P1-0.4-24, P1.5-0.4-24, and P2-0.4-24 groups. Shrinkage tests were not conducted on specimens exposed to carbonation curing conditions for only 1 h, as their microstructures were not yet stabilized, and dimensional changes during early-stage carbonation were found to be highly unstable and unreliable [47].

2.3.2. Specimen Strength

Due to the absence of standardized procedures for determining the compressive strength of hardened cement paste mortar specimens, the carbonated RCP-S mortar specimens were tested with reference to ISO 679:2009 [48], which specifies the method for determining the strength of cement. Three specimens from each group were tested using an NYL-300D pressure testing machine (Quanzhou Keshuo Instrument Co., Ltd.), and the average value was reported as the representative compressive strength for each group.

2.3.3. MIP Analysis

A widely adopted technique for pore structure analysis in cementitious materials, MIP offers a theoretical measurement range of approximately 5 nm to 200 μm. The method is particularly sensitive to larger pore features, making it especially valuable for evaluating the strength and durability of cement-based composites. The accuracy of this technique is, however, limited by pore accessibility. It is incapable of detecting closed pores or ink-bottle-shaped pores with narrow necks and often underestimates the volume of larger pores that are difficult to access. These limitations are especially critical when analyzing pore systems with irregular connectivity or tortuous geometries. Despite these drawbacks, the method remains well-suited for investigating capillary pore structures in RCP-S mortar, particularly when combined with careful sample preparation procedures designed to minimize ink-bottle effects and preserve internal pore networks [20,21].
Pore structure characterization was performed using a PoreMaster GT60 high-performance automatic mercury porosimeter (Shanghai Sibij Instrument System Co., Ltd.), which operates within a pressure range of 0.007–350 MPa (1–50,000 psi) and employs a contact angle of 140°. Prior to testing, each specimen was placed in a sealed chamber, and residual surface gases were evacuated. Pressure was then applied incrementally, and the corresponding mercury intrusion volumes were recorded. The high surface tension of liquid mercury inhibits spontaneous penetration into the pore structure of RCP-S mortar. As pressure increases, mercury is progressively forced into accessible pores, enabling detailed characterization of pore features based on the intrusion volume measured at different pressure levels.
To minimize the influence of the ink-bottle effect during MIP testing, particular attention was given to sample preparation. Thorough solvent exchange and vacuum drying were performed to ensure the complete removal of residual water or solvents from narrow pore necks. This approach helped prevent artificial closure or obstruction of capillary constrictions, thereby enabling mercury to reach deeper pore cavities during intrusion. In the subsequent data analysis, emphasis was placed on evaluating threshold and most probable pore diameters rather than relying solely on cumulative pore size distributions. This strategy helped reduce the impact of neck-dominated artifacts and enhanced the reliability of the interpreted pore structure characteristics. Collectively, these measures contributed to improving the accuracy of the MIP-derived data and mitigating distortions associated with the ink-bottle effect.
In this study, three replicate specimens were tested for each RCP-S mortar group to ensure the reproducibility of MIP data. The average of the three results was reported as the representative value. Given the destructive nature and high cost of MIP, standard deviations were not included; however, intra-group variation was found to be within 5%, indicating acceptable experimental consistency.

2.3.4. SEM Analysis

Microstructural analysis was carried out using SEM. After carbonation, the specimens were dried in an oven at 60 °C for 6 h. From the center of each specimen, a representative sample approximately 1 cm3 in volume was extracted and then further reduced to a size suitable for imaging. Following gold sputter coating, the samples were examined using a Hitachi S-3400N SEM system (Tianmeiyituo Laboratory Equipment (Shanghai) Co., Ltd.) equipped with an EX-250 energy-dispersive spectrometer (Tianmeiyituo Laboratory Equipment (Shanghai) Co., Ltd.).

2.4. Establishment of the Fractal Model

Carbonation of RCP-S mortar leads to the formation of CaCO3 and SiO2·nH2O [47], which fill internal pores, modify the microstructure, and contribute to enhanced compressive strength. The resulting changes in pore connectivity and matrix densification directly affect the mechanical performance of the material. To describe the pore structure and particle morphology of carbonated RCP-S mortar, fractal theory provides a useful framework. These microstructural characteristics are critical because they strongly influence the macroscopic mechanical properties of cementitious materials. By applying fractal analysis, the effect of microstructural complexity on bulk strength can be more accurately quantified. Among three-dimensional fractal models, the Menger sponge is widely recognized for its capacity to simulate hierarchical pore systems. Its advantage lies in the scalable geometric characteristics that can represent multiscale connectivity and spatial distribution. The pore network of RCP-S mortar exhibits a hierarchical and interconnected structure, making the Menger sponge a suitable approximation. Although some degree of deviation between the model and actual pore geometry may exist, previous studies have demonstrated that this approach yields consistent and meaningful correlations with macroscopic performance [9]. To ensure reliability, all fractal calculations in this study were based on representative data segments with the best statistical fits. Future work will include additional parallel experiments and model comparisons to further verify the universality and accuracy of the approach. Compared with other fractal or geometric models, such as box-counting methods or Euclidean-based simplifications, the Menger sponge model offers distinct advantages in representing hierarchical, interconnected pore networks. Its recursive structure allows for multiscale simulation of pore tortuosity, surface area, and connectivity—characteristics that are particularly relevant in carbonated cementitious systems. In addition, the model’s logarithmic scaling behavior aligns well with the principles of mercury intrusion porosimetry, making it a suitable analytical tool for interpreting experimental pore structure data. Figure 4 illustrates the structure of the Menger sponge model, with Figure 4a depicting a unit cube analogous to that extracted from the mortar.
The sponge model calculation method is as follows. Let a cube with a side length L be the initial element. This cube is divided into m3 small cubes, each with a side length of l = L/m. Subsequently, a random number of small cubes is removed, leaving m3 − a cubes to complete the first iteration. The cubes with side lengths of l are further divided into m3 small cubes, each with a side length of L/m2, and a random number a of these small cubes is removed, completing the second iteration. At this point, the number of remaining cubes is (m3 − a)2. Continuing this process for k iterations, (m3 − a) k small cubes with side lengths of lk = L/mk will remain.
The total volume of remaining smaller cubes V t after t iterations is
V t = N t l t 3 = l t 3 D M L D M
where N t is the number of remaining cubes after t iterations, l t is the dimension of cubes after t iterations, L is the initial side length, and D M is the fractal dimension.
The total number of cubes N t is
N t = l t L D M
Thus, the pore volume of the Menger sponge model can be expressed as
V = L 3 V t = L 3 l t 3 D M L D M
Differentiating with respect to l k yields the pore volume distribution density:
f l t = d V d l t = 3 D M L D M l t 2 D M
Taking logarithms on both sides gives
l g f l t = 2 D M l g l t + l g ( 3 D M L D M )
Here, f l t represents the differential pore volume distribution with respect to the pore scale lt. Equation (6) demonstrates that the pore volume distribution of the Menger sponge model conforms to a fractal law. Specifically, the logarithmic form of the pore volume distribution density f l t and the cube edge length l t yields a linear relationship. The slope of this double logarithmic curve is 2 − D M , allowing the fractal dimension D M to be directly derived from experimental data. This provides a clear mathematical framework for characterizing pore complexity in RCP-S mortars based on mercury intrusion data.

3. Results and Discussion

3.1. Development of Dry Shrinkage and Strength During Carbonation

Dimensional measurements were conducted on two specimens each from the P1-0.4-24, P1.5-0.4-24, and P2-0.4-24 groups before and after carbonation. The results, summarized in Table 4, revealed volumetric changes of −1.33%, −1.16%, and −0.52%, respectively, where negative values indicate volume shrinkage. All specimens exhibited a clear shrinkage trend following carbonation, with the extent of shrinkage inversely related to the sand-to-powder ratio. This suggests that mixtures with a higher proportion of recycled paste experienced more pronounced volumetric changes due to carbonation.
Despite the observed shrinkage in all groups, no visible cracking was detected. This may be attributed to the absence of external constraints on the specimen surfaces, which likely mitigated the buildup of internal shrinkage stresses and reduced the risk of cracking. Therefore, under the conditions employed in this study, the volumetric changes induced by carbonation did not significantly compromise the structural integrity of the specimens.
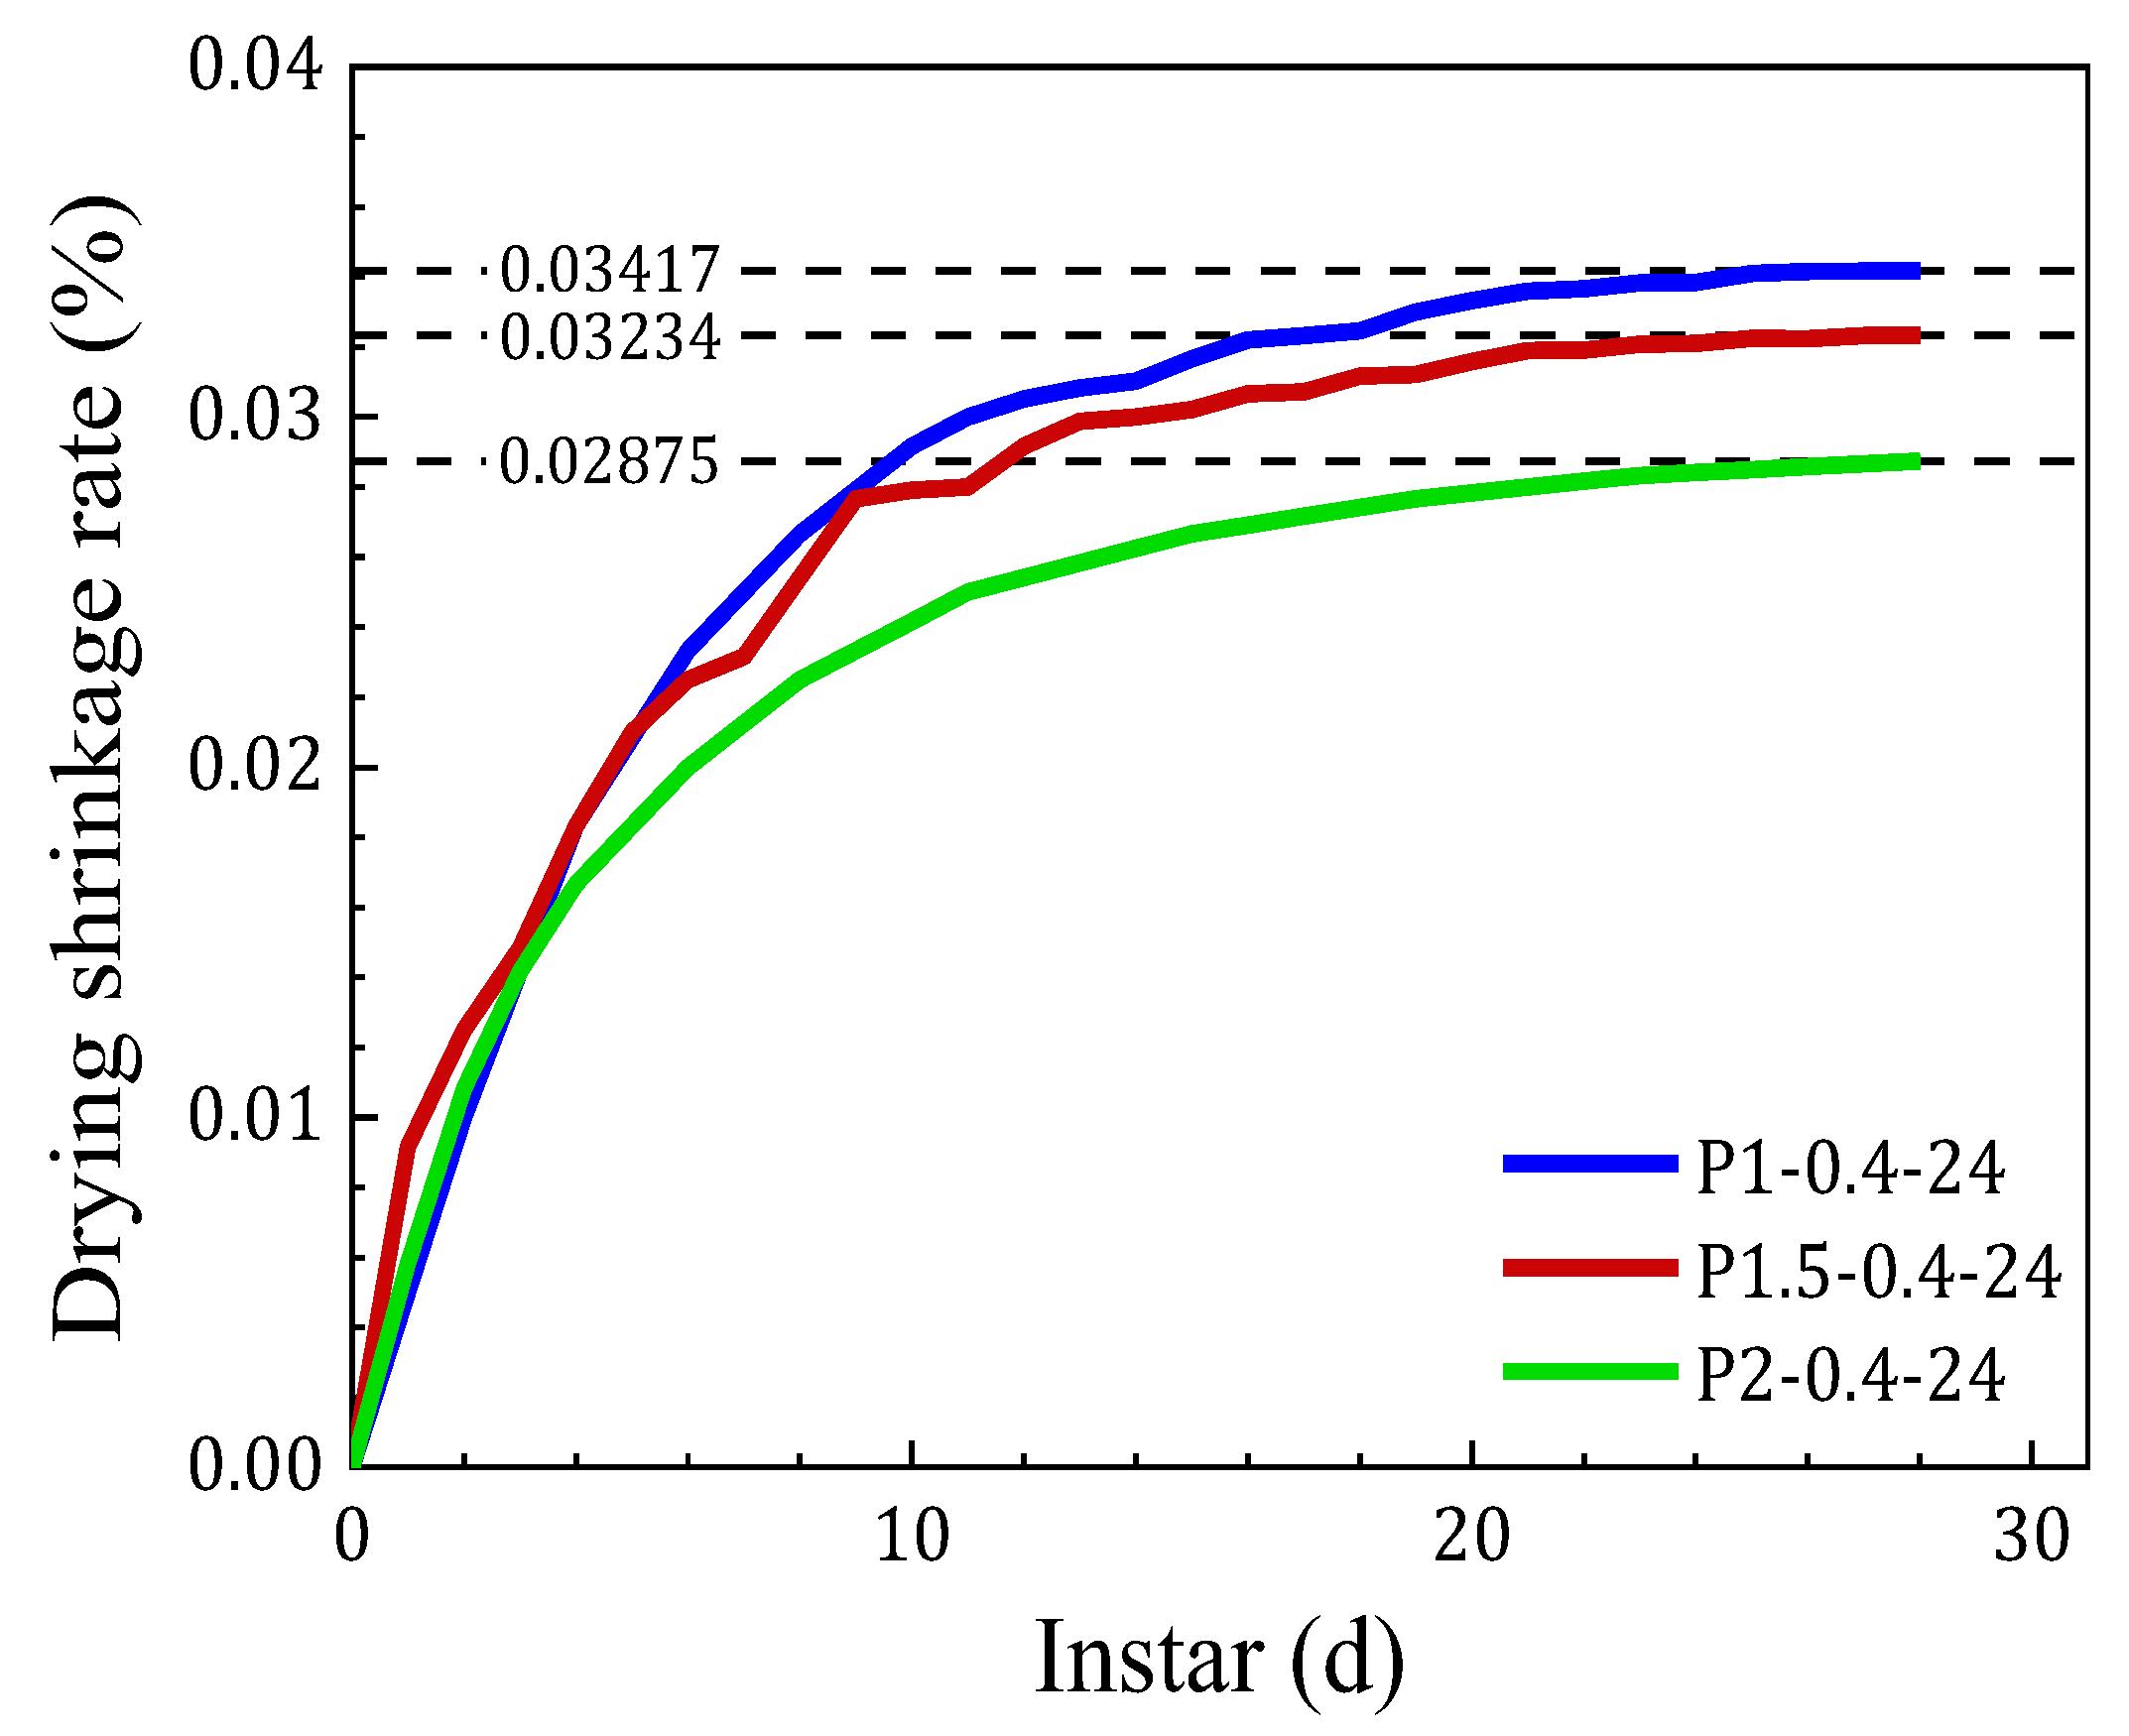
Figure 5 illustrates the evolution of the drying shrinkage rate over a 24 h period. The shrinkage rates of all specimen groups gradually stabilized with time. Specimens with higher sand content demonstrated smaller variations in shrinkage rate, likely due to the increased volume of inert sand that did not participate in hydration. As a result, mixtures with a lower proportion of RCP-S experienced reduced volume deformation [45,49]. After 28 days of drying, the shrinkage rates for the P1-0.4-24, P1.5-0.4-24, and P2-0.4-24 groups were −0.034%, −0.032%, and −0.029%, respectively. For comparison, ordinary Portland cement mortar exhibited a shrinkage rate exceeding twice these values, at 0.071% [50]. This reduction in shrinkage for RCP-S mortar can be attributed to secondary hydration processes, whereas traditional cement mortars undergo primary hydration, which involves chemical shrinkage and autogenous deformation associated with continuous hydration of cementitious phases.
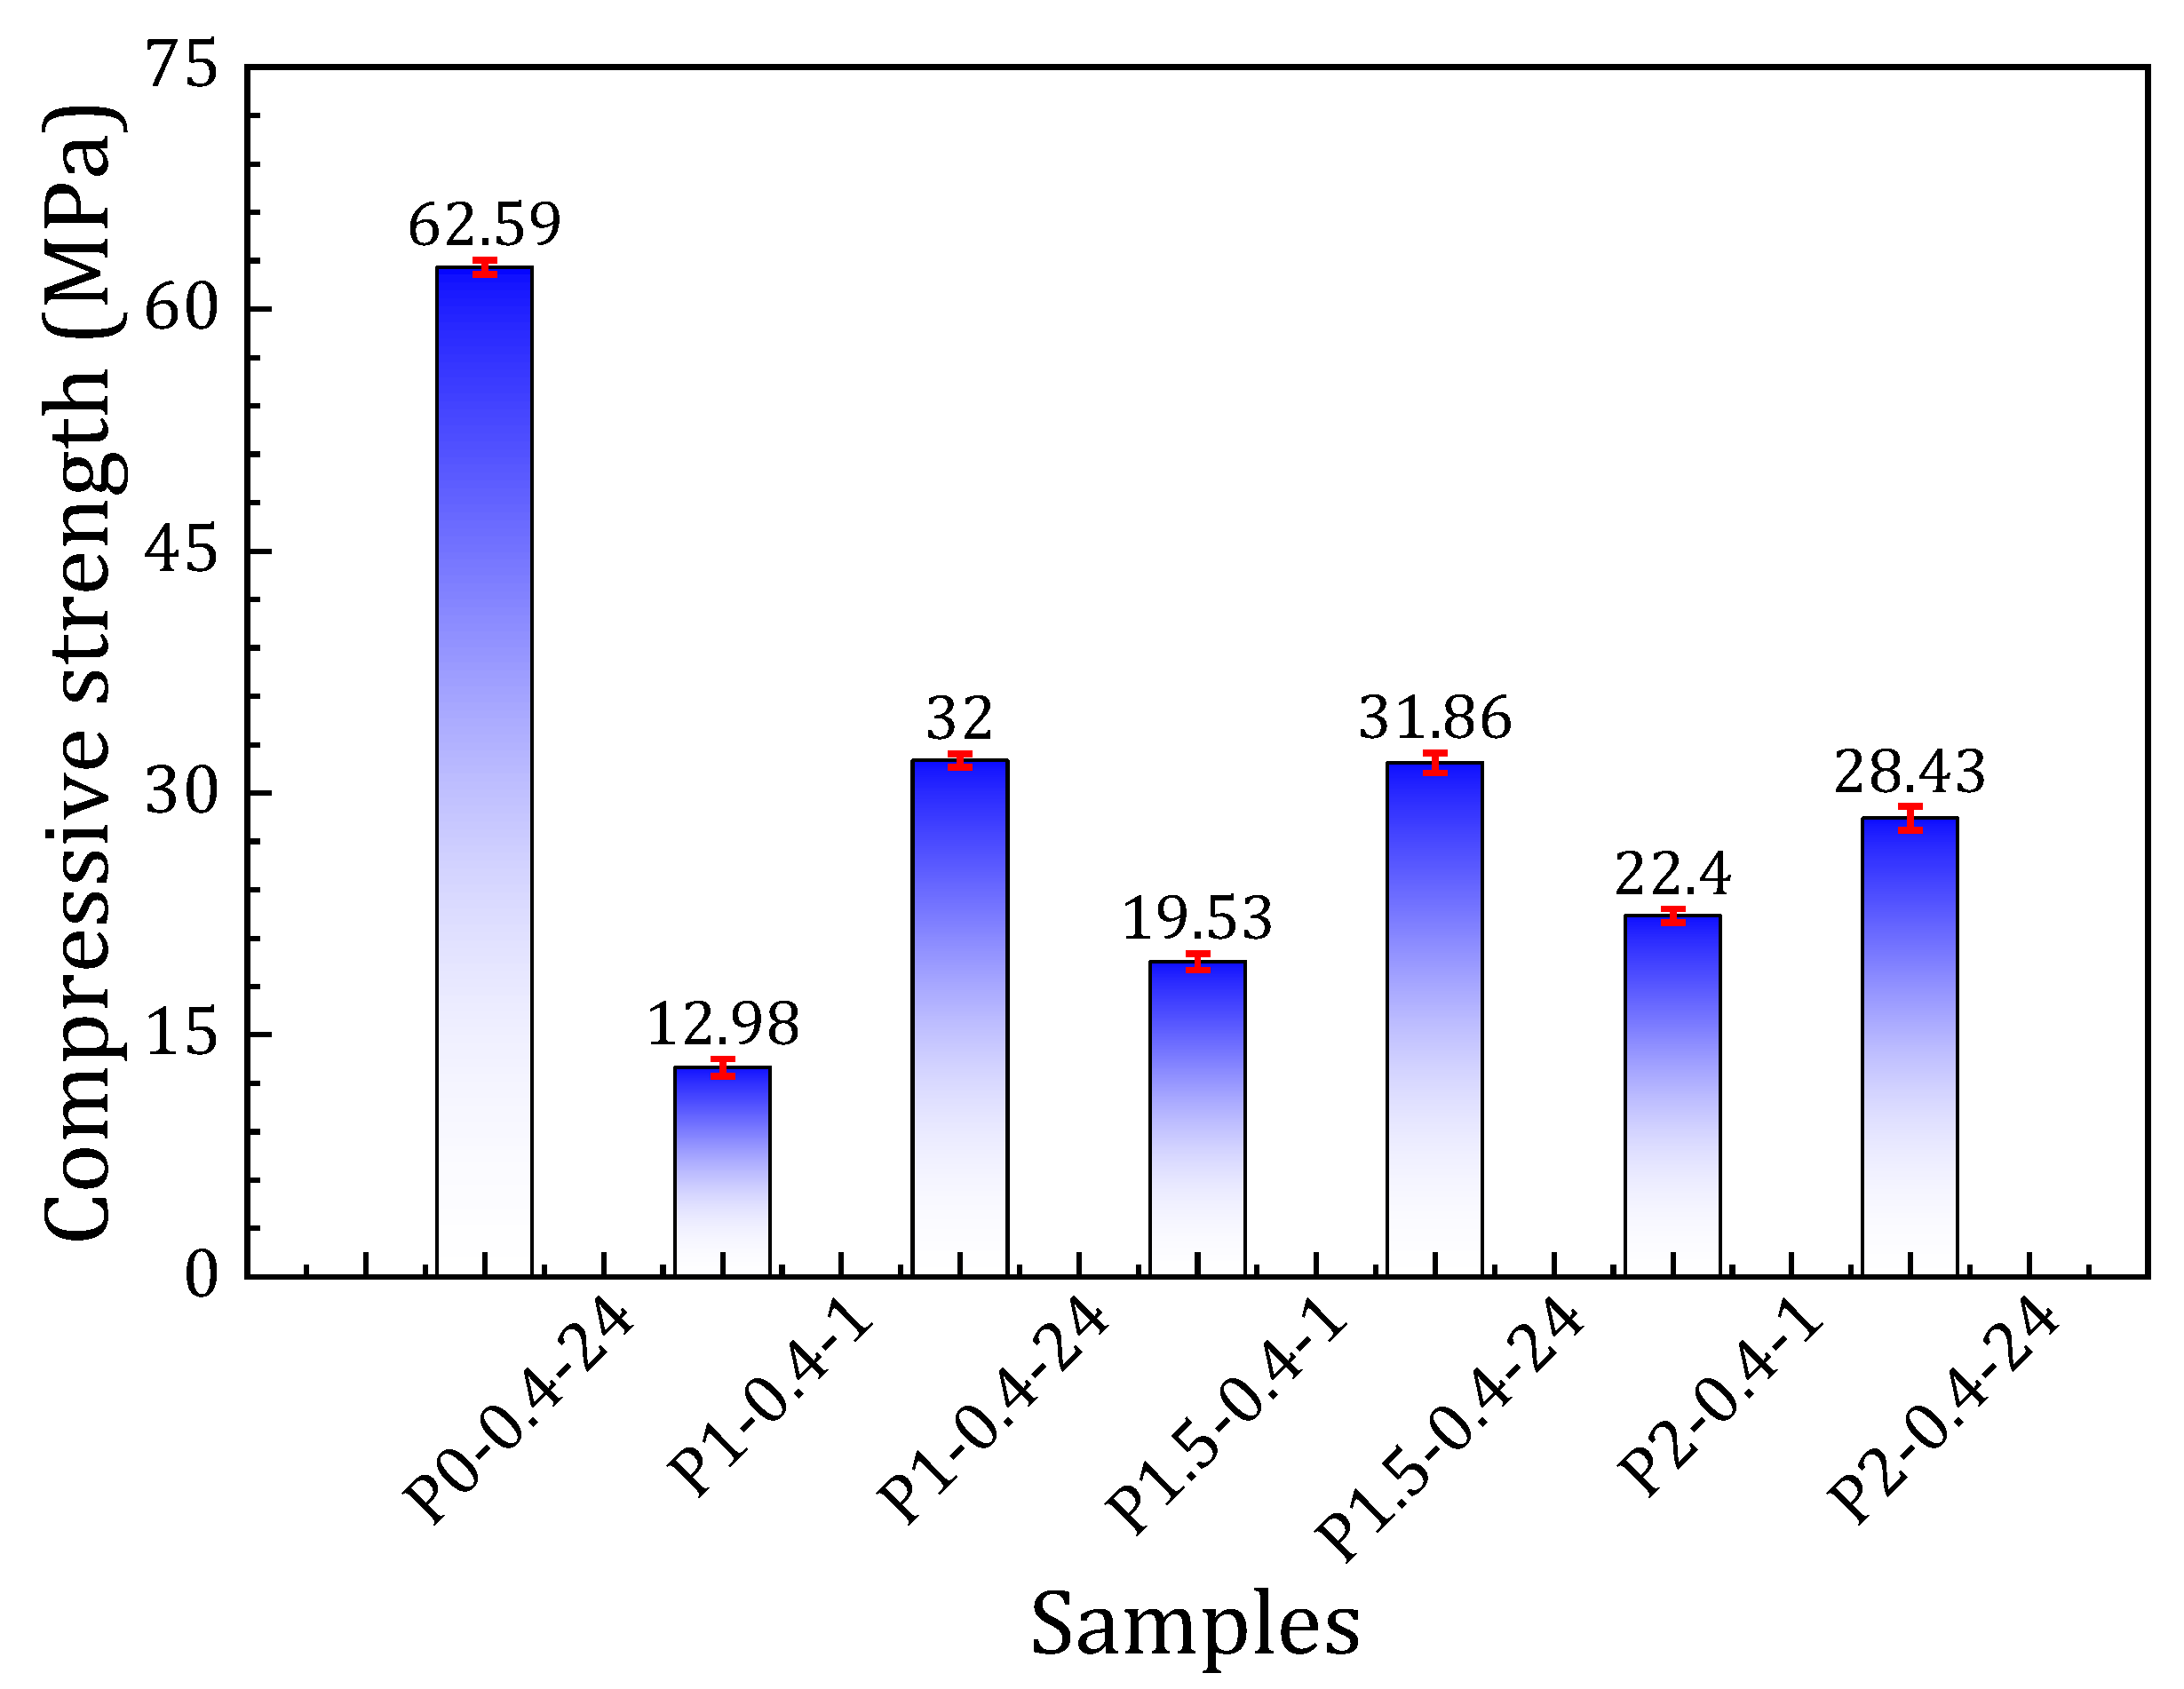
Figure 6 presents the variation in compressive strength across the different specimen groups. The P0-0.4-24 group exhibited the highest compressive strength, surpassing those of the P1-0.4-24, P1.5-0.4-24, and P2-0.4-24 groups by 30.59%, 30.73%, and 34.16%, respectively. Notably, after only 1 h of carbonation, the P2-0.4-1 specimen achieved the highest strength among all sand-containing mixtures. This early-stage strength gain may be attributed to the high sand content, which acted as a rigid framework, providing mechanical support before significant reactions occurred during carbonation [51,52]. In particular, the compressive strength of the P1-0.4-1 group reached 12.98 MPa, surpassing the typical strength of C10-grade concrete, thereby demonstrating its potential for practical applications. The higher strength of the P1-0.4-24 group was largely due to prolonged carbonation, which enabled more complete reactions among reactive components. This strength was primarily governed by the cementitious binding capacity, with the relatively higher cement content contributing to improved structural integrity.
By contrast, reducing the cement content decreased the paste volume available to coat and bind the sand particles, potentially resulting in incomplete encapsulation and a corresponding decline in overall cohesion and strength. These findings highlight that compressive strength development is strongly influenced by both the sand-to-powder ratio and the carbonation duration. The underlying mechanisms are further elucidated through the subsequent microstructural analyses.

3.2. SEM Analysis

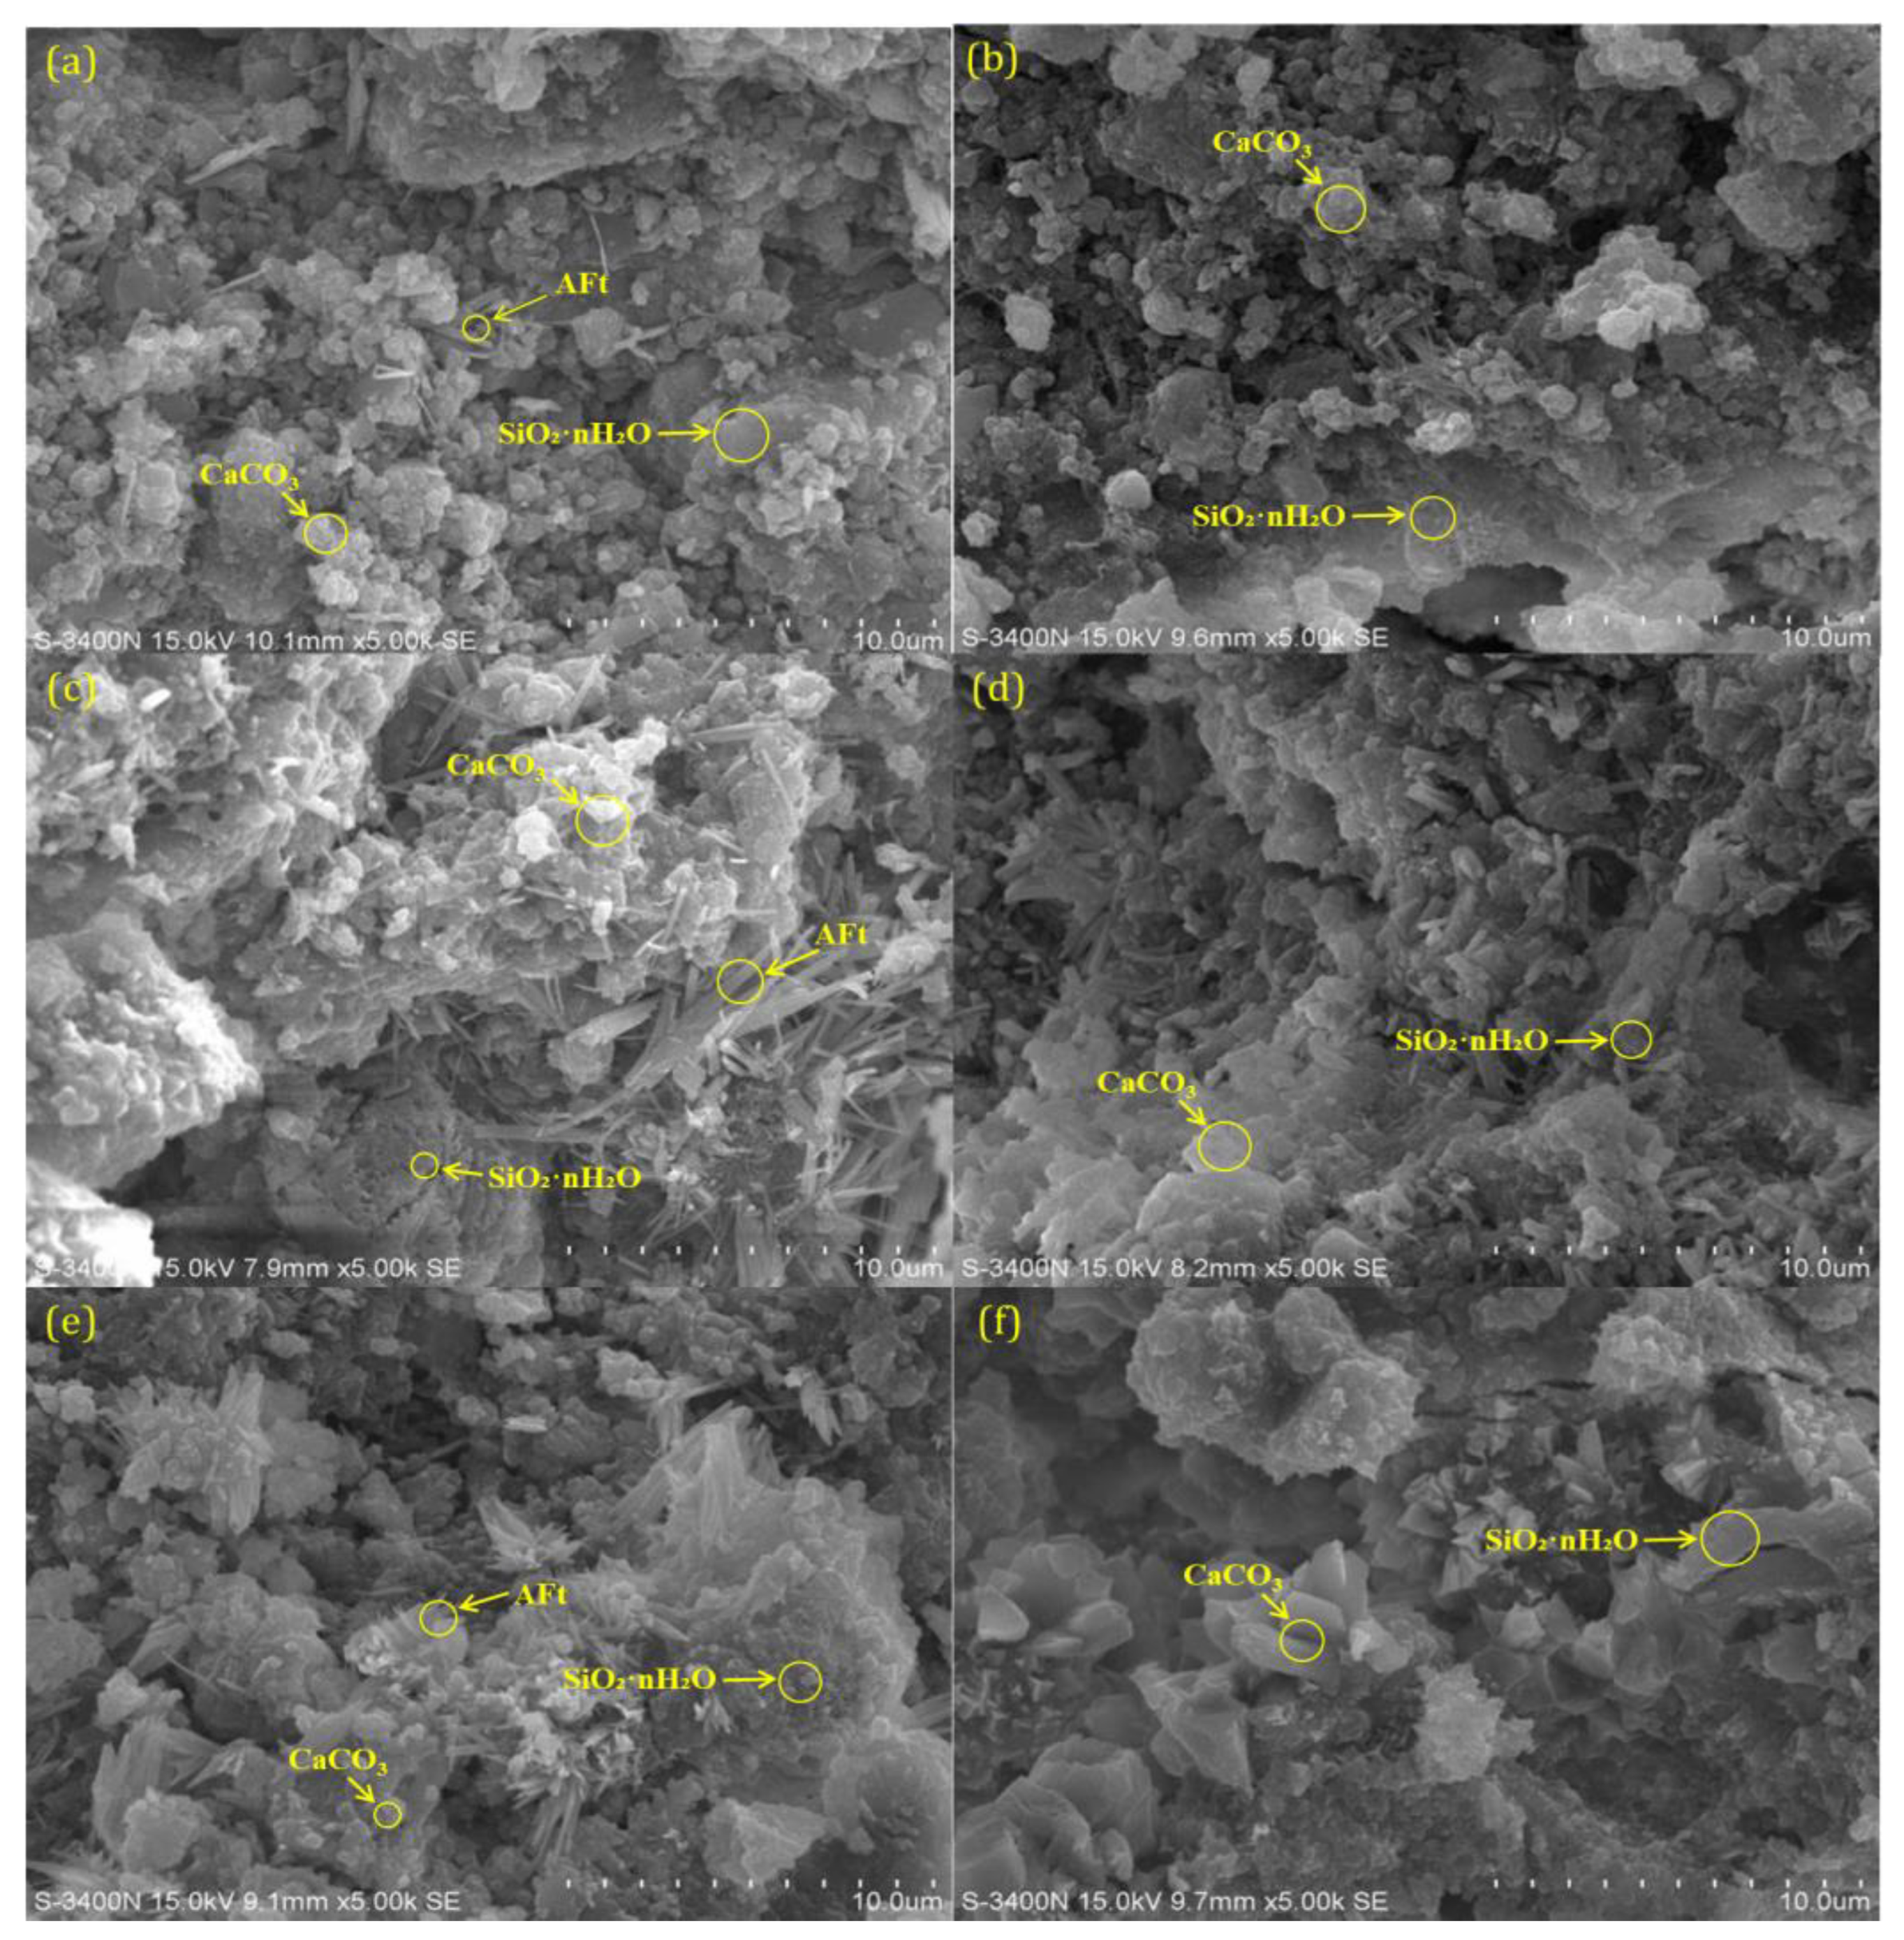
Figure 7 presents a comparison of SEM images captured at 5000× magnification for the three sand-containing mortar specimens after 1 and 24 h of carbonation. The primary reaction products—CaCO3 and SiO2·nH2O—gradually accumulated within the pore structure, particularly after 24 h, resulting in significantly denser microstructures. A clear difference can be observed between the P1-0.4-1 and P1-0.4-24 specimens. After 1 h of carbonation, particulate reaction products had formed on the surfaces of the hardened matrix, yet their distribution was sparse and ineffective in filling the pores, leading to weak interfacial bonding. By contrast, the 24 h specimens exhibited a substantial increase in the amount of reaction products. These filled the pore network more completely, coated the cement paste surface, and bonded tightly with the fine sand particles. This microstructural densification directly corresponds to the observed increases in compressive strength following prolonged carbonation.
Scanning electron microscopy observations further revealed a marked reduction in fine pore sizes—particularly those below 0.1 μm—after 24 h, indicating enhanced matrix compactness. The more uniform and continuous distribution of carbonation products improved not only the microstructure but also the overall mechanical performance of the specimens. Comparative images illustrate this evolution clearly: while the 1 h specimens showed loosely arranged and poorly bonded particles, the 24 h specimens exhibited well-connected, densely packed structures. In addition, lower sand-to-powder ratios promoted more extensive formation and distribution of carbonation products. This resulted in stronger bonding between particles and higher structural uniformity, which are the primary factors contributing to the superior mechanical performance observed in RCP-S mortar with reduced sand content.
Although nanoindentation or EDS mapping was not conducted in this study, previous research has demonstrated that carbonation can enhance the interfacial transition zone (ITZ) by promoting calcium carbonate precipitation and reducing porosity gradients near aggregate surfaces. The observed trends in this study—including densified particle contacts, refined pore structure, and improved bonding—are consistent with those findings, suggesting that extended carbonation also contributes to ITZ enhancement in RCP-S mortar systems [53]. These inferences are further corroborated by SEM images, which show denser morphology and fewer voids at particle interfaces. While direct quantification was not conducted, the consistency of mechanical, MIP, and SEM trends provides a reasonable basis for this interpretation, in agreement with earlier studies [54].

3.3. Pore Size Distribution

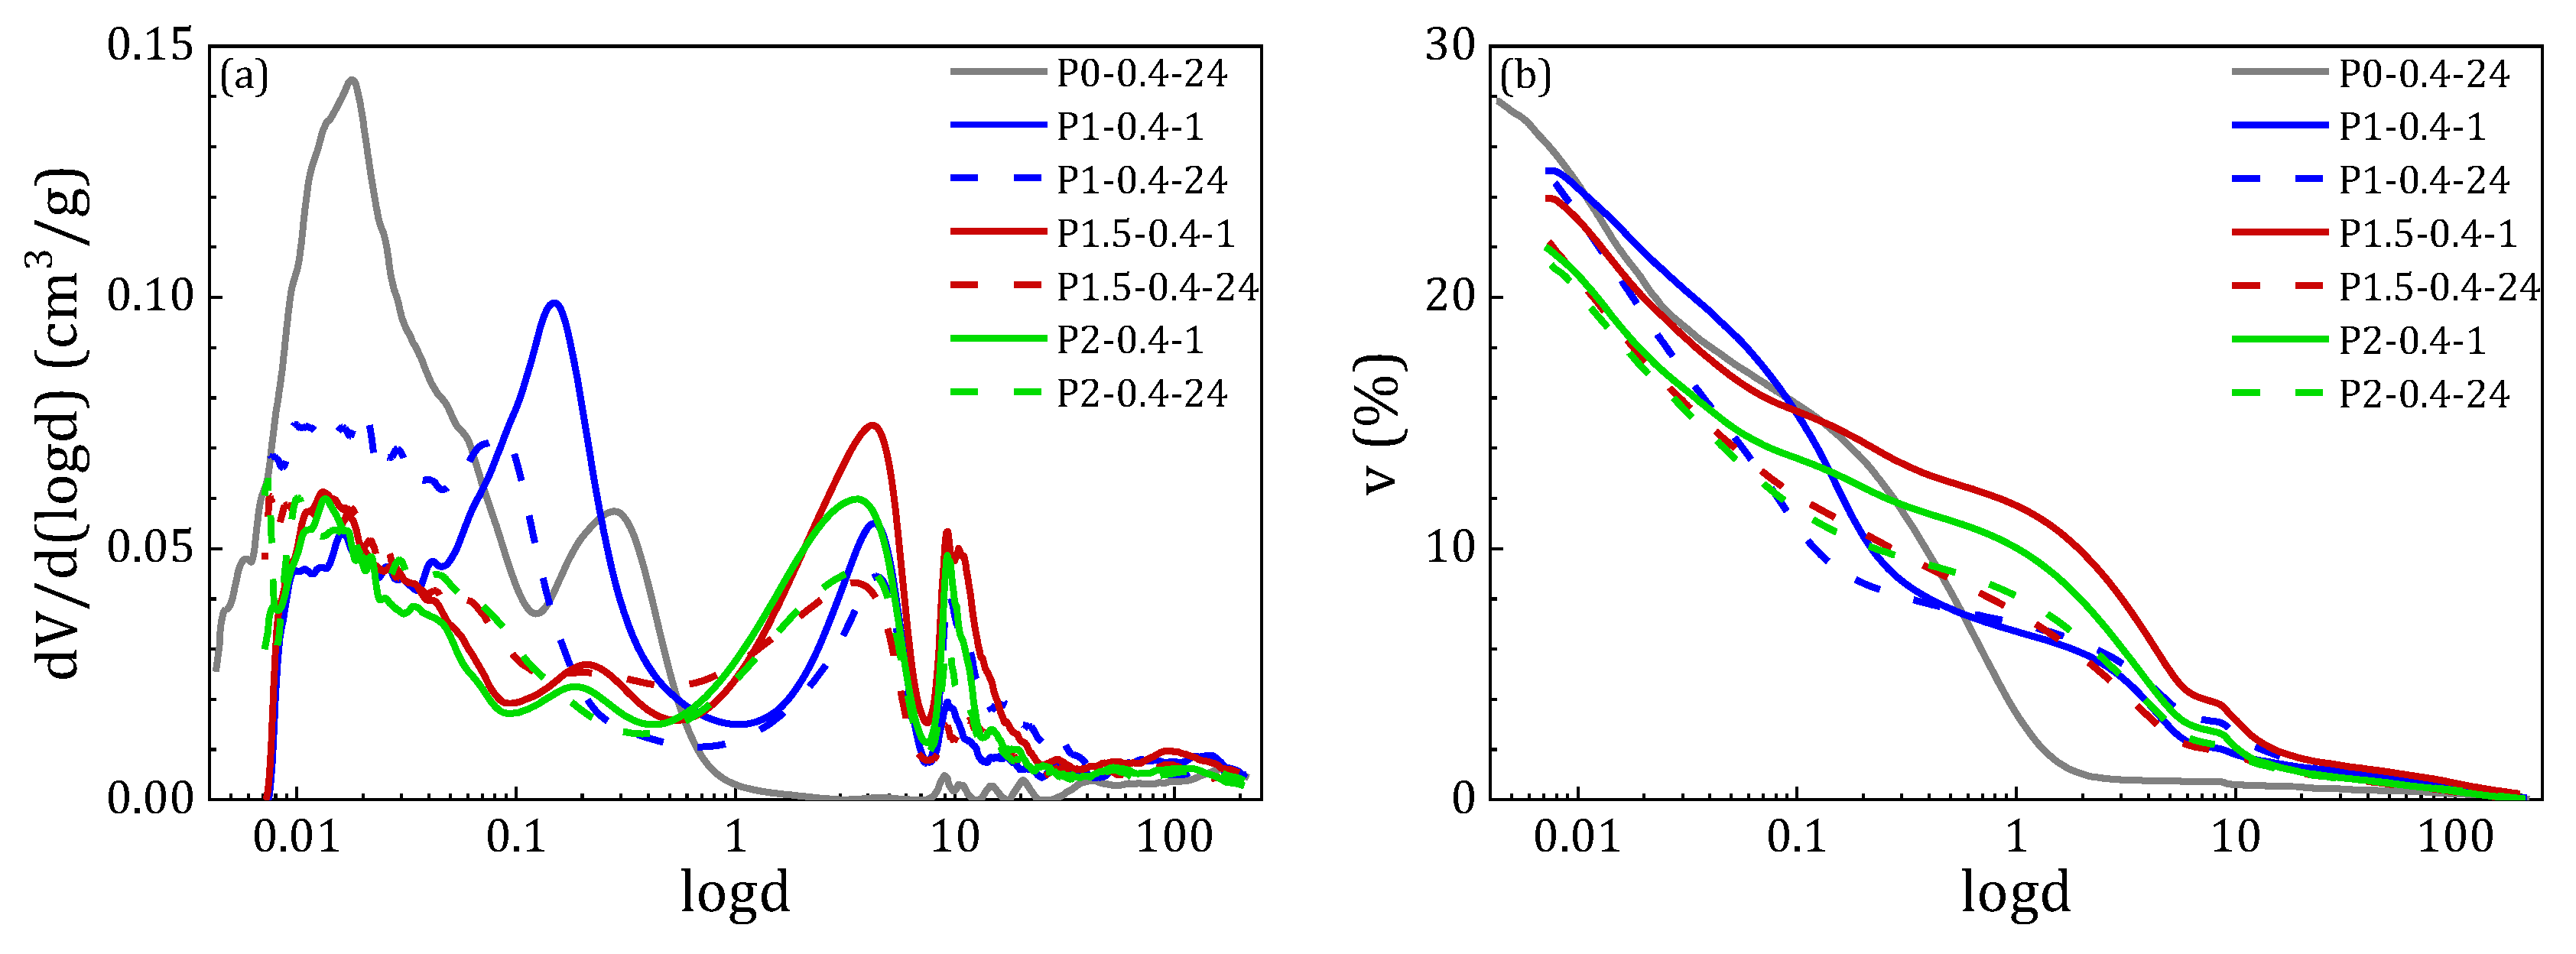
Figure 8 displays the pore size distribution of the different RCP-S mortar specimens as determined by MIP. The pore structure was primarily composed of gel, fine, and medium-sized pores, with relatively few large pores. The detailed distribution is represented by the function, where denotes the pore diameter, represents the incremental pore volume, and corresponds to the cumulative porosity. Carbonation time had a significant influence on porosity. For instance, the total porosity of the P1-0.4-24 specimen was 0.243% lower than that of the P1-0.4-1 specimen. Prolonged carbonation promoted the continuous precipitation of CaCO3, which filled larger internal pores and reduced their connectivity. This pore-filling effect enhanced the compactness and density of the matrix, thereby contributing to a more refined pore structure and improved microstructural uniformity.
In addition to carbonation time, the sand-to-powder ratio also had a notable impact on the porosity of the mortar. The porosity of the P1-0.4-1 specimen was measured at 25.104%, while the corresponding values for the P1.5-0.4-1 and P2-0.4-1 specimens were 23.94% and 22.00%, respectively. Following 24 h of carbonation, the porosity of all specimens decreased, indicating an overall densification of the matrix. Although increasing the sand content alters the binder-to-aggregate ratio, it is important to note that packing density is primarily governed by particle size distribution rather than absolute sand volume. In this study, the same river sand with a fixed particle size range (<1.25 mm) was used in all mixtures, ensuring consistent packing characteristics across specimens. Therefore, the increase in porosity observed at higher sand-to-powder ratios is primarily attributed to a relative reduction in binder content. This reduction can lead to inadequate paste coverage of sand particles and insufficient filling of voids, resulting in more interconnected pores and weaker internal bonding. Such conditions ultimately compromise the compactness and homogeneity of the mortar microstructure.
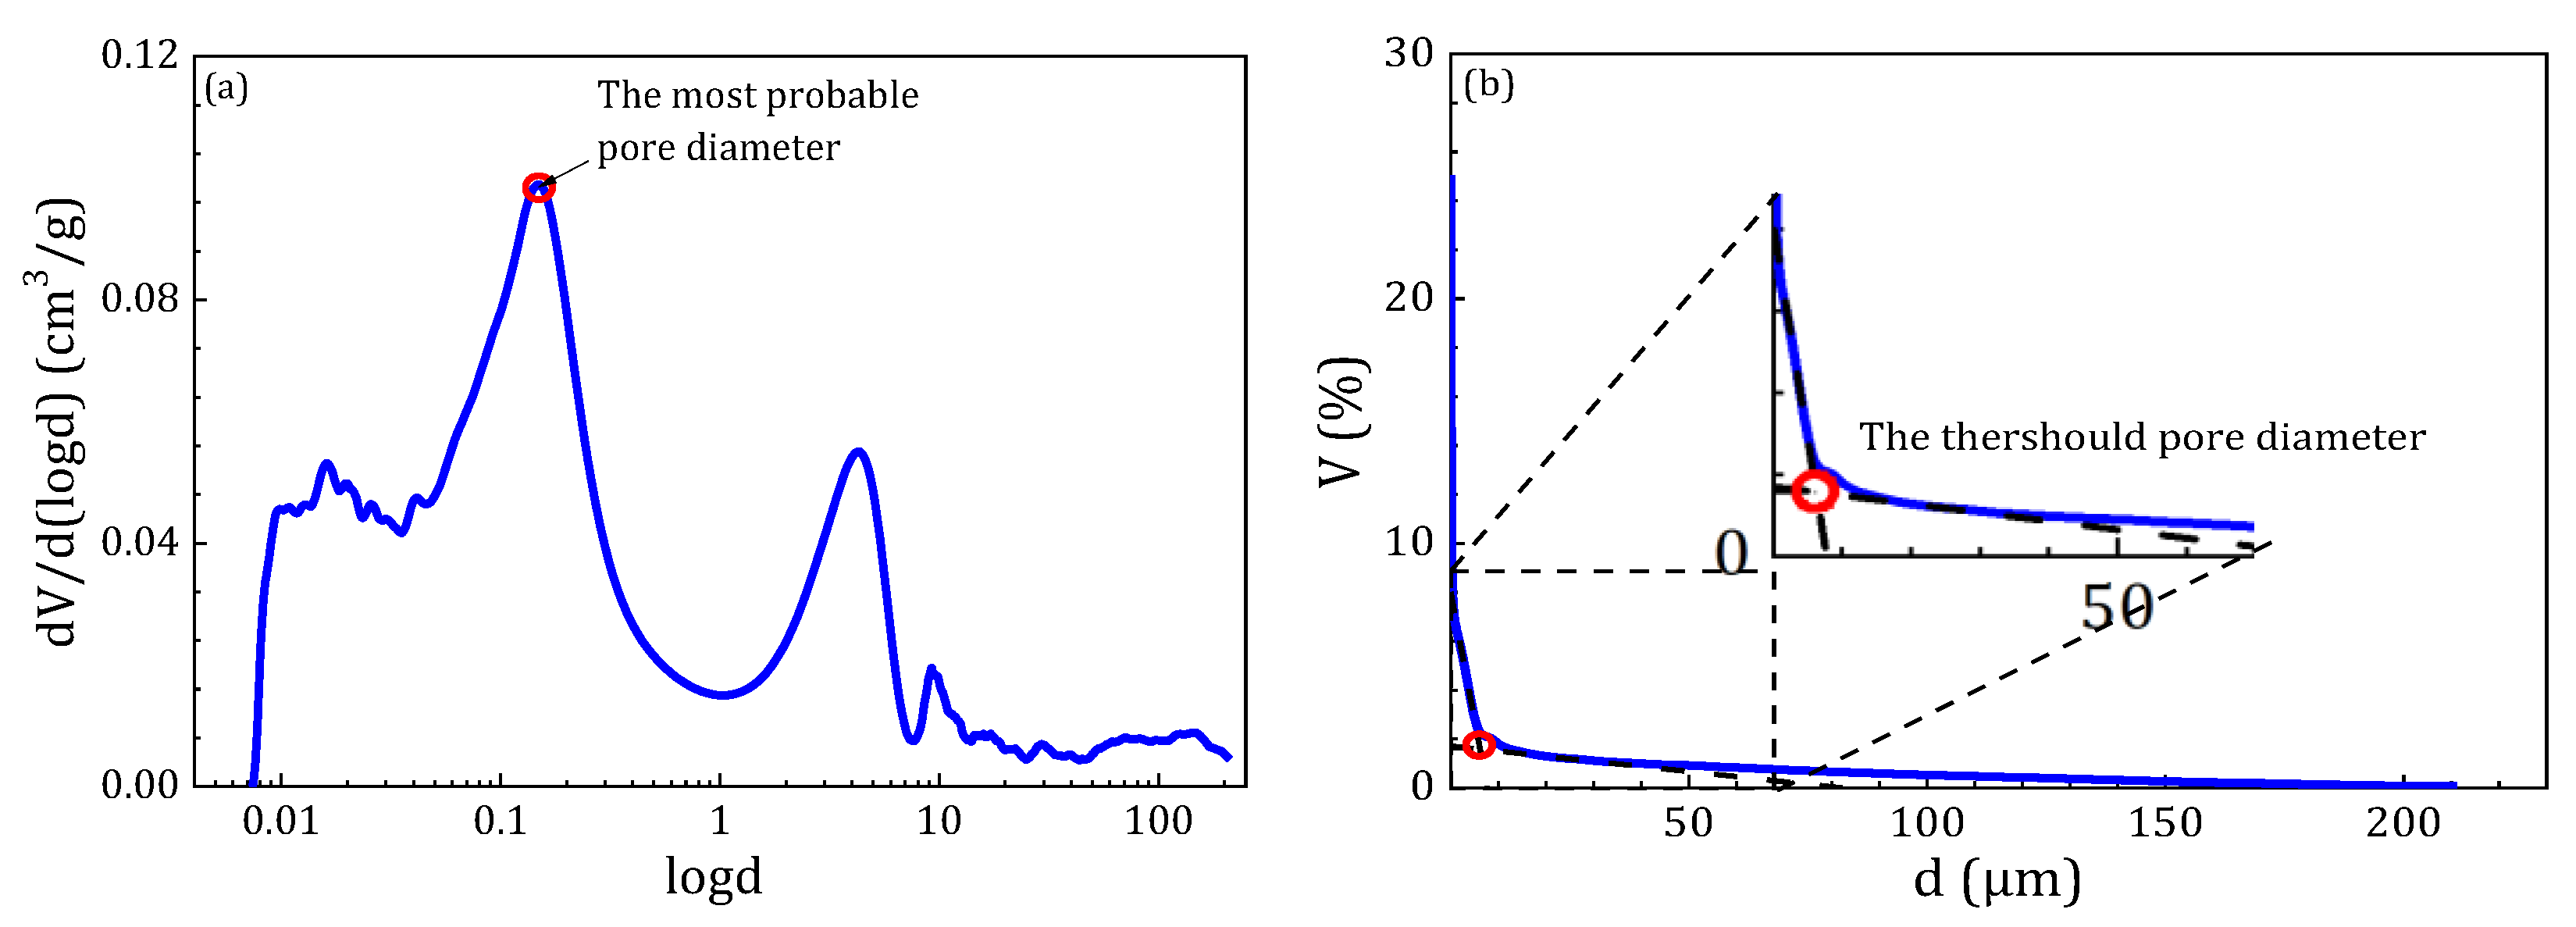
The P0-0.4-24 specimen group was selected as a representative case to illustrate pore size distribution characteristics. Figure 9 shows the determination of the most probable pore diameter—defined as the peak of the differential intrusion curve—and the threshold pore diameter—identified as the intersection of tangents to the slow- and fast-rising segments of the cumulative intrusion curve, following the method proposed by Katz and Thompson [55]. The most probable diameter reflects the average pore size, while the threshold diameter indicates the onset of a connected pore network. In complex cementitious composites, multiple pore clusters complicate threshold identification; thus, the tangent-intersection method offers greater precision [56,57].
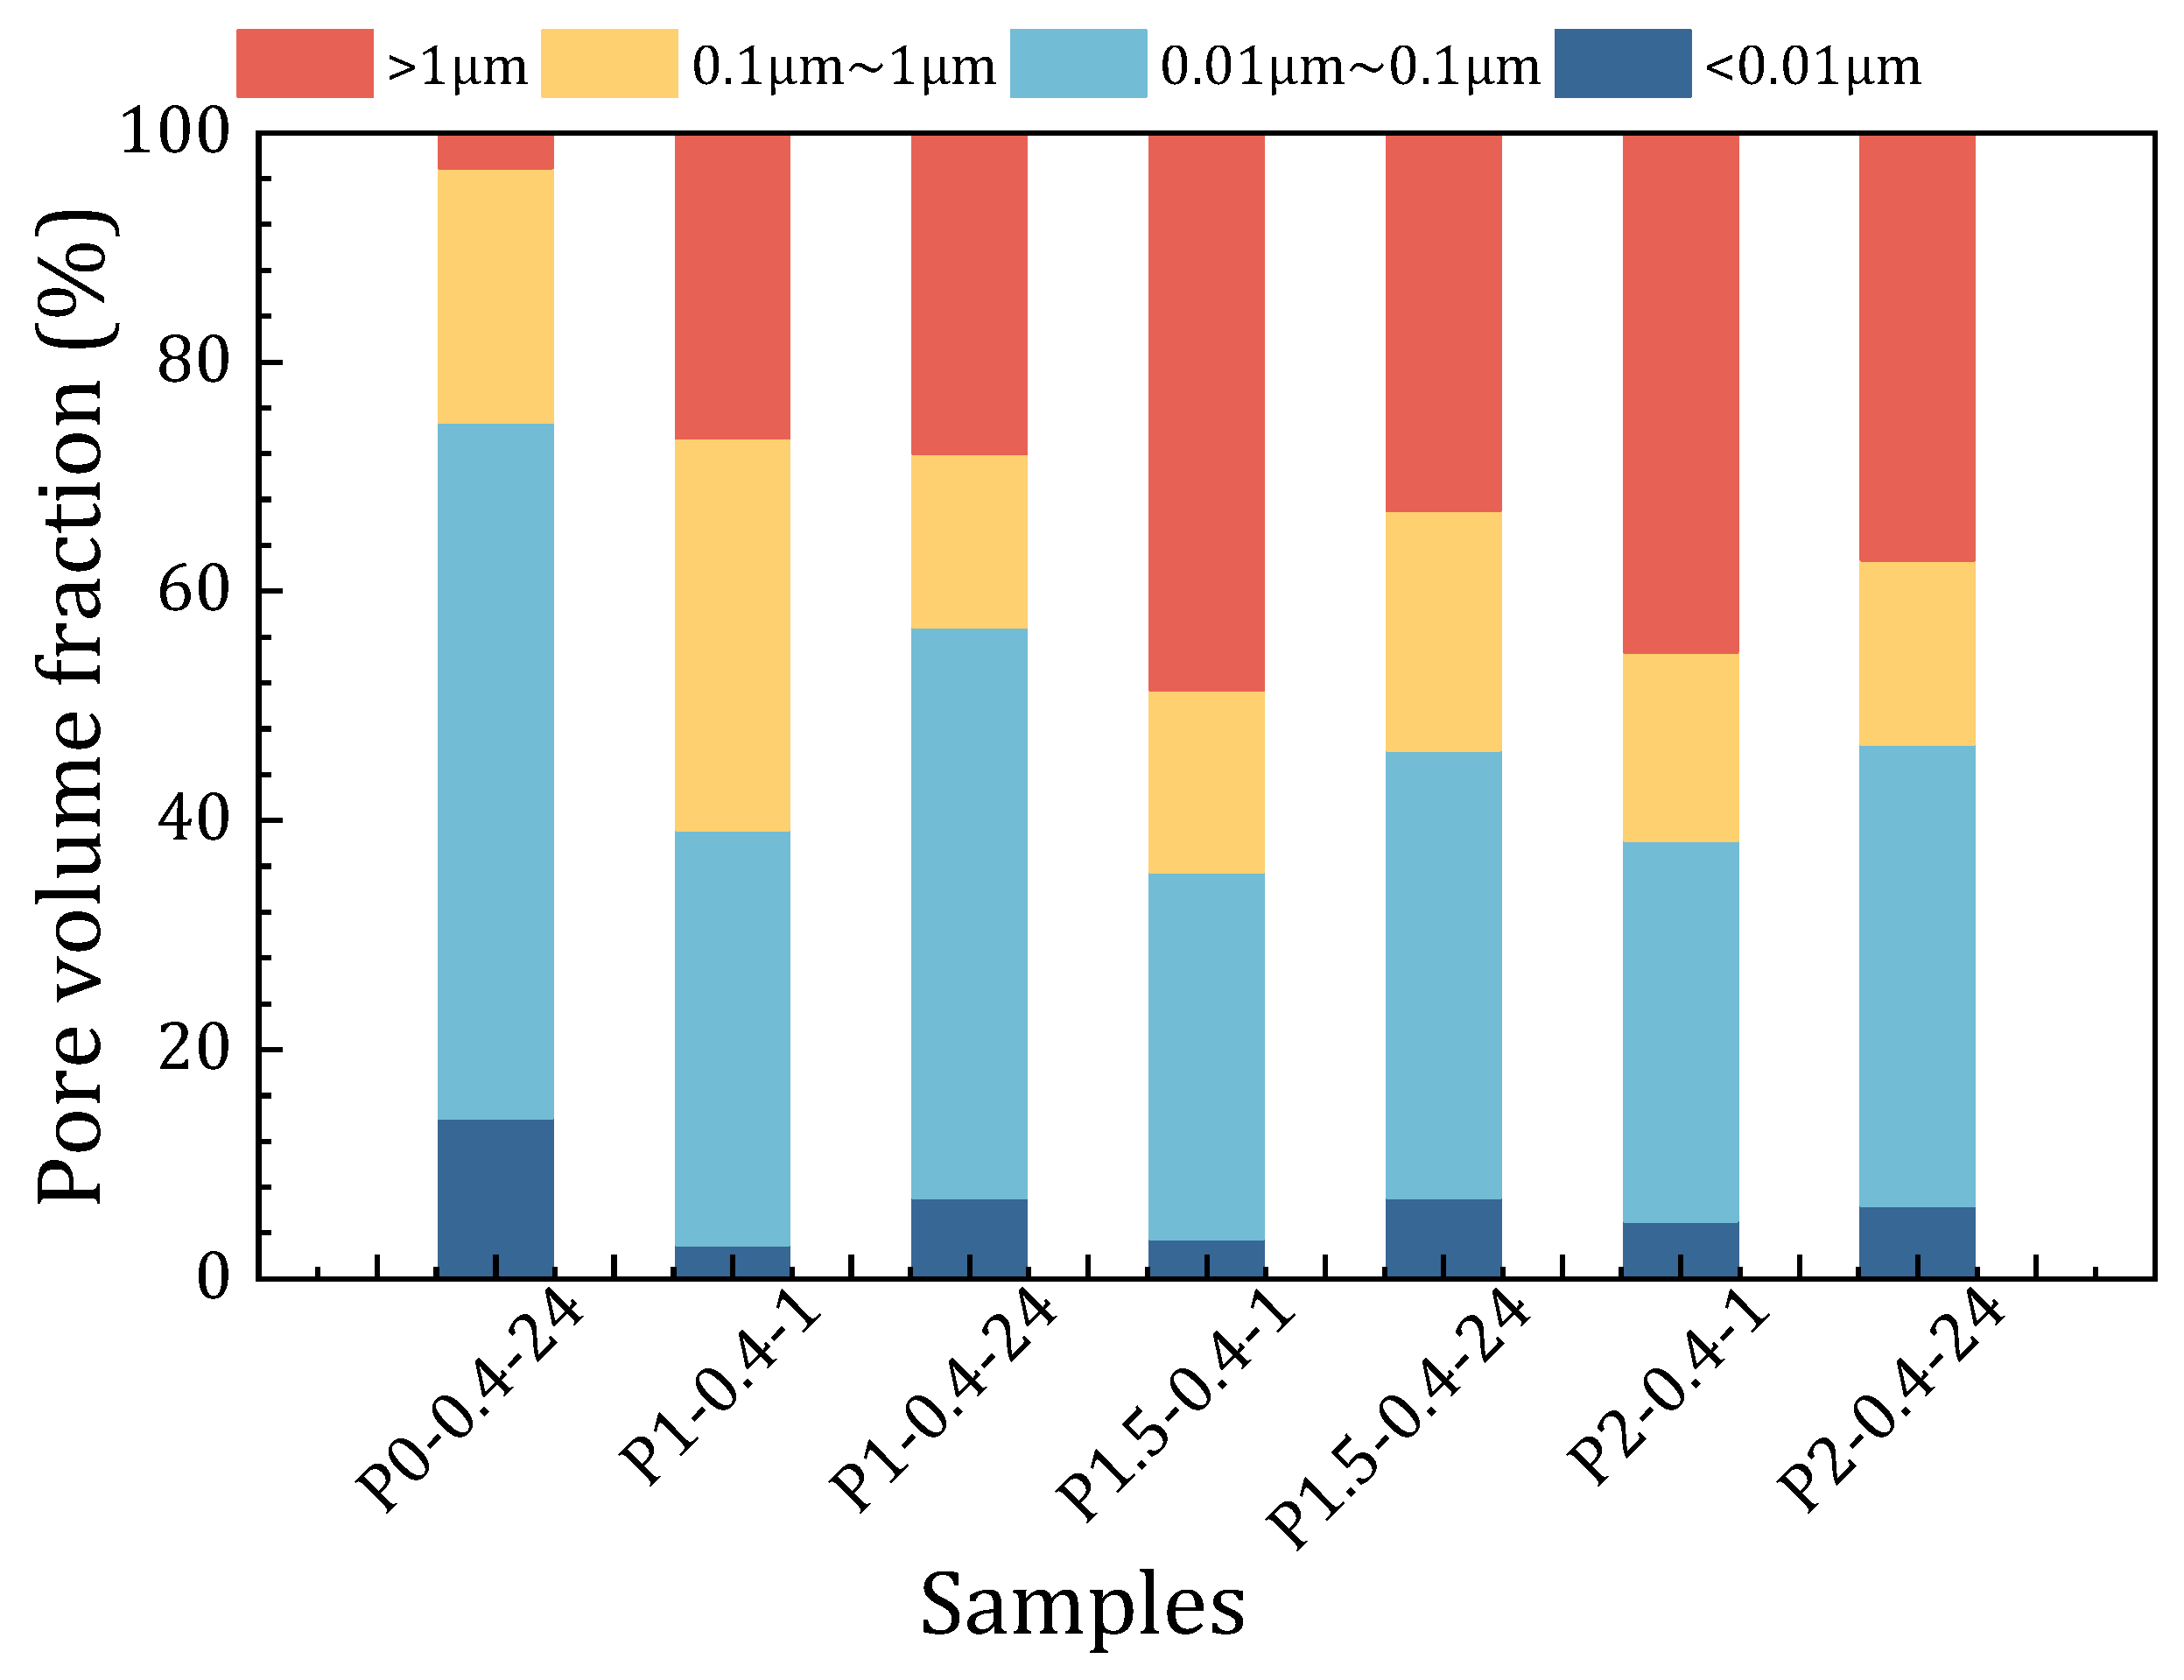
Figure 10 illustrates the influence of carbonation duration on the pore structure and hydration activity of RCP-S mortar specimens. For instance, in the P1-0.4-24 group, the volume fraction of pores smaller than 0.01 μm increased from 13.50% after 1 h of carbonation to 14.05% after 24 h. In contrast, the proportion of pores between 0.1 μm and 1 μm decreased markedly from 50.34% to 3.94% over the same period. These results clearly demonstrate that prolonged carbonation leads to a more refined and compact pore structure.
Overall, both carbonation time and the sand-to-powder ratio significantly influenced the pore structure and density of the RCP-S mortar. As carbonation progressed, total porosity decreased, and larger pores were progressively filled by carbonation products such as CaCO3, resulting in a pore size distribution shifted toward finer pores. This densification effect contributed to improved microstructural integrity, which in turn enhanced the material’s density and long-term durability. The estimation of CO2 uptake in this study refers to findings from previous thermogravimetric analyses, which demonstrated a stable molar relationship between Ca(OH)2 consumption and CO2 absorption during early-stage carbonation. Under the applied conditions of 0.4 MPa and limited exposure duration, relevant studies have also shown that the formation of CaCO3 layers does not significantly hinder further diffusion or reaction [57].

3.4. Other Characterizations of Pore Structure

Additional pore structure parameters obtained from MIP analysis are summarized and compared in Table 5. As carbonation time increased, both the total porosity and the threshold pore diameter of the specimens decreased. This observation is consistent with earlier analyses and further supports the conclusion that ongoing cement hydration and carbonation progressively refine the pore structure across all specimen groups. In the early stages of carbonation, the primary pore structure transformation involved the gradual conversion of large and medium pores into finer ones within the hardened cement paste. While key MIP-derived parameters such as porosity and pore size distribution have been analyzed, other pore network descriptors—including tortuosity, pore connectivity, and specific surface area—were not considered in this study. According to the existing literature, these parameters often show weak or indirect correlations with fractal dimensions derived from mercury intrusion data, particularly in cementitious systems with complex multiscale pore networks [10]. Therefore, their exclusion is unlikely to affect the validity of the observed fractal behavior or strength-related trends.
After 1 h of carbonation, the porosities of the P1-0.4-1, P1.5-0.4-1, and P2-0.4-1 specimens were 25.104%, 23.94%, and 22.00%, respectively. Following 24 h of carbonation, the corresponding values decreased to 25.043%, 22.363%, and 21.616%. These results indicate that specimens with higher sand-to-powder ratios exhibited lower porosity and greater matrix density under the same carbonation conditions. This trend differs from the pattern observed in compressive strength development. During the early stage of carbonation, compressive strength was closely associated with matrix density. Specimens with higher sand content exhibited greater early strength, largely due to their more compact structure. As carbonation continued, the influence of hardened cement paste content became more prominent. Mixtures with lower sand-to-powder ratios, and consequently higher paste content, developed higher compressive strength after 24 h of carbonation. Although increased sand content leads to reduced porosity, a corresponding increase in compressive strength was not observed. This discrepancy is primarily attributed to the reduced binder content and weakened ITZ development caused by excessive fine sand, which disrupts particle bonding and limits the formation of a continuous load-bearing microstructure. Moreover, with lower gel volume available per unit volume of composite, densification does not necessarily translate into improved strength. These findings are consistent with a prior study that highlights the critical role of paste continuity and ITZ quality in the strength development of sand-rich systems [39].
The primary factor influencing strength evolution shifted over time. While a higher sand-to-powder ratio contributed to greater density and improved early strength, the long-term strength was mainly governed by the volume and reactivity of the hardened cementitious matrix.

4. Relationship Between Fractal Dimension and Strength of RCP-S Mortar

4.1. Fractal Dimension and Segments

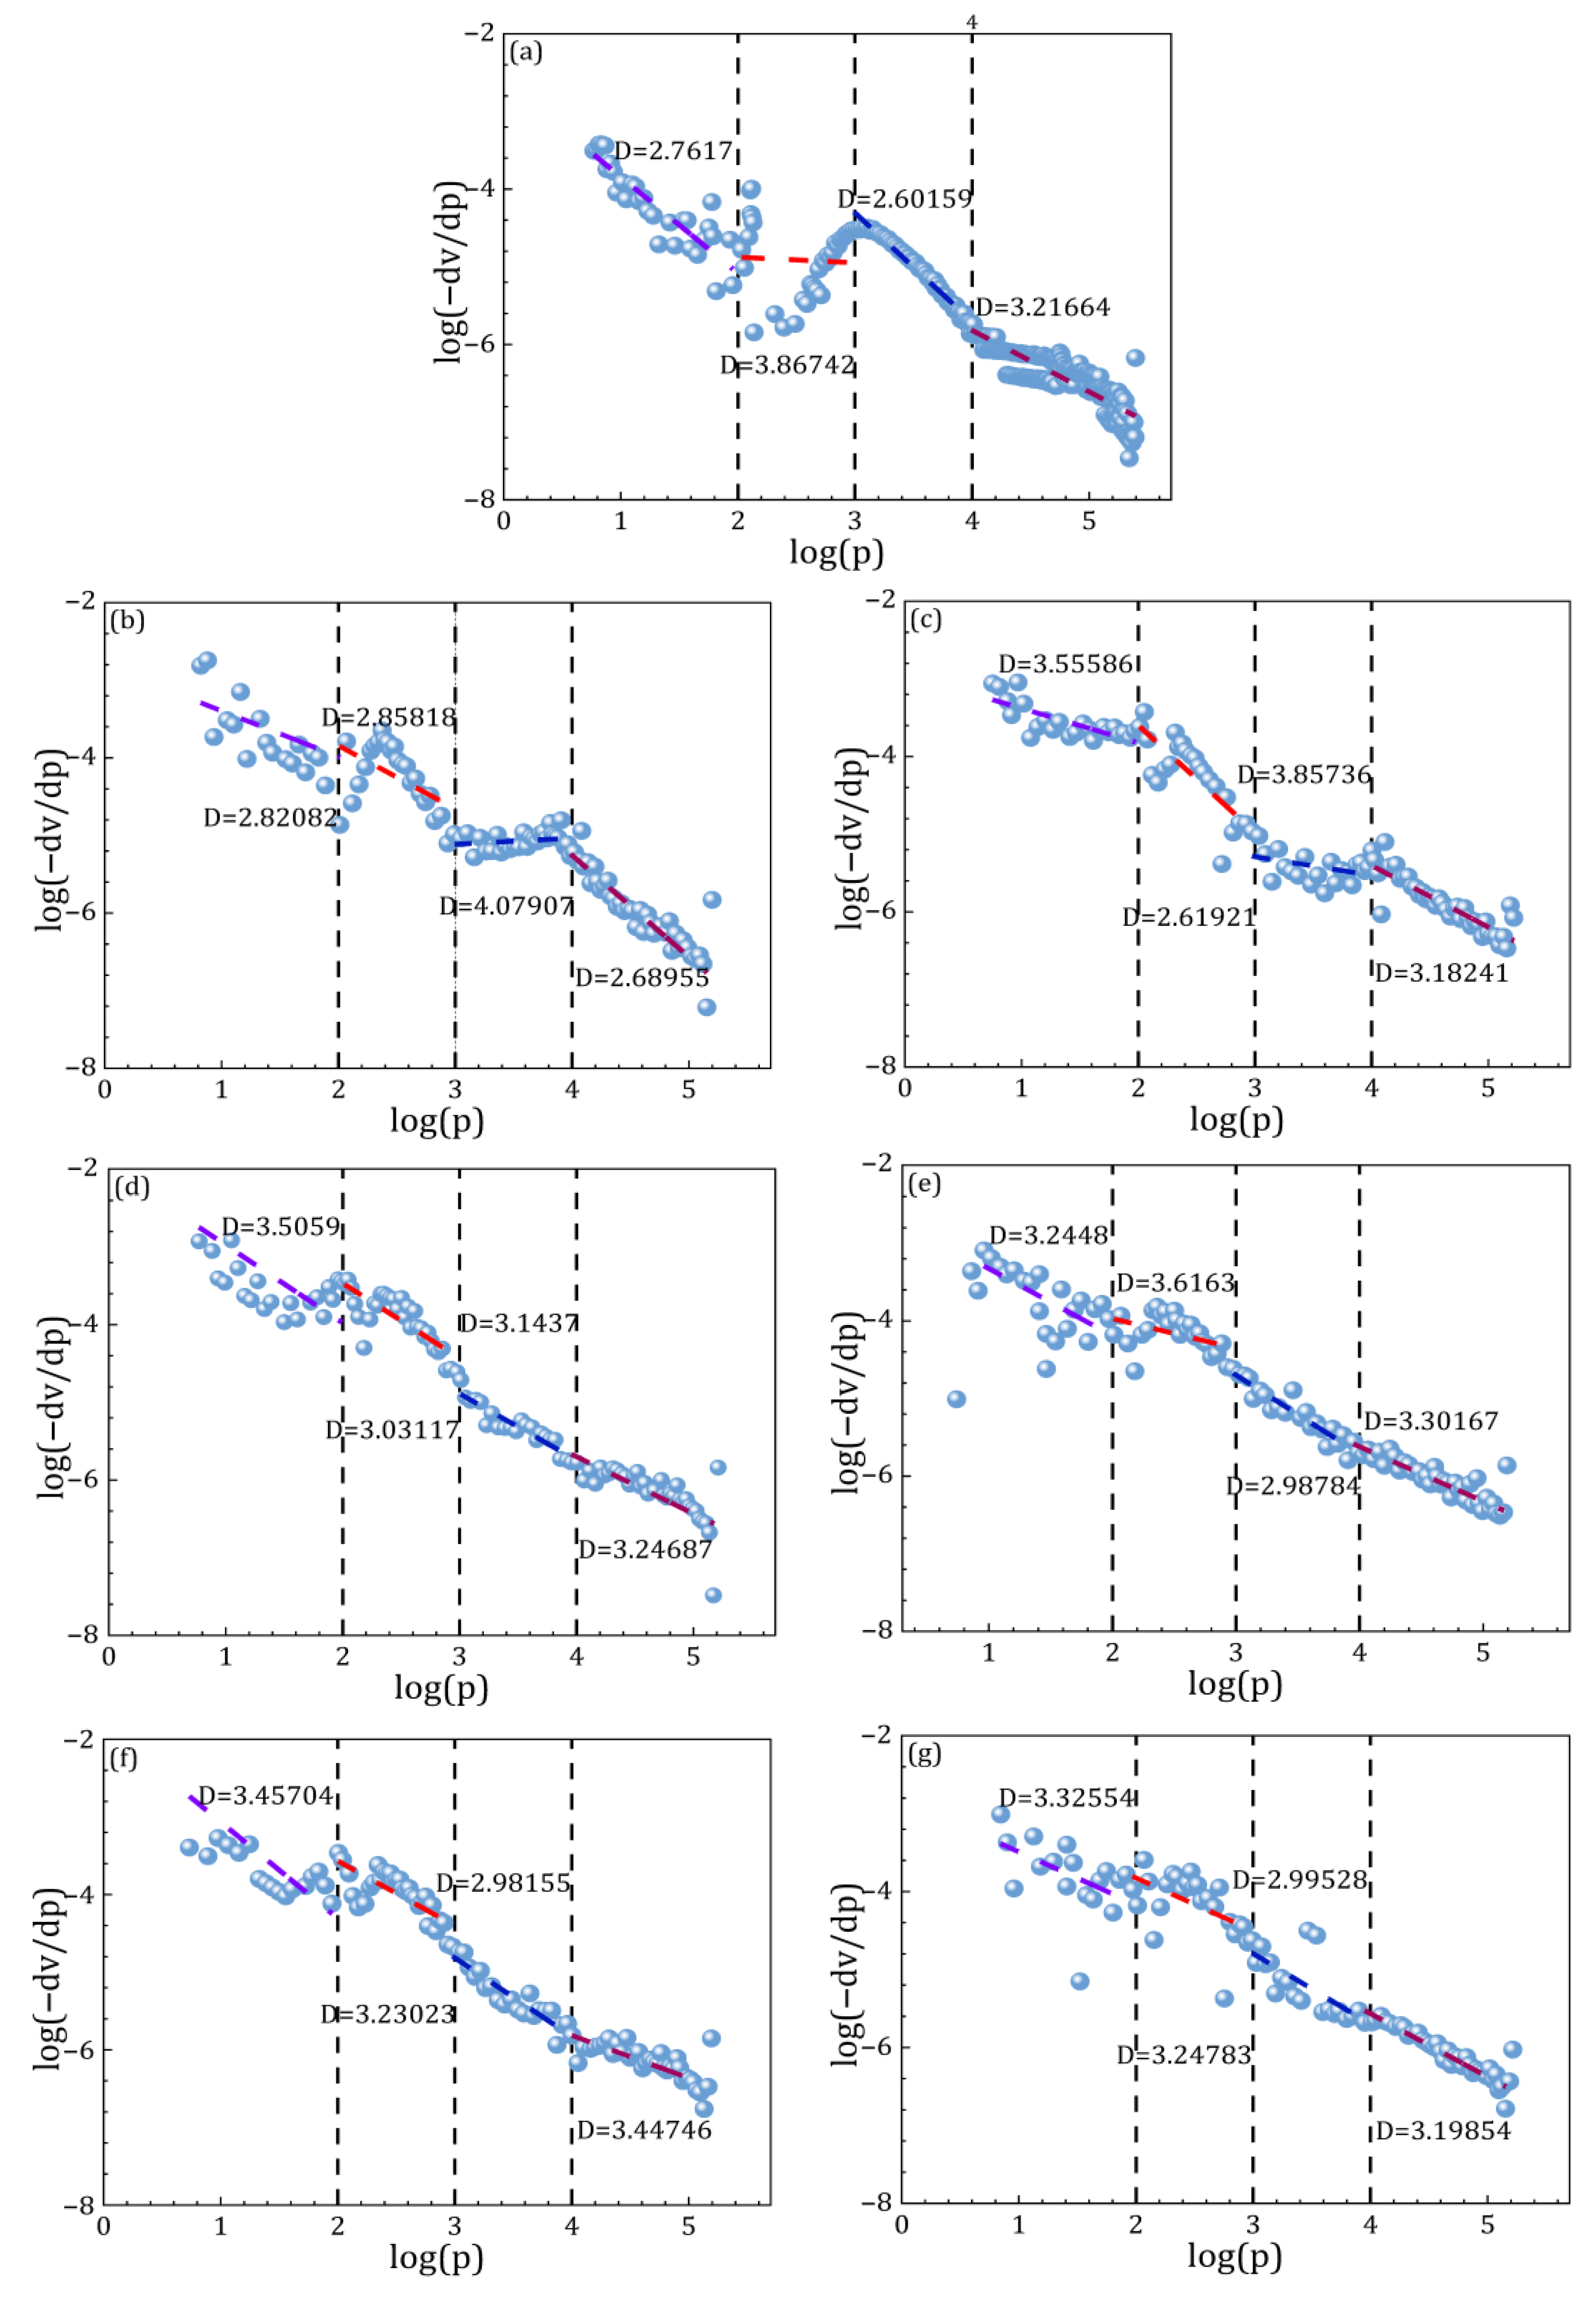
RCP-S mortar is physically defined as a recycled cement-based material and is inherently characterized by a highly disordered porous microstructure. The pore structure spans a broad range of unevenly distributed diameters, from nanometer-scale gel pores to millimeter-scale entrapped air voids. This heterogeneous structure undergoes significant transformation during carbonation, directly influencing key mechanical properties such as compressive strength, permeability, and shrinkage [58]. The resulting irregular pore distribution and varied morphologies exhibit scale dependency and multifractal characteristics. Similar to other cement-based materials, calculating a single fractal dimension across the full pore size range provides limited insight into the structural complexity of RCP-S mortar. To address this limitation, the present study employed a segmented analysis strategy based on pore size classification commonly used in cementitious material studies. The cumulative intrusion curve was divided into four distinct regions—Segments I, II, III, and IV—corresponding to pore diameter ranges of <0.01 μm, 0.01–0.1 μm, 0.1–1 μm, and >1 μm, respectively. This classification is consistent with the prior literature that associates these ranges with gel pores, transition pores, capillary pores, and macropores. Linear regression analysis was independently applied to each segment on the log–log plot of cumulative volume versus pore diameter, and the fractal dimensions were determined from the fitted slopes. Although these divisions are not statistically derived, they follow established pore structure classification schemes and enable detailed multiscale analysis of pore complexity. Moreover, the fractal dimension of Segment II, which corresponds to transition pores, exhibited the strongest correlation with compressive strength across all tested conditions, suggesting its dominant role in strength development [45]. The fitting results are shown in Figure 11. Here, log(p) refers to the logarithm of the intrusion pressure, and log(−dv/dp) describes the rate of pore volume change with pressure. These values are used to evaluate the fractal characteristics of the pore structure. This four-segment classification follows commonly accepted pore size categories used in studies on cementitious materials [59]. Segment I represents gel pores smaller than 0.01 μm, Segment II corresponds to fine capillary pores ranging from 0.01 to 0.1 μm, Segment III includes medium capillary pores between 0.1 and 1 μm, and Segment IV refers to large capillary pores or macropores greater than 1 μm. Each pore category contributes differently to material behavior, particularly in terms of mechanical strength, transport properties, and shrinkage potential. Segmenting the fractal curve in this manner enables a more targeted analysis of structural complexity at various scales and provides deeper insight into the effect of carbonation on individual pore classes. This approach also aligns with the resolution range and sensitivity of mercury intrusion porosimetry and has been adopted in previous research on cement-based systems [59].
The fractal dimensions ranged from 2.60159 to 3.86742, reflecting the complexity of the pore structures in each segment and their impacts on material hydration. All specimens exhibited relatively high fractal dimensions in Segment I, indicating complex pore structures. In particular, specimen P1-0.4-24 exhibited the highest fractal dimension of 3.55586 in this segment, suggesting significant changes in its pore structure under prolonged carbonation. In Segment II, Specimen P0-0.4-24 exhibited the highest fractal dimension of 3.86742, reflecting a complex pore structure, whereas specimen P1-0.4-24 exhibited the lowest fractal dimension of 2.61921. This implies that the pore structure tended to simplify with prolonged carbonation. In Segment III, specimen P1-0.4-1 exhibited the highest fractal dimension of 4.07907; in contrast, specimen P0-0.4-24 exhibited the lowest fractal dimension of 2.60159, indicating a relatively simple pore structure in the absence of sand. Finally, the fractal dimension variations were relatively small in Segment IV; however, specimen P2-0.4-1 exhibited a high fractal dimension of 3.447746, indicating that even larger pores maintained a certain level of complexity.
Therefore, this investigation found that the pore structure complexity of RCP-S mortar differs significantly according to the applied carbonation conditions. The fractal dimension of the pore structure followed a distinct pattern with increasing carbonation time that was closely linked to the hydration reaction in cementitious materials. Note that although the fractal dimension of the pore structure changed with ongoing hydration reactions, the ranges of pore sizes used to define the fractal characteristic segments were not fixed, with multifractal properties existing even within a single defined segment. Critically, as the addition of fine sand altered the fractal dimensions of the specimens, defining the fractal segments based on pore size alone may be insufficient to reflect the evolution of fractal characteristics in the pore structure accurately.

4.2. Relationship Between Fractal Dimension and Pore Structure Parameters

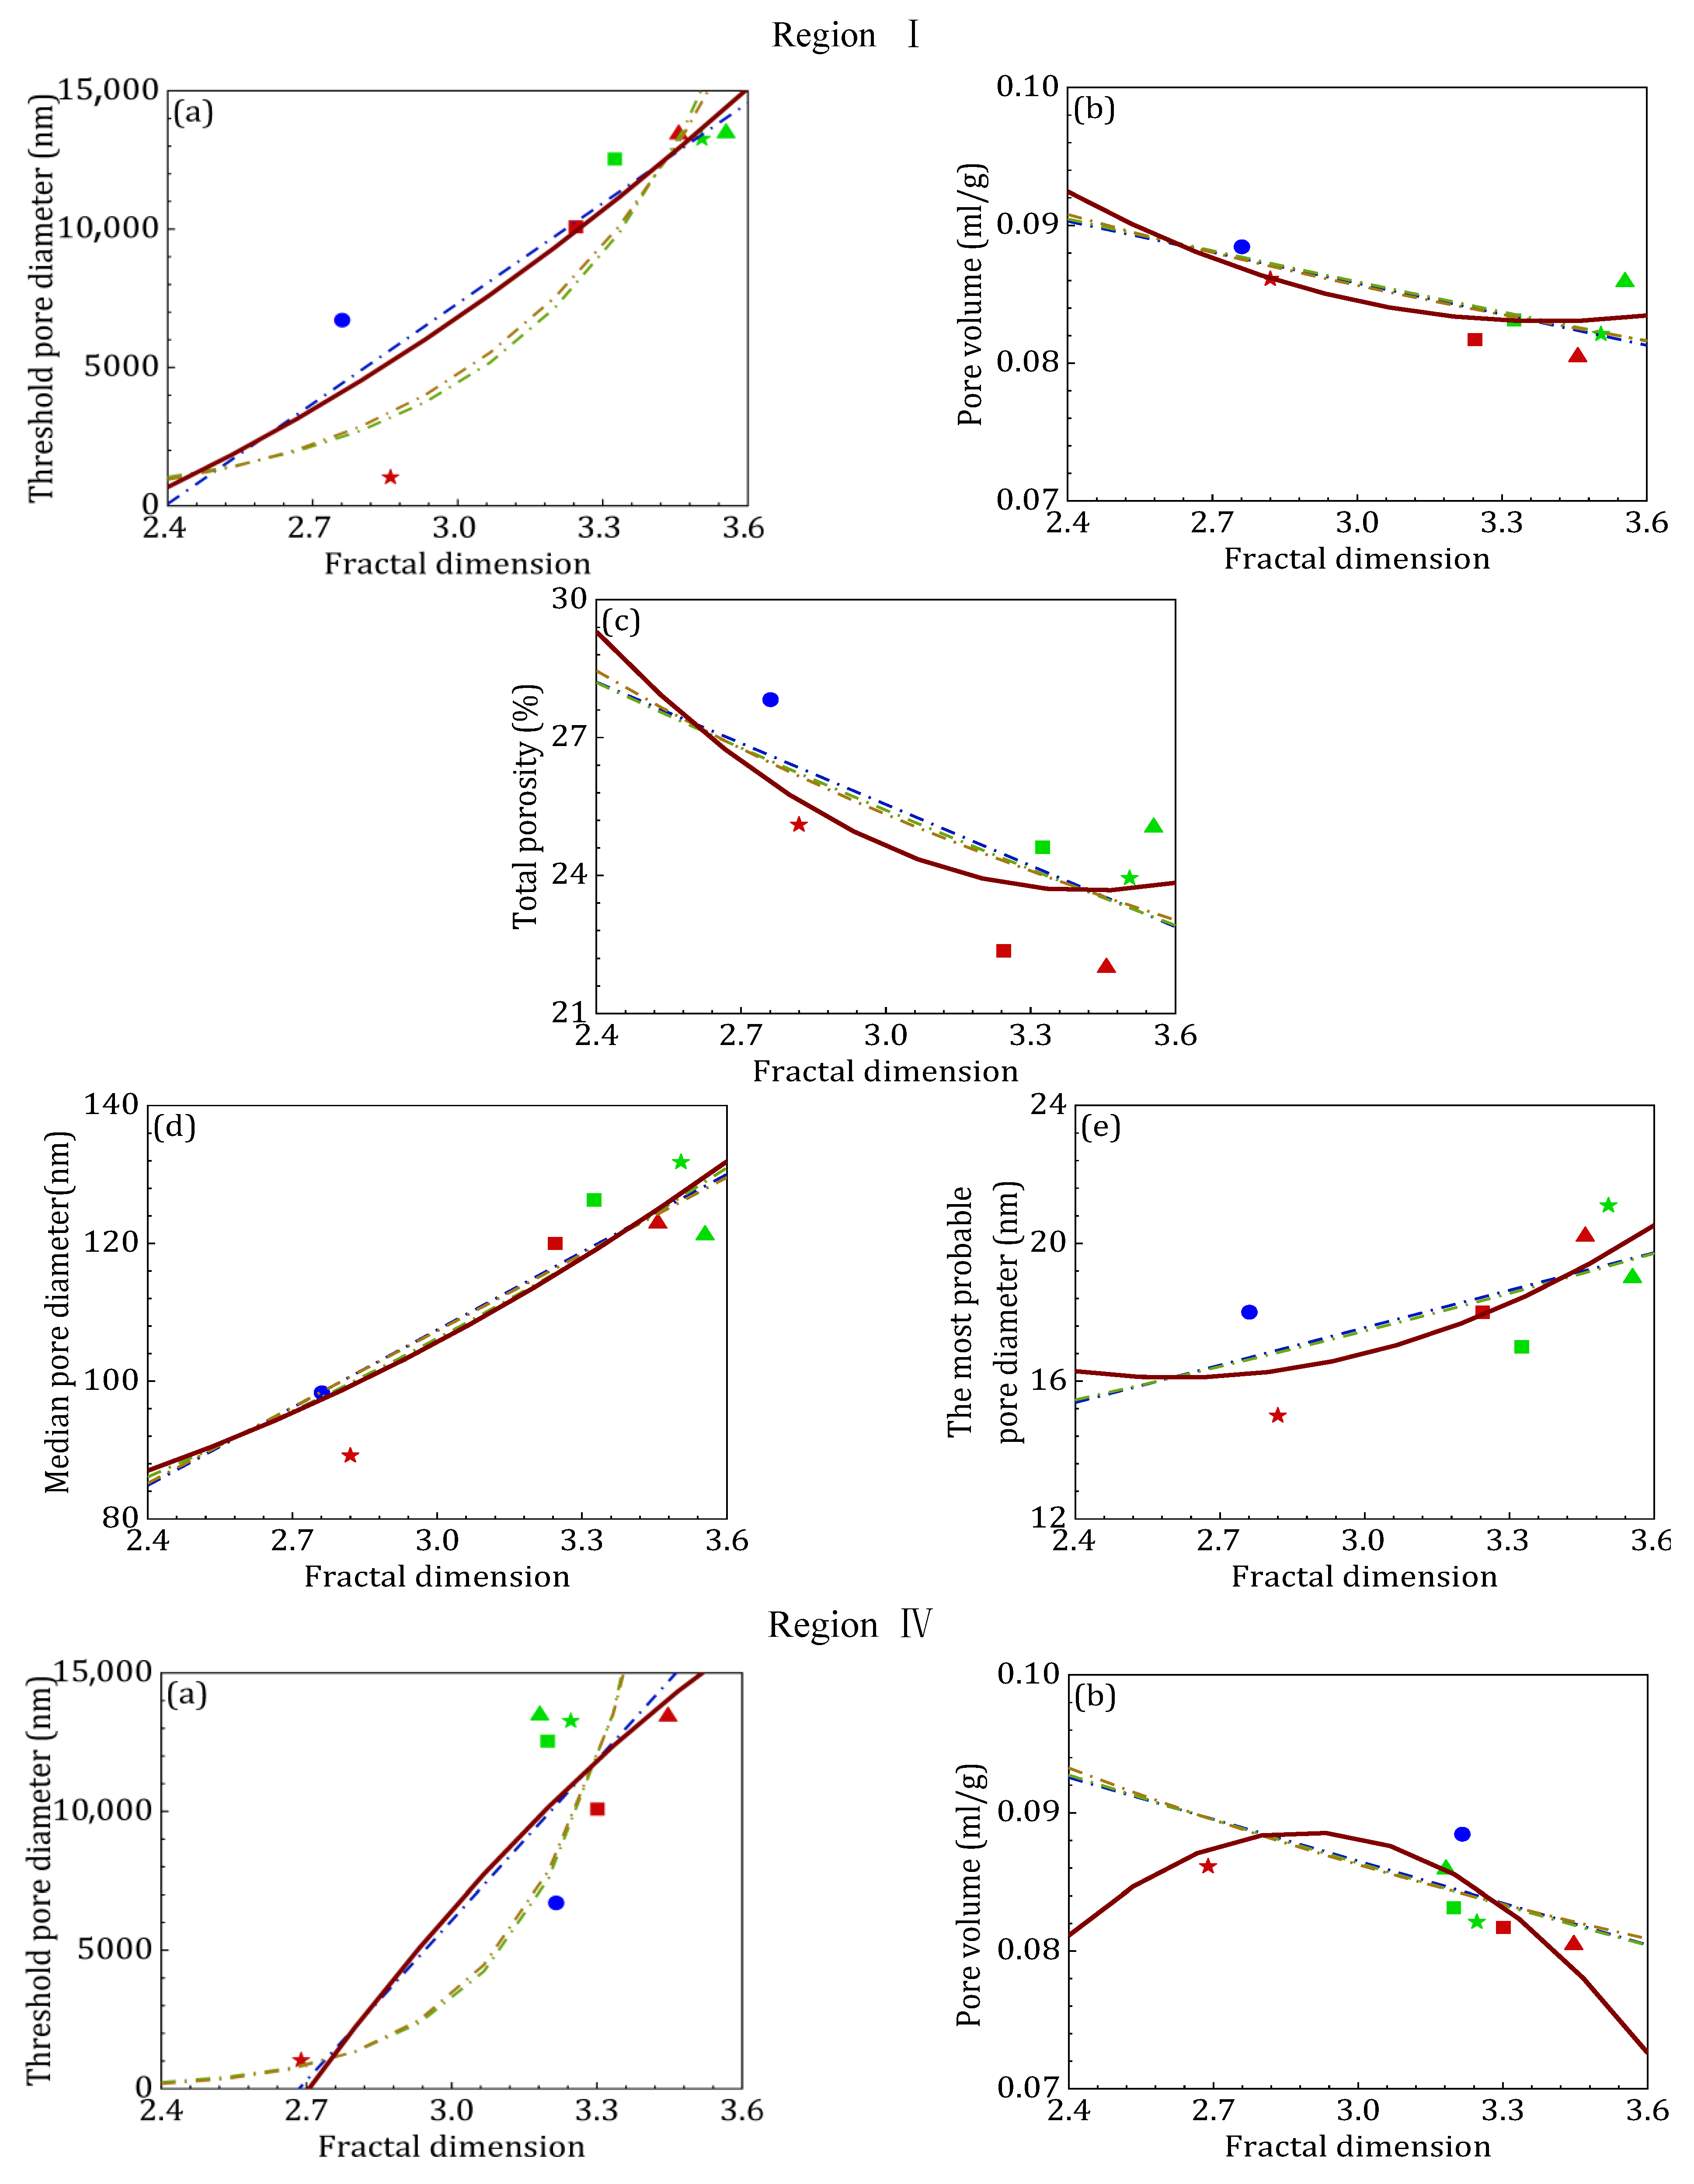
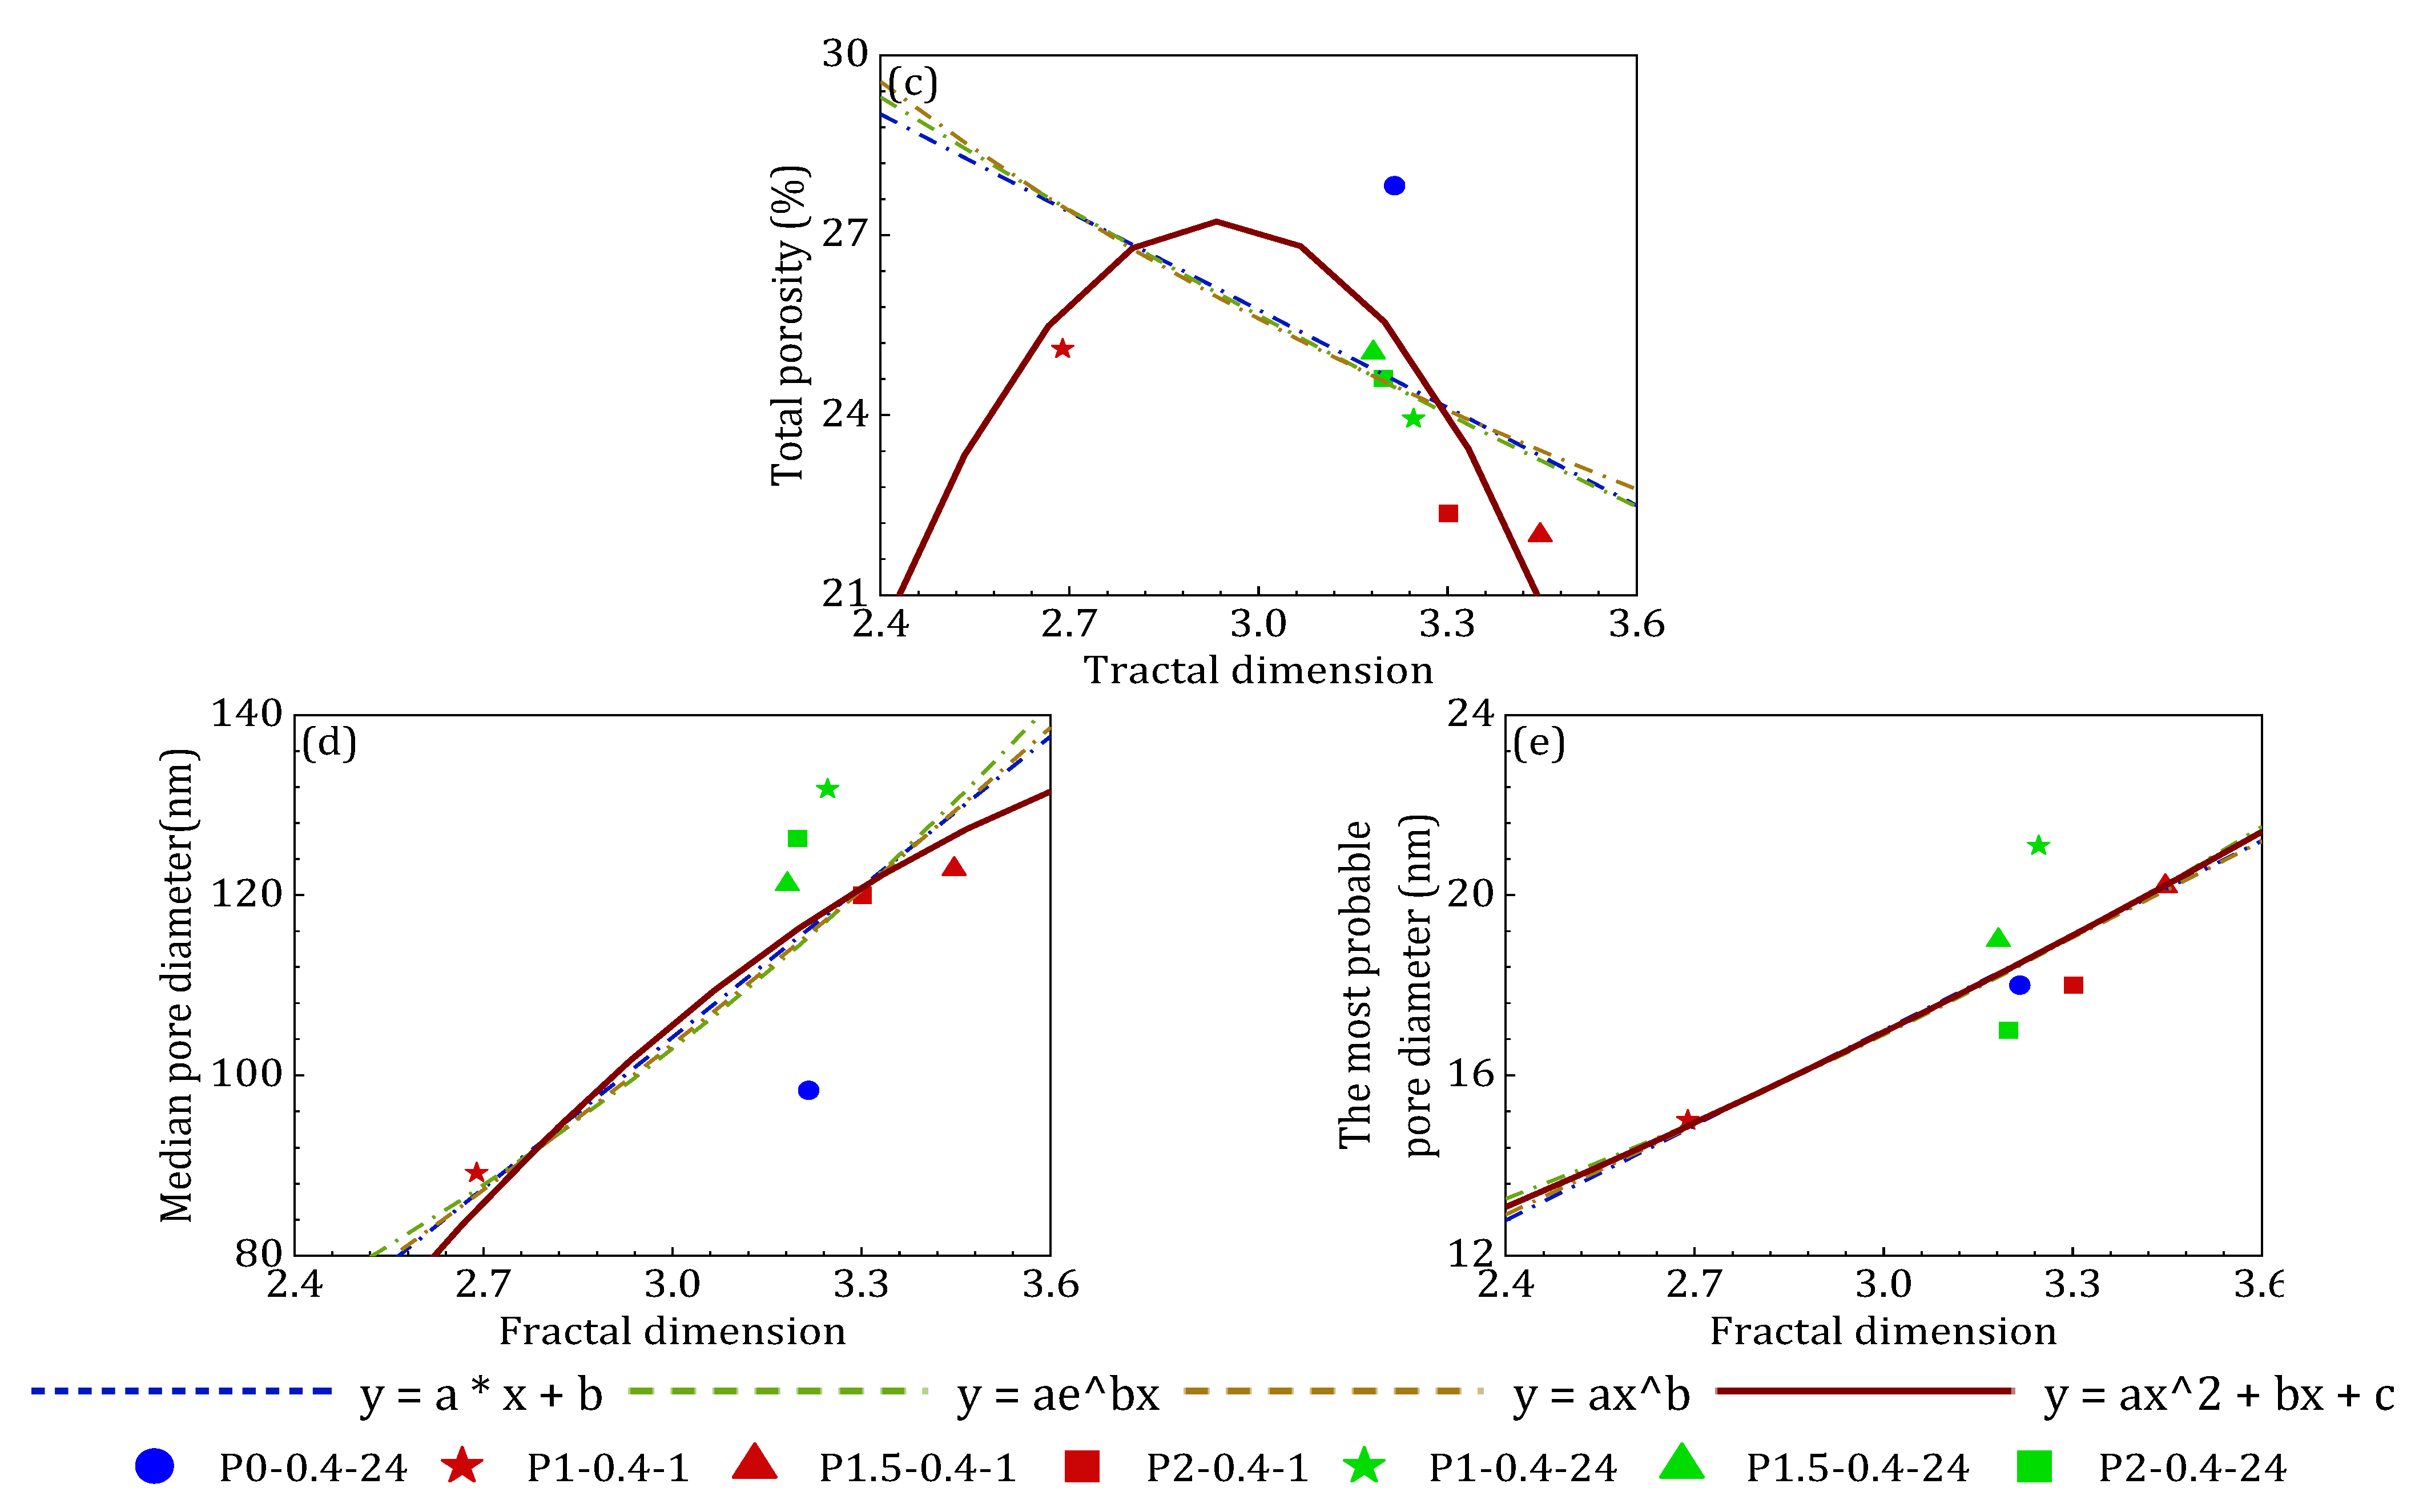
The results of this study confirmed that the pore structures of RCP-S mortar exhibit fractal characteristics with respect to pore surface area, pore volume, and pore diameter. Understanding the relationships between fractal dimension and various pore structure parameters is essential for interpreting the material’s microstructural behavior. Segments II and III were excluded from the regression analysis due to the significant influence of hydration reactions within the 0.01–1 μm range. Pores in this range are susceptible to rapid filling by carbonation products such as C–S–H and CaCO3, which can disrupt the geometric continuity of the pore network and reduce the reliability of fractal interpretation. For this reason, only Segments I and IV—representing more structurally stable pore regimes—were selected for quantitative fractal analysis [60]. As shown in Figure 12, the fractal dimensions of Segments I and IV were correlated with key pore structure parameters, including porosity, total pore volume, cumulative pore surface area, average pore diameter, median pore diameter, most probable pore diameter, and threshold pore diameter.
Regression analyses were carried out to examine the relationships between fractal dimension and key pore structure parameters using four fitting models: linear, exponential, power–law, and quadratic polynomial. The fitting results, covering both Segment I and Segment IV, are summarized in Table 6, Table 7, Table 8 and Table 9. Among the tested models, the quadratic polynomial function consistently exhibited the best overall performance. In Segment I, the relationships between fractal dimension and threshold pore size, pore volume, and median pore size achieved R2 values of 0.883, 0.798, and 0.862, respectively. These values were higher than those obtained through linear, exponential, or power–law models for the same parameters. Segment IV showed similar trends, with quadratic models providing superior fits despite slightly lower coefficients. The strength of the quadratic model lies in its ability to capture the nonlinear behavior of pore structure evolution during carbonation. Mid-scale pore parameters—such as pore volume and median pore size—demonstrated particularly strong quadratic correlations with fractal dimension, indicating that fractal geometry is sensitive to transitional pore structures that are not well described by simple linear or exponential relationships. Although other models, including exponential and power–law functions, yielded acceptable results in certain cases—especially for threshold and most probable pore sizes—the quadratic regression consistently produced higher R2 values and more statistically significant F-tests across the majority of parameters. This outcome confirms that pore complexity and fractal dimension do not evolve in a purely linear fashion but follow a more complex trajectory that is best captured by second-order relationships. These findings underscore the suitability of the quadratic polynomial model for quantifying the relationship between fractal dimension and pore structure in RCP-S mortar. The model’s robustness across different pore size ranges and structural indicators highlights its value as a predictive tool in microstructural characterization.
These findings affirm that fractal dimension is a reliable and comprehensive descriptor of pore structure in cementitious composites. Higher fractal dimensions were associated with increased quantities of finer pores and expanded surface areas, along with reduced presence of larger pores and lower total pore volumes. Such microstructural features correspond to more complex and tortuous internal pore networks. Therefore, the fractal dimension effectively reflects the morphological complexity and spatial heterogeneity of pore systems in RCP-S-based materials, offering a powerful quantitative tool for evaluating microstructural performance and guiding material optimization.

4.3. Relationship Between Fractal Dimension and Compressive Strength

Compressive strength is a critical macro-performance indicator for cementitious materials and is closely linked to their pore microstructures. The pore volume fractal dimension provides a holistic representation of the internal pore structure and is expected to correlate with the material strength accordingly.
As illustrated in Figure 12, linear, power, exponential, and quadratic polynomial functions were applied to perform regression analyses of the relationship between the fractal dimension and compressive strength. The significance of the regression parameters and functions was assessed through t-tests and F-tests, with the detailed results presented in Table 6, Table 7, Table 8 and Table 9. A positive correlation was found between the fractal dimension and compressive strength, suggesting that the increase in compressive strength, driven by the hydration products filling the capillaries and larger pores, led to a more complex pore surface morphology and a higher fractal dimension. This enhancement is not only attributed to pore refinement but also to the densification of the ITZ, where carbonation-induced CaCO3 precipitation fills microvoids and strengthens the bond between the paste and aggregate [3]. Additionally, finer particles promote better packing density, while carbonation products serve as nucleation sites for secondary hydration, contributing to overall matrix densification. These mechanisms are consistent with previous microstructural studies [5]. As shown in Table 6, Table 7, Table 8 and Table 9, quadratic polynomial regressions generally exhibited moderate correlation coefficients, while other models, such as exponential and linear regressions, showed relatively lower fitting performance in some cases. In several instances, the R2 values exceeded 0.9, particularly in Segments I and IV. However, the standard errors for the regression parameters were larger in the exponential and polynomial models, with t-test p-values frequently exceeding 0.05, indicating greater data dispersion compared to the linear and power models.
A thorough analysis revealed that the correlation coefficients for the power regressions in Segments I and IV were 0.9806 and 0.9820, respectively, with both t-test and F-test p-values below 0.001. Consequently, the fractal dimension, which captures the layered aggregate morphology, offers a direct representation of the compressive strength of RCP-S-based materials. Based on these findings, power regression is recommended as the most suitable approach for developing accurate and reliable compressive strength prediction models using the fractal dimension.

4.4. Verification and Discussion

4.4.1. Verification

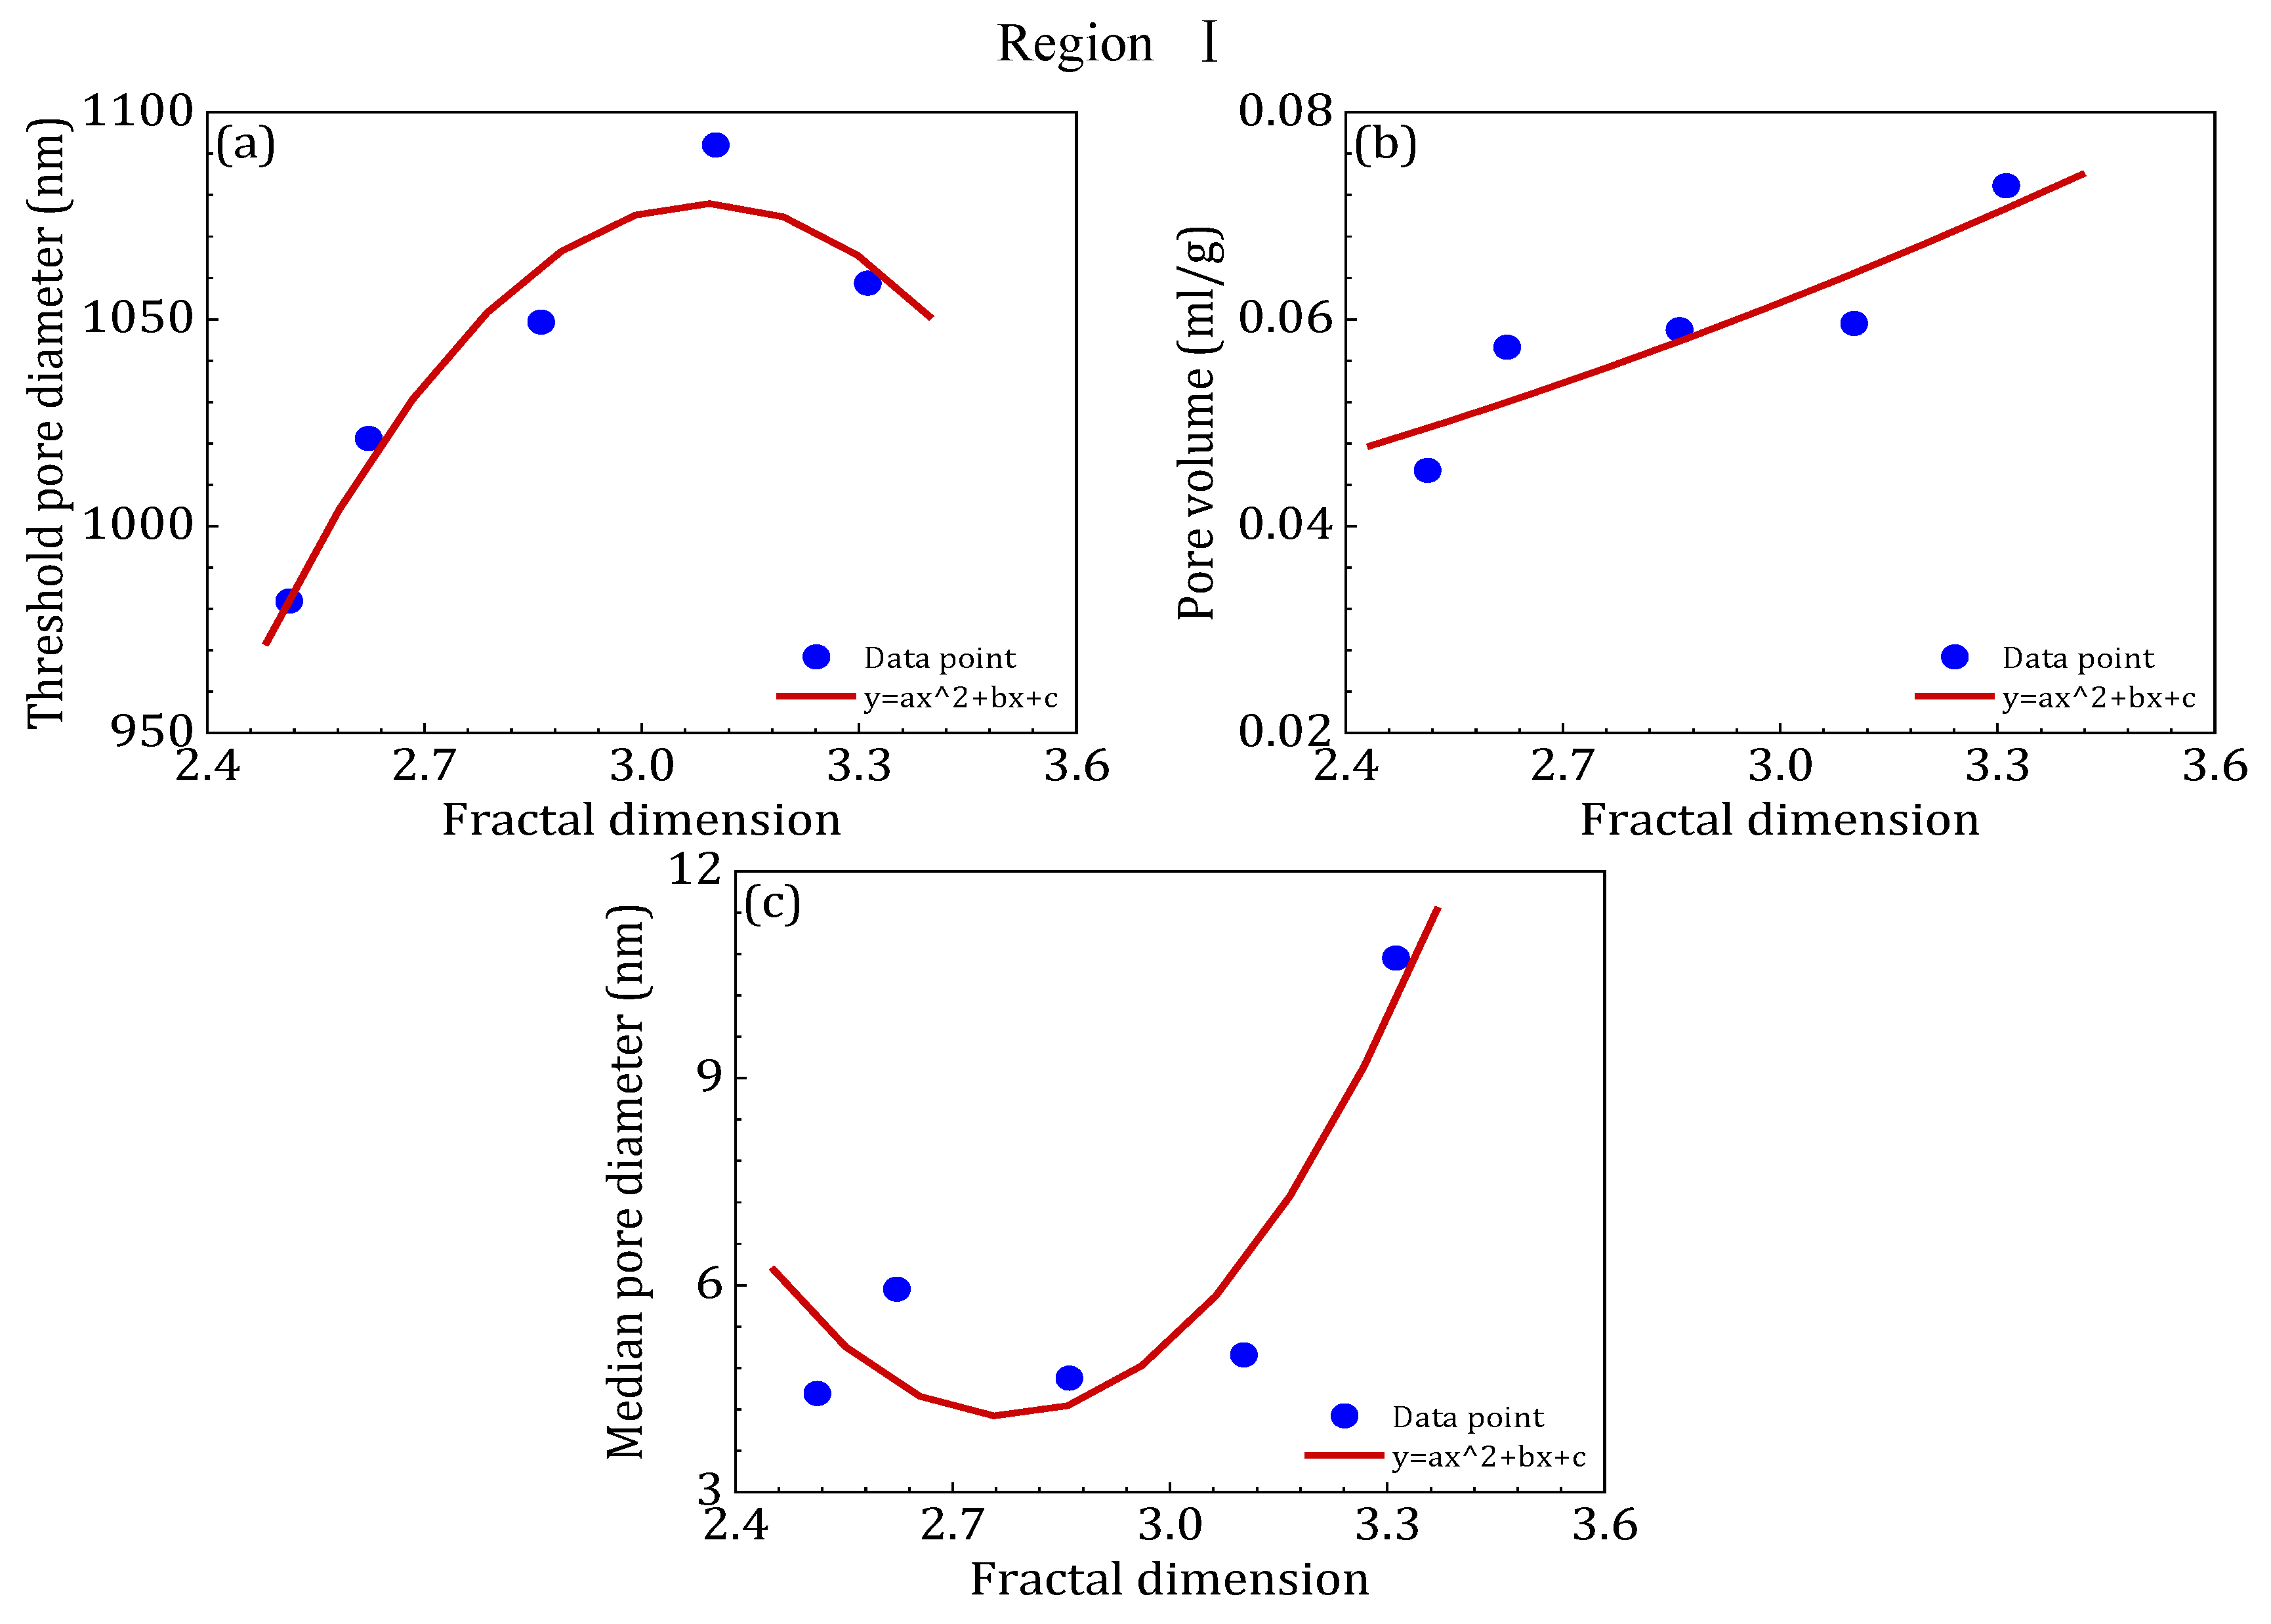
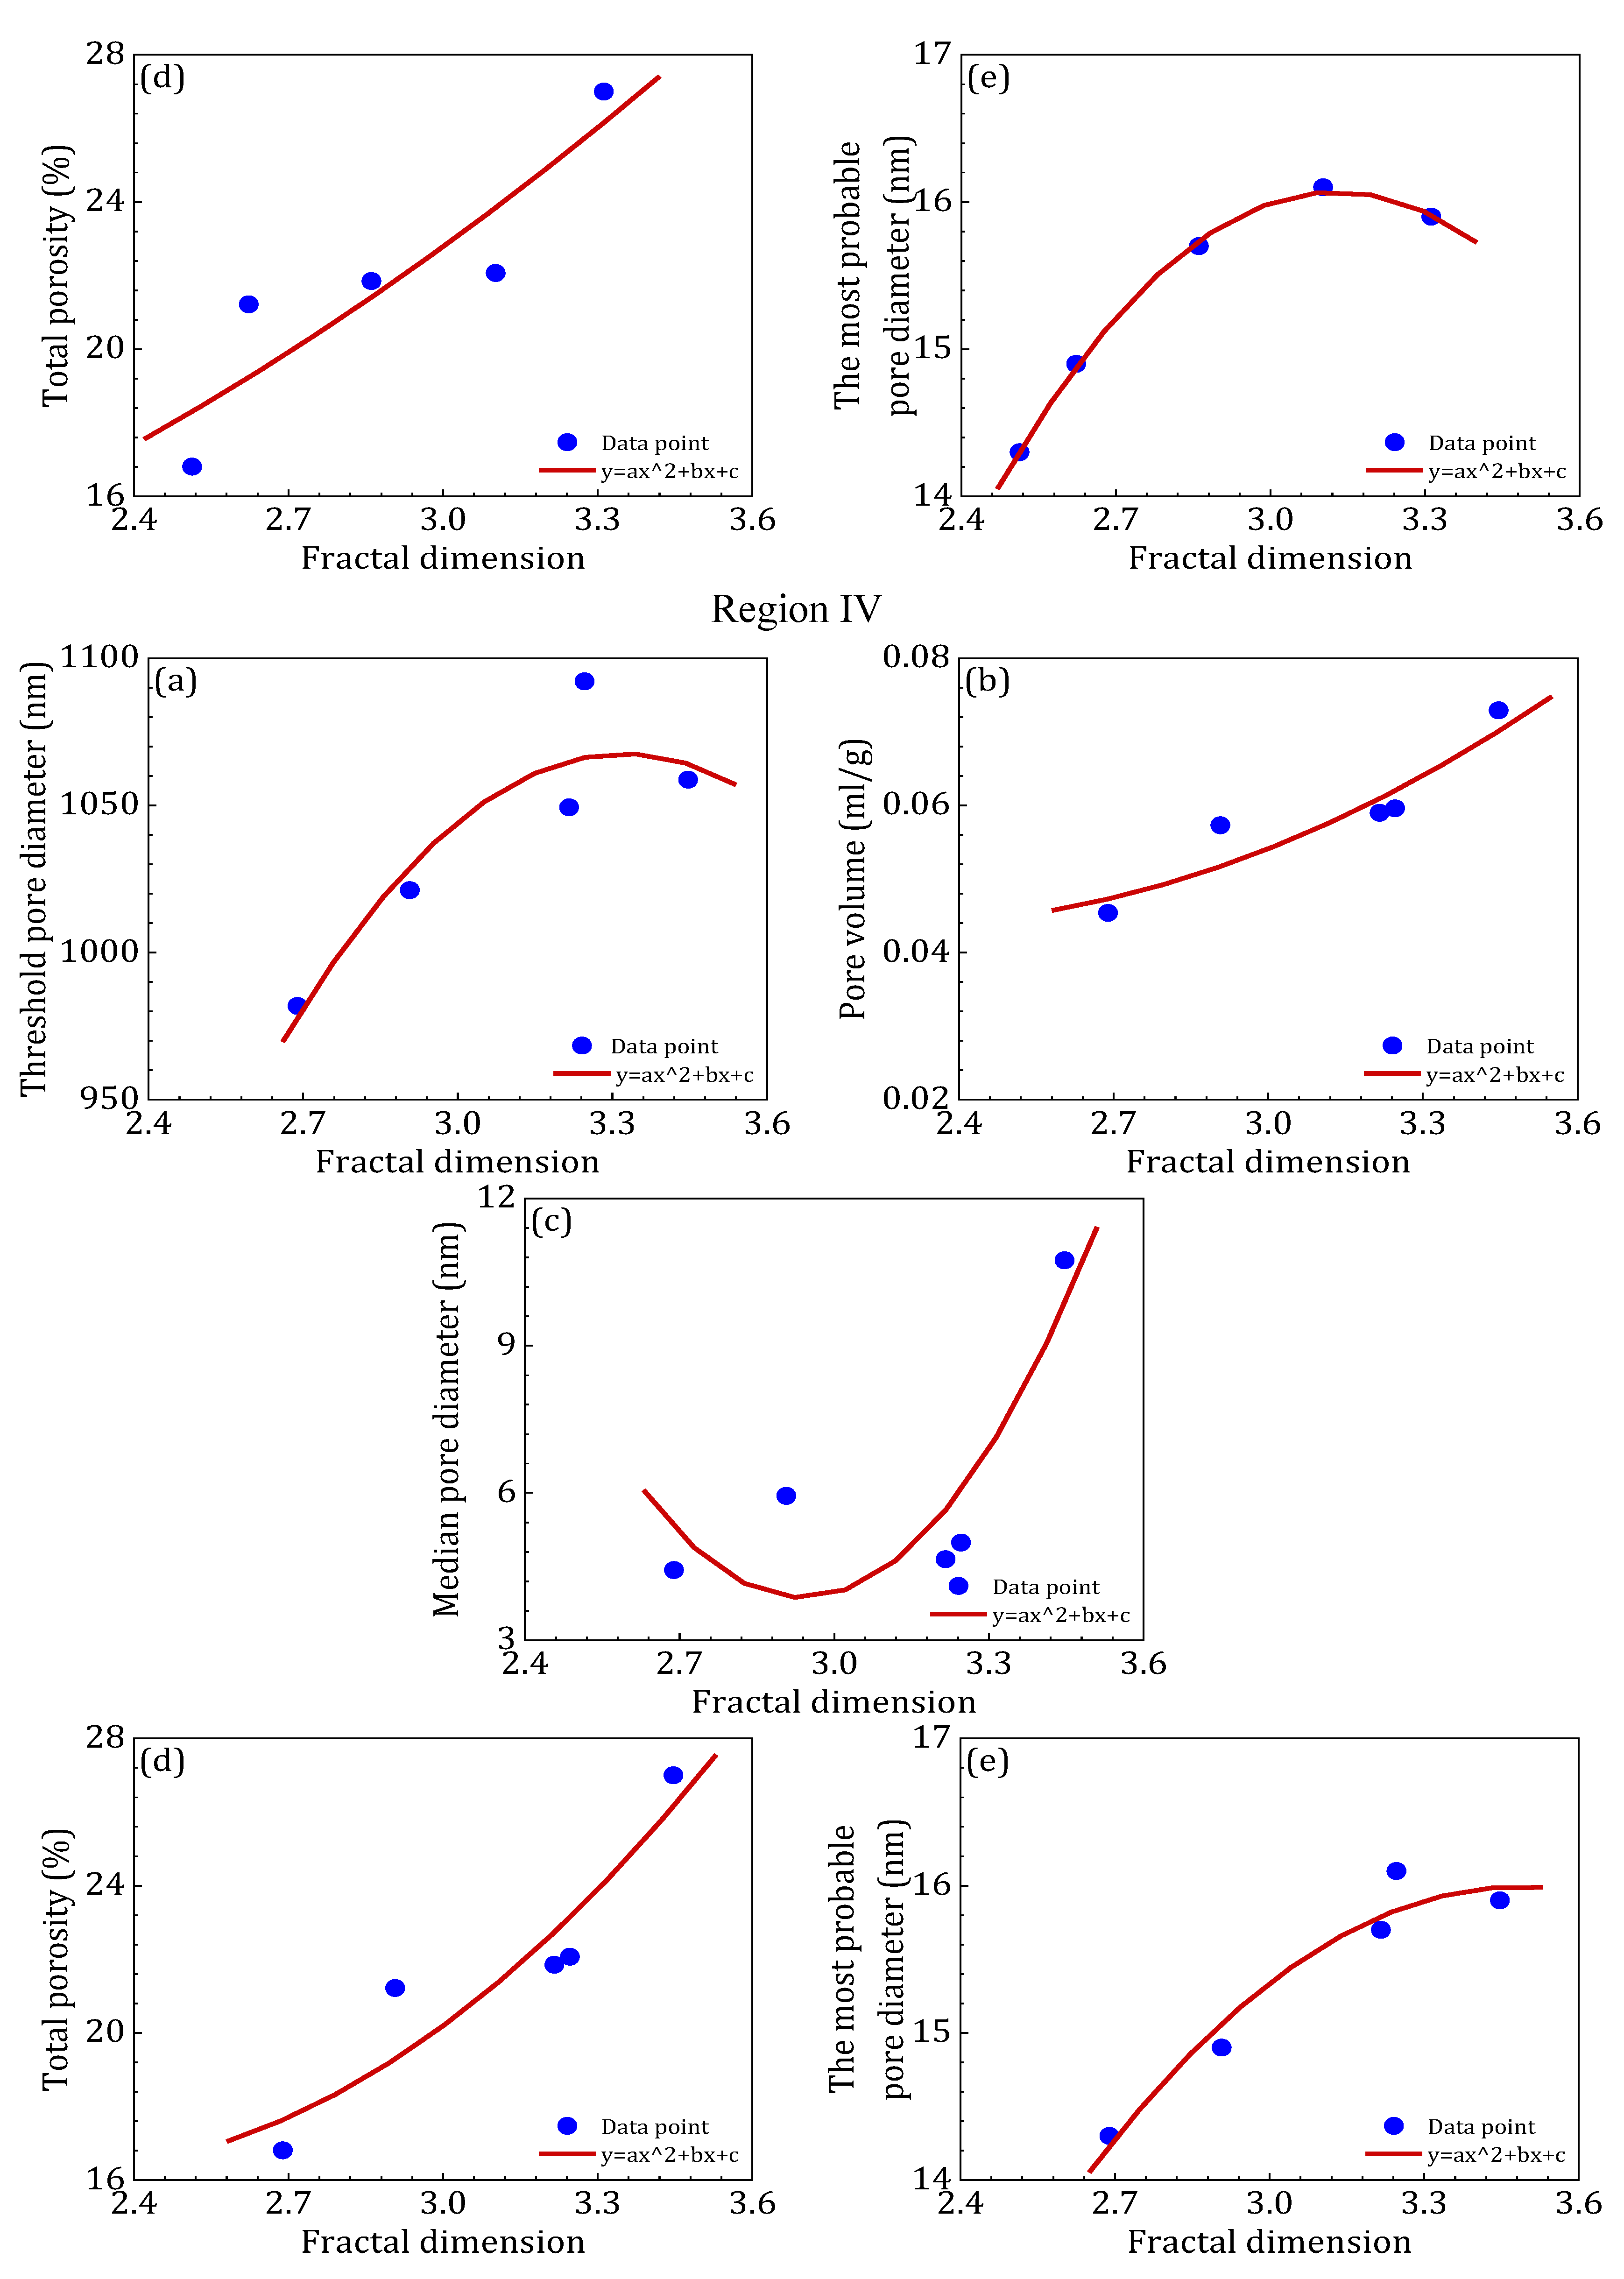
The pore structure in the experimental specimens reported by Liu et al. [61] was predominantly composed of gel pores, fine pores, and mesopores, with relatively few large pores, as summarized in Table 10. Given the structural similarities between these specimens and the RCP-S mortar investigated in this study, the pore data from Liu et al. were employed to validate the robustness of the proposed regression model relating compressive strength to fractal dimension.
To this end, a polynomial regression analysis was performed to examine the correlation between fractal dimension and compressive strength. The resulting fitting curve is presented in Figure 13. The corresponding regression coefficients, as well as the results of the t-tests and F-tests used to assess the statistical significance of both the individual parameters and the overall regression function, are provided in Table 11.

4.4.2. Discussion

This study demonstrated that both carbonation time and sand-to-powder ratio significantly influenced the porosity and pore size distribution of RCP-S mortar. Prolonged carbonation effectively reduced the total porosity, suggesting that the carbonation process promoted matrix densification. Similar trends have been reported by previous researchers. For instance, Bertos et al. [62] observed that extended carbonation durations accelerated CaCO3 formation and led to notable reductions in porosity. These findings are consistent with the results of the present study and highlight the critical role of carbonation conditions in modifying the pore structure of RCP-S mortar. These trends are generally consistent with previous observations in recycled aggregate concrete and carbonation-exposed systems. For instance, studies by Li et al. [22] and Yang et al. [47] demonstrated similar strength gains and pore densification due to CaCO3 precipitation and pore filling during accelerated carbonation, supporting the present findings.
To systematically examine the influence of these factors, various sand-to-powder ratios and carbonation durations were applied. This multivariable approach parallels that used in earlier research; for example, James and Assadi-Langroudi [63] employed a comparable experimental framework to investigate the effects of carbonation on recycled construction waste, thereby enhancing the reproducibility and applicability of their findings. Nonetheless, the present study is limited by the relatively narrow range of carbonation pressures and sand-to-powder ratios. Future work should broaden the experimental scope to provide a more comprehensive understanding of how carbonation influences the microstructural evolution of RCP-S materials.
Fractal dimension analysis revealed that the complexity of the pore network was directly affected by both carbonation duration and sand content, which in turn influenced the mechanical performance. While mercury intrusion porosimetry indicated that prolonged carbonation led to reduced total porosity and refined pore structure, it is important to note that the strength enhancement cannot be solely attributed to porosity reduction. The formation of reaction products such as CaCO3 also contributes significantly to matrix densification and particle bonding, thereby improving strength. These combined effects—including both microstructural compaction and chemical reaction—account for the observed increase in compressive strength under extended carbonation durations. Moreover, pore complexity characterized by higher fractal dimensions has been shown to affect not only mechanical properties but also water infiltration behavior in porous media. Recent studies, such as Zhang et al. [64], have demonstrated that fractal characteristics can significantly influence the rate and pattern of moisture transport, especially in heterogeneous or cementitious systems. Although this study primarily focused on mechanical implications, these insights suggest that improved fractal connectivity and pore refinement could also enhance the water resistance of RCP-S mortar. Future work may further explore this coupling using permeability tests and multiphysics simulations.
These findings offer practical guidance for optimizing the production of RCP-S-based construction materials. The observed improvements in densification and mechanical performance under prolonged carbonation and tailored sand contents suggest strategies to enhance durability and extend service life in practical applications. Importantly, as noted by Wang et al. [65], carbonation not only improves the structural properties of recycled cementitious materials but also contributes to carbon sequestration, offering additional environmental benefits.
Recent research has increasingly emphasized the role of pore structure in determining the mechanical performance of cementitious materials. In particular, fractal theory has been shown to be an effective tool for quantitatively describing pore complexity and establishing correlations with strength properties. Jiang et al. [66,67] have applied this approach across different material systems, including recycled mortars and fractured sandstones, demonstrating that fractal dimensions derived from NMR data are closely related to compressive strength and pore connectivity. These findings confirm the broad applicability of fractal analysis in assessing pore structure evolution and predicting mechanical behavior, thereby offering valuable theoretical support for the current investigation.
Compared with ordinary Portland cement (OPC) mortar, the RCP-S specimens investigated in this study exhibited markedly different pore structure characteristics and fractal behavior [68]. The fractal dimensions calculated for RCP-S mortar were generally higher than those reported for OPC systems, highlighting the increased structural heterogeneity and multiscale complexity introduced by recycled constituents. Notably, the compressive strength and shrinkage performance of RCP-S mortar under carbonation were comparable to, and in some instances exceeded, those of OPC mortar. These results indicate that, despite differences in composition, RCP-S mortar demonstrates favorable mechanical properties and durability. When evaluated through the framework of fractal pore structure analysis, RCP-S mortar presents distinct performance and sustainability benefits that support its broader application in low-carbon construction materials.
Future research should further explore the influence of environmental conditions—such as humidity, temperature, and CO2 concentration—on the effectiveness of carbonation curing. In addition, the application of advanced analytical techniques, such as X-ray CT scanning and 3D image reconstruction, could provide deeper insights into the internal pore structure and crack distribution of RCP-S mortars. Long-term durability assessments, including chloride penetration and freeze–thaw resistance tests, are also recommended to validate their field applicability. Furthermore, the incorporation of additional industrial by-products or reinforcing fibers may further enhance both the mechanical performance and sustainability of these materials.

5. Conclusions

This study systematically investigated the effects of sand-to-powder ratio and carbonation duration on the mechanical performance and pore structure of recycled cement paste–sand mortar. Four mortar groups with varying sand content were subjected to carbonation for one and twenty-four hours. Mechanical tests and pore structure characterization using mercury intrusion porosimetry and scanning electron microscopy revealed that increasing the sand content resulted in higher porosity and reduced compressive strength. In contrast, prolonged carbonation significantly refined the pore structure by reducing macropores and increasing the proportion of fine pores, thereby enhancing matrix compactness and strength.
A Menger sponge-based fractal model was employed to describe the multiscale pore structure. The pore size distribution was divided into four segments, among which the finest and coarsest pore ranges exhibited distinct fractal characteristics. Regression analysis established strong mathematical relationships between fractal dimension and pore structure parameters. The fractal dimension increased exponentially with pore diameter and showed quadratic relationships with porosity, pore volume, and specific surface area. Additionally, a power–law relationship was observed between fractal dimension and compressive strength, enabling strength prediction based on pore geometry.
Overall, the results confirm that fractal analysis is a robust tool for quantifying pore complexity and linking it to strength development. This work provides a theoretical foundation for optimizing the pore structure and performance of recycled cementitious materials in the pursuit of sustainable construction.

Author Contributions

Conceptualization, Y.Y.; methodology, Y.Y.; Supervision, J.Y.; validation, C.Z.; investigation, C.Z. and Z.G.; resources, C.Z.; writing—original draft preparation, Y.Y.; writing—review and editing, Z.G. and J.Y.; visualization, Y.Y.; funding acquisition, C.Z. All authors have read and agreed to the published version of the manuscript.

Funding

This research was sponsored by the National Natural Science Foundation of China (Grant No. 52208395) and Nantong City Social Livelihood Science and Technology Project (MS22022067). The authors are grateful for the financial support.

Data Availability Statement

The original contributions presented in this study are included in the article. Further inquiries can be directed to the corresponding authors.

Conflicts of Interest

The authors declare no conflicts of interest.

References

  1. Andrew, R.M. Global CO2 emissions from cement production, 1928–2018. Earth Syst. Sci. Data 2018, 10, 2213–2239. [Google Scholar] [CrossRef]
  2. Jiang, C.; Li, Q.; Tang, Y.; Wang, L. Effect of microwave pretreatment on the properties and microstructure of low-concentration carbon dioxide early cured cement-based materials. Constr. Build. Mater. 2024, 314, 125692. [Google Scholar]
  3. Han, S.; Zhao, S.; Lu, D.; Wang, D. Performance improvement of recycled concrete aggregates and their potential applications in infrastructure: A review. Buildings 2023, 13, 1411. [Google Scholar] [CrossRef]
  4. Mao, Y.; He, P.; Drissi, S.; Zhang, J.; Hu, X.; Shi, C. Effect of conditions on wet carbonation products of recycled cement paste powder. Cement. Concr. Comp. 2023, 144, 105307. [Google Scholar] [CrossRef]
  5. Liu, J.; An, S.; Zhang, Y. Mechanism of regulating the mechanical properties and paste structure of supersulfated cement through ultrafine iron tailings powder. Cement Concr. Comp. 2023, 140, 105061. [Google Scholar] [CrossRef]
  6. Martins, P.; Cachim, P.; Faria, P. Performance of concrete with recycled aggregates and supplementary cementitious materials: A review. Constr. Build. Mater. 2023, 338, 127544. [Google Scholar]
  7. Fajardo, G.; Rodriguez, R.; Ramos, M. Durability of concrete with recycled aggregates and supplementary cementitious materials under chloride attack. J. Clean. Prod. 2022, 351, 131473. [Google Scholar]
  8. Li, W.; Shumuye, E.D.; Shiying, T.; Wang, Z.; Zerfu, K. Eco-friendly fibre reinforced geopolymer concrete: A critical review on the microstructure and long-term durability properties. Case Stud. Constr. Mat. 2022, 16, e00894. [Google Scholar] [CrossRef]
  9. Lee, S.; Kim, J. Influence of microwave drying technology on the carbonation curing process of cementitious materials. Materials 2023, 16, 2553. [Google Scholar]
  10. Ji, X.; Chan, S.Y.N.; Feng, N. Fractal model for simulating the space-filling process of cement hydrates and fractal dimensions of pore structure of cement-based materials. Cement Concr. Res. 1997, 27, 1691–1699. [Google Scholar] [CrossRef]
  11. Wei, D.; Hurley, R.C.; Poh, L.H.; Dias-da-Costa, D.; Gan, Y. The role of particle morphology on concrete fracture behaviour: A meso-scale modelling approach. Cement Concr. Res. 2020, 134, 106096. [Google Scholar] [CrossRef]
  12. Lin, Y.; He, T.; Da, Y. Effects of recycled micro-powders mixing methods on the properties of recycled concrete. J. Build. Eng. 2023, 80, 107994. [Google Scholar] [CrossRef]
  13. Tittarelli, F.; Moriconi, G.; Bracchi, G. Recycled powders from construction and demolition waste: Characterization and possible use in cement-based materials. Cement Concr. Comp. 2021, 119, 103992. [Google Scholar]
  14. Su, C.; Zhang, J.; Ding, Y. Research on reactivity evaluation and micro-mechanism of various solid waste powders for alkali-activated cementitious materials. Constr. Build. Mater. 2024, 411, 134374. [Google Scholar] [CrossRef]
  15. Kaufmann, J. Characterization of pore space of cement-based materials by combined mercury Wool’s metal intrusion. J. Am. Ceram. Soc. 2009, 91, 209–216. [Google Scholar] [CrossRef]
  16. Chen, Y.; Li, L.; Zhao, X.; Wang, X. Multi-scale pore structure its influence on mechanical properties of recycled aggregate concrete. J. Build. Mater. 2022, 35, 198–208. [Google Scholar]
  17. Zhu, L.; Wang, L.; Yang, X. Physico-mechanical and durability characterization of eco-ternary cementitious binder containing calcined clay/rice husk ash and recycled glass powder. Materials 2023, 16, 7009. [Google Scholar]
  18. Han, L.; Liu, L.; Chen, G. Effects of multi-walled carbon nanotubes recycled fine aggregates on the multi-generational cycle properties of reactive powder concrete. J. Mater. Sci. Eng. 2021, 45, 301–312. [Google Scholar]
  19. Liu, J.; Wang, H.; Song, Z. Optimization of steam-curing regimes for enhanced concrete properties. Constr. Build. Mater. 2023, 307, 124927. [Google Scholar]
  20. Benson, J.E. Challenges and advances in the use of mercury intrusion porosimetry for characterizing pore structures in construction materials. Mater. Struct. 2022, 55, 83. [Google Scholar]
  21. Johnson, L.M. Understanding the limitations of MIP in pore size distribution measurements of cement-based materials. Cement Concr. Comp. 2021, 117, 103915. [Google Scholar]
  22. White, R.E. Improving the accuracy of mercury intrusion porosimetry for fine pore measurements in recycled concrete powder using solvent-exchange methods. J. Microsc. 2023, 289, 79–90. [Google Scholar]
  23. Tucker, A.D. Solvent-exchange pretreatment: A method to improve MIP measurements of microstructural properties of construction materials. Mater. Sci. Eng. A 2022, 843, 143213. [Google Scholar]
  24. Esparham, A.; Rezaei, S. Comprehensive investigation of the durability mechanical properties of eco-friendly geopolymer concrete (alkali-activated). Int. J. Environ. Sci. Technol. 2024, 21, 6615–6636. [Google Scholar] [CrossRef]
  25. Guan, D. Fractal and multifractal analysis of microscopic pore structure of UHPC matrix modified with nano silica. Fractal. Fract. 2024, 8, 360. [Google Scholar] [CrossRef]
  26. Zhang, Y.; Li, H.; Chen, Y. A review on the Menger sponge fractal structure and its applications in materials. Materials 2019, 12, 1642. [Google Scholar]
  27. Wang, X.; Liu, Q.; Li, J. Application of the Menger sponge model in sound absorption materials. Appl. Acoust. 2020, 142, 107520. [Google Scholar]
  28. Chen, Z.; Yang, L.; Wang, Y. Investigation of heat transfer characteristics in porous media based on the Menger sponge model. Int. J. Heat Mass Transf. 2018, 125, 1234–1245. [Google Scholar]
  29. Khelafi, A.; Kaid, N.; Soltani, R.; Kerdal, D.E.; Khelafi, H. Elaboration of recycled concrete sand aggregates-based mortars: An alternative recycling process. Constr. Build. Mater. 2023, 398, 132333. [Google Scholar] [CrossRef]
  30. Sui, Y.; Ou, C.; Liu, S.; Zhang, J.; Tian, Q. Study on properties of waste concrete powder by thermal treatment and application in mortar. Appl. Sci. 2020, 10, 998. [Google Scholar] [CrossRef]
  31. Zhao, X.; Li, L.; Yang, B.; Yang, C. Application of fractal theory to evaluate the drying shrinkage behavior of soil composites from recycled waste clay brick. Fractal Fract. 2023, 7, 25. [Google Scholar] [CrossRef]
  32. Anleu, P.B.; Pape, Y.L.; Chen, Q.; Advincula, R.; Sun, X.G.; Felder, J.B.; Meyer, H.M.; Post, B.K.; Lance, M.J.; Paranthaman, M.P. An innovative carbonated cementitious material and its printability and carbon mineralization capacity. Prog. Addit. Manuf. 2024, 9, 435–444. [Google Scholar] [CrossRef]
  33. Hoang, N.D. Leveraging a hybrid machine learning approach for compressive strength estimation of roller-compacted concrete with recycled aggregates. Mathematics 2024, 12, 2542. [Google Scholar] [CrossRef]
  34. Li, K.; Zhang, L.; Wang, Z. Effect of recycled aggregate its application on concrete properties: A review. J. Clean. Prod. 2022, 351, 131423. [Google Scholar]
  35. Khan, M.I.; Hassan, M.F. Impact of recycled aggregate on the performance of concrete: A review. Constr. Build. Mater. 2022, 349, 128533. [Google Scholar]
  36. Hossain, K.M.A.; Lachemi, M. Sustainability of recycled aggregate concrete: A review on the impact of different factors. Sustainability 2022, 14, 695. [Google Scholar]
  37. Wang, H.; Zhou, X.; Yang, T. Assessment of the influence of recycled fine aggregates on the mechanical and durability properties of concrete. Materials 2023, 16, 116. [Google Scholar] [CrossRef]
  38. Kumar, A.; Ghosh, S. Influence of recycled concrete aggregate on the microstructure and mechanical properties of concrete: A review. Constr. Build. Mater. 2022, 334, 127483. [Google Scholar]
  39. Clark, J.; Burns, L. Effectiveness of fractal theory in characterizing the pore structure of recycled concrete. J. Build. Perform. Simul. 2023, 14, 89–104. [Google Scholar]
  40. Klaver, J.; Desbois, G.; Urai, J.L.; Littke, R. BIB-SEMstudy of the pore space morphology in early mature Posidonia shale from the Hils area Germany. Int. J. Coal Geol. 2012, 103, 12–25. [Google Scholar] [CrossRef]
  41. Moro, F.; Bohni, H. Ink-bottle effect in mercury intrusion porosimetry of cement-based materials. J. Colloid. Interface Sci. 2002, 246, 135–149. [Google Scholar] [CrossRef]
  42. Zhu, C.H.; Fang, Y.; Wei, H. Carbonation-cementation of recycled hardened cement paste powder. Constr. Build. Mater. 2018, 192, 224–232. [Google Scholar] [CrossRef]
  43. Andrade, C.; Prieto, M.; Zuloaga, P. Assessment of recycled concrete fines for sustainable use in concrete production. Sustain. Mater. Technol. 2021, 29, e00277. [Google Scholar]
  44. Zhang, B.; Zhang, Y.; Li, Y.; Xu, H.; Li, L. Effects of recycled fine aggregate and fly ash on the shrinkage and creep performance of recycled aggregate concrete. Constr. Build. Mater. 2021, 271, 121843. [Google Scholar]
  45. Sosa, M.E.; Zega, C.J. Experimental and estimated evaluation of drying shrinkage of concrete made with fine recycled aggregates. Sustainability 2023, 15, 7666. [Google Scholar] [CrossRef]
  46. Pedro, D.; Brito, J.D.; Evangelista, L. Drying shrinkage of concrete made with recycled aggregates—A review. Materials 2021, 14, 3725. [Google Scholar]
  47. Yang, J.; Piao, R.Z.; Zhu, C.H.; Yoo, D.Y. Carbonation mechanism and cementation properties of recycled cement paste based on CO2 injection time and pressure. Constr. Build. Mater. 2024, 447, 138104. [Google Scholar] [CrossRef]
  48. ISO 679:2009; Cement—Test Methods—Determination of Strength. International Organization for Standardization: Geneva, Switzerland, 2009.
  49. Evangelista, L.; de Brito, J. Durability performance of concrete made with fine recycled concrete aggregates. Materials 2021, 14, 395. [Google Scholar] [CrossRef]
  50. Zhang, H.; Xiao, J.; Tang, Y.; Duan, Z.; Poon, C.S. Long-term shrinkage and mechanical properties of fully recycled aggregate concrete: Testing and modelling. Cem. Concr. Compos. 2022, 130, 104527. [Google Scholar] [CrossRef]
  51. Kim, H.J.; Ulm, F.J.; Masic, A. Time-space-resolved chemical deconvolution of cementitious colloidal systems using Raman spectroscopy. Langmuir 2021, 37, 7019–7031. [Google Scholar]
  52. Rostami, V.; Shao, Y.; Boyd, A.J. Carbonation curing versus steam curing for precast concrete production. J. Mater. Civ. Eng. 2022, 24, 1221–1229. [Google Scholar] [CrossRef]
  53. Gao, Q.; Li, X.G.; Shi, X.D.; Li, X.L.; Lyu, X.J.; Zhu, X.N.; Ren, Y.G. Clean and high-value recycling approach for waste concrete powder: Mechano-chemical activation of pozzolanic activity. Powder Technol. 2025, 458, 120988. [Google Scholar] [CrossRef]
  54. Atzeni, C.; Pia, G.; Sanna, U. A geometrical fractal model for the porosity and permeability of hydraulic cement pastes. Constr. Build. Mater. 2010, 24, 1843–1847. [Google Scholar] [CrossRef]
  55. Katz, A.J.; Thompson, A.H. Quantiative prediction of permeability in porous rock. Phys. Rev. B 1986, 34, 8179. [Google Scholar] [CrossRef]
  56. Zeng, Q.; Li, K.; Fen-Chong, T.; Dangla, P. Pore structure characterization of cement pastes blended with high-volume fly-ash. Cement Concr. Res. 2012, 42, 194–204. [Google Scholar] [CrossRef]
  57. Zarnaghi, V.N.; Fouroghi-Asl, A.; Nourani, V.; Ma, H. On the pore structures of lightweight self-compacting concrete containing silica fume. Constr. Build. Mater. 2018, 193, 557–564. [Google Scholar] [CrossRef]
  58. Ma, H.; Sun, J.; Wu, C.; Yi, C.; Li, Y. Study on the pore and microstructure fractal characteristics of alkali-activated coal gangue-slag mortars. Materials 2020, 13, 2442. [Google Scholar] [CrossRef]
  59. Lai, J.; Wu, C.; Liao, N.; Shen, H.; Fang, X.; Wu, J.; Xu, J.; Li, L.; Long, B.; Wei, D. Correlation between fractal dimension and particle size distribution: Insight into energy-particle size distribution characterization analysis and prediction. Miner. Eng. 2025, 229, 109399. [Google Scholar] [CrossRef]
  60. Yan, S.; Liu, Y.; Liang, Y. A space fractal derivative crack model for characterizing chloride ions superdiffusion in concrete in the marine tidal zone. Constr. Build. Mater. 2024, 450, 138585. [Google Scholar] [CrossRef]
  61. Liu, L.; Fang, Z.; Qi, C.; Zhang, B.; Guo, L.; Song, K.I.-I.L. Experimental investigation on the relationship between pore characteristics and unconfined compressive strength of cemented paste backfill. Constr. Build. Mater. 2018, 179, 254–264. [Google Scholar] [CrossRef]
  62. Bertos, M.F. Carbonation of cement-based materials and its impact on pore structure. J. Sustain. Cem.-Based Mater. 2022, 11, 123–134. [Google Scholar]
  63. James, M.; Assadi-Langroudi, A. Multi-variable analysis of carbonation effects on recycled construction materials. Constr. Build. Mater. 2023, 291, 123780. [Google Scholar]
  64. Zhang, X.D.; Huang, T.W.; Ge, Z.; Man, T.; Huppert, H.E. Infiltration characteristics of slurries in porous media based on the coupled Lattice-Boltzmann discrete element method. Comput. Geotech. 2025, 177, 106865. [Google Scholar] [CrossRef]
  65. Wang, Y. Enhancing mechanical properties and CO2 uptake of recycled cementitious materials through optimized carbonation. J. Clean. Prod. 2023, 367, 132401. [Google Scholar]
  66. Jiang, Z.; Liu, F.; Cai, G.; He, H.; Shi, W.; He, Y. Fractal characterization of pore structure evolution in pre-fractured sandstone under cyclic freeze-thaw. Geoenergy Sci. Eng. 2025, 247, 213649. [Google Scholar] [CrossRef]
  67. Jiang, Z.; Liu, F.; Cai, G.; Liu, Z.; Tian, G.; Lu, Z.; Yu, S. A recycled crushed rock sand mortar based on Talbot grading theory: Correlation of pore structure and mechanical properties. Constr. Build. Mater. 2024, 446, 137980. [Google Scholar] [CrossRef]
  68. Ding, K.; Zeng, C. Study on the compressive strength, pore structure characteristics, and fractal dimension of the ecological porous concrete specimens based on ordinary Portland cement. Constr. Build. Mater. 2025, 483, 141795. [Google Scholar] [CrossRef]
Figure 1. Flowchart of the mortar forming process.
Buildings 15 02906 g001
Figure 2. Schematic diagram of the carbonation apparatus.
Buildings 15 02906 g002
Figure 3. Dry shrinkage measurement device.
Buildings 15 02906 g003
Figure 4. Menger sponge model: (a) Original block; (bd) Menger sponge model.
Buildings 15 02906 g004
Figure 5. Dry shrinkage rate of the gelatinous body after 24 h of carbonation.
Buildings 15 02906 g005
Figure 6. Variation of compressive strength for each sample.
Buildings 15 02906 g006
Figure 7. SEM images of carbonated RCP-S mortar: (a) P1-0.4-1, (b) P1-0.4-24, (c) P1.5-0.4-1, (d) P1.5-0.4-24, (e) P2-0.4-1, and (f) P2-0.4-24.
Buildings 15 02906 g007
Figure 8. Pore size distribution (a) and cumulative porosity (b) of specimens.
Buildings 15 02906 g008
Figure 9. Determination methods for the most probable pore diameter and threshold pore diameter of RCP-S: (a) determination method for the most probable pore diameter; (b) determination method for the threshold pore diameter.
Buildings 15 02906 g009
Figure 10. Porosity volume fraction distribution.
Buildings 15 02906 g010
Figure 11. Distribution curve: (a) P0-0.4-24, (b) P1-0.4-1, (c) P1-0.4-24, (d) P1.5-0.4-1, (e) P1.5-0.4-24, (f) P2-0.4-1, and (g) P2-0.4-24.
Buildings 15 02906 g011
Figure 12. Relationship between fractal dimension and pore structure characterization parameters. (a) Threshold Pore Size (b) Pore Volume (c) Median Pore Size (d) Total Porosity (e) Most Probable Pore Size.
Buildings 15 02906 g012aBuildings 15 02906 g012b
Figure 13. Verification of the relationship between fractal dimension and pore structure characterization parameters. (a) Threshold Pore Size (b) Pore Volume (c) Median Pore Size (d) Total Porosity (e) Most Probable Pore Size.
Buildings 15 02906 g013aBuildings 15 02906 g013b
Table 1. Chemical composition of cement (wt%).
ComponentSiO2Fe2O3Al2O3CaOMgONa2OK2OTiO2SO3LOI
P·II 42.521.244.515.2262.062.280.130.490.231.981.86
Table 2. Basic physical properties of cement.
Physical PropertiesDensity
/g·cm−3
Specific Surface Area
/m2·kg−1
Setting Time/minCompressive Strength/MPa
InitialFinal3 d28 d
P·II 42.53.1639414019533.753.6
Table 3. Sample grouping.
Serial
Number
SampleCarbonation Time (h)CO2 Carbonation Pressure (MPa)Sand-to-Powder RatiosRecycled
Micro-Powder (g)
Sand (g)Water (g)
1P0-0.4-24240.401117.040335.11
2P1-0.4-110.41558.52459.54167.56
3P1-0.4-24240.41558.52459.54167.56
4P1.5-0.4-110.41.5446.82551.45134.05
5P1.5-0.4-24240.41.5446.82551.45134.05
6P2-0.4-110.42372.18612.72111.65
7P2-0.4-24240.42372.18612.72111.65
Table 4. Volume change rates of mortar samples after 24 h of carbonation.
NumberVolume Change Rate (%)
P1-0.4-24−1.33
P1.5-0.4-24−1.16
P2-0.4-24−0.52
Table 5. Pore structure parameters of the formed body.
SampleThreshold Pore Size (nm)Most Probable Pore Size (nm)Total Porosity (%)Pore Volume (ml/g)Median Pore Size (nm)
P0-0.4-246708.41827.8250.0884498.3
P1-0.4-11027.21525.1040.0861189.2
P1-0.4-24134731925.0430.0859121.2
P1.5-0.4-113264.121.123.940.08211131.8
P1.5-0.4-2410085.31822.3630.08171120
P2-0.4-113428.320.2220.08046122.9
P2-0.4-2412540.31721.6160.08314126.3
Table 6. Linear fit test results.
y = ax + b
RegionabR2f
Threshold Pore SizeI12076 −289140.877927.70111
IV19260 −517090.719569.78677
Pore VolumeI−0.0075 0.10830.6958419.8698
IV−0.0101 0.11680.41321265.505
Median Pore SizeI37.609 −5.38120.855717.01155
IV55.73 −62.9790.6054111.1767
Total PorosityI−4.4396 38.8630.6275829.4527
IV−5.4355 42.0620.3031160.097
Most Probable Pore SizeI3.6252 6.67710.553516.09358
IV7.0209−4.0660.668915.83055
Table 7. Exponential fit test results.
y = ae^bx
RegionabR2f
Threshold Pore SizeI3.1406 2.41530.816717.23148
IV0.0068 4.35110.471134.34861
Pore VolumeI0.1112−0.0860.7025419.9466
IV0.1234 −0.1190.40521265.61
Median Pore SizeI37.216 0.34950.859823.62374
IV21.091 0.52830.5946504.5589
Total PorosityI42.709 −0.1730.6386845.0606
IV49.8 −0.2210.28761128.917
Most Probable Pore SizeI9.5009 0.20270.56541141.019
IV5.0379 0.40330.66891485.21
Table 8. Power fit test results.
y = ax^b
RegionabR2f
Threshold Pore SizeI1.706 7.21410.839918.17289
IV0.001613.2460.508638.41317
Pore VolumeI0.1142 −0.2620.7252419.9153
IV0.1268 −0.3510.38261265.705
Median Pore SizeI34.4451.03430.85625.88483
IV17.691.60730.6024608.9794
Total PorosityI44.937−0.5220.6564421.4646
IV51.945−0.6440.26541170.096
Most Probable Pore SizeI9.16650.5920.54524926.27
IV4.42451.22320.66917290.58
Table 9. Quadratic fit test results.
y = ax^2 + bx + c
RegionabcR2f
Threshold Pore SizeI2979.1 −5863.3−2415.30.882627.71013
IV−6386.9 58208−1107030.723758.28091
Pore VolumeI0.0096 −0.06510.19340.7976419.8221
IV−0.0315 0.1819−0.1740.62191264.685
Median Pore SizeI10.507 −25.65988.0750.861710.84373
IV−25.153 209.12−295.320.611816.41103
Total PorosityI5.3992 −36.95186.8880.7097696.2375
IV−24.03 141.1−179.90.6118877.5277
Most Probable Pore SizeI4.4889 −23.40546.6050.628710.00507
IV0.81872.02863.49590.66939.05062
Table 10. Pore structure parameters.
SampleThreshold Pore Size (nm)Most Probable Pore Size (nm)Total Porosity (%)Pore Volume (ml/g)Median Pore Size (nm)
UFT001021.214.921.220.0572945.94
UFT201049.315.721.850.0589954.65
UFT40981.914.316.810.0453874.43
UFT601092.116.122.070.0595894.99
UFT801058.715.927.000.0729010.74
Table 11. Quadratic fit test results.
y = ax^2 + bx + c
RegionabcR2f
Threshold Pore SizeI−287.28 1775−1663.80.93513131.54
IV−223.29 1483.6−1396.80.85153130.254
Pore VolumeI0.0054 −0.00490.02770.8045364.5199
IV0.0182 −0.08160.13510.8654511.6988
Median Pore SizeI20.682 −114.69163.10.80487.599507
IV23.106 −135.78203.340.71466.63376
Total PorosityI2.0018 −1.833210.270.8045135.4483
IV6.7578 −30.22350.0390.8654132.5215
Most Probable Pore SizeI−4.659 29.149−29.5230.99871146.393
IV−2.7791 19.374−17.7720.94811138.197
Disclaimer/Publisher’s Note: The statements, opinions and data contained in all publications are solely those of the individual author(s) and contributor(s) and not of MDPI and/or the editor(s). MDPI and/or the editor(s) disclaim responsibility for any injury to people or property resulting from any ideas, methods, instructions or products referred to in the content.