Abstract
Ensuring the safety of building occupants during emergency evacuations is a critical aspect of building design. The spatial configuration and functional layout of buildings significantly influence overall evacuation efficiency. However, accurately assessing evacuation performance based on spatial characteristics remains challenging. This study proposes a weighted network analysis approach to evaluate the evacuation efficiency of buildings. It establishes the “Space-to-Network” diagram translation principles for converting spatial configurations into graph-based representations, defines analytical indicators for evacuation-weighted networks, and introduces a systematic methodology and workflow. A case study demonstrates the effectiveness of this approach, showing that the average relative deviation from evacuation simulation results is less than 10%. The method is particularly well suited for evaluating designs during the early stages. This research offers a novel perspective for evacuation analysis and provides a concise and reliable tool for the quantitative evaluation and performance optimization of building evacuation space.
1. Introduction
Safe evacuation is essential for protecting human life and minimizing losses during emergencies. Evacuation refers to the process by which building occupants move from hazardous areas to safe zones in response to actual or perceived threats [1,2,3]. Evacuation efficiency describes how effectively this process is carried out under specific spatial and environmental conditions. It directly reflects the safety, effectiveness, and orderliness of evacuation procedures and thus serves as a critical metric for evaluating the overall safety of buildings.
Buildings are complex systems composed of spatial configurations, functional programs, circulation routes, and occupants. The organization of space and the distribution of functions are crucial in determining evacuation efficiency. Existing research has primarily utilized evacuation time as a key performance indicator, employing simulation-based methods to evaluate building safety. These approaches typically focus on computing evacuation time in predefined scenarios and identifying congestion-prone zones. However, evacuation time is a composite metric affected by various factors, including occupant behavior, spatial layout, and the nature of the emergency. As such, it does not provide an intuitive or comprehensive means of quantifying the influence of spatial structures and functional layouts on evacuation efficiency.
Prevailing simulation-based evacuation methods—such as cellular automata models [4,5,6], social force models [7,8], and agent-based simulations [9,10]—typically require elaborate modeling and multiple simulations tailored to specific scenarios, resulting in substantial computational demands and procedural complexity. These constraints make such methods heavily reliant on high-resolution Building Information Modeling (BIM) data, thereby limiting their applicability during early design stages, when only schematic or low-fidelity floor plans are available, rendering them less effective for rapid design evaluation [11]. Moreover, simulation outputs primarily focus on quantitative indicators such as evacuation time and exit flow [12,13,14], which do not intuitively reflect performance differences caused by spatial configuration and functional layout variations.
To address these limitations, the weighted network method proposed in this study directly integrates spatial layout, functional allocation, and occupant distribution into a unified analytical framework. It enables direct quantification of the influence of spatial structures on evacuation efficiency, facilitating rapid, macro-level assessments of evacuation performance. This method bridges the gap between spatial configurations and evacuation outcomes, often lacking in conventional simulation approaches, and provides a complementary perspective for modeling dynamic evacuation scenarios.
The structure of this paper is as follows: Section 2 reviews existing literature on evacuation networks in building design. Section 3 introduces the methodological framework of the study. Section 4 presents case studies that demonstrate the practical application of the proposed framework in both single-story and multi-story buildings. Section 5 analyzes the method’s performance and examines evacuation-related spatial characteristics. Section 6 and the Conclusion summarize key findings, limitations, and future research directions.
2. Literature Review
2.1. Complex Network
Complex network models represent real-world systems by abstracting components as nodes and the relationships between them as edges, with an emphasis on the system’s topological structure and intrinsic properties [15,16,17,18]. In engineering disciplines [19,20,21], complex network theory is widely applied to macro-scale systems such as urban transportation networks, supporting analyses of topological features, identification of critical nodes, and evaluation of network robustness, as exemplified in metro rail systems [22,23] and public transit systems [24].
Network analysis typically involves two fundamental dimensions: basic metrics and stability evaluation.
Basic network metrics include both node-level and network-level indicators [25,26]. Node-level indicators evaluate the roles of individual nodes within the network and are commonly used to identify key or influential nodes. Representative metrics include degree centrality (), betweenness centrality (), and local efficiency (). Network-level indicators, in contrast, assess the overall performance of the network by considering all nodes and connections. Typical metrics include global efficiency (), average shortest path length (), and the proportion of the largest connected component (). The relationships between these indicators and node properties can be examined through distribution plots.
Network stability refers to a network’s ability to maintain its core connectivity functions under external disturbances [27,28,29]. Stability analysis is typically performed through node attack simulations [30,31], categorized as intentional or random attacks. Intentional attacks remove nodes in a targeted order (e.g., based on degree or betweenness centrality) to test specific vulnerabilities. In contrast, random attacks remove nodes indiscriminately to establish a baseline measure of resilience. This comparative approach supports the assessment of the network’s structural robustness.
A weighted network extends the traditional topological network by incorporating the intrinsic attributes of nodes and edges [32,33], which are encoded as weights. This enables a more accurate representation of real-world systems. From a network perspective, a building can be conceptualized as a spatial network system, where nodes represent individual spaces and edges denote the physical or functional connections between them. The resulting building spatial network graph reflects the topological organization of the building. A weighted network further enhances this representation by embedding attributes such as spatial size, functional type, occupant density, and circulation capacity into the nodes and edges. This modeling approach is particularly well suited for analyzing building evacuation spaces, providing a more realistic basis for performance evaluation and design optimization in evacuation planning.
2.2. Building Network Model
Several studies have proposed methods for constructing spatial network models of buildings. One approach involves transforming the central axis of building spaces into topological networks [34]. Others have developed automatic extraction techniques that integrate both geometric and connectivity information [35] or generated networks based on boundary corner points [36]. Three-dimensional topological networks have been used to model multi-story spatial structures [37], while Triangulated Irregular Networks (TINs) have also been applied to represent architectural layouts [38]. Graph theory has been incorporated into Building Information Modeling (BIM) workflows to analyze floor plans [39], and automatic generation of Geometric Network Models (GNMs) from BIM data has been proposed to capture corridor and vertical circulation configurations [40]. Deep learning techniques have been applied to extract topological networks from evacuation plans [41], and recent studies have explored integrating spatial networks with virtual reality environments to investigate the relationship between spatial layout and wayfinding behavior [42].
2.3. Building Evacuation Network Analysis
Evacuation network models treat building spaces as interconnected nodes and edges to evaluate evacuation performance. Macroscopic models such as EVACNET represent evacuation as flow between nodes within the network [43], while other frameworks apply graph theory and network flow algorithms to determine feasible evacuation routes [44]. Some studies have focused on identifying fire-prone zones and potential congestion points within the spatial network [45] or have proposed guide-node-based path networks to simplify evacuation modeling in complex layouts [46]. Integrated approaches that model indoor and outdoor evacuation spaces have also been developed [47].
Graph-theoretic methods have been widely used to calculate shortest evacuation paths, support group-based evacuation, and assess overall performance [48,49]. Geographic Information System (GIS)-based analyses have been applied to compare the shortest and safest evacuation routes [50]. Additionally, imbalanced exit usage caused by floor plan asymmetry has been investigated in multi-exit building layouts [51,52], and grid-based models have been constructed to simulate the spread of smoke and fire in high-rise structures [53].
Evacuation stability under path disruption has also been a significant focus. Some studies use reliability theory to evaluate the impact of individual node failures on evacuation efficiency [54]. In contrast, others employ dynamic network models to compute real-time evacuation routes under hazard conditions [55,56]. Network robustness has been assessed using sustained node failure models, considering degree, connectivity, and reliability [49]. Real-time algorithms have been proposed to identify the lowest-risk evacuation paths in blockages [57], and dynamic network flow models have been developed to optimize evacuation under disrupted pathway conditions [58].
In summary, prior studies have demonstrated how building floorplans can be abstracted into topological networks using graph-theoretic approaches to calculate evacuation time, identify shortest evacuation routes, and locate congestion-prone areas—thereby supporting the evaluation of evacuation space efficiency in buildings. However, several key challenges remain.
- Existing studies describe general approaches to constructing spatial networks from building layouts. However, most heavily depend on detailed BIM data, limiting their applicability in the early design stages, when only low-resolution or schematic plans are available. Additionally, network models often underrepresent or oversimplify open spaces such as long corridors and lobbies.
- Most models treat buildings solely as topological networks, without incorporating spatial attributes such as room size, occupant load, or edge length—factors that directly influence network structure and evacuation path calculations. Moreover, there is a lack of comparative validation between network-based analyses and results from evacuation simulations.
- Case studies often assume a single-exit scenario and fail to evaluate the balance of exit usage in multi-exit buildings. Moreover, existing methods lack appropriate indicators to assess evacuation balance. Regarding network stability, previous studies primarily focus on evaluating changes in network performance metrics under varying proportions of node removal, without explicitly considering the unique characteristics of evacuation networks.
3. Materials and Methods
3.1. Construction of the Building Evacuation Network
The weighted evacuation network model is constructed based on spatial information extracted from architectural CAD files or BIM models. This section introduces the modeling strategy, including node classification, edge construction, and weight assignment rules. The modeling process ensures that the resulting network faithfully reflects the building’s functional layout and circulation logic.
3.1.1. ”Space-to-Network” Diagram Translation Principles
The foundation of building evacuation network analysis lies in translating space into a network representation. Applying graph theory, building spaces are abstracted as nodes and edges, where nodes represent distinct spatial units—such as rooms, corridors, staircases, lobbies, and emergency exits—and edges denote direct physical connections between these spaces.
One major challenge in translating building space into network nodes is that not all spatial elements are enclosed or bounded. Open-plan areas, elongated corridors, and large public lobbies often lack well-defined boundaries, making node segmentation ambiguous. Based on principles synthesized from the literature [42,45,59], this study adopts three core criteria for translating “space” into “nodes”: spatial continuity, spatial homogeneity, and spatial connectivity. Specifically, a space should be uninterrupted and spatially continuous (preferably convex); it should exhibit homogeneous functional or physical characteristics that distinguish it from adjacent areas; and it should be connected to other spaces via doorways, openings, or other standard circulation elements that enable occupant movement.
Corridors represent critical horizontal organizational elements in buildings and are present across various scales and building types. However, accurately modeling corridors within a network presents particular challenges.
Table 1 illustrates the translation from spatial boundaries to topological network representations, highlighting differences between simplified and segmented corridor modeling patterns (Pattern A vs. Pattern B). If a corridor is simplified into a single node, it results in a star-shaped structure (Pattern A in Table 1), which oversimplifies connectivity and fails to capture essential evacuation dynamics. Drawing upon previous research [60], this study models long corridors as linear chains composed of multiple connected nodes (Pattern B in Table 1). Each corridor segment, corresponding to its adjacent room, is treated as a distinct node. This approach enables a more refined representation of spatial proximity between individual rooms and exits, and better reflects variations in evacuation pathways.

Table 1.
Illustration of “Space-to-Network” diagram translation.
Based on their functional attributes, spatial nodes in the building evacuation network are classified into four categories: Room Node (R), Pathway Node (P), Staircase Node (S), and Exit Node (E). For single-floor analyses, staircase nodes may be merged with exit nodes for simplification.
To preserve the spatial logic of the original layout, the position of each node is defined by the geometric centroid of the corresponding space. It is assigned a unique identifier and coordinate values. Edges are straight-line segments connecting the centroids of adjacent nodes, representing the physical connections between spaces. These edge lengths can be extracted from building drawings, such as CAD files or BIM models, and serve as the geometric basis for subsequent weighted network analysis.
3.1.2. Weight Assignment Rules
Node Weight: In a building evacuation network, nodes represent individual spatial units. The node’s weight typically corresponds to the instantaneous capacity of the space—that is, the number of occupants currently present. There are two primary approaches to determining the number of occupants within a space.
- (a)
- For spatial units with known occupancy, the weight of node i, denoted as wᵢ, is defined as the normalized value of the number of occupants. Min–max normalization is applied across all nodes in the network, using the observed maximum and minimum occupant values as reference points. To avoid zero values in the normalized output, the resulting weights are bounded within the range of 0.01 to 0.99.
- (b)
- For spatial units with unknown occupancy, weights can be estimated based on spatial area and occupant density. In this case, the node weight is computed as
Note: Node capacities may be dynamic. While the area of a space remains static, occupant density may fluctuate over time. For evacuation networks with frequently changing densities (e.g., public zones or high-usage regions), the area–density method supports real-time adjustment of node weights, thereby enabling dynamic modeling of evacuation scenarios.
Edge Weight: Edges represent the connectivity between adjacent spatial units, and in evacuation modeling, edge weights are typically determined by the physical distance between connected nodes. These distances reflect the positional relationships and the spatial scale of the actual building environment. Edge weights are essential for calculating the weighted path length from any node to all available exits, enabling the identification of the nearest exit and the corresponding evacuation route for each node. The edge weight is defined as
where is the normalized physical length of edge p. Min–max normalization is applied, using the maximum and minimum edge lengths across the entire network as reference values. The output range is constrained to 0.01–0.99 to prevent zero values in the normalized results.
By applying the “Space-to-Network” translation principles to establish the topological structure and assigning weights to nodes and edges based on occupant capacity, spatial scale, and geometric distance, the resulting model forms a weighted evacuation network that captures both the organizational logic and quantifiable spatial properties of the building. This network provides a robust analytical foundation for evaluating evacuation efficiency in building design.
3.2. Evacuation Efficiency Evaluation Metrics
In general, based on the fundamental principles of safe evacuation, the evacuation of public buildings typically involves multiple exits and nearest-exit routing as key characteristics. A critical focus of evacuation network research is the relationship between each exit node and the general nodes it serves. The evaluation of building evacuation efficiency primarily addresses evacuation balance [61,62] and stability [49].
Evacuation balance refers to the distribution and utilization of evacuation routes and exits in multi-exit scenarios, reflecting how evenly the evacuation load is shared. Evacuation stability describes the ability of the spatial system to maintain safe evacuation when the network structure is disrupted due to disasters, congestion, or other external factors.
This study defines evaluation metrics based on fundamental network indicators and the characteristics of building evacuation, as summarized in Table 2.
Table 2.
Evacuation efficiency evaluation metrics.
3.2.1. Definition of the Evacuation Balance Indicator
The evaluation begins with the calculation of the usage level of each exit node, defined as the Exit Capacity (). This is followed by the Evacuation Balance Statistic (EBS) computation. represents the evacuation load associated with exit node k, primarily based on the number of occupants in the spaces it serves and the evacuation pressure placed on that exit. A higher within the same network, this indicates greater utilization of the corresponding exit. The EBS is derived from the distribution of values and is used to assess the evenness of exit usage across the building. A lower EBS indicates a more balanced distribution of evacuation loads among all available exits.
3.2.2. Definition of the Evacuation Stability Indicator
Evacuation stability is evaluated by analyzing changes in evacuation balance before and after node attacks, thereby assessing the network’s stability and redundancy. In addition to the baseline balance metrics derived from the original network, the effects of disasters, congestion, or accidents are simulated through sequential node attacks, in which nodes are successively removed. After each removal, the updated network balance is recalculated, enabling assessment of the resilience of the original network.
To quantify the sensitivity of Exit Capacities, we define the Exit Capacity Sensitivity Index, , which measures the average change in Exit Capacities before and after node i is removed. A higher value indicates that node i exerts a greater influence on exit usage when attacked. Similarly, to assess the sensitivity of evacuation balance, we introduce the Network Balance Sensitivity Index, , which represents the change in the overall balance metric resulting from the removal of node i. A higher value reflects a greater impact of node i on the overall balance of the network under disruption.
In general network stability studies, various attack strategies are employed to progressively remove nodes and observe how network metrics change as a function of the proportion of nodes removed. However, the likelihood of simultaneous, multi-node failures is relatively low due to the localized nature of disruptions in evacuation scenarios, where incidents such as fires typically occur at specific points. Therefore, this study adopts a sequential node attack approach to examine how the location and functional type of individual nodes influence the stability of the evacuation network.
3.3. Evacuation Efficiency Analysis Workflow
The analytical approach for the weighted evacuation network is based on the nearest-exit principle, which transforms the evacuation problem into a shortest-path analysis between each node and all available exits. By comparing the lengths of these paths, the exit with the shortest distance is assigned to each node. This process determines the evacuation route for each node, partitions the network into exit-specific subgraphs, and enables the subsequent calculation of evacuation performance indicators.
The analytical workflow is illustrated using a primary school teaching building as an example, as shown in Figure 1. The weighted evacuation network is constructed and visualized using Gephi 0.9.5 for network drawing, while computational analysis is conducted in Python 3.9.7, employing the NetworkX (v3.5) and Matplotlib (v3.10.3) libraries.
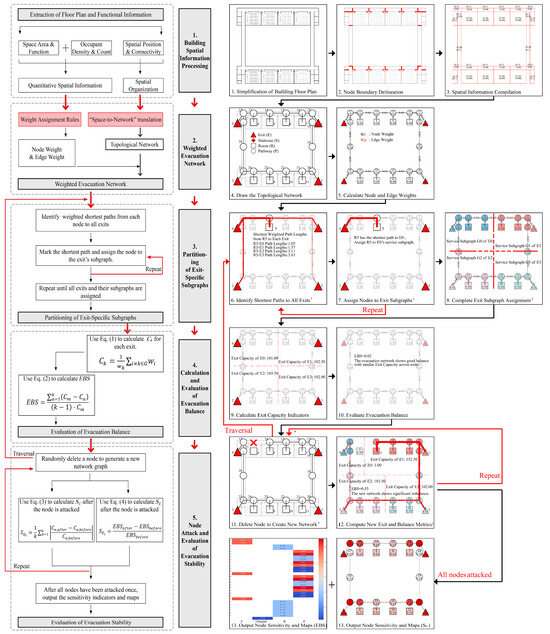
Figure 1.
Analytical workflow and schematic representation of a teaching building. 1 In labels 6, 7, and 12, red lines show paths from functional nodes to exits, with thicker lines indicating shorter distances. 2 In label 8, the red dashed lines indicate the divided node attribution sets. 3 In label 11, the red “×” indicates that the node has been deleted. 4 The black arrows between the labels indicate the next step, while the red arrows represent looping steps.
3.3.1. Assumptions
This model is constructed based on the following assumptions:
- The model is developed based on the nearest-exit principle, whereby the evacuation process is formulated as a shortest-path analysis on a weighted network between each node and all available exit nodes. Each node is assigned to the exit with the shortest weighted path length.
- The spatial configuration of the building forms the foundation for evacuation efficiency and time. The weighted network analysis primarily focuses on spatial layout factors, including room attributes, occupant quantity, and path structure. It does not explicitly account for individual occupant characteristics, such as movement speed, congestion dynamics, or evacuation time.
- The analysis assumes a simultaneous evacuation scenario, evaluating the evacuation load imposed on each exit under a given spatial configuration and occupant distribution. It does not account for variations caused by travel distance, evacuation sequence, or temporal dynamics.
3.3.2. Procedure
Step 1: Building Spatial Information Processing
- (1)
- Select and simplify a representative architectural floor plan to extract spatial connectivity relationships, including, but not limited to, corridor connections, doorway linkages, and hallway transitions.
- (2)
- Segment the spatial layout according to the fundamental principles of “Space-to-Network” translation, and delineate the boundaries of each node.
- (3)
- Record key spatial attributes, including area, functional type, occupant density, and the location of emergency exits.
Step 2: Construction of the Weighted Evacuation Network
- (1)
- Translate the spatial system into nodes and edges. Classify and label the nodes as exits, rooms, or circulation paths; assign each node a unique identifier; and visualize the resulting topological network.
- (2)
- Calculate the weights of all nodes and edges, and generate the corresponding weighted evacuation network diagram.
Step 3: Partitioning of Exit-Specific Subgraphs
- (1)
- Identify the shortest weighted paths from each non-exit node to all available exit nodes.
- (2)
- Compare the path lengths and assign each node to the exit with the shortest weighted path. If multiple paths fall within 5% of the minimum path length (to account for modeling or drafting inaccuracies), the node’s weight is proportionally distributed across the corresponding exit subgraphs.
- (3)
- Repeat the process until all exit nodes and their corresponding service subgraphs are identified. Output each exit node along with the set of nodes it serves.
Step 4: Calculation of Exit Capacity and Evaluation of Evacuation Balance
- (1)
- Use Equation (1) to compute the for each exit node.
- (2)
- Apply Equation (2) to calculate the EBS to assess the balance of evacuation demand across exits.
Step 5: Node Attack and Evaluation of Evacuation Stability
- (1)
- Randomly remove a node to generate a modified network version. Then, repeat Step 3 to reassign exit subgraphs within the updated network structure.
- (2)
- Repeat Step 4 to compute the new Exit Capacities () and the post-attack EBS value. Then, use Equation (3) to calculate the , and Equation (4) to calculate the .
- (3)
- Iterate this process until each node has been attacked once. Collect and compare the resulting network metric variations under different attack scenarios. Visualize the computed sensitivity indicators using network-based mapping, enabling an intuitive assessment of overall network stability and the identification of critical nodes.
3.3.3. Output Results
The weighted network analysis yields key outputs, including the of each exit node and the overall the . Additionally, the set of nodes served by each exit is identified and visualized using network graphs, which indirectly reflect each node’s assigned exit and its corresponding evacuation path.
The Map illustrates the average change in before and after each node is attacked. The values are represented using a color gradient, where deeper red indicates higher sensitivity, meaning that the node has a greater impact on all exits when removed.
The Map visualizes the change in the network-wide resulting from the removal of each node. The color scheme includes red, white, and orange, corresponding to positive, zero, and negative values: A larger positive value (red) indicates that the node’s removal increases the , suggesting worsened evacuation balance. A zero value (white) implies that the removal does not impact the evacuation balance. A larger negative value (orange) indicates that the node’s removal reduces the , suggesting an improvement in overall network balance.
4. Results
To validate the effectiveness of the weighted evacuation network analysis method, three architectural case studies were established: a single-story building (Case 1), a simple multi-story building (Case 2), and a complex multi-story building (Case 3). The method was evaluated by comparing the results of the weighted network analysis with those obtained through evacuation drills and simulation experiments.
In this study, validation was performed using buildingEXODUS V6.2 [63], a widely adopted evacuation simulation software in fire safety engineering. Developed by the Fire Safety Engineering Group (FSEG) at the University of Greenwich, buildingEXODUS is designed to simulate occupant evacuation behavior in complex building environments. The simulation outputs include the number of evacuees per exit, which can be processed to calculate the Exit Balance Statistic (EBS2), and visualizations of evacuation paths. By comparing these outputs with the indicators derived from the weighted network model, the study evaluates the model’s capability to represent real evacuation processes. Simulation scenarios were configured to match the network model regarding occupant count, initial distribution, and evacuation strategy, ensuring consistency and comparability in the evaluation.
However, evacuation simulation is limited to producing results for a predefined scenario and does not support direct node attack or removal operations. Manual intervention was required to progressively delete spatial grid cells and their connections within the model to simulate node failures. The simulation results were then exported for statistical analysis. After data processing, line charts were generated to illustrate the relationship between node IDs and their corresponding metric values. Nevertheless, this process was time-consuming, and the resulting spatial representation of node sensitivity was less intuitive compared to network-based visualizations.
4.1. Case Study 1: Single-Floor Building
The single-floor building model is based on a primary school teaching facility and includes three distinct spatial configurations: a linear layout (Model A), a ring layout (Model B), and a radial layout (Model C).
Evacuation Simulation Rules: The number and spatial distribution of occupants were assigned based on each model’s geometric and functional parameters. The movement speed of individuals was set to the default value defined by the simulation software. The nearest-exit principle was applied, under which all occupants were assumed to evacuate to the closest available exit.
Building Spatial Information: Details of the spatial configuration for each scenario are presented in Table 3. Each model includes the following elements:
Table 3.
(1) Comparative analysis of single-floor building case (balance). (2) Comparative analysis of single-floor building case (stability). (3) Comparative analysis of single-floor building case (comparison).
- Ten standard rooms (RA), each 60 m2 in area with an occupant density of 0.8 persons/m2, weight = 0.38;
- Two larger rooms (RB), each 120 m2 with an occupant density of 1.0 persons/m2, weight = 0.98;
- Pathway nodes (P) with an occupant density of 0.1 persons/m2, weight range = 0.01–0.02;
- Exit nodes (E), each with an area of 20 m2 and an occupant density of 1.0 persons/m2, weight = 0.15.
4.1.1. Case 1: Evacuation Balance Analysis
The number of evacuees per exit and the corresponding values obtained from both methods show strong agreement after normalization, with closely matching distributions. Furthermore, the evacuation path diagram and the exit service subgraph exhibit consistent patterns in evacuation path selection. The deviation in evacuation balance indicators does not exceed 10.00% (Table 3-1).
4.1.2. Case 1: Evacuation Stability Evaluation
The data distribution curves obtained from both methods demonstrate strong consistency. In particular, the Exit Occupant Sensitivity Curve derived from the evacuation simulation closely aligns with the Curve obtained from the network analysis. For Models A, B, and C, the average relative deviations of are 6.46%, 8.47%, and 7.67%, respectively (Table 3-2 and Table 3-3).
4.1.3. Case 1: Spatial Feature Analysis
Exit nodes and their adjacent pathway nodes significantly influence the entire network when attacked. In contrast, pathway nodes near the midpoint between adjacent exits exhibit a lower average impact. Room nodes, when attacked, tend to produce a relatively consistent effect and do not significantly alter the overall network characteristics.
The average relative deviation between the results of both methods across all case models is less than 10%, and the 95% confidence interval upper bound remains below 15%, confirming the reliability of the weighted network analysis in representing evacuation efficiency in single-story building layouts.
4.2. Case Study 2: Evacuation Drill of a Multi-Story Building
The five-floor primary school building is an existing facility in Henan Province, China. In December 2023, the research team carried out an evacuation drill, during which the entire evacuation process—from the activation of the fire alarm to the complete clearance of all participants through designated safety exits—was comprehensively documented [64]. The exit-specific evacuation data obtained from this drill provides an empirical basis for validating the proposed weighted network analysis approach.
The drill was conducted at a 24-class urban primary school. Classrooms were distributed across the first to fourth floors, with approximately 55 students per class and a floor height of 3.6 m. Each floor was equipped with two open, double-run staircases. Evacuation data were collected using camera-based positioning techniques and observational counting methods. The drill followed a pre-informed and organized evacuation strategy. Following the recommendations of local fire safety authorities, evacuation routes were predetermined, participants were briefed in advance, and the drill was conducted under adult supervision. Firefighters and teachers provided continuous guidance and command throughout the process. The experimental setup and procedures conformed to the emergency evacuation guidelines issued by the Ministry of Education of China.
Figures a1–a3 in Table 4 illustrate the school layout and the evacuation process. Based on video analysis, exit flow curves over time were extracted for each exit (Table 4-a4), enabling the calculation of total evacuee numbers per exit. The results showed that 692 individuals evacuated through the west exit (E0), 543 through the east exit (E1), and an additional 122 individuals from ground-floor classrooms exited directly to the outdoor area. These were accounted for via a virtual ground-floor exit, as this level was not included in the detailed network model. The total number of evacuees was 1357.
Table 4.
Evacuation drill and results of the network analysis.
Based on the above data, an evacuation network model for the multi-story building was developed. Node weights were assigned: R nodes = 0.98, P nodes = 0.05, S nodes = 0.05, and E nodes = 0.15. It is important to note that since individuals on the first floor evacuated directly to outdoor areas, the virtual ground-floor exit had minimal influence on the overall evacuation process. Accordingly, only the main circulation paths, staircases, and exits on the first floor were incorporated into the network model, while ground-floor rooms were excluded (see Table 4-b1).
4.2.1. Case 2: Evacuation Balance Analysis
The EBS derived from the drill was 0.22, while the EBS obtained through the weighted network analysis was 0.24. After normalization, the evacuation counts and indicators exhibited a high level of consistency, with an EBS deviation of 8.33% (see Table 4-a4,b2).
4.2.2. Case 2: Evacuation Stability Evaluation
Regarding evacuation stability, the findings are consistent with those from earlier single-floor models, in which exit nodes and their adjacent path nodes significantly influence evacuation efficiency when compromised. However, in multi-story buildings, the impact of staircase nodes varies across different levels. As the floor level increases, the influence of a given staircase node on the overall evacuation gradually diminishes, since staircases on lower floors serve all upper levels, while those on higher floors only affect their own and higher levels (see Table 4-b3,b4).
In conclusion, the proposed weighted network analysis method demonstrated high consistency with empirical drill data, thereby confirming its effectiveness. Due to the inherent limitations of physical evacuation drills, node-attack scenarios could not be empirically tested. Future research may consider leveraging VR-based simulations to facilitate virtual evacuation experiments under controlled failure conditions.
4.3. Case Study 3: Multi-Story Building
The four-floor primary school teaching building analyzed in this case study is a design practice project conducted by the research team. Detailed information regarding the spatial layout of the building is provided in Figure 2.
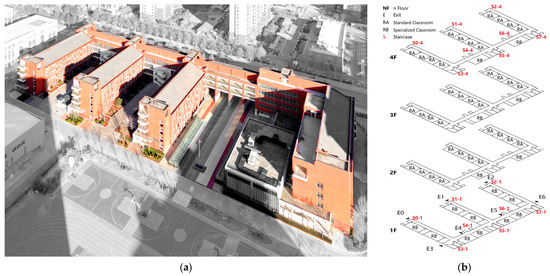
Figure 2.
(a) Project photograph; (b) floor plans.
The project is located in Zhengzhou, Henan Province, China, with a total building area of 10,032 m2. The school comprises 36 standard classrooms distributed across four above-ground floors. There are seven emergency exits on the ground floor and eight evacuation staircases on each floor.
Evacuation Simulation Rules: Occupants move at the software’s default speed, following the nearest-exit principle.
Building Spatial Information
- Standard Classroom (RA): area = 60 m2, occupants = 48, density = 0.8 persons/m2, weight = 0.63;
- Specialized Classroom (RB): area = 100 m2, occupants = 72, density = 0.7 persons/m2, weight = 0.99;
- Pathway (P): area = 10–20 m2, density = 0.1 persons/m2, weight range = 0.01–0.02;
- Staircase (S): area = 20 m2, density = 0.4 persons/m2, weight = 0.05;
- Exit (E): area = 20 m2, density = 1.0 persons/m2, weight = 0.15.
4.3.1. Case 3: Evacuation Balance Analysis
The data distributions obtained from both methods demonstrate strong consistency. After normalization, the number of evacuees per exit and the corresponding values show a high degree of agreement. The evacuation path diagram and the exit service subgraph exhibit similar patterns in occupant route selection. The deviation in the EBS does not exceed 6.00% (Table 5-1). These results validate the effectiveness of the weighted network analysis method in evaluating evacuation balance in multi-story complex buildings.
Table 5.
(1) Analysis results of the multi-story building case (balance); (2) analysis results of the multi-story building case (stability).
The distribution of evacuation exits in the building, as observed from the floor plan, appears to be relatively well organized. However, staircases S3 and S5 are located a considerable from the nearest exits. In contrast, staircases S4, S5, and S6 are positioned near one another, leading to underutilization of certain staircases during evacuation. Additionally, Exit E3 shows a significantly lower evacuation load and number of evacuees compared to the other exits.
4.3.2. Case 3: Evacuation Stability Evaluation
The number of nodes in multi-story complex buildings is significantly higher than in single-floor buildings, making node removal analysis via evacuation simulation highly time-consuming. Based on the findings from the single-floor building analysis, a set of representative key nodes was selectively removed in the simulation. These primarily included exit nodes (E), staircase nodes (S), and corridor nodes (P) located at staircase/corridor intersections, resulting in a total of 53 simulation scenarios. After data processing, line charts were generated to visualize the relationship between node IDs and corresponding metric values.
The sensitivity and evacuation balance curves obtained from both methods show strong agreement. The average relative deviation of across all model nodes is 9.69%, while that of the EBS is 5.57% (Figure 3).
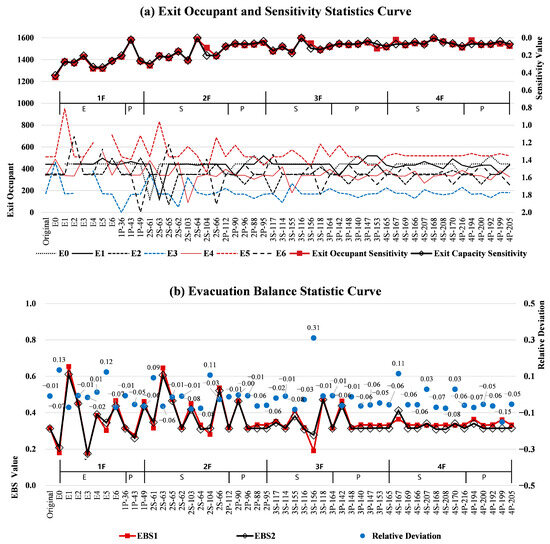
Figure 3.
Comparison of simulation and network-based results for the multi-story building.
4.3.3. Case 3: Spatial Feature Analysis
A notable case in this model is the staircase node group S5, where the is approximately zero, indicating that removing this staircase has no significant impact on network evacuation performance. This suggests that S5 is functionally redundant and could be optimized or eliminated. In contrast, when Exit E1 and its adjacent staircases and pathway nodes are removed, values reach their maximum positive value, indicating the most significant negative impact on the network balance. The most impactful nodes are E6 and E2 (Table 5-2).
Conversely, attacking E3 and E4 yields the maximum negative values, suggesting that their removal improves the network’s overall balance, although it also leads to increased evacuation loads on other exits. This implies that, during design, the width and capacity of evacuation routes should be carefully considered to mitigate potential imbalances.
The analysis confirms the effectiveness of the weighted network analysis method in evaluating the overall evacuation efficiency of spatial networks in multi-story complex buildings.
5. Discussion
The proposed weighted network model aligns well with simulation results across typical building evacuation scenarios. Table 6 summarizes absolute deviations, and the figure illustrates the distribution of each values. The average relative deviation is below 10%, with a 95% confidence interval upper bound under 15%, validating the method’s robustness and reliability.
Table 6.
Summary of deviation (absolute value) analysis between network analysis and simulation data for each case.
The study reveals that the Exit Capacity values and overall evacuation balance metrics are strongly influenced by the building’s spatial configuration, including network topology, geometric dimensions, and occupant density. The underlying network structure affects potential evacuation routes and flow directions, while the capacity of functional spaces determines localized evacuation loads. For example, in the single-floor building case studies (Model A and C), room nodes at the ends of corridors typically support unidirectional evacuation, which may lead to significantly unbalanced loads on terminal exit nodes. In contrast, rooms between adjacent exits tend to distribute loads more evenly, contributing to greater balance in exit utilization.
Different spatial nodes within the evacuation network are essential primarily due to their topological positions and geometric characteristics. On a given floor, exit nodes and adjacent corridor nodes generally exhibit greater sensitivity to evacuation balance, as they concentrate high occupant flow and control major evacuation routes. In comparison, corridor nodes between two exits offer higher path redundancy and typically exert a less pronounced impact when removed. Room nodes tend to exhibit more consistent behavior under attack, with relatively limited influence on the overall network, highlighting the importance of ensuring the accessibility and robustness of critical path nodes during the design phase.
In multi-story buildings, vertical circulation systems play a critical role in evacuation, and ground-floor exits, stairwells, and key path nodes tend to exhibit higher values. This is because these nodes control the main vertical evacuation routes. While exit nodes in single-floor buildings exert a two-dimensional influence, those in multi-story structures function in three dimensions, connecting floors through staircases. Stair nodes closer to ground-level exits are especially influential, as they serve as essential transit points for their own and upper floors. Aside from the ground level, horizontally equivalent nodes on upper floors—whether corridor or room nodes—have comparable impacts on evacuation, reflected by similar values. This suggests that evacuation efficiency in multi-story buildings is primarily shaped by horizontal spatial organization.
These results suggest that a node’s criticality in the evacuation network is determined by its functional type (e.g., room or corridor) and, more importantly, by its degree of connectivity, spatial position, and the scarcity of its access routes. This finding is consistent with prior studies [52], which emphasized that critical evacuation bottlenecks typically arise at high-traffic junctions rather than within functional spaces.
Overall, the findings demonstrate that network-based methods can effectively assess evacuation balance and optimize spatial configuration. By analyzing the distribution of network indicators, the location and scale of exits can be strategically adjusted to enhance spatial accessibility and system stability. Node sensitivity analysis facilitates the identification of critical spatial positions across diverse building types, offering clear interpretability and contextual adaptability. Moreover, network analysis can uncover latent structural vulnerabilities often overlooked in conventional evacuation simulations. For example, certain stairwells that appear adequate in normal scenarios may contribute little to overall stability and exhibit minimal sensitivity under failure conditions—suggesting potential for redesign or elimination. This capability to proactively identify such risks adds practical value to enhancing evacuation resilience.
6. Strengths and Limitations
Adopting a network-based perspective, the proposed method elucidates the mechanisms underlying variations in evacuation performance by examining the topological configuration, geometric scale, and functional distribution of architectural space. It provides a quantifiable foundation for spatial optimization in the early design phase. Employing algorithmic traversal to systematically evaluate potential node failures substantially reduces the complexity and time required for assessing evacuation efficiency during preliminary architectural planning. Furthermore, it can be applied to the performance assessment and strategic refinement of evacuation systems in existing buildings, thereby addressing the limitations of conventional simulation-based methods.
A building is a complex system comprising spatial configurations, functional programs, circulation routes, and occupants. The organization of spatial structures and the distribution of functions significantly impact overall evacuation efficiency. Once the functional attributes of a building are defined, the evacuation behavior of its occupants becomes relatively stable. The distribution of the number of people served by each exit directly affects the evacuation time at that exit to a certain extent. Accordingly, this study adopts Exit Capacity as the primary metric for analysis, as it is influenced by factors such as spatial configuration and functional layout. This approach enables a quantitative evaluation of the evacuation balance and stability of the building space.
However, this study has certain limitations. The evacuation network model is based on the nearest-exit principle and does not explicitly account for individual occupant behaviors, mobility constraints, or guidance strategies. A key component of the weighted network analysis is the assignment of node weights, which are strongly influenced by occupant numbers within each space. In this study, the number of occupants in each spatial unit is assumed to be known; however, in buildings with complex occupant composition and frequent movement, accurately obtaining this information remains a significant challenge.
buildingEXODUS was adopted as the primary benchmark simulation platform for validation in this study. However, differences in computational mechanisms may exist across various evacuation simulation models. Future work could involve cross-validation with alternative tools, such as Pathfinder, to further assess and enhance the generalizability of the proposed model.
Nevertheless, these limitations also highlight directions for future research. Subsequent studies will focus on dynamic evacuation networks under real-time fluctuations in occupant density and explore network-based optimization strategies for spatial planning in building design.
7. Conclusions
Based on the characteristics and principles of building evacuation, this study introduces network analysis into evacuation research and develops a weighted network-based method for evaluating evacuation efficiency in buildings. The proposed approach enables a comprehensive assessment of the balance and stability of evacuation spaces.
The “Space-to-Network” diagram translation principles are defined to provide clear guidance for constructing building evacuation network models. The network representation of critical spaces, such as corridors, is clarified, and by integrating node and edge positions, weights, and distances, the method effectively captures the spatial structure and functional attributes of the building. This network model does not rely heavily on detailed building data, making it particularly suitable for evacuation efficiency evaluations during the early design stages.
Evacuation performance metrics are established by calculating the Exit Capacity of each exit node, allowing for an evaluation of evacuation balance under normal conditions. To assess evacuation stability, the method simulates disaster conditions by applying a node traversal attack, analyzing variations in network metrics after node removal, and thereby identifying critical nodes that significantly affect the system’s performance.
The method is validated through case studies involving both single-floor and multi-story buildings. By comparing the results of the weighted network analysis with those from evacuation simulations, the study demonstrates that the proposed method is accurate and reliable. The average relative deviation between the two methods does not exceed 10%, confirming the method’s effectiveness while reducing modeling complexity and providing intuitive visual outputs.
Author Contributions
Conceptualization, S.C. and J.Z.; Methodology, S.C. and J.Z.; Software, Z.L.; Formal analysis, S.C.; Writing—original draft preparation, S.C.; Resources, S.C. and J.Z.; Funding acquisition, J.Z. All authors have read and agreed to the published version of the manuscript.
Funding
This research was funded by the National Natural Science Foundation of China, grant number 52478035 and 51878620.
Data Availability Statement
The original contributions presented in the study are included in the article; further inquiries can be directed to the corresponding authors.
Acknowledgments
The work was supported by Zhengzhou University.
Conflicts of Interest
The authors declare no conflicts of interest.
Abbreviations
The following abbreviations are used in this manuscript:
| NA | Network Analysis |
| ES | Evacuation Simulation |
| Exit Capacity | |
| EBS | Evacuation Balance Statistic |
| Exit Capacity Sensitivity | |
| Evacuation Balance Sensitivity | |
| ESS | Exit Service Subgraph |
| EP | Evacuation Path |
| EO | Exit Occupant |
| NV | Normalized Value |
References
- Adrian, J.; Bode, N.; Amos, M.; Baratchi, M.; Beermann, M.; Boltes, M.; Corbetta, A.; Dezecache, G.; Drury, J.; Fu, Z.; et al. A glossary for research on human crowd dynamics. Collect. Dyn. 2019, 4, 1–13. [Google Scholar] [CrossRef]
- Gwynne, S.; Galea, E.R.; Owen, M.; Lawrence, P.J.; Filippidis, L. A review of the methodologies used in the computer simulation of evacuation from the built environment. Build. Environ. 1999, 34, 741–749. [Google Scholar] [CrossRef]
- Haghani, M. Optimising crowd evacuations: Mathematical, architectural and behavioural approaches. Saf. Sci. 2020, 128, 104745. [Google Scholar] [CrossRef]
- Kirchner, A.; Schadschneider, A. Simulation of evacuation processes using a bionics-inspired cellular automaton model for pedestrian dynamics. Phys. A 2002, 312, 260–276. [Google Scholar] [CrossRef]
- Qiu, H.; Liang, X.; Chen, Q.; Lee, E.W.M. Effect of Different Time Step Sizes on Pedestrian Evacuation Time under Emergencies Such as Fires Using an Extended Cellular Automata Model. Fire 2024, 7, 100. [Google Scholar] [CrossRef]
- Liu, Y.; Li, J.; Sun, C. Cellular Automaton Model for Pedestrian Evacuation Considering Impacts of Fire Products. Fire 2023, 6, 320. [Google Scholar] [CrossRef]
- Helbing, D.; Molnár, P. Social force model for pedestrian dynamics. Phys. Rev. E 1995, 51, 4282–4286. [Google Scholar] [CrossRef]
- Zhang, J.; Zhu, J.; Dang, P.; Wu, J.; Zhou, Y.; Li, W.; Fu, L.; Guo, Y.; You, J. An improved social force model (ISFM)-based crowd evacuation simulation method in virtual reality with a subway fire as a case study. Int. J. Digit. Earth 2023, 16, 1186–1204. [Google Scholar] [CrossRef]
- Christensen, K.; Sasaki, Y. Agent-Based Emergency Evacuation Simulation with Individuals with Disabilities in the Population. J. Artif. Soc. Soc. Simul. 2008, 11, 9. [Google Scholar]
- Cao, R.F.; Lee, E.W.M.; Xie, W.; Gao, D.L.; Chen, Q.; Chun, A.; Yuen, Y.; Yeoh, G.H.; Yuen, R.-K.K. Development of an Agent-Based Indoor Evacuation Model for Local Fire Risks Analysis. J. Saf. Sci. Resil. 2023, 4, 75–92. [Google Scholar] [CrossRef]
- Wang, B.; Ren, G.; Li, H.; Zhang, J.; Qin, J. Developing a framework leveraging building information modelling to validate fire emergency evacuation. Buildings 2024, 14, 156. [Google Scholar] [CrossRef]
- Ronchi, E.; Kuligowski, E.D.; Reneke, P.A.; Peacock, R.D.; Nilsson, D. The process of verification and validation of building fire evacuation models. Fire Technol. 2013, 1822, 1–20. [Google Scholar]
- Cuesta, A.; Ronchi, E.; Gwynne, S.M.; Kinsey, M.J.; Hunt, A.L.; Alvear, D. School egress data: Comparing the configuration and validation of five egress modelling tools. Fire Mater. 2017, 41, 535–554. [Google Scholar] [CrossRef]
- Jullien, Q.; Dréan, V.; Wyzgolik, A.; Ntoung, J.Z.; Blouin, M.; Kabalan, B.; Gwynne, S.; Ganiyu, A.-A.; Collin, A.; Pianet, G.; et al. Evacuation modelling—Application to an office building using several simulation tools. In Proceedings of the Fire and Evacuation Modeling Technical Conference, Virtual, 9–11 September 2020; Volume 15. [Google Scholar]
- Newman, M. Networks; Oxford University Press: Oxford, UK, 2018. [Google Scholar]
- Kantarci, B.; Labatut, V. Classification of complex networks based on topological properties. In Proceedings of the 2013 International Conference on Cloud and Green Computing, Karlsruhe, Germany, 30 September–2 October 2013; IEEE: Piscataway, NJ, USA, 2013; pp. 297–304. [Google Scholar]
- Böttcher, L.; Porter, M.A. Complex networks with complex weights. Phys. Rev. E 2024, 109, 024314. [Google Scholar] [CrossRef]
- Costa, L.D.F.; Oliveira, O.N., Jr.; Travieso, G.; Rodrigues, F.A.; Villas Boas, P.R.; Antiqueira, L.; Viana, M.P.; Correa Rocha, L.E. Analyzing and modeling real-world phenomena with complex networks: A survey of applications. Adv. Phys. 2011, 60, 329–412. [Google Scholar] [CrossRef]
- Kim, S.; Shekhar, S.; Min, M. Contraflow transportation network reconfiguration for evacuation route planning. IEEE Trans. Knowl. Data Eng. 2008, 20, 1115–1129. [Google Scholar] [CrossRef]
- Rashid, N.U.; Chan, K.T. A review on transportation network based on complex network approach. arXiv 2023, arXiv:2308.04636. [Google Scholar] [CrossRef]
- Háznagy, A.; Fi, I.; London, A.; Nemeth, T. Complex network analysis of public transportation networks: A comprehensive study. In Proceedings of the 2015 International Conference on Models and Technologies for Intelligent Transportation Systems (MT-ITS), Budapest, Hungary, 3–5 June 2015; IEEE: Piscataway, NJ, USA, 2015; pp. 371–378. [Google Scholar]
- Zhang, J.; Xu, X.; Hong, L.; Wang, S.; Fei, Q. Networked analysis of the Shanghai subway network, in China. Phys. A Stat. Mech. Appl. 2011, 390, 4562–4570. [Google Scholar] [CrossRef]
- Zhang, Y.; Zhang, Q.; Qiao, J. Analysis of Guangzhou metro network based on L-space and P-space using complex network. In Proceedings of the 2014 22nd International Conference on Geoinformatics, Kaohsiung, Taiwan, 25–27 June 2014; IEEE: Piscataway, NJ, USA, 2014; pp. 1–6. [Google Scholar]
- von Ferber, C.; Holovatch, T.; Holovatch, Y.; Palchykov, V. Network harness: Metropolis public transport. Phys. A Stat. Mech. Appl. 2007, 380, 585–591. [Google Scholar] [CrossRef]
- Gattuso, D.; Miriello, E. Compared analysis of metro networks supported by graph theory. Netw. Spat. Econ. 2005, 5, 395–414. [Google Scholar] [CrossRef]
- Chatterjee, A.; Manohar, M.; Ramadurai, G. Statistical analysis of bus networks in India. PLoS ONE 2016, 11, e0168478. [Google Scholar] [CrossRef]
- Lou, Y.; Wang, L.; Chen, G. Structural robustness of complex networks: A survey of a posteriori measures. IEEE Circuits Syst. Mag. 2023, 23, 12–35. [Google Scholar] [CrossRef]
- Jin, J.G.; Tang, L.C.; Sun, L.; Lee, D.H. Enhancing metro network resilience via localized integration with bus services. Transp. Res. Part E Logist. Transp. Rev. 2014, 63, 17–30. [Google Scholar] [CrossRef]
- Tundulyasaree, K. Topological Characterizing and Clustering of Public Transport Networks. Master’s Thesis, Delft University of Technology: Delft, The Netherlands, 2019. [Google Scholar]
- Bertsimas, D.; Nasrabadi, E.; Stiller, S. Robust and adaptive network flows. Oper. Res. 2013, 61, 1218–1242. [Google Scholar] [CrossRef]
- Berche, B.; Ferber, C.V.; Holovatch, T.; Holovatch, Y. Transportation network stability: A case study of city transit. Adv. Complex Syst. 2012, 15 (Suppl. S1), 1250063. [Google Scholar] [CrossRef]
- Antoniou, I.E.; Tsompa, E.T. Statistical analysis of weighted networks. Discret. Dyn. Nat. Soc. 2008, 2008, 375452. [Google Scholar] [CrossRef]
- Hor, A.H.; Sohn, G.; Claudio, P.; Jadidi, M.; Afnan, A. A semantic graph database for BIM-GIS integrated information model for an intelligent urban mobility web application. ISPRS Ann. Photogramm. Remote Sens. Spat. Inf. Sci. 2018, 4, 89–96. [Google Scholar] [CrossRef]
- Lee, J. 3D data model for representing topological relations of urban features. In Proceedings of the 21st Annual ESRI International User Conference, San Diego, CA, USA, 9–12 July 2001. [Google Scholar]
- Karas, I.R.; Batuk, F.; Akay, A.E.; Baz, I. Automatically extracting 3D models and network analysis for indoors. In Innovations in 3D Geo Information Systems; Coors, V., Zlatanova, S., Fendel, E.M., Eds.; Springer: Berlin/Heidelberg, Germany, 2006; pp. 395–404. [Google Scholar]
- Zhang, L.; Wang, Y.; Shi, H.; Zhang, L. Modeling and analyzing 3D complex building interiors for effective evacuation simulations. Fire Saf. J. 2012, 53, 1–12. [Google Scholar] [CrossRef]
- Weiss, A.; Williams, L.; MacGregor Smith, J. Performance & optimization of M/G/c/c building evacuation networks. J. Math. Model. Algorithms 2012, 11, 361–386. [Google Scholar]
- Xu, M.; Hijazi, I.; Mebarki, A.; Meouche, R.E.; Abune’meh, M. Indoor guided evacuation: TIN for graph generation and crowd evacuation. Geomat. Nat. Hazards Risk 2016, 7 (Suppl. S1), 47–56. [Google Scholar] [CrossRef]
- Donato, V. Towards design process validation integrating graph theory into BIM. Archit. Eng. Des. Manag. 2017, 13, 22–38. [Google Scholar] [CrossRef]
- Deng, H.; Ou, Z.; Zhang, G.; Deng, Y.; Tian, M. BIM and computer vision-based framework for fire emergency evacuation considering local safety performance. Sensors 2021, 21, 3851. [Google Scholar] [CrossRef]
- Park, S.; Kim, S.Y.; Yu, K.; Kim, J.O. Indoor network generation using building evacuation maps. J. Korean Soc. Hazard Mitig. 2018, 18, 387–394. [Google Scholar] [CrossRef]
- Fu, R.; Zhang, C.; Wang, Y.; Yue, Y.; Di Sarno, L. Building layout assessment on fire evacuation efficiency by integrating graph theory and virtual reality. J. Build. Eng. 2024, 98, 111498. [Google Scholar] [CrossRef]
- Francis, R.L.; Saunders, P.B. EVACNET: Prototype Network Optimization Models for Building Evacuation; Operations Research Division, Center for Applied Mathematics, National Bureau of Standards: Washington, DC, USA, 1979. [Google Scholar]
- Gupta, A.K.; Yadav, P.K. SAFE-R: A new model to study the evacuation profile of a building. Fire Saf. J. 2004, 39, 539–556. [Google Scholar] [CrossRef]
- Desmet, A.; Gelenbe, E. Graph and analytical models for emergency evacuation. In Proceedings of the 2013 IEEE International Conference on Pervasive Computing and Communications Workshops (PERCOM Workshops), San Diego, CA, USA, 18–22 March 2013; pp. 523–527. [Google Scholar]
- Lee, H.Y. Using a guiding network to determine efficient evacuation routes in a public building. J. Infrastruct. Syst. 2013, 19, 243–251. [Google Scholar] [CrossRef]
- Osman, M.S.; Ram, B. Two-phase evacuation route planning approach using combined path networks for buildings and roads. Comput. Ind. Eng. 2013, 65, 233–245. [Google Scholar] [CrossRef]
- Hu, Y.; Liu, X. Optimization of grouping evacuation strategy in high-rise building fires based on graph theory and computational experiments. IEEE/CAA J. Autom. Sin. 2018, 5, 1104–1112. [Google Scholar] [CrossRef]
- Li, J.J.; Zhu, H.Y. A risk-based model of evacuation route optimization under fire. Procedia Eng. 2018, 211, 365–371. [Google Scholar] [CrossRef]
- Atyabi, S.; Kiavarz Moghaddam, M.; Rajabifard, A. Optimization of emergency evacuation in fire building by integrated BIM and GIS. Int. Arch. Photogramm. Remote Sens. Spat. Inf. Sci. 2019, 42, 131–139. [Google Scholar] [CrossRef]
- Gao, J.; He, J.; Gong, J. A simplified method to provide evacuation guidance in a multi-exit building under emergency. Phys. A 2020, 545, 123554. [Google Scholar] [CrossRef]
- Kurdi, H.; Almulifi, A.; Al-Megren, S.; Youcef-Toumi, K. A balanced evacuation algorithm for facilities with multiple exits. Eur. J. Oper. Res. 2021, 289, 285–296. [Google Scholar] [CrossRef]
- Zhao, H.; Yu, Z.; Zhu, J. A prediction model for smoke spread path in high rise building fires based on graph theory. Fire 2023, 6, 258. [Google Scholar] [CrossRef]
- Lovas, G.G. On the importance of building evacuation system components. IEEE Trans. Eng. Manag. 1998, 45, 181–191. [Google Scholar] [CrossRef]
- Filippoupolitis, A.; Gelenbe, E. A distributed decision support system for building evacuation. In Proceedings of the 2009 2nd Conference on Human System Interactions, Catania, Italy, 21–23 May 2009; pp. 323–330. [Google Scholar]
- Zu, Y.; Dai, R. Distributed path planning for building evacuation guidance. Cyber-Phys. Syst. 2017, 3, 1–21. [Google Scholar] [CrossRef]
- Mirahadi, F.; McCabe, B.Y. EvacuSafe: A real-time model for building evacuation based on Dijkstra’s algorithm. J. Build. Eng. 2021, 34, 101687. [Google Scholar] [CrossRef]
- Shin, Y.; Moon, I. Robust building evacuation planning in a dynamic network flow model under collapsible nodes and arcs. Socio-Econ. Plan. Sci. 2023, 86, 101455. [Google Scholar] [CrossRef]
- Chen, P.H.; Feng, F. A fast flow control algorithm for real-time emergency evacuation in large indoor areas. Fire Saf. J. 2009, 44, 732–740. [Google Scholar] [CrossRef]
- Choi, J.; Lee, J. 3D geo-network for agent-based building evacuation simulation. In 3D Geo-Information Sciences; Kolbe, T.H., König, G., Nagel, C., Eds.; Springer: Berlin, Germany, 2009; pp. 283–299. [Google Scholar]
- Francis, R.L. A “uniformity principle” for evacuation route allocation. J. Res. Natl. Bur. Stand. 1981, 86, 509. [Google Scholar] [CrossRef] [PubMed]
- Liao, W.; Kemloh Wagoum, A.U.; Bode, N.W. Route choice in pedestrians: Determinants for initial choices and revising decisions. J. R. Soc. Interface 2017, 14, 20160684. [Google Scholar] [CrossRef]
- Galea, E.; Lawrence, P.; Gwynne, S.; Filippidis, L.; Blackshields, D.; Cooney, D. buildingEXODUS V6.2 Technical Manual and User Guide; University of Greenwich: London, UK, 2015. [Google Scholar]
- Cao, S.; Zhang, J. Research on the Functional Layout of Elementary School Building Based on the Perspective of Safe Evacuation. South Archit. 2024, 5, 58–69. [Google Scholar] [CrossRef]


Disclaimer/Publisher’s Note: The statements, opinions and data contained in all publications are solely those of the individual author(s) and contributor(s) and not of MDPI and/or the editor(s). MDPI and/or the editor(s) disclaim responsibility for any injury to people or property resulting from any ideas, methods, instructions or products referred to in the content. |
© 2025 by the authors. Licensee MDPI, Basel, Switzerland. This article is an open access article distributed under the terms and conditions of the Creative Commons Attribution (CC BY) license (https://creativecommons.org/licenses/by/4.0/).