Article

A Simplified Multi-Linear Spring Model for Cross-Plate Joint in Diaphragm Walls Based on Model Tests

1
Institute of Applied Mechanics, Ningbo Polytechnic University, Ningbo 315800, China
2
School of Civil Engineering, Central South University, Changsha 410075, China
3
Research Center of Integrated Pipe Gallery, Ningbo Urban Construction Design & Research Institute Co., Ltd., Ningbo 315012, China
*
Author to whom correspondence should be addressed.
Buildings 2025, 15(16), 2890; https://doi.org/10.3390/buildings15162890
Submission received: 2 July 2025 / Revised: 31 July 2025 / Accepted: 13 August 2025 / Published: 15 August 2025
(This article belongs to the Section Building Structures)

Abstract

Cross-plate joints between panels are commonly used in diaphragm wall construction to ensure structural integrity. However, research on the mechanical behaviour of these joints remains limited, and they are often disregarded in numerical modelling due to their complexity. This paper fabricated two types of specimens with cross-plate joints, which were subsequently employed in bending and shear tests, respectively. The load–displacement curves and the joint openings were experimentally measured. It was found that the load–displacement curves exhibited approximately four linear stages in the bending tests and two in the shear tests. Based on the test results, a multi-linear spring model was proposed to simplify the mechanical behaviour of the joints, and the stiffness of each linear stage was determined through back-analysis of the tested data. The calculated load–displacement curves ultimately agreed well with those obtained from the tests, with average errors of 3.6% in the bending test and 2.6% in the shear test. The proposed model was then applied to a devised case study, thereby demonstrating its capacity to capture joint opening phenomena and revealing the spatial variability of joint opening within the excavation depth. Compared with conventional 2D and 3D models, the proposed model yields displacement results that better reflect the actual deformation of the diaphragm wall. Furthermore, the precise modelling calculation for joints, which is time-consuming, is also avoided, and the calculation time of the proposed model is only 1.52 times that of the conventional 3D model.

1. Introduction

Diaphragm walls, which are used in deep excavation projects, are typically constructed in the form of panels connected by various types of joints [1,2,3,4]. It is of great importance that the joints between the panels are constructed in a manner that ensures substantial structural integrity and impermeability [5,6,7,8]. Cross-plate joints, as illustrated in Figure 1, are a prevalent joint configuration in the construction of diaphragm walls [9,10,11,12,13]. These joints comprise a transverse plate and a longitudinal plate. The transverse plate functions as the conventional stop-end casing during the concrete casting process, while the longitudinal plate, which features several square holes, is embedded into the concrete of adjacent panels to facilitate the transfer of forces between them [12,13]. This porous configuration bears a strong resemblance to the perfobond rib shear connectors employed in composite construction [14,15,16,17].
Despite the widespread use of cross-plate joints in diaphragm wall construction, there has been a paucity of research exploring their mechanical behaviour, which has been shown to have a significant influence on the deformation of diaphragm walls in small-scale deep excavations [18]. Chen et al. [12,13] conducted model tests and numerical analyses to investigate the shear behaviour of the cross-plate joints. Specifically, the load–displacement curves of the joint under shear force were obtained through model tests and numerical analyses, and a formula for predicting the shear bearing capacity of cross-plate joints was then proposed. However, the shear direction examined in their study was aligned with the z-axis (see Figure 1), which corresponds to a vertical direction. It is widely acknowledged that the diaphragm walls, as retaining structures, primarily bear horizontal loads, and thus, more attention should be paid to the mechanical behaviour of joints subjected to horizontal loads, namely, along the y-axis instead of the z-axis, as illustrated in Figure 1. In contrast, numerous studies have been conducted on the mechanical behaviour of the perfobond shear connectors, bolted joints in shield tunnels, and assembled joints in prefabricated diaphragm walls, which have provided valuable insights into the investigation of cross-plate joints in diaphragm walls [14,15,16,17,19,20,21,22]. The above studies similarly employed load–displacement curves, whether obtained through experiments or numerical simulations, to evaluate the mechanical behaviour of shear connectors or types of joints, which is also employed in this paper.
Numerical modelling has been commonly used to predict the displacements of the diaphragm walls during the excavation process [23,24,25,26,27,28,29]. However, the majority of the previous studies have disregarded the joints in numerical modelling, with only a limited number of studies considering the joints between panels and an even smaller number focusing on the form of cross-plate joints. Zdravkovic et al. [26] and Dong et al. [27,28,29] simulated the diaphragm walls using anisotropic solid or anisotropic shell elements and accounted for joint effects by reducing the wall’s horizontal stiffness. Similarly, Yang et al. [18] employed anisotropic plate and elastic bar elements, reducing the horizontal Young’s modulus of the plate elements to almost zero, to simulate the locking pipe joint, which is assumed to be incapable of resisting bending moments. Nevertheless, these approaches have not been validated for cross-plate steel joints, whose mechanical behaviour remains insufficiently understood. Chen et al. [13] simulated the steel plates of the cross-plate joint and the reinforced concrete using solid elements, and the interaction between the steel plate and the concrete was modelled using interface elements. The same method was employed by Jin et al. [30] in the simulation of a type II joint of a diaphragm wall. However, the precise modelling of the joints is relatively time-consuming, and particularly in the case of cross-plate joints, the presence of square holes in the longitudinal plate necessitates the use of a very small mesh, resulting in a high number of meshes within the model. Thus, employing a model with such a high number of meshes demands a considerable investment of computational resources and time, particularly when analysing a large-scale excavation [31]. Consequently, the application of precise modelling is not a convenient or practical method in practice.
This study aimed to develop a simplified spring model to conveniently simulate the cross-plate joint in diaphragm walls. Firstly, two types of specimens with cross-plate joints were fabricated, which were subsequently employed in bending and shear tests, respectively. The load–displacement curves and the opening of the joints were experimentally measured. Based on the test results, a multi-linear spring model, which simplified the bending and shear behaviour of the joints, was proposed to address the issue that the cross-plate joints between panels are usually disregarded in numerical modelling, and the stiffness of the spring at each stage was then obtained by back-analysis of the measured data. Finally, the proposed multi-linear spring model was applied to a devised case, and the spatial variability of the joint opening within the excavation depth was investigated. The results obtained were also compared with those derived from a conventional 3D model that disregards joints and a 2D model. The results of this study can be of technical relevance to the modelling of joints in diaphragm walls.

2. Experimental Program and Results

2.1. Fabrication of Specimens

In practice, the thickness of diaphragm walls is typically between 800 and 1200 mm, with a standard width of 6.0 m for wall panels and a depth exceeding 30.0 m. This presents a significant challenge in conducting full-scale tests, given the capacity limitations of the laboratory facility. Accordingly, reduced-scale model tests are frequently employed in the investigation of diaphragm walls [32,33,34].
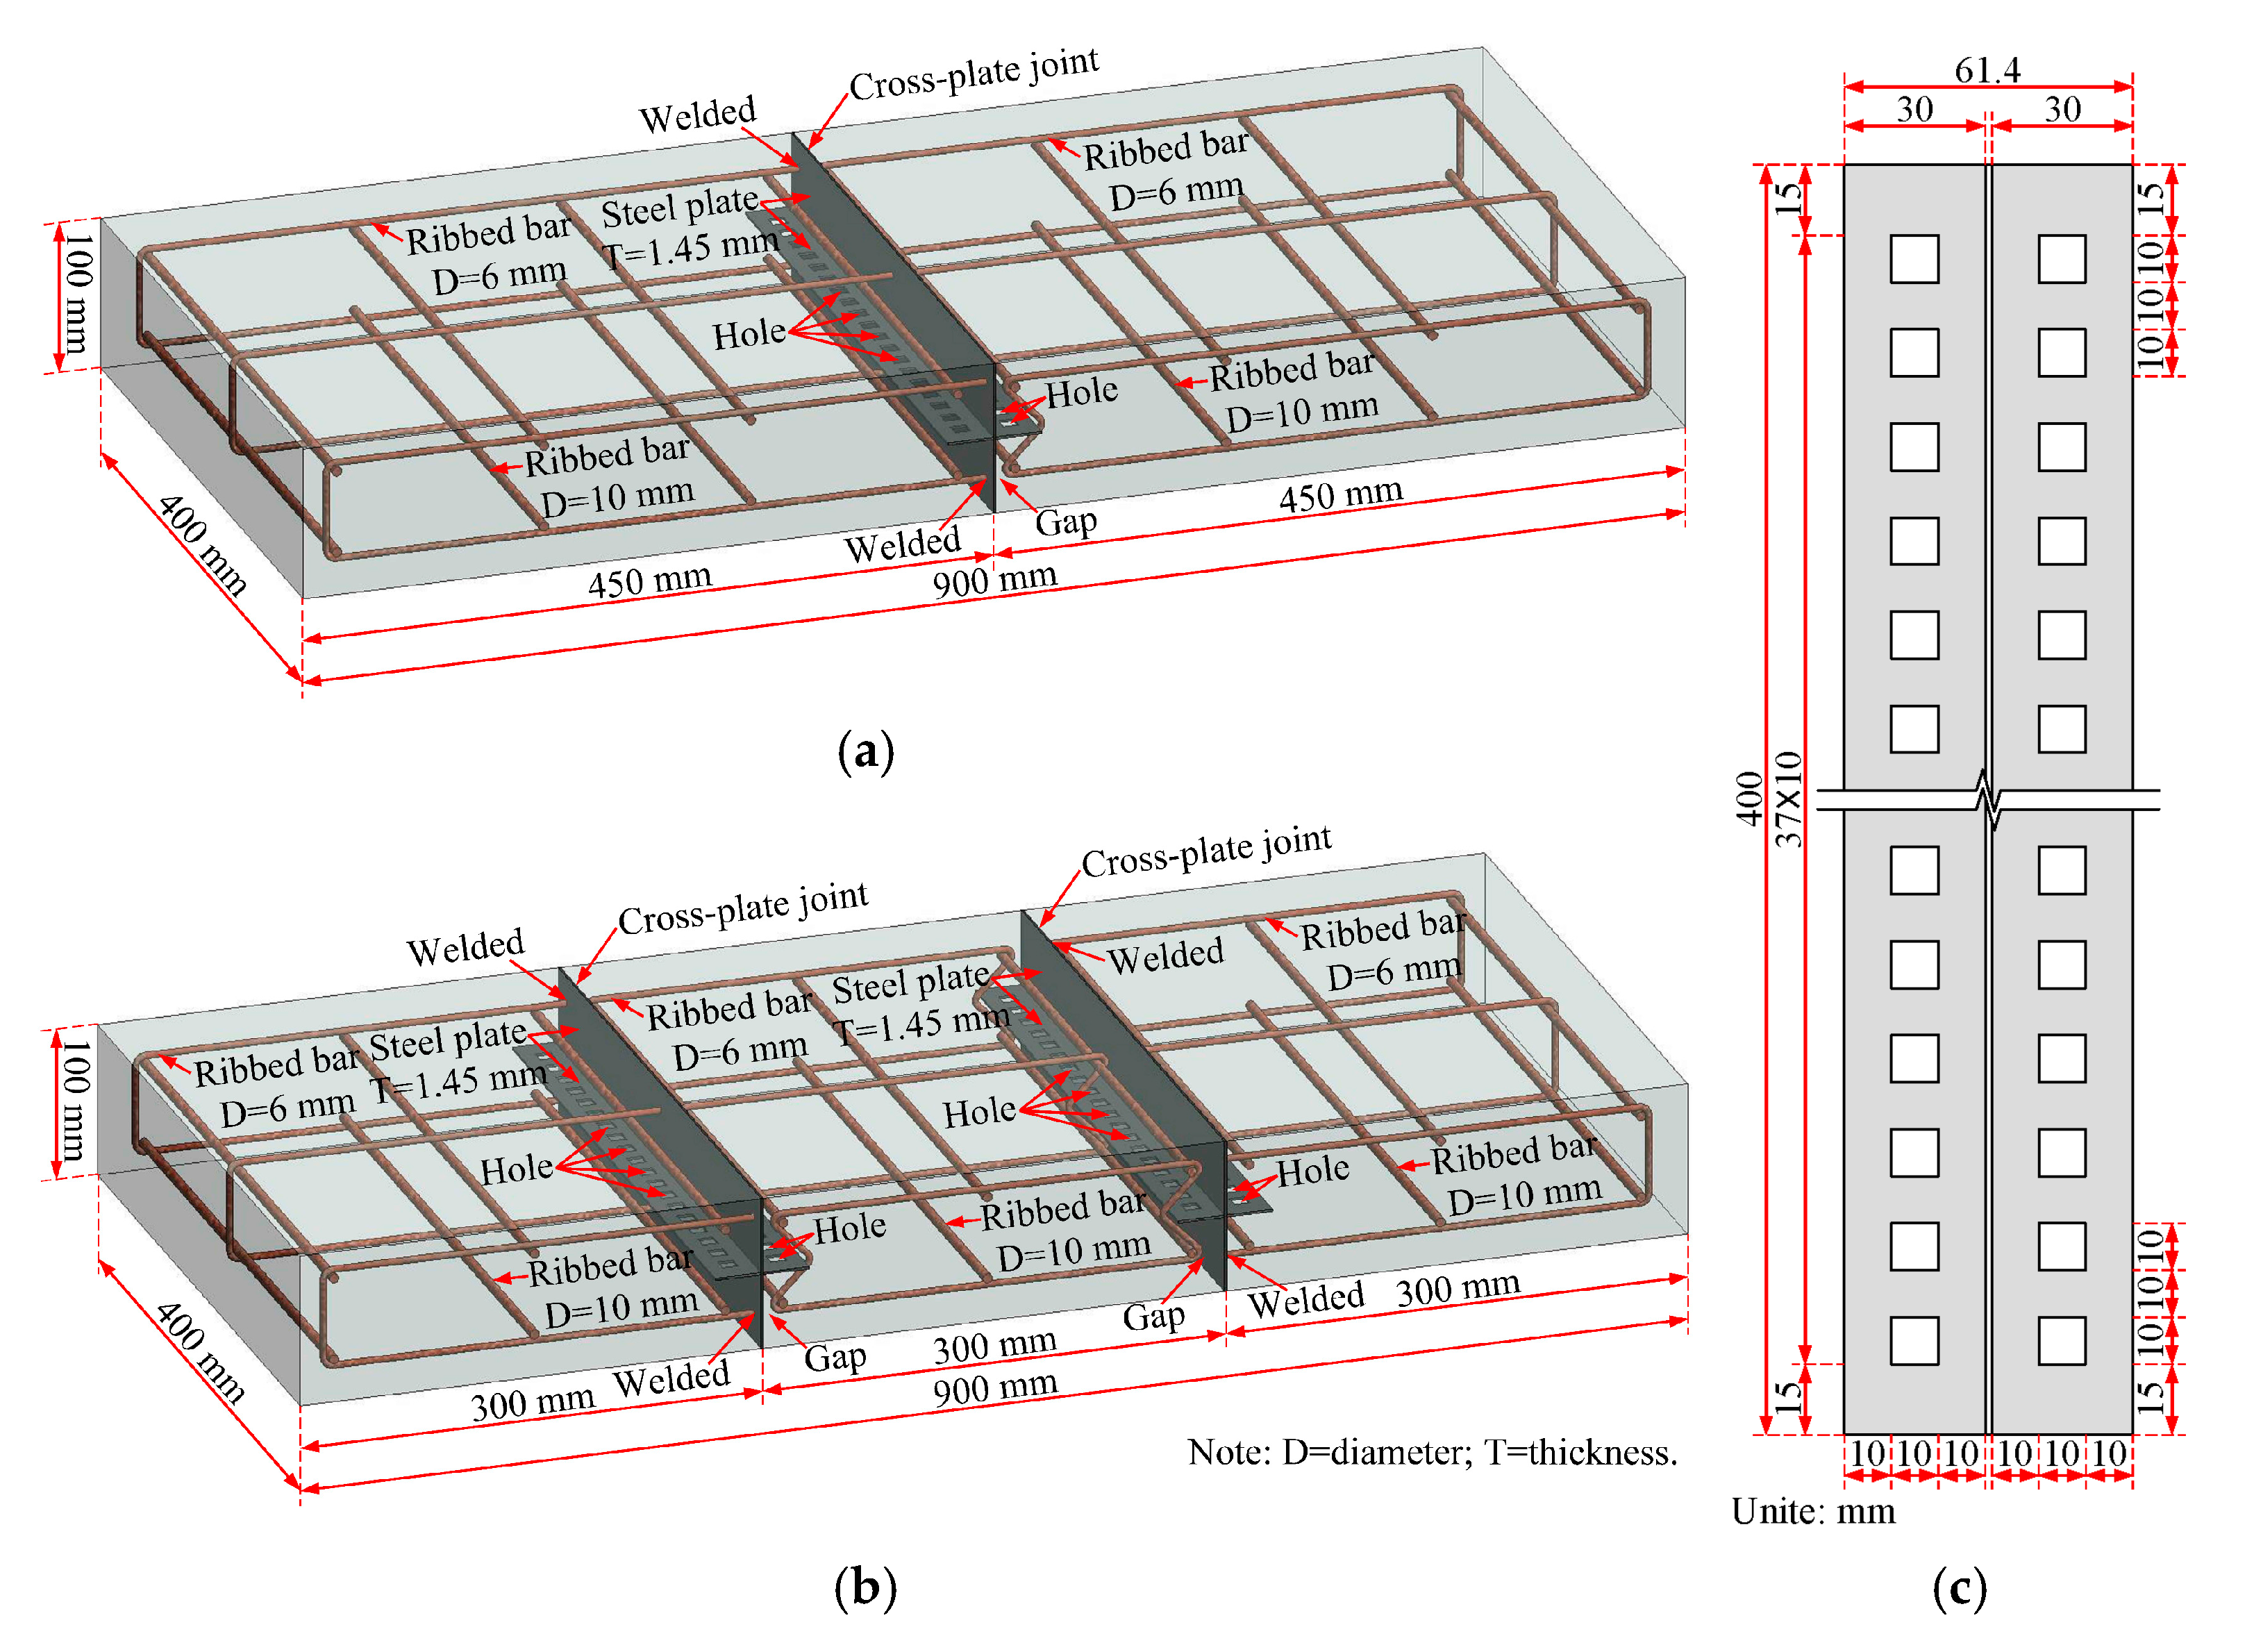
In this paper, two types of specimens with cross-plate joints, scaled at a ratio of 1:10, were fabricated, and the design details are presented in Figure 2. The dimensions of the specimens were 900 mm × 400 mm × 100 mm (length × width × thickness). Specimen 1 (S1) comprised two panels and one joint, with the length of the two panel components fixed at 450 mm, while specimen 2 (S2) comprised three panels and two joints, with the length of the three panel parts set at 300 mm. The cross-plate joints were composed of Q235 steel plates with a thickness of 1.45 mm, which were welded together. The square holes in the steel plate exhibited a width of 10 mm and a distance between holes of 10 mm. The reinforcement bars utilised in the specimens were ribbed, with the diameter of the steel bars arranged in the longitudinal direction measuring 6 mm, while those arranged in the transverse direction had a diameter of 10 mm. The reinforcement ratio of the specimens was comparable to that of the diaphragm walls in the actual project. It should be noted that, on one side of the cross-plate joint, the transverse plate was welded to the longitudinally arranged reinforcement bars, while on the other side, there was a certain gap between the steel plate and the reinforcement bars, which is also consistent with the practice of the joints in the actual project.
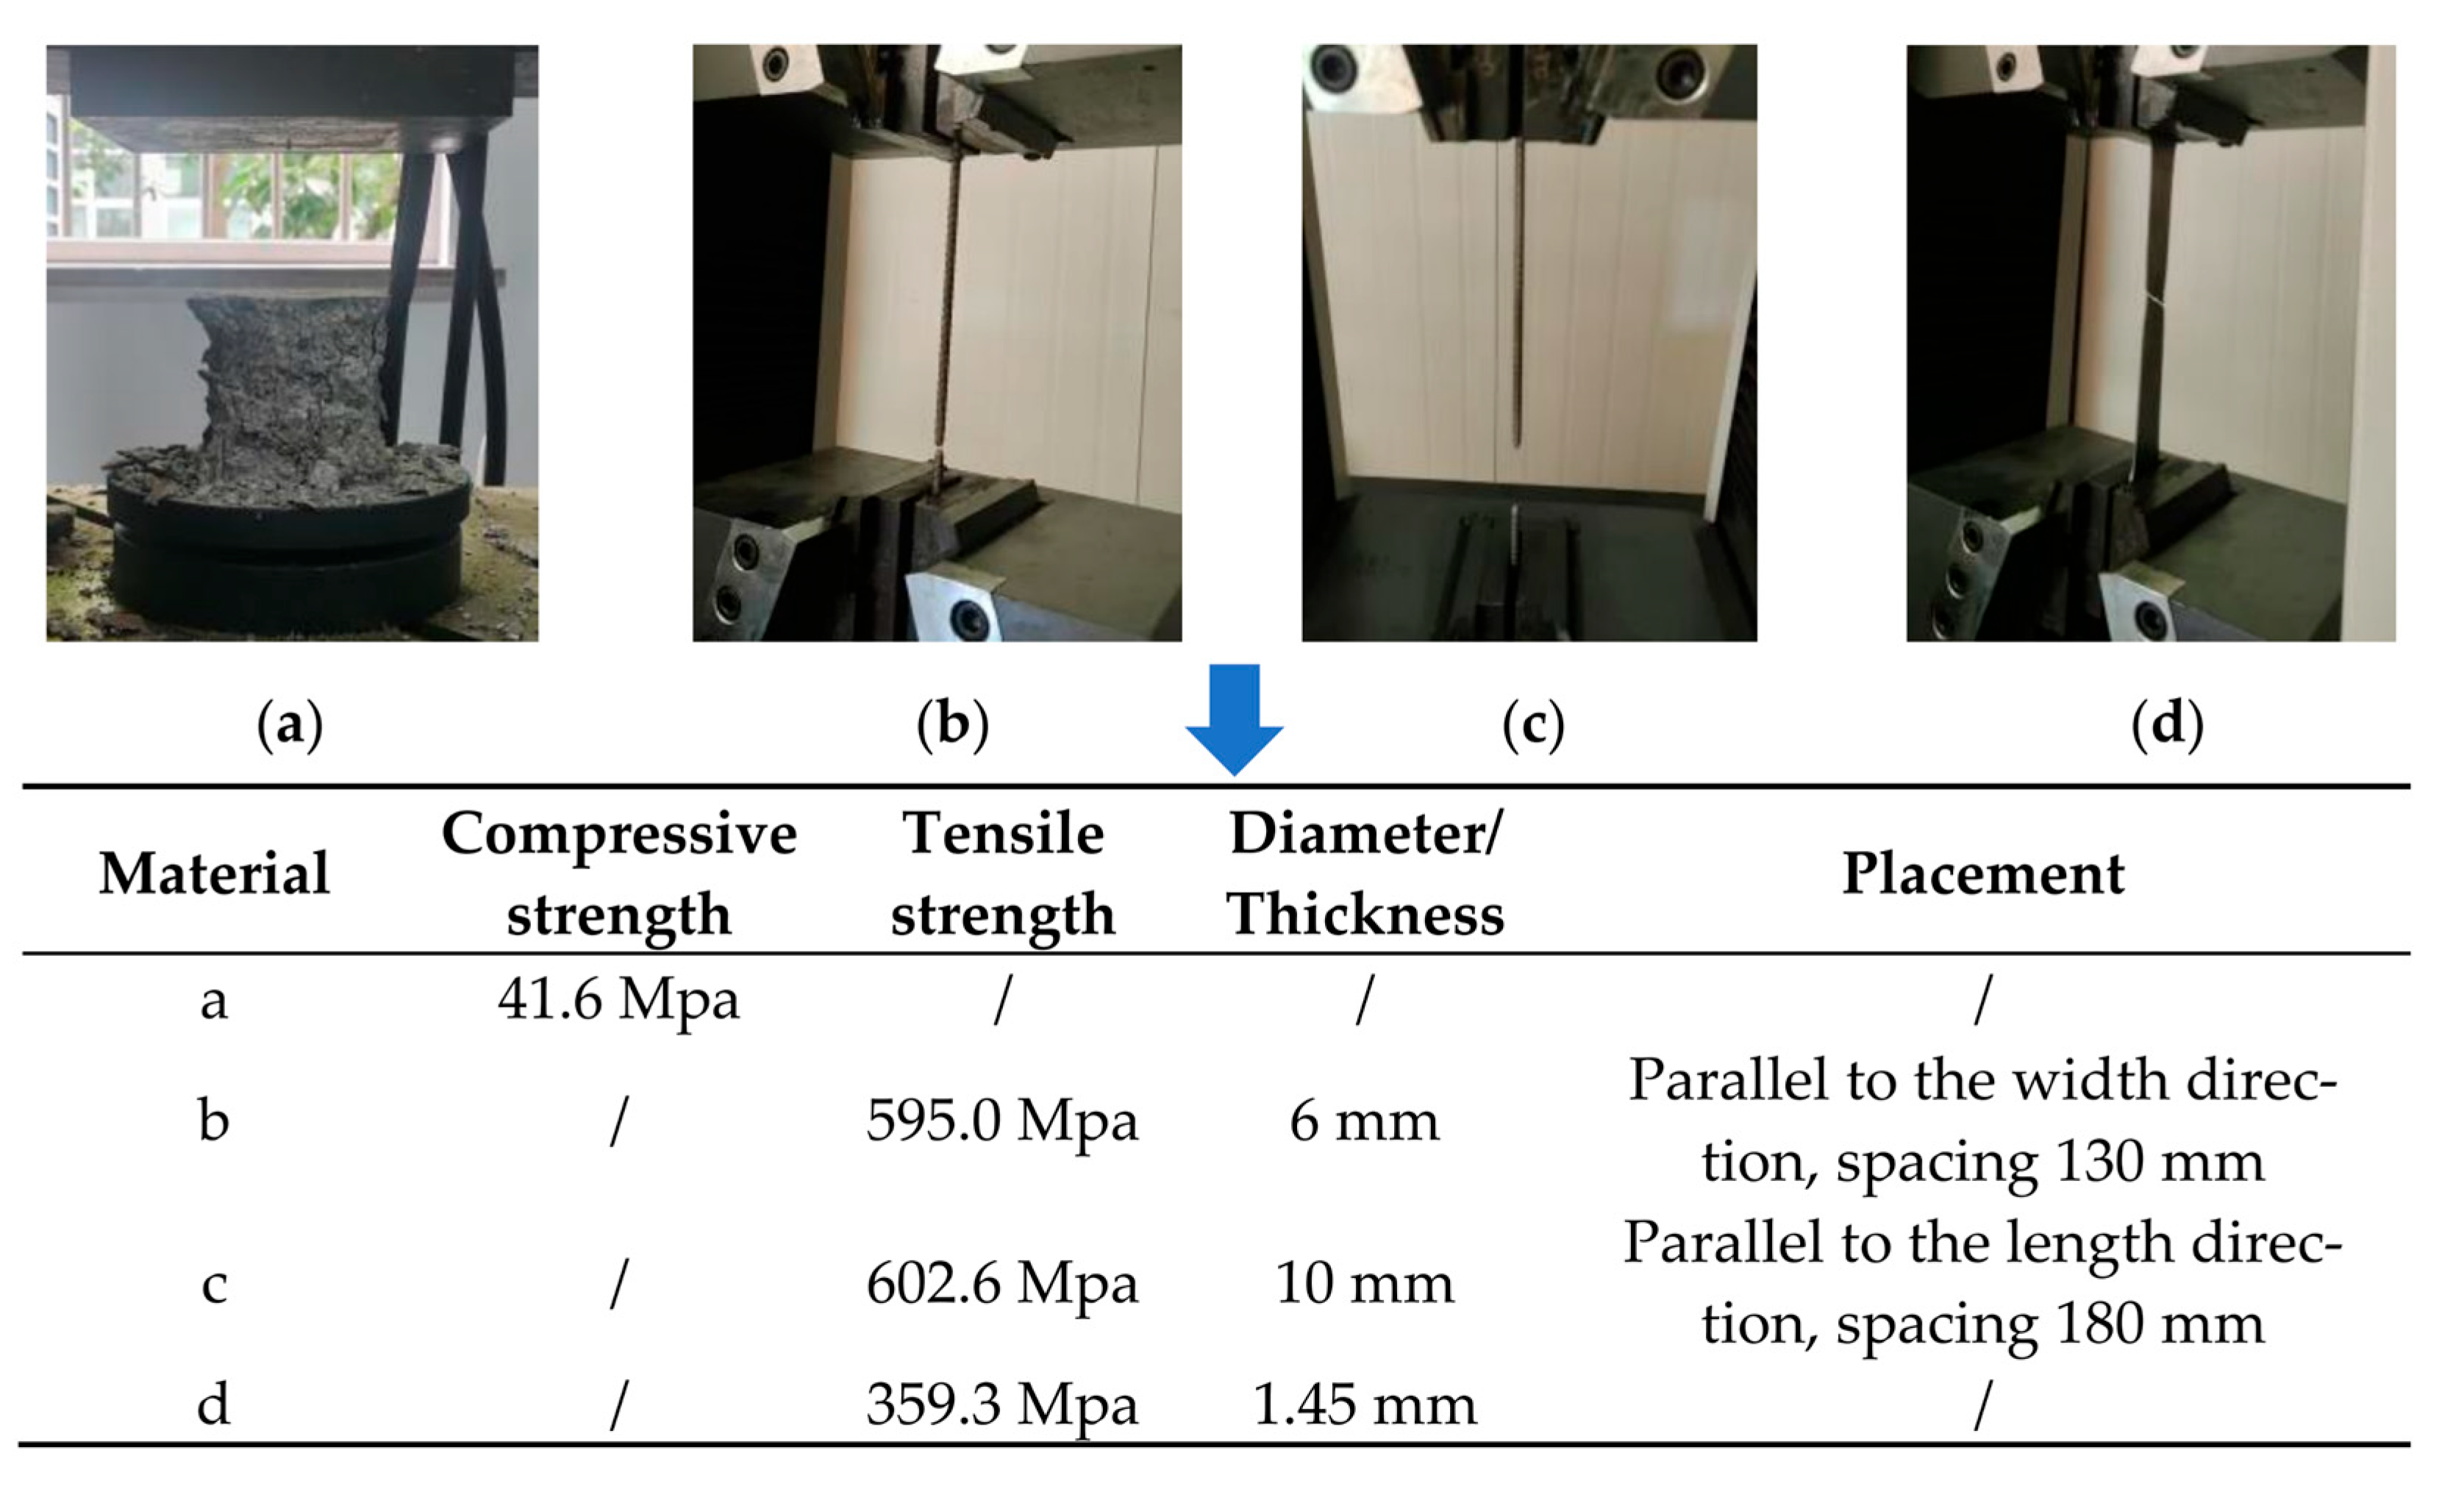
The results of previous studies on perfobond shear connectors indicate that the mechanical behaviour of the cross-plate joints is predominantly influenced by the interaction between the steel plate and the concrete [14,15,16,17], which is challenging to replicate using alternative materials. Consequently, concrete and steel were utilised in the fabrication of the specimens to accurately reflect the interaction between the steel and the concrete, as is customary in reduced-scale model tests that require such interaction to be accurately reflected [12,35,36,37]. The material properties were then subjected to laboratory testing, as shown in Figure 3.

2.2. Test Setup and Instrumentation

As illustrated in Figure 4, two test loading schemes for specimens in bending and shear states, respectively, were devised in accordance with the recommendations outlined in the Standard for Test Method of Concrete Structures [38]. Specimen 1 (S1) was subjected to a four-point bending test (see Figure 4a), and specimen 2 (S2) was subjected to a nearly pure shear test (see Figure 4b).
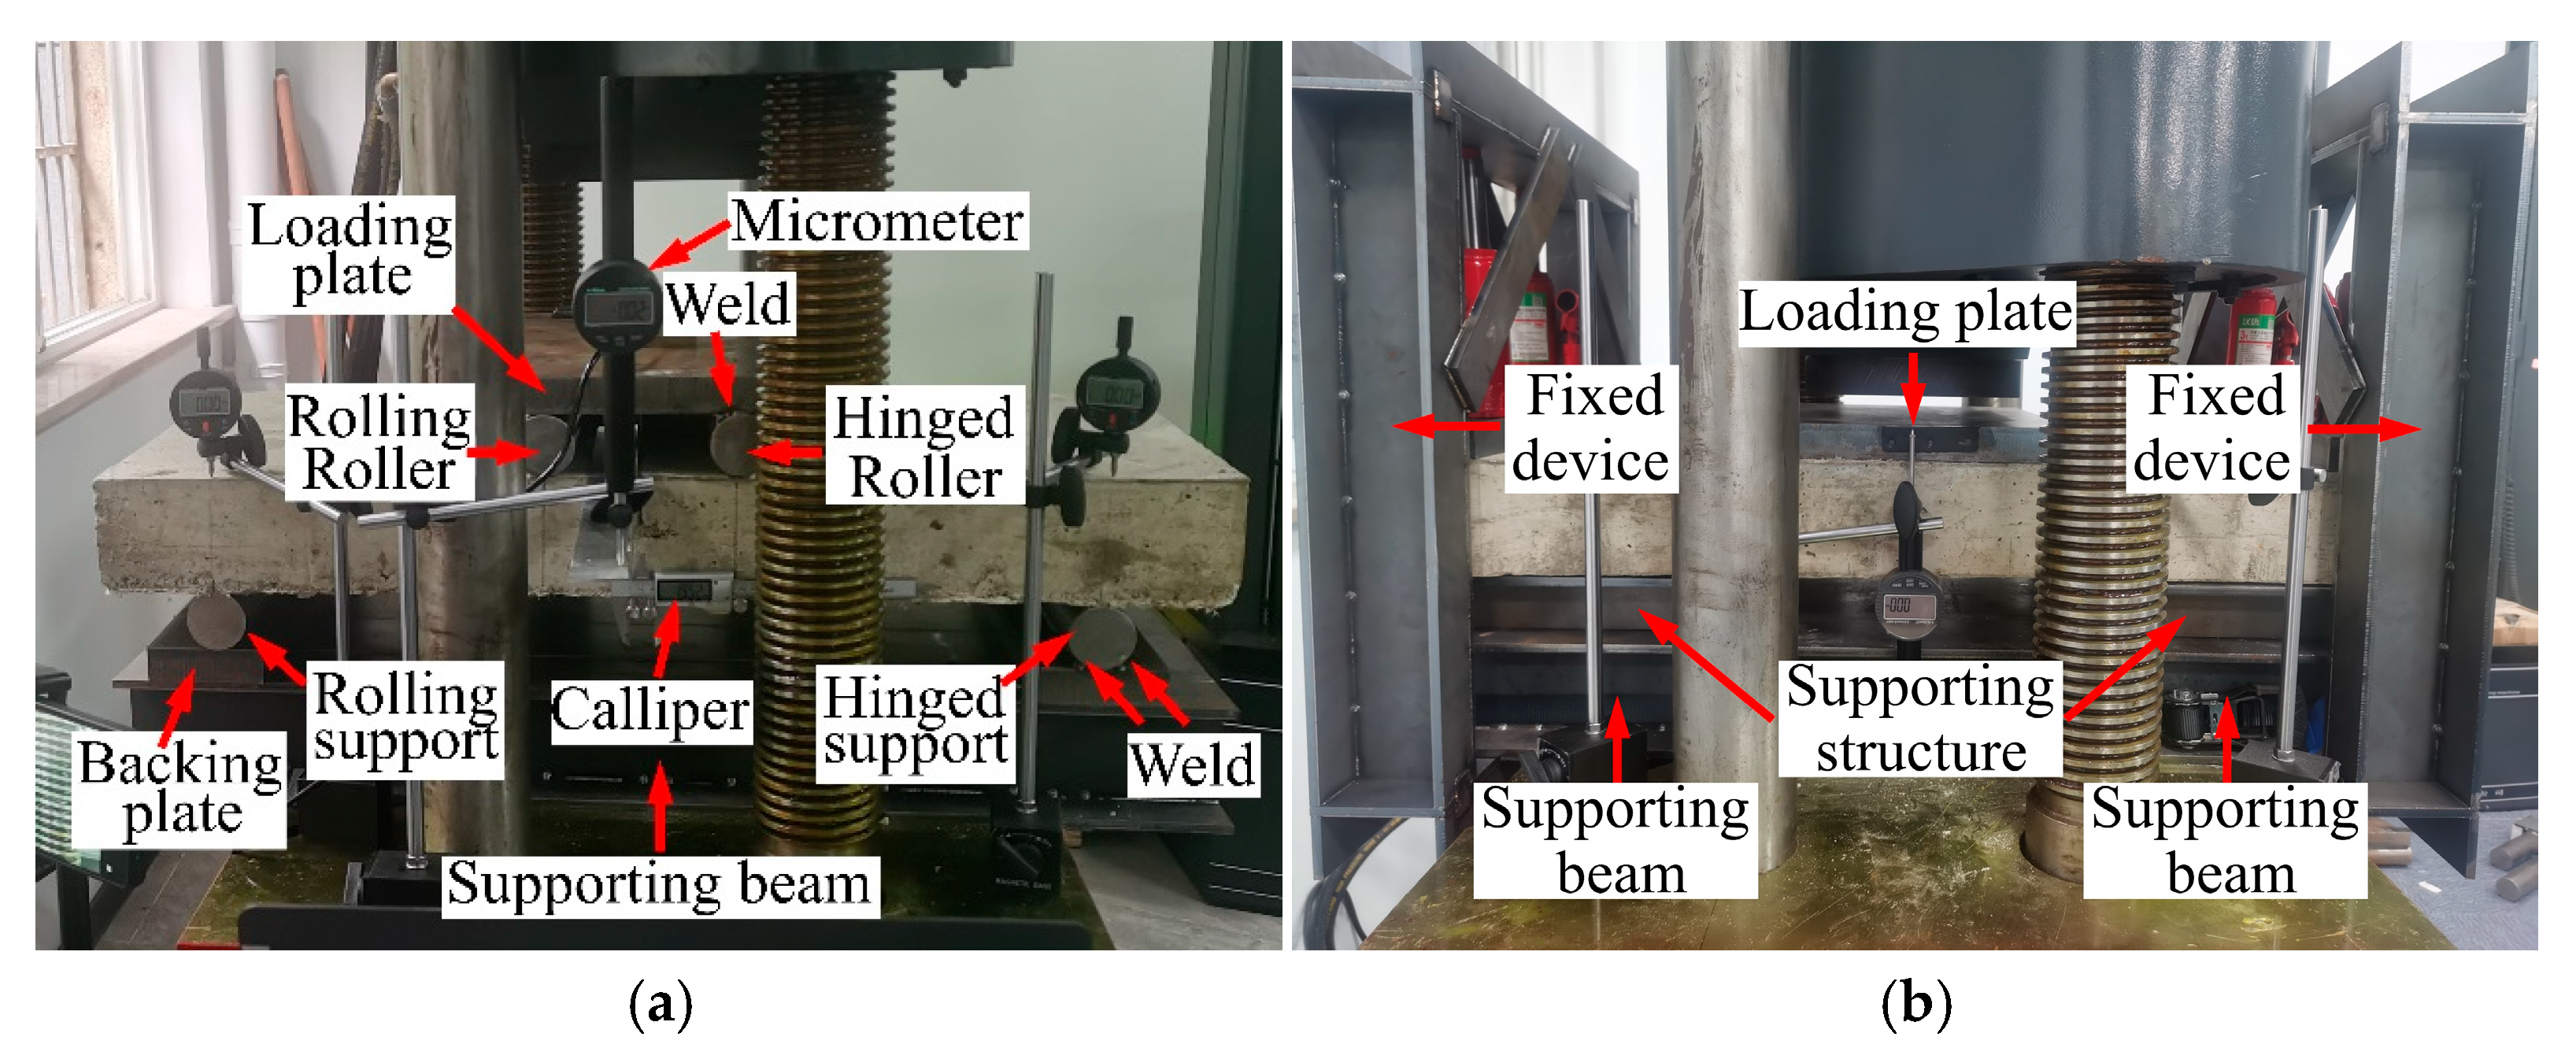
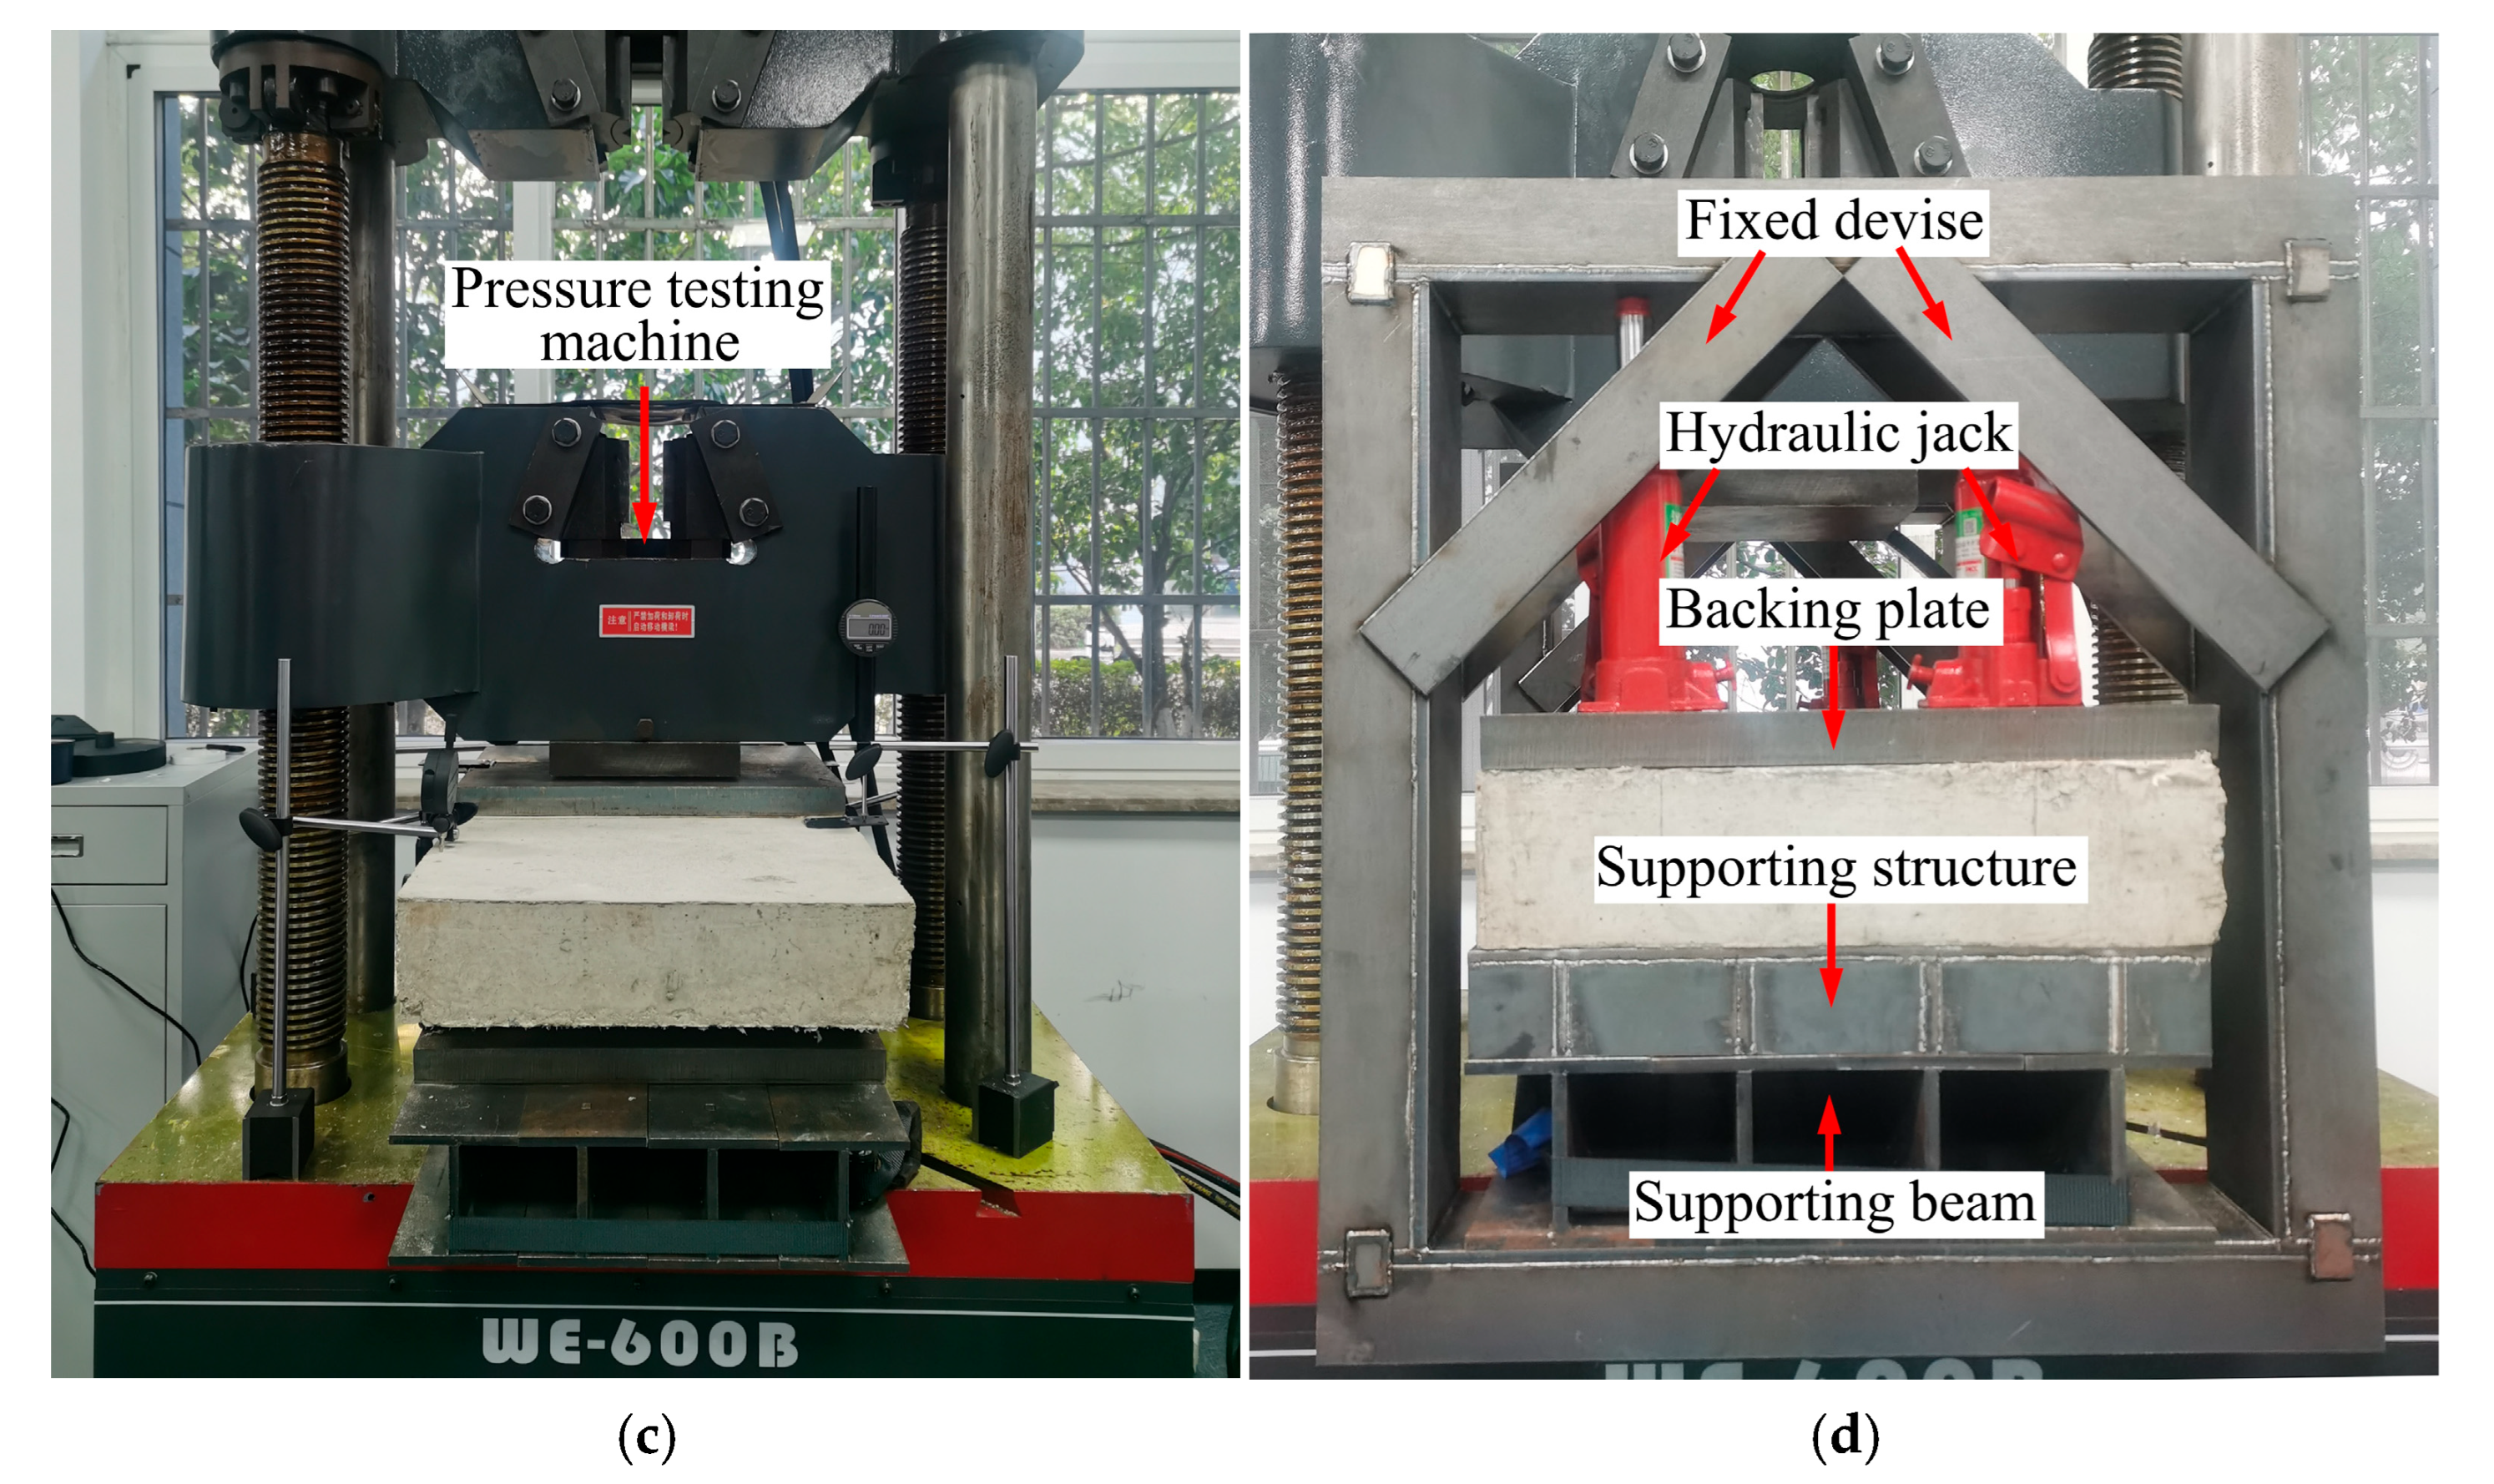
The detailed test instrumentations are shown in Figure 5. A pressure testing machine (see Figure 5c) was used as the loading device, which enabled precise control of the loading rate. Given that the width of the pressure testing machine (i.e., 700 mm) was less than the length of the specimens (i.e., 900 mm), four supporting beams, measuring 900 mm in length, 100 mm in width, and 100 mm in height, were placed on the tabletop of the pressure testing machine to serve as the testing platform (see Figure 5).
In the bending test (see Figure 4a and Figure 5a), the load was distributed to the panels on either side of the joint via a loading plate and two rollers, and five digital micrometers (labelled D1 to D5) were utilised to measure displacements at the mid-span, the loading points, and the supports. The joint opening was measured using a digital calliper fixed to two steel rods that were bonded to opposite sides of the joint. The circular hinged support, with a diameter of 50 mm, was welded to the backing plate below, which was fixed to the supporting beams by friction. In contrast, the roller support was placed on the backing plate directly, thereby enabling unrestricted rolling movement. The configuration was consistent between the loading plate and the two rollers, with one roller being welded to the loading plate and the other positioned directly below the loading plate to permit unobstructed rolling movement. However, it should be noted that the hinged roller and the hinged support must be on the same side of the joint. In the shear test (see Figure 4b and Figure 5b), four hydraulic jacks were employed as fixed devices for specimen 2 (S2), with the load applied to the central panel via a loading plate, and three digital micrometers (labelled D6 to D8) were utilised for the measurement of panel displacement. The load and loading displacement were automatically recorded by the pressure testing machine, and the readings of the digital micrometers and digital calliper were manually recorded. The digital micrometers and the digital calliper utilised in this study had an accuracy of 0.01 mm. The steel structures utilised in the experiment, such as the supports, the beams, the plates, and the fixed devise, were composed of Q235 steel.

2.3. Experimental Results

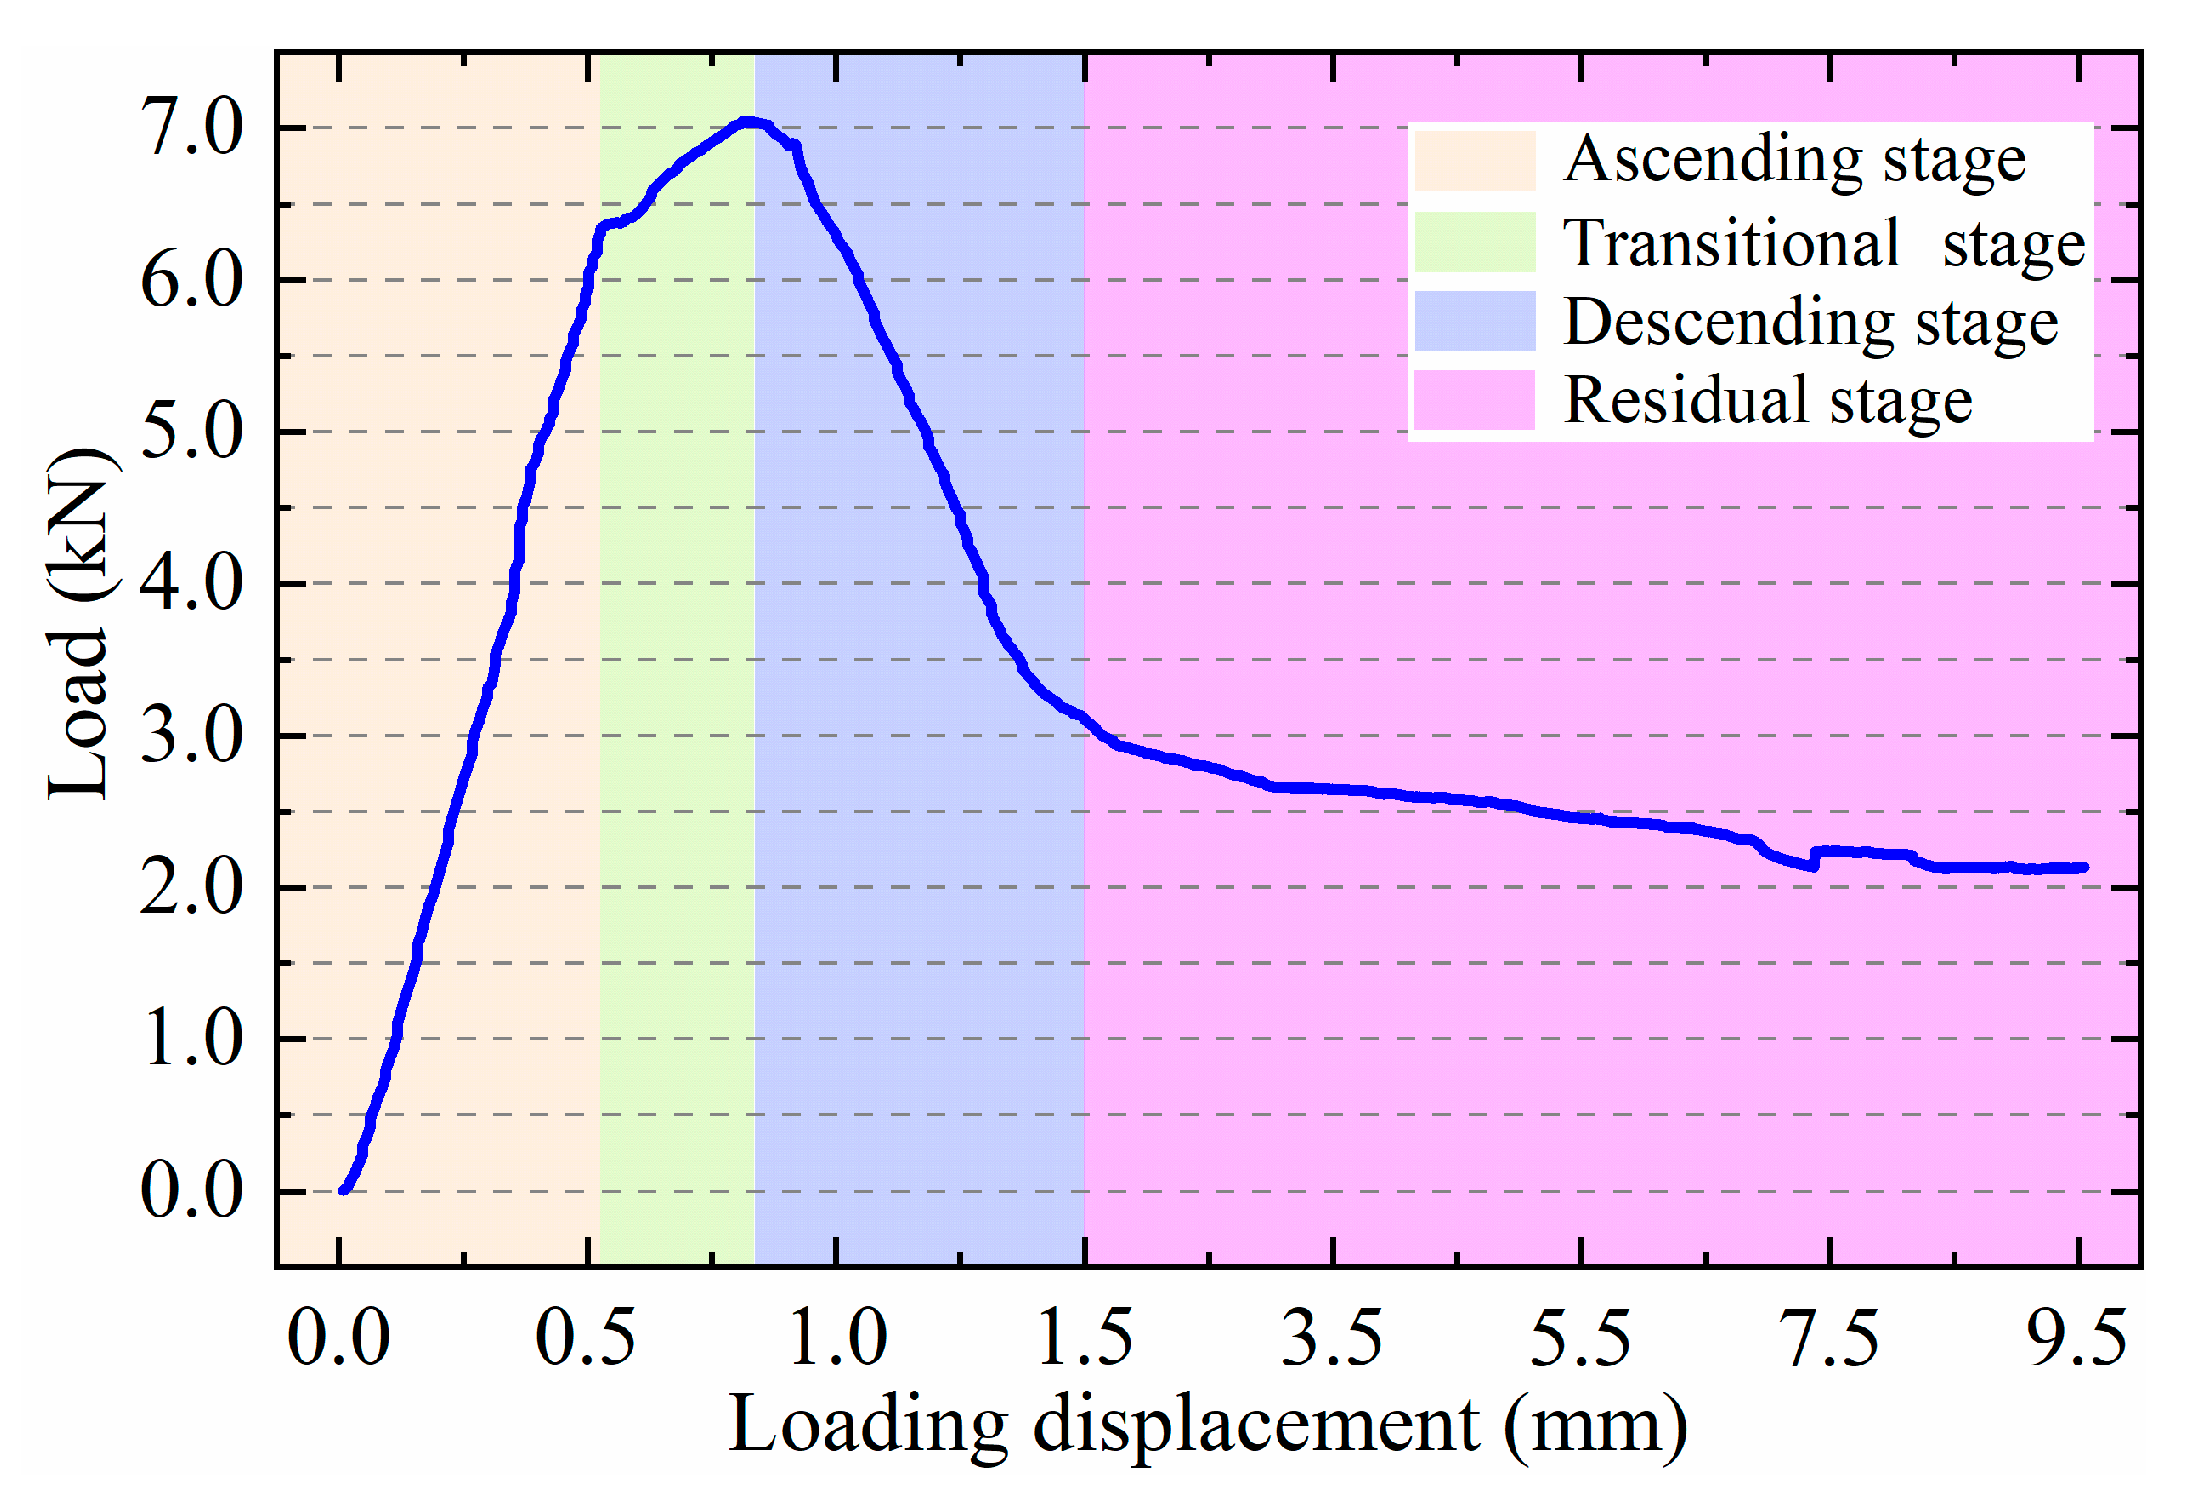
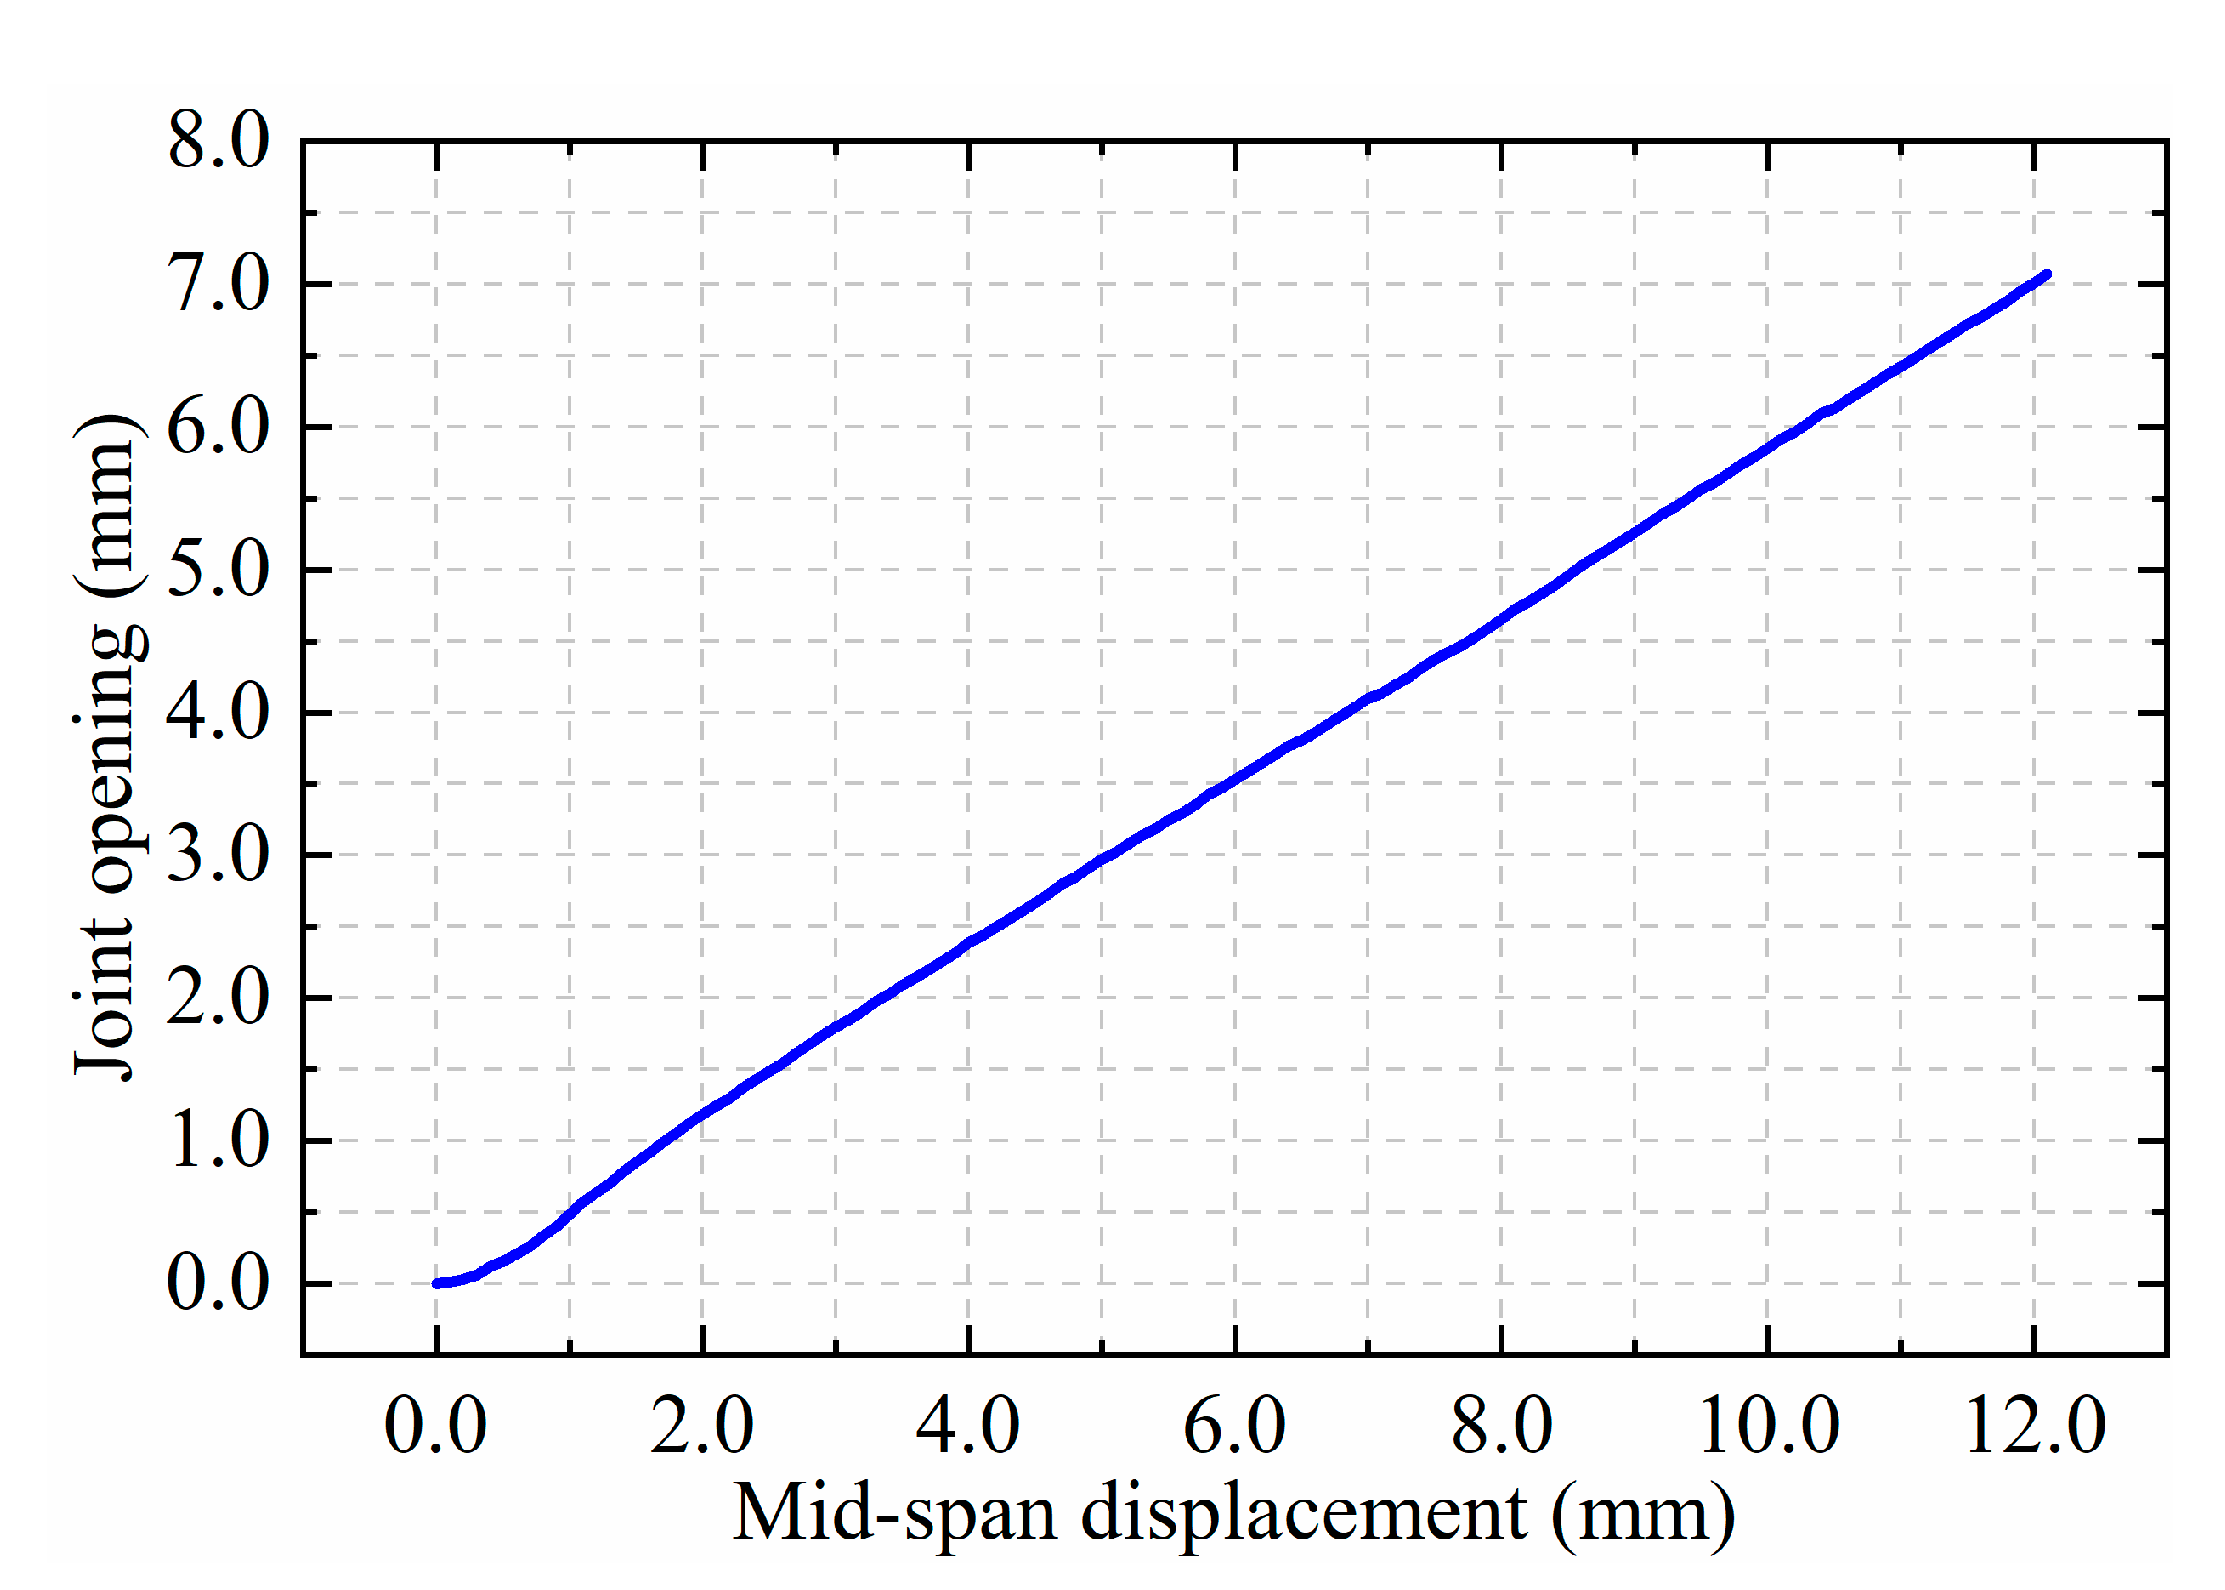
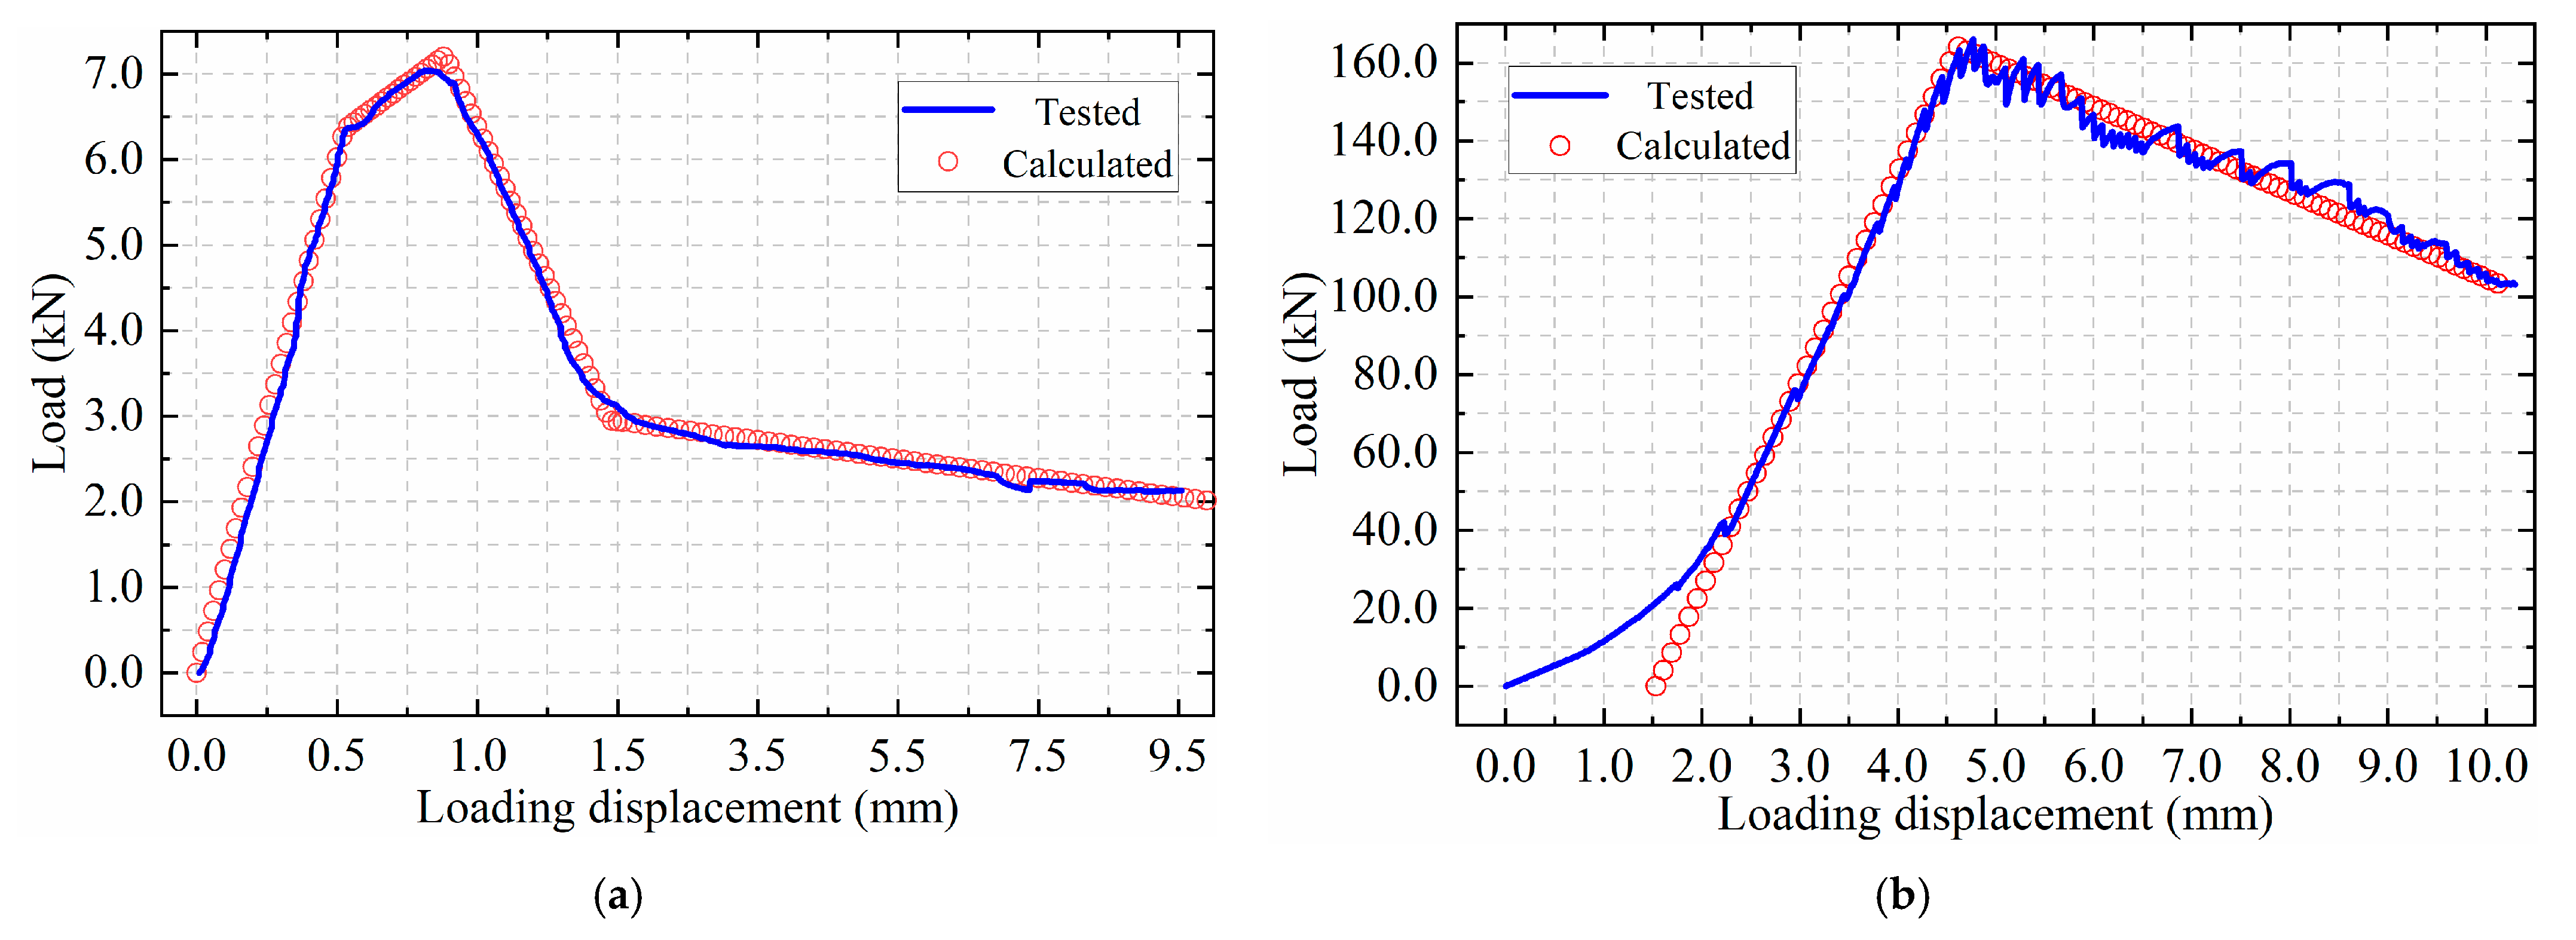
The loading process for the two tests was controlled by means of displacement of the pressure testing machine automatically. The displacement was regulated at a relatively low loading rate of 0.2 mm/min, with the objective of eliminating the potential influence of loading rate on the experimental outcomes. The permissible deformation of the diaphragm wall is stipulated in the Technical Standard for Monitoring of Building Excavation Engineering [39] to be within the range of 30 to 50 mm in actual projects. Accordingly, a maximum loading displacement of approximately 10 mm, applied by the pressure testing machine, is adequate to mirror the actual working condition of the joint, given the scaling ratio of the specimens being 1:10. During the experiment, the reading of the digital calliper was collected for every 0.1 mm increase in the reading of D1 simultaneously. The load versus loading displacement and joint opening versus mid-span displacement of the bending test are shown in Figure 6 and Figure 7, respectively. As illustrated in Figure 6, the load–displacement curve of the bending test can be roughly categorised into four stages (i.e., ascending stage, transitional stage, descending stage, and residual stage), each of which can be approximated as a linear progression. The ascending stage is characterised by a pronounced gradient, with a rapid increase in load with increasing displacement. This observation indicates that the joint is operating within an elastic state, with a relatively high stiffness at this stage. Upon reaching a load of nearly 6.4 kN, the curve proceeds to the transitional stage, wherein the gradient declines until reaching the peak load of approximately 7.0 kN. This stage is characterised by a decline in stiffness, attributable to the onset of plastic strain. Subsequently, the curve progresses to the descending stage, during which the load diminishes considerably in conjunction with an increase in loading displacement. Ultimately, the curve transitions into the residual stage, whereby the load diminishes at a very slow rate in accordance with the increasing loading displacement, and the joint retains a residual flexural capacity. The curve shows a strong resemblance to the load–displacement curve obtained in the full-scale pull-out test on a perfobond shear connector (See Figure 7 in Reference [40]). Both curves demonstrate a similar trend: a rising phase, followed by a decline in slope as the peak is approached, a significant reduction in the slope after the peak is reached, and, finally, entry into a relatively stable phase. The capacity of both the cross-steel plate and the perfobond shear connector to resist external loads is fundamentally dependent on the shear resistance of the concrete dowel passing through the holes in the plate as well as the frictional and the bond effects between concrete and steel [41,42]. Consequently, the observed similarity between the two curves serves as an indirect confirmation of the validity of the results. Furthermore, the findings of the above test results demonstrate that the bending behaviour of cross-plate joints is not single-linear, and thus, it is not appropriate to simulate these joints by simply reducing the horizontal stiffness of the diaphragm wall, as proposed by Yang et al. [18], Dong et al. [27,28,29], and Zdravkovic et al. [26].
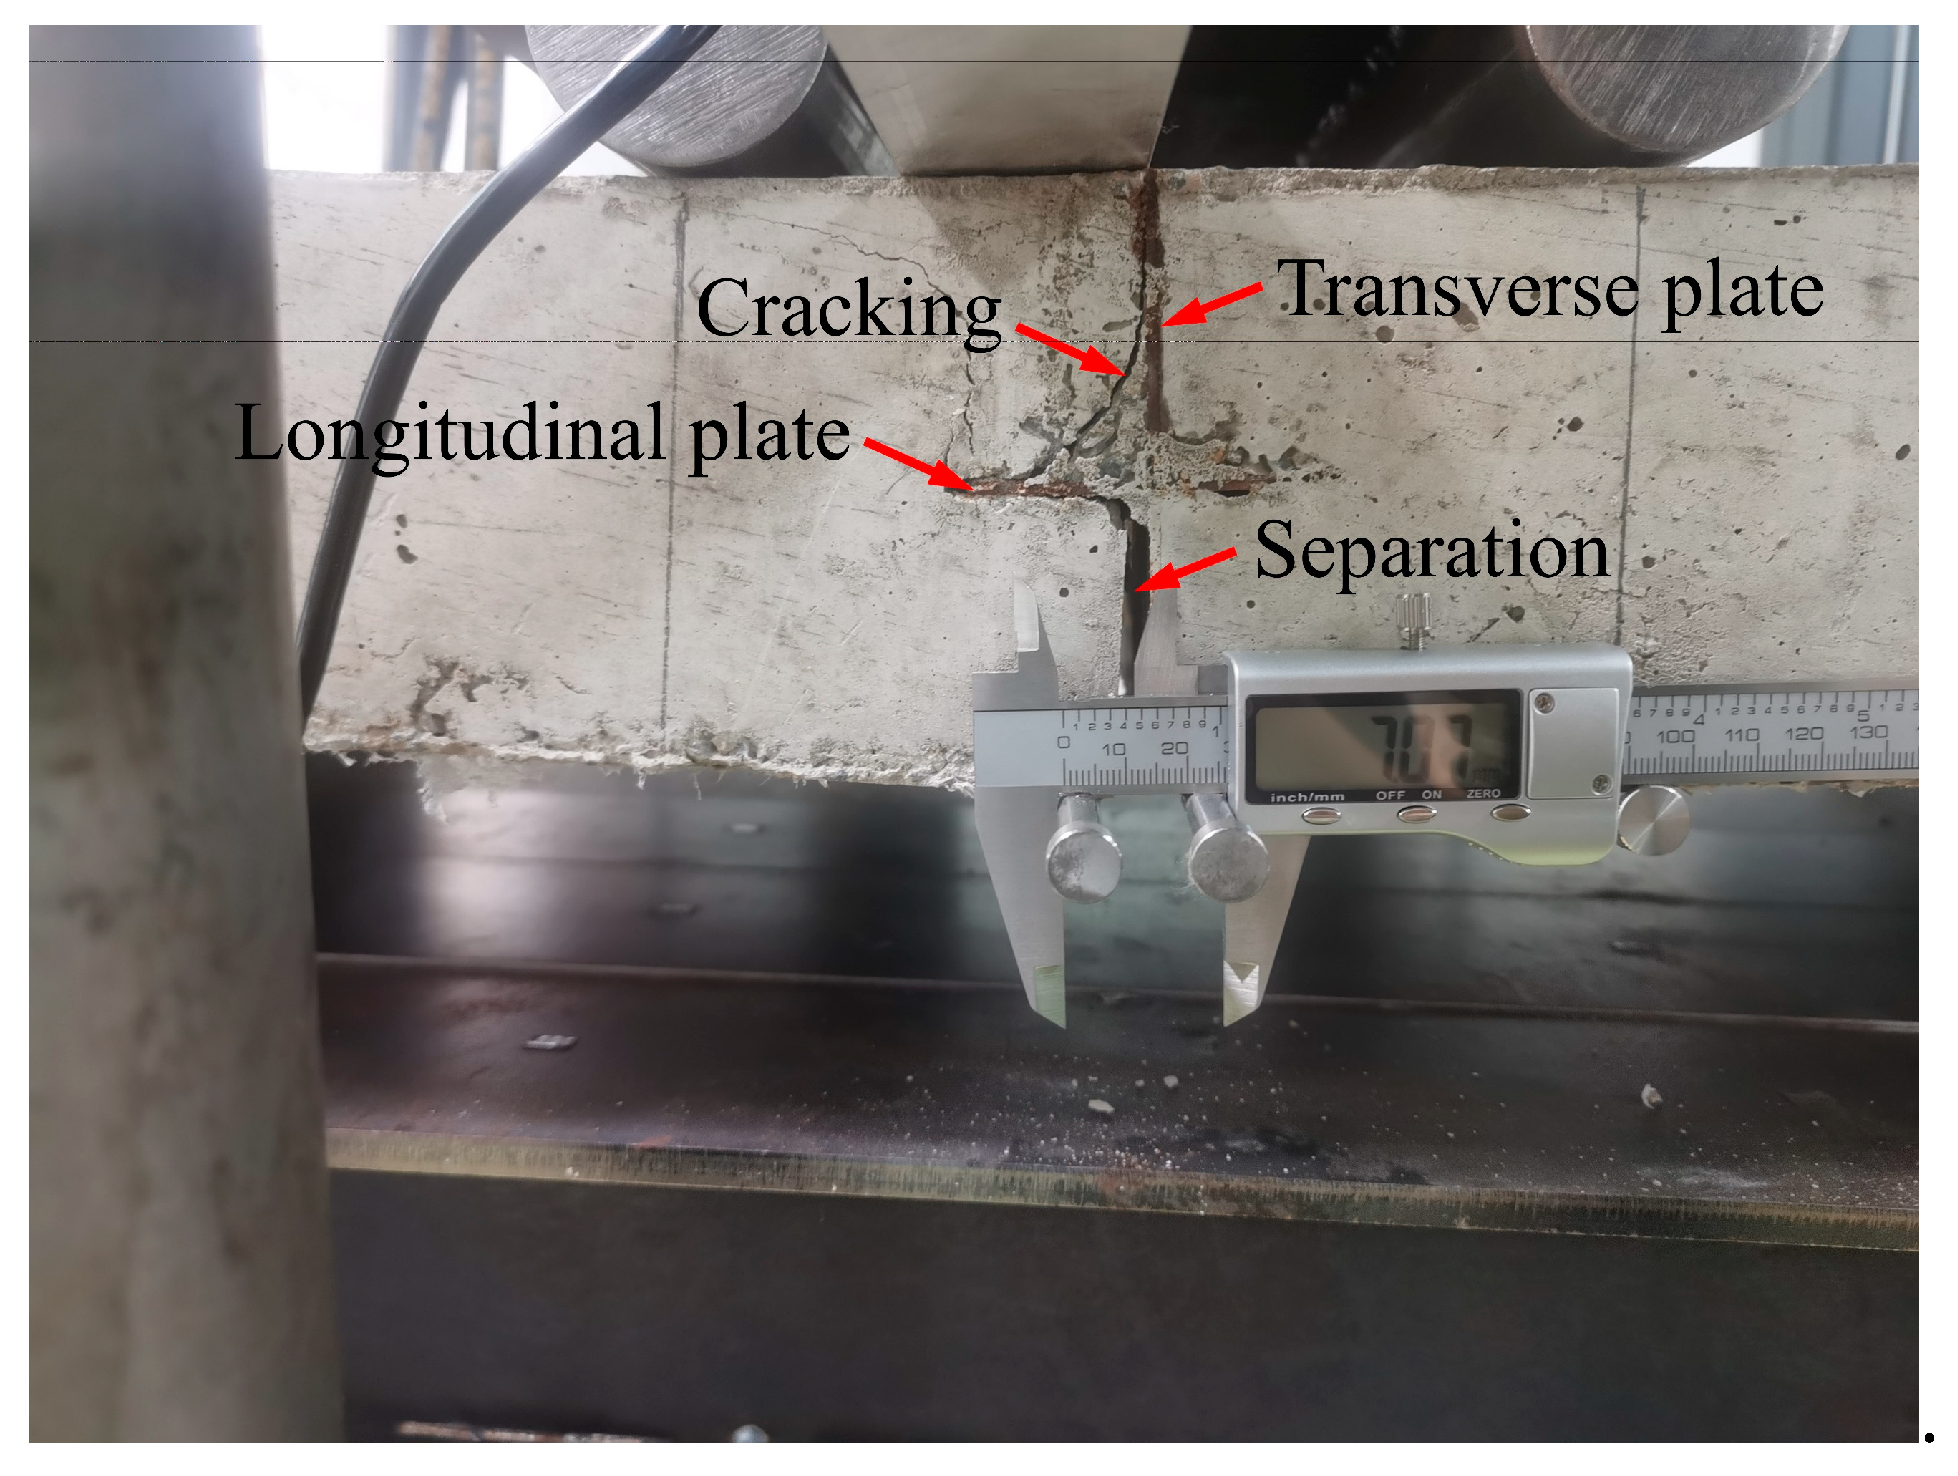
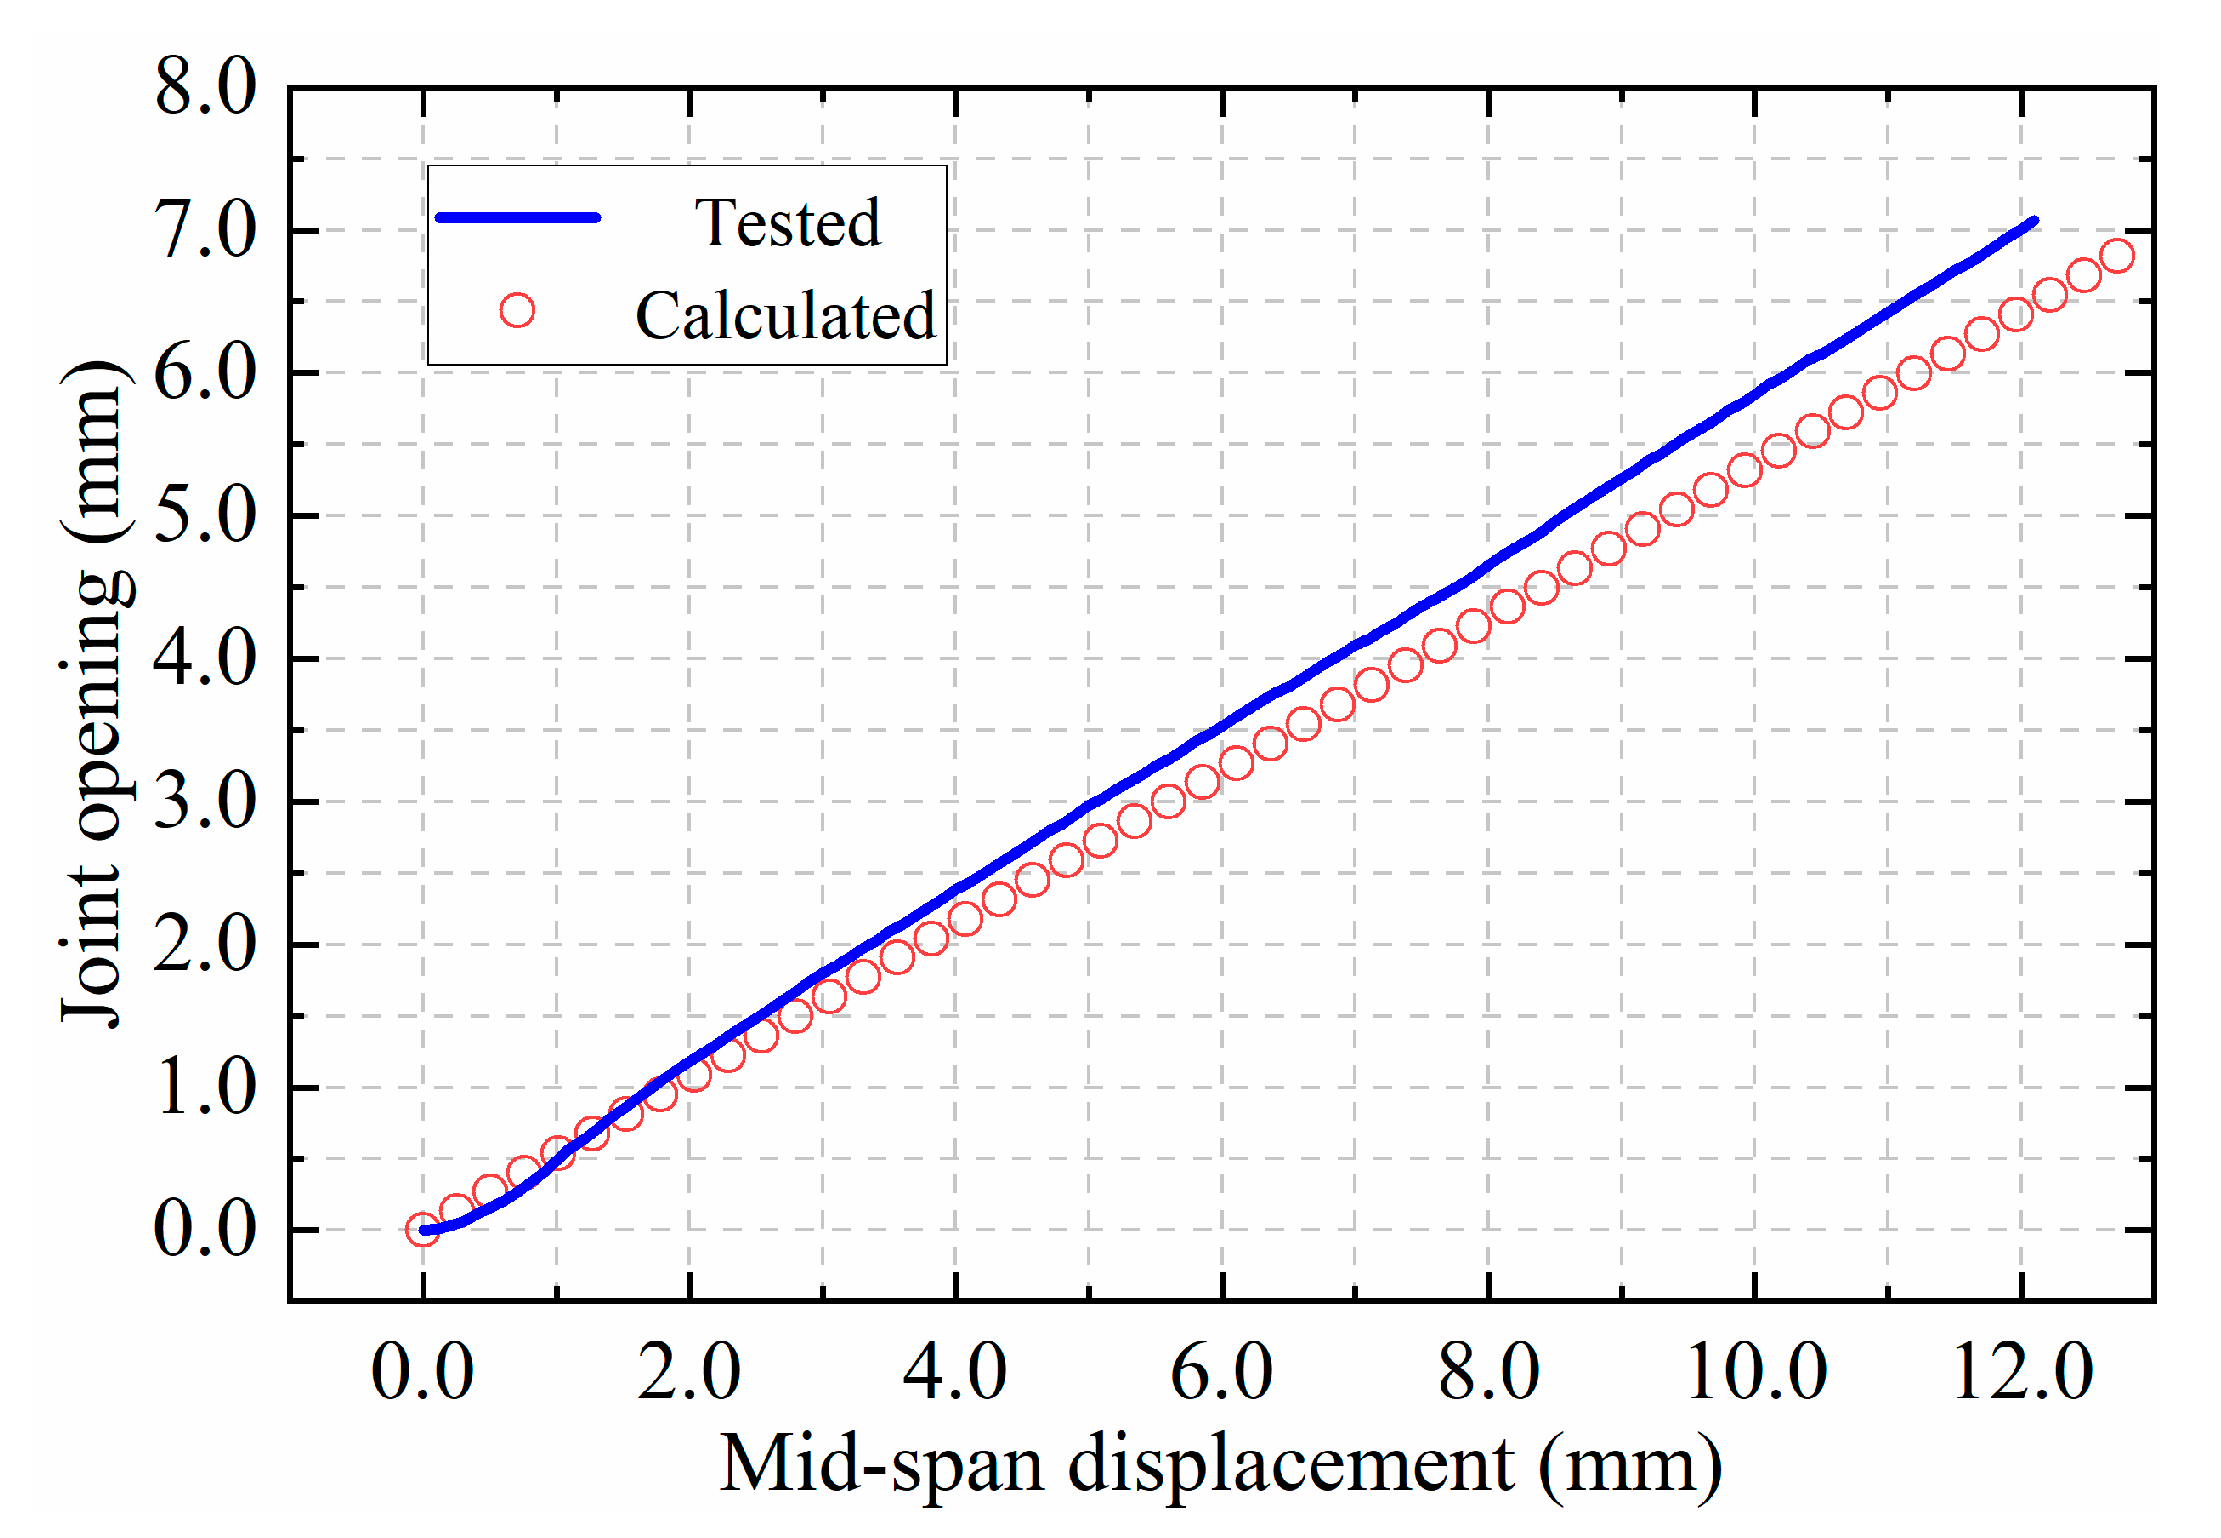
As illustrated in Figure 7, it can be observed that the joint opening increased in accordance with the mid-span displacement, exhibiting a linear growth pattern. The final opening of the joint was over 7.0 mm, and the longitudinal plate of the joint was observed to be pulled out of the concrete on one side, with the concrete below the longitudinal plate separated from the steel plate at this moment. Additionally, cracking was noted along a curved surface in the concrete above the longitudinal plate, extending from the end of the longitudinal plate to the end of the transverse plate as shown in Figure 8.
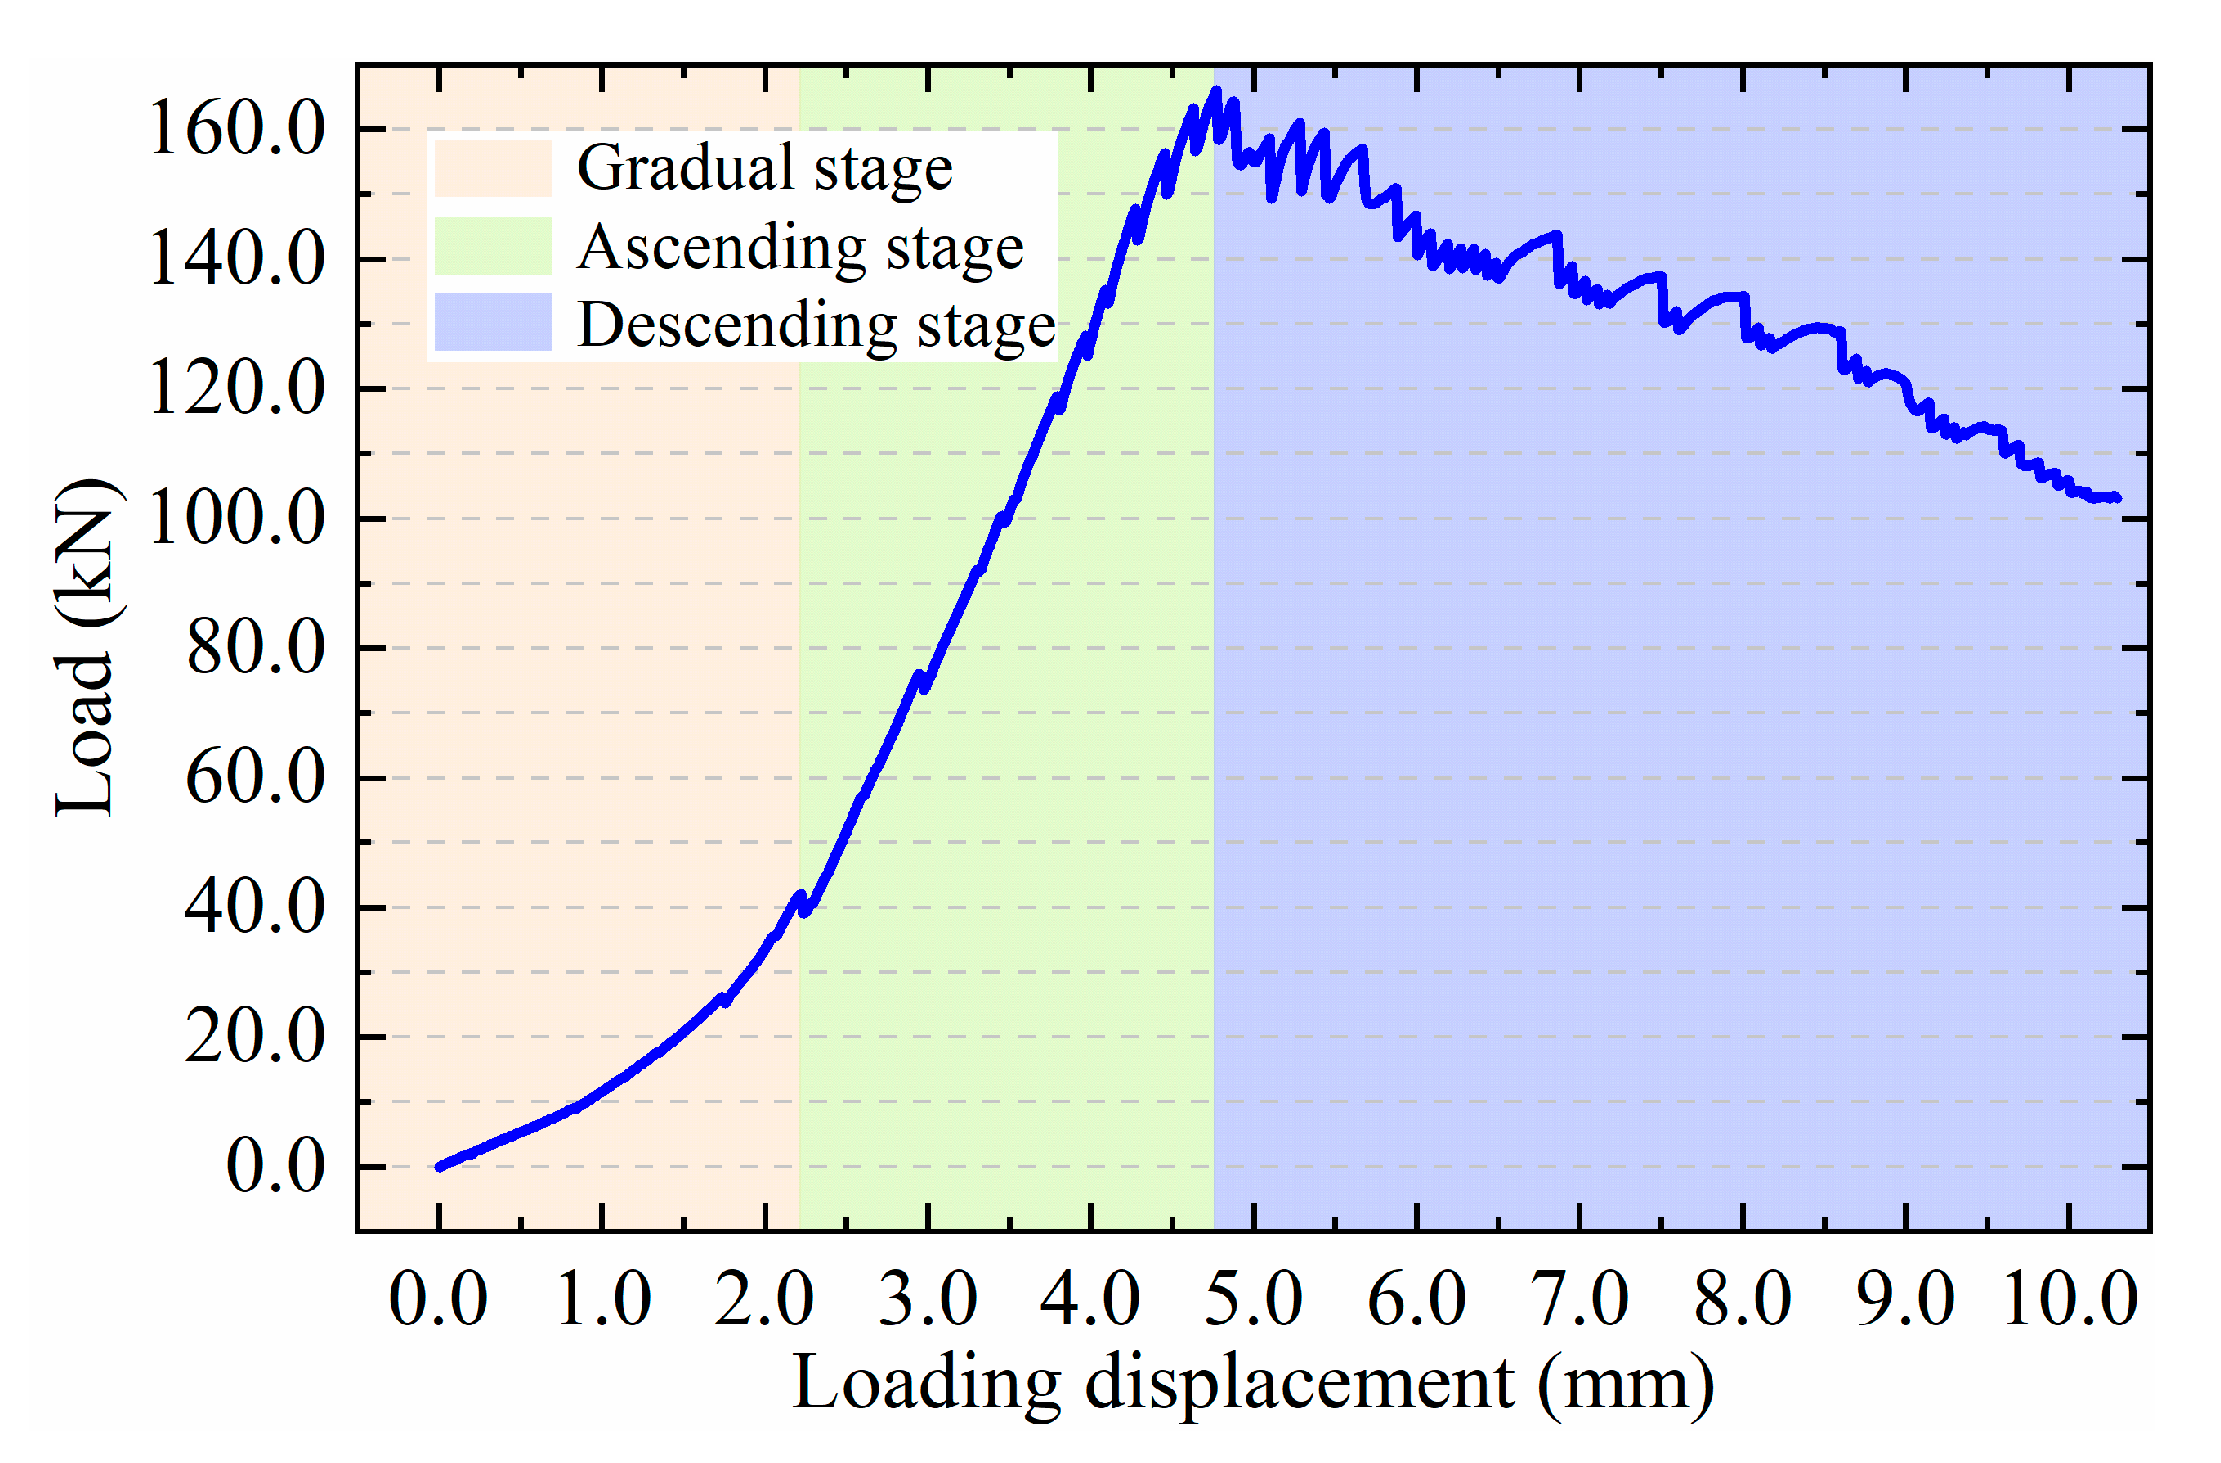
In the actual working state, the joints of diaphragm walls will be subjected to both bending moments and shear forces simultaneously. For a cross-plate joint, the shear resistance primarily depends on the bond effects between concrete and steel as well as the steel plate’s inherent capacity to resist shear deformation. The findings of the bending test demonstrate that, under a comparatively modest load (with a peak of only 7.0 kN), the joint opens, and the bond effects between concrete and steel disappear. Consequently, it can be concluded that the joint primarily relies on the steel plate’s inherent capacity to resist shear deformation. In this study, a four-point bending preload was applied to specimen 2 (S2) prior to the shear test, continuing until its flexural capacity entered the residual stage, with the objective of eliminating the influence of the bond effects on the shear test results. The shear test was also conducted at a rate of 0.2 mm/min, with a maximum displacement of approximately 10 mm, as was the bending test. The load versus loading displacement relationship obtained from the shear test is shown in Figure 9, and the load–displacement curve can be broadly divided into three stages (i.e., gradual stage, ascending stage, and descending stage). In contrast to the bending test, in the shear test, the contact area between the specimen and the steel structure is substantial, coupled with the fact that the surface of the specimen is not entirely flat, resulting in the inevitable formation of a certain gap between the specimen and the steel structure. At the onset of the gradual stage, the gradient is relatively modest due to the presence of the gap. As the applied load increases, the specimen and the steel structure are pressed closer together, resulting in a gradual decrease in the gap between them and an attendant increase in the gradient of the curve. Upon reaching a load of nearly 42.1 kN, the curve progresses to the ascending stage, during which it can be approximated to be linear until reaching the peak load of approximately 166.1 kN. Thereafter, the curve transitions to the descending stage, wherein the load diminishes as the displacement increases. During this phase, the curve fluctuates to a certain extent, yet the dominant tendency can be viewed as a linearly declining line. In this study, the gradual stage will be disregarded, given that the generation of this stage can be attributed to the deviation in the fabrication of the specimen. Consequently, the load–displacement relationship in the shear test can be regarded as comprising two linear stages, namely the ascending stage and the descending stage.
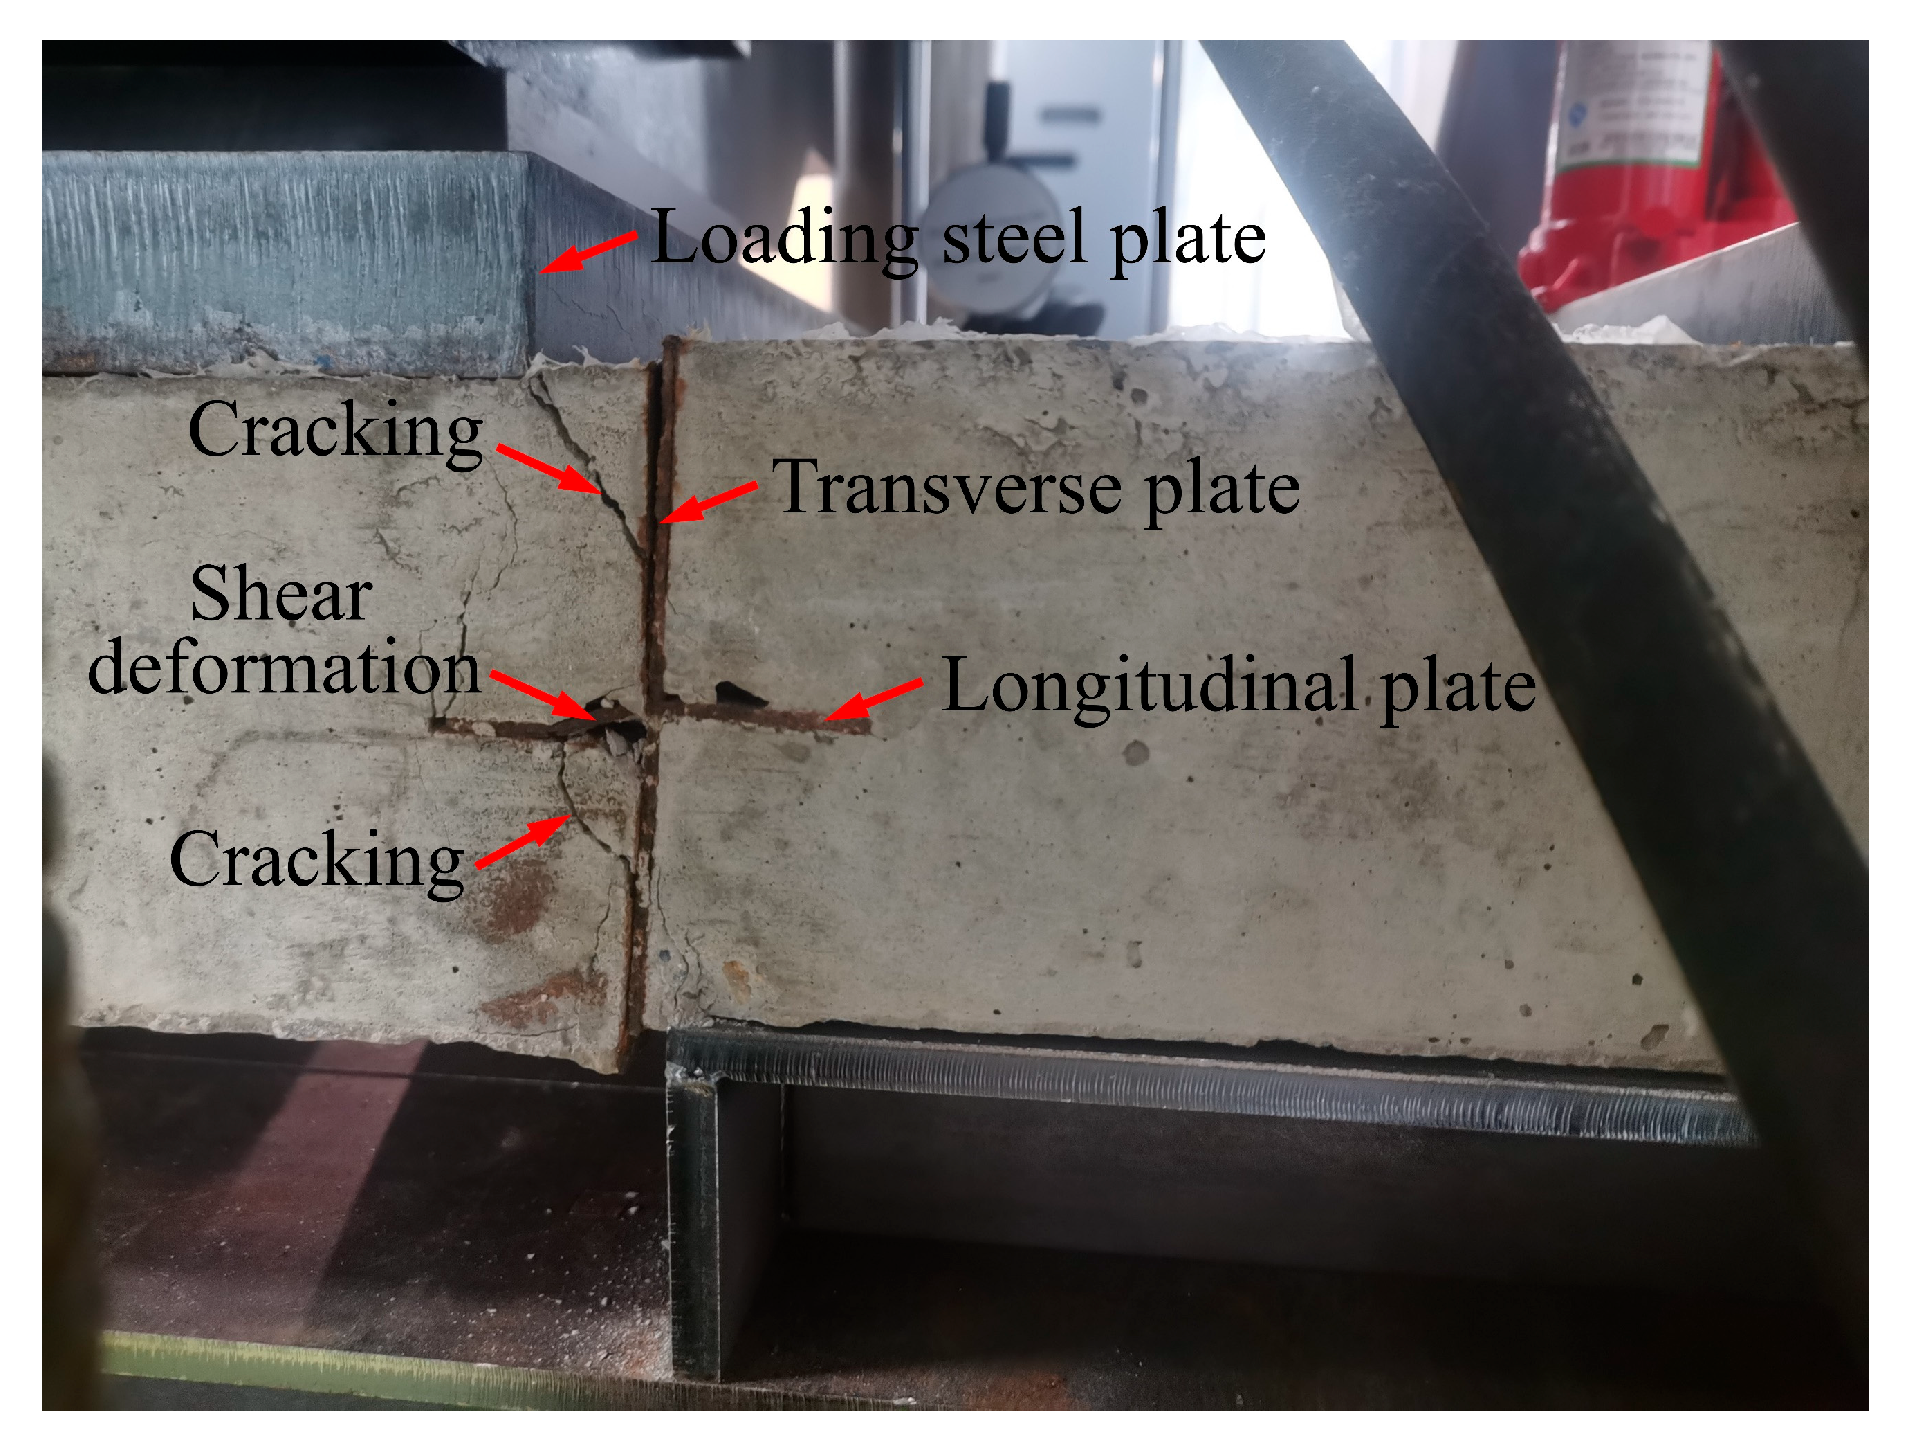
As shown in Figure 6 and Figure 9, the peak load in the bending test is about 7.0 kN, whereas it reaches around 166.1 kN in the shear test, indicating that the shear capacity of the joint is significantly higher than its flexural capacity. Furthermore, the joint remains in the elastic state for a much shorter duration under bending moment compared to shear force, as indicated by the loading displacement at the respective peak loads. A notable residual stage is observed in the bending test, whereas no such stage is evident in the shear test. As shown in Figure 10, when the joint failed under shear force, the longitudinal plate of the joint exhibited a substantial degree of shear deformation. The concrete beneath the longitudinal plate displayed cracking along a curved surface, extending from the location where the longitudinal plate exhibited significant deformation to the longitudinal steel plate, and then, the cracking continued along the interface between the concrete and the longitudinal plate. The concrete above the longitudinal plate exhibited cracking from the edge of the loading steel plate, with the crack extending to the transverse plate and subsequently propagating along the interface between the concrete and the longitudinal plate. In both the bending and shear tests, no evidence of damage, such as cracking and crushing, was observed in the remaining areas of the specimen, with the exception of the area proximate to the joint.

3. Simplified Mechanical Model

3.1. Multi-Linear Spring Model

The utilisation of springs is a common method for simulating complex interactions, such as the interaction between bolt and segment in the case of a joint in a shield tunnel [31,43,44] as well as the interaction between the perfobond steel plate and concrete in the case of a perfobond shear connector [42,45,46]. In this study, the interaction between the cross-plate and the concrete in bending was simplified as a set of normal springs that connect the midpoints of the contiguous panels (see Figure 11a), and the interaction in shear was simplified as a set of shear springs (see Figure 11b). As demonstrated in the preceding section, the experimental findings indicate that the bending and shear behaviour of the cross-plate joint can be categorised into four and two linear stages, respectively. Consequently, the stiffness of normal and shear springs is also subdivided into a corresponding number of four and two linear stages, thereby resulting in a multi-linear spring model. It is noteworthy that the normal bonding performance of the steel–concrete interface can be represented by a bilinear model [47], which can also be regarded as a type of multi-linear model. In order to simplify the numerical model, the distribution of the bonding force at the interface is disregarded, and the bonding force is thus simplified to a concentrated force at the midline of the interface, which is unified in the normal springs aforementioned. The normal springs and the shear springs can be set at the same position. The number of springs is determined by the meshing size, and it is recommended that the springs be set at each node.

3.2. Stiffness of the Multi-Linear Spring

Based upon the joint bending and shear test configuration above, two 3D finite element models were developed utilising Abaqus/CAE 2023, as shown in Figure 12a,b, respectively. The wall panels were modelled using 3D C3D8R 8-node linear solid elements, with a size of 0.025 m, and the springs were configured at each solid element node along the midline of the contact surface between the adjacent panels, as shown in Figure 12c. The connector element, incorporated within the Abaqus software, can function as the spring, which is an element established between two nodes and is capable of inputting the force corresponding to different displacements. The interaction between the steel and concrete was modelled using hard contact type in Abaqus, which prevents two contiguous panels from penetrating into each other in compression but allows them to separate when subject to tension [44]. The friction coefficient of the hard contact type was set to be 0.5, a value referenced from the study of Hosseini et al. [46]. The concrete of the panel was considered as a linear elastic material rather than an isotropic damage plasticity material [13], which is primarily due to the fact that the objective of this procedure is to determine the stiffness of the spring at each stage by back-analysis of the experimental data using finite element models rather than to investigate the detailed damage mechanism of the joint. Moreover, in the context of finite element modelling of excavation cases, diaphragm walls are typically regarded as elastic [23,24,25,26,27,28,29]. The compressive strength of the concrete utilised in the fabrication of the specimens was found to be in close alignment with that of C40 concrete documented in the Code for Design of Concrete Structures [48]. Accordingly, the Young’s modulus, Poisson’s ratio, and unit weight of C40 concrete were employed in the numerical models, with values of 32.5 GPa, 0.2, and 24.5 kN·m3, respectively [48]. The isotropic elasticity of Q235 steel structure is characterised by a Young’s modulus of 206 GPa and a Poisson’s ratio of 0.3, along with a unit weight of 78.5 kN·m3 [49].
The selection of the spring stiffness was conducted through a process of comparison between the results of the finite element analysis and the available test data, namely a back-analysis approach. This approach involves first assuming the spring stiffness values in the finite element model and then calculating an initial load–displacement curve. The spring stiffness values are then continuously adjusted until the calculated and tested curves closely match. The stiffness values at this point are the desired values. As demonstrated in Figure 12, a total of 17 normal springs and 34 shear springs were configured for the bending and shear tests, respectively. Given the positioning of spring 2 in Figure 12c at the edge of the model, its stiffness should be reduced by half in comparison to that of spring 1, regardless of whether it is a normal or shear spring. The stiffness values obtained for spring 1 are presented in Figure 13, and comparisons of the tested and calculated results are displayed in Figure 14 and Figure 15. The average error between the calculated and tested values illustrated in Figure 14a,b and Figure 15 was found to be 3.6%, 2.6%, and 10.7%, respectively, following statistical analysis, which indicates that the spring stiffness values obtained are appropriate for simulating the bending and shear behaviour of the joints.

4. Case Study

4.1. Basic Information

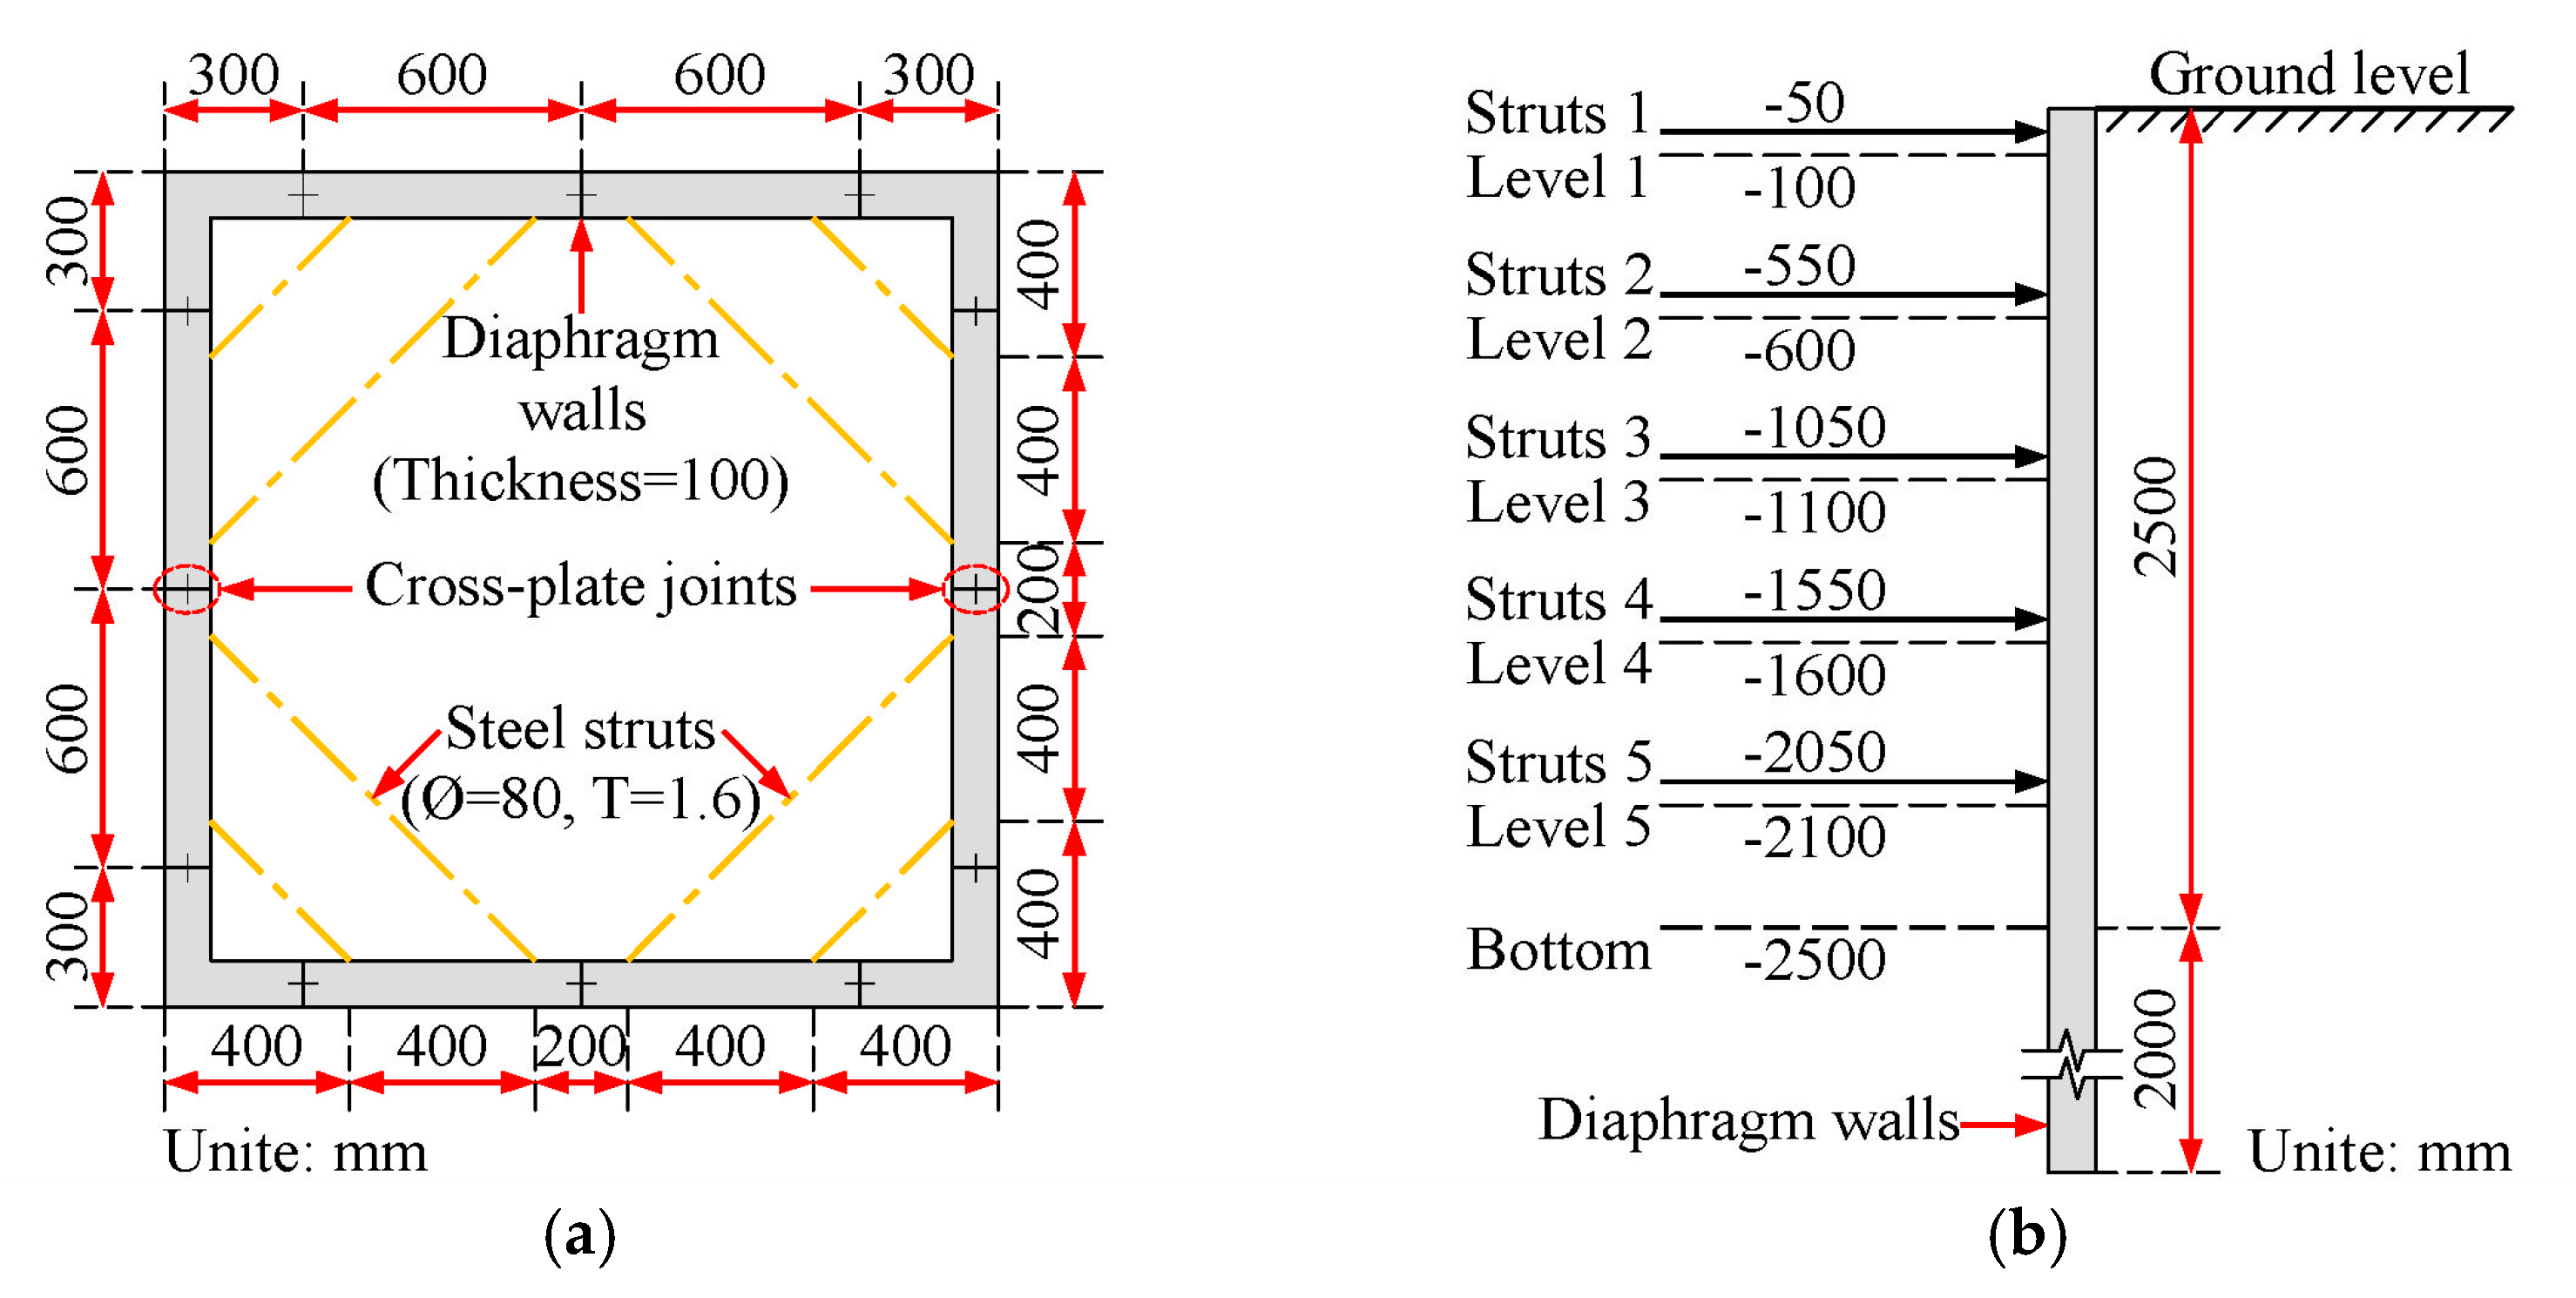
Given that the scale ratio of the model tests in the preceding sections was 1:10, an excavation case with the same scale ratio was devised to enable the proposed model and the obtained spring stiffness values to be applied directly to the case analysis. As shown in Figure 16, the excavation case had a plan size of 1600 mm × 1600 mm, an excavation depth of 2500 mm, a diaphragm wall depth of 4500 mm, and a diaphragm wall thickness of 100 mm. The steel structs, positioned at the elevations of −50, −550, −1050, −1550, and −2050 mm, respectively, had an external diameter of 80 mm and a thickness of 1.6 mm, which was also equivalent to 1/10th of the actual steel pipe size, and the Young’s modulus of the steel structs is 206 GPa. The prototype of the excavation was hypothesised to be situated within a sand layer characterised by a unit weight of 18.6 kN·m−3, an angle of internal friction of 28°, and a scale factor for a horizontal coefficient of subgrade reaction of 10 MN·m−4 [10]. The ground surface surcharge was assumed to be 20 kPa [9,10].

4.2. Numerical Modelling

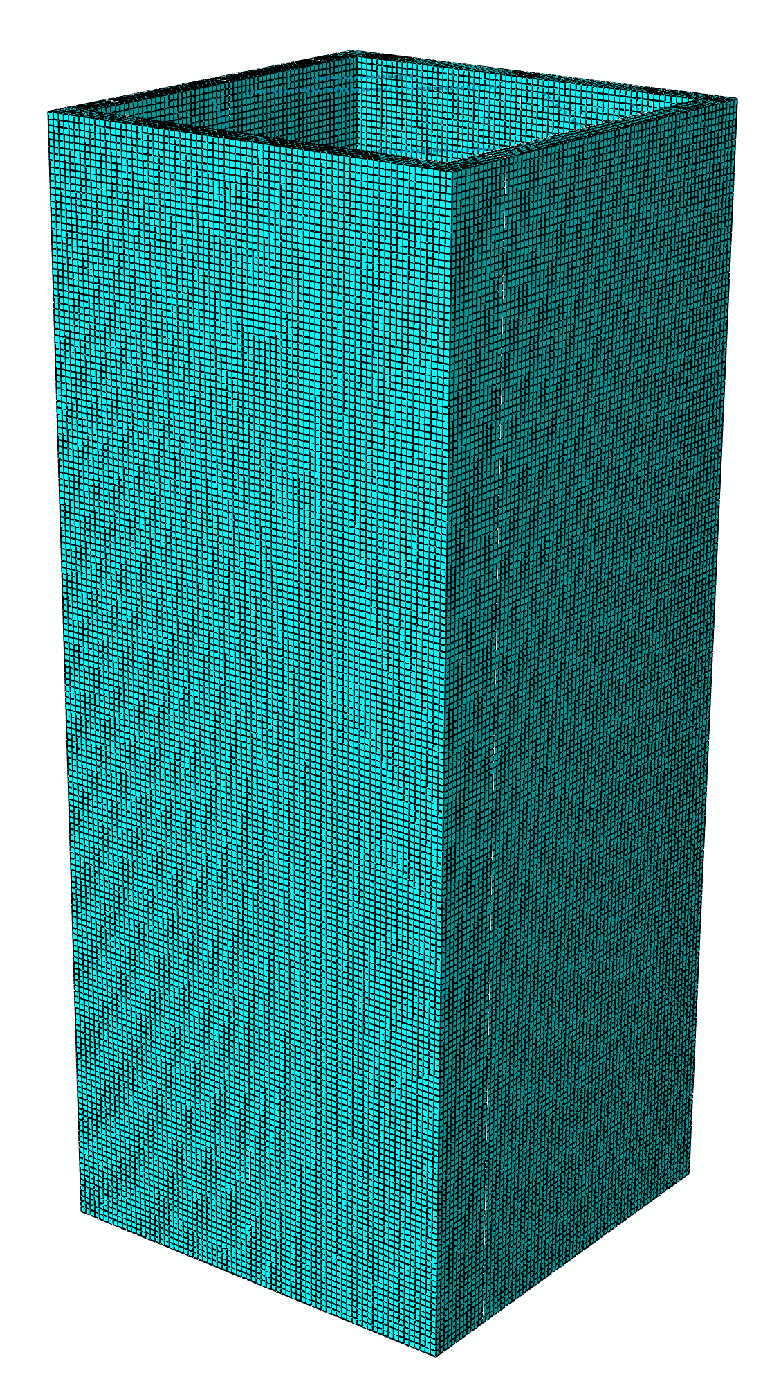
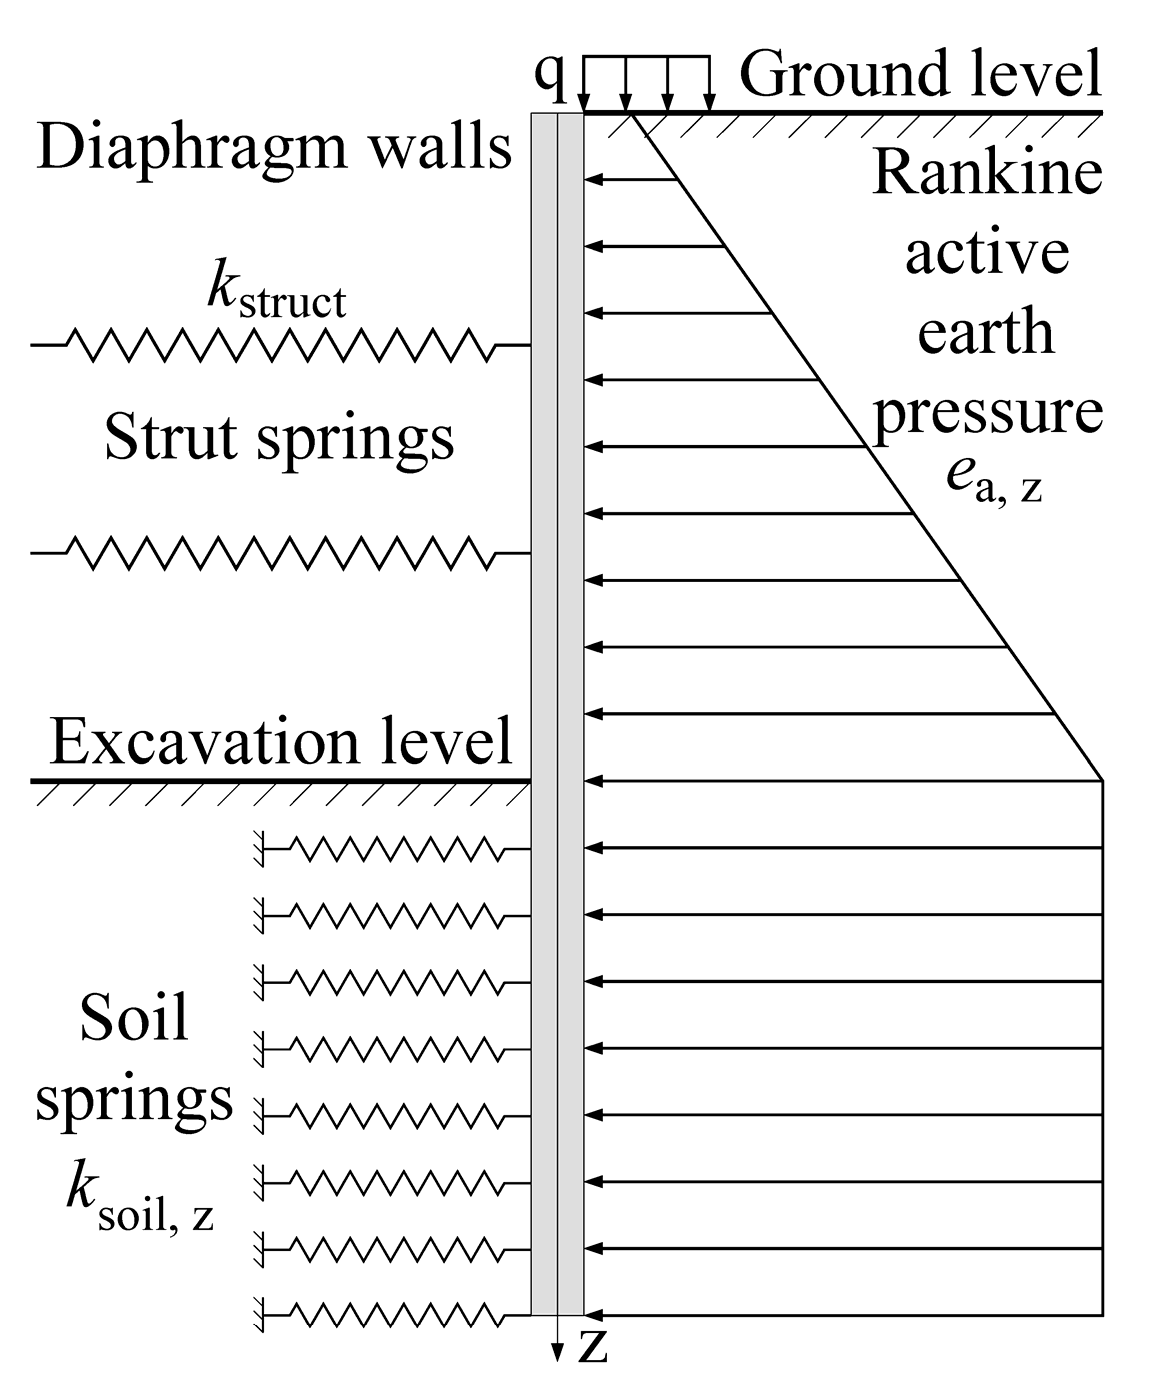
The numerical model of the case, composed of 195,840 3D C3D8R 8-node linear solid elements with a size of 0.025 m, is shown in Figure 17. In this study, the Winkler’s model, alternatively referred to as the beam-on-elastic foundation method, was employed to analyse soil–structure interaction problems [9,10,50]. As demonstrated in Figure 18, in the Winkler’s model, the steel struts are equivalent to struct springs, and the soil on the passive side is modelled as soil springs. It is widely accepted that the soil on the active side is regarded as a pressure acting on the wall. This pressure is equivalent to the Rankine active earth pressure above the excavation bottom while maintaining a constant pressure below the excavation bottom [9,10,50]. The modelling method for the diaphragm walls and joints as well as the parameters remain the same as in Section 3.1 and Section 3.2. The stiffness of struct springs, the stiffness of soil springs, and the Rankine active earth pressure can be expressed as Equations (1)–(3):
k struct = E s A L
k soil ,   z = m a 2 z h n
e a ,   z = γ z + q tan 2 45 φ 2
where kstruct, ksoil, z, and ea, z are the stiffness of struct springs, the stiffness of soil springs at depth z, and the Rankine active earth pressure at depth z, respectively; Es, A, and L are the Young’s modulus, the section area, and the length of steel structs, respectively; m, a, and hn are the scale factor for horizontal coefficient of subgrade reaction of the soil, the meshing size of the diaphragm wall, and the excavation depth at nth stage, respectively; γ, q, and φ are the unit weight of soil, the ground surface surcharge, and the angle of internal friction of the soil, respectively.
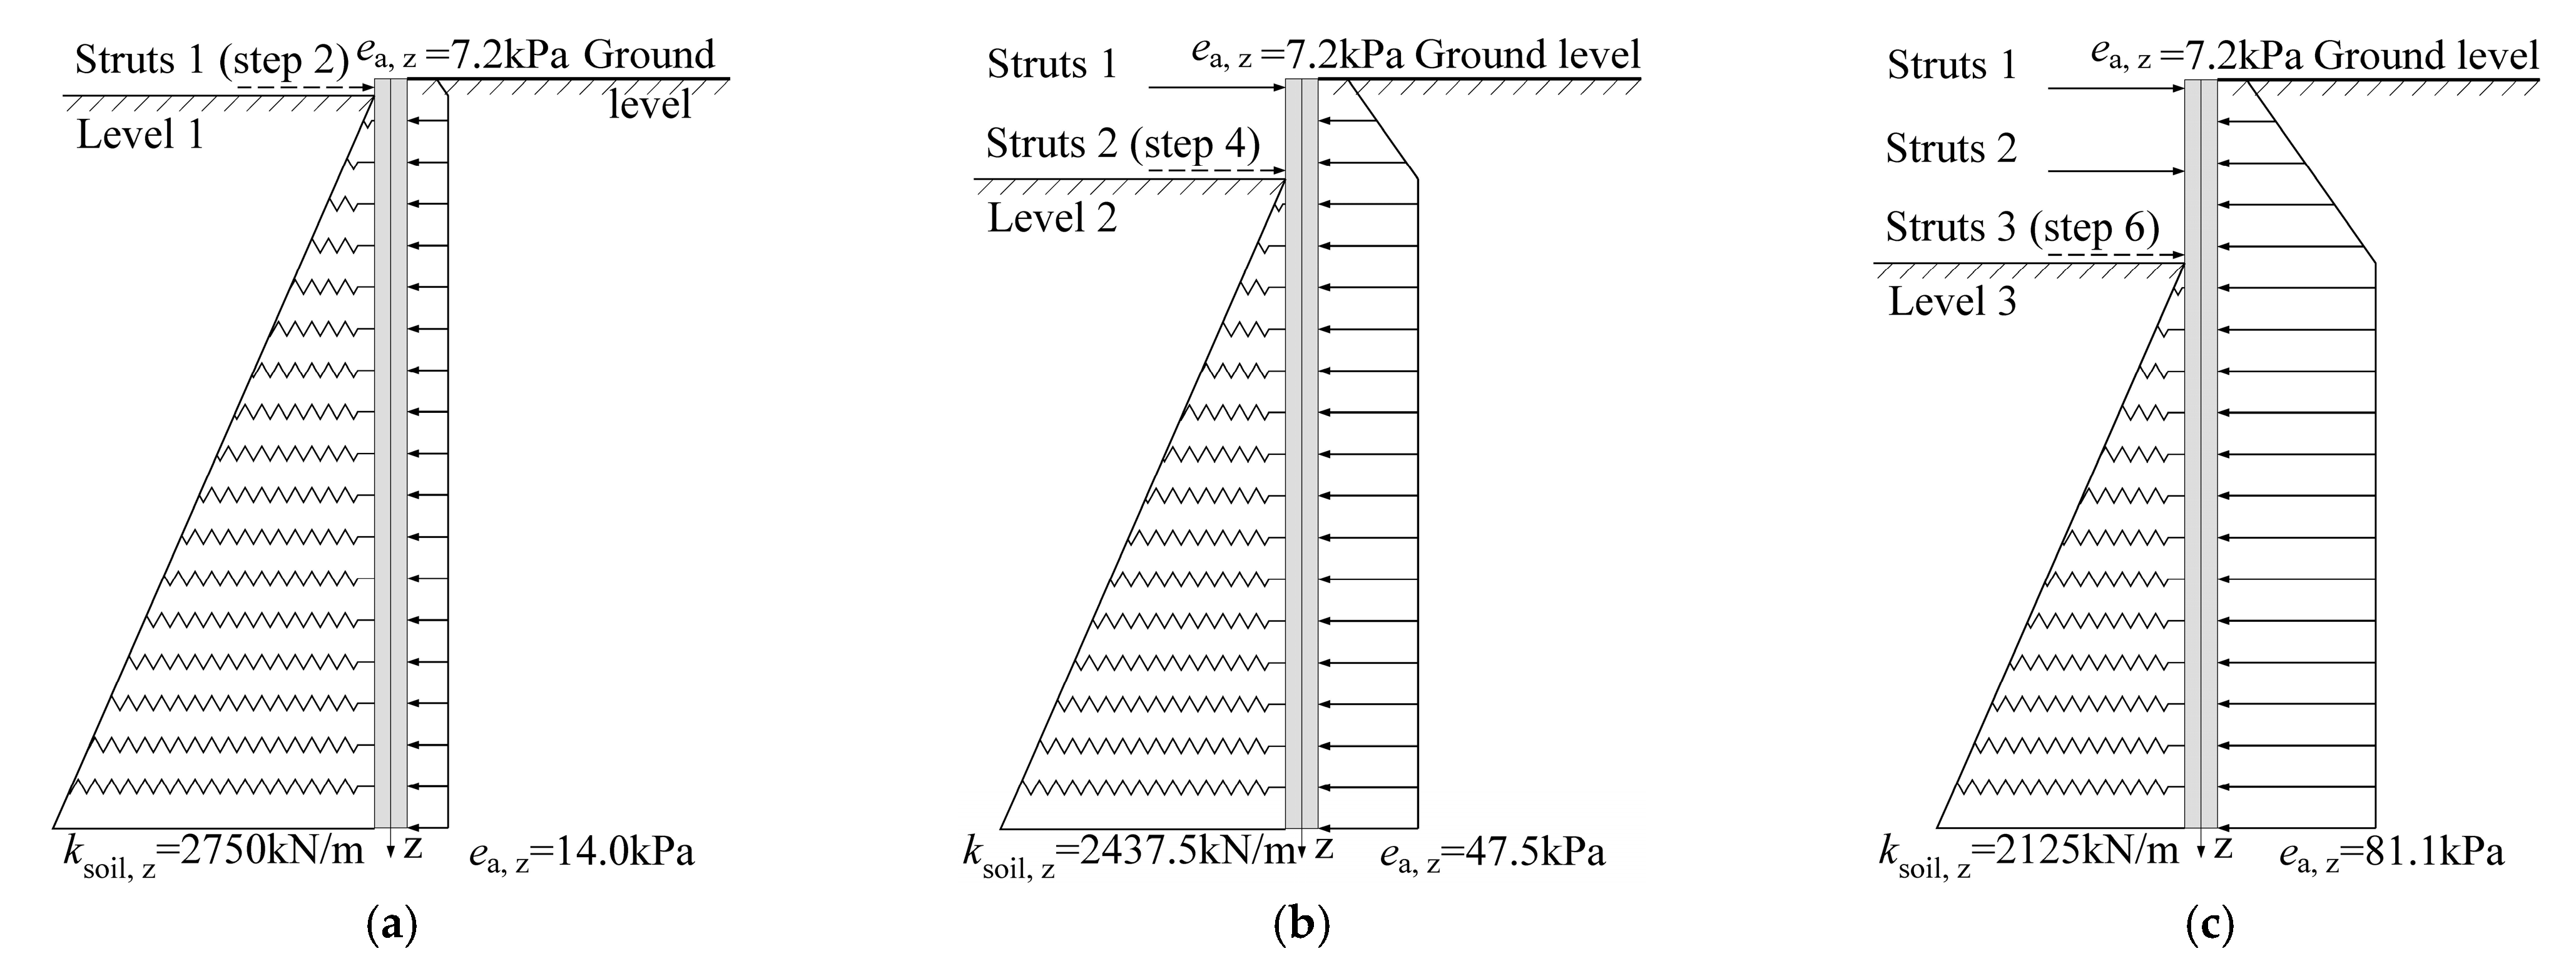
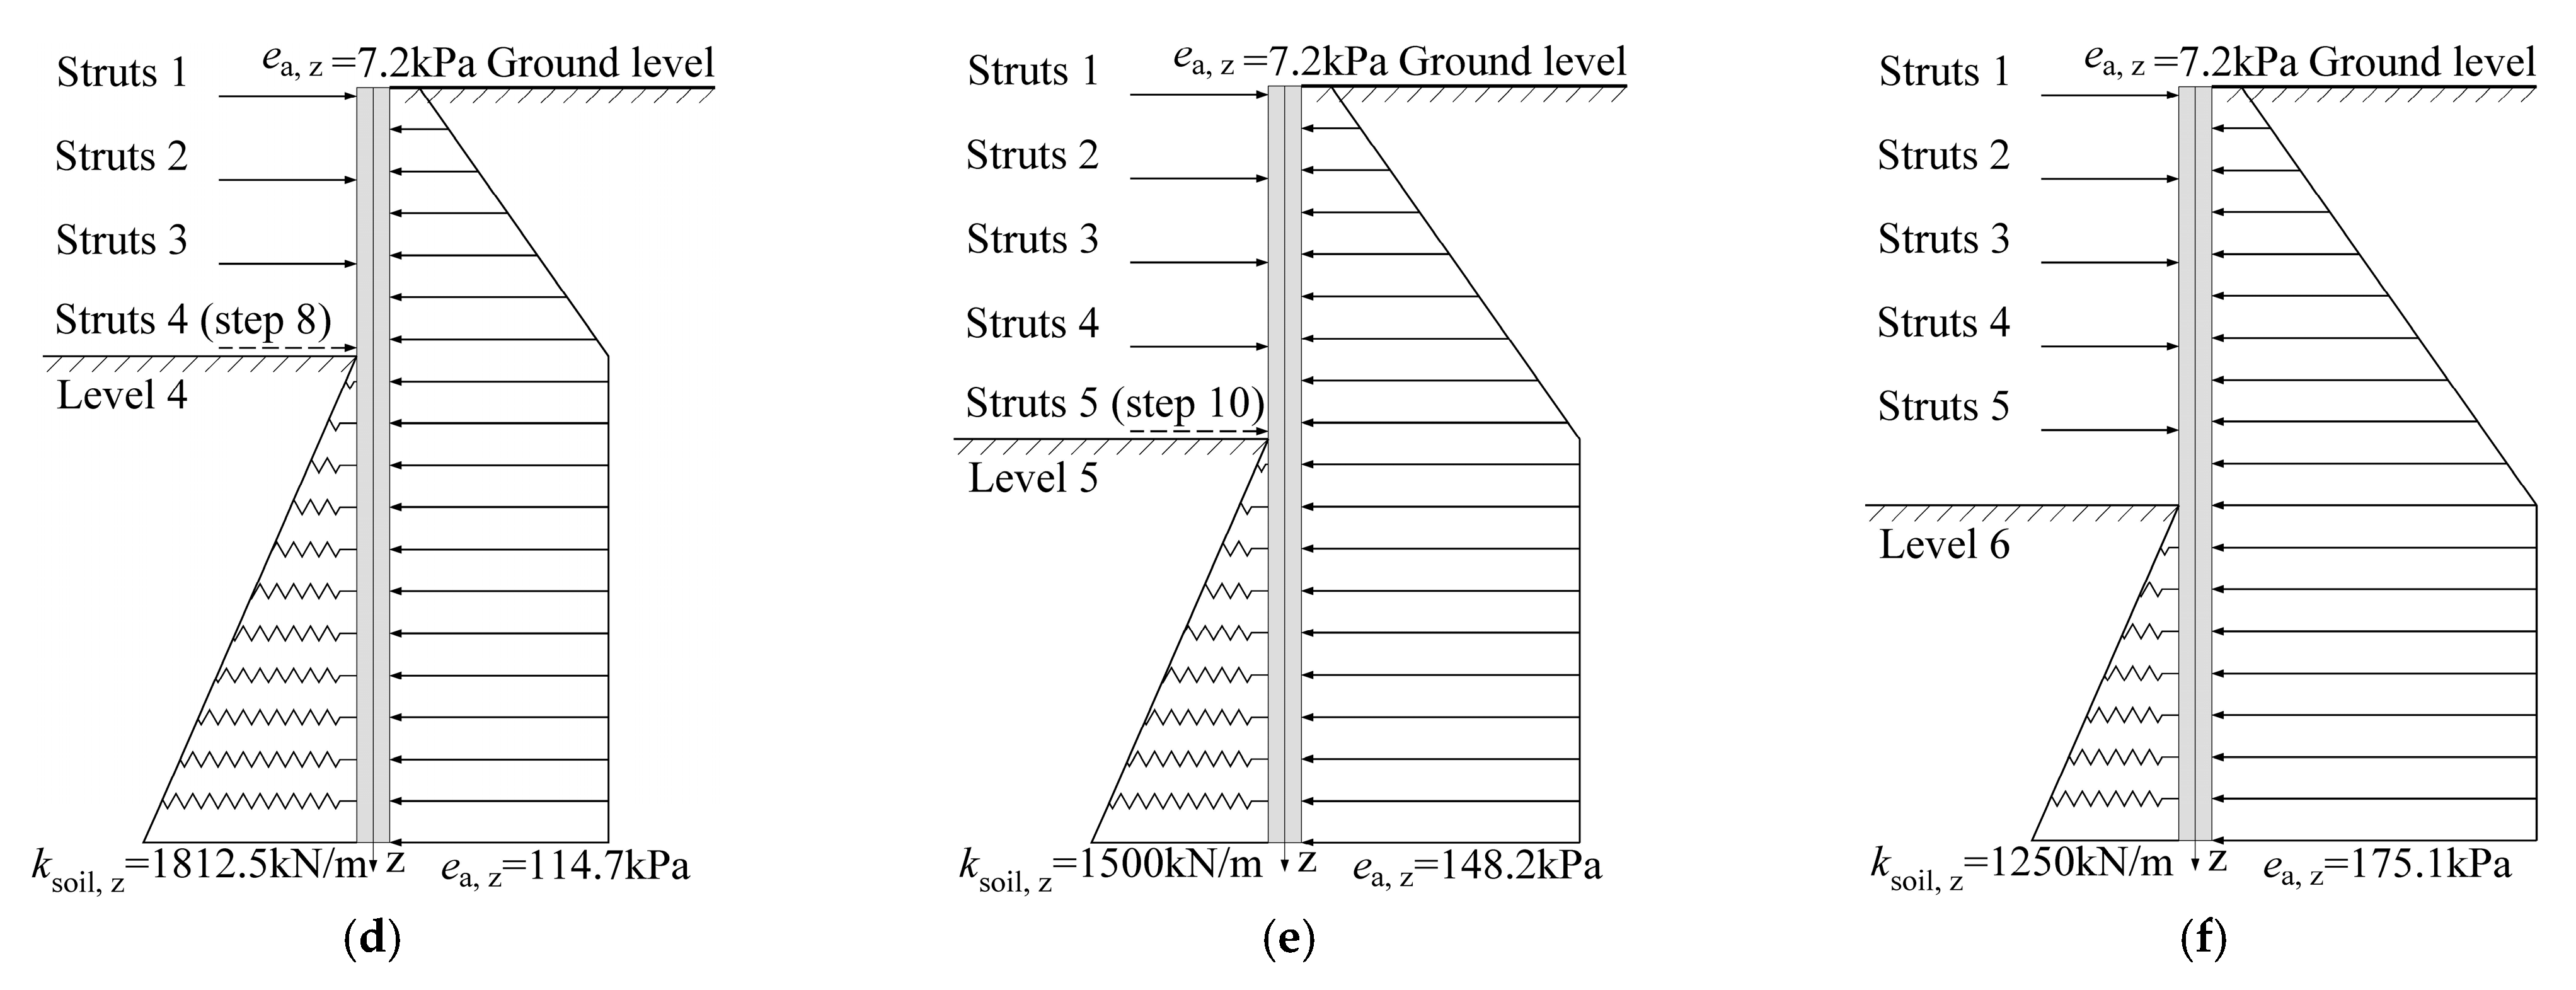
The excavation was assumed to be undertaken in eleven steps, as illustrated in Figure 16b and outlined in Table 1. The excavation process was modelled using the incremental method [51], and each excavation step was simulated by increasing the active earth pressure and struct springs while concurrently decreasing the soil springs on the passive side and reducing their stiffness according to the excavation depth.
According to the similarity relationships summarised in Table 2, the length similarity ratio (SL) and the material elastic modulus similarity ratio (SE) can be determined first when designing a scaled model, and then, the remaining physical quantities are functions of SL or SE or are equal to 1.0 [52]. The numerical model established in this paper was a scaled model with a length scale SL = 1/10 and an elasticity modulus scale SE = 1/1. Therefore, the surface load scale, Sq, should be equal to the SE (i.e., 1/1), and the displacement scale, Sx, is equal to the SL (i.e., 1/10). In other words, the surface load of the scale model should be consistent with the actual project, with displacement being 1/10 of the actual project. This indicates that the surface load on the diaphragm wall at a depth of 4.5 m in the scaled model must be equivalent to the surface load at a depth of 45 m in the actual project; with this, the displacement of the diaphragm wall in the scaled model will be 1/10 of that in the actual project. Based on the aforementioned principles, the active earth pressure and stiffness of the soil springs of the diaphragm wall in the scaled mode were calculated for each step, as illustrated in Figure 19.

4.3. Results and Discussion

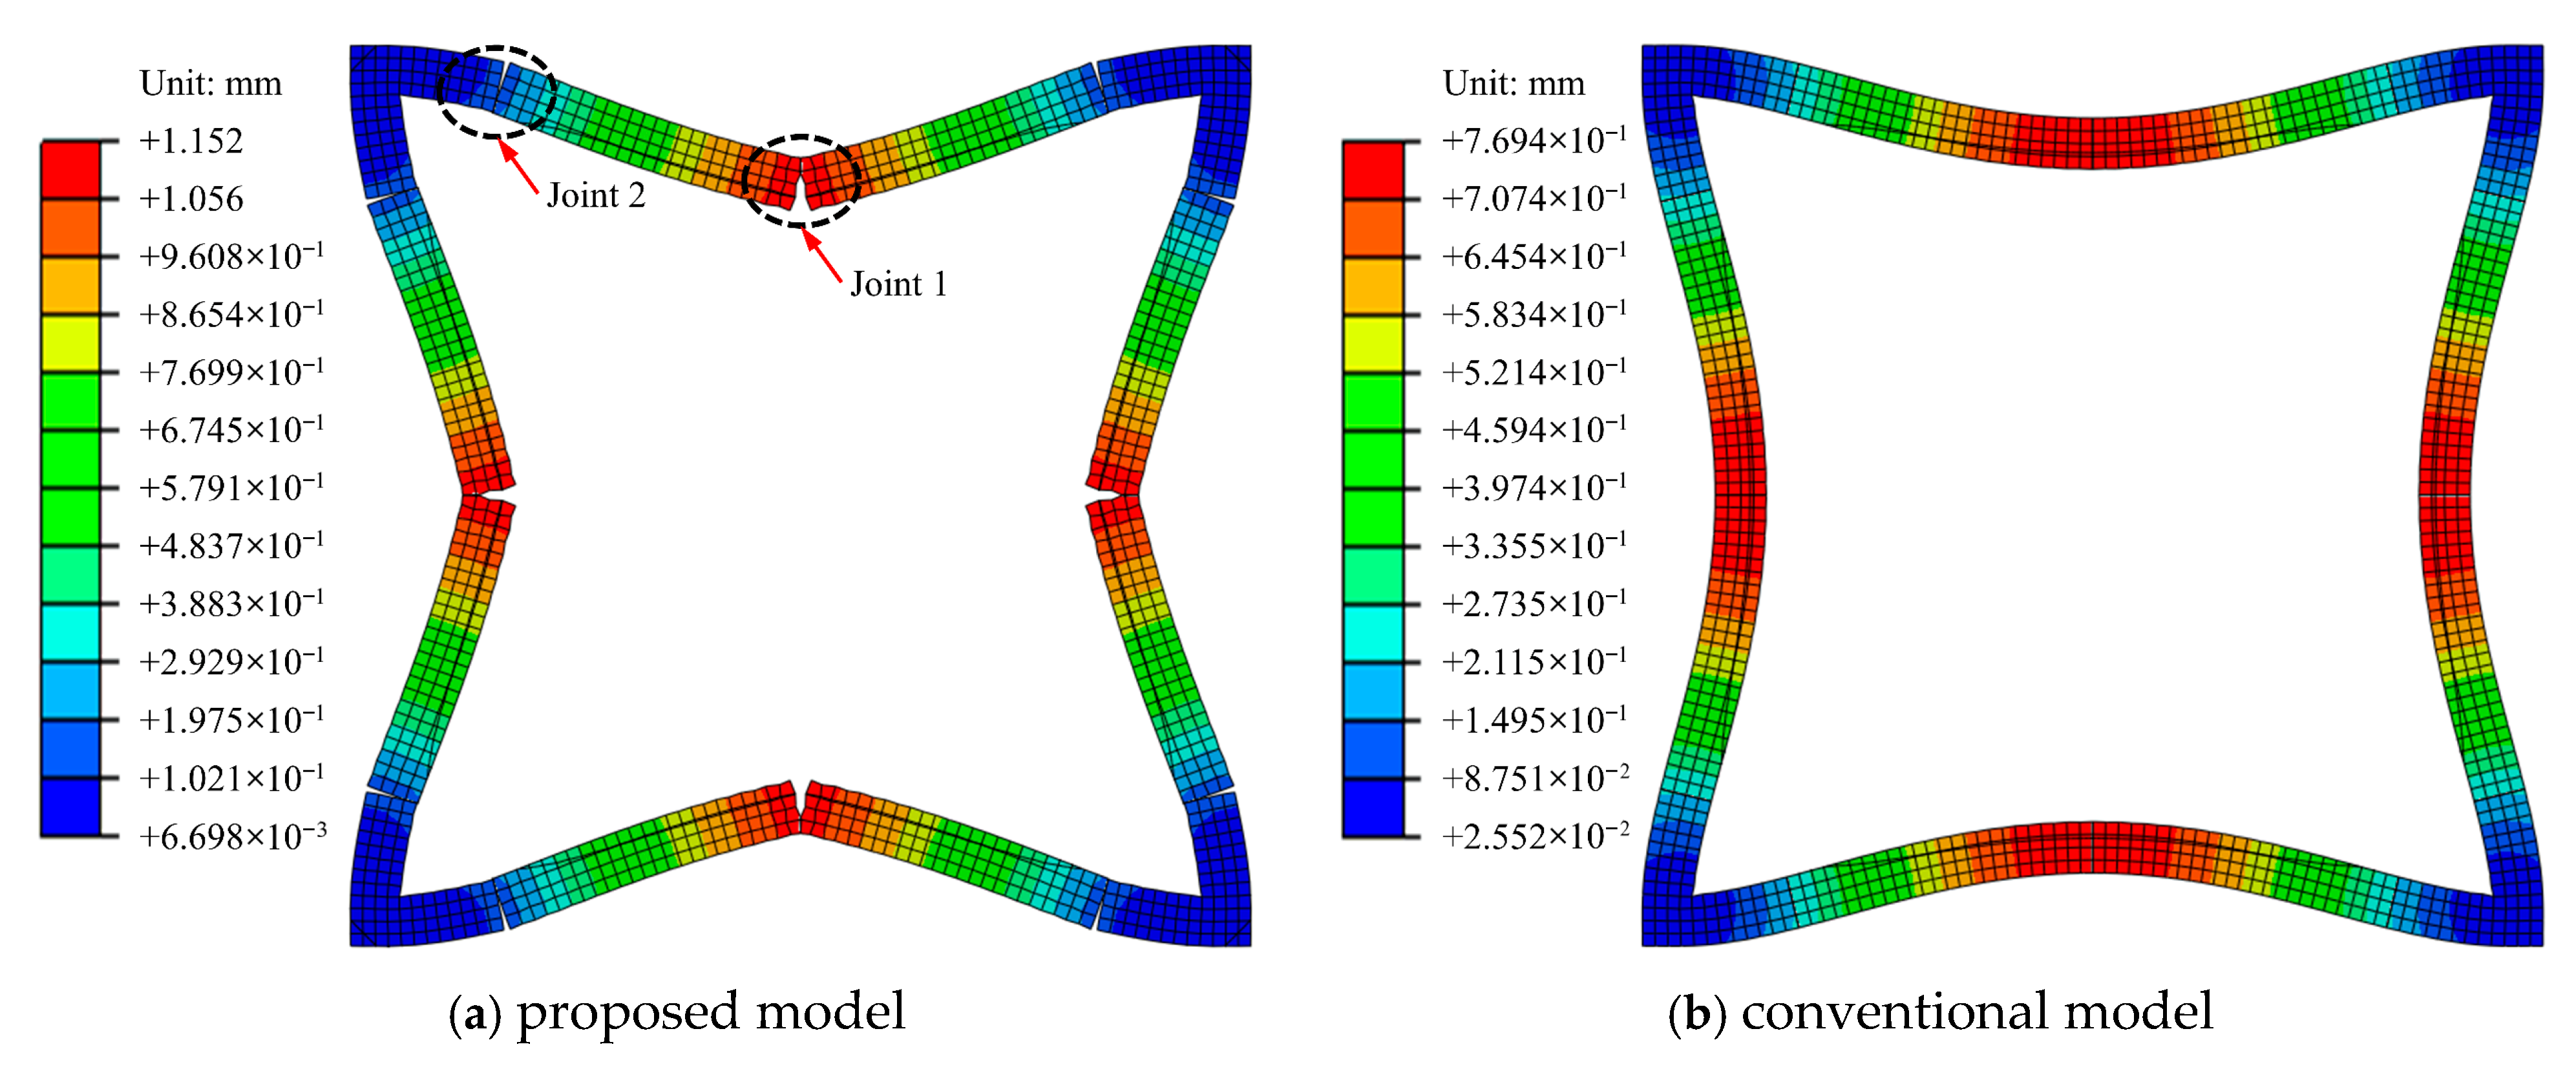
In the last step of the case, for instance, the contours of wall deformation at the excavation bottom obtained by the proposed method, considering joints, and the conventional method, disregarding joints, are shown in Figure 20a and Figure 20b, respectively. As demonstrated in Figure 20, the deformation contour obtained by the proposed method can provide a superior representation of the opening phenomenon in the diaphragm wall at the two joint locations, namely joint 1 at the midpoint and joint 2 near the corner, aligning more closely with actual deformation than the conventional method. It can be observed that joint 1 is open on the inside of the excavation, while joint 2 is open on the outside. With regard to the deformation values, the mid-span displacement of the diaphragm wall calculated by the proposed method is 1.152 mm, whereas the conventional method is only 0.769 mm, which is a difference of nearly 1.5 times.
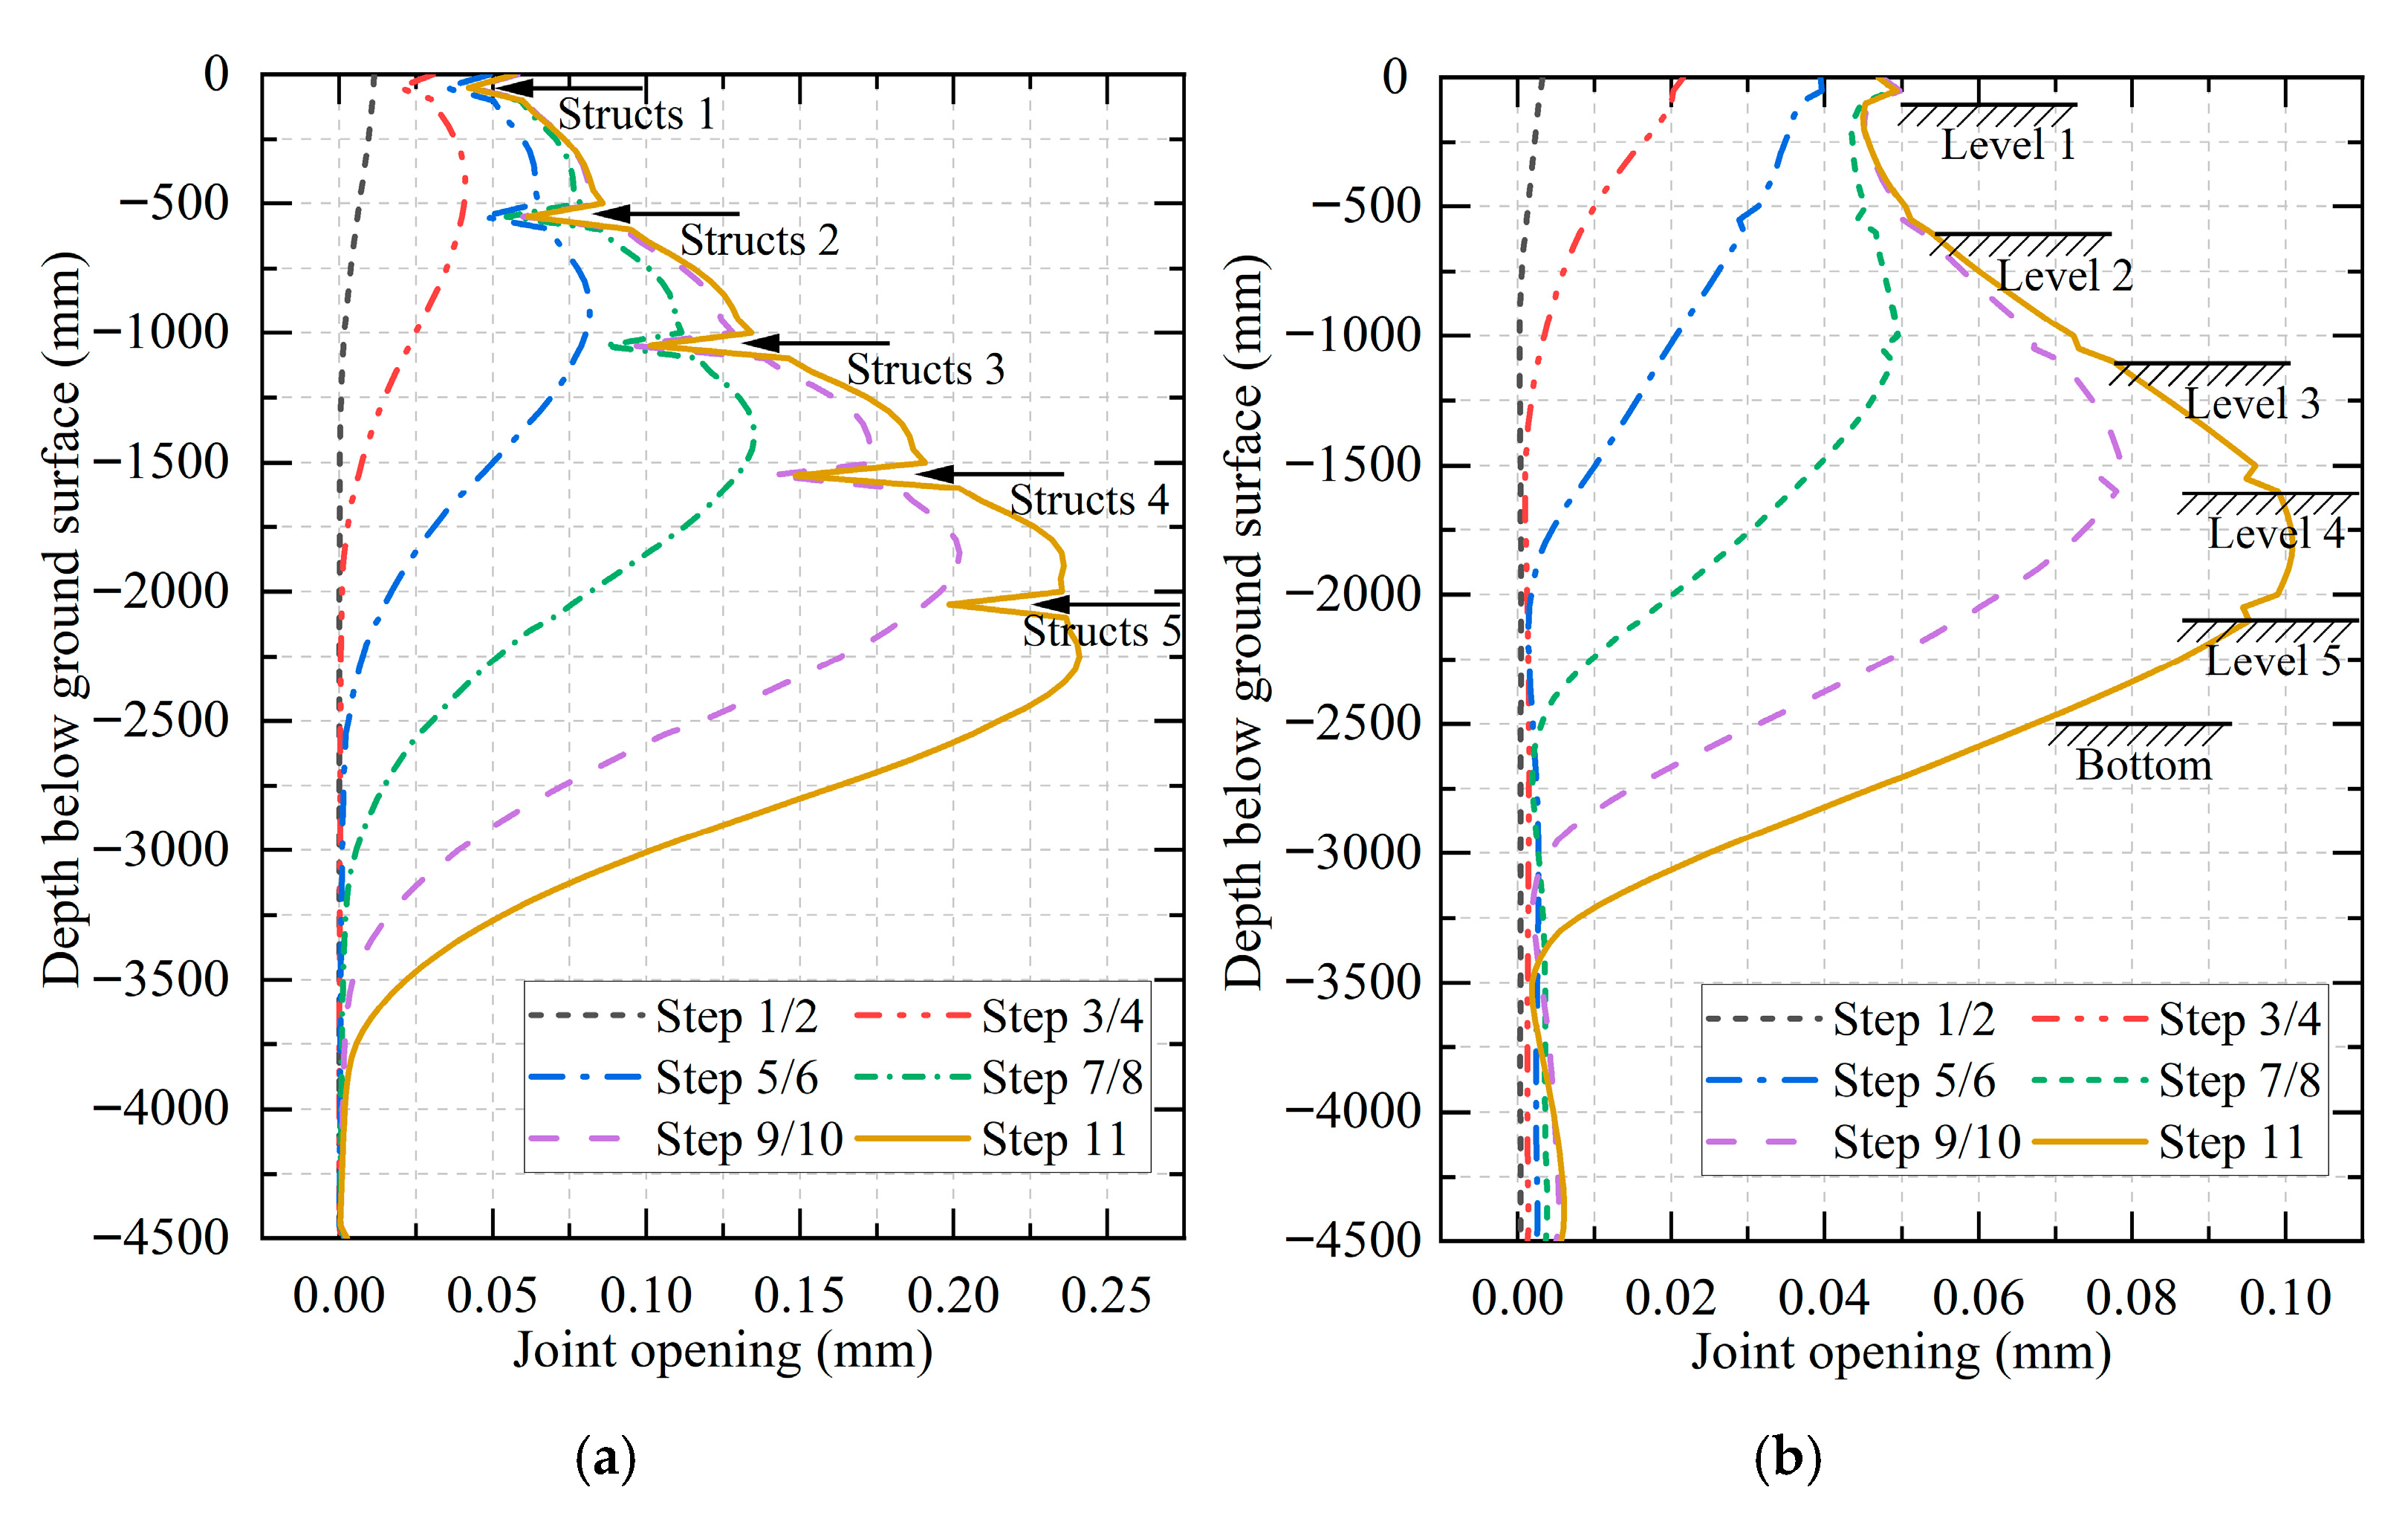
Figure 21a,b show the opening of joint 1 and joint 2 at each step, respectively. The opening exhibited by joint 1 (see Figure 21a) was markedly larger than that observed in joint 2 (see Figure 21b), which was also evident in Figure 20a. For both joints 1 and 2, the joint opening increased with the excavation step, and for joint 1, the maximum joint opening generally occurred near the excavation level. For joint 2, however, the maximum joint opening is observed at the top of the diaphragm wall from Step 1 to Step 6. Subsequently, the location at which the maximum joint opening occurred shifted deeper into the excavation yet remained significantly higher than the excavation level. It is noteworthy that, in consequence of the presence of the structs, there has been an unusual reduction in the opening of joint 1 at the struct elevations.
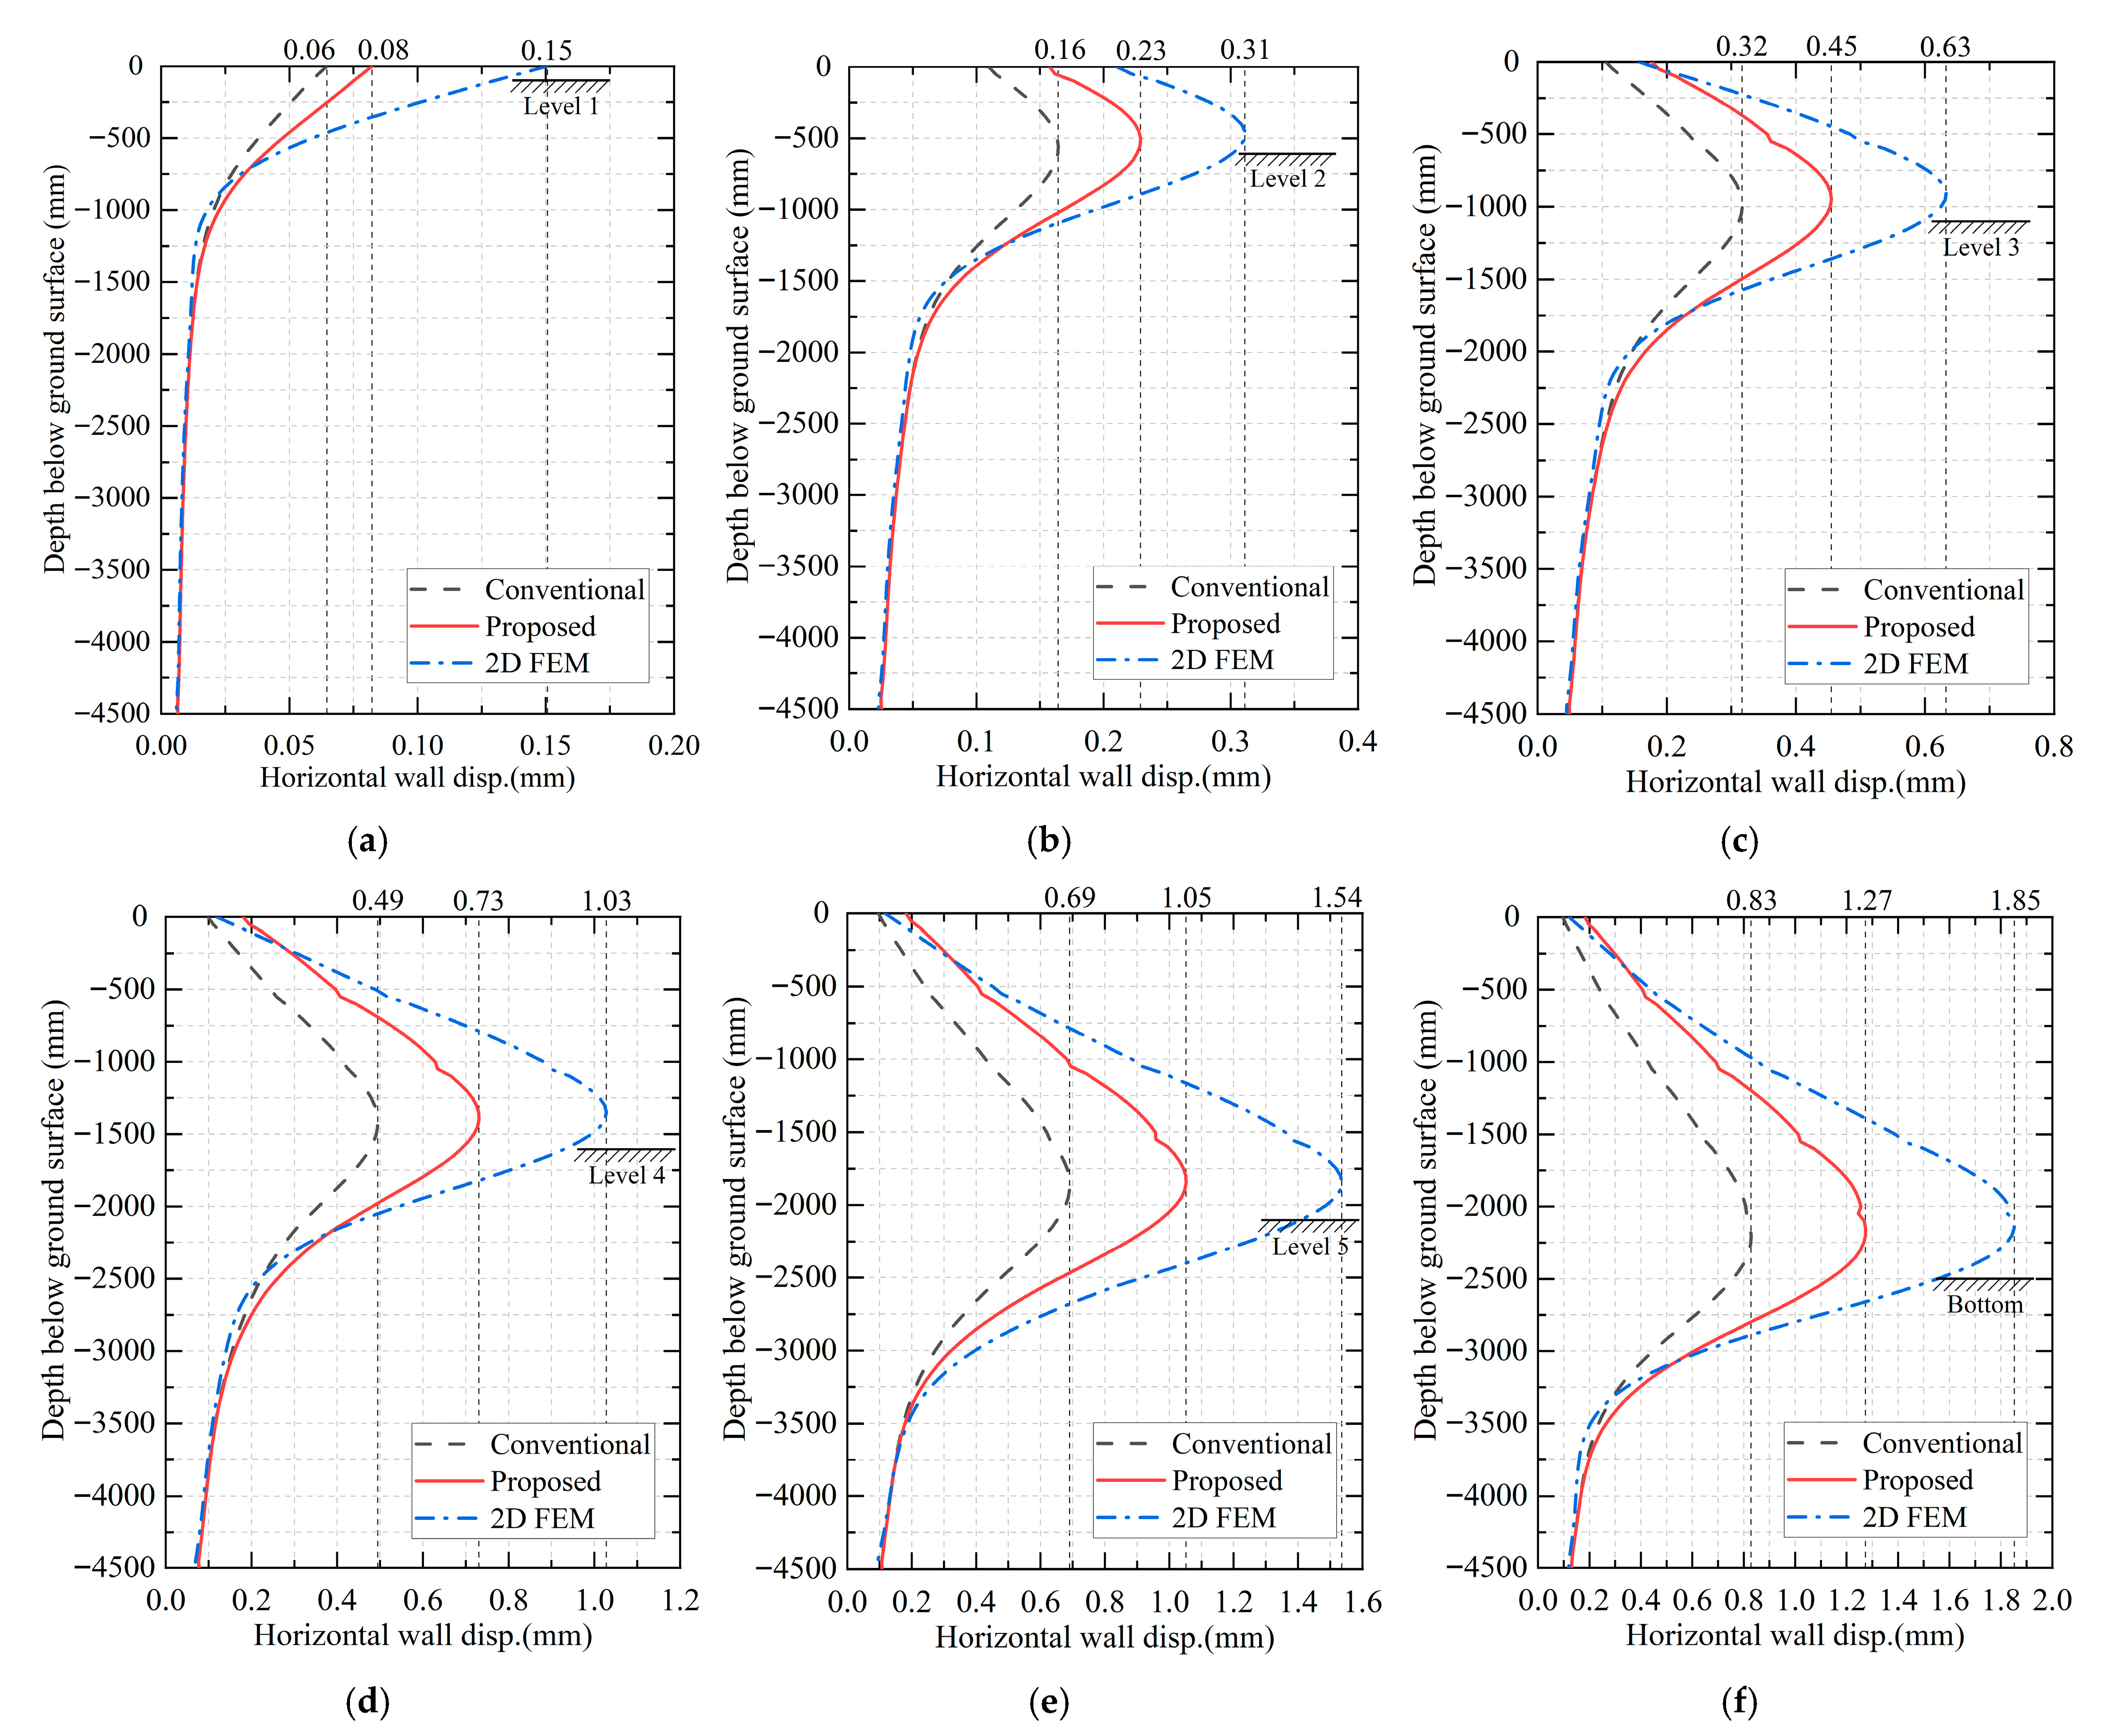
Figure 22 compares the calculated displacements that occurred at the midpoint of the excavation length obtained by the conventional 3D model, the 2D model, and the proposed 3D model for each excavation stage. As illustrated, a maximum inward bulging of the wall occurred at a depth proximate to the excavation level, which coincided with the deformation of the diaphragm wall in the actual working state. As described in Section 4.2, the displacements are scaled at a ratio of 1:10 in the case. Therefore, a maximum displacement of 1 mm in the case corresponds to 10 mm in the field. Moreover, it should be noted that the calculated displacements tend to fall between those of conventional 3D and 2D calculations at each excavation stage when employing the proposed model. This discrepancy can be attributed primarily to the fact that the 2D model disregards the spatial effect of excavation [53], while the conventional 3D model does not take into account the reduction in horizontal stiffness of the diaphragm wall resulting from the joints [26]. The proposed model has the capacity to incorporate the two factors, thereby enabling the provision of calculation results that are more aligned with the actual deformation of diaphragm walls.
With regard to the computation time and computational resource, when employing equivalent mesh density conditions and the same computer, which is equipped with 6 cores, 16 GB of RAM, and a 500 GB hard disk, the traditional 2D model (calculating one panel) and the 3D model require 0.20 h and 5.95 h, respectively, and the resulting files are 1.0 GB and 10.8 GB in size, respectively. In contrast, the 3D model that incorporates the proposed model to consider joints requires 9.07 h and 11.2 GB of storage space. The calculation time of the improved 3D model is only 1.52 times that of conventional 3D models, and the storage space occupied is very similar. It can be seen that the improved 3D model does not impose a significant additional burden on calculation time and computational resources. Furthermore, this improved 3D model has a significant advantage over refined modelling in terms of computation time, as Wang’s research results demonstrate that the time required to compute a refined model is, on average, 12.6 times that of a spring model [31].

4.4. Study Limitation

The above studies were conducted based on the reduced-scale model tests, of which a major challenge is how to take the size effects into account. The size effects of a reduced-scale model will affect its quantitative results so that the reduced-scale test can usually be used for qualitative results [54]. Consequently, the conclusions that will be presented in the following section are primarily qualitative in nature. In order to apply the quantitative results of this study, such as the bending and shear bearing capacity of joints, to full-scale engineering structures, it is necessary to consider the effects of factors such as the diaphragm wall thickness, the cross-steel plate dimensions, the number of holes, and the area of holes and then to validate the calculated results by comparison with field monitored results, for which further study is warranted.

5. Conclusions

This paper presents the results of an experimental investigation into the bending and shear behaviour of the cross-plate joints in diaphragm walls. Based on the test results, a multi-linear spring model was developed to simplify the mechanical behaviour of the joints: bending behaviour was modelled using a set of normal springs, while the shear behaviour was represented by a series of shear springs. The proposed model was subsequently applied in a devised case study. The general conclusions drawn from this study are as follows.
(1)
When the joint is subjected to a bending test, the load–displacement curve obtained can be categorised into four stages: ascending, transitional, descending, and residual. Each stage can be approximated by a linear trend. The joint opening showed an approximate linear growth pattern, with an increase in mid-span displacement. When the joint fails, the longitudinal plate is pulled out of the concrete on one side, the concrete below the longitudinal plate separates from the plate, and the concrete above the longitudinal plate cracks along a curved surface extending from the end of the longitudinal plate to the end of the transverse plate.
(2)
In the shear test, the load–displacement curve can be divided into three stages: gradual, ascending, and descending. With the exception of the gradual stage, which is non-linear due to deviations in specimen manufacture, the other two stages can also be approximated to be linear. When the joint breaks, the longitudinal plate exhibits substantial shear deformation. The concrete beneath the longitudinal plate cracks along a curved surface, extending to the longitudinal steel plate, and then, the cracking continues along the interface between the concrete and the longitudinal plate. The concrete above the longitudinal plate cracks, originating from the edge of the loading steel plate, extending to the transverse plate, and subsequently propagating along the interface between the concrete and the longitudinal plate.
(3)
In comparison to the conventional 3D and 2D models, the deformation of the diaphragm wall obtained by the proposed model can provide a superior representation of the joint opening phenomenon. For the joint located at the midpoint, the maximum joint opening generally occurred near the excavation level. For the joint near the corner, the maximum joint opening was observed at the top of the diaphragm wall during the initial stages. Subsequently, the location where the maximum joint opening occurred shifted deeper into the excavation yet remained significantly higher than the excavation level. Furthermore, it is evident that the midpoint joints exhibit a substantially greater degree of opening in comparison to the joints near the corners.
(4)
The 3D model, incorporating the multi-linear spring model, is capable of accounting for the spatial effect of the excavation and the reduction in horizontal stiffness of the diaphragm wall resulting from the joints simultaneously. The calculated displacements of the model fall between those of conventional 3D and 2D calculations and are more in line with the actual deformation of the diaphragm wall. Moreover, the calculation time of the proposed model is only 1.52 times that of the conventional 3D model.

Author Contributions

Conceptualisation, M.Y. and C.T.; methodology, M.Y. and C.T.; software, M.Y.; validation, R.W.; formal analysis, M.Y.; investigation, M.Y.; G.W. and S.T.; resources, G.W.; data curation, S.T.; writing—original draft preparation, M.Y.; writing—review and editing, R.W. and C.T.; project administration, M.Y. and G.W.; funding acquisition, M.Y. and G.W. All authors have read and agreed to the published version of the manuscript.

Funding

This research was funded by the Ningbo Commonweal Research Program, grant number 2023S131, Ningbo Natural Science Foundation, grant number 2024J094, and National Scientific Research Project Cultivation Project by Ningbo Polytechnic, grant number NZ22GJ007.

Data Availability Statement

The data used to support the findings of this study are available from the corresponding author upon request.

Acknowledgments

The authors appreciate the anonymous reviewers for their constructive comments and suggestions that significantly improved the quality of this manuscript.

Conflicts of Interest

Author Gaoke Wang was employed by the company Ningbo Urban Construction Design & Research Institute Co., Ltd. The remaining authors declare that the research was conducted in the absence of any commercial or financial relationships that could be construed as a potential conflict of interest.

References

  1. Gunn, M.J.; Clayton, C.R.I. Installation effects and their importance in the design of earth-retaining structures. Geotechnique 1992, 42, 137–141. [Google Scholar] [CrossRef]
  2. El-Razek, M.E.A. New method for construction of diaphragm walls. J. Constr. Eng. Manag. 1999, 125, 233–241. [Google Scholar] [CrossRef]
  3. Brown, A.J.; Bruggemann, D.A. Arminou Dam, Cyprus, and construction joints in diaphragm cut-off walls. Géotechnique 2002, 52, 3–13. [Google Scholar] [CrossRef]
  4. Comodromos, E.M.; Papadopoulou, M.C.; Konstantinidis, G.K. Effects from diaphragm wall installation to surrounding soil and adjacent buildings. Comput. Geotech. 2013, 53, 106–121. [Google Scholar] [CrossRef]
  5. Ewald, K.; Schneider, N. Avoid of damage to diaphragm wall joints through the use of appropriate quality assurance systems. Bautechnik 2015, 92, 631–637. [Google Scholar] [CrossRef]
  6. Wu, G.; Chen, W.; Bian, H.; Yuan, J. Structure optimisation of a diaphragm wall with special modelling methods in a large-scale circular ventilating shaft considering shield crossing. Tunn. Undergr. Space Technol. 2017, 65, 35–41. [Google Scholar] [CrossRef]
  7. Zheng, Y.; Chen, C.; Liu, T.; Shao, Y.; Zhang, Y. Leakage detection and long-term monitoring in diaphragm wall joints using fiber Bragg grating sensing technology. Tunn. Undergr. Space Technol. 2020, 98, 103331. [Google Scholar] [CrossRef]
  8. Shao, Y.; Chen, C.; Lu, Z.; Zheng, Y.; Zhang, Y. An intelligent leakage detection method for diaphragm wall joints based on fiber Bragg grating sensors and intelligent algorithms. Measurement 2022, 197, 111339. [Google Scholar] [CrossRef]
  9. JGJ 120-2012; Technical Specification for Retaining and Protection of Building Foundation Excavations. China Architecture Press: Beijing, China, 2012; pp. 24–25+163. (In Chinese)
  10. DG/TJ 508-61-2018; Technical Code for Excavation Engineering. Tongji University Press: Shanghai, China, 2018; pp. 59–61+248. (In Chinese)
  11. 11SG814; Specification for the Structure of Building Excavation. China Planning Press: Beijing, China, 2011; p. 41. (In Chinese)
  12. Chen, J.J.; Wang, J.H.; Qiao, P.; Hou, Y.M.; Gu, Q.Y. Shear bearing of cross-plate joints between diaphragm wall panels–I: Model tests and shear behaviour. Mag. Concr. Res. 2016, 68, 902–915. [Google Scholar] [CrossRef]
  13. Chen, J.J.; Hou, Y.M.; Wang, J.H.; Qiao, P. Shear bearing of cross-plate joints between diaphragm wall panels–II: Numerical analysis and prediction formula. Mag. Concr. Res. 2016, 68, 1025–1039. [Google Scholar] [CrossRef]
  14. Valente, I.; Cruz, P.J. Experimental analysis of perfobond shear connection between steel and lightweight concrete. J. Constr. Steel Res. 2004, 60, 465–479. [Google Scholar] [CrossRef]
  15. Vianna, J.D.C.; De Andrade, S.A.L.; Vellasco, P.D.S.; Costa-Neves, L.F. Experimental study of perfobond shear connectors in composite construction. J. Constr. Steel Res. 2013, 81, 62–75. [Google Scholar] [CrossRef]
  16. Zou, Y.; Peng, H.; Zhang, Z.; Jiang, J.; Guo, J. Effect of additional constraints of push-out test on the mechanical properties of perfobond shear connectors. Structures 2023, 47, 991–1004. [Google Scholar] [CrossRef]
  17. Zhao, C.; Wang, Y.; Zhu, S.; Deng, K.; Li, Z.; Yuan, X. Shear resistance of perfobond rib shear connectors under cyclic loading. J. Struct. Eng. 2024, 150, 4023218. [Google Scholar] [CrossRef]
  18. Yang, M.; Wu, R.; Tong, C.; Chen, J.; Tang, B. Displacement analyses of diaphragm wall in small-scale deep excavation considering joints between panels. Buildings 2024, 14, 1449. [Google Scholar] [CrossRef]
  19. Wang, Q.; Geng, P.; Guo, X.; Zeng, G.; Chen, C.; He, C. Experimental study on the tensile performance of circumferential joint in shield tunnel. Tunn. Undergr. Space Technol. 2021, 112, 103937. [Google Scholar] [CrossRef]
  20. Wu, Y.; Ding, W.; Li, S.; Qiao, Y. Effect of oblique bolt arrangement on flexural behavior of segmental joint for shield tunnel. Tunn. Undergr. Space Technol. 2023, 135, 105043. [Google Scholar] [CrossRef]
  21. Zhang, J.; Zhao, M. Experimental study on the mechanical properties of longitudinal joints of shield tunnels under large deformation conditions. Tunn. Undergr. Space Technol. 2024, 144, 105447. [Google Scholar] [CrossRef]
  22. Qiu, T.; Zhang, J.; Chen, X.; Xu, Z.; Su, D.; Song, R.; Cui, T. Experimental investigation and mechanical model for assembled joints of prefabricated two-wall-in-one diaphragm walls. Eng. Struct. 2023, 275, 115285. [Google Scholar] [CrossRef]
  23. Han, G.; Zhang, Y.; Zhang, J.; Zhang, H. Numerical analysis and optimization of displacement of enclosure structure based on midas finite element simulation software. Buildings 2025, 15, 1462. [Google Scholar] [CrossRef]
  24. Zhuang, Y.; Cui, X.; Hu, S. Numerical simulation and simplified analytical method to evaluate the displacement of adjacent tunnels caused by excavation. Tunn. Undergr. Space Technol. 2023, 132, 104879. [Google Scholar] [CrossRef]
  25. Bozkurt, S.; Abed, A.; Karstunen, M. Finite element analysis for a deep excavation in soft clay supported by lime-cement columns. Comput. Geotech. 2023, 162, 105687. [Google Scholar] [CrossRef]
  26. Zdravkovic, L.; Potts, D.M.; St John, H.D. Modelling of a 3D excavation in finite element analysis. Géotechnique 2005, 55, 497–513. [Google Scholar] [CrossRef]
  27. Dong, Y.P.; Burd, H.J.; Houlsby, G.T. Finite-element analysis of a deep excavation case history. Géotechnique 2016, 66, 1–15. [Google Scholar] [CrossRef]
  28. Dong, Y.; Burd, H.; Houlsby, G.; Hou, Y. Advanced finite element analysis of a complex deep excavation case history in Shanghai. Front. Struct. Civ. Eng. 2014, 8, 93–100. [Google Scholar] [CrossRef]
  29. Dong, Y.P.; Burd, H.J.; Houlsby, G.T. Finite element parametric study of the performance of a deep excavation. Soils Found. 2018, 58, 729–743. [Google Scholar] [CrossRef]
  30. Jin, X.F.; Zhang, Y.L.; Liang, S.T.; Zhu, X.J. Simplified calculation method for mechanical performance of type Ⅱ joint of diaphragm wall. J. Southeast Univ. 2015, 45, 929–934. (In Chinese) [Google Scholar]
  31. Wang, F.; Huang, H.; Soga, K.; Li, Z. 3D modelling of concrete tunnel segmental joints and the development of a new bolt-spring model. Tunn. Undergr. Space Technol. 2021, 110, 103835. [Google Scholar] [CrossRef]
  32. Sun, H.; Li, B.; Wang, Z.; Wang, S.; Wang, H.; Meng, X. Centrifugal model tests on characteristics of deep foundation pits in starting. Chin. J. Geotech. Eng. 2024, 46, 244–248. (In Chinese) [Google Scholar]
  33. Wang, Z.; Yu, H.; Zhang, Z.; Song, Y.; Liu, S. Shaking table test for near-valley underground station: Influence of diaphragm walls. Tunn. Undergr. Space Technol. 2024, 153, 106030. [Google Scholar] [CrossRef]
  34. Yu, H.; Wang, Z.; Zhang, Z.; Song, Y.; Liu, S. Shaking table test for subway station considering the influence of diaphragm walls. Earthq. Eng. Struct. Dyn. 2024, 53, 2710–2733. [Google Scholar] [CrossRef]
  35. Kumbasaroğlu, A.; Budak, A. An experimental study on impact of anchor bars at the steel frames with infilled walls. Chall. J. Struct. Mech. 2016, 2, 129–138. [Google Scholar]
  36. He, J.; Liu, Y.; Pei, B. Experimental study of the steel-concrete connection in hybrid cable-stayed bridges. J. Perform. Constr. Facil. 2014, 28, 559–570. [Google Scholar] [CrossRef]
  37. Mirghaderi, S.R.; Eghbali, N.B.; Ahmadi, M.M. Moment-connection between continuous steel beams and reinforced concrete column under cyclic loading. J. Constr. Steel Res. 2016, 118, 105–119. [Google Scholar] [CrossRef]
  38. GB/T 50152-2012; Standard for Test Method of Concrete Structures. China Architecture & Building Press: Beijing, China, 2012; p. 13. (In Chinese)
  39. GB 50497-2019; Technical Standard for Monitoring of Building Excavation Engineering. China Planning Press: Beijing, China, 2020; p. 35. (In Chinese)
  40. Cho, J.R.; Park, S.Y.; Cho, K.; Kim, S.T.; Kim, B.S. Pull-out test and discrete spring model of fibre-reinforced polymer perfobond rib shear connector. Can. J. Civ. Eng. 2012, 39, 1311–1320. [Google Scholar] [CrossRef]
  41. Zhang, J.; Hu, X.; Kou, L.; Zhang, B.; Jiang, Y.; Yu, H. Experimental study of the short-term and long-term behavior of perfobond connectors. J. Constr. Steel Res. 2018, 150, 462–474. [Google Scholar] [CrossRef]
  42. Deng, W.; Xiong, Y.; Liu, D.; Zhang, J. Static and fatigue behavior of shear connectors for a steel-concrete composite girder. J. Constr. Steel Res. 2019, 159, 134–146. [Google Scholar] [CrossRef]
  43. Jin, H.; Yu, S.; Zhou, S.; Xiao, J. Research on mechanics of longitudinal joint in shield tunnel by the nonlinear spring equivalent method. KSCE J. Civ. Eng. 2019, 23, 902–913. [Google Scholar] [CrossRef]
  44. Li, Z.; Soga, K.; Wang, F.; Wright, P.; Tsuno, K. Behaviour of cast-iron tunnel segmental joint from the 3D FE analyses and development of a new bolt-spring model. Tunn. Undergr. Space Technol. 2014, 41, 176–192. [Google Scholar] [CrossRef]
  45. Karam, M.S.; Nakamura, H.; Yamamoto, Y.; Miura, T. Numerical evaluation of the perfobond (PBL) shear connector with transverse rebar using coupled rigid Body spring model (RBSM) and solid finite element method (FEM). Structures 2022, 45, 1544–1560. [Google Scholar] [CrossRef]
  46. Hosseini, S.M.; Mashiri, F.; Mirza, O. Parametric study of innovative bolted shear connectors using 3D finite element modelling. J. Constr. Steel Res. 2021, 179, 106565. [Google Scholar] [CrossRef]
  47. Xue, X.; Hu, S.W.; Qi, H.; Shan, C.X. Study on the normal bonding performance of the steel-concrete interface. Eng. Mech. 2022, 39, 65–74. (In Chinese) [Google Scholar]
  48. GB 50010-2010; Code for Design of Concrete Structures. China Architecture Press: Beijing, China, 2015; pp. 19–20. (In Chinese)
  49. GB 50017-2017; Standard for Design of Steel Structures. China Architecture Press: Beijing, China, 2017; p. 28. (In Chinese)
  50. Guo, P.; Gong, X.; Wang, Y. Displacement and force analyses of braced structure of deep excavation considering unsymmetrical surcharge effect. Comput. Geotech. 2019, 113, 103102. [Google Scholar] [CrossRef]
  51. Tu, B.; Han, M.; Jia, J.; Xiao, Z.; Liu, L. Improved mobilized strength design method for multi-support excavation deformation analysis. Buildings 2024, 14, 3630. [Google Scholar] [CrossRef]
  52. Yang, D.; Ma, Y. Test for Building Structure; Wuhan University of Technology Press: Wuhan, China, 2013; p. 86. (In Chinese) [Google Scholar]
  53. Li, Z.; Han, M.; Liu, L.; Li, Y.; Yan, S. Corner and partition wall effects on the settlement of a historical building near a supported subway excavation in soft soil. Comput. Geotech. 2020, 128, 103805. [Google Scholar] [CrossRef]
  54. Wang, Y.; Liu, R.; Liang, C. Size effects of small-scale model tests on bearing capacity of strip foundation. Chin. J. Geotech. Eng. 2024, 46, 1289–1299. (In Chinese) [Google Scholar]
Figure 1. Diaphragm wall and cross-plate joint. (a) cross-section of diaphragm wall, (b) geometry of diaphragm wall, (c) geometry of cross-plate joint.
Buildings 15 02890 g001
Figure 2. Details of test specimens. (a) specimen 1 (S1), (b) specimen 2 (S2), (c) cross-plate joint.
Buildings 15 02890 g002
Figure 3. Material properties. (a) concrete, (b) steel bar 1 (S2), (c) steel bar 2, (d) steel plate.
Buildings 15 02890 g003
Figure 4. Test loading schemes. (a) bending test, (b) shear test.
Buildings 15 02890 g004
Figure 5. Test setup and instrumentation. (a) bending test, (b) shear test, (c) loading devise, (d) fixed devise.
Buildings 15 02890 g005aBuildings 15 02890 g005b
Figure 6. Load–displacement curve of the bending test.
Buildings 15 02890 g006
Figure 7. Joint opening of the bending test.
Buildings 15 02890 g007
Figure 8. Damage patterns of the joint in the bending test.
Buildings 15 02890 g008
Figure 9. Load–displacement curve of the shear test.
Buildings 15 02890 g009
Figure 10. Damage patterns of the joint in the shear test.
Buildings 15 02890 g010
Figure 11. Simplified joint model (the distortion is exaggerated). (a) bending mode, (b) shear mode.
Buildings 15 02890 g011
Figure 12. 3D finite element models. (a) bending test, (b) shear test, (c) spring position.
Buildings 15 02890 g012
Figure 13. Load–displacement relationship for multi-linear spring model. (a) normal spring, (b) shear spring.
Buildings 15 02890 g013
Figure 14. Comparison between the tested and calculated load–displacement curves. (a) bending test, (b) shear test.
Buildings 15 02890 g014
Figure 15. Comparison between the tested and calculated joint openings of the bending test.
Buildings 15 02890 g015
Figure 16. Geometry of the excavation model. (a) planar layout, (b) cross-sectional layout.
Buildings 15 02890 g016
Figure 17. Numerical model of the case.
Buildings 15 02890 g017
Figure 18. Schematic diagram of the Winkler’s model.
Buildings 15 02890 g018
Figure 19. Active earth pressure and stiffness of the soil springs at each step. (a) step 1 and step 2, (b) step 3 and step 4, (c) step 5 and step 6, (d) step 7 and step 8, (e) step 9 and step 10, (f) step 11.
Buildings 15 02890 g019aBuildings 15 02890 g019b
Figure 20. Contours of wall deformation at the excavation bottom of step 11 by (a) the proposed model considering joints and (b) the conventional model disregarding joints.
Buildings 15 02890 g020
Figure 21. Joint opening obtained by the proposed method at each step. (a) joint 1, (b) joint 2.
Buildings 15 02890 g021
Figure 22. Horizontal wall displacements at each step. (a) step 1 and step 2, (b) step 3 and step 4, (c) step 5 and step 6, (d) step 7 and step 8, (e) step 9 and step 10, (f) step 11.
Buildings 15 02890 g022
Table 1. Steps of excavation in numerical analysis.
StepDescription
1Excavate to the level 1 at −100 mm.
2Install struts 1 at −50 mm.
3Excavate to the level 2 at −600 mm.
4Install struts 2 at −550 mm.
5Excavate to the level 3 at −1100 mm.
6Install struts 3 at −1050 mm.
7Excavate to the level 4 at −1600 mm.
8Install struts 4 at −1550 mm.
9Excavate to the level 5 at −2100 mm.
10Install struts 5 at −2050 mm.
11Excavate to the level 6 at −2500 mm.
Table 2. Similarity constants and similarity relationships.
TypePhysical QuantitySimilarity Relationship [52]
Material
Properties
Stress σSσ = SE
Strain ε1.0
Elasticity modulus ESE
Poisson’s ratio υ1.0
Geometric PropertiesLength LSL
Displacement xSx = SL
Rotation θ1.0
Area ASA = SL2
LoadPoint load PSP = SESL2
Line load ωSω = SESL2
Surface load qSq = SE
Disclaimer/Publisher’s Note: The statements, opinions and data contained in all publications are solely those of the individual author(s) and contributor(s) and not of MDPI and/or the editor(s). MDPI and/or the editor(s) disclaim responsibility for any injury to people or property resulting from any ideas, methods, instructions or products referred to in the content.