Article

Subjective Perception and Cooling Effect for Dynamic Ventilation with Fluctuating Air Velocity

1
Qingdao Haier Air Conditioner Co., Ltd., Qingdao 266100, China
2
National Engineering Research Center of Digital Home Networking, Qingdao 266100, China
3
School of Human Settlements and Civil Engineering, Xi’an Jiaotong University, Xi’an 710049, China
*
Author to whom correspondence should be addressed.
Buildings 2025, 15(16), 2871; https://doi.org/10.3390/buildings15162871 (registering DOI)
Submission received: 25 June 2025 / Revised: 5 August 2025 / Accepted: 10 August 2025 / Published: 14 August 2025
(This article belongs to the Special Issue Development of Indoor Environment Comfort)

Abstract

Dynamic ventilation has proven effective in enhancing indoor thermal comfort. However, previous studies often expose participants to inconsistent thermal environments, potentially compromising the accuracy of subjective evaluations. To address this limitation, this study implemented dynamic ventilation with fluctuating air velocity in an accurately controlled environmental chamber. Objective measurements of indoor air velocity and air temperature distribution are conducted, and subjective thermal sensation votes are collected under thermally consistent environments among participants. During the experiment, all participants experience similar dynamic thermal environments. The results show that participants experience thermal comfort under dynamic ventilation. Dynamic ventilation enhances convective heat transfer between the human body and the surrounding air and stimulates cutaneous cold receptors. The pronounced cooling effect of dynamic airflow contributes to a reduction in skin temperature on the head, chest, upper arm, forearm, hand, and thigh, with a temperature drop ranging from 1.3% to 2.8%. In addition, dynamic ventilation significantly reduces draft risk, with the proportion of participants reporting a dissatisfied sensation decreasing from 10% to 0%. This study demonstrates the advantages of dynamic ventilation in improving thermal comfort and minimizing draft risk under controlled and uniform environmental conditions for all participants.

1. Introduction

Thermal comfort is essential for the health and well-being of occupants. Although steady thermal environments are widely implemented, they often fall short in meeting the evolving needs of occupants. Studies have shown that a steady thermal environment is not always the optimal solution [1], and it may contribute to sick building syndrome and other potential health risks. Dynamic ventilation creates a non-steady-state thermal environment by introducing variations in air velocity, such as pulsating airflow [2] or simulated natural wind [3]. These airflow fluctuations stimulate the skin’s cutaneous cold receptors [4], triggering physiological responses that create a cooling sensation. The cooling effect of dynamic airflow enhances thermal sensation and overall comfort [5,6], while also extending the upper threshold of acceptable thermal comfort temperatures [7]. Dynamic ventilation helps to mitigate the discomfort of draft risk caused by direct airflow under high-temperature conditions. For example, dynamic ventilation with pulsating air velocity has been shown to reduce the percentage of dissatisfaction from 34% to just 8% [8]. Beyond improving comfort, dynamic ventilation also offers energy-saving benefits. Periodic and stepwise variations in the thermal environment have been reported to lower fan energy consumption by 31–68% and reduce cooling loads by up to 13% [7,9].
To better understand the mechanisms behind dynamic ventilation and its impact on thermal comfort, researchers have investigated the characteristics of indoor airflow fields, with particular attention to their cooling effects. Two key parameters commonly used to describe dynamic airflow are the logarithmic power spectrum slope [10] and turbulence intensity [11,12]. The β value, which represents the negative slope of the airflow’s power spectrum curve, quantifies the variability of velocity fluctuations. Studies have shown that mechanical wind typically exhibits lower β values than natural wind, generally falling within the range of 1.2 to 1.6. With the development of the airflow, the air velocity tends to decrease, while the β value of mechanical wind increases. Some studies suggest that the β value can serve as a useful metric for characterizing dynamic airflow and optimizing ventilation strategies for thermal comfort [13]. Turbulence intensity, another crucial indicator, describes the ratio of the standard deviation of the velocity fluctuations to the mean airflow velocity [14]. Higher turbulence intensity is associated with stronger convective cooling effects and improved thermal sensation [12]. For instance, quantitative analysis indicates that at an airflow velocity of 1.0 m/s, a 15% increase in turbulence intensity can enhance the convective heat transfer coefficient by approximately 3 W/(m2 K) [5]. Under sedentary conditions in an indoor environment with temperatures ranging from 26.0 °C to 32.0 °C, dynamic airflow can increase the overall convective heat transfer coefficient by approximately 10 W/(m2·K), reduce the average skin temperature by around 0.5 °C, and lower thermal sensation votes by one scale [5]. Complementary findings from Du et al. [15] indicate that the fluctuations in convective heat loss under dynamic airflow can range from 10 W/m2 to 50 W/m2, further highlighting its physiological cooling potential.
Airflow characteristics and physiological responses form the basis for understanding the cooling mechanisms of dynamic ventilation, while the evaluation of occupants’ thermal comfort under dynamic ventilation relies primarily on subjective experiments [16]. For instance, Tian et al. [8] reported that more than 87% of participants experienced thermal comfort under pulsating air supply based on the subjective questionnaire results. Zhou et al. [17] demonstrated that pulsating airflow can effectively reduce overall and local thermal sensation by as much as 0.21 and 0.28 scale units, respectively. However, many existing studies lack environmental consistency. For instance, participants seated at different distances from the supply air vents may experience varying airflow velocities and temperature fluctuations, leading to inconsistencies in the thermal environment. These spatial inconsistencies may have influenced participants’ thermal perceptions and subjective evaluations, thereby reducing the comparability and representativeness of the experimental results.
To address this limitation, the study aims to investigate the effects of dynamic ventilation with fluctuating air velocity on thermal comfort in a controllable environmental chamber. The objective is to determine whether dynamic airflow can enhance thermal comfort and reduce draft risk compared to steady ventilation. To achieve this goal, both subjective evaluations and objective measurements are conducted, ensuring that all participants experience a consistent and repeatable thermal environment. Our subjective evaluations effectively eliminate the confounding effects of environmental variability on thermal comfort assessments, thereby enhancing the accuracy of experimental data and the consistency of subjective responses. In order to gain a deeper understanding of the spatial characteristics and attenuation behavior of airflow under dynamic ventilation and steady ventilation, the distribution of air velocity and air temperature is measured and analyzed. These results are presented in Section 3.1, providing a foundation for understanding how airflow propagates from the supply vent to the occupied zone and how its amplitude diminishes with distance. Section 3.2 summarizes the overall and local thermal sensation votes reported by participants. To validate these subjective findings, the analysis also incorporates skin temperature measurements, allowing for a quantitative assessment of the enhanced cooling sensation induced by dynamic airflow. Finally, participants’ satisfaction with air movement is compared under dynamic ventilation and steady ventilation. The results demonstrate that dynamic airflow can effectively reduce draft risk while improving overall acceptance of air movement. The main contributions of this study are summarized as follows.
(i)
A controlled and consistent experimental environment is established for all participants, within which both subjective evaluations and objective measurements are conducted under dynamic ventilation and steady ventilation;
(ii)
A comprehensive comparative analysis is performed between subjective questionnaire responses and physiological indicators, thereby validating the reliability and accuracy of subjective thermal comfort assessments;
(iii)
The implementation of dynamic ventilation demonstrates a significant improvement in participants’ thermal comfort satisfaction and a notable reduction in draft risk.

2. Methodology

2.1. Measurement Site

The subjective and objective experiments on dynamic ventilation are conducted in the environmental chamber located at the Innovation Harbor Campus of Xi’an Jiaotong University. The chamber measures 6.80 m in length, 4.60 m in width, and 2.85 m in height, providing a controlled environment for determining whether dynamic airflow can enhance thermal comfort and reduce draft risk compared to steady ventilation. The dynamic ventilation system implemented in this study is developed based on the patented method (ZL202210158090.1). By adjusting the supply voltage applied to the fans to precisely regulate the rotational speeds, thereby enabling dynamic variation in the supply air velocity. The dynamic ventilation system is controlled by a Siemens Programmable Logic Controller (PLC), which provides a high degree of programmability and operational stability. A user-friendly graphical user interface is provided, allowing users to specify parameters including the range, frequency, and mode of variation for supply velocity and temperature. Supported variation modes include sinusoidal, step-wise, or user-defined functions. Once the parameters are configured, the PLC executes real-time control of fan operation based on predefined logic, generating airflow fluctuations that replicate real-world ventilation dynamics. For the experiments, the environmental chamber is arranged in a classroom setting, with a row of seated participants remaining still. Each participant is exposed to identical thermal conditions to ensure consistency in the experimental data. The layout of instrumentation within the chamber is shown in Figure 1.
The technical specifications of the instruments used in the experiment are detailed in Table 1. To monitor the thermal environment, the WWFWZY-1 wireless universal wind speed and temperature recorder is employed, capable of measuring air temperature from −20 °C to 80 °C and wind speed from 0.05 m/s to 30 m/s, with an accuracy of ±0.5 °C and ±0.05 m/s, respectively. In addition, the WWSZY-1 wind temperature and humidity recorder is used to continuously monitor air temperature (−40 °C to 100 °C, accuracy ±0.3 °C) and relative humidity (0–100%, accuracy ±3% RH). The WHQZY-1 global temperature recorder is used to measure radiant temperature, with a range of −20 °C to 80 °C and an accuracy of ±0.3 °C. More details about the recorders can be found at https://www.ybzhan.cn/st25259/product_722351.html (accessed on 1 August 2025). To capture physiological responses, DS1922L-F5# iButton sensors are attached to the participants’ skin to record skin temperature, operating within a range of −40 °C to 85 °C with an accuracy of ±0.5 °C. These instruments ensure accurate and reliable data collection of both environmental and physiological thermal parameters during the experiment.
Seven measurement lines, labeled M1 through M7, are strategically arranged within the chamber. Measurement lines M1 and M2 are positioned in front of the supply vents and return vents. Each of these lines is equipped with the WWFWZY-1 wireless universal wind speed and temperature recorder positioned at the supply vents at a height of 1.3 m, and the WWSZY-1 wind temperature and humidity recorder placed at the return vent at a height of 0.2 m. M1 and M2 are used to monitor the air temperature and air velocity at the supply vents, as well as the air temperature and relative humidity at the return vents. Measurement lines M3 and M4 are placed along the front edge of the desks. The WWFWZY-1 wireless universal wind speed and temperature recorders are installed at heights of 0.1 m (near the ankles). Lines M5 and M6 are arranged at the center of the desks, with WWFWZY-1 wireless universal wind speed and temperature recorders placed at a height of 1.1 m (representing the breathing zone). Measurement line M7 is positioned at the center of the chamber, where the WHQZY-1 global temperature recorder is installed at a height of 1.1 m to measure radiant temperature. The recording interval for all the aforementioned instruments is set to 5 s. The DS1922L-F5# iButton sensors used for recording skin temperature are attached directly to the participants’ skin using medical adhesive tape. Considering both cost efficiency and accuracy, the recording interval for the DS1922L-F5# iButton sensors is set to 10 s in this study.
To better understand the spatial distribution of airflow, the attenuation of air velocity and temperature from the supply vent to the occupied zone is analyzed. As the supply air travels through the room, it mixes with the surrounding air, leading to momentum loss and thermal dissipation, which in turn reduce both the air velocity and temperature. Quantifying this attenuation is crucial for evaluating the effectiveness of dynamic ventilation in delivering air and maintaining thermal comfort within the occupied zone. Equations (1) and (2) describe the attenuation of air velocity and temperature from the supply vent to the occupied zone.
A R v = v s v o v s × 100 %
A R T = T o T s T s × 100 %
where ARv and ART are the attenuation rate for air velocity and air temperature; vo and vs denote the air velocity at the occupied zone and the supply vent (m/s); To and Ts denote the air temperature at the occupied zone and the supply vent (°C).

2.2. Subjective Questionnaire

A priori power analysis is conducted using G*Power 3.1.9.7 software [18,19] to estimate the minimum required sample size prior to the experiment. For the statistical test, the effect size (f), error probability (α), and statistical power (1–β) are set at 0.4, 0.05, and 0.95, respectively. The calculation indicates that a minimum of eight participants is sufficient. To enhance the accuracy and robustness of the results, ten participants (five female and five male) are recruited for the subjective survey. All participants are graduate students from Xi’an Jiaotong University who have lived in Xi’an city for over one year. All participants are in good health and have no harmful habits. Each participant is exposed to steady ventilation and dynamic ventilation and completes the questionnaire for both conditions. The basic information of the participants is presented in Table 2.
To ensure the reliability of the questionnaire data, the entire experimental procedure and relevant precautions are thoroughly explained to all participants prior to the study. The content of the questionnaire is clearly interpreted, and a pre-experiment session is conducted to familiarize participants with the process and ensure the smooth execution of the main experiment. To minimize response bias, participants are informed before the experiment that their responses would be used solely for research purposes and that they should answer truthfully based on their actual experience. In addition, we cross-check subjective responses with physiological measurements (e.g., skin temperature) to ensure consistency. If a participant’s responses are found to be inconsistent or invalid, the data are excluded from analysis. Participants are instructed in advance to maintain adequate sleep and a balanced diet on the day before each experimental session. They are also advised to avoid taking any medications within 24 h prior to the experiment and to ensure they are in good physical condition [20]. Additionally, they are required to abstain from caffeine, alcohol, and strenuous physical activity for at least 12 h before testing. Participants are required to wear typical indoor summer clothing during the experiment, including a short-sleeved T-shirt or light blouse and lightweight long trousers, along with short socks and athletic shoes.
As shown in previous studies on dynamic ventilation strategies [8,13,17], experimental durations ranging from 70 to 110 min are commonly used to capture reliable subjective responses. In this study, a total experimental duration of two hours is adopted, which is adequate for a comprehensive assessment of participants’ thermal perception over time. The experiment consisted of two phases: the first 30 min served as an acclimatization period, intended to eliminate the influence of thermal history on subjective responses [21]. The remaining 90 min comprised the formal experimental phase, during which subjective and physiological data are continuously collected. Participants are instructed to arrive at the environmental chamber 15 min prior to the experiment. During this time, they are briefed on the experimental guidelines, equipped with iButton skin temperature sensors, and asked to complete a personal information questionnaire (Questionnaire A1: Basic Information of Participants in Appendix A). The detailed procedure of the subjective experiment is illustrated in Figure 2.
The iButton devices automatically log skin temperature data at 10 s intervals and store the skin temperature in a data logger. Participants are encouraged to engage in calm activities such as reading or office work to minimize the influence of emotional arousal. Every 10 min, participants are required to complete a thermal environment evaluation questionnaire (Questionnaire A2: Thermal Comfort Evaluation Questionnaire in Appendix A), resulting in a total of one personal information questionnaire and twelve thermal sensation surveys. At the end of the experiment, a total of 240 subjective thermal environment questionnaires are collected. All participants receive compensation upon completing their participation in the study. The subjective questionnaire administered during the experiment primarily focused on thermal environment-related evaluations. These evaluations included overall thermal sensation votes, local body thermal sensation votes (covering the head, chest, upper arm, forearm, hand, thigh, calf, foot, and back), and satisfaction with air velocity. The thermal sensation and local body thermal sensation are assessed using the ASHRAE 7-point scale according to ANSI/ASHRAE Standard 55-2023 [22], where 0 indicates a neutral feeling, values below 0 indicate a sensation of cold, and values above 0 indicate a sensation of warmth. Air velocity satisfaction is measured using a Likert 7-point scale, with a score of 4 indicating acceptability. Scores below 4 reflect dissatisfaction, while scores above 4 indicate satisfaction.

2.3. Physiological Parameters

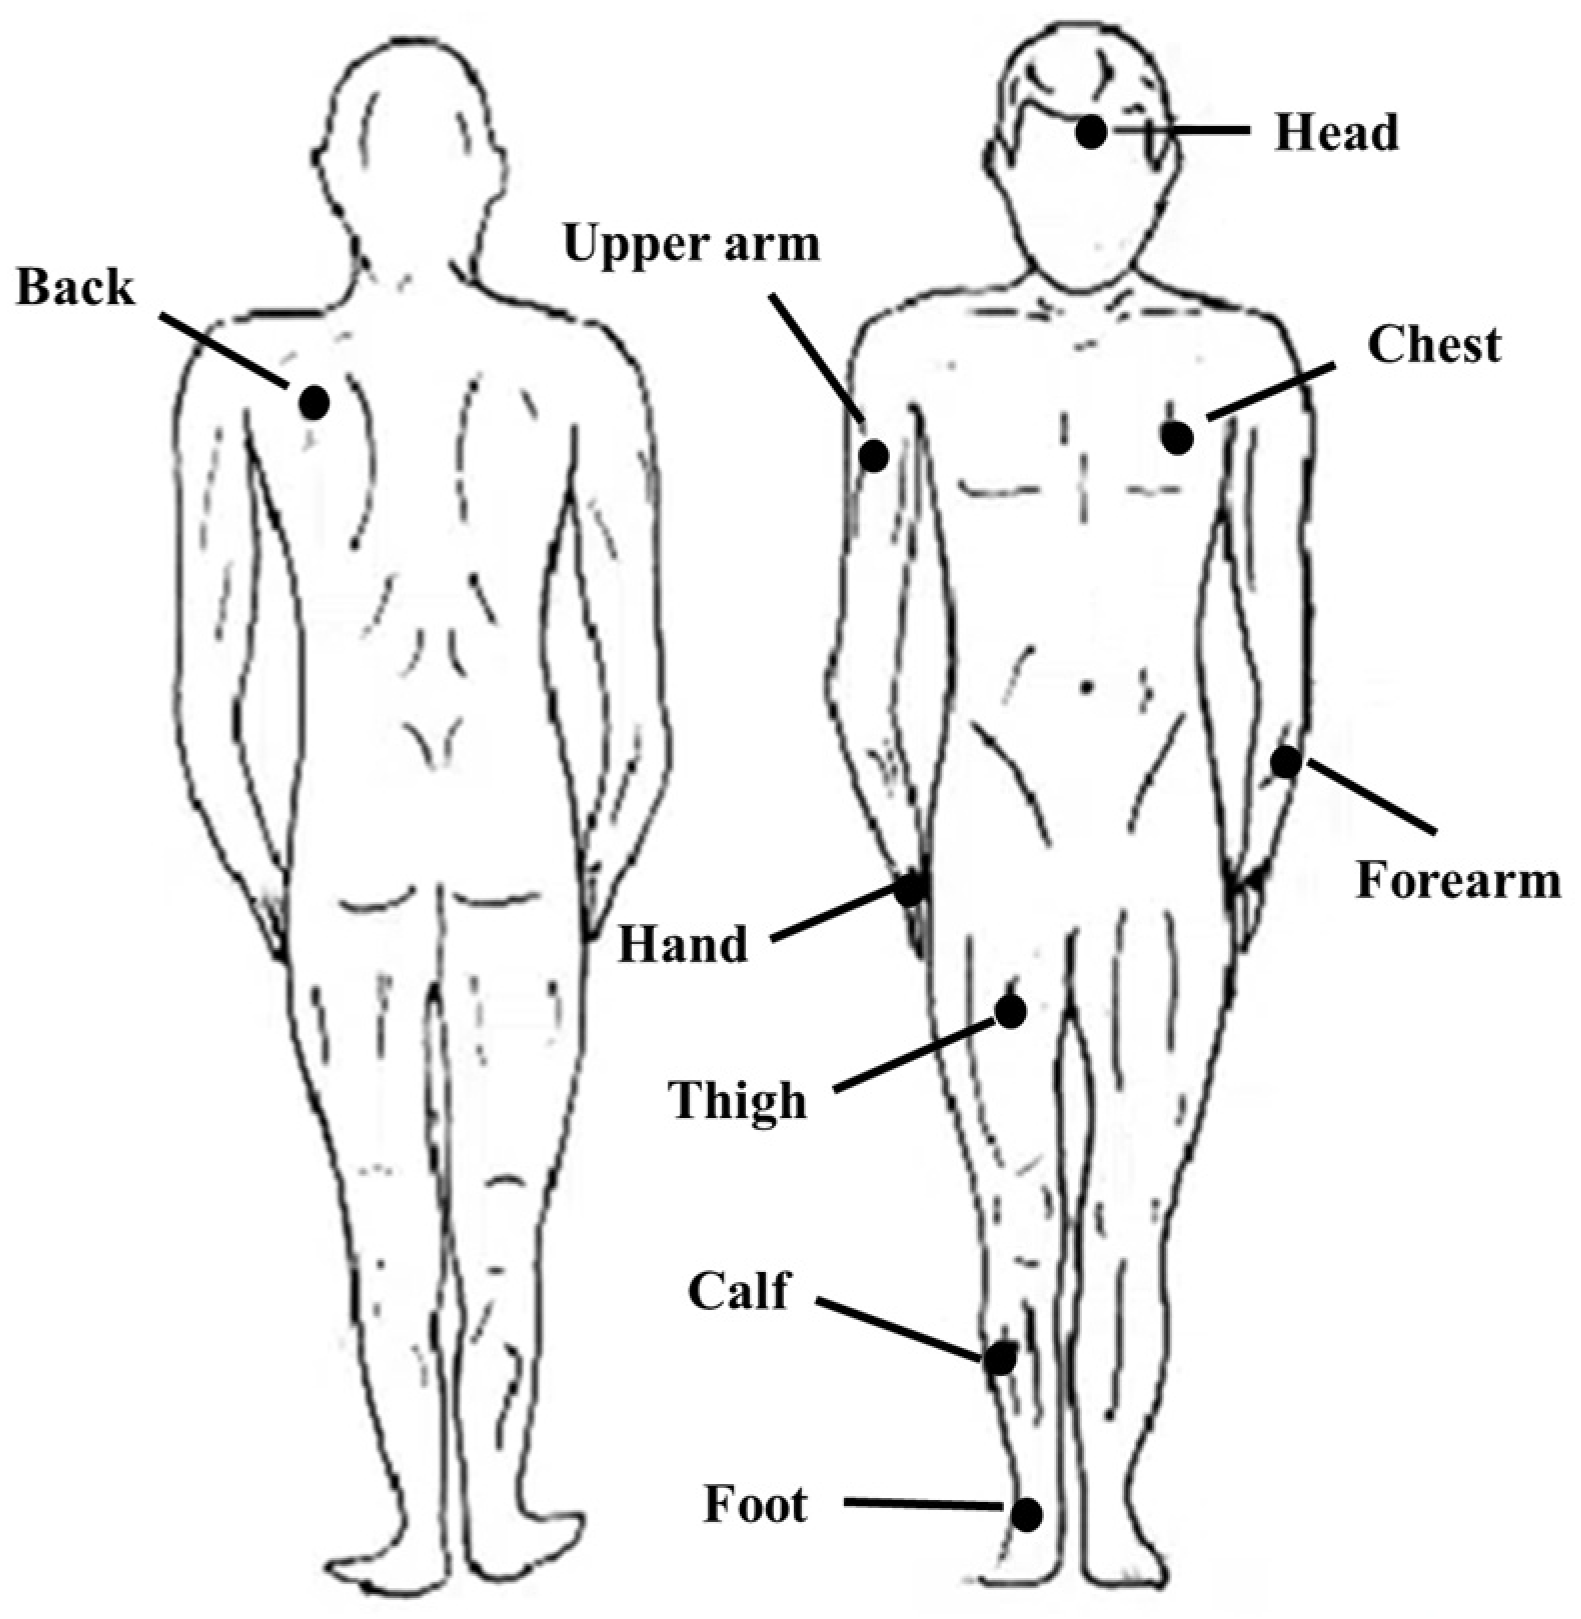
The purpose of skin temperature measurement in this study is to obtain both the local and overall mean skin temperatures of the participants during the adaptation phase and the experimental process, in order to support the reliability of the subjective questionnaire results. Considering the physiological characteristics of different body regions and the variation in skin temperature caused by thermoregulatory mechanisms, such as differences in blood perfusion, metabolic activity, and proximity to the body core [23], this study adopts a 9-point mean skin temperature calculation method [24]. The iButton sensors are placed at the following body locations: forehead, left chest, right upper arm, left forearm, right hand, front thigh, front calf, right foot, and left upper back. The arrangement of these measurement points is illustrated in Figure 3. The overall skin temperature for each participant is calculated using Equation (3) [25]. According to the weighting factors summarized by Liu et al. [26], the proportional contributions of each site in the 9-point mean skin temperature calculation method are as follows: 0.07, 0.18, 0.07, 0.07, 0.05, 0.19, 0.13, 0.06, and 0.18, respectively.
T sk = 0.07 t 1 + 0.18 t 2 + 0.07 t 3 + 0.07 t 4 + 0.05 t 5 + 0.19 t 6 + 0.13 t 7 + 0.06 t 8 + 0.18 t 9
where Tsk represents the overall skin temperature (°C); t1 to t9 represent the local skin temperatures of the forehead, left chest, right upper arm, left forearm, right hand, front thigh, front calf, right foot, and left upper back (°C).

3. Results

3.1. Spatial Transmission Characteristics of Airflow

This section examines how airflow parameters are spatially propagated from the supply vent to the occupied zone under both dynamic and steady ventilation conditions. Figure 4a illustrates the air velocity variation at the supply vent under dynamic ventilation and steady ventilation modes, which serve as the initial conditions for spatial transmission toward the occupied zone. In dynamic ventilation mode, the air velocity exhibits a distinct periodic fluctuation, ranging approximately from 1.6 m/s to 2.2 m/s, with a clear pulsating pattern and a cycle of about 180 s. This choice is based on Wigö’s findings [27], which indicate that a thermal plume requires roughly 45 s to be disrupted by an air jet and another 45 s to recover after the jet ceases, resulting in a disruption–recovery cycle of 90 s [13]. In this study, two consecutive disruption–recovery periods (90 s × 2) are applied to ensure a stable oscillatory airflow pattern, yielding a full cycle of 180 s. In contrast, the steady ventilation mode maintains a nearly constant air velocity, set equal to the peak value of the dynamic mode. The airflow remains stable at approximately 2.3 m/s. Figure 4a clearly highlights the differences in airflow characteristics between the two ventilation strategies.
Figure 4b presents box plots of air supply temperature under both dynamic ventilation and steady ventilation modes. As shown, the air temperatures remain within relatively stable ranges under both modes. The dynamic ventilation mode shows an average temperature of 24.8 °C with a standard deviation of 0.3 °C. For dynamic ventilation, the minimum observed temperature is 24.1 °C, with the first quartile (Q1) at 24.6 °C, the median at 24.8 °C, the third quartile (Q3) at 25.0 °C, and the maximum at 25.6 °C. The average temperature is 24.9 °C with a standard deviation of 0.2 °C under steady ventilation. The minimum observed temperature is 24.5 °C, with the first quartile (Q1) at 24.7 °C, the median at 25.0 °C, the third quartile (Q3) at 25.1 °C, and the maximum at 25.2 °C for steady ventilation. The average temperature is 24.9 °C. In both cases, the actual supply air temperatures closely align with the target setpoint of 25 °C, demonstrating a high level of temperature stability.
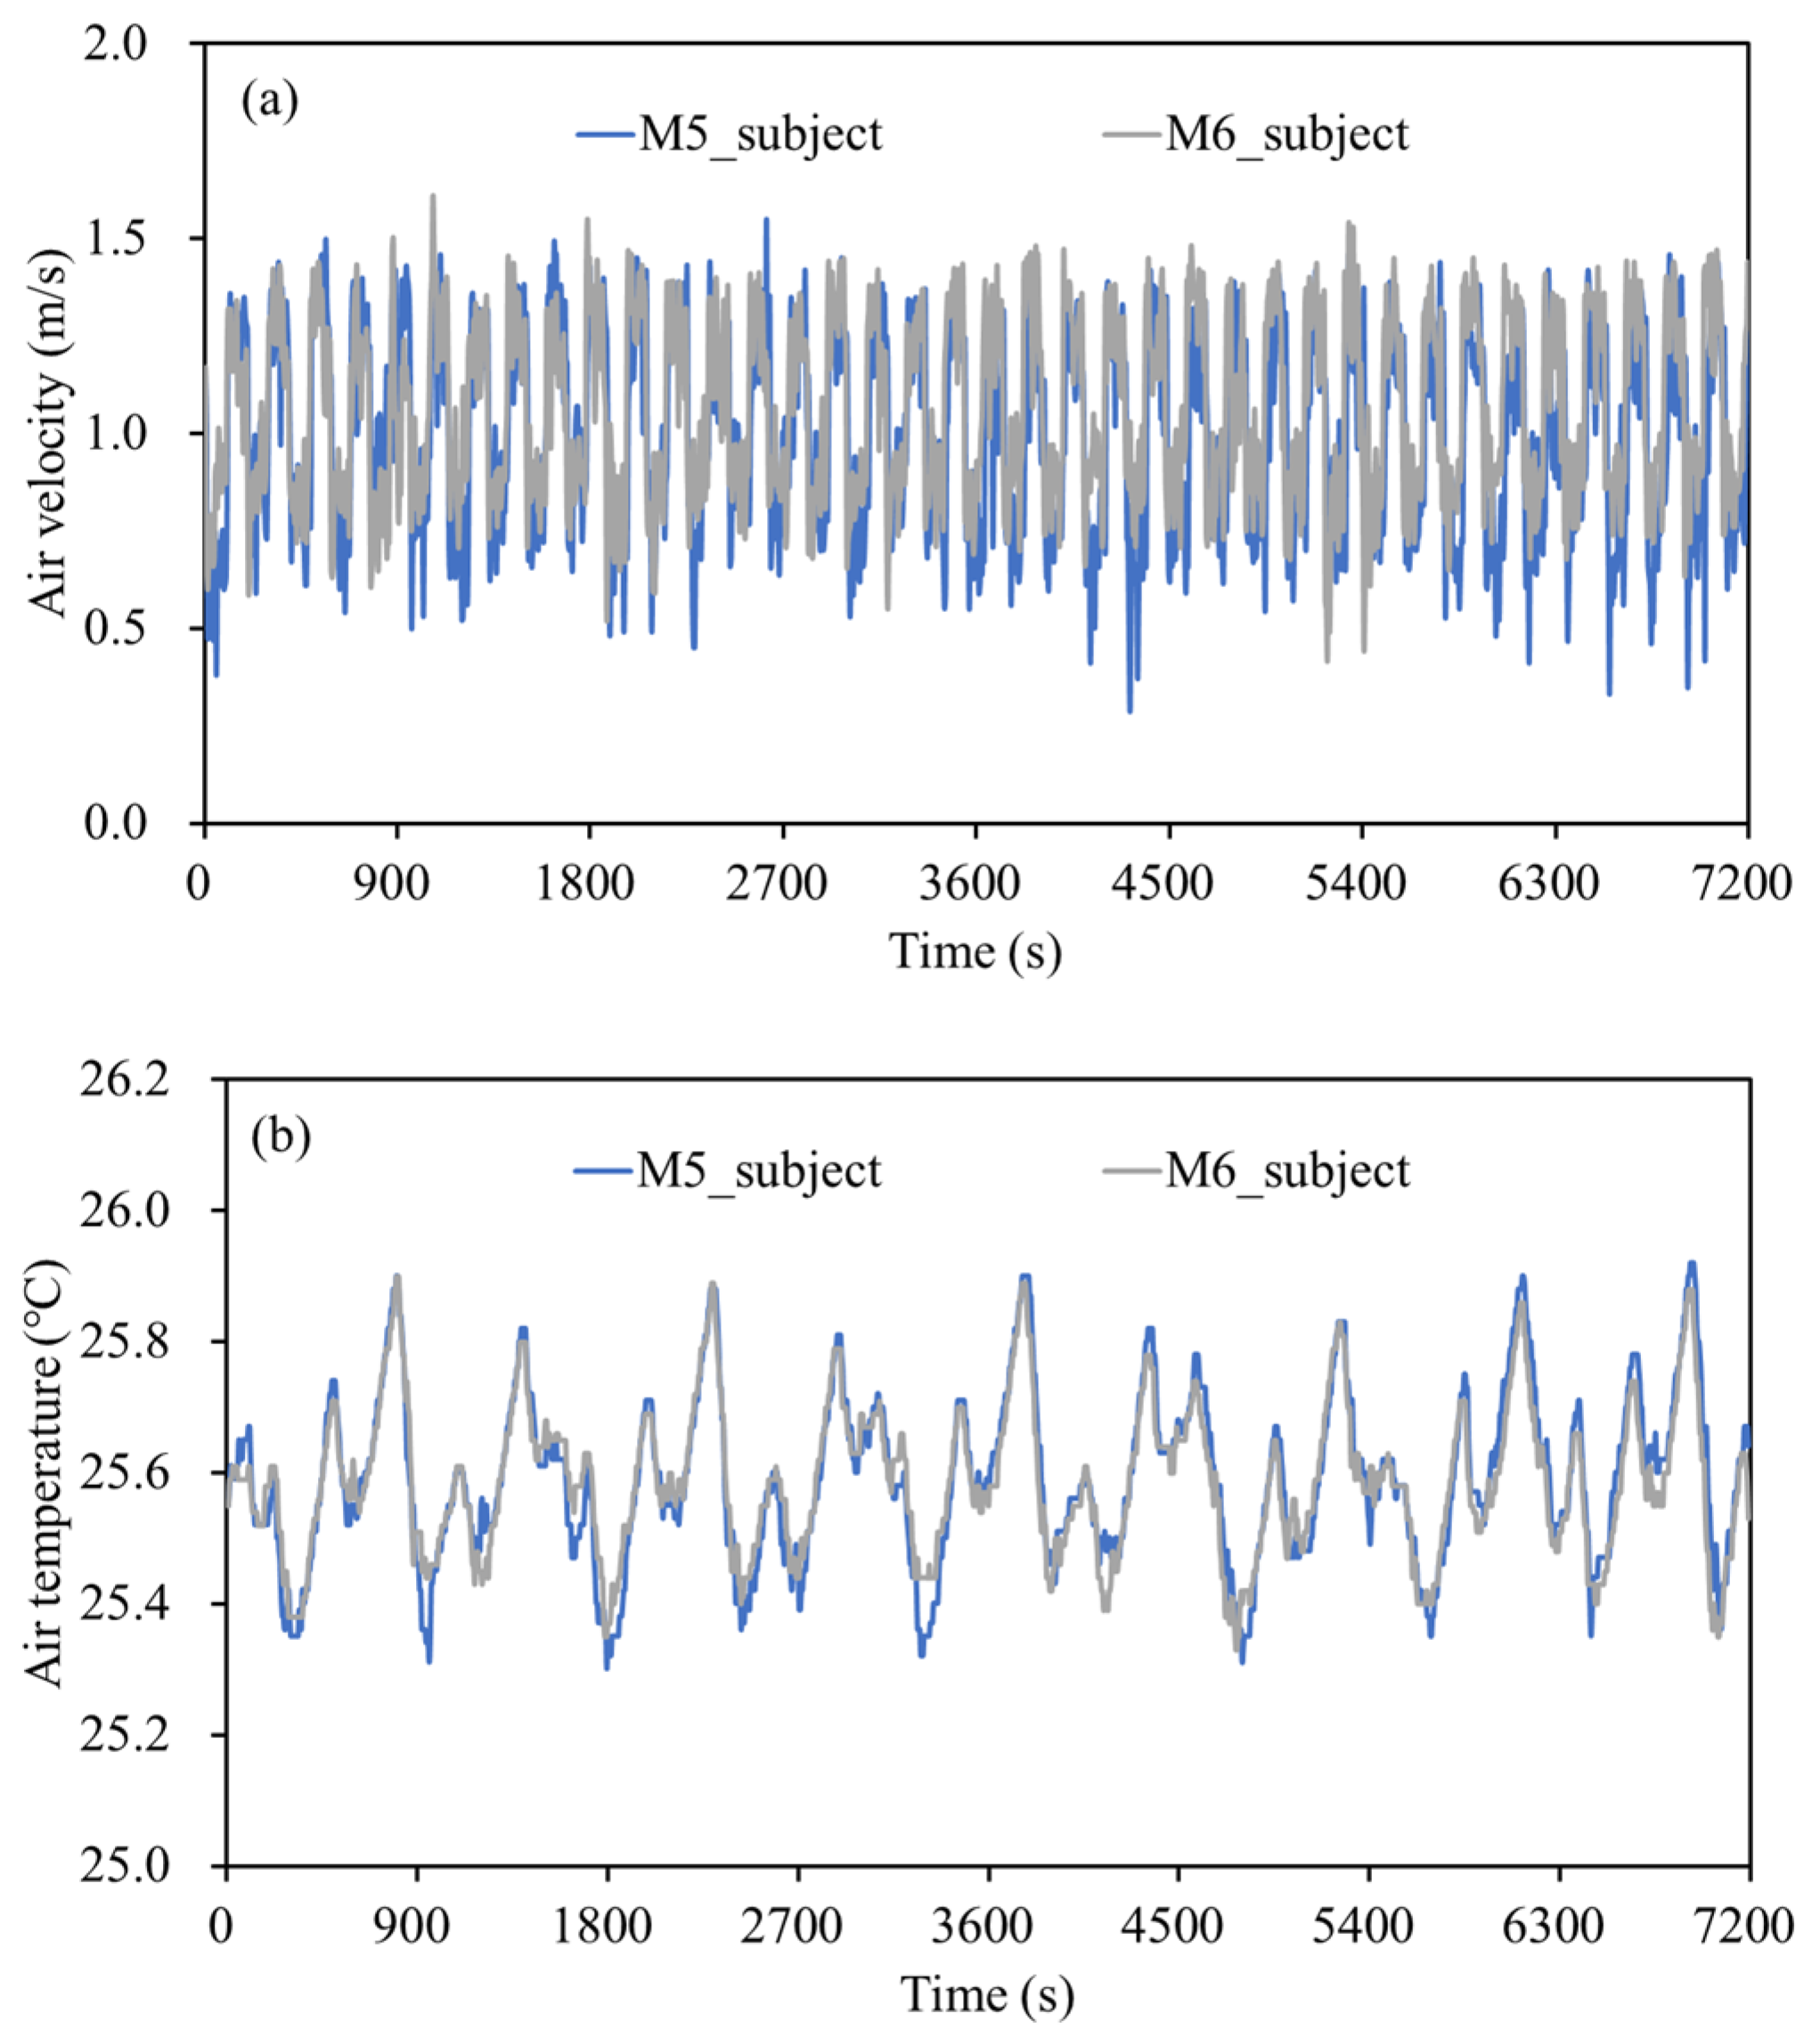
Previous studies [8,28,29] on subjective evaluations under dynamic ventilation have frequently reported inconsistencies in the thermal environments experienced by different occupants. To objectively investigate whether the dynamic ventilation shown in Figure 4 can provide uniform thermal conditions at multiple occupant locations, the temporal variations in air velocity and air temperature experienced by the two participants (M5 and M6, as shown in Figure 1) during the experiment are presented in Figure 5. The trends of the two curves within the occupied zone are highly consistent. The fluctuation amplitude, frequency, and average values of both air velocity and air temperature are nearly identical. This indicates that the thermal environmental parameters experienced by the two participants are almost the same. Therefore, it can be concluded that M5 and M6 are exposed to equivalent thermal conditions during the experiment, providing a reliable basis for subsequent analysis of subjective thermal perception and human thermal responses.
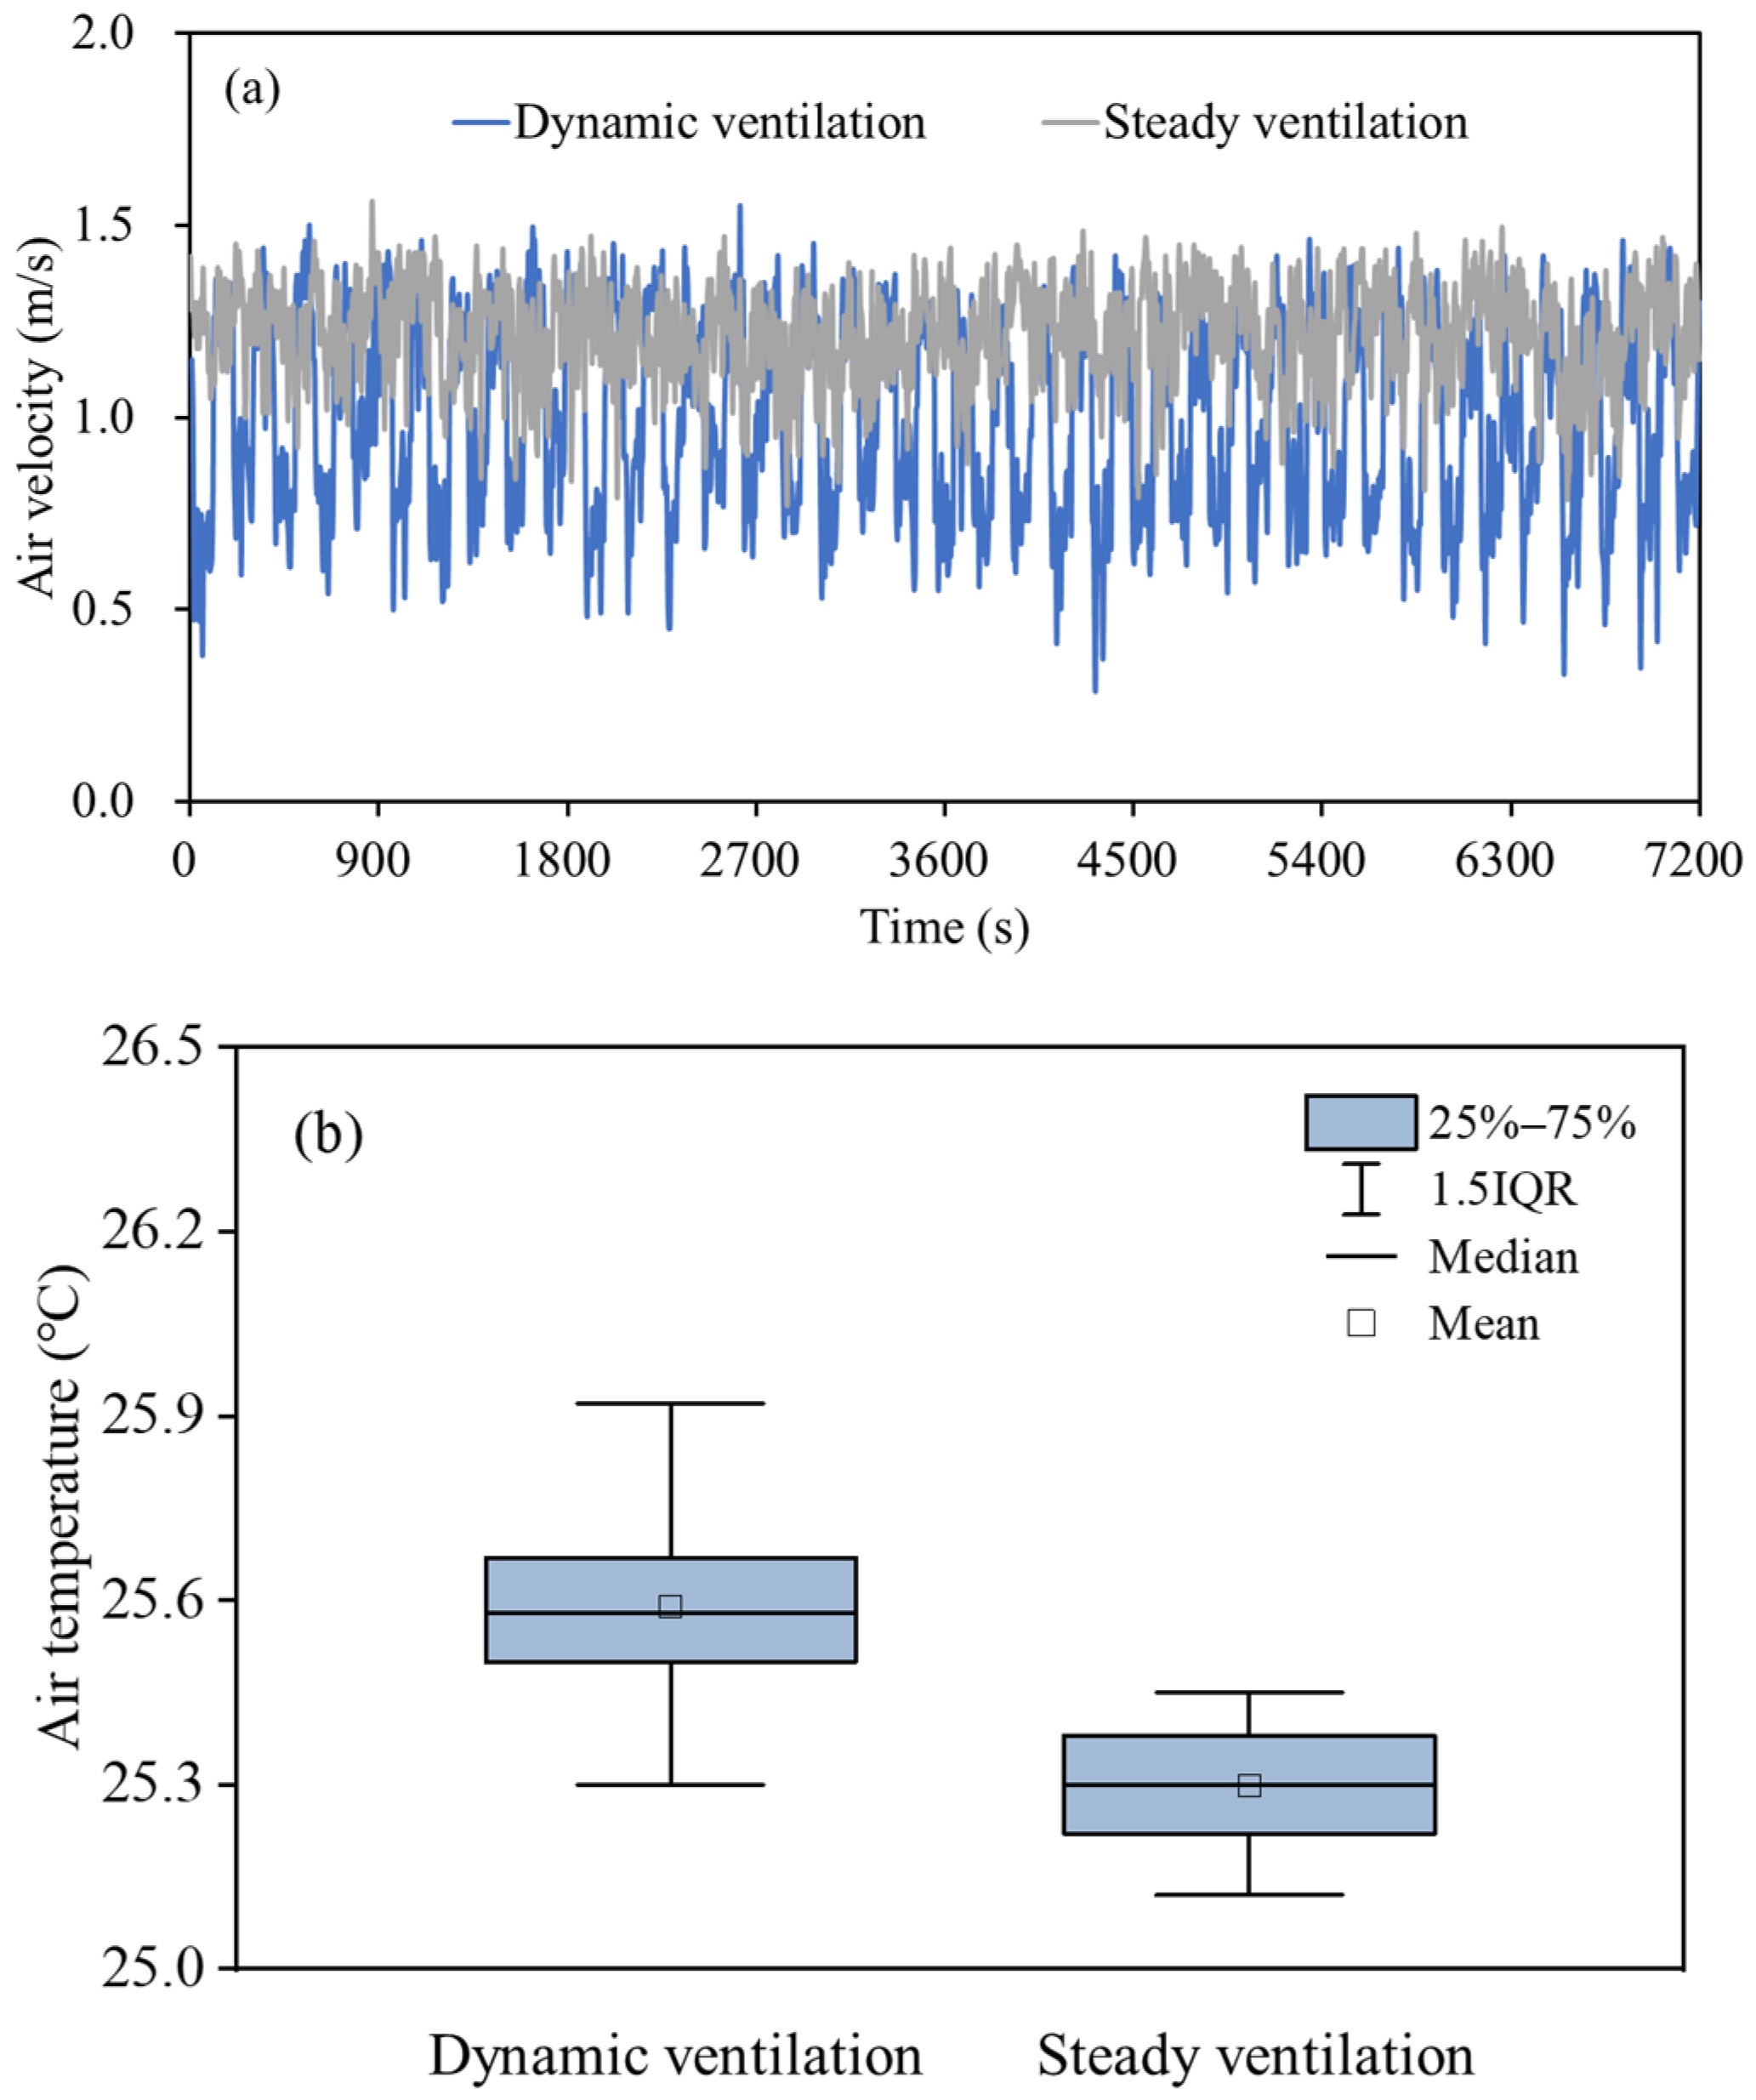
Figure 6a illustrates the variation in air velocity over time after the airflow reaches the occupied zone (location M5 in Figure 1) under both dynamic ventilation and steady ventilation modes. It can be observed that in dynamic ventilation mode, the air velocity continues to exhibit strong fluctuations, ranging from 0.8 to 1.2 m/s, with an average value of 1.0 m/s with a standard deviation of 0.3 m/s, maintaining its characteristic pulsation. This indicates that the pulsating characteristic of dynamic ventilation is effectively transmitted to the occupied zone during airflow propagation. In contrast, while some fluctuations are also present under steady ventilation, they are relatively minor, and the overall air velocity remains stable, with an average value of 1.2 m/s and a standard deviation of 0.1 m/s in the occupied zone. These results highlight a clear distinction between the airflow characteristics of the two ventilation strategies within the occupied zone.
Under dynamic ventilation, the average air temperature of the occupied zone tends to be slightly higher compared to steady ventilation. The dynamic ventilation mode shows an average temperature of 25.6 °C with a standard deviation of 0.1 °C. The average temperature is 25.3 °C with a standard deviation of 0.1 °C under steady ventilation. This difference can be attributed to the increased turbulence intensity which enhances the mixing of supply air with the surrounding air, thereby leading to greater thermal dissipation. As shown in Figure 6b, the range between the maximum and minimum air temperatures is noticeably larger under dynamic ventilation compared to steady ventilation. This wider range reflects greater variability and fluctuation in the thermal environment caused by dynamic airflow. Specifically, the temperature range under dynamic ventilation spans approximately 0.6 °C, while that under steady ventilation is around 0.3 °C.
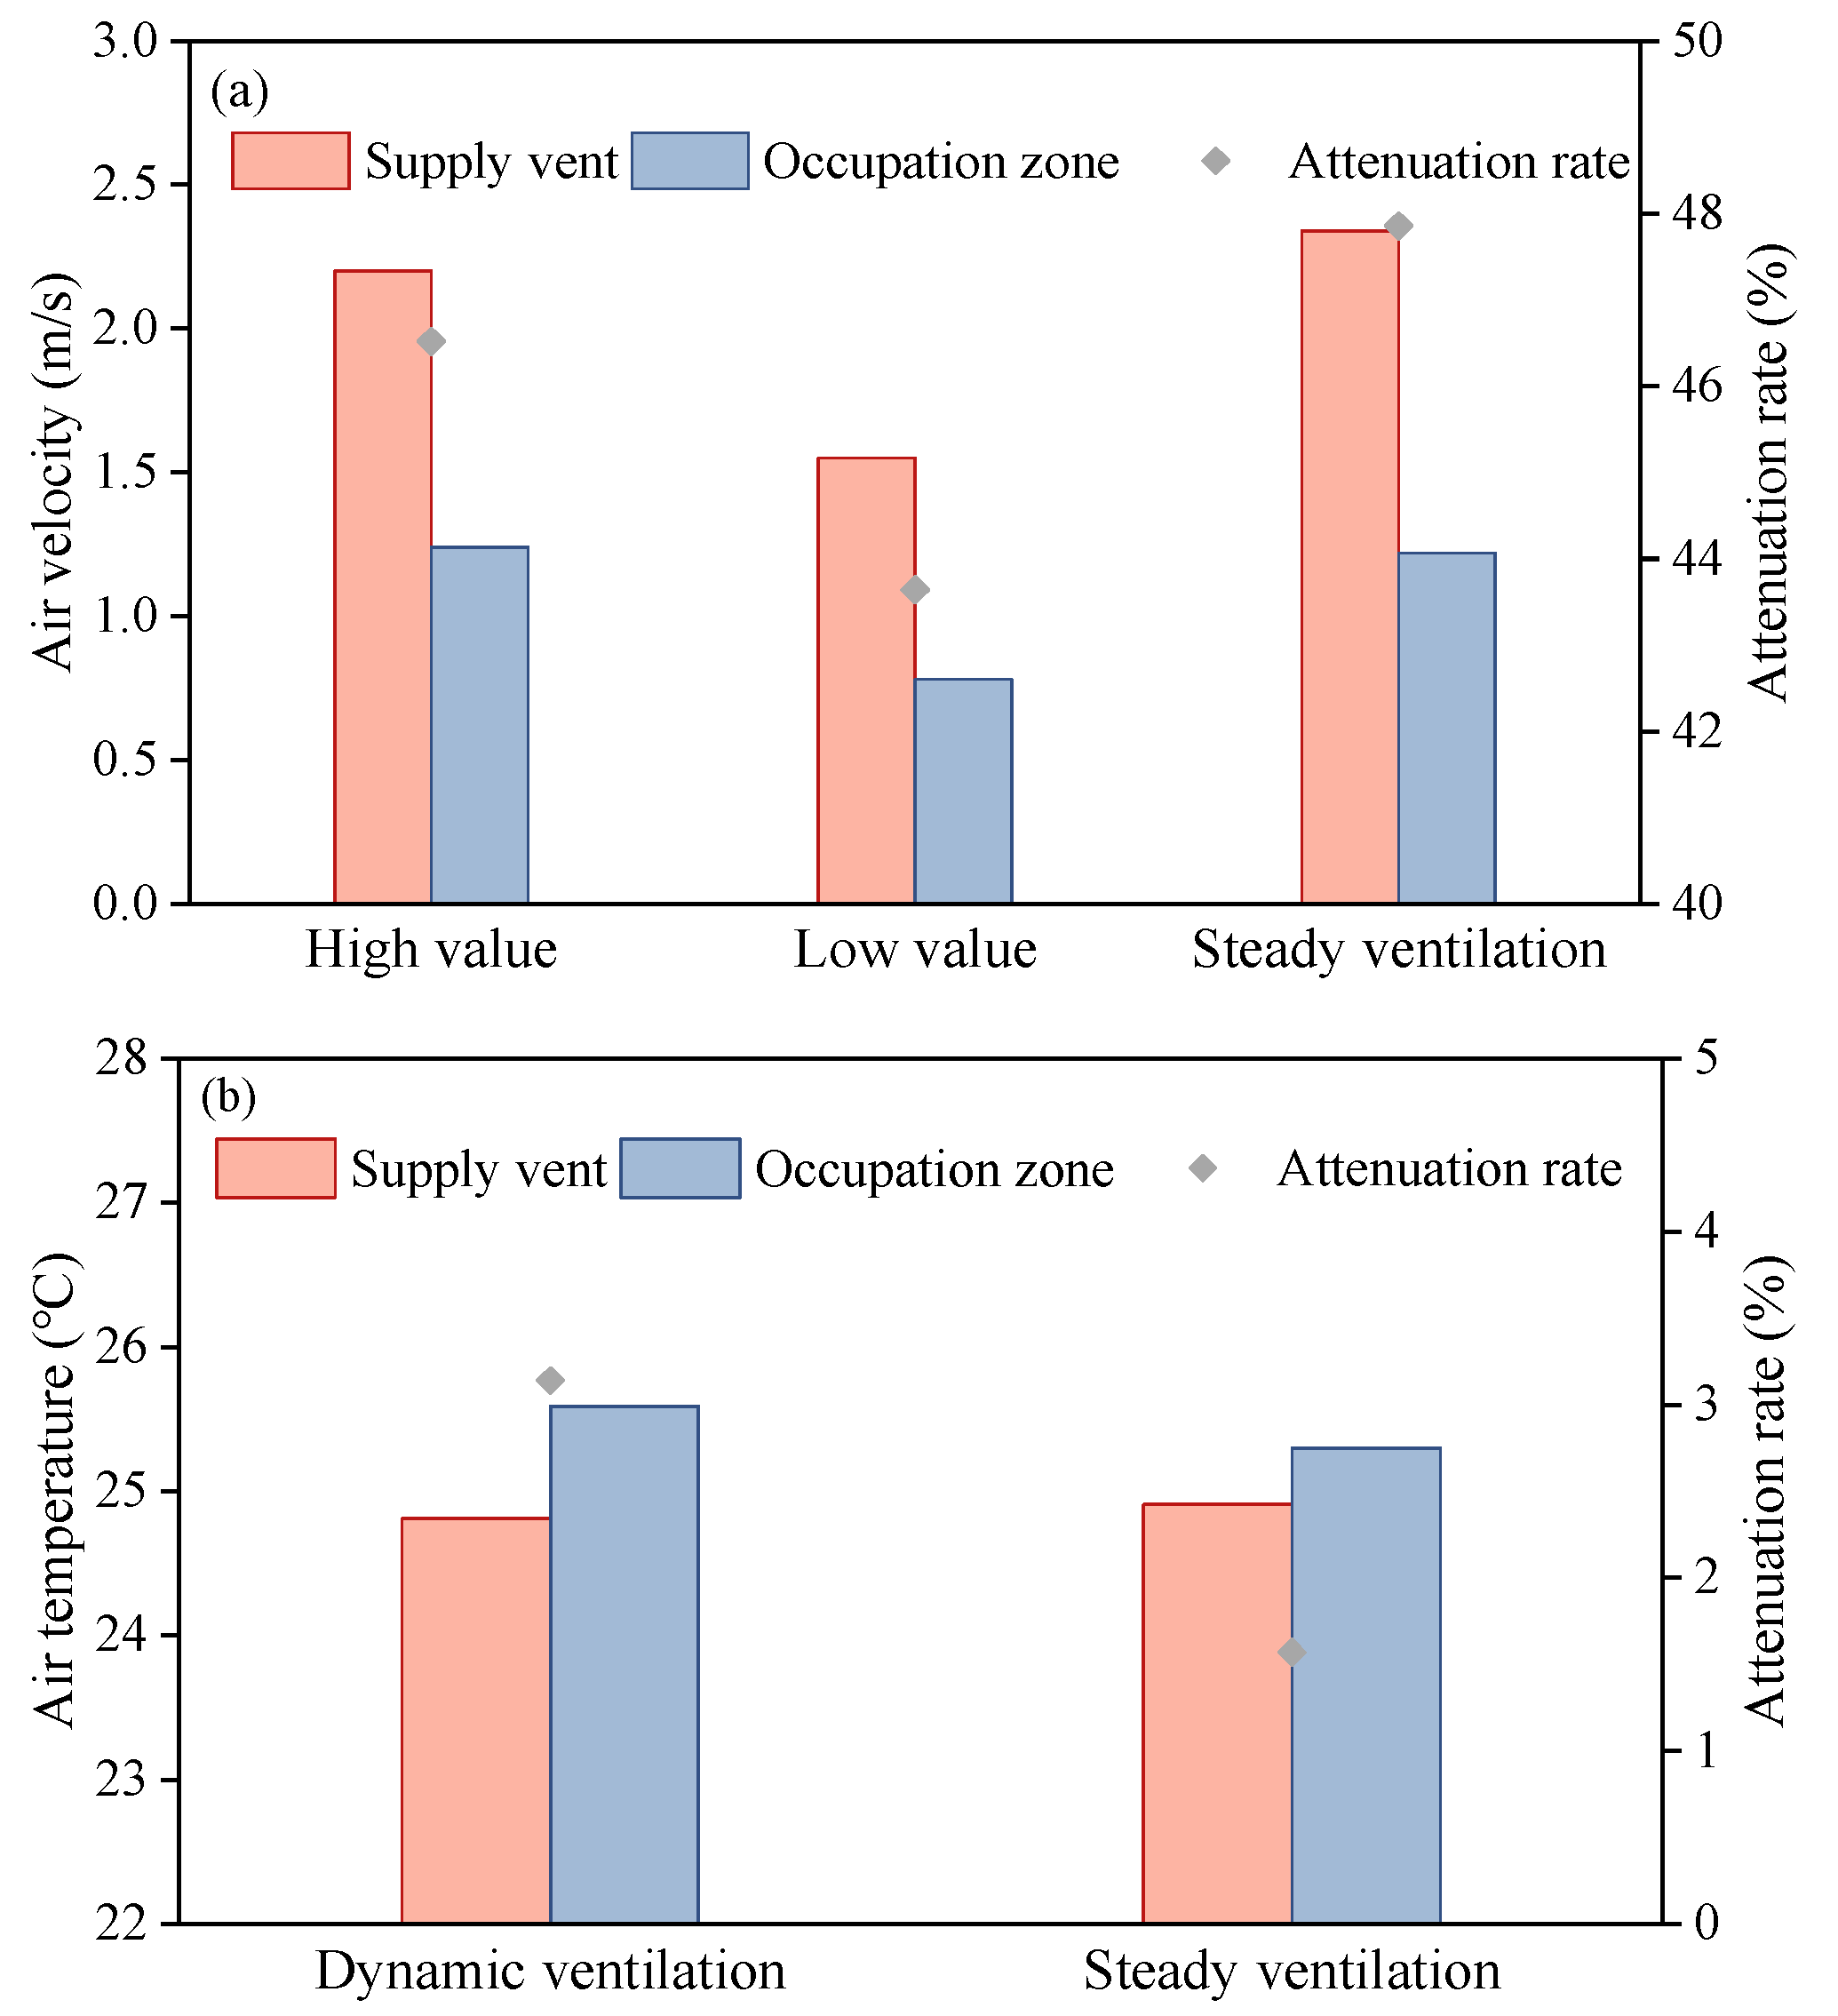
To further quantify the spatial transmission effects, Figure 7a,b present the attenuation of air velocity and air temperature as the airflow propagates from the supply vent to the occupied zone under both ventilation modes. As the supply air enters the occupied zone from the supply vent, entrainment and mixing with the surrounding air lead to a decrease in air velocity and an increase in air temperature. Under dynamic ventilation, the high air velocity decreases from 2.2 m/s to 1.2 m/s, corresponding to an attenuation rate of 43.6% (Equation (1)). The low velocity drops from 1.6 m/s to 0.8 m/s, resulting in an attenuation rate of 49.7%. The average supply air velocity under dynamic conditions decreases from 1.9 m/s to 1.0 m/s, with an attenuation rate of 46.5%. In comparison, under steady ventilation, the average air velocity decreases from 2.3 m/s to 1.2 m/s, corresponding to an attenuation rate of 47.9%. For air temperature, the dynamic ventilation condition shows an increase from 24.8 °C to 25.6 °C, yielding a temperature increase rate of 3.1% (Equation (2)). Under steady ventilation, the temperature rises from 24.9 °C to 25.3 °C, with an increase rate of 1.6%.

3.2. Analysis of Subjective Surveys

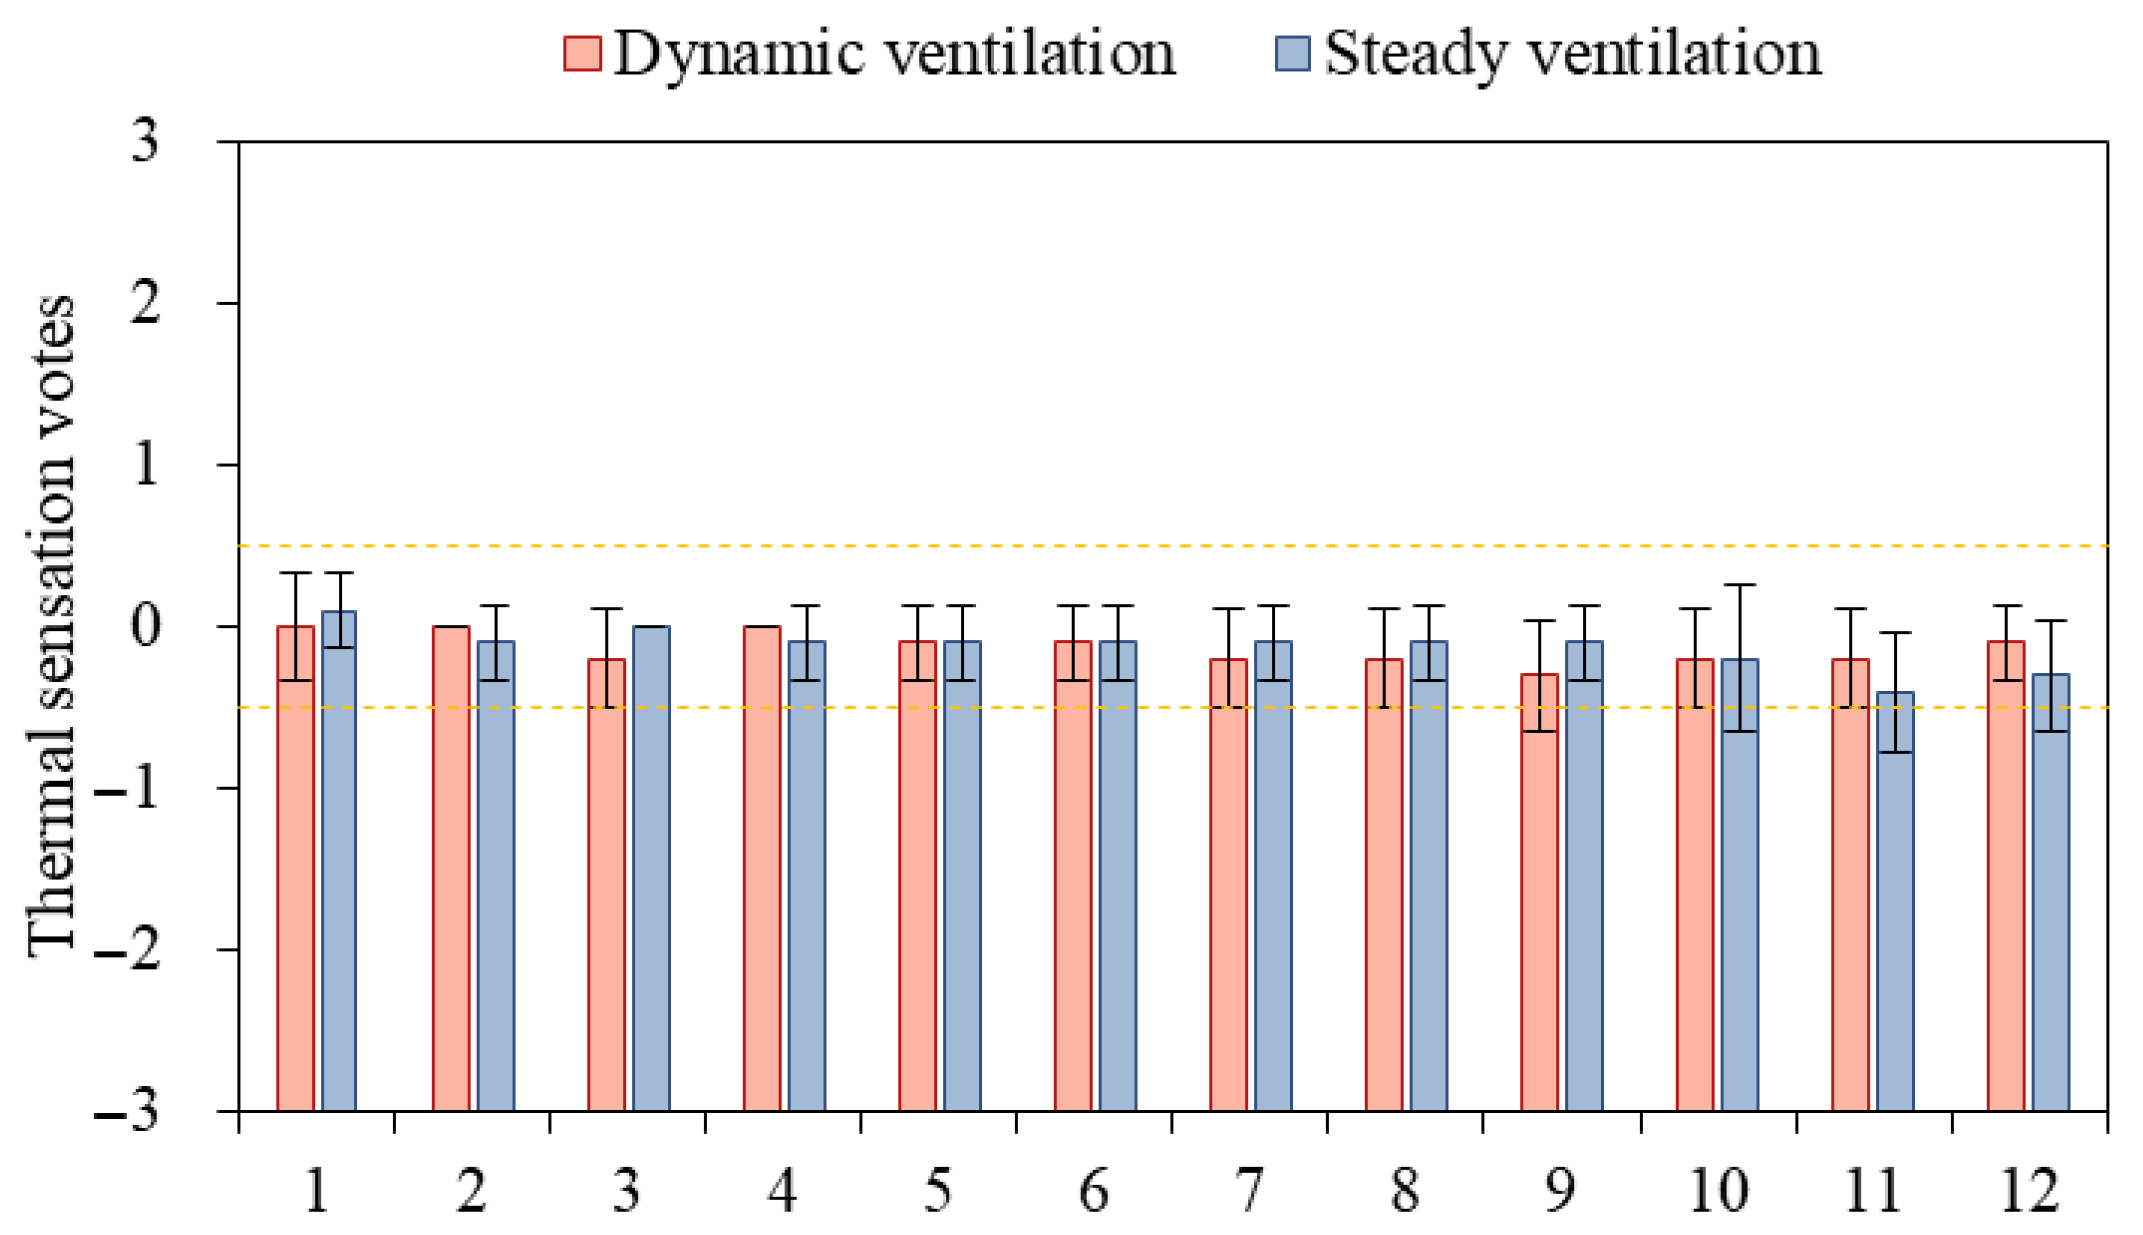
The subjective survey results are analyzed to assess perceived thermal comfort. Figure 8 presents the average thermal sensation votes of all participants under dynamic ventilation and steady ventilation conditions across 12 voting sessions. The bar charts represent the mean thermal sensation votes for each questionnaire under the two ventilation modes, while the error bars indicate the corresponding 95% confidence interval, reflecting the variability and statistical reliability of the data. As shown in Figure 8, thermal sensation vote values for both dynamic ventilation and steady ventilation are predominantly concentrated within the range of −0.5 to 0.5 (yellow dotted lines), indicating that participants generally perceived a thermally comfortable indoor environment. Notably, the error bars under dynamic ventilation are generally shorter, suggesting a higher level of consistency in participants’ subjective responses, with less variability and a more stable comfort experience. In contrast, the confidence intervals under steady ventilation are wider at certain time points, indicating greater individual differences in thermal perception.
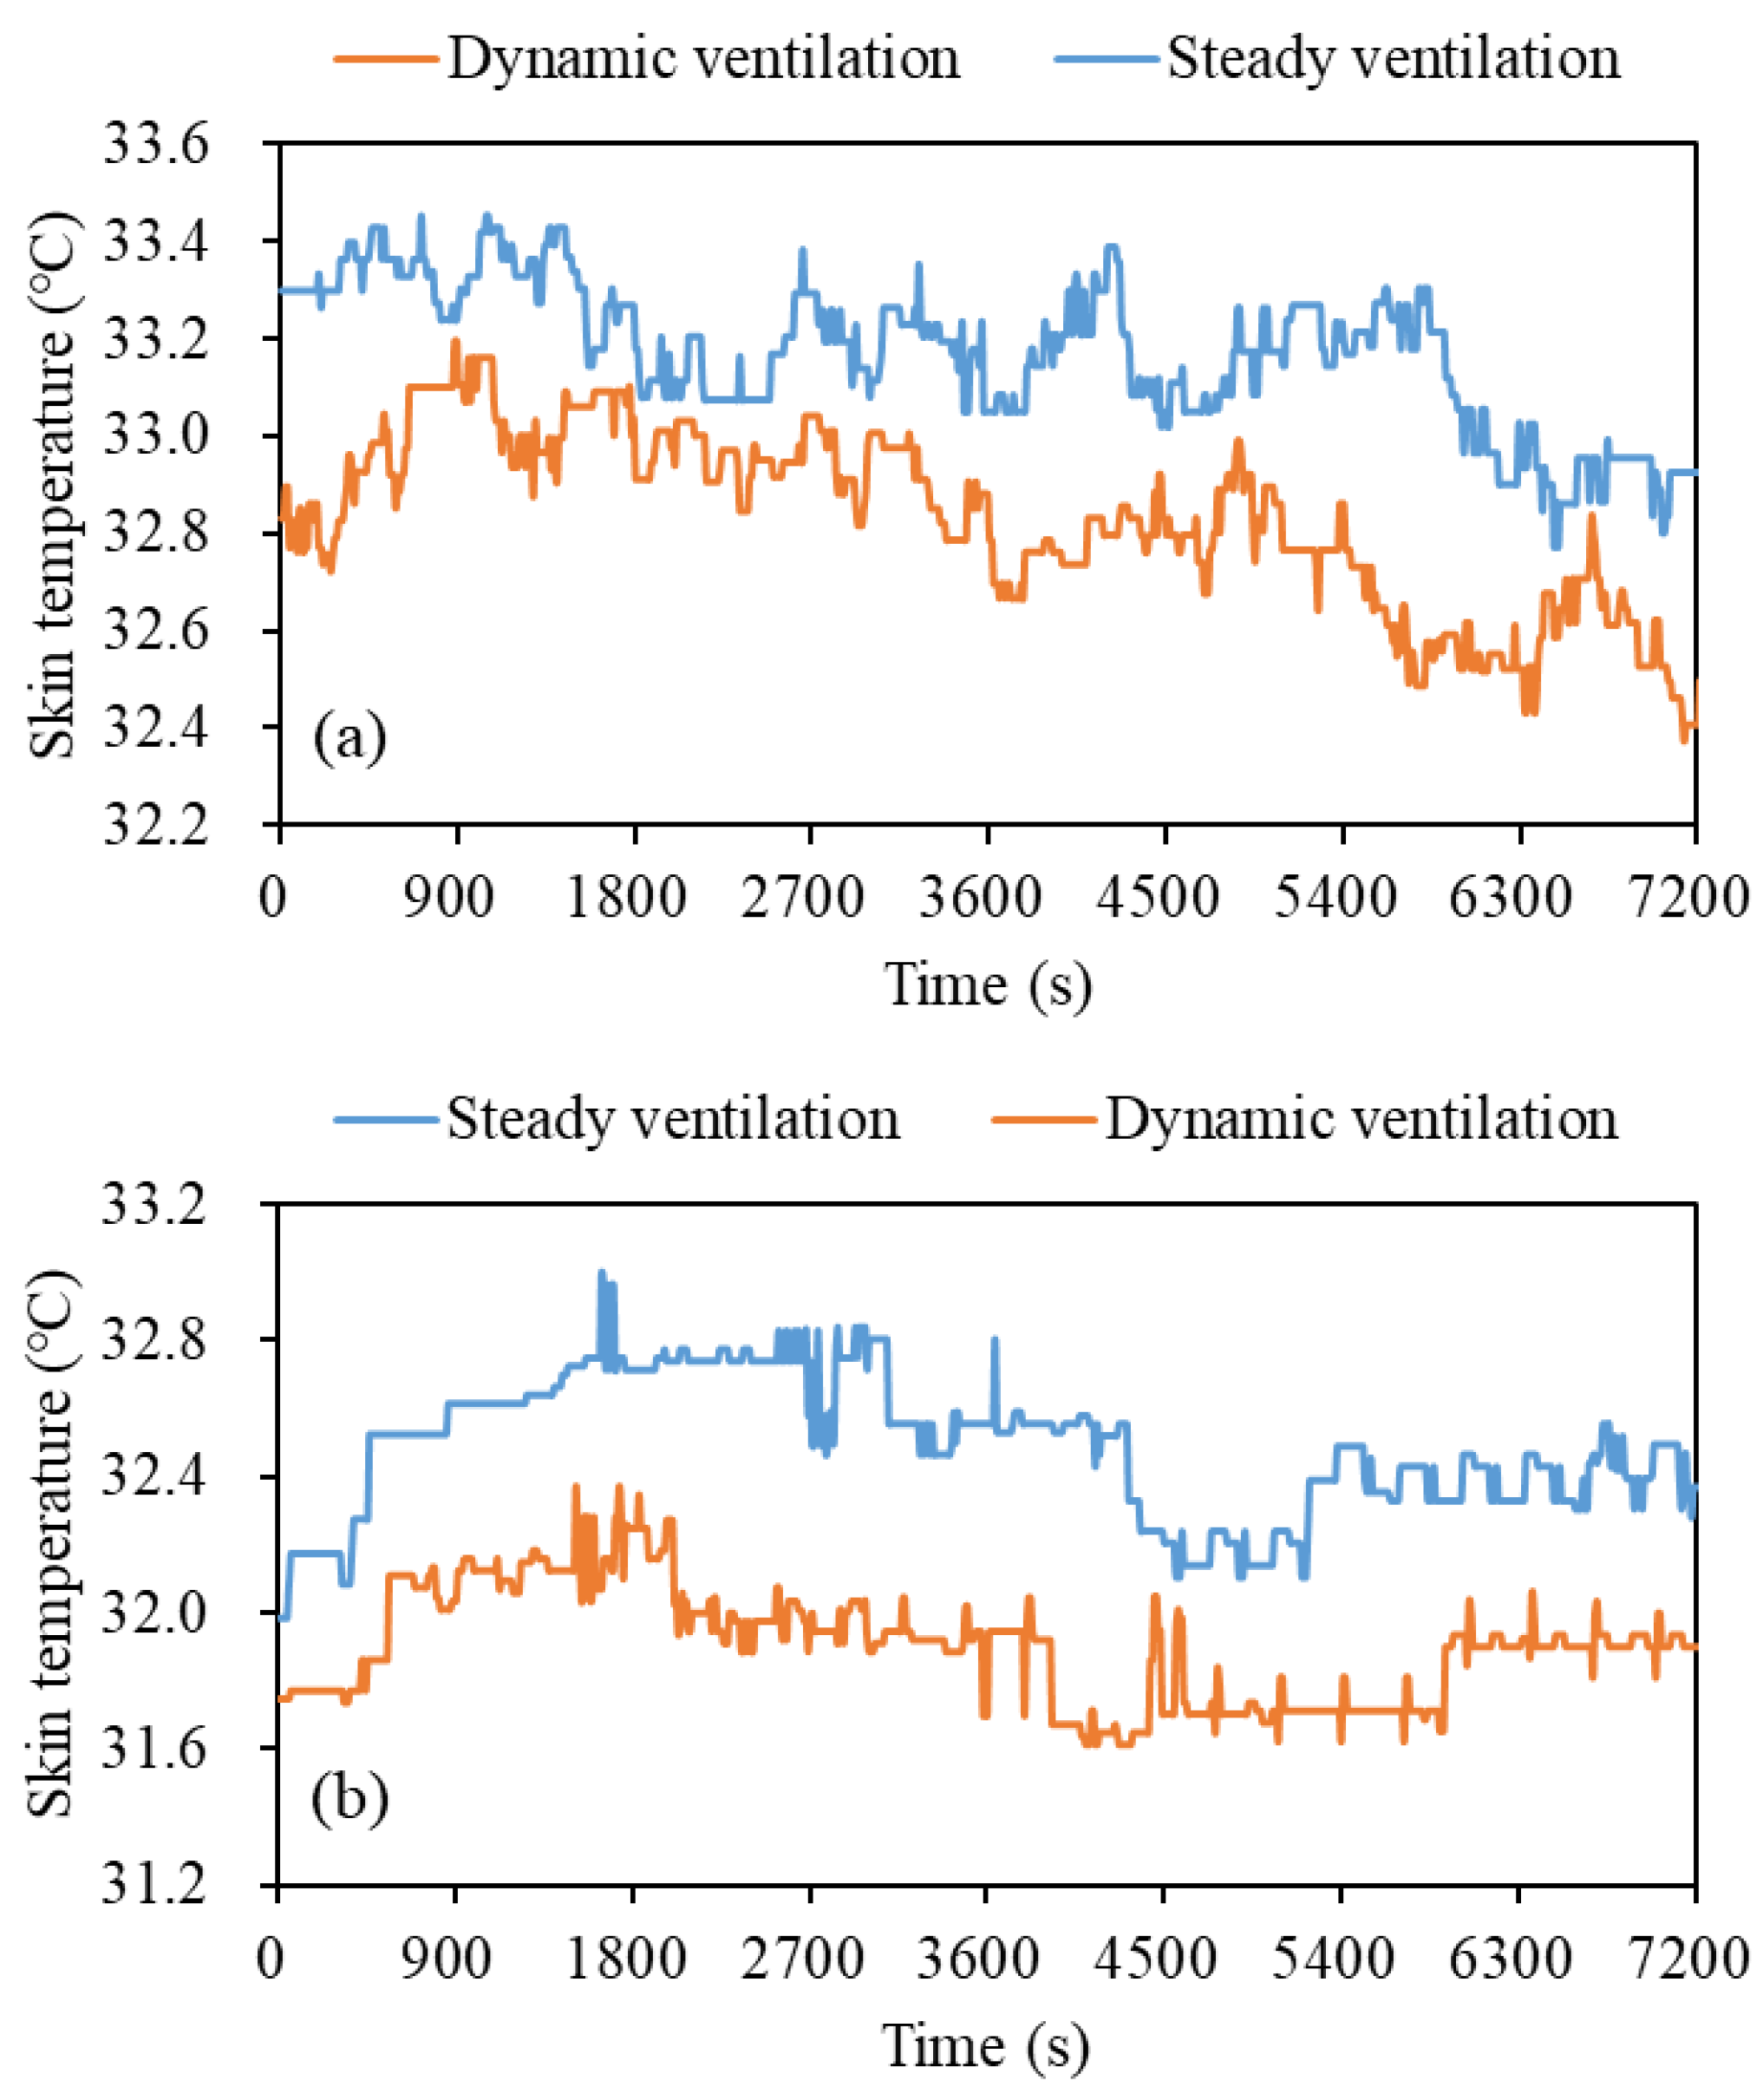
To complement these subjective assessments, skin temperature is also monitored as an objective physiological indicator of thermal response under both ventilation modes. Figure 9 presents the overall average skin temperature distributions of two participants (one male participant and one female participant) under dynamic ventilation and steady ventilation modes. For both participants, the overall skin temperature is consistently lower under dynamic ventilation compared to steady ventilation. This can be attributed to the enhanced cooling effect of dynamic airflow. Specifically, dynamic ventilation enhances convective heat transfer between the human body and the surrounding air by increasing turbulence intensity [30]. Furthermore, the low-frequency fluctuations generated by dynamic airflow introduce correspondingly low-frequency variations in convective heat loss, causing the skin temperature to oscillate and more strongly stimulate cutaneous cold receptors [31]. The resulting cooling sensation contributes to an improved perception of thermal comfort [12,32]. During the initial adaptation phase (the first 30 min), both participants show either an increase or a decrease in skin temperature, which is likely related to their short-term prior thermal exposure before the experiment. After this adaptation period, the female participant’s skin temperature stabilizes with a variation of only 0.2 °C under steady ventilation, but shows a greater change of 0.5 °C under dynamic ventilation, potentially indicating a greater sensitivity to thermal stimuli. When comparing the overall skin temperatures of the two participants, the male participant consistently exhibited slightly lower temperatures than the female, which can be attributed to individual physiological differences.
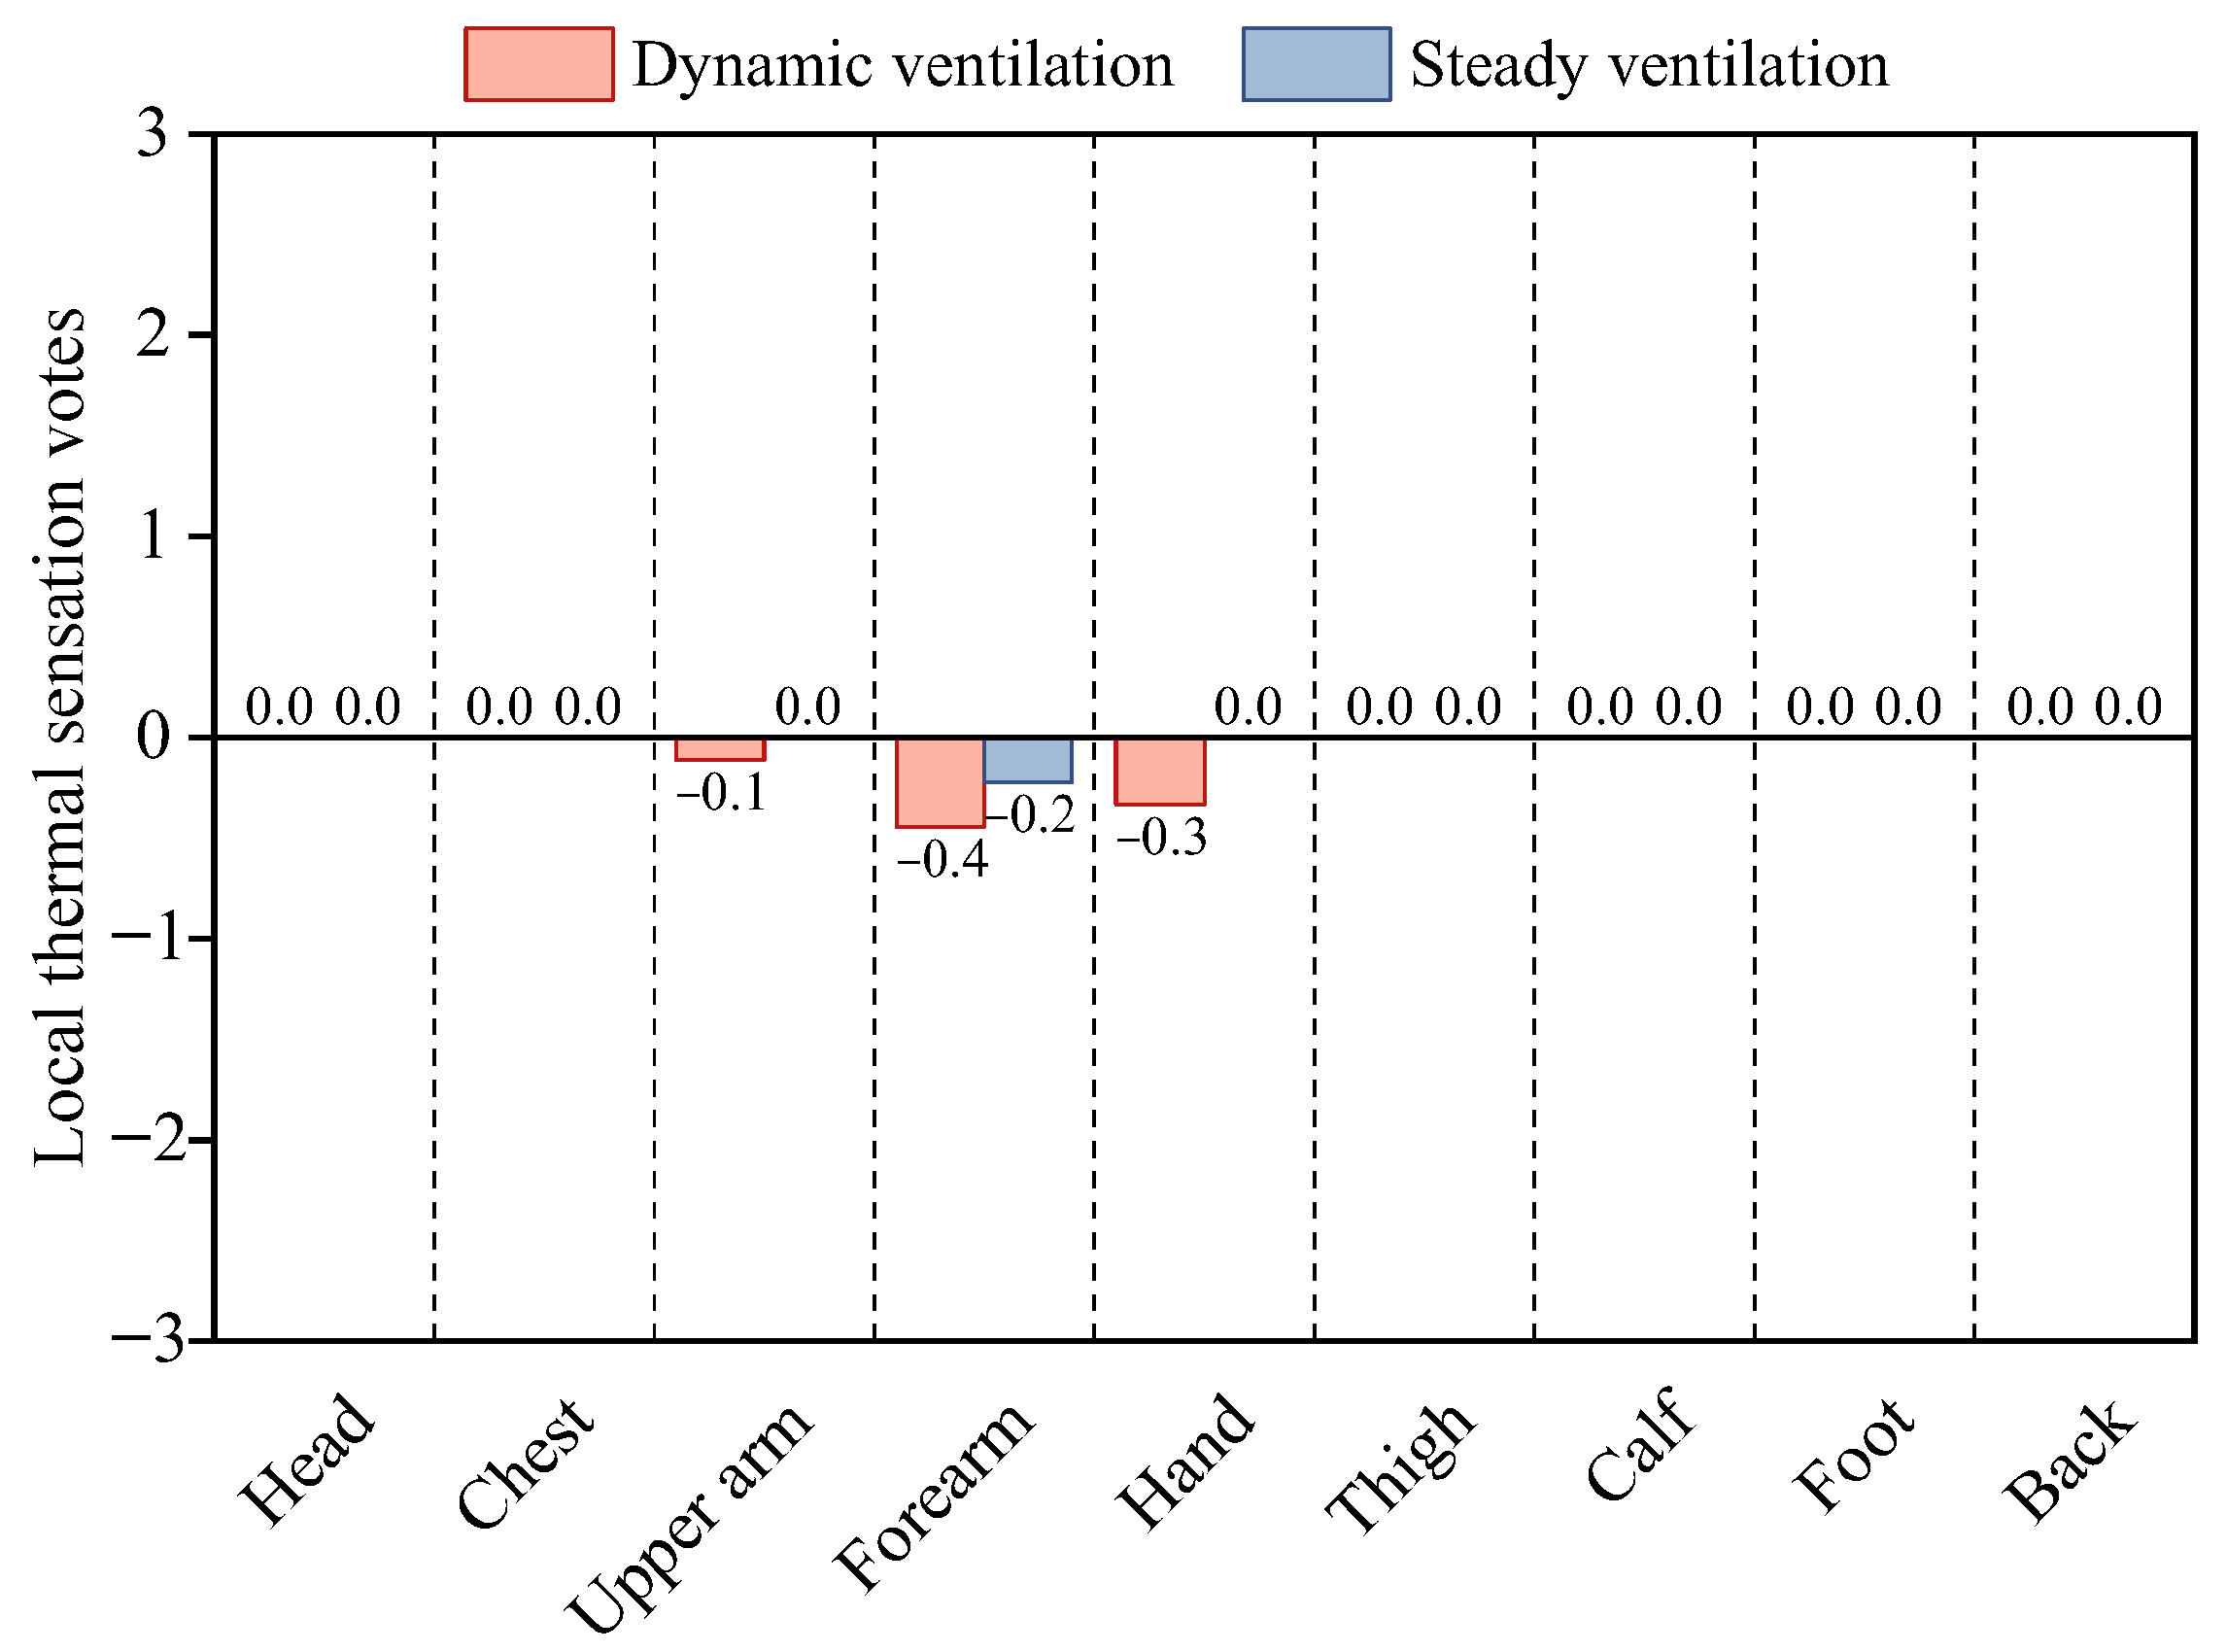
Figure 10 presents the local thermal sensation votes of the female participant shown in Figure 9a under dynamic ventilation and steady ventilation. Although the participant reported a neutral overall thermal sensation in both ventilation modes, the local thermal sensation data reveal more nuanced differences, providing further insight into the role of dynamic airflow in enhancing local thermal comfort. Compared to steady ventilation, the local thermal sensation votes under dynamic ventilation are noticeably lower in the upper arm, forearm, and hand, indicating a stronger perception of local coolness. Specifically, the average thermal sensation votes for the upper arm and hand are −0.1 and −0.3, respectively, suggesting a slight cool feeling in these areas under dynamic airflow, while both are perceived as thermally neutral under steady ventilation. The forearm exhibited negative thermal sensation votes under both ventilation modes, but the value is more pronounced under dynamic ventilation, with an average vote of −0.4. This is primarily because the hands and forearms have a high density of cold thermoreceptors [33]. Cold thermoreceptors are sensitive to low-frequency fluctuations in air velocity [34]. As a result, they are more responsive to airflow stimulation and more likely to exhibit changes in thermal sensation, which is characteristic of dynamic ventilation.
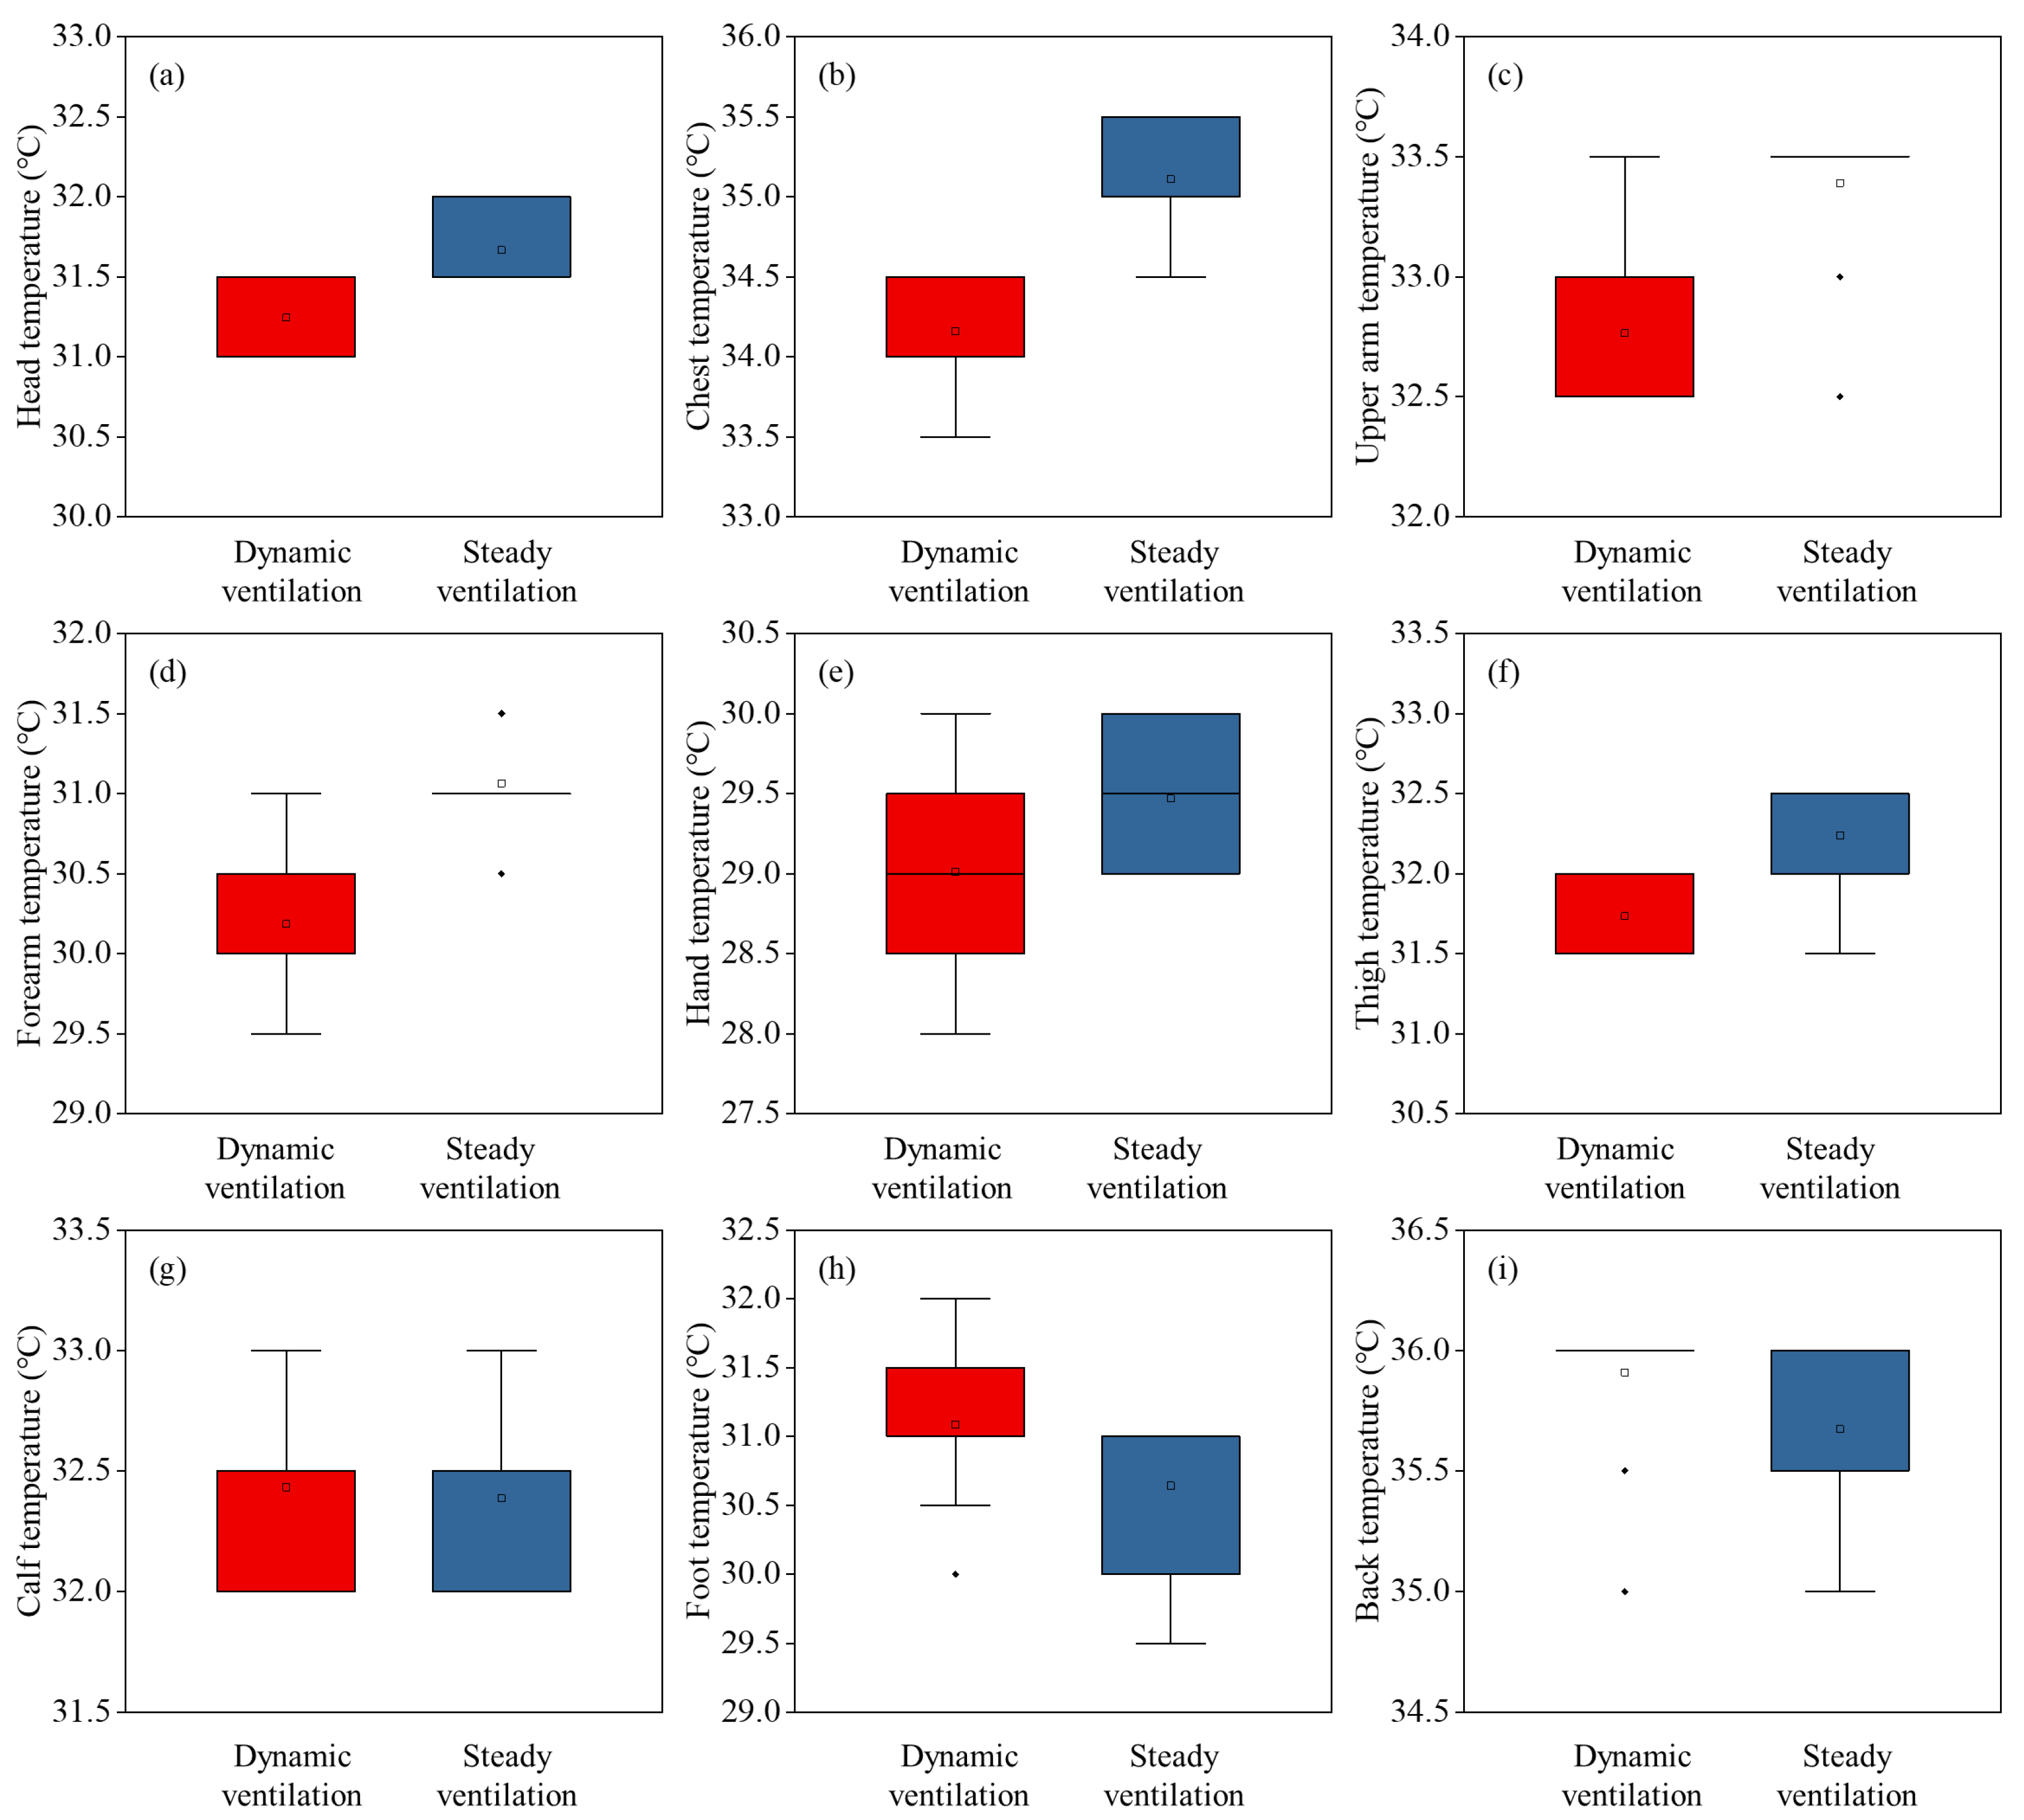
Local skin temperature has been recognized as a significant physiological indicator of an individual’s overall thermal sensation [35]. Individual body parts contribute with different weights to warm and cool sensations, and strong local sensations can dominate the overall thermal perception. When all local sensations are near neutral, the overall sensation tends to approximate the average of all body segments [36]. Figure 11 presents the local skin temperature of the female under dynamic ventilation and steady ventilation. The participant’s hands and feet exhibited lower skin temperatures compared to other parts of the body, with the head showing even lower temperatures than the extremities. In contrast, the chest and back display higher skin temperatures. This conclusion is consistent with the findings reported by Song et al. [37]. The results indicate that under dynamic ventilation, the skin temperatures of the head, chest, upper arm, forearm, hand, and thigh are lower than those recorded under steady ventilation. The reduction in skin temperature can be attributed to the intermittent and periodic fluctuations in air velocity introduced by dynamic ventilation. This airflow pattern enhances convective heat transfer between the body and the surrounding air, thereby improving cooling efficiency. This effect is particularly evident in areas with a higher density of cold thermoreceptors [38,39], making these regions more sensitive to airflow variations. For this participant, the skin temperatures of the head, chest, upper arm, forearm, hand, and thigh under dynamic ventilation are 31.2 °C, 34.2 °C, 32.8 °C, 30.2 °C, 29.0 °C, and 31.7 °C, respectively. Under steady ventilation, the corresponding temperatures are 31.7 °C, 35.1 °C, 33.4 °C, 31.1 °C, 29.5 °C, and 32.2 °C, respectively. This corresponds to temperature reductions of 1.3%, 2.7%, 1.9%, 2.8%, 1.6%, and 1.6%, respectively. This further supports the local thermal comfort voting results of the same participant shown in Figure 9. For this participant, the calf temperature shows minimal difference between the two modes, measured at 32.4 °C under dynamic ventilation and 32.4 °C under steady ventilation. For the foot and back, the participant exhibits lower skin temperatures under steady ventilation compared to dynamic ventilation. This localized deviation reflects individual physiological variability, such as differences in peripheral blood flow or local thermal sensitivity. This interpretation is supported by the weighted skin temperature, which for this participant remains lower under dynamic ventilation compared to steady ventilation (Figure 9a).
“How satisfied are you with the overall air velocity in the current environment?” This question is designed to assess participants’ subjective perception of satisfaction with air velocity during the experiment. The participants rated the perceived air velocity satisfaction on a Likert 7-point scale: (1) very dissatisfied, (2) dissatisfied, (3) slightly dissatisfied, (4) acceptable, (5) slightly satisfied, (6) satisfied, (7) very satisfied. The orange dotted line in the figure marks a score of 4, representing the “acceptable” threshold. Figure 12 summarizes these responses for both dynamic ventilation and steady ventilation. The bar charts represent the mean satisfaction votes for air velocity under the two ventilation modes, while the error bars indicate the corresponding 95% confidence interval. During the initial adaptation phase (the first three voting sessions), participants report lower satisfaction with air velocity under dynamic ventilation compared to steady ventilation, primarily due to the influence of thermal history. Satisfaction with dynamic ventilation progressively improves over the course of the experiment. From the sixth voting session, it consistently surpasses that of steady ventilation, suggesting that a fluctuating airflow is more appealing to them. The voting results are consistent with the findings of Uğursal et al. [30], indicating that the majority of participants prefer a dynamic environment.
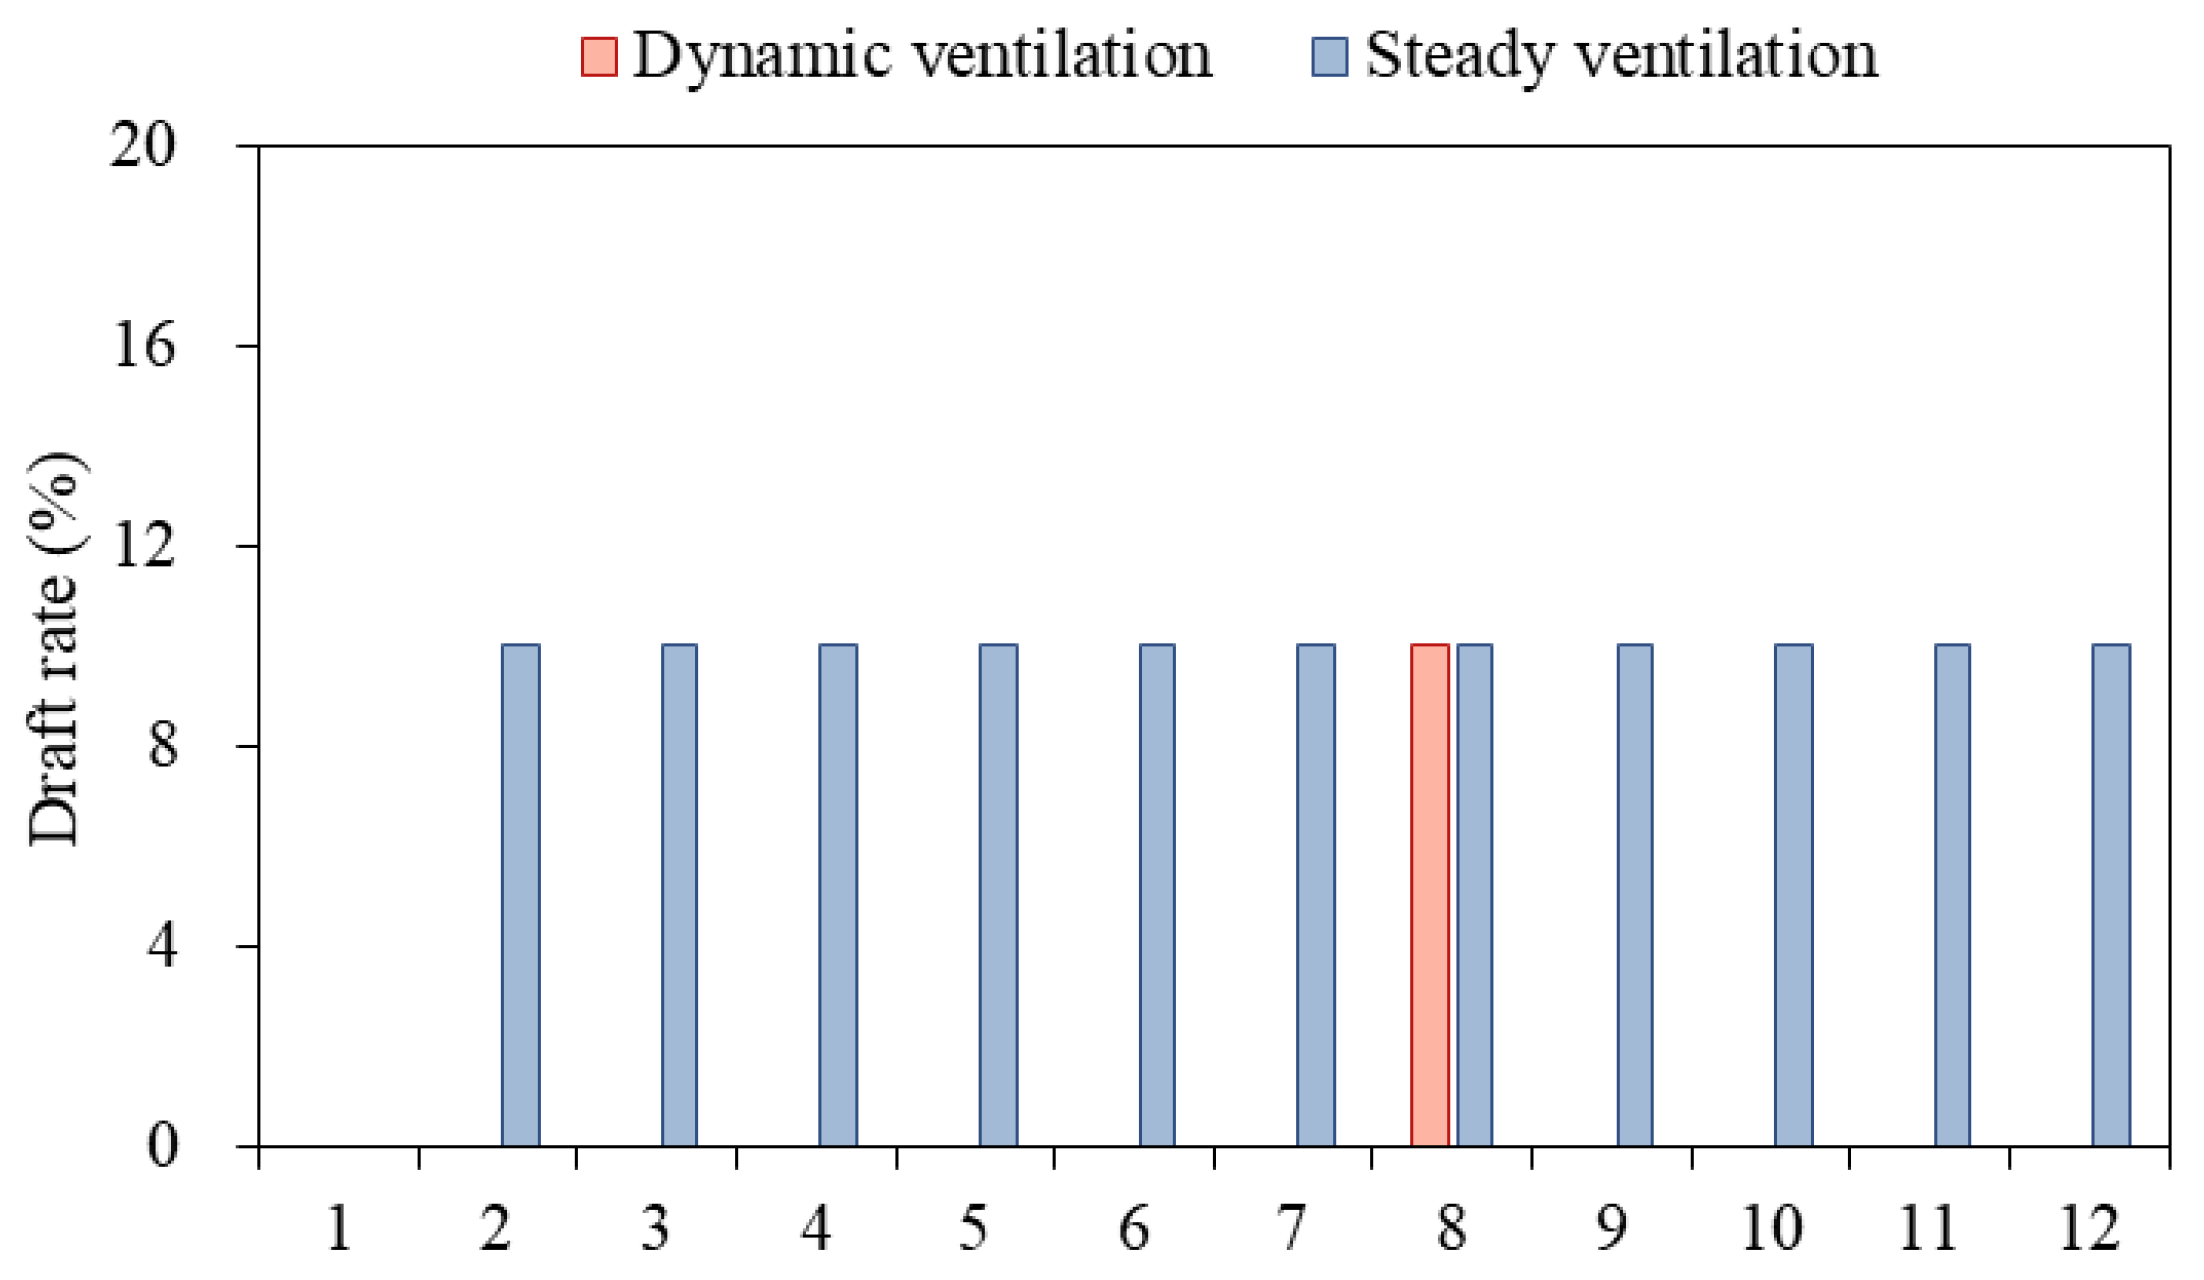
Draft is the unwanted local cooling caused by air movement [40]. A vote of “dissatisfied” or “acceptable” accompanied by a desire to reduce air velocity is considered indicative of draft sensation. Conversely, a vote of “acceptable” with a preference to maintain or increase air velocity or a vote of “satisfied” is interpreted as an absence of draft sensation. After thermal adaptation in the steady ventilation, the draft rate (defined as the proportion of votes indicating dissatisfaction) with air velocity is 10%. Under dynamic ventilation, this proportion decreases to 0%, as illustrated in Figure 13, showing that a dynamic environment not only improves overall satisfaction but also eliminates draft risk.

4. Discussion

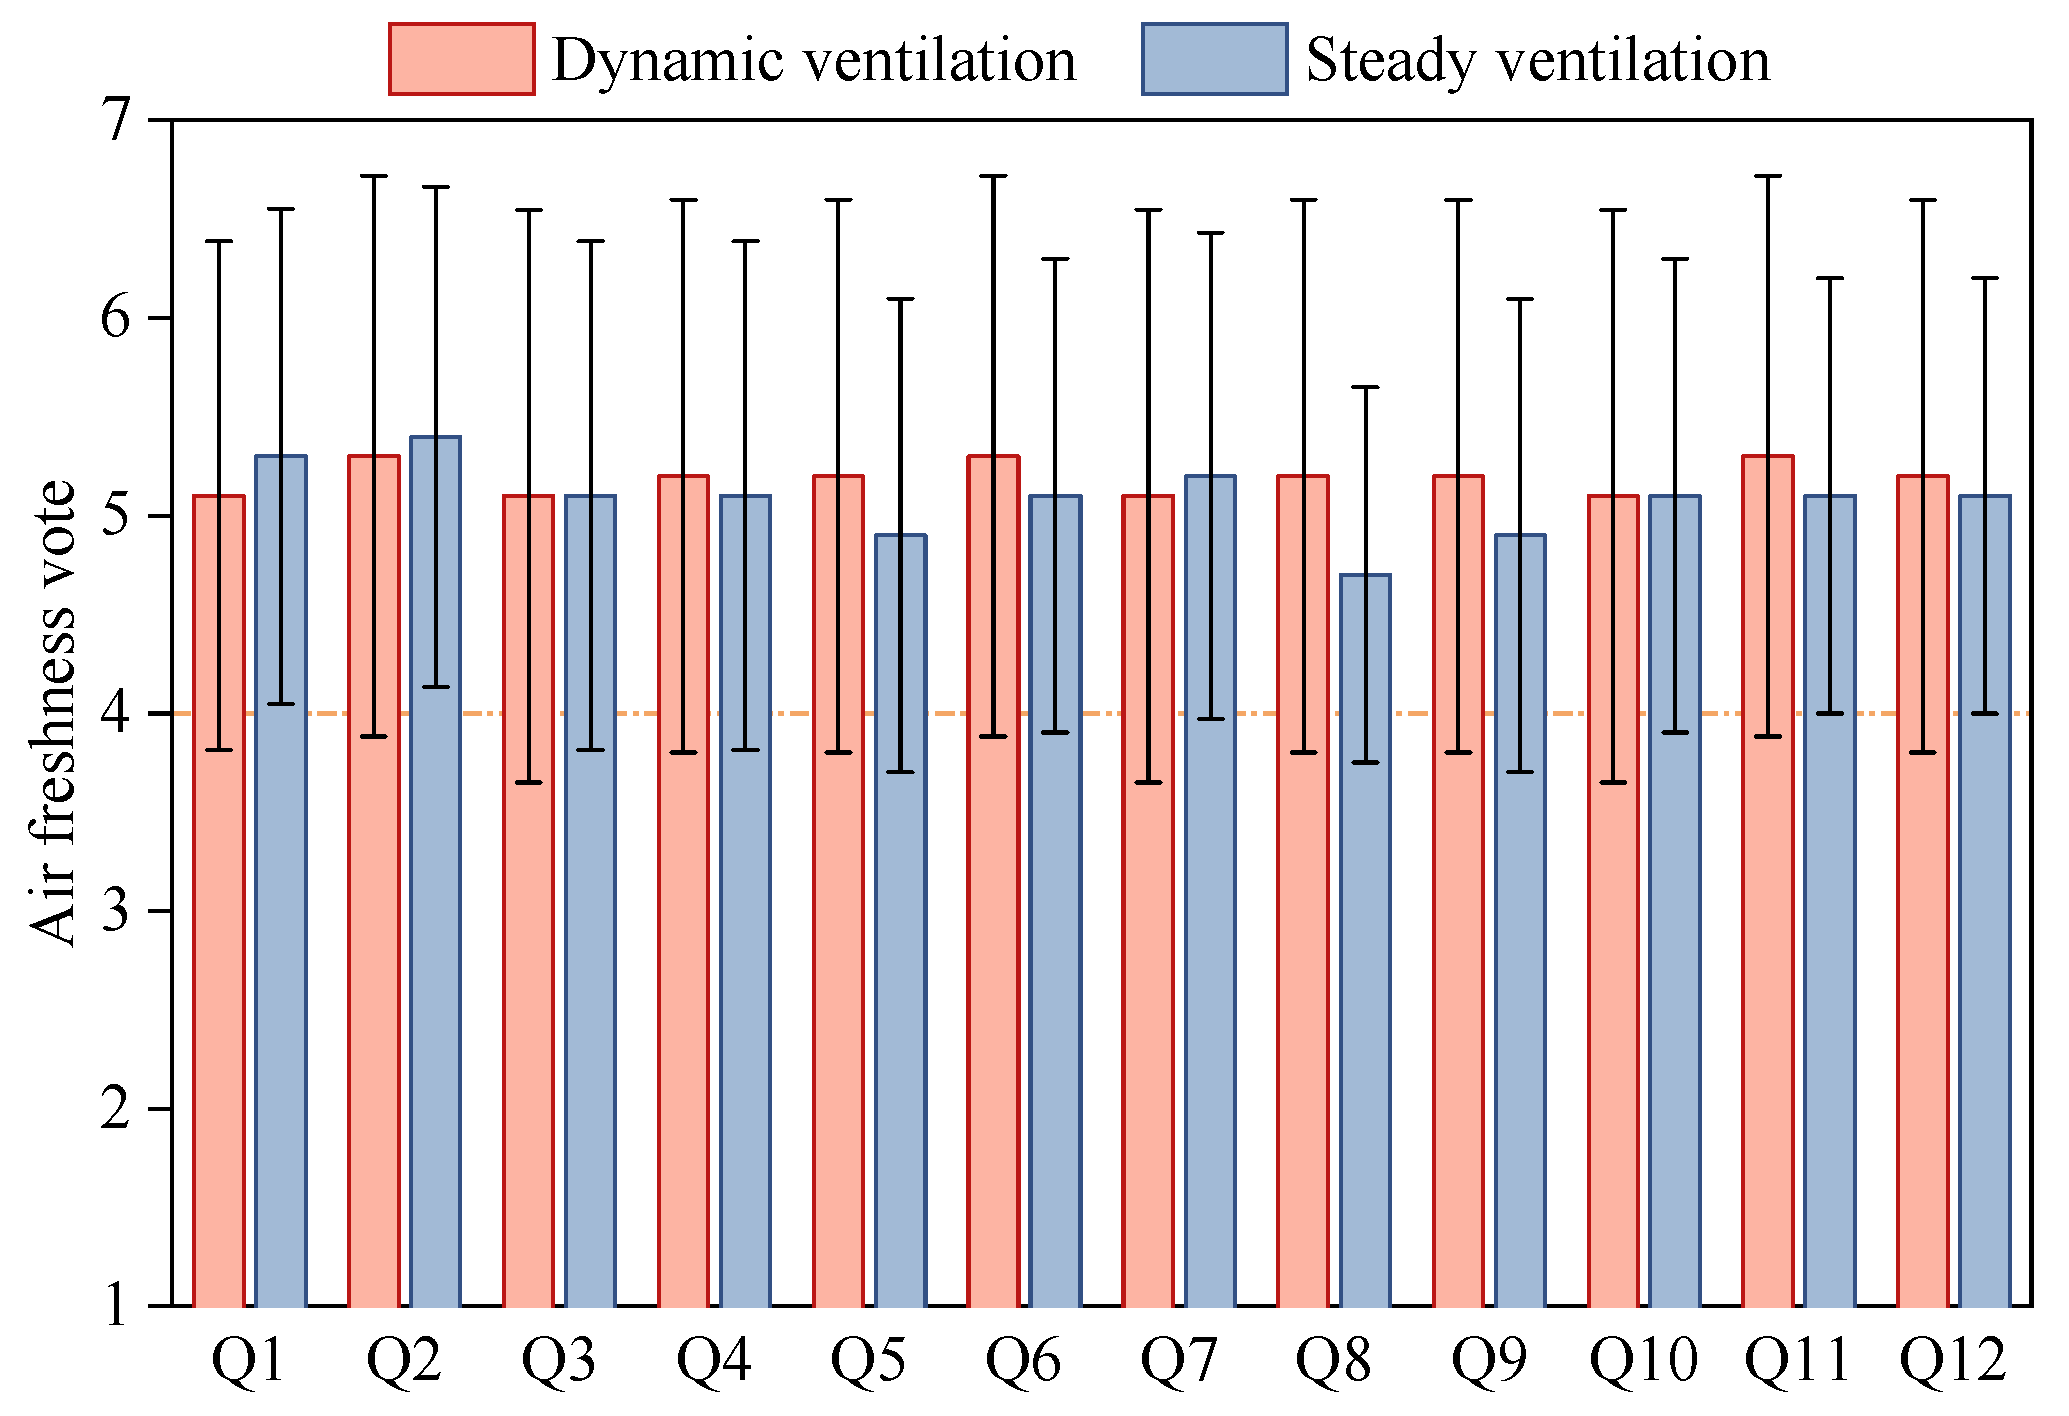
Section 3 primarily presents the results of subjective thermal environment surveys. It further explores subjects’ perceptions of air quality and acoustic environment under both dynamic ventilation and steady ventilation modes. Figure 14 shows the voting statistics results of the average perceived air quality of the subjects. It can be seen that the 95% confidence interval results of the dynamic ventilation and steady ventilation are both greater than (with higher values indicating better air quality, and four representing a moderate level as marked by the orange dotted line), which indicates that both ventilation methods maintained good indoor air quality during the experiment. Dynamic ventilation enhances indoor turbulent mixing, enabling fresh air to be delivered more efficiently to the breathing zone while accelerating the dilution and dispersion of pollutants. This process contributes to improved perceived air quality [41]. Moreover, the fluctuating airflow patterns under dynamic ventilation mimic the rhythm of natural wind, which is more likely to be associated—at a psychological level—with sensations of freshness [42]. Such associations may reinforce subjects’ perception of the air as cleaner and more pleasant, leading to more favorable subjective evaluations.
“Do you perceive any noise in the room?” This question is designed to assess subjects’ subjective perception of the acoustic environment during the experiment. Subjects rate the perceived noise level on a Likert five-point scale: (1) no noise, (2) slight noise, (3) noticeable noise, (4) loud noise, (5) unbearable noise. Figure 15 illustrates the acoustic ratings reported under both dynamic ventilation and steady ventilation. The results indicate that the perceived noise levels are generally higher in dynamic ventilation mode than in steady ventilation mode. This is primarily attributed to the intermittent operation of the fan in dynamic ventilation mode, which reduces the continuous exposure to noise generated by the fan. Compared to steady ventilation mode—where the fan operates continuously—the non-continuous operation effectively decreases cumulative noise exposure and mitigates auditory fatigue, thereby lowering the perceived noise level [43].
The subjective survey results indicate that dynamic ventilation mode provides a favorable indoor environment across multiple dimensions. Subjects report thermally neutral and comfortable conditions, with less variability in thermal sensation responses compared to steady ventilation. Perceived air quality is also rated higher under dynamic ventilation, likely due to enhanced airflow mixing and psychological associations with natural wind patterns. Importantly, the acoustic environment is perceived more favorably under dynamic ventilation. The intermittent operation of the fan helps to reduce continuous noise exposure and auditory fatigue, resulting in lower perceived noise levels than under steady ventilation. These findings suggest that dynamic ventilation not only maintains thermal comfort but also supports positive perceptions of air quality and acoustic conditions.

5. Future Studies

Dynamic ventilation strategies that rely solely on variations in supply velocity are prone to exceeding the upper limit of acceptable air velocity in the occupied zone. As a result, the allowable range of velocity fluctuations is constrained, which significantly limits the cooling effect of dynamic airflow. Therefore, future research should explore low-frequency dynamic ventilation strategies that combine both supply temperature and velocity, aiming to enhance the cooling effectiveness of dynamic ventilation. Additionally, future studies may extend the application of dynamic ventilation to different indoor environments to assess its effectiveness across various spatial and occupancy scenarios.

6. Conclusions

This study investigates the thermal comfort performance of a dynamic ventilation strategy characterized by a fluctuating supply air velocity (1.6 m/s to 2.2 m/s), a constant supply temperature of 25 °C, and a pulsing period of 180 s. Subjective evaluations and objective measurements are conducted in a controlled and consistent experimental environment to minimize environmental variability between participants. Based on data collected from the recruited participants during the 2 h experimental period, the key findings from both subjective perceptions and physiological measurements can be summarized as follows:
(1)
Dynamic ventilation is capable of maintaining the participants in a thermally neutral environment, which further reduces thermal sensation votes for the upper arm, forearm, and hand to −0.1, −0.4, and −0.3, respectively.
(2)
The intensified convective heat exchange coupled with the rhythmic stimulation of cutaneous cold receptors generates a stronger and more sustained cooling effect, which in turn results in a noticeable reduction in skin temperature under dynamic ventilation.
(3)
Dynamic ventilation completely eliminates draft-related dissatisfaction, with the draft rate decreasing from 10% under steady ventilation to 0% under dynamic ventilation.
These findings confirm that dynamic ventilation offers notable advantages in improving thermal comfort and reducing draft risk. The results provide theoretical and empirical support for incorporating dynamic airflow strategies into the design and operation of energy-efficient ventilation systems.

Author Contributions

Conceptualization, C.L. and S.Z.; methodology, J.J.; software, J.J., Y.Y. (Yan Yan), Y.Y. (Yue Yin), and M.G.; formal analysis, C.L. and J.L. (Jing Ling); investigation, J.L. (Jing Li); resources, C.L., J.L. (Jing Ling), and J.L. (Jing Li); data curation, J.J.; writing—review and editing, C.L., J.L. (Jing Ling), and J.J.; visualization, J.J., Y.Y. (Yan Yan), Y.Y. (Yue Yin), and M.G.; supervision, C.L. and S.Z.; project administration, C.L., J.L. (Jing Ling), J.L. (Jing Li), and S.Z. All authors have read and agreed to the published version of the manuscript.

Funding

This research was funded by Qingdao Haier Air Conditioner Co., LTD (Project No. 202403123), the National Natural Science Foundation of China (Project Nos. 52208127), and the Top Young Talent Programme of Xi’an Jiaotong University (Project No. 011900/11305225030703).

Data Availability Statement

The datasets generated and analyzed during the current study are available from the corresponding author on reasonable request.

Conflicts of Interest

Author Chunfeng Lao, Jing Ling, Jing Li, Yan Yan, Yue Yin and Mingliang Gu were employed by the company Qingdao Haier Air Conditioner Co., Ltd.; National Engineering Research Center of Digital Home Networking. The remaining authors declare that the research was conducted in the absence of any commercial or financial relation-ships that could be construed as a potential conflict of interest.

Appendix A

The following includes the pre-experiment demographic questionnaire used to collect participants’ personal information (Questionnaire A1), as well as the subjective evaluation questionnaire administered during the experiment (Questionnaire A2).
I. Questionnaire A1: Basic Information of Participants
1. Name: _______________________________
2. Gender: ______________________________
3. Age: _________________________________
4. Height (cm): __________________________
5. Weight (kg): ___________________________
6. Your current clothing—Upper body: _________________________________
7. Your current clothing—Lower body: _________________________________
8. Your current clothing—Underwear: _________________________________
II. Questionnaire A2: Thermal Comfort Evaluation Questionnaire
1. Name: _______
2. Questionnaire number: ________
3. Your current overall thermal sensation (Single answer only):
□ Cold
□ Cool
□ Slightly cool
□ Neutral
□ Slightly warm
□ Warm
□ Hot
4. Your current local thermal sensation (Single answer only):
Body PartColdCoolSlightly CoolNeutralSlightly WarmWarmHot
Forehead
Chest
Back
Upper arm
Forearm
Hand
Thigh
Calf
Foot
5. Your current overall satisfaction with air movement (Single answer only):
□ Very dissatisfied
□ Dissatisfied
□ Slightly dissatisfied
□ Acceptable
□ Slightly satisfied
□ Satisfied
□ Very satisfied
6. Your current overall air movement acceptability (Single answer only):
□ Very unacceptable
□ Unacceptable
□ Neutral
□ Acceptable
□ Very acceptable
7. What is your air movement preference at the moment (Single answer only)?
□ Stronger
□ No change
□ Weaker
8. How would you rate the current air quality (Single answer only)?
□ Very poor
□ Poor
□ Fairly poor
□ Neutral
□ Fairly good
□ Good
□ Very good
9. Do you think there is noise in the room (Single answer only)?
□ No noise
□ Slight noise
□ Noticeable noise
□ Loud noise
□ Unbearable noise

References

  1. Shahzad, S.; Calautit, J.K.; Aquino, A.I.; Nasir, D.S.; Hughes, B.R. Neutral thermal sensation or dynamic thermal comfort? Numerical and field test analysis of a thermal chair. Energy Procedia 2017, 142, 2189–2194. [Google Scholar] [CrossRef]
  2. Tian, X.; Lin, Z. Dynamic modelling of air temperature in breathing zone with stratum ventilation using a pulsating air supply. Build. Environ. 2022, 210, 108697. [Google Scholar] [CrossRef]
  3. Hua, J.; Ouyang, Q.; Wang, Y.; Li, H.; Zhu, Y. A dynamic air supply device used to produce simulated natural wind in an indoor environment. Build. Environ. 2012, 47, 349–356. [Google Scholar] [CrossRef]
  4. Huang, L.; Ouyang, Q.; Zhu, Y. Perceptible airflow fluctuation frequency and human thermal response. Build. Environ. 2012, 54, 14–19. [Google Scholar] [CrossRef]
  5. Li, J.; Zhou, S.; Yu, Y.; Niu, J. Effects of dynamic airflows on convective cooling of human bodies− Advances in thermal comfort assessment and engineering design. Energy Build. 2024, 324, 114924. [Google Scholar] [CrossRef]
  6. Zhao, H.; Ji, W.; Deng, S.; Wang, Z.; Liu, S. A review of dynamic thermal comfort influenced by environmental parameters and human factors. Energy Build. 2024, 318, 114467. [Google Scholar] [CrossRef]
  7. Yang, B.; Melikov, A.K.; Kabanshi, A.; Zhang, C.; Bauman, F.S.; Cao, G.; Awbi, H.; Wigö, H.; Niu, J.; Cheong, K.W.D. A review of advanced air distribution methods-theory, practice, limitations and solutions. Energy Build. 2019, 202, 109359. [Google Scholar] [CrossRef]
  8. Tian, X.; Zhang, S.; Lin, Z.; Li, Y.; Cheng, Y.; Liao, C. Experimental investigation of thermal comfort with stratum ventilation using a pulsating air supply. Build. Environ. 2019, 165, 106416. [Google Scholar] [CrossRef]
  9. Schlader, Z.J.; Simmons, S.E.; Stannard, S.R.; Mündel, T. The independent roles of temperature and thermal perception in the control of human thermoregulatory behavior. Physiol. Behav. 2011, 103, 217–224. [Google Scholar] [CrossRef] [PubMed]
  10. Zhu, Y.; Luo, M.; Ouyang, Q.; Huang, L.; Cao, B. Dynamic characteristics and comfort assessment of airflows in indoor environments: A review. Build. Environ. 2015, 91, 5–14. [Google Scholar] [CrossRef]
  11. Zhou, S.; Yu, Y.; Kwok, K.C.; Niu, J. Onsite measurements of pedestrian-level wind and preliminary assessment of effects of turbulence characteristics on human body convective heat transfer. Energy Build. 2024, 318, 114448. [Google Scholar] [CrossRef]
  12. Zhou, X.; Ouyang, Q.; Lin, G.; Zhu, Y. Impact of dynamic airflow on human thermal response. Indoor Air 2006, 16, 348–355. [Google Scholar] [CrossRef]
  13. Li, Z.; Zhou, B.; Yang, B.; Li, H.; Jin, D.; Wang, F. Occupant thermal and draft perceptions under various intermittent regimes of an intermittent air jet strategy. Build. Environ. 2024, 262, 111839. [Google Scholar] [CrossRef]
  14. Ren, G.; Liu, J.; Wan, J.; Li, F.; Guo, Y.; Yu, D. The analysis of turbulence intensity based on wind speed data in onshore wind farms. Renew. Energy 2018, 123, 756–766. [Google Scholar] [CrossRef]
  15. Du, C.; Liu, H.; Yu, W.; Ji, Y.; Yan, K.; Ruan, L. Characteristics and comfort evaluation of sinusoidal airflows by regulating motor rotating frequency of a floor fan. Build. Simul. 2022, 15, 1035–1049. [Google Scholar] [CrossRef]
  16. Wang, K.; Xie, Z.; Xiao, Y.; Zhou, X.; Luo, M. Spatial Distribution of Dynamic Characteristics of Fan Airflows and Their Impact on Thermal Comfort. Buildings 2025, 15, 308. [Google Scholar] [CrossRef]
  17. Zhou, B.; Li, Z.; Yang, B.; Li, X.; Wang, F.; Wei, S. Thermal and draught perception in fluctuating stratified thermal environments with intermittent impinging jet ventilation. Build. Environ. 2023, 229, 109934. [Google Scholar] [CrossRef]
  18. Faul, F.; Erdfelder, E.; Buchner, A.; Lang, A.-G. Statistical power analyses using G* Power 3.1: Tests for correlation and regression analyses. Behav. Res. Methods 2009, 41, 1149–1160. [Google Scholar] [CrossRef]
  19. Faul, F.; Erdfelder, E.; Lang, A.-G.; Buchner, A. G* Power 3: A flexible statistical power analysis program for the social, behavioral, and biomedical sciences. Behav. Res. Methods 2007, 39, 175–191. [Google Scholar] [CrossRef]
  20. Pan, J.; Li, N.; Zhang, W.; He, Y.; Hu, X. Investigation based on physiological parameters of human thermal sensation and comfort zone on indoor solar radiation conditions in summer. Build. Environ. 2022, 226, 109780. [Google Scholar] [CrossRef]
  21. Zhang, S.; Jiang, J.; Lin, Z. Time length of adaptation phase for subjective thermal environment evaluation based on thermal stability time. Build. Environ. 2025, 267, 112283. [Google Scholar] [CrossRef]
  22. ANSI/ASHRAE Standard 55-2023; Thermal Environmental Conditions for Human Occupancy. ASHRAE: Atlanta, GA, USA, 2023.
  23. Saiko, G. Skin temperature: The impact of perfusion, epidermis thickness, and skin wetness. Appl. Sci. 2022, 12, 7106. [Google Scholar] [CrossRef]
  24. Luo, M.; Ji, W.; Cao, B.; Ouyang, Q.; Zhu, Y. Indoor climate and thermal physiological adaptation: Evidences from migrants with different cold indoor exposures. Build. Environ. 2016, 98, 30–38. [Google Scholar] [CrossRef]
  25. Liu, W.; Lian, Z.; Deng, Q. Use of mean skin temperature in evaluation of individual thermal comfort for a person in a sleeping posture under steady thermal environment. Indoor Built Environ. 2015, 24, 489–499. [Google Scholar] [CrossRef]
  26. Liu, W.; Lian, Z.; Deng, Q.; Liu, Y. Evaluation of calculation methods of mean skin temperature for use in thermal comfort study. Build. Environ. 2011, 46, 478–488. [Google Scholar] [CrossRef]
  27. Wigö, H. Technique and Human Perception of Intermittent Air Velocity Variation; KTH Royal Institute of Technology: Stockholm, Sweden, 2005. [Google Scholar]
  28. Tian, X.; Li, B.; Cheng, Y. Experimental study into turbulent characteristics of airflows under stratum ventilation with pulsating air supply: Comparison to steady air supply. IOP Conf. Ser. Earth Environ. Sci. 2019, 295, 042078. [Google Scholar] [CrossRef]
  29. Tian, X.; Li, B.; Liao, C.; Cheng, Y. Experimental comparison on dynamic characteristics of the airflows produced by pulsating and steady air supply under stratum ventilation. IOP Conf. Ser. Mater. Sci. Eng. 2019, 609, 032020. [Google Scholar] [CrossRef]
  30. Uğursal, A.; Culp, C.H. The effect of temperature, metabolic rate and dynamic localized airflow on thermal comfort. Appl. Energy 2013, 111, 64–73. [Google Scholar] [CrossRef]
  31. Parkinson, T.; Zhang, H.; Arens, E.; He, Y.; de Dear, R.; Elson, J.; Parkinson, A.; Maranville, C.; Wang, A. Predicting thermal pleasure experienced in dynamic environments from simulated cutaneous thermoreceptor activity. Indoor Air 2021, 31, 2266–2280. [Google Scholar] [CrossRef]
  32. Buonocore, C.; De Vecchi, R.; Lamberts, R.; Güths, S. From characterisation to evaluation: A review of dynamic and non-uniform airflows in thermal comfort studies. Build. Environ. 2021, 206, 108386. [Google Scholar] [CrossRef]
  33. Luo, M.; Wang, Z.; Zhang, H.; Arens, E.; Filingeri, D.; Jin, L.; Ghahramani, A.; Chen, W.; He, Y.; Si, B. High-density thermal sensitivity maps of the human body. Build. Environ. 2020, 167, 106435. [Google Scholar] [CrossRef]
  34. Lv, Y.-G.; Liu, J. Effect of transient temperature on thermoreceptor response and thermal sensation. Build. Environ. 2007, 42, 656–664. [Google Scholar] [CrossRef]
  35. Wu, Y.; Cao, B. Recognition and prediction of individual thermal comfort requirement based on local skin temperature. J. Build. Eng. 2022, 49, 104025. [Google Scholar] [CrossRef]
  36. Zhang, H.; Arens, E.; Huizenga, C.; Han, T. Thermal sensation and comfort models for non-uniform and transient environments, part III: Whole-body sensation and comfort. Build. Environ. 2010, 45, 399–410. [Google Scholar] [CrossRef]
  37. Song, W.; Zhong, F.; Calautit, J.K.; Li, J. Exploring the role of skin temperature in thermal sensation and thermal comfort: A comprehensive review. Energy Built Environ. 2025, 6, 762–781. [Google Scholar] [CrossRef]
  38. Arens, E.A.; Zhang, H. The Skin’s Role in Human Thermoregulation and Comfort; Woodhead Publishing Ltd.: Cambridge, UK, 2006; pp. 560–602. [Google Scholar]
  39. Ouzzahra, Y.; Havenith, G.; Redortier, B. Regional distribution of thermal sensitivity to cold at rest and during mild exercise in males. J. Therm. Biol. 2012, 37, 517–523. [Google Scholar] [CrossRef]
  40. Roth, J.; Heiselberg, P.; Zhang, C. Thermal comfort and risk of draught with natural ventilation-assessment methods, experiences and solutions. In Proceedings of the 43rd AIVC-11th TightVent & 9th venticool Conference: Ventilation, IEQ and Health in Sustainable Buildings, Copenhagen, Denmark, 4–5 October 2023; pp. 780–789. [Google Scholar]
  41. Fan, M.; Fu, Z.; Wang, J.; Wang, Z.; Suo, H.; Kong, X.; Li, H. A review of different ventilation modes on thermal comfort, air quality and virus spread control. Build. Environ. 2022, 212, 108831. [Google Scholar] [CrossRef]
  42. Gao, R.; Zheng, Q.; Liu, M.; Zhang, Z.; Jing, R.; Che, L.; Liu, Y. Study on simulated natural wind based on spectral analysis. Build. Environ. 2022, 209, 108645. [Google Scholar] [CrossRef]
  43. Love, J.; Sung, W.; Francis, A.L. Psychophysiological responses to potentially annoying heating, ventilation, and air conditioning noise during mentally demanding work. J. Acoust. Soc. Am. 2021, 150, 3149–3163. [Google Scholar] [CrossRef] [PubMed]
Figure 1. Schematic plan of the environmental chamber interior layout.
Buildings 15 02871 g001
Figure 2. Schematic diagram of the experimental procedure.
Buildings 15 02871 g002
Figure 3. Diagram of skin temperature measurement sites.
Buildings 15 02871 g003
Figure 4. Air velocity and air temperature at the supply vent: (a) air velocity; (b) air temperature.
Buildings 15 02871 g004
Figure 5. Air velocity and temperature distributions in the occupied zone of M5 and M6: (a) air velocity; (b) air temperature.
Buildings 15 02871 g005
Figure 6. Air velocity and temperature distributions in the occupied zone of M5: (a) air velocity; (b) air temperature.
Buildings 15 02871 g006
Figure 7. Attenuation of air velocity and air temperature: (a) air velocity; (b) air temperature.
Buildings 15 02871 g007
Figure 8. Overall thermal sensation votes under dynamic ventilation and steady ventilation.
Buildings 15 02871 g008
Figure 9. Mean skin temperature: (a) female participant; (b) male participant.
Buildings 15 02871 g009
Figure 10. Local thermal sensation votes under dynamic ventilation and steady ventilation.
Buildings 15 02871 g010
Figure 11. Participants’ local skin temperatures under dynamic ventilation and steady ventilation: (a) head; (b) chest; (c) upper arm; (d) forearm; (e) hand; (f) thigh; (g) calf; (h) foot; (i) back. Note: In the box plot, the five horizontal lines from top to bottom represent the maximum value, the upper quartile (Q3), the median, the lower quartile (Q1), and the minimum value, respectively. The white rectangle indicates the average value, and the black diamond represents an outlier.
Buildings 15 02871 g011
Figure 12. Voting statistics of the participants’ satisfaction with air velocity.
Buildings 15 02871 g012
Figure 13. Draft rate under dynamic ventilation and steady ventilation.
Buildings 15 02871 g013
Figure 14. Mean air freshness votes under dynamic ventilation and steady ventilation.
Buildings 15 02871 g014
Figure 15. Acoustic environment votes under dynamic ventilation and steady ventilation.
Buildings 15 02871 g015
Table 1. Detailed information on experimental instrument.
InstrumentsParameterLocationHeightRangeAccuracy
WWFWZY-1Air temperature
Air velocity
M1–M61.3 m (M1–M2)
0.1 m (M3–M4)
1.1 m (M5–M6)
−20–80 °C
0.05–30 m/s
±0.5 °C
±0.05 m/s
WWSZY-1Air temperature
Relative humidity
M1–M20.2 m (M1–M2)−40–100 °C
0–100%
±0.3 °C
±3%
WHQZY-1Global temperatureM71.1 m (M7)−20–80 °C±0.3 °C
DS1922L-F5# iButton sensorsSkin temperature--−40–85 °C±0.5 °C
Table 2. Basic information on participants.
GenderAge (Years)Height (cm)Weight (kg)
Male24.6 ± 2.5173.83 ± 2.9477.65 ± 8.83
Female24.0 ± 1.0163.94 ± 7.5754.37 ± 7.03
Disclaimer/Publisher’s Note: The statements, opinions and data contained in all publications are solely those of the individual author(s) and contributor(s) and not of MDPI and/or the editor(s). MDPI and/or the editor(s) disclaim responsibility for any injury to people or property resulting from any ideas, methods, instructions or products referred to in the content.