Abstract
The air source heat pump coupled with energy storage system is a key technology for flexibly utilizing clean energy. The capacity configuration parameters and control strategies of this coupled system are two important aspects that significantly affect its performance. In order to explore the methods of setting configuration parameters and provide reasonable operation strategies, a simulation model of the coupled system under a time-of-use electricity pricing strategy is established and verified with measured data. Through multi-objective optimization of the system, configuration schemes considering economy, energy saving, and flexibility are given. Subsequently, based on the load prediction model, an optimal control strategy is proposed with the objective function of minimizing the operating cost. The optimization amplitude of the schemes considering the three indicators reached 11.09%, 13.37%, and 29.03%, respectively. Under the proposed control strategies, the typical daily electricity consumption decreased by 14.65% to 24.06%, and the operating electricity cost is saved by approximately 17.32%. By reasonably designing the parameters of the coupled system, its economic, energy-saving performance, and flexibility can be improved by more than 11% compared to a system designed using traditional methods. By adopting the control strategy based on hourly load prediction, the operating cost can be reduced significantly.
1. Introduction
Currently, in the face of challenges such as energy security, environmental protection, and climate change, the international community generally believes that accelerating the development of new energy is a necessary measure to promote the transformation of the energy structure and address global climate change. Air source heat pump (ASHP) systems use electricity and the heat in the air for heating and have great potential for application in clean heating. Moreover, due to the characteristic of large thermal inertia of ASHPs, they can participate in the demand response of the power system [1]. During operation, ASHPs need to absorb heat from the outside, and their performance deteriorates when the ambient temperature is low [2,3], and their operational stability also decreases [4]. In addition, in low-temperature and high-humidity environments, the outdoor heat exchanger of ASHPs also has the risk of frosting, further deteriorating their performance [5,6]. To make ASHPs operate more stably and with higher performance, they can be combined with thermal energy storage (TES) devices. On the one hand, this can enable ASHPs to operate as much as possible at higher temperatures and store heat, reducing the number of operation times during low-temperature periods [7,8] and using the stored heat for heating, such as by storing heat during the day and releasing it at night [9,10], thereby improving their performance. On the other hand, after adding TES devices, the system is more conducive to participating in the peak shaving and valley filling of the power system and can respond promptly to user-side demands [10,11].
The water tank is the simplest heat storage device, with a simple structure and low cost. However, the heat it stores or releases is sensible heat and generally requires a large volume [12]. Currently, phase change materials (PCMs) have been widely used for heat storage [13,14]. PCM tanks can store or release sensible heat and latent heat, and under the same amount of heat storage capacity, the required volume is smaller than that of the water tank [14,15]. Regardless of the type of TES, when coupled with ASHPs, appropriate configuration and reasonable control strategies are required to fully utilize the advantages of the system. The configuration parameters and control strategies of the ASHP-coupled TES system have a significant impact on the efficiency and stable operation of the system. The optimization control strategy, combined with conventional control strategies and optimization control methods, aims to overcome the phenomenon of control delay and improve the stability and effectiveness of the power peak-shifting and valley-filling strategy.
Ettorre et al. [16] conducted an assessment on buildings equipped with ASHPs and water thermal storage systems. They compared two configurations with and without TES. Their research results showed that the cost-effectiveness of installing TES was significant. The thermal storage tank enabled the system to operate the heat pump during periods with lower electricity rates, thereby saving up to 8% of costs. Compared with the configuration without TES, CO2 emissions were reduced by 13%. From their research, it can be found that the storage capacity and the capacity of the heat pump are interdependent: the capacity of the heat pump affects the time required for charging the storage, which in turn affects the ability to utilize favorable operating periods throughout the day. On the other hand, the storage capacity limits the energy that can be transferred. The optimal capacity strategies based on these two perspectives should be further studied. In order to better determine the size of the water tank, Lyu et al. [8] conducted a simulation on the TRNSYS platform to study the variation in system performance with the volume of the water tank under certain load demands in the ASHP-coupled water tank system. The results showed that the existence of the water tank could significantly reduce the start–stop frequency of the ASHP, thereby reducing the start–stop losses. As the volume of the water tank increased, the energy-saving rate of the system also increased, and it remained unchanged after reaching a certain level, while when the capacity of the ASHP varied between 80% and 100%, the energy-saving rate of the system remained almost unchanged. From this, it can be concluded that the capacity of the energy storage device in the coupled system is a key parameter affecting the system performance [8,17], and the capacity configuration of the ASHP does not need to be further studied.
In terms of control strategies, there are control schemes that start and stop at different time periods [10,11], control strategies that combine electricity prices [18], and control strategies based on demand response or indoor thermal comfort [19]. Among them, there are applications of machine learning algorithms. Wu et al. [10] conducted an experimental study on the long-term operating characteristics of an ASHP coupled with a water tank thermal storage system. This system adopts a control strategy of starting up during the day and using the water tank for heat storage at night and then using the water tank for heating at night. The test results over 4 months show that, under this control strategy, the average coefficient of performance (COP) of the system increased by 14.0% per day, and the seasonal performance coefficient (SCOP) increased by 26.1%. Jin et al. [20] conducted a detailed study on the latent heat storage system of heat pumps from the perspectives of capacity matching of heat storage materials and operation strategies. Their research results show that phase change materials with a phase change temperature of 40–50 °C have good performance in terms of energy saving and economic efficiency. In addition, they compared the energy consumption and economic performance of the system under different operation strategies. The operation strategy of the ASHP at night shows good performance in reducing peak loads and reducing operating electricity costs, while the efficiency enhancement strategy during the day performs well in energy saving. Compared with electric heaters, the average investment payback period of this system is 7.73 years, and carbon emissions are reduced by 52.5%. Langner et al. [18] adopted the Extended Price Storage Control strategy to control the heat pump, which could reduce the peak load of the power system and decrease the electricity cost. Andreas et al. [21] coupled an ASHP with a PCM tank and photovoltaic, analyzed the economic performance of the system under different control strategies, and combined them into a comprehensive control method, to extend the operation time of the heat pump and photovoltaic cells as much as possible. They proposed that the combination of 5 kW photovoltaic power generation, and a 1 m3 phase change storage tank was the optimal one. Under this combination, the shortest payback period of cost was 17.1 years, and 2400 kW·h of electricity consumption was reduced compared with the previous optimization, which decreased by 29%. Meng et al. [22] proposed a demand response method combining active cold storage and global temperature regulation and tested it on the full-scale variable air volume (VAV) air conditioning test bench. Their experimental results showed that the energy storage tank could effectively reduce the start–stop times of the heat pump. Simulation confirmed that the new control method could also effectively reduce the peak load of the power grid and had little impact on the thermal comfort of energy consumers. Compared with the conventional operation mode (no energy storage during other periods), if the new control strategy is adopted, the cost-saving rate throughout the summer season can reach 7.02%. Based on the local time-of-use electricity price, Jiang et al. [23] proposed to fully utilize the thermal inertia of buildings to achieve the purpose of energy storage. Under the premise of meeting the comfort requirements, the minimum heating season operating electricity cost was set as the objective function, and the optimal heat storage temperature and time were determined by using machine learning algorithms. The optimization results showed that the operating cost of the optimal strategy was saved by 3.1–4.1%. Meng et al. [7,22] utilized the artificial neural network to predict the air conditioning load and formulated the corresponding demand response strategy according to the predicted load. The optimal model for predicting the air conditioning load was obtained by using TRNSYS 18, and the Elman neural network was used to predict the storage and release energy duration of the energy storage tank. Based on the load prediction and the prediction results of the storage and release energy duration, a demand response strategy combining active energy storage and global temperature regulation was formulated. The results showed that, compared with the traditional response strategy, the electricity consumption during the demand response period was the least under the premise of meeting the comfort requirements, and the total operation cost was the lowest throughout the day.
To sum up, at present, research on the optimization of control strategies for energy storage ASHPs adopts the idea of balance and matching of supply and demand to achieve the goal of energy conservation and optimization. The difficulty lies in the quantification of user demands. It can be seen that, currently, scholars often adopt the method of using artificial neural networks to predict load to clarify the demand of the energy system and adjust the daily operating parameters dynamically according to the demand. The performance of ASHPs is affected by external factors such as weather and load, and there are relatively few related studies on the hourly optimization of control strategies for ASHPs in existing research. Therefore, further research is necessary.
The existing research on energy storage ASHPs often focuses on two aspects: the matching problem of system capacity and the optimization research of system control strategies. Although some progress has been made in these two fields, there are still some problems and challenges.
The existing research on multi-objective optimization of ASHP coupled with TES systems lacks comprehensive consideration of economy, energy saving, and flexibility. In the current studies, the optimization objectives for capacity configuration of the system mostly focus on the single system cost or energy consumption. However, in the energy storage system, the economy, energy saving, and energy utilization flexibility of the system are all important indicators for evaluating the energy storage system. Moreover, there are few related studies on the coupling of multi-objective optimization in the existing research.
Research on hourly optimization of control strategies in the field of ASHPs is relatively scarce, and there is a problem of excessive variables. In the optimization of system control strategies, the traditional control strategies mainly adopt the proportion integration differentiation (PID) control mode, which has the main drawback of its delay. Measures must be taken in advance, so the load prediction of the heat pump system becomes particularly crucial. The conventional control strategies for ASHP systems are greatly affected by the real-time changes in the external environment. Therefore, it is necessary to adjust the operating parameters of the system in advance according to the load prediction. Currently, the optimization methods for the control strategies of energy storage ASHPs mainly include two forms: optimization of storage operation parameters and hourly optimization. Among them, hourly optimization has the problem that it cannot adjust the operation strategy according to the real-time changes in outdoor load, while the optimization of storage operation parameters has the problem of excessive optimization variables and long optimization time. Further research is needed to solve these problems.
In order to fill the gaps in the existing research, this paper takes the actual experimental system as the starting point, and through the construction of a simulation model of the ASHP coupled with TES system based on the time-of-use electricity price operation strategy, it reveals the operating characteristics of the system and the influencing mechanism of the coupled system. Starting from the aspects of economy, energy saving, and flexibility, it analyzes the influence of energy storage configuration parameters on the system performance and conducts optimization research on the control strategy. The main research contents are as follows:
- (1)
- Analysis and optimization research on the influence of energy storage capacity configuration parameters of the ASHP coupled with the TES system on system performance.
An optimization study on the energy storage capacity configuration of the system was carried out. Based on the transient simulation model, the influence laws of different energy storage capacity configuration parameters on the system performance were explored. With economic efficiency, energy saving, and flexibility as the goals, the energy storage capacity configuration parameters were taken as variables, and the NSGA-II intelligent optimization algorithm was used to obtain a series of Pareto frontier solution sets to measure the sensitivity of each variable to the three objectives, providing guidance solutions to meet different design requirements.
- (2)
- Optimization research on ASHP coupling energy storage control strategy.
The control strategy of the system was optimized. Firstly, a load prediction model was established based on a particle swarm optimization–long short-term memory (PSO-LSTM) neural network to achieve precise regulation of the system flow. To solve the problem of excessive optimization variables in hourly optimization, a new method for hourly optimization of the control strategy applicable to the ASHP coupled with the TES system was proposed based on the load prediction and the operating characteristics of time-of-use electricity prices. The variables included hourly operating parameters, energy storage duration, and temperature. The purpose was to reduce the dimension of optimization variables and minimize the operation cost. Finally, the optimization effect of this method under different typical daily conditions and throughout the heating season was studied.
2. Model Establishment
2.1. System Model
The schematic diagram of the ASHP-coupled TES system model studied in this paper is shown in Figure 1. Two TES systems are used, namely, phase change storage tanks and water tanks. According to Ref. [24], when the water tank and TES are used in series, the system performance is better than when they are used in parallel. Therefore, the equipment is arranged as shown in Figure 1. When TES releases heat (the ASHP is not operating, valve 1 is closed, other valves are open, and both pumps are on), TES and the water tank are in a series configuration. In the system, the ASHP used is an integrated modular unit, and the system is divided into two parts with common through the water tank, namely, the heat source side and the load side. The system can be controlled to operate in heating, heat storage, etc. modes by the switching of valves 0 to 4. The location of the system is in Xi’an, China, and the rooms are offices.
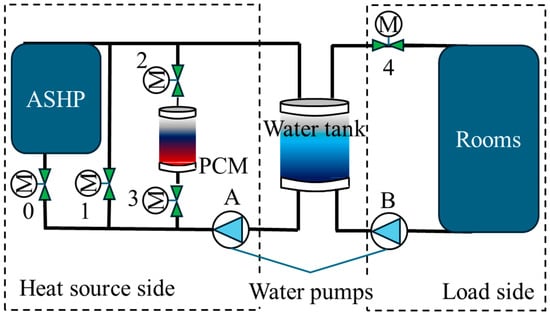
Figure 1.
System model diagram.
The ASHP, water pumps, water tanks, and room models in the system are established based on the mature modules in TRNSYS 18. Among them, the meteorological parameters in the building model are derived from DEST 2.0. The COP and heating capacity of ASHP are mainly related to the ambient air temperature and the inlet water temperature, and the calculation method is referred to in Ref. [25]. The water flow rate of the water pumps is determined by Equation (1):
where Qload is heating load, kW; Mw is mass flow rate of circulating water, kg/h; ΔT is temperature difference between supply and return water, °C, determined as 10 °C.
The water tank volume is determined by Equation (2) [26]:
where Vwt is the volume of water tank, m3; ρw is water density, (kg/m3); Qhp is the heating capacity of ASHP, kW; τ is the minimum running time of the ASHP. In this study, the defrosting time was selected, s, and 240 s is taken [27,28].
The energy balance relationship of node x of the water tank is shown in Equation (3) [29]:
where Mx,w is mass of water at node x, kg; Ed is energy that is transferred from the heat source to the water tank, kW; Eloss is energy lost to the environment from the water tank, kW; Ex is energy that is transferred from the water tank to load side, kW.
The model of PCM tank comes from Ref. [30], and its main equations are as follows:
Liquid/solid phase (TPCM > Tm, xPCM = 0, is the liquid phase; TPCM < Tm, xPCM = 1, is the solid phase):
Phase change process (TPCM = Tm, 0 < xPCM < 1):
where T is the average temperature, °C; xPCM is PCM solid fraction; is the effectiveness of the heat exchanger; LH is the latent heat, kJ·kg−1; k is the heat loss coefficient; Atank is the tank surface area, m2; the subscripts PCM, m, air, s, and f represent PCM, melting temperature, air, solid phase, and full load, respectively.
Based on the principle of demand response [11], the system should store heat as much as possible during off-peak electricity hours and release heat as much as possible during peak electricity hours. The system has three modes: (1) Storage mode; no heating is provided to the end-users. (2) Heat release mode; heating to the end-users is provided by the PCM storage tank and water tank, while the ASHP does not operate. (3) Simultaneous storage and heat release mode; heating to the end-users is carried out while storing heat. The local time-of-use electricity price and system control strategy can be explained by Table 1.

Table 1.
System control strategy based on time-of-use electricity price.
2.2. Model Validation
The verification of the PCM storage tank model can be found in Ref. [30]. To validate the system model, an experimental platform was set up in this study. The equipment layout, control strategy, and measurement points were exactly the same as those of the model. The measurement points are shown in Figure 2. The temperature sensor for measuring the outdoor environment temperature is not shown in the figure. Temperature data are recorded once every minute. The measurement instruments and their accuracies are shown in Table 2. The main components and their parameters in the experiment and the main components and parameters in the model are shown in Table 3.
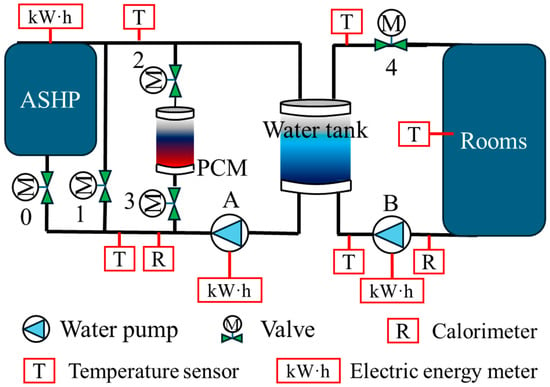
Figure 2.
Experimental system diagram.

Table 2.
Measuring instruments and their accuracy.

Table 3.
Experimental equipment and model parameters.
The coldest day (14 January) was selected for model validation. The verification results of temperature are shown in Figure 3. The dashed lines in the figures are all the simulated values, and the solid lines are the measured values. Taking both thermal comfort and energy conservation into consideration, the indoor temperature in this study was set between 22 and 25 °C.
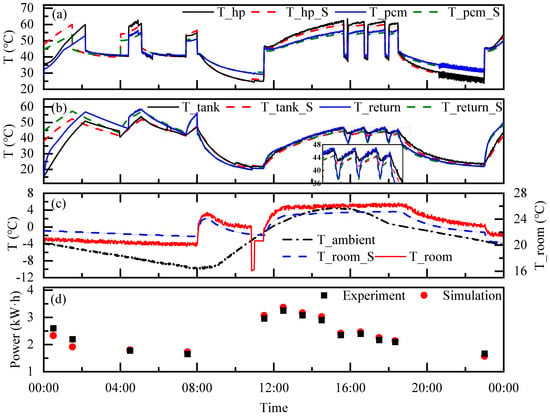
Figure 3.
Results of model validation. ((a) variations of temperatures on the heat source side, (b) variations of temperatures on the load side, (c) variations of ambient temperature and indoor temperature, (d) variations of power consumption).
Figure 3a shows the temperature data on the heat source side, including the outlet temperature of the ASHP and the temperature of the PCM storage tank. Figure 3b compares the temperature data on the load side, including the return water temperature at the end and the water temperature in the water tank, and the water tank temperature is also the return water temperature of the ASHP. Figure 3c shows the ambient temperature and indoor temperature. And Figure 3d shows the verification of power consumption, which is recorded in hours. The simulated values have large deviations from the measured values in the initial stage of this day because the system just started to operate at this time, but the model simulated the state where the system was running stably all the time, so there were large deviations. The simulated values matched well with the measured values after the system was running stably. The abnormal indoor temperature measurement value around 11:00 was caused by the abnormal indoor temperature sensor. For more than 96% of the time, the simulated indoor temperature values were within the set range. In conclusion, the ASHP-coupled TES model established in this study is reliable.
3. Methodology
3.1. Evaluation Indicators
In this study, three evaluation indicators for the system are determined, namely, economy, energy saving, and flexibility, to assess the influence of each energy storage capacity configuration parameter on the system’s various performance indicators. Based on these three evaluation indicators, the system model is optimized for multiple objectives through the multi-objective NSGA-II genetic algorithm. The objective function integrates the system’s economy, carbon emissions, and flexibility for comprehensive evaluation. It is strived to achieve both the optimal economic efficiency and the minimum carbon emissions in the capacity configuration parameters, while also maximizing the flexibility. Eventually, a series of Pareto front compromise solution sets can be obtained, from which schemes under different weights can be selected. The economic indicator of the system adopts the annual cost method [17,31]. It consists of the initial investment and the operating costs of the system. The initial investment includes the purchase costs of ASHPs, phase change storage tanks, water tanks, water pumps, and pipelines, which are 2000 CNY/kW, 14,200 CNY/m3, 1000 CNY/m3, and 2000 CNY, respectively [32]. The initial investment of the system is as follows:
where IC is the initial investment cost, CNY; VPCM is the volume of PCM, m3; Vwt is the volume of water tank, m3.
When the system is running, it only consumes electricity, and the calculation method operating cost of electricity is as follows:
where EC is the electricity cost, CNY; OC is the operation cost, CNY; PRI1/2/3 is electricity prices during three periods, CNY/(kW·h); W1/2/3 is the electricity consumption during three periods, kW·h.
The system cost can be calculated according to Equation (8) [17]:
where C is the annual cost value, CNY; i is the discount rate, set as 7% [17]; n is the useful life, in years, which is 15 years [32] in this study.
The coupled system in this study operates by electricity. Therefore, the CO2 emissions during the operation stage are converted from the electricity consumption. The operational carbon emissions in the system comprise two parts: the CO2 generated when the compressor operates for heating driven by electricity and the CO2 produced when the water pumps operate. These can be calculated by Equations (9) and (10):
where Ei is annual CO2 emissions, kg; COP is calculated by an empirical formula [25]; its rated value is 3.3867; aele is the annual CO2 emission factor of electricity; the value is set to 0.656 kg/kW·h [33].
The evaluation of the system’s flexibility adopts the flexibility indicator [34], which can measure how much of the electricity demand during peak periods is shifted to off-peak periods. The closer this indicator is to 1, the better the system’s flexibility is. The system flexibility is calculated by Equation (11):
where F is the flexibility indicator; Q is the amount of heating power, kW; is the system’s power consumption during valley periods, kW·h; is the system’s power consumption during peak periods, kW·h.
3.2. PSO-LSTM Load Prediction Model
The end-terminal load forecasting is a nonlinear system problem involving multiple factors. The more variables that have an impact on the load through input, the higher the accuracy of the prediction. However, it will correspondingly increase the time required for calculation. Based on Ref. [35], the input parameters of the prediction model are shown in Figure 4. The input parameters are mainly divided into five categories, namely, time, load, temperature, humidity, and solar radiation intensity. Among them, the weather parameters are derived from the DEST 2.0 software, and the historical load data are from the TRNSYS 18 simulation software. Considering the influence of thermal delay on the load, the temperature and load in the previous 1 h are added as input variables. Due to the similar patterns of load characteristics on a daily basis, to a certain extent, the temperature and load data of the previous day are used as input variables.
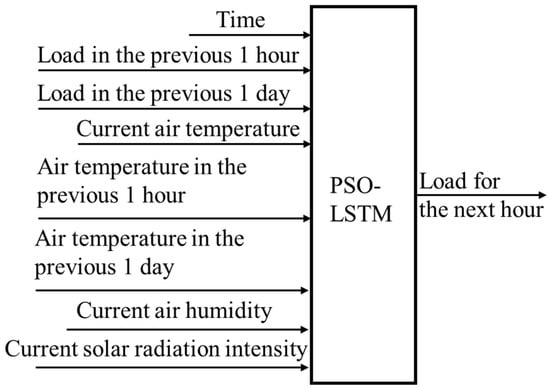
Figure 4.
Input and output of load prediction.
After determining the input variables, the data will be proportionally divided into a training set (80%) and a test set (20%). The input data of each dimension will be normalized, and the hyperparameters of PSO-LSTM will be set as per Table 4. Among them, the parameters of LSTM will be determined by the particle swarm optimization algorithm. After optimization, the learning rate is set to 0.001, and the number of hidden layers is 258. This enables the prediction of the future 1 h load. After the load prediction model outputs the load for the next 1 h, if the predicted value is used as the input, it can predict the load for the next 2 h, and this process is recursively repeated. Eventually, it can achieve the prediction of future 24 h load data.

Table 4.
PSO-LSTM prediction model parameter settings.
Taking the hourly meteorological and load data within the heating season as the training dataset for prediction, the results of the LSTM neural network trained after optimization by the PSO algorithm are shown in Figure 5. Among them, the correlation coefficient R2 of the training set is 0.986, and that of the test set is 0.937; the average relative error of the test set is 2.87%, indicating that the trained prediction model is relatively reliable.
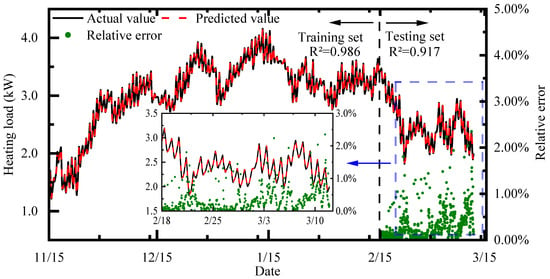
Figure 5.
Load prediction training model.
After establishing the load forecasting model, in order to explore the control strategies corresponding to different levels of heat load, in this study, the predicted heat load throughout the heating season is further divided. The maximum heat load moment within the heating season is defined as 100%, while the minimum heat load moment is defined as 0%. The hourly heat load throughout the heating season is evenly divided into 5 levels, and the proportion of each level is shown in Table 5.

Table 5.
Load division.
Among them, the 60–80% level has the largest load proportion (41.18%), followed by the 40–60% level (26.51%). Based on the maximum load moment of each day, the typical days representing the five levels are further selected.
3.3. System Operation Strategy Optimization Method
At present, most of the control strategies for ASHP energy storage systems are based on time-of-use electricity pricing to set the start–stop or mode-switching of the heat pump units. This may lead to unnecessary resource waste when the load is small on the same day and may fail to meet the end-user’s demand when the load is large. To solve this problem, this paper proposes an optimization control strategy applicable to coupled systems based on load forecasting. The objective function is to minimize the operating electricity cost. The system controls the operating parameters such as temperature, flow rate, and energy storage duration as variables and uses the hourly heat load as the constraint condition. Machine learning algorithms are utilized to find the optimal control strategy applicable to different load ranges.
The optimization variables of the coupling system control strategy are generally the flow rate, heat pump set temperature, heat storage time, etc. If hourly optimization is carried out on a 24 h cycle, there will be 24 × n variables that need to be optimized through algorithms, which may fail to respond promptly to external load changes due to the long optimization time. Therefore, the optimization variables need to be dimensionally reduced. The load prediction model based on PSO-LSTM can also be used to indirectly calculate the hourly flow rate of the system. The method is to convert the predicted future load into the control signal of the variable frequency water pump on the load side. The terminal flow rate changes in real time according to the predicted load to achieve an on-demand energy supply. The specific calculation process can be expressed by Equation (12).
where fsignal is the control signal of the variable frequency water pump; Qpre is the predicted load, kW; mpu,r is the rated flow of the variable frequency pump, kg·h−1; ΔTdesign is the design end water supply and return temperature difference, °C.
In terms of the system-set temperature and energy storage duration, intelligent algorithms need to be utilized to optimize the hourly set temperature of the heat pump and the energy storage time based on the predicted load as constraints. To reduce the number of optimization variables and save computing power, this study optimizes the two periods of off-peak electricity heat storage and peak electricity heat release as two separate entities. Since the heat pump does not need to run continuously during these two periods, the optimization variables for the heat storage temperature and energy storage duration during the off-peak electricity period and the end heat release temperature during the peak electricity period are sought. For the flat electricity period, since the building scenario studied in this paper is an office building and, considering the thermal comfort of the heat pump, which needs to undertake the continuous heating task, the hourly set temperature of the heat pump from 12:00 to 18:00 is taken as the optimization variable for optimization, and the set temperatures of the heat pump involved are all the return water temperatures of the units.
The purpose of optimizing the control strategy is to save the operating electricity cost of the system. Therefore, taking 24 h as a cycle, on the premise of ensuring that the building load and equipment operation are safe and reliable, the optimization is carried out with the aim of minimizing the system’s operating electricity cost, considering the time-of-use electricity price. This function can be calculated by Equation (6), where the time-of-use electricity prices in Xi’an and the time periods are shown in Table 1.
In the process of control strategy optimization, the GenOpt optimization program included in the TRNSYS 18 software is used to optimize the simulation model. The specific optimization process of the joint optimization of GenOpt (a special program in type56 in TRNSYS 18) and TRNSYS 18 is shown in Figure 6, and the control strategy optimization model is shown in Figure 7. Considering the convergence speed of global optimization, the particle swarm algorithm was selected to optimize the control strategy of the system. The constraints and step sizes of the running parameters for the optimization of the system control strategy are set, as shown in Table 6, with a total of 9 optimization variables.
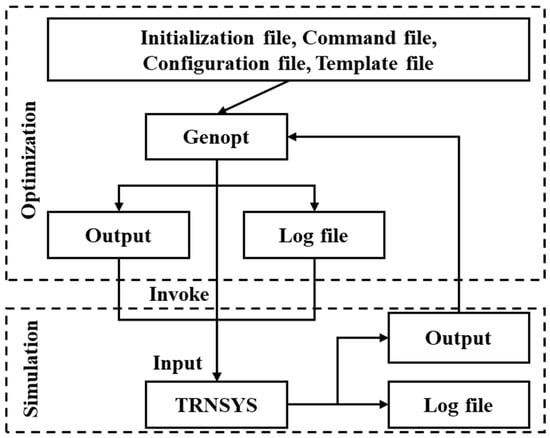
Figure 6.
GenOpt optimization flow chart.
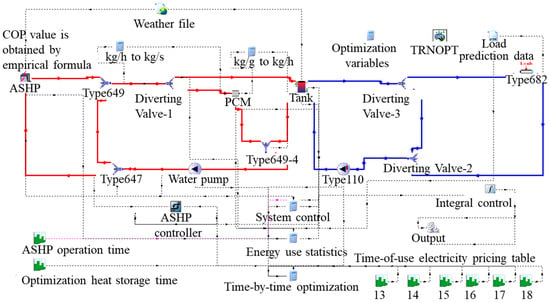
Figure 7.
Model of system control strategy optimization.

Table 6.
Initial values of each optimization variable and constraint conditions.
4. Results and Discussion
4.1. Capacity Configuration Parameter Analysis
4.1.1. Schemes of Capacity Configuration Parameter
Among the configuration parameters of energy storage capacity, the water tank volume, the PCM volume, the phase change temperature, and the temperature of the heat source for heat storage are the key design parameters of the ASHP-coupled TES system. They have varying degrees of influence on the above evaluation indicators. Therefore, these four variables are adopted as the optimization variables. The system cost, carbon emission quantity, and flexibility indicator are taken as the objective functions. The multi-objective NSGA-II genetic algorithm is used to perform multi-objective optimization on the system model. The objective functions are the system economy, carbon emission quantity, and flexibility.
Through multi-objective optimization, an optimization scheme applicable to different design requirements can be obtained, as shown in Table 7. Figure 8 shows the optimization rate of the three evaluation indicators under each scheme compared with the original scheme. Scheme 1, which focuses on economic optimization, has a cost reduction of 14.04% compared to the initial scheme. Scheme 2 emphasizes energy-saving optimization, with a carbon emission reduction of 29.39% during operation. Scheme 3 has an increase of 31.97% in the flexibility indicator after optimization. However, the flexibility indicator of Scheme 1 has increased by 13.19%; Scheme 3 shows negative optimization in terms of economy and energy saving. For Scheme 3, the economic efficiency decreased by 6.69% and the energy conservation rate dropped by 3.79%. This is because the volume of the water tank and the PCM tank selected in this scheme are too large, and the resulting benefits are less than the increased system burden. Therefore, both the system cost and carbon emissions increase. Scheme 4 is the relatively optimal scheme selected by the TOPSIS optimization method, which takes into account the three evaluation indicators and has optimization to varying degrees. The optimization amplitudes for the economy, energy-saving, and flexibility indicators are 11.09%, 13.38%, and 29.03%, respectively. By comprehensively analyzing all the schemes, it can be seen that excessively high or low configuration parameter values may lead to an improvement in the performance of a single aspect of the system, but the overall performance improvement requires that all parameters remain within a reasonable range.

Table 7.
Storage capacity configuration scheme and index for different design requirements.
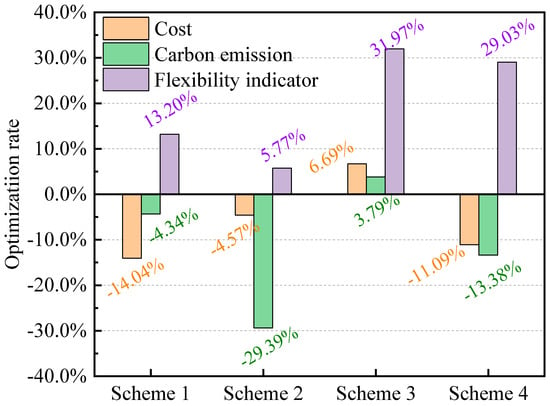
Figure 8.
Optimization rate of every scheme.
4.1.2. Impact Analysis of Configuration Parameters
In order to understand the influence of each optimization variable on each objective function, in this study, the influence of four parameters on the three optimization indexes was analyzed, respectively.
Set the optimization weight to minimize the system cost. Figure 9 shows the influence laws of each energy storage capacity configuration parameter on the system economy during the optimization process. From Figure 9a,c, it can be seen that the volume of the water tank and the phase change temperature show a trend of first decreasing and then increasing. From Figure 9b,d, it is shown that the volume of the PCM tank, the temperature of the heat storage heat source, and the economy generally show a positive correlation trend. When the volume of the water tank is 0.4 m3, the volume of the PCM tank is 0.14 m3, the phase change temperature is around 42 °C, and the temperature of the heat storage heat source is 50 °C, the system’s cost is the lowest.
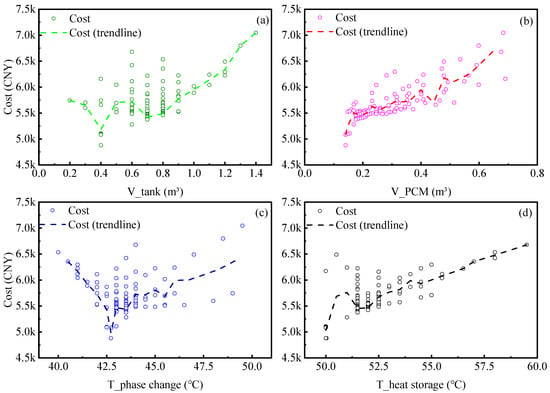
Figure 9.
The influence of each optimization variable on the system cost. ((a) variation of cost with water tank volume, (b) variation of cost with PCM tank volume, (c) variation of cost with phase change temperature, (d) variation of cost with heat source temperature).
Set the optimization weight to minimize the carbon emission during operation. Figure 10 shows the influence laws of each energy storage capacity configuration parameter on the energy-saving performance of the system during the optimization process. From Figure 10a,d, it can be seen that the water tank volume, heat source temperature, and carbon emission are generally positively correlated. As shown in Figure 10b,c, the volume of the PCM tank, phase change temperature, and carbon emission show a trend of first decreasing and then increasing. However, it is worth noting that, in Figure 10a, when the water tank volume is 0.15–0.2 m3, as the water tank volume increases, the system’s carbon emission decreases. This is because, in this stage, increasing the water tank volume can significantly reduce the start–stop times of the ASHP unit and thestartup time during peak period, thereby reducing the start–stop losses and thus reducing the carbon emission. The results show that, when the water tank volume is 0.2 m3, the storage tank volume is 0.5 m3, the phase change temperature is 41 °C, and the heat source temperature is 50 °C, the operating carbon emission is the minimum.
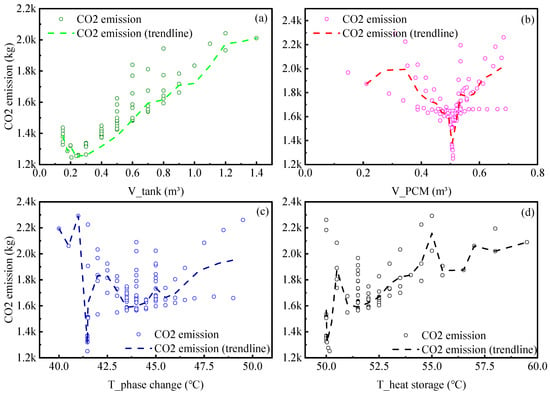
Figure 10.
The influence of each optimization variable on the operating carbon emission. ((a) variation of CO2 emission with water tank volume, (b) variation of CO2 emission with PCM tank volume, (c) variation of CO2 emission with phase change temperature, (d) variation of CO2 emission with heat source temperature).
Set the optimization weight to focus on flexibility optimization. Figure 11 shows the influence patterns of each variable on the system flexibility during the optimization process. Among them, the data in Figure 11a–c indicate that the flexibility of the system increases first and then decreases as the volume of the water tank, the volume of the PCM tank, and the phase change temperature increase. Figure 11d shows that the system flexibility increases first and then remains stable as the temperature of the heat source rises. When the volume of the water tank is 0.9 m3, the volume of the PCM is around 0.6 m3, the phase change temperature is 45 °C, and the temperature of the heat source is around 51 °C, the flexibility of the system reaches its maximum value.
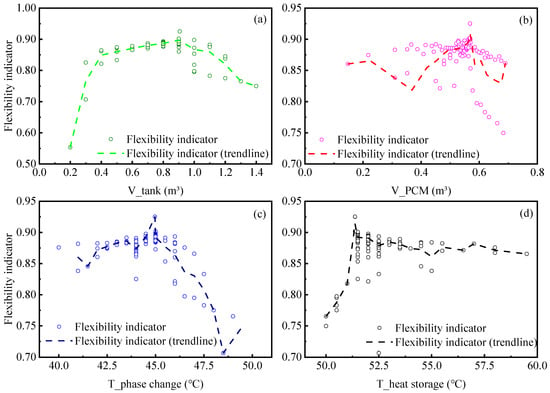
Figure 11.
The influence of each optimization variable on the flexibility indicator. ((a) variation of flexibility indicator with water tank volume, (b) variation of flexibility indicator with PCM tank volume, (c) variation of flexibility indicator with phase change temperature, (d) variation of flexibility indicator with heat source temperature).
When the volume of the water tank increases, it can significantly reduce the time that the ASHP unit is activated during peak electricity periods. The increase in the water tank volume and the rise in the storage temperature will both increase the power consumption of the unit during off-peak electricity periods. Therefore, according to Equation (10), in the initial stages of these two factors increasing, the flexibility shows a significant increasing trend. However, when they increase to a certain value, the stored heat during off-peak periods is already sufficient, and further increases will no longer bring an improvement in system flexibility. In summary, the water tank has a significant impact on the flexibility index. When the phase change temperature of the PCM is too high, the required outlet water temperature for the ASHP unit is also too high, resulting in a decrease in system flexibility.
In multi-objective optimization, sensitivity analysis is helpful for understanding the degree of influence of different parameters on each objective function. This paper clarifies the degree of influence of the design parameters of the system energy storage on each objective function through quantitative analysis and is used to guide different design requirements. Based on the relative optimal solution, this paper calculates the sensitivity of the objective function by changing the optimization variables by the same amplitude (±5%). As shown in Table 8, the following conclusions can be drawn:
- (1)
- For system economy, the volume of the PCM has the greatest impact on it. Changing the volume of the PCM by ±5%, the economy increases by 2.12% or decreases by 1.89%, followed by the volume of the water tank, then the temperature of the heat source during heat storage period, and finally the phase change temperature.
- (2)
- For system energy saving, the volume of the water tank has the greatest impact on the system energy saving. Changing the volume of the water tank by ±5%, the energy saving increases by 4.03% or decreases by 3.32%, followed by the temperature of the heat source, then the volume of the PCM tank, and the phase change temperature.
- (3)
- For system flexibility, the volume of the water tank has the greatest impact on flexibility. Changing the volume of the water tank by ±5%, flexibility increases by 2.78% or decreases by 4.69%, followed by the volume of the PCM, then the temperature of the heat source, and finally the phase change temperature.

Table 8.
Sensitivity analysis.
Table 8.
Sensitivity analysis.
| Optimization Variable | Rangeability | Economy | Energy Saving | Flexibility |
|---|---|---|---|---|
| Water tank volume | −5% | −0.678% | −3.321% | −4.699% |
| +5% | 1.329% | 4.038% | 2.780% | |
| PCM volume | −5% | −1.890% | 0.322% | −1.422% |
| +5% | 2.115% | 0.223% | 1.242% | |
| Phase change temperature | −5% | 0.024% | 0.146% | 0.141% |
| +5% | 0.055% | 0.088% | −0.064% | |
| Heat source temperature | −5% | −0.663% | −2.256% | −1.082% |
| +5% | 0.857% | 2.835% | 1.187% |
4.2. Control Strategy Results
4.2.1. Control Strategy Optimization
Figure 12 illustrates the iterative process of optimizing the daily operating electricity cost for each load level and the convergence situation of the particle swarm algorithm. The values of the daily operating electricity cost for each typical day all iteratively converge in a direction that is beneficial to reducing the cost. After more than 100 iterations, the numerical fluctuations of the objective function values for each typical day have decreased. When the number of iterations reaches more than 300 times, the objective function values basically remain stable and fluctuate slightly within a certain range regularly. When the number of iterations reaches approximately 480 times, the daily operating electricity cost for each load level on a typical day no longer decreases. At this point, the algorithm converges, and the system’s operating electricity cost reaches the minimum value. Therefore, the operating parameters and optimization variables in the system are the optimal solutions. Finally, the optimized control strategies for each load level on a typical day are determined, as shown in Table 9.
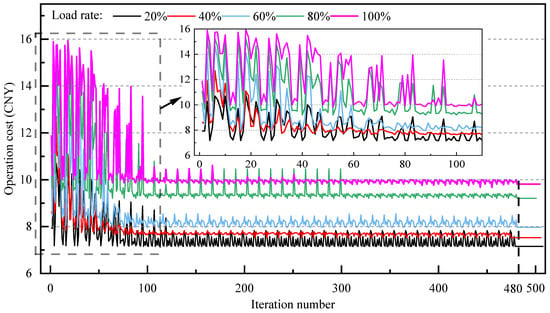
Figure 12.
The iterative process of optimizing the system control strategy.

Table 9.
The optimization control strategy for each load level on the typical day.
4.2.2. Energy Consumption Analysis
In order to reflect the optimization potential under different load levels, Figure 13a–e, respectively, show the comparison of electricity consumption before and after optimization of a typical day’s operation strategies for the five load levels ranging from 20% to 100%. It can be seen that, due to the different load characteristics on each typical day, the control strategies also vary. During the off-peak electricity storage stage, after optimization, the storage duration of the phase change storage tank is shorter compared to the original strategy, and this time increases with the increase in heat load. Among them, the storage duration of the warmest day with the smallest heat load is 2.5 h, while that of the coldest day with the largest heat load is 4 h. During the peak electricity discharge stage, due to the optimization of the configuration parameters of the system’s energy storage capacity, the heat pump units both before and after control optimization do not operate during the peak electricity period. The system energy consumption in this stage is the lowest, only the energy consumption of the water pump. During the flat electricity storage and supply stage, compared with the original strategy, the hourly power consumption of the optimized system has decreased to varying degrees, and it changes with the outdoor temperature, showing a negative correlation trend in general. After statistical calculation, the results are shown in Figure 13f, and the optimized control strategy can reduce the electricity consumption for each load level on the typical day by 14.65% to 24.06%.
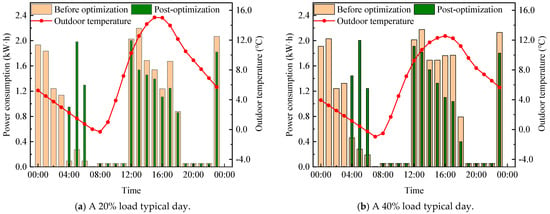
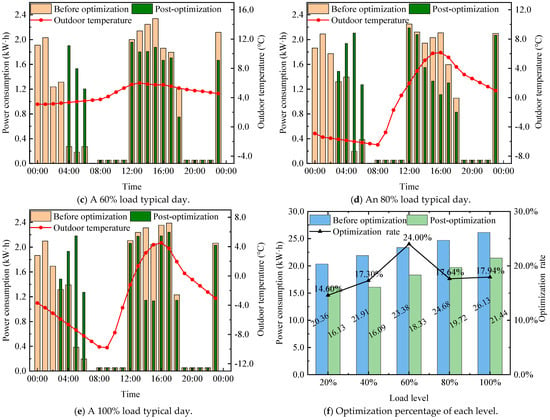
Figure 13.
Comparison of power consumption before and after operation strategy optimization.
4.2.3. Economic Analysis
Figure 14 shows the saving ratios of system operation electricity costs before and after optimization under each load level. It can be seen that, as the load rate increases, the operation electricity costs on typical days also increase. Among them, the operation electricity costs before and after optimization on the day with the maximum load rate are 11.89 CNY and 9.81 CNY, respectively, which decreased by 17.49% year-on-year. Moreover, the saving ratios of operational electricity costs under different loads are different. Among them, a typical day with a load rate of 60% has the largest saving ratio, saving approximately 21.65% compared to the original strategy, while a typical day with a load rate of 20% has the smallest saving ratio, saving approximately 9.95% compared to the original strategy. Based on the TRNSYS 18 software, the economy of the entire heating season with the optimized control strategy is calculated. The results are shown in Figure 15, and the operation electricity costs during the entire heating season have been saved by approximately 17.32% after adopting the optimized control strategy.
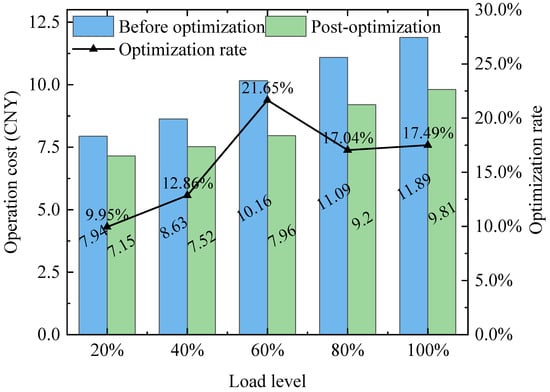
Figure 14.
Comparison before and after optimization of operation electricity charges.
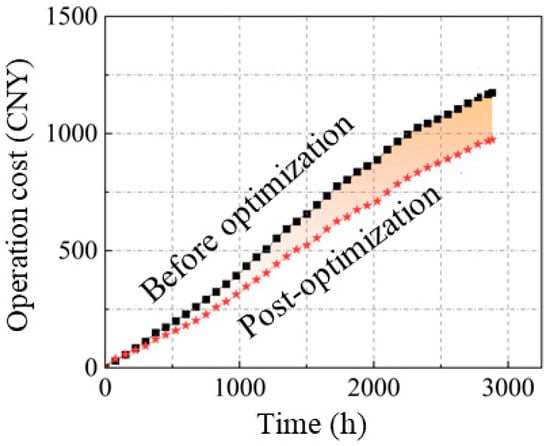
Figure 15.
Comparison of operating electricity costs in the heating season.
5. Conclusions
Based on the TRNSYS 18 platform, this study has constructed a simulation model of an ASHP-coupled TES system under the operation strategy of time-of-use electricity pricing. The energy storage system includes a PCM storage tank and a water tank, and the model has been verified with the measured data. From the aspects of economy, energy saving, and flexibility, the capacity configuration parameters of the coupled system have been analyzed. Then, based on the PSO-LSTM load forecasting model, an optimization control strategy applicable to the coupled system has been proposed. The objective function is to minimize the operating electricity cost. The system controls the operating parameters such as temperature, flow rate, and energy storage duration as variables and takes the hourly heat load as the constraint condition. By using machine learning algorithms, the optimal control strategy applicable to different load ranges has been found. The specific conclusions are as follows:
The multi-objective optimization algorithm NSGA-II was utilized to optimize the parameters of energy storage capacity, and the optimal configuration under different evaluation indicators was obtained. The cost of the optimal economic scheme decreased by 14.04%; the carbon emission of the optimal energy-saving scheme decreased by 29.39%; the flexibility of the optimal flexible scheme increased by 31.97%. Compared with systems that design parameters using traditional methods, the optimization amplitudes considering economy, energy saving, and flexibility are 11.09%, 13.37%, and 29.03%, respectively. The configuration is a 0.52 m3 water tank, a 0.25 m3 phase change storage tank, a phase change temperature of 45.9 °C, and a heat source temperature during heat storage of 50.5 °C. The influence of the energy storage configuration parameters on the system performance under different optimization weights was analyzed. These optimization results and the analysis can provide guidance for different design requirements.
Based on the relatively optimal parameters of energy storage capacity configuration, research on the optimization of the control strategy of the system was carried out. The following conclusions can be drawn: In this study, a load forecasting model based on PSO-LSTM was established, with an average relative error of 2.87%, which is used to predict the load for the next 24 h. Based on this, an optimization control strategy applicable to the ASHP-coupled TES system was proposed. The predicted future load was transformed into the control signal of the variable frequency water pump on the load side. The terminal flow rate changed in real time according to the predicted load, so as to achieve an on-demand energy supply. Taking the minimum operating electricity cost as the objective function, the optimized control strategy obtained can enable the system to automatically adjust the operating parameters according to the outdoor ambient conditions, and the typical daily electricity consumption of each load level decreased by 14.65% to 24.06%; meanwhile, after adopting the optimized control strategy, the operating electricity cost of the entire heating season was saved by approximately 17.32% compared with the system that only uses the time-of-use electricity pricing control strategy.
These research results provide a theoretical basis and guidance for different design requirements of ASHP energy storage systems, expand the application scope of energy storage ASHPs, and help alleviate grid pressure to achieve a match between supply and demand, flexible energy use, and peak shaving. But due to limitations in objective conditions and time constraints, this research can be further deepened and improved as follows:
(1) In the optimization process of the simulation, this study considered the temperature of the terminal room as a constant condition. In subsequent work, different comfort conditions can be incorporated into the research. (2) The proposed time-optimized control strategy based on load prediction, due to the limited conditions such as experimental equipment and environment, the input parameters of the model are not comprehensive enough. For example, meteorological factors such as wind speed and precipitation are not considered. (3) The ASHP has a relatively good matching and integration performance with other heat sources. In future research, the ASHP and TES can be combined with multiple heat source systems and energy storage systems, such as solar energy and ground source heat pumps, to form a multi-source energy storage system for research work.
Supplementary Materials
The following supporting information can be downloaded at: https://www.mdpi.com/article/10.3390/buildings15162870/s1, Table S1: Sources of the key materials or data used in this study [36,37].
Author Contributions
Conceptualization, X.L.; methodology, X.L., W.C. and P.Z.; validation, F.L. and S.D.; formal analysis, X.L. and G.Y.; investigation, P.Z.; data curation, P.Z.; writing—original draft preparation, P.Z., W.C. and F.L.; writing—review and editing, S.D., P.Z. and K.X.; supervision, Z.W.; project administration, X.L.; funding acquisition, Z.W. All authors have read and agreed to the published version of the manuscript.
Funding
The following projects have provided financial support for this research: PowerChina Northwest Engineering Corporation Limited’s 2022 Core Technology Research Project: Design Method and Complete Set of Key Technologies for Coupled Heat Pump System Utilization of Mid-Deep Geothermal Energy, Project Number: DJ-HXGG-2022-07.
Data Availability Statement
Interested researchers can contact 2191310156@stu.xjtu.edu.cn (Pengfei Zhang) to obtain the data used in this study. We added more details in the Supplementary Material for this paper. For example, the source of PCM material and ASHP unit can be found in the Supplementary Material.
Acknowledgments
The authors acknowledge the editors and reviewers for their valuable suggestions and comments on this manuscript.
Conflicts of Interest
Authors Xuan Liu, Wei Chen, Saisai Du and Ge Yao were employed by the company PowerChina Northwest Engineering Corporation Limited. Author Feng Li was employed by the company PowerChina Construction Industry Investment Corporation Limited. Author Kaiwen Xu was employed by the company Xi’an Aerospace Yuan Dongli Engineering Corporation Limited. The remaining authors declare that the research was conducted in the absence of any commercial or financial relationships that could be construed as a potential conflict of interest.
Nomenclature
| Symbol | Description |
| aele | Annual CO2 emission factor of electricity, kg·(kW·h)−1 |
| Atank | Area of the tank surface, m2 |
| c | Specific heat capacity, kJ·(kg·°C)−1 |
| C | Annual cost value, CNY |
| COP | Coefficient of performance |
| E | Energy, kW |
| EC | Electricity cost, CNY |
| Ei | Annual CO2 emissions, kg |
| fsignal | Control signal of variable frequency water pump |
| F | Flexibility indicator |
| i | discount rate |
| IC | Initial investment cost, CNY |
| k | Heat loss coefficient |
| LH | Latent heat, kJ·kg−1 |
| m | Mass flow rate, kg·s−1 |
| M | Mass, kg |
| n | Useful life, year |
| OC | Operation cost, CNY |
| PRI | Electricity price, CNY·(kW·h)−1 |
| Q | Heat capacity, kW |
| T | Temperature, °C |
| V | Volume, m3 |
| W | Electricity consumption, kW·h |
| x | Proportion |
| Greek symbol | Description |
| ε | Effectiveness of the heat exchanger |
| ρ | Density, kg·m−3 |
| τ | Defrosting time, s |
| Abbreviation | Description |
| ASHP | Air source heat pump |
| COP | Coefficient of performance |
| HVAC | Heating, Ventilation, and Air Conditioning |
| LSTM | Long short-term memory |
| PCM | Phase change material |
| PID | Proportion integration differentiation control |
| PSO | Particle swarm optimization |
| SAT | Sodium acetate trihydrate |
| SCOP | Seasonal coefficient of performance |
| TES | Thermal energy storage |
| VAV | Variable air volume (system) |
| Subscripts | Description |
| air | Air |
| f | Full load |
| h | Heating |
| hp | Air source heat pump |
| in | Inlet |
| m | Melting process |
| PCM | Phase change material |
| pre | Predicted |
| pu | Pump |
| r | Rated |
| s | Solid |
| wt | Water tank |
| w | Water |
| x | Node |
References
- Wang, Y.; Jiang, L.; Shen, B.; Liu, J. Research on air source phase change energy storage cascade heat pump heating system. Acta Energiae Solaris Sin. 2021, 42, 14–18. [Google Scholar]
- Xu, Z.W.; Li, H.; Xu, W.; Shao, S.Q.; Wang, Z.C.; Gou, X.X.; Zhao, M.Y.; Li, J.D. Investigation on the efficiency degradation characterization of low ambient temperature air source heat pump under partial load operation. Int. J. Refrig. 2022, 133, 99–110. [Google Scholar] [CrossRef]
- Zhang, Y.N.; Ma, Q.; Li, B.X.; Fan, X.M.; Fu, Z.B. Application of an air source heat pump (ASHP) for heating in Harbin, the coldest provincial capital of China. Energy Build. 2017, 138, 96–103. [Google Scholar] [CrossRef]
- Liang, S.M.; Wang, H.; Bai, X.X.; Wang, G.; Gao, X.F.; Tian, X.H. A field study on the impacts of cold island effect on operating performances of air source heat pump array for space heating. J. Build. Eng. 2024, 82, 108266. [Google Scholar] [CrossRef]
- Song, M.J.; Deng, S.M.; Dang, C.B.; Mao, N.; Wang, Z.H. Review on improvement for air source heat pump units during frosting and defrosting. Appl. Energy 2018, 211, 1150–1170. [Google Scholar] [CrossRef]
- Ma, L.X.; Sun, Y.J.; Wang, F.H.; Wang, M.; Zhang, S.; Wang, Z.H. Advancements in anti-frosting and defrosting techniques for air source heat pumps: A comprehensive review of recent progress. Appl. Energy 2025, 377, 124358. [Google Scholar] [CrossRef]
- Meng, Q.L.; Ren, X.X.; Wang, W.Q.; Xiong, C.Y.; Li, Y.; Xi, Y.; Yang, L. Reduction in on-off operations of an air source heat pump with active thermal storage and demand response: An experimental case study. J. Energy Storage 2021, 36, 102401. [Google Scholar] [CrossRef]
- Lyu, W.; Wang, Z.C.; Li, X.F.; Deng, G.F.; Xu, Z.W.; Li, H.; Yang, Y.X.; Zhan, B.F.; Zhao, M.Y. Influence of the water tank size and air source heat pump size on the energy saving potential of the energy storage heating system. J. Energy Storage 2022, 55, 105542. [Google Scholar] [CrossRef]
- Li, Y.T.; Huang, G.S.; Wu, H.J.; Xu, T. Feasibility study of a PCM storage tank integrated heating system for outdoor swimming pools during the winter season. Appl. Therm. Eng. 2018, 134, 490–500. [Google Scholar] [CrossRef]
- Wu, P.; Wang, Z.C.; Li, X.F.; Xu, Z.W.; Yang, Y.X.; Yang, Q. Energy-saving analysis of air source heat pump integrated with a water storage tank for heating applications. Build. Environ. 2020, 180, 107029. [Google Scholar] [CrossRef]
- Li, X.T.; Sun, Y.Y.; Wang, W.; Wei, W.Z. Enhancing demand response and heating performance of air source heat pump through optimal water temperature scheduling: Method and application. Energy Build. 2024, 323, 114839. [Google Scholar] [CrossRef]
- Zou, D.Q.; Ma, X.F.; Liu, X.S.; Zheng, P.J.; Cai, B.M.; Huang, J.F.; Guo, J.R.; Liu, M. Experimental research of an air-source heat pump water heater using water-PCM for heat storage. Appl. Energy 2017, 206, 784–792. [Google Scholar] [CrossRef]
- Qu, S.L.; Ma, F.; Ji, R.; Wang, D.X.; Yang, L.X. System design and energy performance of a solar heat pump heating system with dual-tank latent heat storage. Energy Build. 2015, 105, 294–301. [Google Scholar] [CrossRef]
- Kapsalis, V.; Karamanis, D. Solar thermal energy storage and heat pumps with phase change materials. Appl. Therm. Eng. 2016, 99, 1212–1224. [Google Scholar] [CrossRef]
- Pardiñas, A.A.; Alonso, M.J.; Diz, R.; Kvalsvik, K.H.; Fernández-Seara, J. State-of-the-art for the use of phase-change materials in tanks coupled with heat pumps. Energy Build. 2017, 140, 28–41. [Google Scholar] [CrossRef]
- D’Ettorre, F.; De Rosa, M.; Conti, P.; Testi, D.; Finn, D. Mapping the energy flexibility potential of single buildings equipped with optimally-controlled heat pump, gas boilers and thermal storage. Sust. Cities Soc. 2019, 50, 101689. [Google Scholar] [CrossRef]
- Wang, F.; Liu, M.W.; Guo, W.L.; Liu, X.F.; Zhang, J.; Li, J.C.; Hu, G.Y.; Yin, J. Photovoltaic/thermal integrated air source heat pump hot water system with phase change tank. Renew. Energy 2025, 240, 122204. [Google Scholar] [CrossRef]
- Langner, F.; Kovacevic, J.; Zwickel, P.; Dengiz, T.; Frahm, M.; Waczowicz, S.; Çakmak, H.K.; Matthes, J.; Hagenmeyer, V. Coordinated price-based control of modulating heat pumps for practical demand response and peak shaving in building clusters. Energy Build. 2024, 324, 114940. [Google Scholar] [CrossRef]
- Zhang, D.; Qu, B.Y.; Wang, C.L. Energy-saving evaluation and control optimization of an ASHP heating system based on indoor thermal comfort. Sol. Energy 2019, 194, 913–922. [Google Scholar]
- Jin, X.; Zheng, S.Q.; Huang, G.S.; Lai, A.C.K. Energy and economic performance of the heat pump integrated with latent heat thermal energy storage for peak demand shifting. Appl. Therm. Eng. 2023, 218, 119337. [Google Scholar] [CrossRef]
- Heinz, A.; Rieberer, R. Energetic and economic analysis of a PV-assisted air-to-water heat pump system for renovated residential buildings with high-temperature heat emission system. Appl. Energy 2021, 293, 116953. [Google Scholar] [CrossRef]
- Meng, Q.L.; Li, Y.; Ren, X.X.; Xiong, C.Y.; Wang, W.Q.; You, J.W. A demand-response method to balance electric power-grids via HVAC systems using active energy-storage: Simulation and on-site experiment. Energy Rep. 2021, 7, 762–777. [Google Scholar] [CrossRef]
- Jiang, D.H.; Cui, H.S.; Jiang, K.D.; Yang, J.L. Study building heat storage operation strategy for air-to-water heat pumps connected to a residential floor heating system. In Proceedings of the 3rd International Conference on Energy Engineering and Environmental Protection (EEEP), Sanya, China, 19–21 November 2018. [Google Scholar]
- Zheng, Y.X.; Xu, T.T. Effects of the different water tank location on the performance of CO2 heat pump with thermal energy storage for space heating. J. Mech. Sci. Technol. 2024, 38, 3185–3195. [Google Scholar] [CrossRef]
- Wang, Y.B.; Quan, Z.H.; Jing, H.R.; Wang, L.C.; Zhao, Y.H. Performance and operation strategy optimization of a new dual-source building energy supply system with heat pumps and energy storage. Energy Conv. Manag. 2021, 239, 114204. [Google Scholar] [CrossRef]
- Feng, G.H.; Li, A.N.; Chang, S.S.; Huang, K.L.; Zhang, L. Design and Matching Mode of Heat Pump Valley Electric Storage Heating System. J. Shenyang Jianzhu Univ. Nat. Sci. 2022, 38, 714–722. [Google Scholar]
- Ma, L.X.; Wang, F.H.; Wang, Z.H.; Zhang, S.; Liu, Z.X.; Lou, Y.C. Experimental investigation on an air source heat pump system with coupled liquid-storage gas-liquid separator regarding heating and defrosting performance. Int. J. Refrig. 2022, 134, 176–188. [Google Scholar] [CrossRef]
- Ma, L.X.; Wang, F.H.; Wang, Z.Y.; Wang, Z.H.; Zhang, S.; Sun, Y.J. Thermodynamic mechanism of high energy performance of air source heat pump with coupled liquid-storage to gas-liquid separator. Sol. Energy 2023, 255, 497–506. [Google Scholar] [CrossRef]
- Duffie, J.A.; Beckman, W.A. Solar Engineering of Thermal Processes; Wiley-Interscience: New York, NY, USA, 2013. [Google Scholar]
- Wang, Z.Y.; Wang, F.H.; Bai, M.M.; Zhang, S.; Xie, Z.T.; Han, B.C.; Li, Y.Z.; Liu, J.; Cai, W.L.; Zhang, Y.X.; et al. Multi-faceted performance analysis and optimization of a hybrid deep borehole heat exchanger heating system with latent heat thermal energy storage. Energy Conv. Manag. 2024, 315, 118732. [Google Scholar] [CrossRef]
- Qu, M.L.; Yan, X.F.; Wang, H.Y.; Hei, Y.X.; Liu, H.Z.; Li, Z. Energy, exergy, economic and environmental analysis of photovoltaic/thermal integrated water source heat pump water heater. Renew. Energy 2022, 194, 1084–1097. [Google Scholar] [CrossRef]
- Liu, Y.; Zhou, W.; Luo, X.; Hu, X. Comparison and optimal design of multi-source complementary heating system based on air source heat pump in alpine canyon area of western Sichuan. Acta Energiae Solaris Sin. 2021, 42, 478–486. [Google Scholar]
- Hara, N.; Taniguchi, S.; Yamaki, T.; Nguyen, T.T.; Kataoka, S. Impacts of hydrogen price and carbon dioxide emission factor on bi-objective optimizations of absorption and subsequent methanation processes of carbon dioxide capture, utilization, and storage. J. Clean. Prod. 2024, 456, 142358. [Google Scholar] [CrossRef]
- Finck, C.; Li, R.L.; Kramer, R.; Zeiler, W. Quantifying demand flexibility of power-to-heat and thermal energy storage in the control of building heating systems. Appl. Energy 2018, 209, 409–425. [Google Scholar] [CrossRef]
- Bai, D.; Ma, S.; Yang, X.; Ma, D.; Ma, X.; Ma, H. A recommendation model for optimizing transfer learning hyper-parameter settings in building heat load prediction with limited data samples. Energy Build. 2024, 325, 115021. [Google Scholar] [CrossRef]
- Available online: https://xadrc.xa.gov.cn/xwzx/tzgg/5fd0539df8fd1c59665181be.html (accessed on 19 May 2025).
- Xing, W.; Zhang, X.; Zhang, C.; Jia, X.; Meng, J.; Shi, Q.; Yao, S.; Huang, J. Study on the effect of additives on the heat storage properties of the phase change material sodium acetate trihydrate. Therm. Sci. Eng. Prog. 2025, 59, 103296. [Google Scholar] [CrossRef]
Disclaimer/Publisher’s Note: The statements, opinions and data contained in all publications are solely those of the individual author(s) and contributor(s) and not of MDPI and/or the editor(s). MDPI and/or the editor(s) disclaim responsibility for any injury to people or property resulting from any ideas, methods, instructions or products referred to in the content. |
© 2025 by the authors. Licensee MDPI, Basel, Switzerland. This article is an open access article distributed under the terms and conditions of the Creative Commons Attribution (CC BY) license (https://creativecommons.org/licenses/by/4.0/).