Article

Impact Resistance Test and Numerical Simulation Study of Scrap Steel Fiber Rubber Concrete

1
College of Environment and Civil Engineering, Chengdu University of Technology, Chengdu 610059, China
2
State Key Laboratory of Geohazard Prevention and Geoenvironment Protection, Chengdu 610059, China
*
Author to whom correspondence should be addressed.
Buildings 2025, 15(16), 2857; https://doi.org/10.3390/buildings15162857
Submission received: 7 July 2025 / Revised: 29 July 2025 / Accepted: 8 August 2025 / Published: 13 August 2025

Abstract

The scrap steel fibers (SSF) produced by mechanical processing are processed and added to rubber concrete (RC) to make scrap steel fiber rubber concrete (SSFRC), so as to enhance the strength of the rubber concrete. SSFRC with a concrete strength grade of C30, a rubber dosage of 10%, and SSF dosages of 0, 0.5, 1.0, 1.5, 2.0, and 2.5% were prepared. Cubic compressive tests and drop hammer impact tests were conducted respectively on cubic and cylindrical specimens, and the influence of different weights of the drop hammer, different heights of the drop hammer, and different dosages of SSF on the results was analyzed. The results show that adding SSF to RC can effectively improve the compressive performance and impact resistance. When the fiber dosage is 1%, the compressive performance reaches the optimal level. With the increase of the weight and height of the drop hammer, the impact resistance of the specimens decreases significantly. With the increase of the dosage of SSF, the impact resistance of the specimens significantly improves. When the dosage of SSF is 1.5%, the impact resistance performance is the best. The finite element model was established using ABAQUS, and the simulation results were compared with the test results. The error was within an acceptable range.

1. Introduction

In the 21st century, concrete has been the most widely used building material in the field of civil engineering. However, its disadvantages, such as high brittleness, poor toughness, easy cracking, low tensile strength and heavy self-weight, limit its application. In recent years, scholars [1,2,3,4,5] have proposed incorporating steel fibers into concrete to achieve the reuse of steel fibers and enhance the performance of concrete. Steel fiber concrete has thus become a new type of composite building material that is developing rapidly and widely applied. Meanwhile, with the continuous advancement of technology, waste rubber, as a polymer material, originates from the aging, wear, and scrapping of tires, rubber hoses, etc. At present, there are various ways to deal with waste tires, including incineration, stacking, landfill, production of recycled rubber, refurbishment and reuse, production of rubber particles, and so on [6,7,8,9,10,11]. The most effective and environmentally friendly way to green-transform waste tires is through production and utilization. Based on this, it was proposed to add rubber particles to concrete to form a new type of material—RC. Since the development of RC, many scholars [12,13,14,15,16] have conducted research on various aspects of it and found that it has good impact resistance, good impermeability and good toughness, but the addition of rubber particles reduces the strength of concrete. Therefore, adding scrap steel fibers to rubber concrete to form SSFRC not only enhances the performance of the original rubber concrete, but also utilizes solid waste, saves resources, and promotes green and sustainable development.
Steel fiber rubber concrete (SFRC) is a composite concrete made by simultaneously adding steel fibers, rubber particles, and cement and other materials to concrete. It has superior properties to normal concrete (NC), such as high strength, good toughness, strong compression, and flexural resistance [17,18,19,20,21,22]. Adding steel fibers to reinforced concrete can significantly enhance the compressive strength of concrete. To study the compressive toughness of steel fiber rubber concrete, recycled rubber particles pretreated with NaOH solution are incorporated into steel-fiber-reinforced concrete. This method effectively improves the interfacial bonding performance between the recycled rubber particles and the concrete [23]. In the present work, an impact test on steel-fiber-reinforced rubber self-compacting concrete was conducted using a split Hopkinson pressure bar. The strain rate in the test ranged from 65.3 s−1 to 137.6 s−1, and four volume fractions of steel fibers, as well as four volume fractions of rubber contents, were taken into account [24]. The compressive toughness of steel fiber concrete, where crumb rubber partially replaces fine aggregate, was investigated. Crumb rubber was incorporated at volume percentages of 5, 10, and 15%. The compressive properties revealed a potential interaction between steel fibers and crumb rubber that enhanced the concrete’s performance in these aspects [25]. It was found that when the number of freeze-thaw cycles was fixed, the compressive strength of the concrete increased with the increase of steel fiber content [26,27]. In the experimental work [28], the variables taken into account are the concrete type and the content of crumb rubber aggregate, where the latter is defined as replacement ratios by the volume of sand. Herein, for both plain and steel-fiber-reinforced rubberized concrete, the mechanical properties, fracture energy, stress intensity factor, critical strain energy release rate, elastic plastic fracture toughness parameter, and characteristic length are studied. However, most existing studies focus on the influence of common steel fibers or single variables (such as rubber dosage, fiber type) on the performance of concrete, while there is insufficient research on different dosages of SSF in “RC”.
At present, the research on the dynamic load of steel-fiber-reinforced concrete under impact load mainly focuses on the beam, plate, and other structures [29,30,31,32,33,34]. An innovative ultra-high-performance concrete (UHPC) incorporated with nano-materials has been developed. Dynamic properties of this UHPC were investigated via split Hopkinson pressure bar tests, where different types of steel fibers—including two microfiber varieties and two twisted fiber types—are hybridized into the UHPC [35]. To study the influence of multiple factors on impact resistance, 15 groups of cylindrical specimens were designed for SHPB tests. The test parameters included the content of steel fibers, the replacement ratios of recycled coarse aggregate, and the impact pressure. After the tests, the failure modes of the specimens were carefully observed, and dynamic stress-strain curves of steel-fiber-reinforced recycled aggregate concrete under various impact pressures were accurately measured. Furthermore, a detailed analysis was conducted to explore how these changing parameters affected the dynamic peak stress, peak strain, energy dissipation performance, and dynamic strength growth factor [36]. The stress–strain behavior of recycled concrete under various recycled material mixing systems and different volume contents of steel fibers was studied. Uniaxial cyclic loading tests were conducted to evaluate the failure mode, stress–strain curve, axial compressive strength, and residual strain. The research results show that the use of recycled materials transforms the failure mode from vertical splitting to oblique shearing and reduces the upward slope of the stress–strain curve and the axial compressive strength [37]. The study [38] systematically investigates the mechanical behavior of steel-fiber-reinforced geopolymer concrete (FR-GPC) slabs under static and impact loading conditions, employing hooked-end steel fibers at a 0.5% volume fraction. Impact tests were conducted using a 565 kg pendulum with impact velocities ranging from 2.5 to 4.9 m/s. The static and dynamic performance of FR-GPC slabs was evaluated and compared with that of plain geopolymer concrete slabs. The results demonstrate that FR-GPC slabs exhibit significant improvements in punching shear resistance, energy absorption capacity, and impact resistance under both loading scenarios. The flexural performance of basalt textile reinforced concrete specimens incorporating pre-tensioned configurations, short carbon, steel, and alkali-resistant glass fibers was systematically investigated via three-point bending tests using a drop-weight impact apparatus. Key flexural impact parameters were characterized across a range of impact velocities to evaluate the composite’s dynamic response [39]. To study the impact response of 3D-printed high-strength concrete panels [40], experimental investigations were conducted on specimens reinforced with two layers of alkali-resistant glass textile and two layers of carbon textile, respectively, under low-velocity drop-weight impacts. The reinforcing effects of textile configurations on impact behavior were systematically compared against unreinforced printed counterparts. Specimens were subjected to progressively increasing impact loads until failure criteria were met.
At present, there are many studies on the impact resistance of rubber concrete, but most of these studies only consider a single rubber material [41,42,43,44,45,46]. Granulated crumb rubber derived from waste tires was employed with two maximum particle sizes of 1 mm and 2 mm. A total of nine specimen series were prepared, including one control group and others with aggregate replaced by rubber at volume ratios of 0.5, 1, 2, and 4%. The water/cement ratio was maintained at 0.50 for all mixtures. Drop-weight impact tests were conducted on specimens incorporating and excluding waste rubber, where the impact energy required for initial cracking and final denting was determined using a free-falling steel ball at a specified height [47]. To study and evaluate the impact of waste rubber fibers replacing fine aggregates on the impact resistance of concrete [48]. For three different cement ratios, six rubber fiber substitution levels (0, 5, 10, 15, 20, and 25%) were considered. Impact tests were conducted on the concrete through three different techniques: drop hammer test, bending load test, and rebound test. To address the issue of significant variations in impact values, a two-parameter Weibull distribution was adopted to analyze the experimental data of the drop weight test. The study [49] aims to evaluate the impact resistance of synthetic fiber reinforced self-compacting rubber concrete, maximizing the impact resistance and energy absorption of self-compacting rubber–concrete mixtures by optimizing the proportion of the mixture and using the most suitable type and volume of synthetic fibers. This study also introduced the influence of steel fibers on the impact resistance performance of self-compacting rubber concrete.
Based on previous research, in this study, 10% rubber particles were added to concrete to prepare RC. Then, SSFs were added to the RC with a strength grade of C30 in different volume dosages (0, 0.5, 1.0, 1.5, 2.0, 2.5%) to prepare cubic and cylindrical specimens. Taking NC as the control, the compressive and impact resistance properties of SSFRC with different dosages of SSF were studied through basic mechanical compressive tests and drop hammer impact tests. Meanwhile, finite element models were established using ABAQUS CAE 2023, and the concrete damage plasticity (CDP) model was combined with the test data of different dosages by comparing the failure modes and impact energy absorption values of NC and specimens with 1.5% SSF dosage. This work makes up for the defect in the existing research that “impact performance tests are disconnected from numerical simulation”, and the simulation results were compared with the test results to verify the feasibility.

2. Experimental Process and Method

2.1. Material Preparation

This experiment aimed to study the impact of waste steel fiber dosage on the impact resistance of SSFRC. Therefore, other dopants were not considered. The main raw materials were as follows:
  • Cement: the same grade of P.C 42.5R [50] Red Lion Composite Silicate Cement (Hongshi Group Co., Ltd., Zhejiang province, China) is used to ensure the test results.
  • Water: ordinary tap water for daily use was used.
  • SSF: SSF used in this test came from the lathe machining trimmings of a company in Chengdu, China. The original form of SSF, which was picked to select the more neatly spiraled steel fibers (Figure 1b), is shown in Figure 1a. The surface of the selected SSF was clean and tidy, free from rust, oil, and impurities, and its mechanical properties are shown in Table 1.
  • Aggregates: coarse aggregates used ordinary crushed stone with a grain size of 5–20 mm; fine aggregates adopted medium sand with a fineness modulus of 1.85 and a moisture content of 0.5% or less produced locally in Sichuan.
  • Rubber: rubber particles with a particle size of 1–3 mm were obtained by shredding waste rubber tires (Figure 2).

2.2. Specimens’ Manufacture and Maintenance

In addition to meeting the principle of economy, the mix proportion of concrete should also meet the requirements of strength level design, durability, and workability. When steel fibers are added into rubber concrete, it is necessary to prevent the phenomenon of “agglomeration”, when the dosage is too large, which will affect the uniformity and fluidity of RC. The relevant standards [51,52] are referred to ensure the uniformity and fluidity of rubber concrete under the determination of the proportion. In this study, the strength grade of concrete was C30, and the used steel fibers were added into RC with the dosages of 0, 0.5, 1.0, 1.5, 2.0 and 2.5% respectively. The specific mix proportion are shown in Table 2.
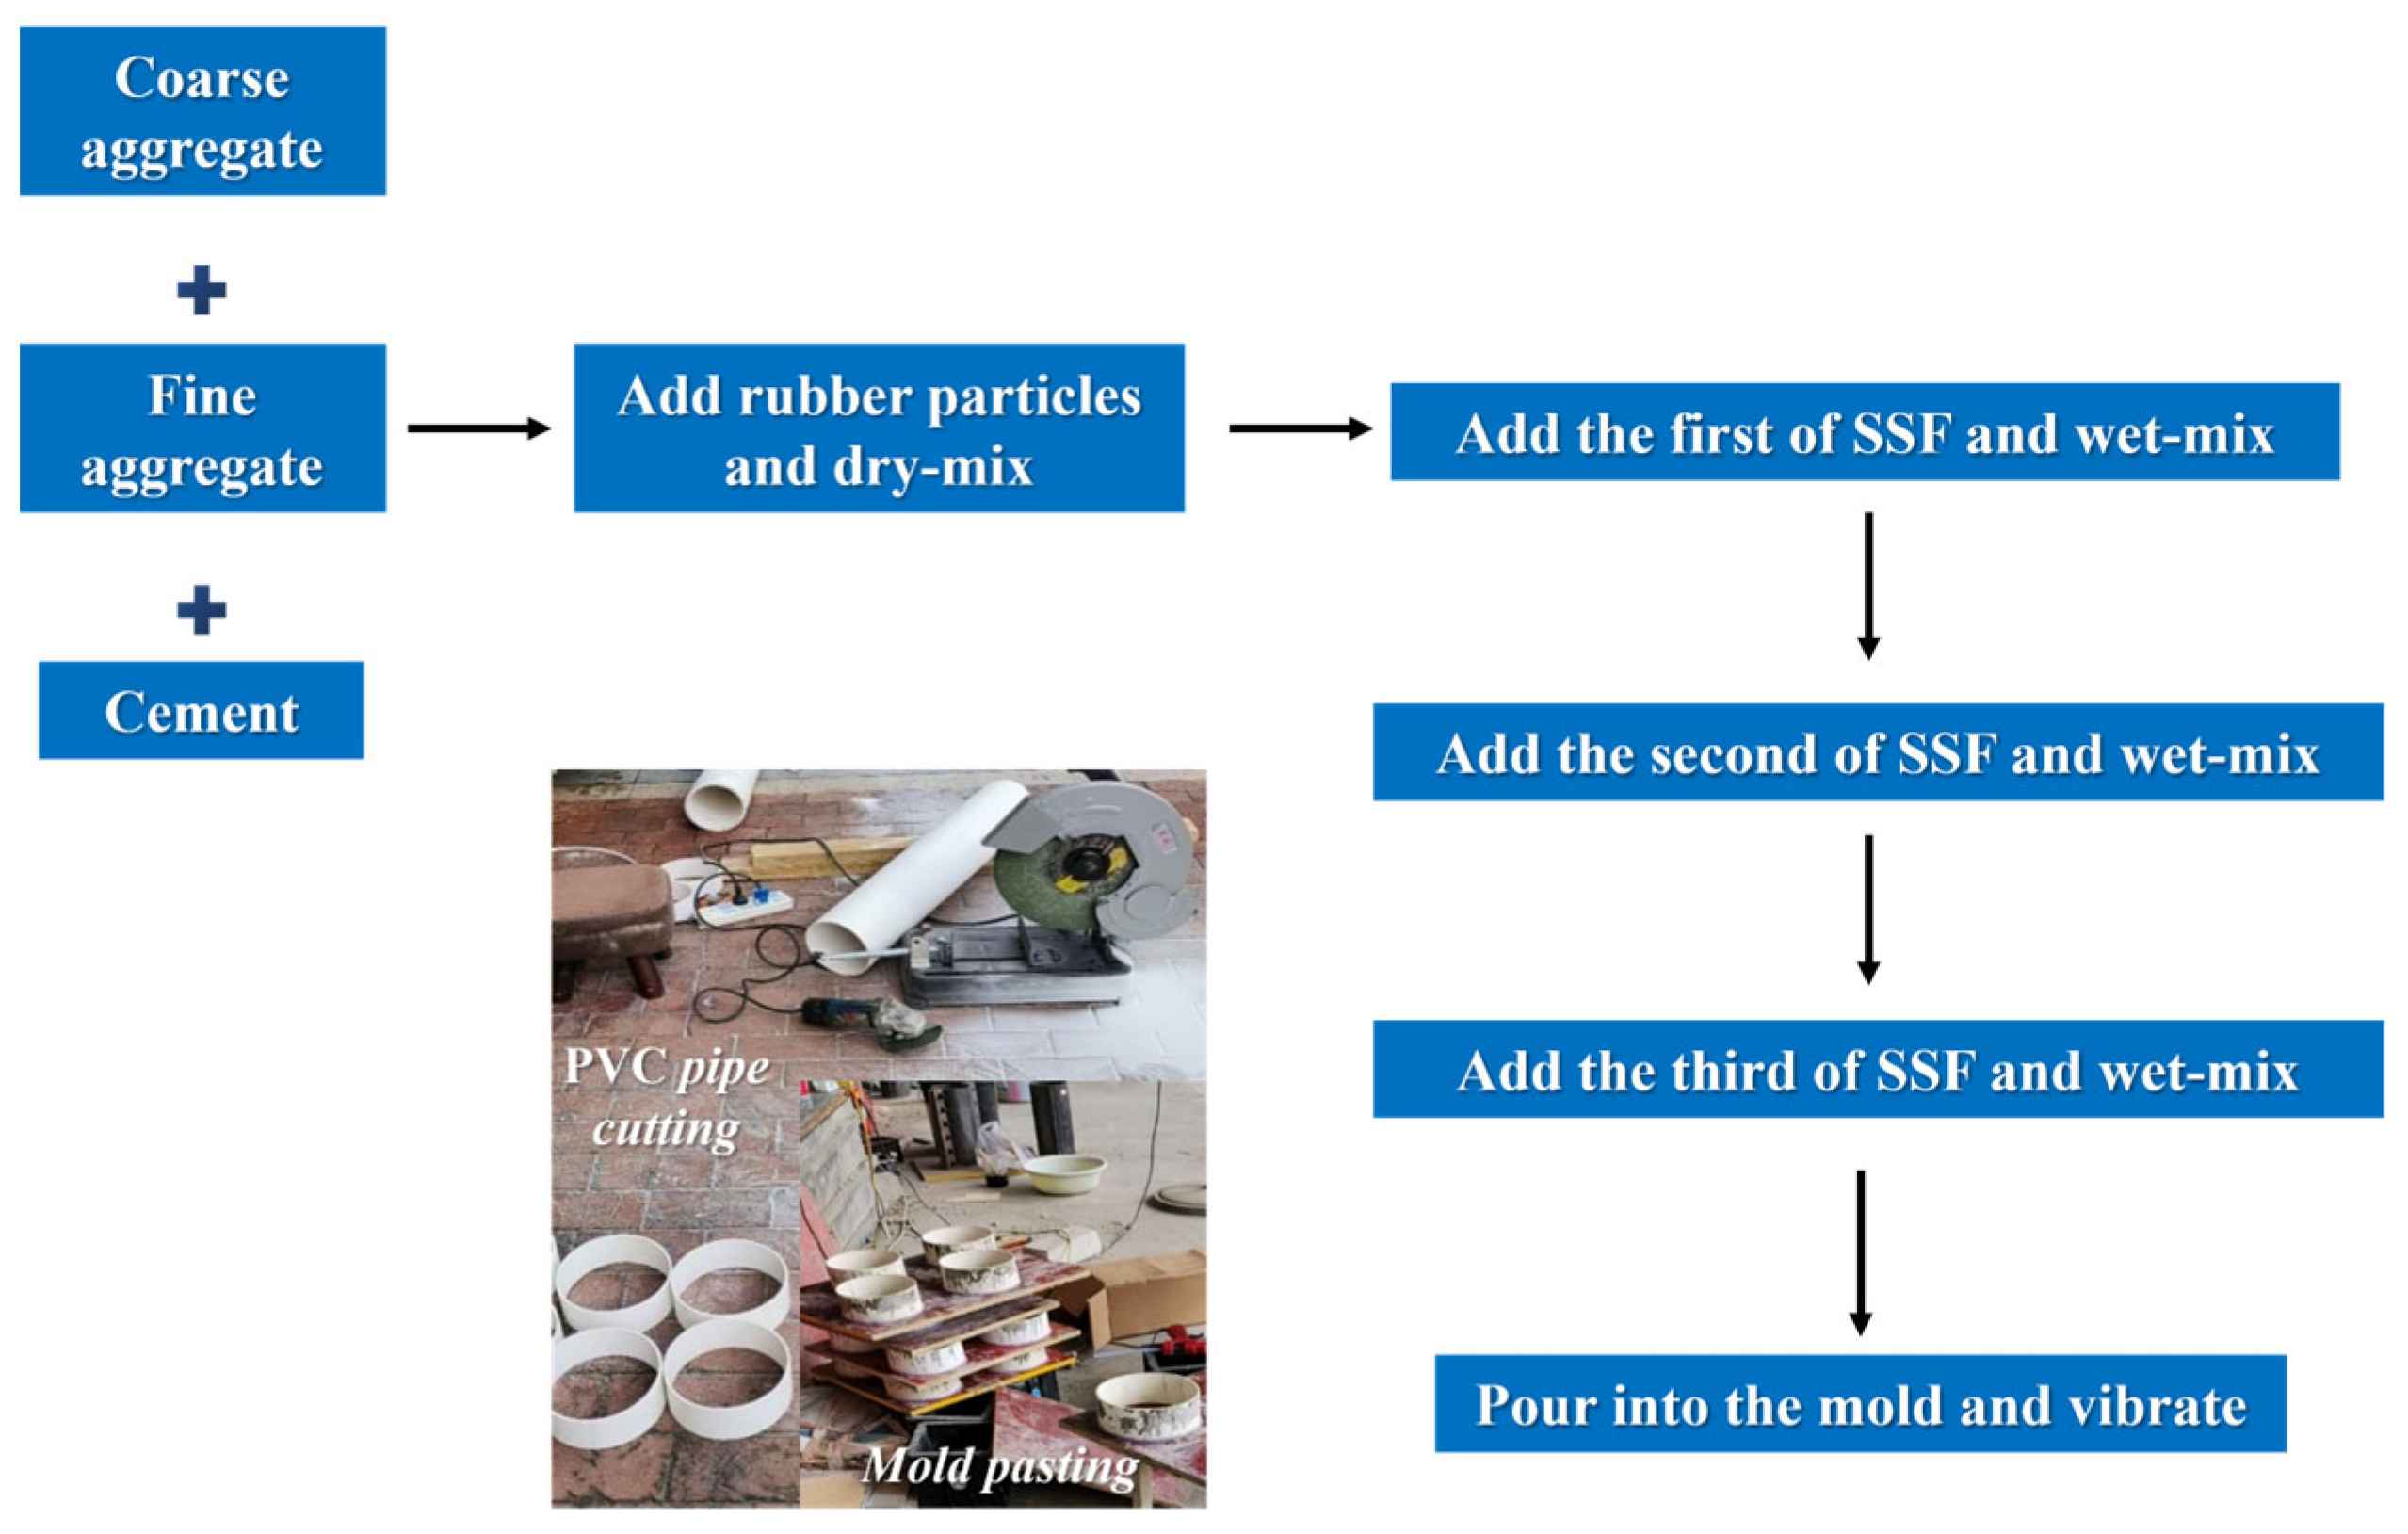
This test was designed for two specifications of specimens: one was 100 mm ×100 mm × 100 mm specimen for concrete cube compression, and the other was 150 mm × 65 mm (diameter × thickness) cylindrical specimen for impact resistance. The size and number of each group of specimens are shown in Table 3. The cylindrical PVC pipe offers advantages such as non-deformability, corrosion resistance, ease of material acquisition, and low cost. Therefore, in this study, the mold was fabricated from a PVC pipe. The specimen preparation flowchart is shown in Figure 3.
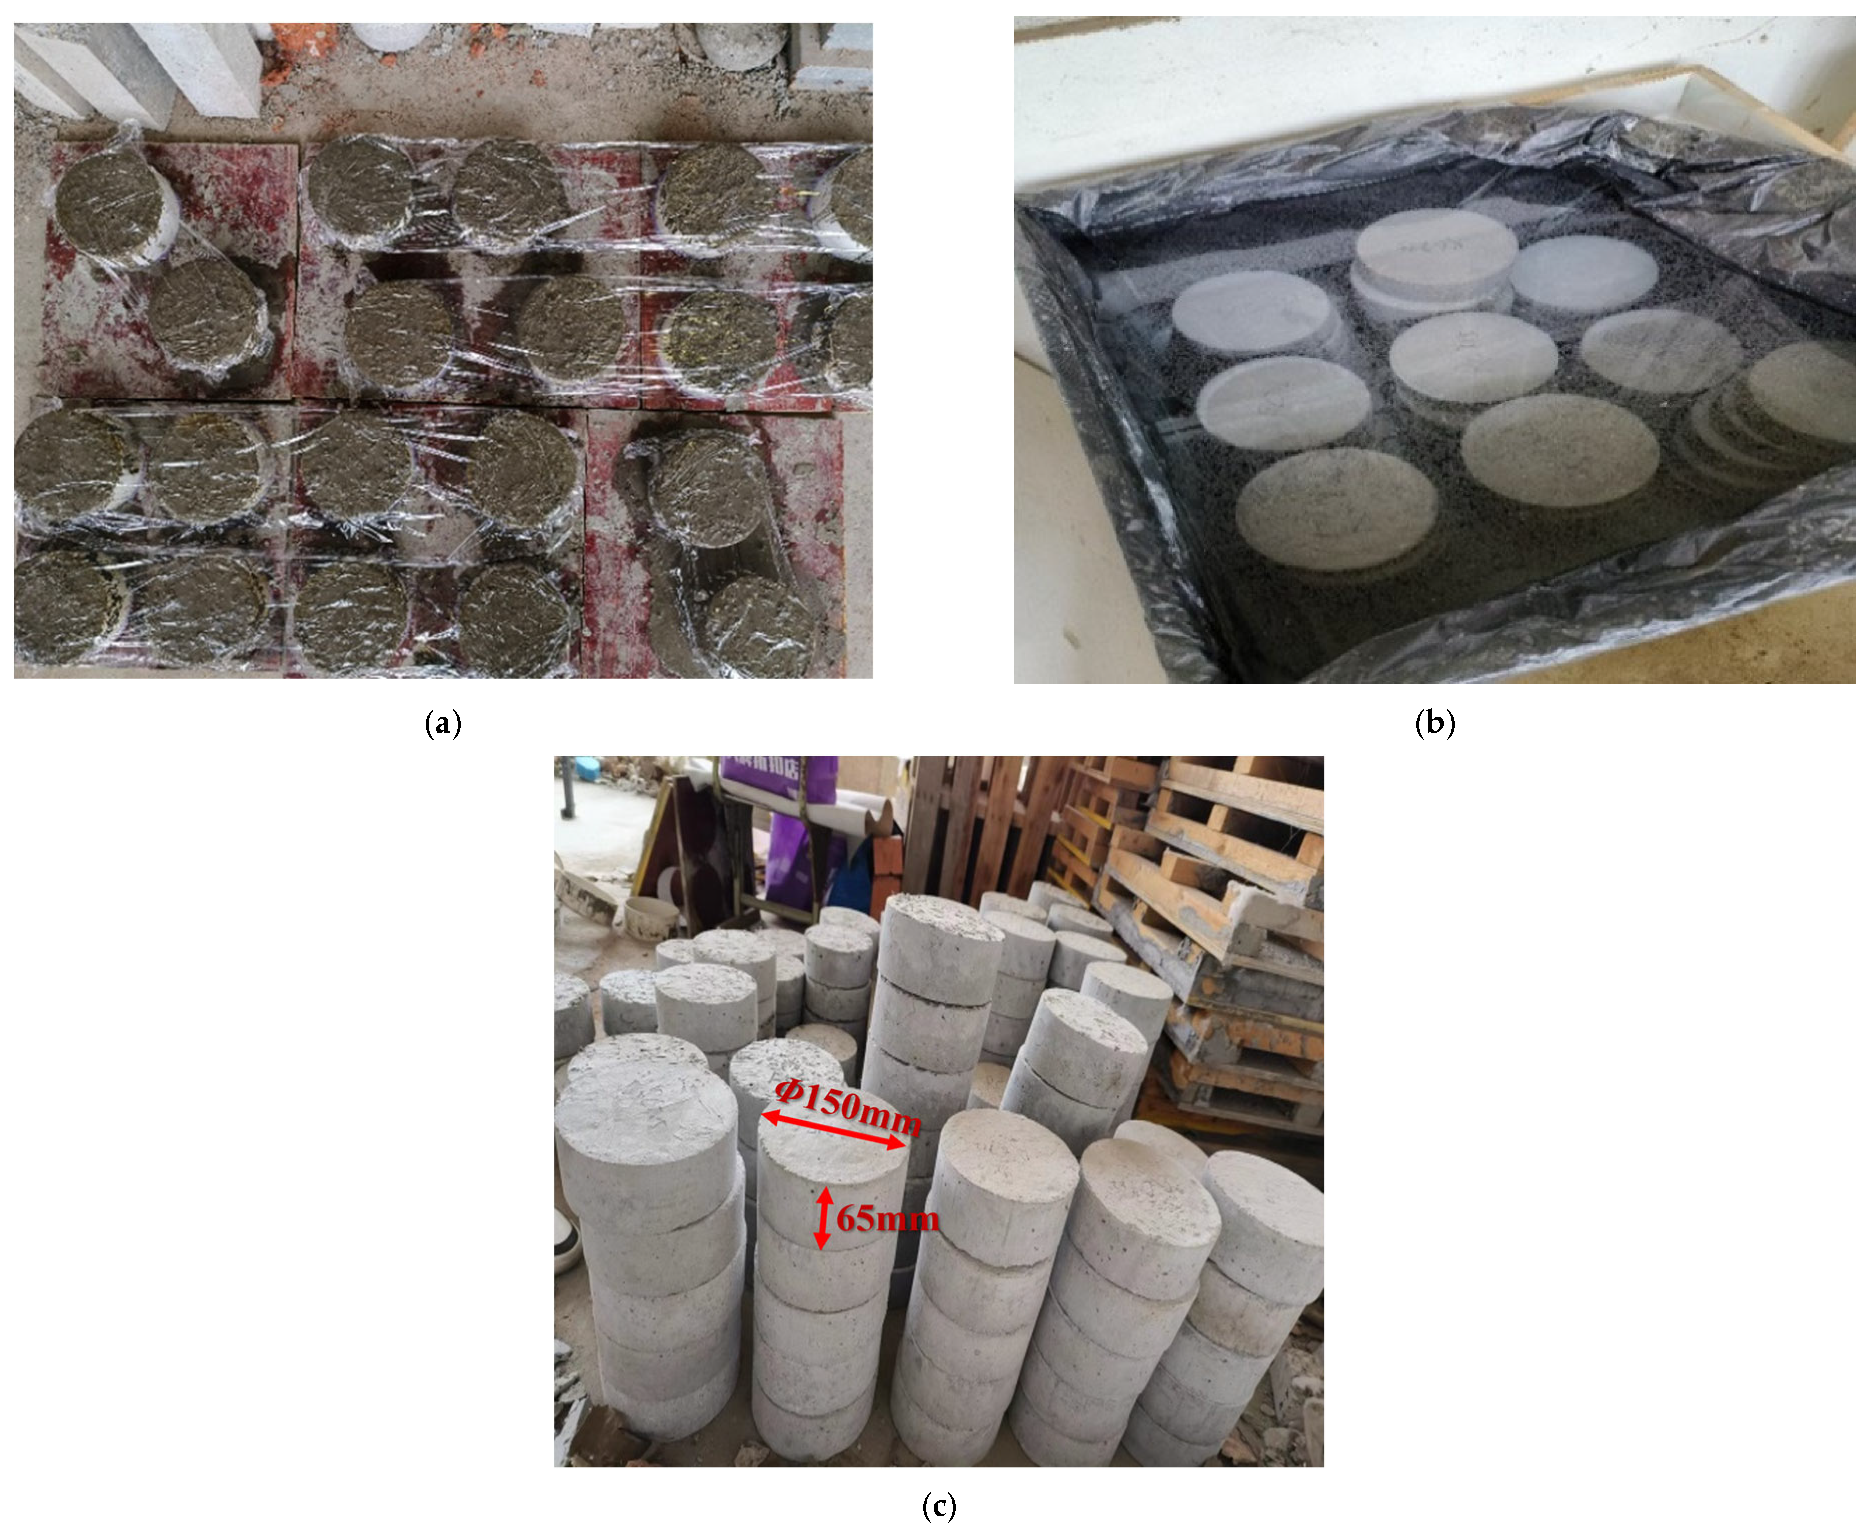
The prepared specimens were placed on a flat surface according to their grouping categories and immediately covered with plastic film. They were demolded and numbered 24 h after casting and shaping. Finally, specimen curing was carried out. The specimens were then placed into a standard curing tank with a relative humidity of over 95%, a room temperature of approximately 23 °C, and a tank temperature of (20 ± 2) °C for 28 days, as depicted in Figure 4.

2.3. Test Device

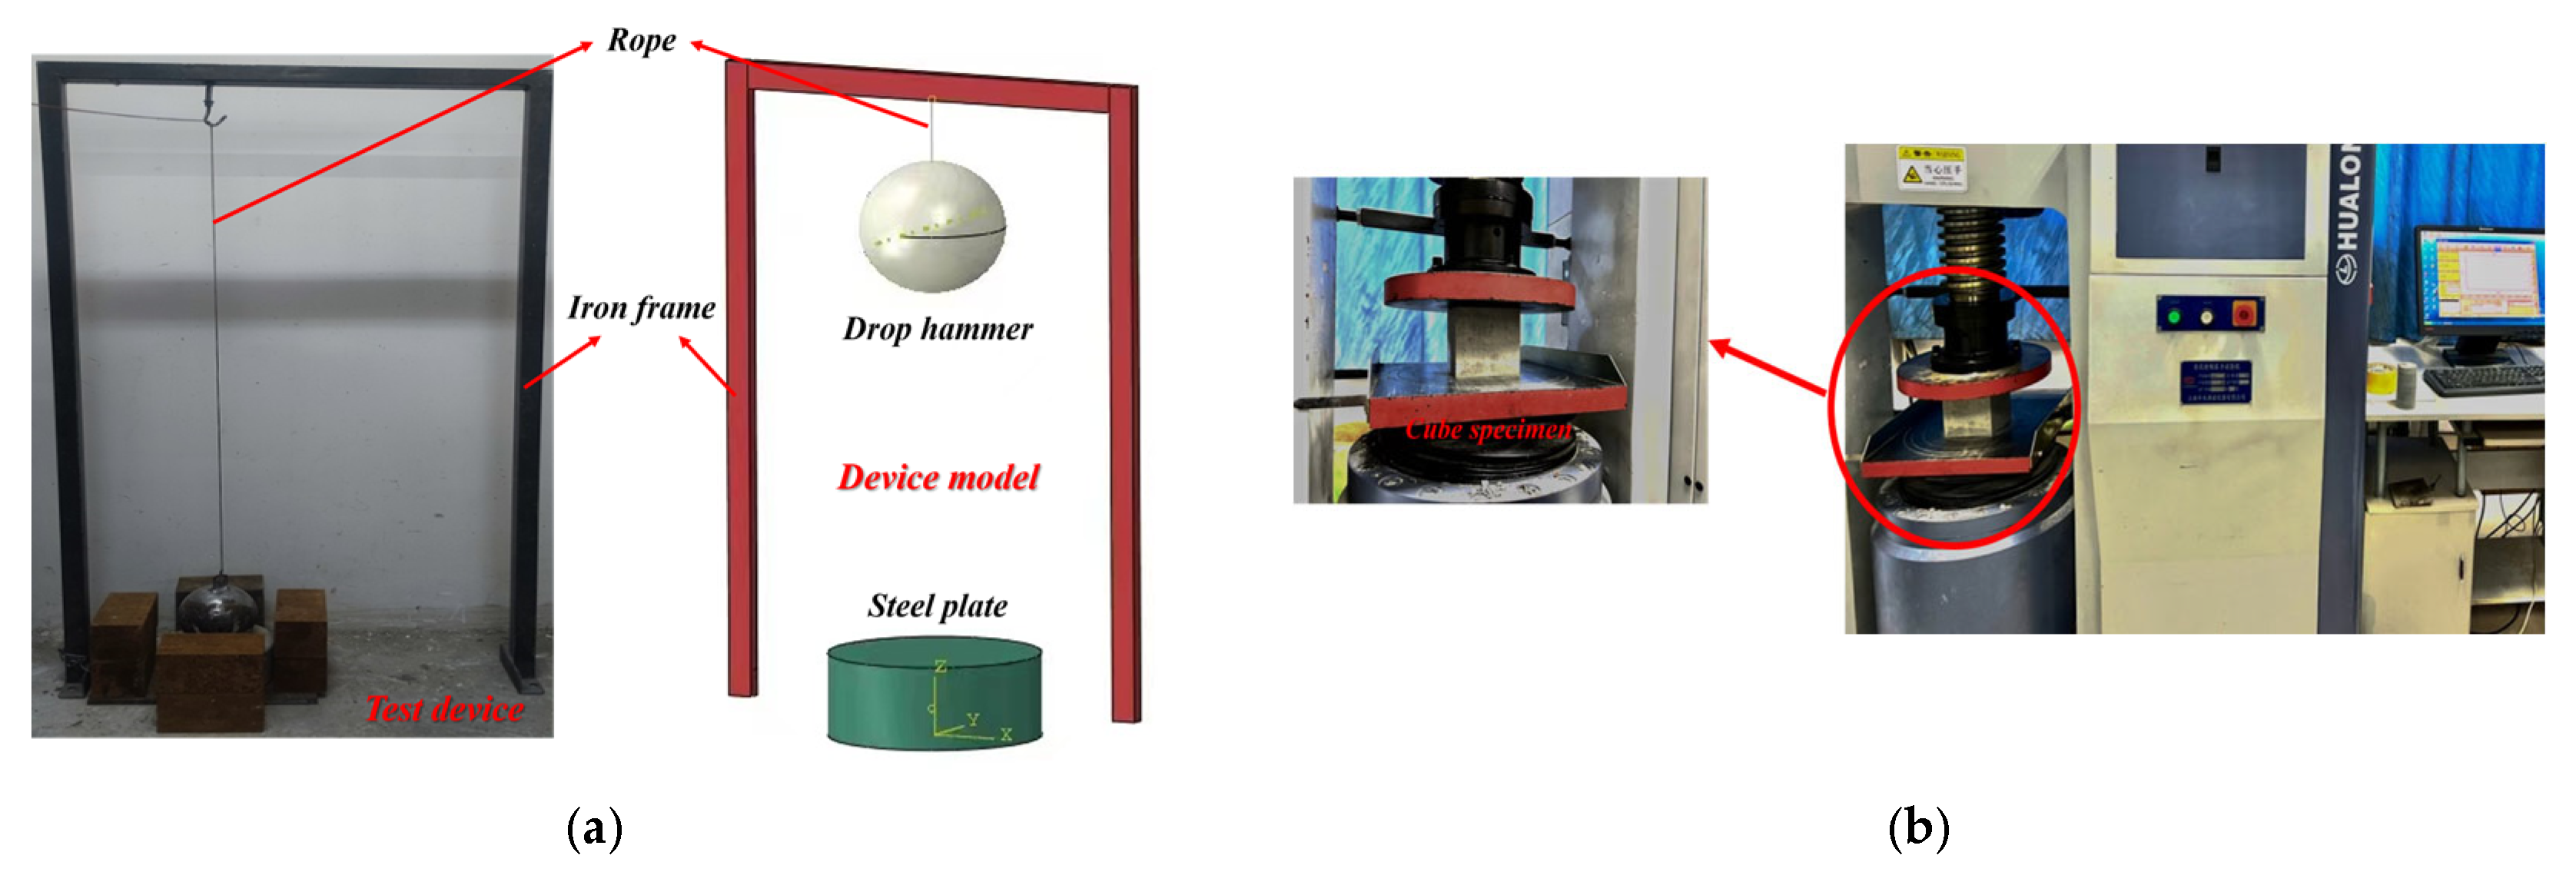
The hammer impact test device in this study is an improvement of the existing device, the main components of which include an iron frame with an iron hook at the top and a drop hammer with a round hole, a rope connecting the drop hammer and the iron frame, and a steel plate padded at the bottom of the test specimen. The rope raises the hammer to the required height for the test to fix the height and position of the hammer’s fall; the friction between the rope and the hook can be neglected, improving the accuracy of the test and saving costs (Figure 5a). Three different weights (4.5, 6.0, 7.5 kg) of drop hammers were prepared and placed at three different heights (450, 575, 750 mm). The maximum range of the WHY-1000 microcomputer-controlled pressure testing machine (Shanghai Hualong Test Instruments Corporation, Shanghai city, China) was used to carry out the cube compressive strength test, as shown in Figure 5b.

3. Results and Discussion

3.1. Cube Compression Test

3.1.1. Test Results and Analyses

Because the specimens used in the cubic compressive tests in this study are non-standard specimens, with length, width, and height of 100 mm × 100 mm × 100 mm, according to the Standard Test Methods for Fiber Concrete, the strength of the test specimens measured through the test need to be multiplied by a conversion factor of 0.95 to be the final compressive strength.
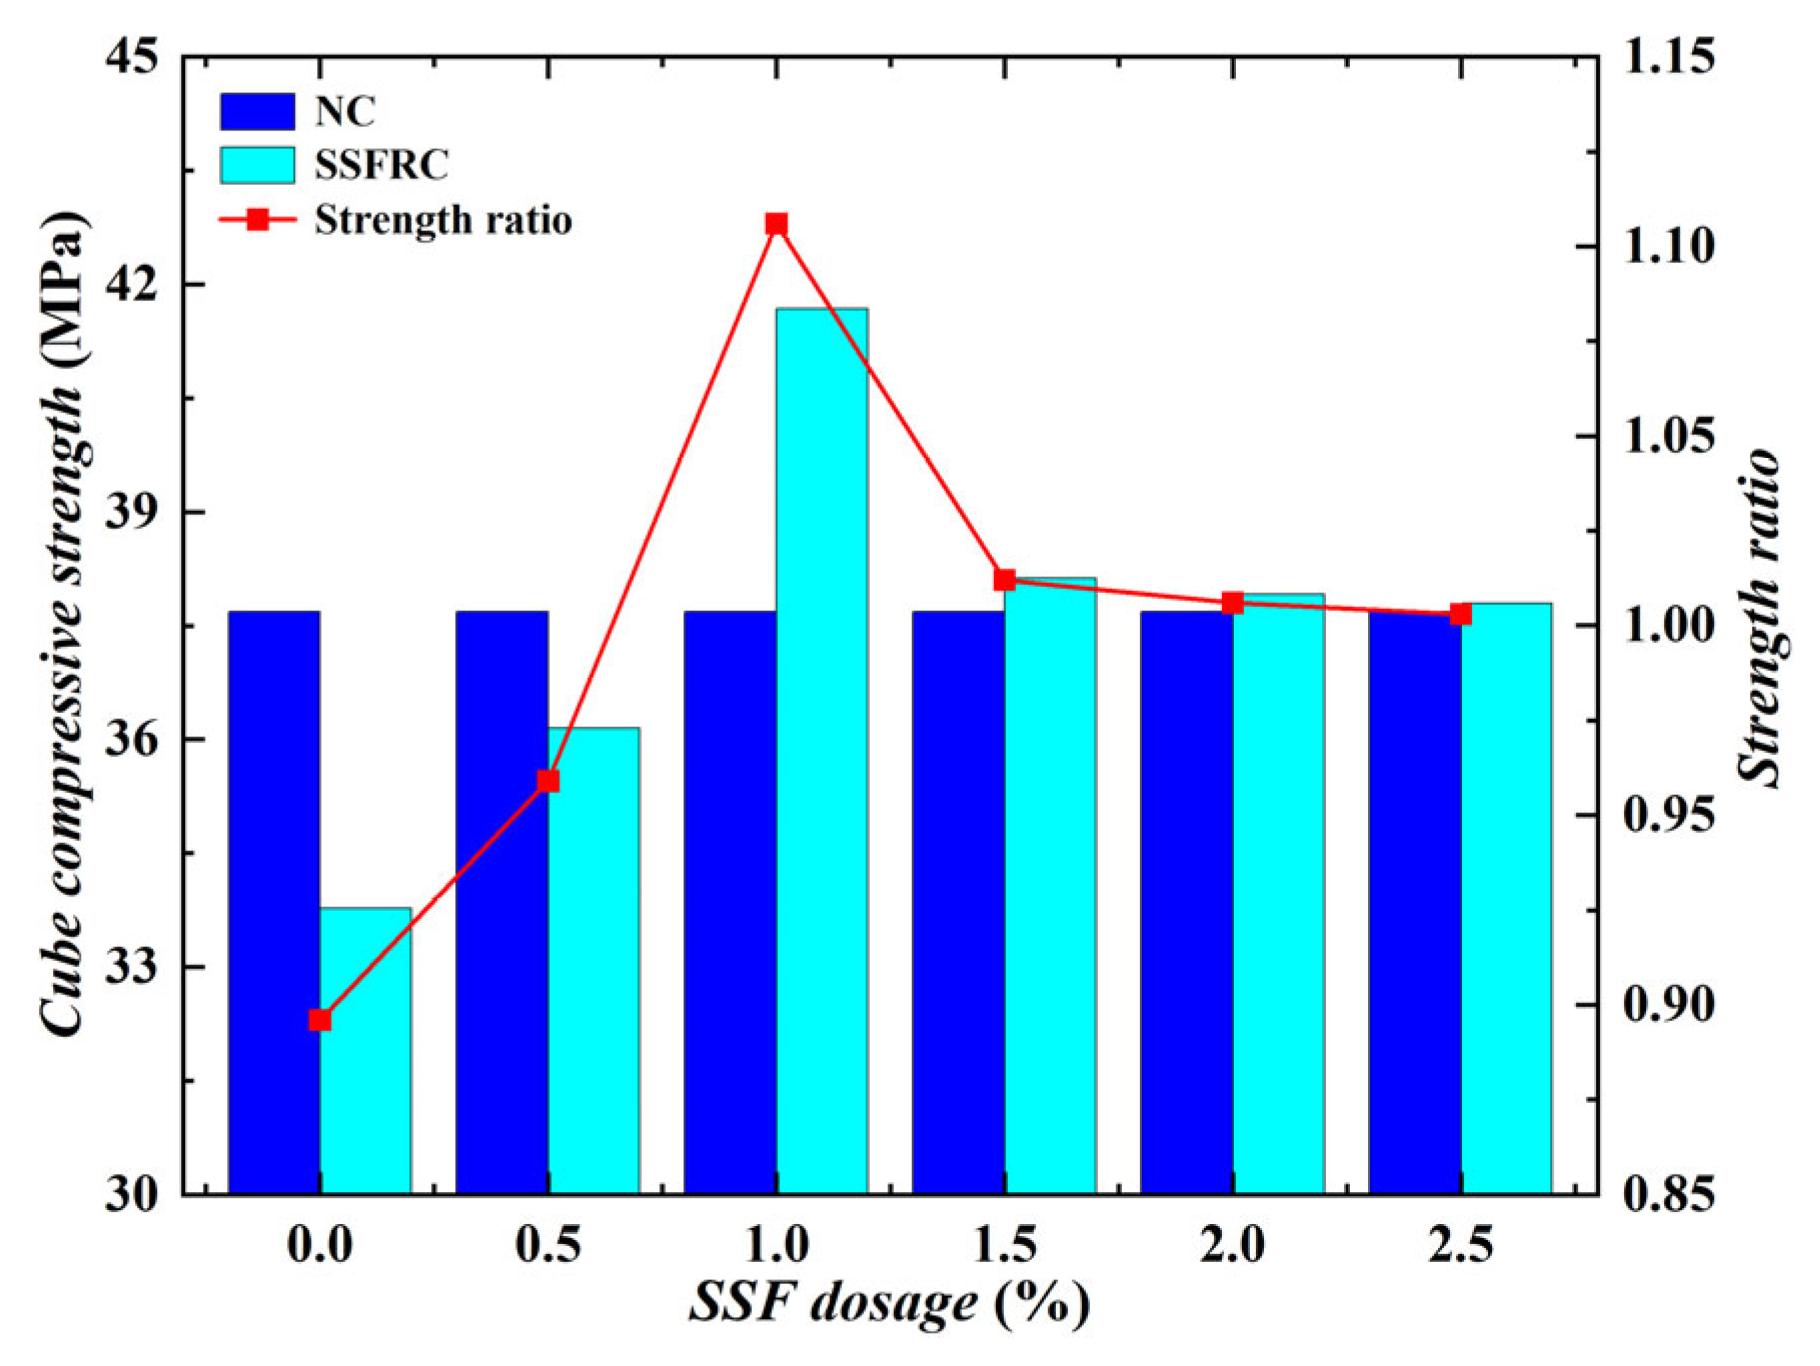
The cube compressive strength values and strength ratios obtained from the cubic compression tests are shown in Table 4. From the table, it can be seen that 10% volume dosage of rubber particles added to NC decreases the cube compressive strength from 37.68 to 33.77 MPa, a decrease of 10.4%, and the strength ratio of RC to NC is 0.896.
The trend of cubic compressive strength with respect to the dosage of scrap steel fibers is shown in Figure 6. It can be concluded from the diagram that when the dosage of used scrap steel fibers is 0–1%, the compressive strength of SSFRC increases with the increase of the dosage; when the dosage is 1–2.5%, the strength decreases with the increase of the dosage: the overall trend of first increase and then decrease. The combination of the diagram and the table shows that when the dosage of scrap steel fibers is 1%, the cube compressive strength of SSFRC reaches a maximum value of 41.68 MPa, which is 23.4% higher than that of rubber concrete.
Due to the low strength of the rubber particles themselves and the surface adsorption of some gases, a weak zone of force is formed inside the concrete, so the compressive strength of rubber concrete is bound to be lower than that of normal concrete. When the dosage of scrap steel fibers is not more than 1%, the scrap steel fibers are firmly fused with the matrix and form an intricate three-dimensional support system inside, which makes the test block reduce the gaps and strengthen integrity, and the scrap steel fibers will also bear part of the stress under the dynamic loading, so its compressive strength is increased. But when the dosage of scrap steel fibers is more than 1%, the scrap steel fiber dosage is too much; in the test block, it will be piled up into a group, resulting in increased voids and increased weak areas, so its compressive strength will be decreased.

3.1.2. Failure Modes

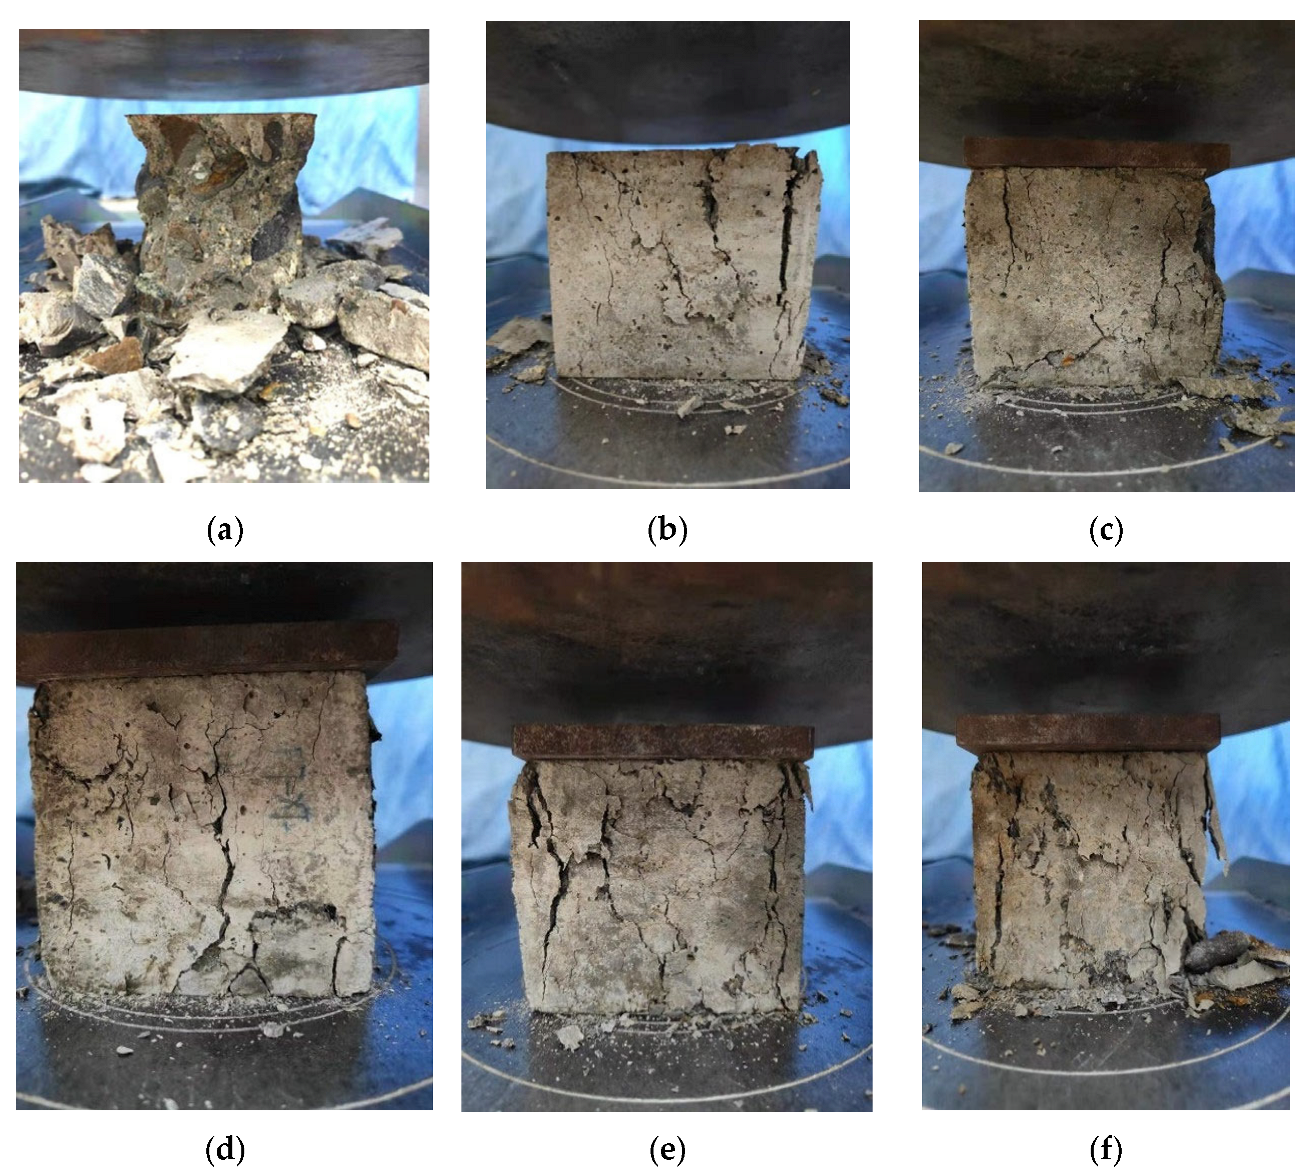
Figure 7 shows the compression failure modes of SSFRC. Throughout the compression test, it can be seen that NC, RC, and SSFRC have completely different damage patterns.
NC in the compression damage is brittle damage. In the loading process, there are more small cracks; the cracks at both ends of the specimen gradually expand and extend, the concrete around the specimen is seriously detached, the specimen is crushed and finally destroyed after the overall presentation of the two ends of the thick middle of the thin, wedge-shaped damage surface, and the whole destruction process is completed instantly.
During the loading process, cracks appeared in the RC and extended, and the slender cracks penetrated through the specimen and caused part of the concrete to be peeled off, and the whole specimen had a complete form with a certain degree of ductility. Compared with NC, SSFRC did not have obvious sound when damaged, the degree of concrete spalling was smaller, and the number of cracks was larger than NC, but the width was smaller. This may be due to the fact that rubber is an elastic material that can bear and buffer the concentrated stress in the voids when it is added to the concrete, preventing the development of cracks.
After the used SSF was added to the RC, the compression failure mode was significantly improved. The pressure damage could be heard when the metal friction produced a fine sound, cracks were also finer and fewer compared to the previous two, the time until the specimen was completely destroyed was longer, and the integrity was better, with almost no falling debris and very good toughness characteristics. That is because after SSFs were mixed in, when the specimen was damaged, the fibers were pulled out, consuming a lot of energy, making the stress on the specimen reduced and greatly reducing the brittleness of the specimen.
In the study, when the dosage of SSF was 1%, the compressive strength significantly increased, while when it was 1.5, 2, and 2.5%, the compressive strength changed gently (or even slightly decreased). The reasons for this phenomenon are as follows:
  • Under compressive loads, uniformly distributed 1% dosage of fibers can play a role through axial stress-sharing and lateral constrained deformation: the high tensile strength of the fibers themselves can bear part of the compressive stress transmission, and at the same time, their helical structure exerts radial constraints on the matrix, reducing the lateral expansion and micro-crack initiation of concrete under compression, which is consistent with [25].
  • When the dosage of SSF continues to increase, the agglomerated fibers will cause a sharp increase in the interface area between them and the matrix. However, the cement paste cannot fully wet the surface of each fiber, resulting in the directional growth of calcium hydroxide crystals in the interface transition zone and a loose structure [23]. When under pressure, these weak interfaces are the first to be damaged, and the cracks rapidly expand along the edges of the aggregates, resulting in the overall compressive strength being unable to continue to increase and even slightly decreasing.
  • The elastic deformation characteristics of rubber particles may exacerbate structural instability at high fiber content: when under pressure, the local deformation of rubber particles will exert additional shear force on the surrounding agglomerated fibers, causing the fiber–matrix interface to peel off earlier and further weakening the compressive performance [17].

3.2. NC Impact Resistance Analysis

Table 5 shows the impact lifetimes of NC, where N1 represents the number of impacts when the first crack observable to the naked eye appears, and N2 represents the number of impacts when the crack width is greater than 3 mm. It can be seen from the table that the number of cracks produced when NC fails does not increase significantly with the increase of the weight of the drop hammer and the height of its drop, but is almost stable at 1–2. The energy absorbed during destruction decreases as the energy of each impact increases.

3.3. SSFRC Impact Resistance Analysis

The corresponding relationship between the drop hammer weight and the drop height in the SSFRC drop hammer impact test is as follows: the hammer weights are 4.5, 6.0, and 7.5 kg, respectively, and the drop heights of these three weights are 450, 575, and 700 mm, respectively. The volume dosages of SSF are 0, 0.5, 1, 1.5, 2, and 2.5%, respectively. The length of SSF is controlled within the range of 20 to 40 mm. The test results are shown in Table 6, Table 7 and Table 8.
The phenomenon that the compressive performance of SSFRC with a 1.5% dosage is slightly lower than that with a 1% dosage, but its impact performance is better, is due to the following reasons:
  • The compressive performance mainly depends on the compactness of the material, the integrity of the matrix, and the synergistic load-bearing capacity of the fibers and the matrix. When the dosage is 1.5%, the increase in the number of fibers leads to a higher probability of local agglomeration, forming tiny voids and weak areas. Under static pressure, these voids cannot be filled by the dynamic energy dissipation of the fibers, and the stress is concentrated in the weak areas, resulting in a decrease in compressive strength.
  • Impact performance is more dependent on the energy dissipation capacity of the material, and dynamic impact energy needs to be consumed through fiber bridging, rubber elastic buffering, and crack propagation inhibition. The number of fibers with a 1.5% dosage is greater than that of those with a 1% dosage, and the network formed by the three-dimensional helical structure is denser. Under impact loads, new cracks are more likely to be “captured” by fibers—fibers bear tensile stress through their bonding force with the matrix, preventing rapid crack propagation. Meanwhile, the process of fibers being pulled out or broken consumes a large amount of impact energy.

3.4. Analysis of Factors Affecting the Impact Resistance Results of SSFRC

3.4.1. Effect of the Number of Hammer Strikes on the First Crack and the Specimen Failure

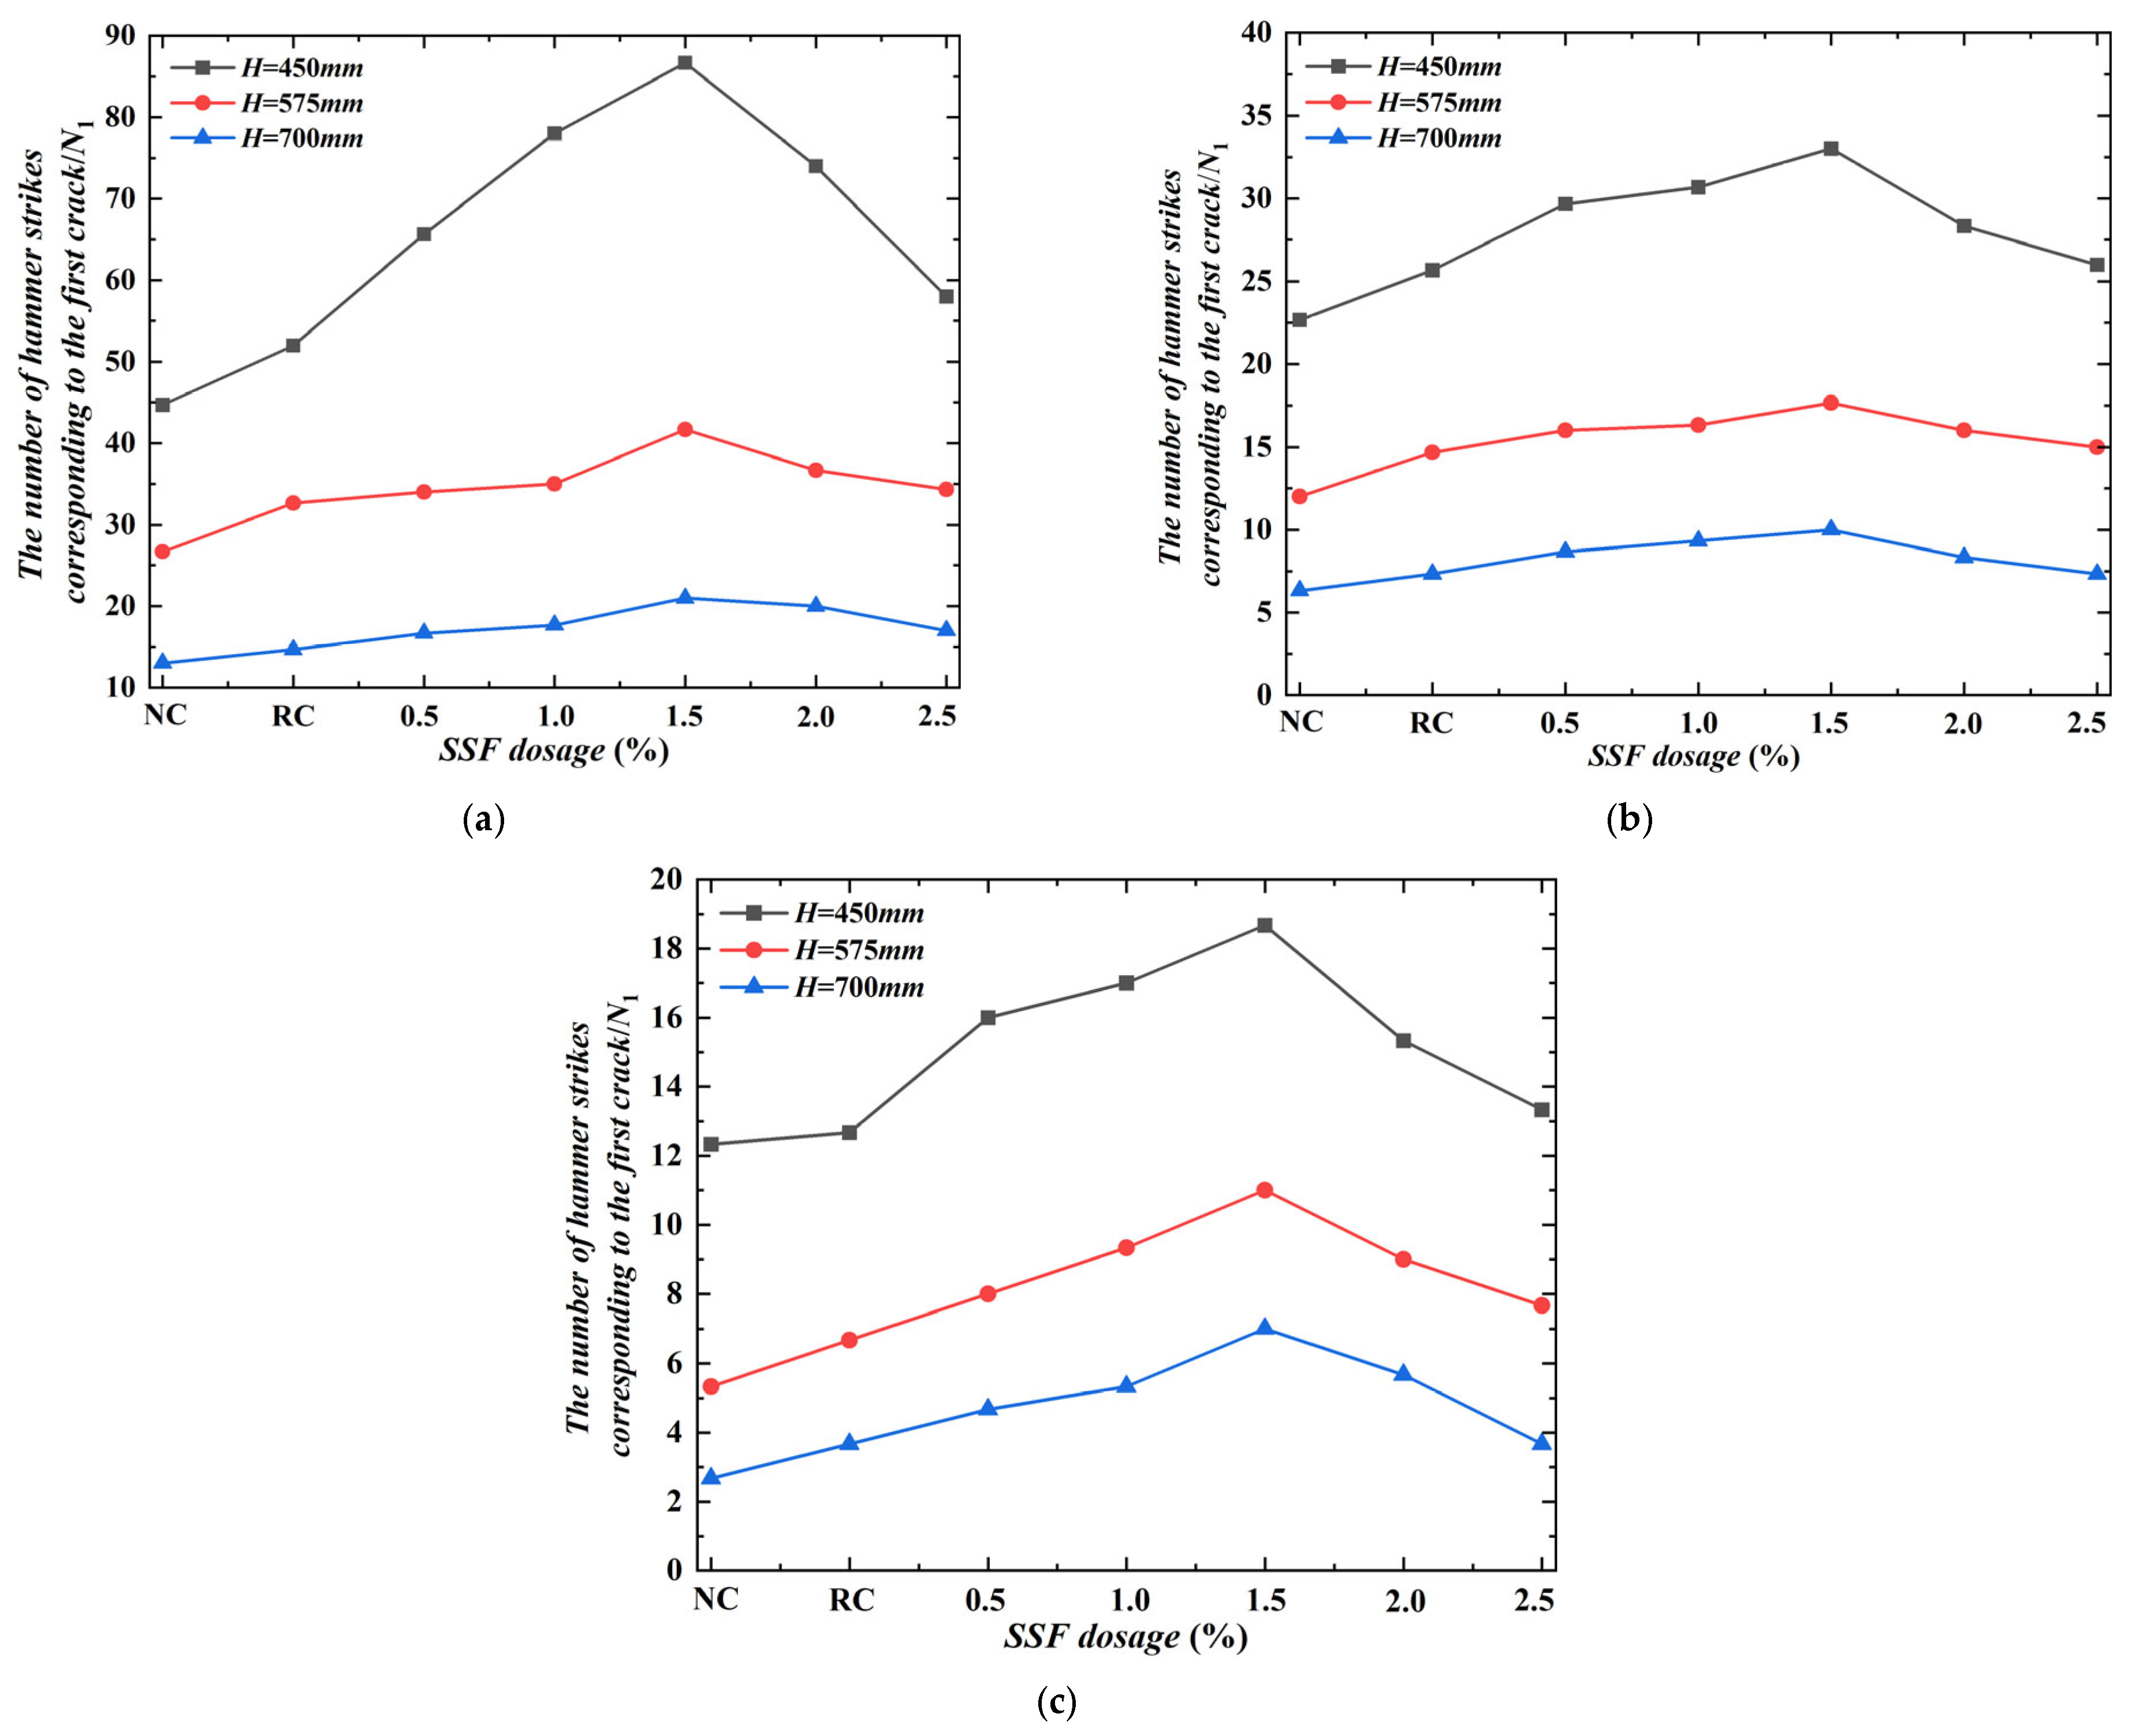
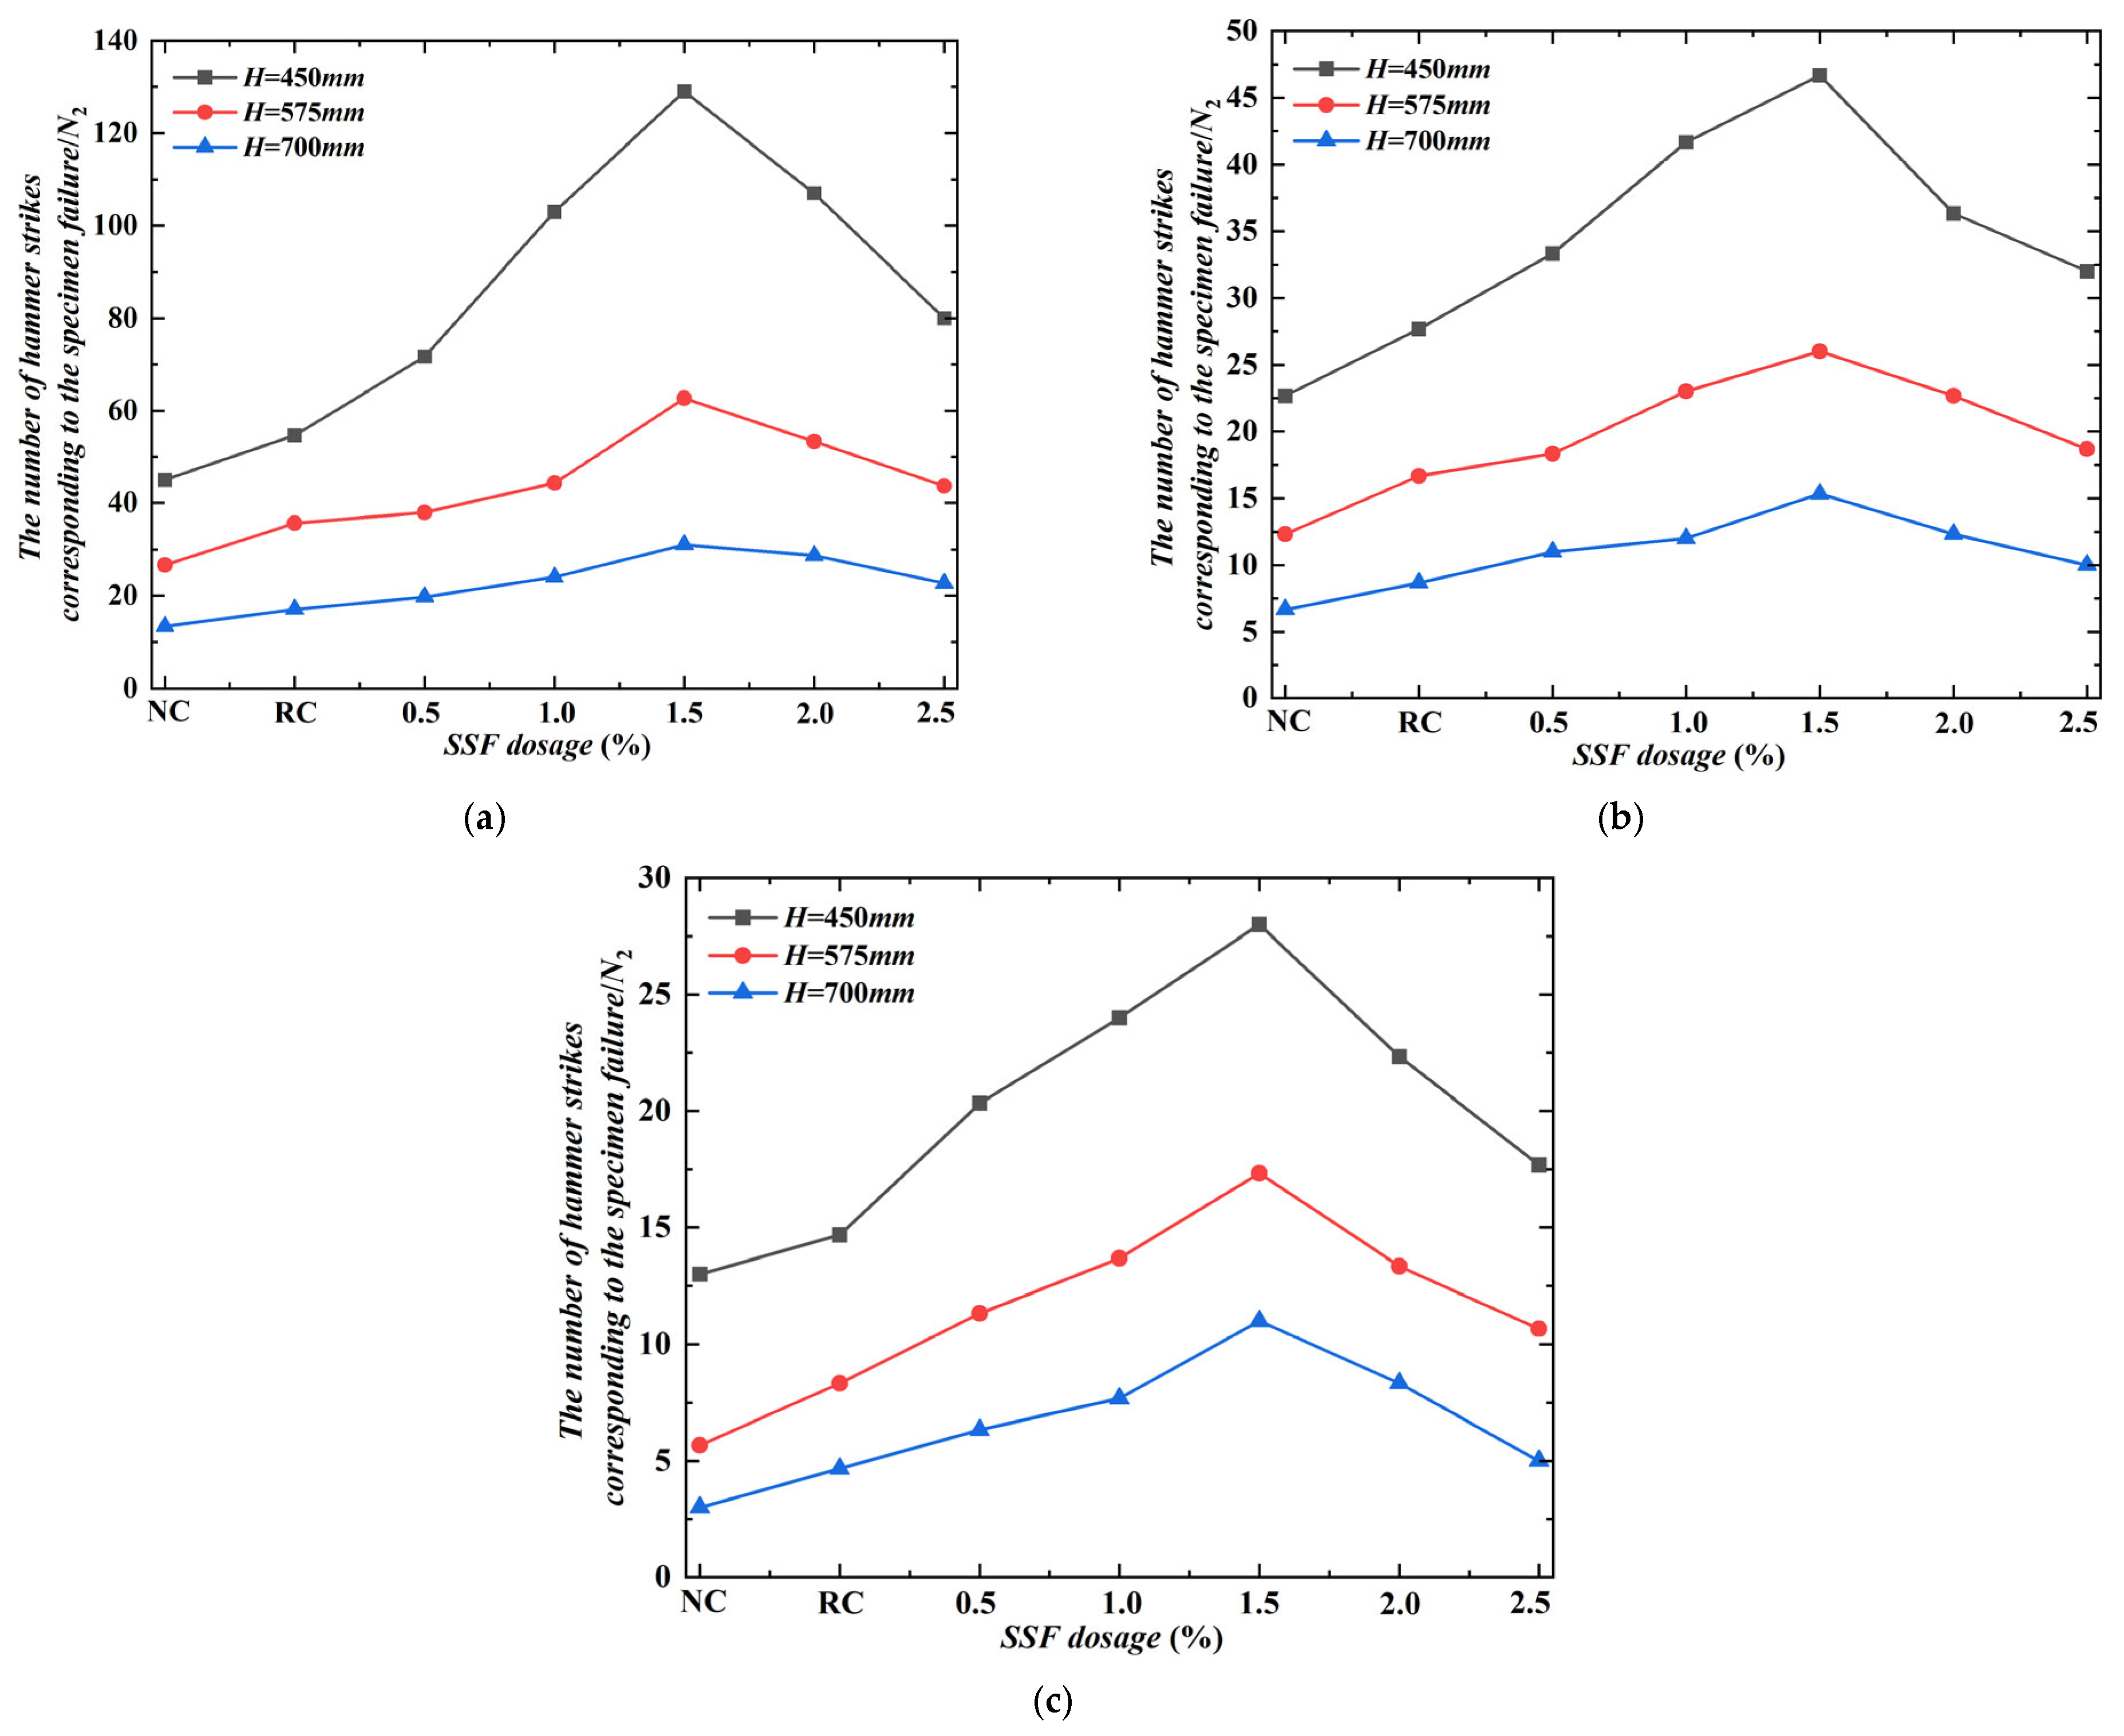
Based on the statistics in Table 5, Table 6, Table 7 and Table 8, Figure 8 and Figure 9 show the number of hammer strikes N1 corresponding to the appearance of the first crack and the number of hammer strikes N2 corresponding to the failure of the specimens when the hammer of different weights, NC, RC, and SSFRC with different dosages fall from different heights. Figure 8 and Figure 9 show that the impact resistance of SSFRC first increases and then decreases with the dosage of SSF.
When the SSF dosage is 0–1.5%, the impact resistance of SSFRC increases with the increase of SSF dosage. This is attributed to the active connection effect of steel fibers when transferring loads along the cracks. When the concrete is under load, the fibers prevent or slow down the growth of cracks, thereby absorbing more impact energy. Steel fibers can enhance the tensile strength of concrete by controlling the development of cracks, thereby enabling the concrete to have greater ductility under tensile, bending and impact loads.
When the SSF dosage is 1.5–2.5%, the impact resistance of SSFRC decreases with the increase of the dosage of SSF. This is because when a large amount of SSF is added to the RC, the steel fibers are unevenly distributed inside the specimens, and there will be mutual entanglement and overlap, which has a negative impact on the strength of the matrix.
Figure 8 and Figure 9 also show that regardless of the dosage of SSF, the higher the drop hammer height, the more the number of hammer strikes when the first crack appears on the specimen. The number of hammer strikes corresponding to specimen failure are significantly reduced; that is, the impact force increases with the increase of the drop hammer height. Therefore, the specimens at a smaller drop height have a longer duration before cracking and failure compared with those at a larger drop height.

3.4.2. Effect of Drop Height on Impact Energy

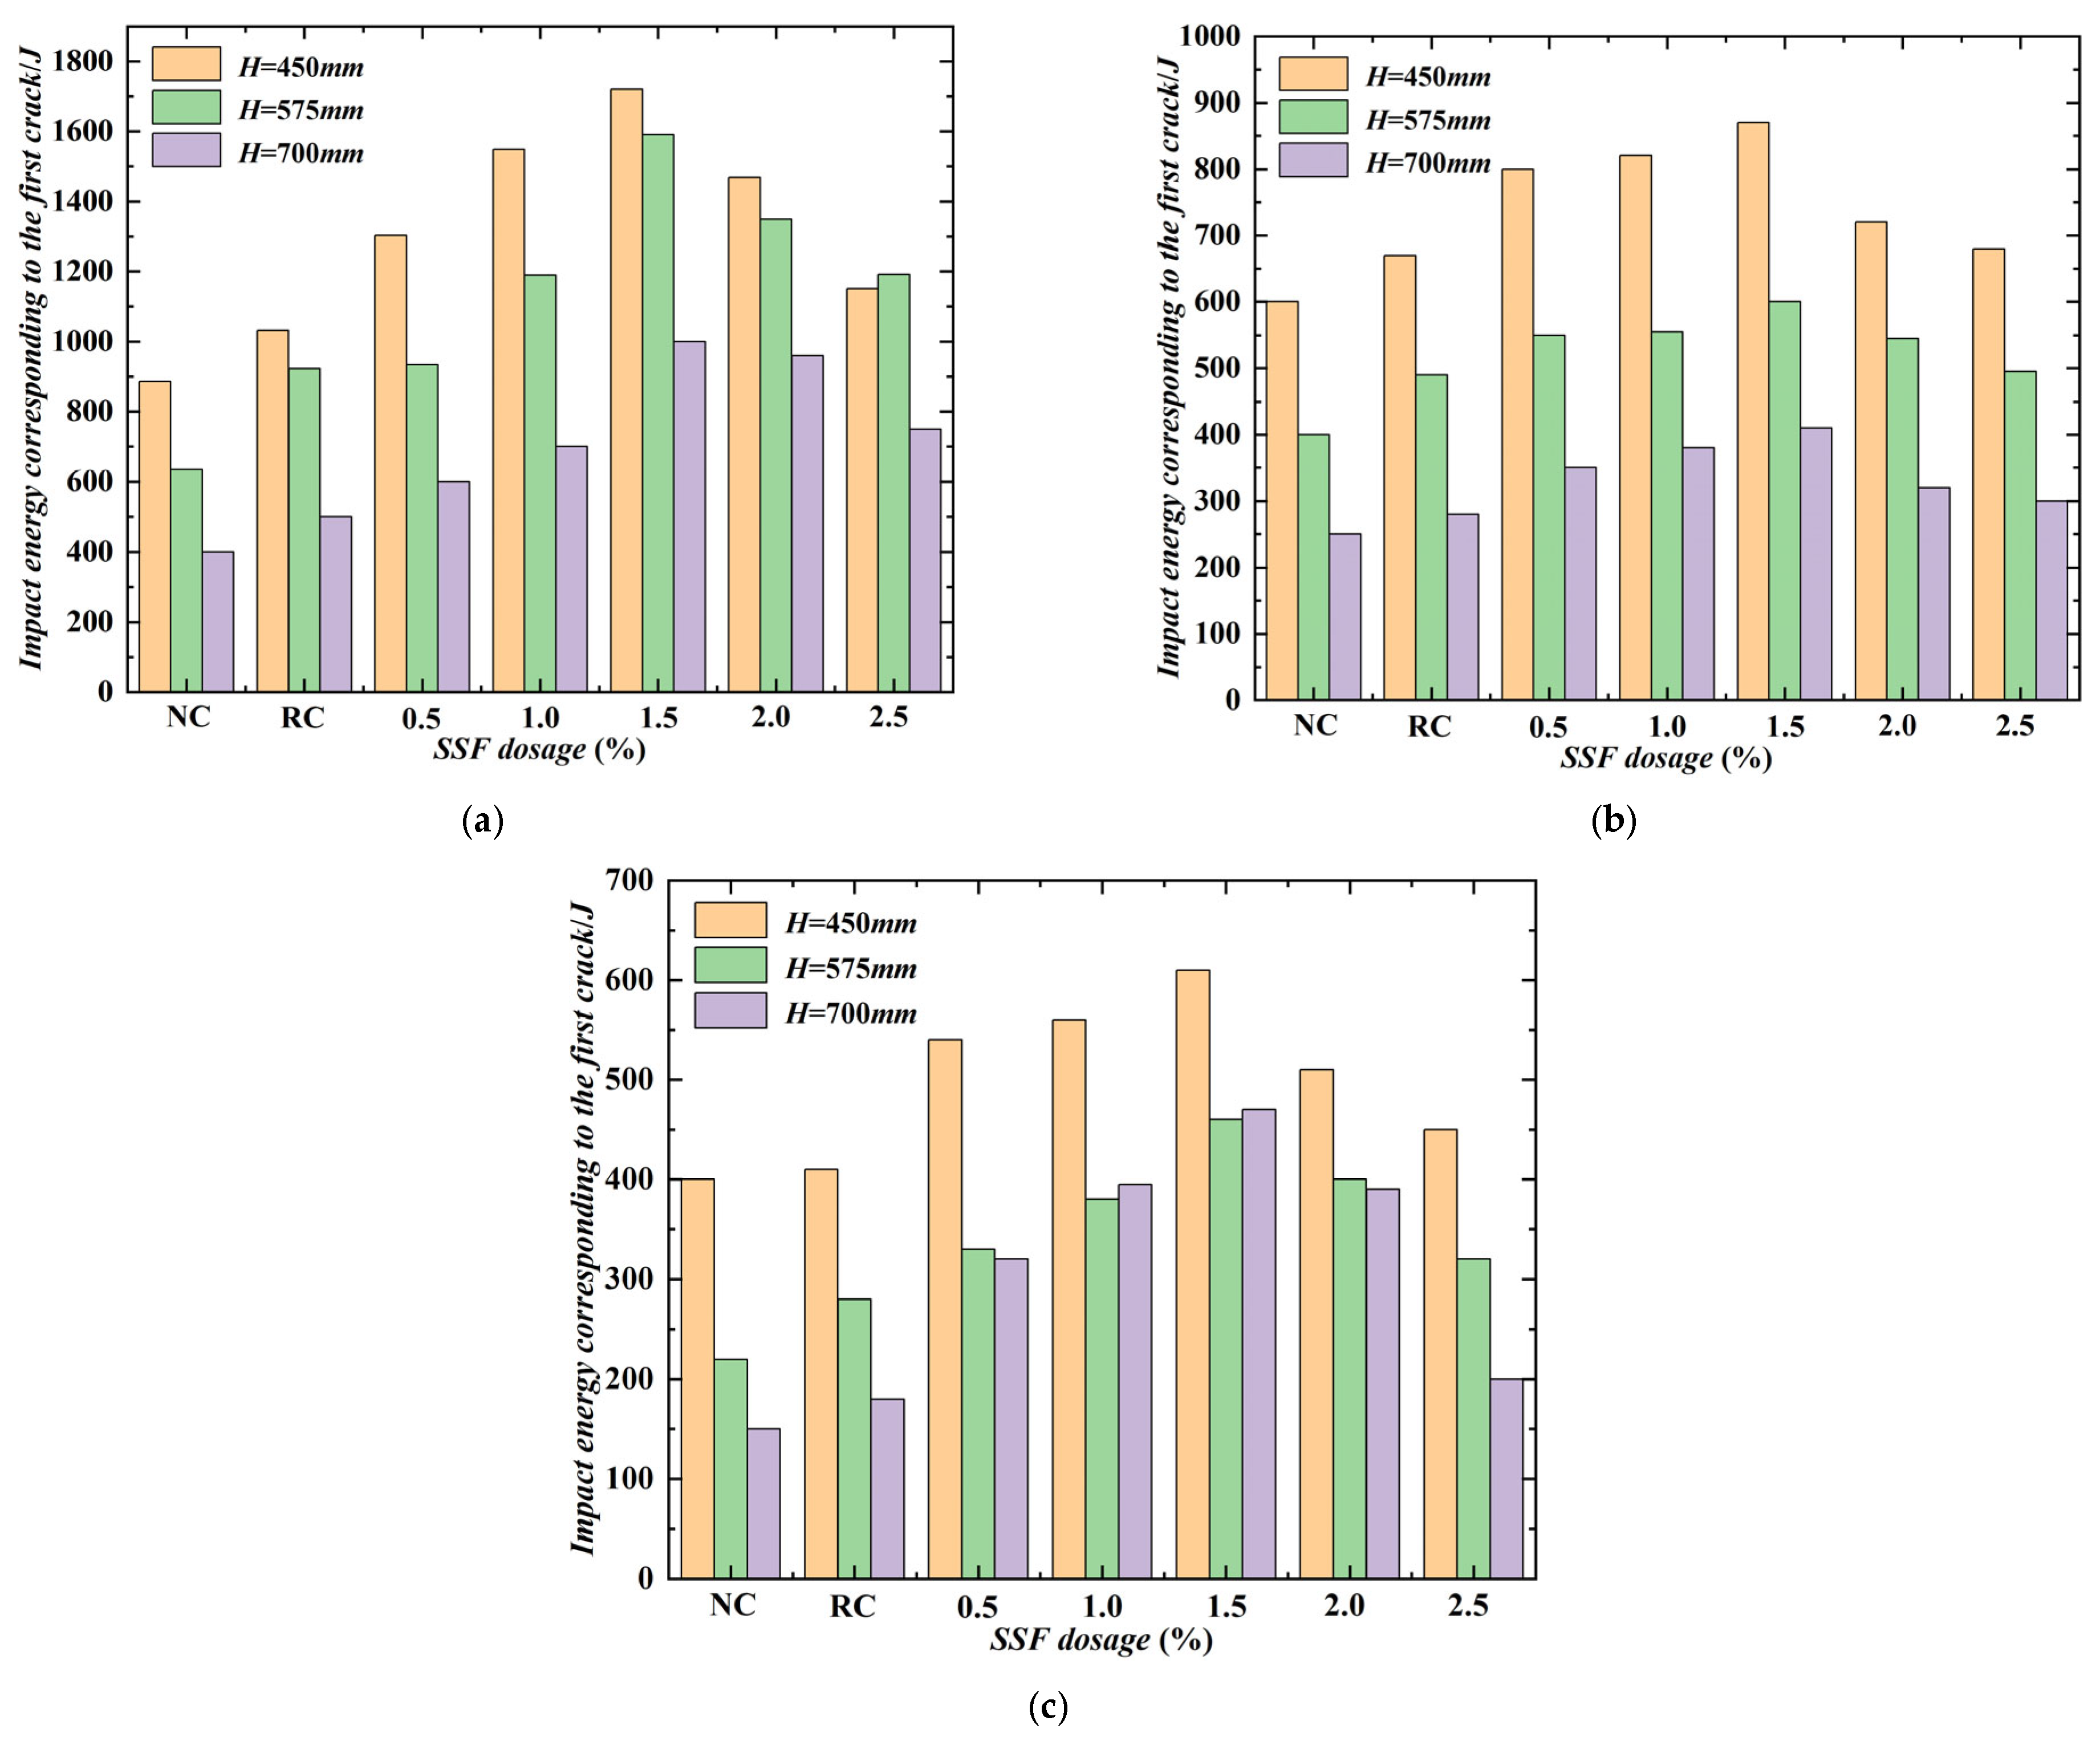
Calculate the impact energy absorbed by the specimens according to Equation (1), and evaluate the influence of different drop heights on the impact effect of SSFRC by using the magnitude of the impact energy.
W 1 = N 1 m g H       W 2 = N 2 m g H
In the formula, m is the mass of the drop hammer, 4.5, 6.0, 7.5 kg; g is gravitational acceleration, 9.8 m/s2; H is drop height, 45, 575, 700 mm; N1, N2 are the number of drop hammer strikes corresponding to the first cracking and specimen failure.
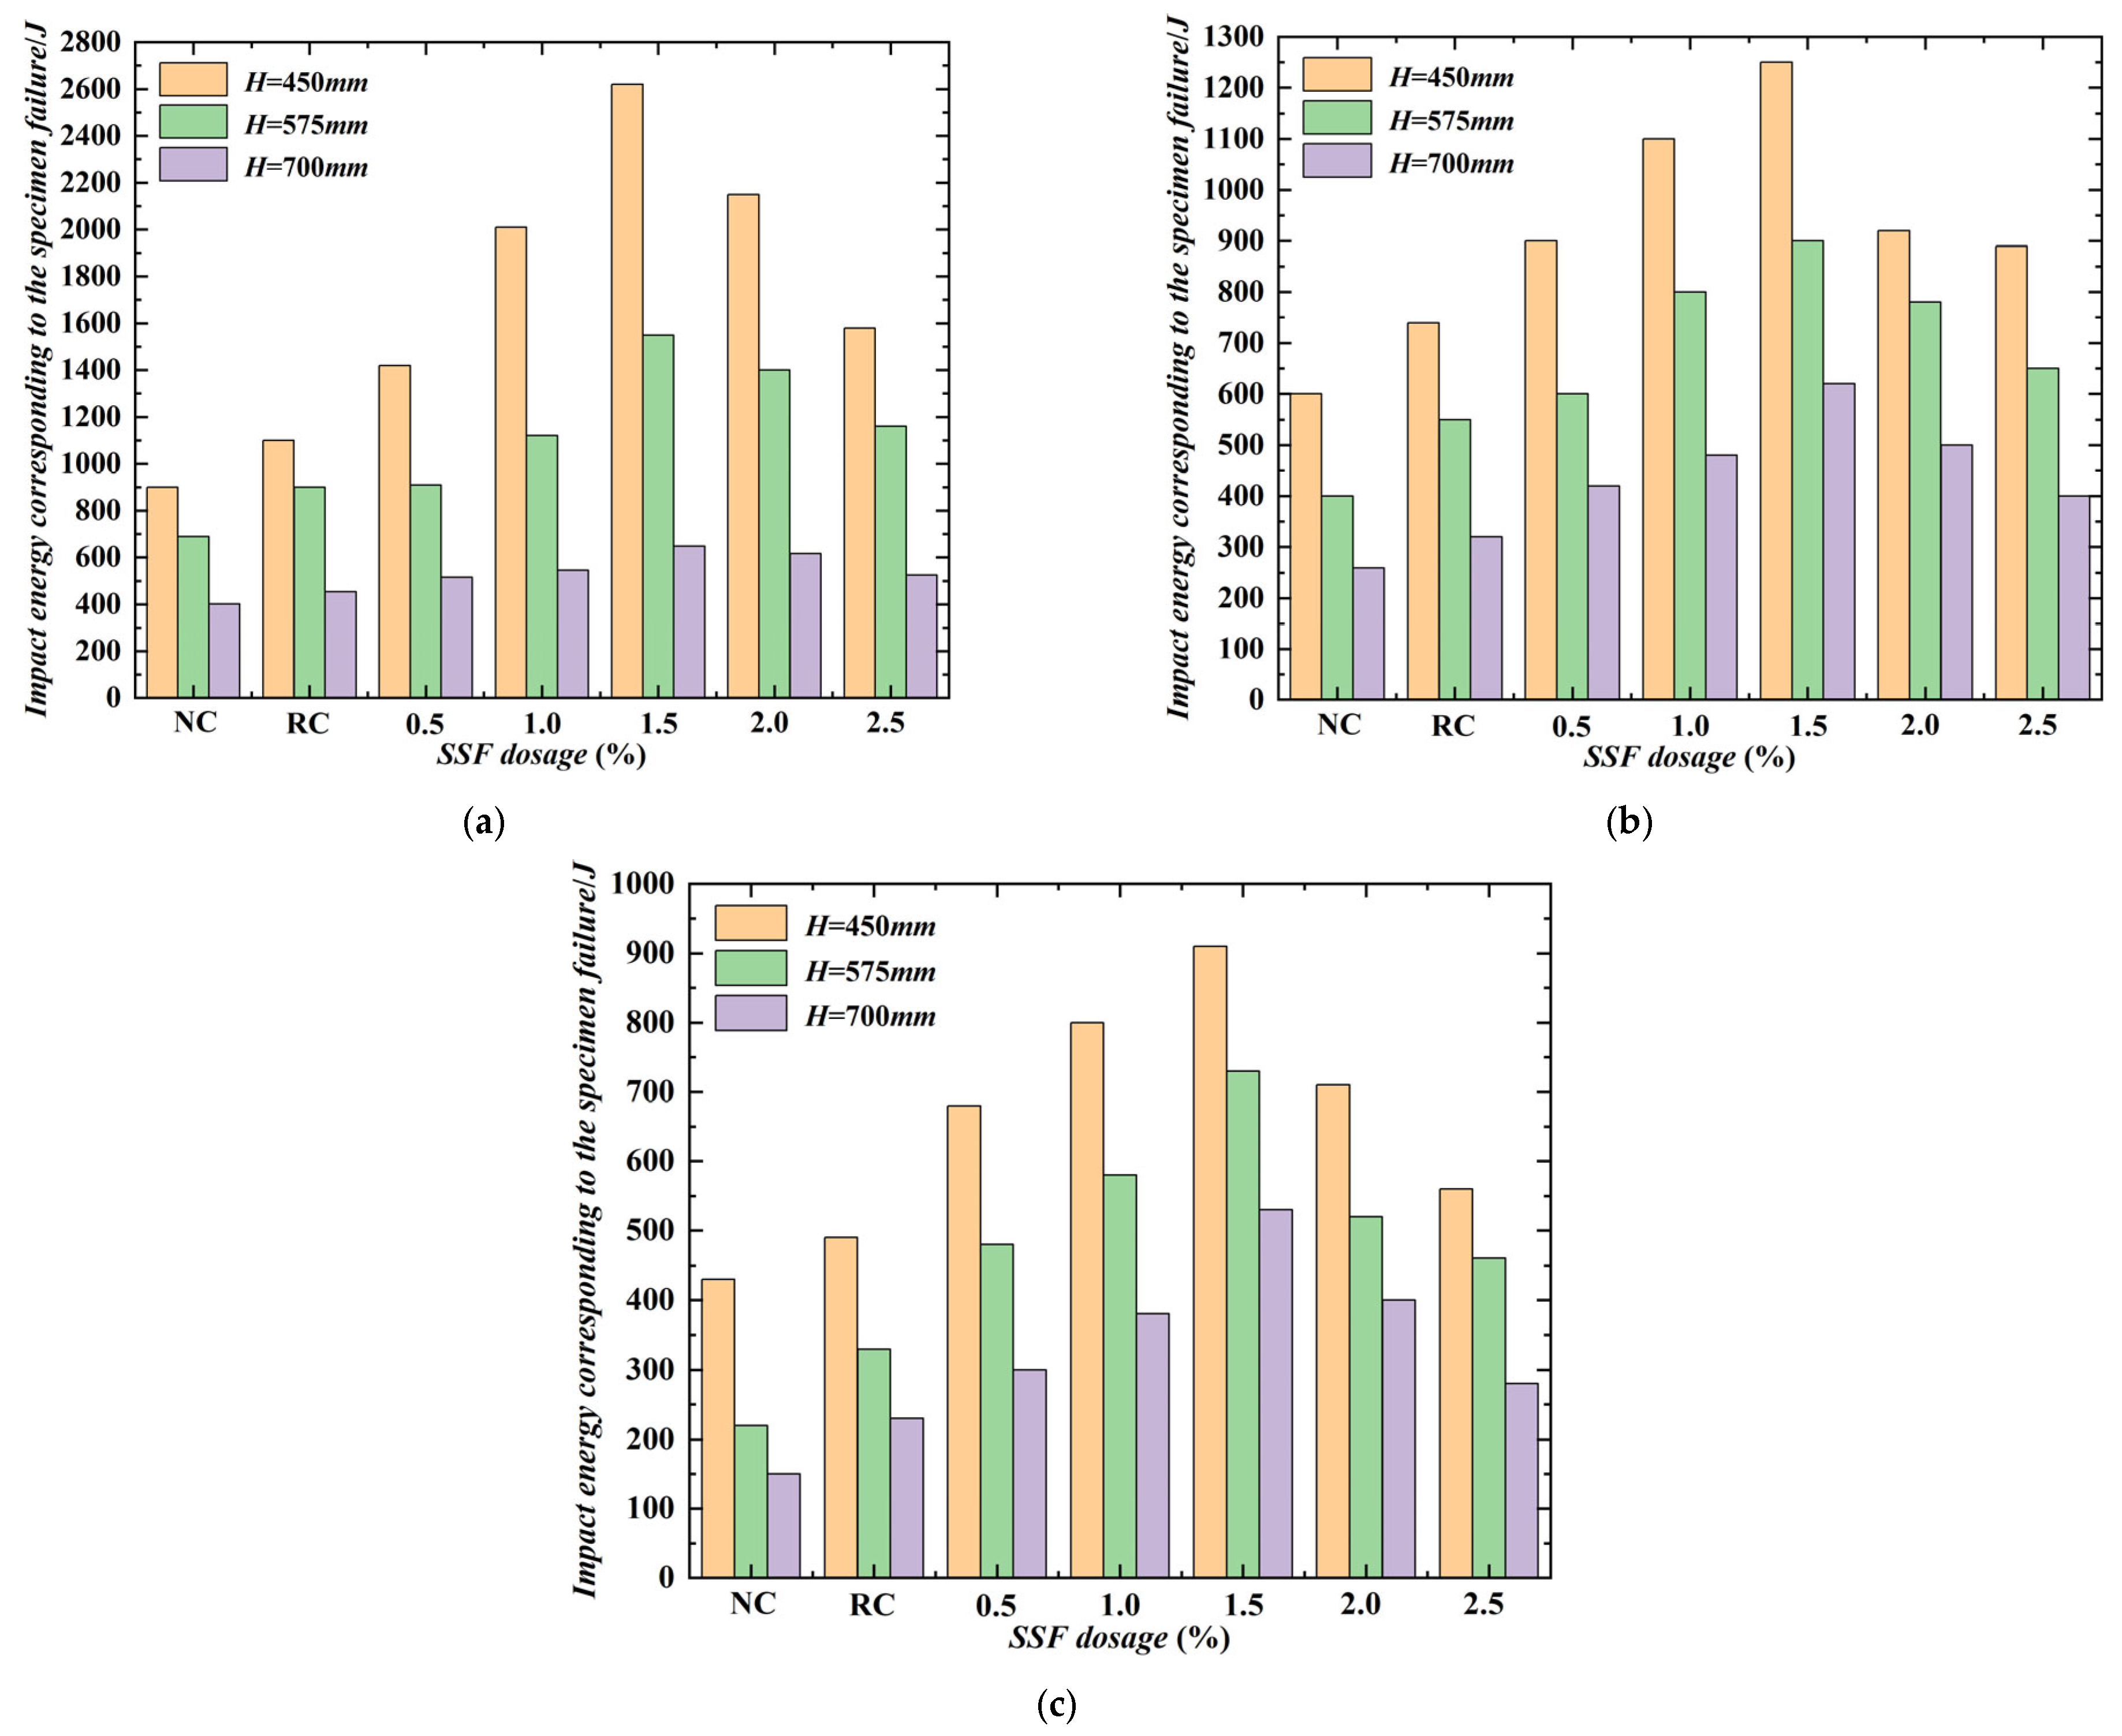
Figure 10 and Figure 11, respectively, show the impact energies corresponding to the appearance of the first crack of NC, RC, and SSFRC with different dosages when a 4.5 kg drop hammer, a 6.0 kg drop hammer, and a 7.5 kg drop hammer are dropped to heights of 450, 575, and 700 mm, as well as the impact energies corresponding to the failure of the specimens. As shown in the figures, the ability of the specimens to absorb impact energy, whether for the appearance of the first crack or the specimen failure, decreases with the increase of the drop height. The reason is that a larger drop height generates a greater impact force, which has a more significant impact on the microstructure of the specimens after each impact. Therefore, when the specimen is at a higher drop height, the internal microstructure of the concrete will crack and break at a higher rate. It is obvious that as the height of the drop hammer increases, the crack and failure absorption energy of each specimen recorded decreases.
Figure 10 and Figure 11 also show that the impact energy absorbed by RC when the first crack appears and when the specimen fails is greater than that of NC. As the SSF dosage increases from 0 to 1.5%, the impact energy absorbed by the specimens jumps significantly, which once again indicates that the addition of steel fibers has a significant impact on the development of the impact resistance of RC. The presence of steel fibers along the cracks effectively improves the stress transmission along the cracks, thereby enhancing the crack propagation capacity. Therefore, more impact cycles are required to apply effective stress, thereby breaking the bond between the steel fibers and the surrounding concrete until the steel fibers break or are pulled out of the concrete, leading to the failure of the specimen.

3.4.3. Effect of SSF Dosage on Impact Resistance Times and Energy Consumption

It is possible to have an intuitive understanding of the effect of SSF dosage on impact resistance times and energy consumption. Since the test adopted three sets of weights and drop heights, each set of result data obtained has a certain general pattern. Therefore, it was decided to select the test data of weights of 4.5 and 6.0 kg and a drop height of 450 mm for analysis.
Figure 12 and Figure 13 show impact resistance times and energy consumption of concrete when the weight of the drop hammer is 4.5 kg and the drop height is 450 mm. Figure 12 and Figure 13 show the number of impacts and energy consumption of concrete when the weight of the drop hammer is 4.5 kg and the drop height is 450 mm. The N1 and N2 values of NC are the same, both being 45, indicating that NC has obvious brittle failure characteristics. The N1 and N2 of RC were increased by 16 and 22%, respectively, compared with NC, with 52 and 55 times, respectively, indicating that the impact resistance performance of RC has been improved to a certain extent compared with NC. This is because rubber particles are energy-absorbing materials with excellent elasticity. After modification, they can be closely combined with the matrix. When subjected to impact loads, they will absorb part of the energy to inhibit the extension of cracks.
As can be seen from the figures, with the increase of SSF dosage, the N1 and N2 of the SSFRC, as well as the energy consumption against initial cracking and failure, all show a trend of first increasing and then decreasing. When the SSF dosage is 1.5%, the impact resistance times and impact energy consumption reach their maximum values, and the impact resistance performance is the best at this time. N1 is 87 times, and the energy consumption is 1719.97 J. N2 is 129 times; the energy consumption is 2560.01 J. Compared with NC, its impact resistance has increased by 29 times, and compared with RC, it has increased by 2.3 times.
Steel fibers can bond well with the cement matrix, preventing the formation and extension of cracks in the early stage of impact, thereby increasing N1. After the first crack, it can also play a bridge role and continuously consume the impact energy until the specimen is damaged. Therefore, SSFRC has a significant improvement from the first crack to the failure. When the dosage is too large, it will be unevenly distributed within the matrix, resulting in entanglement phenomena and eventually leading to a decrease.
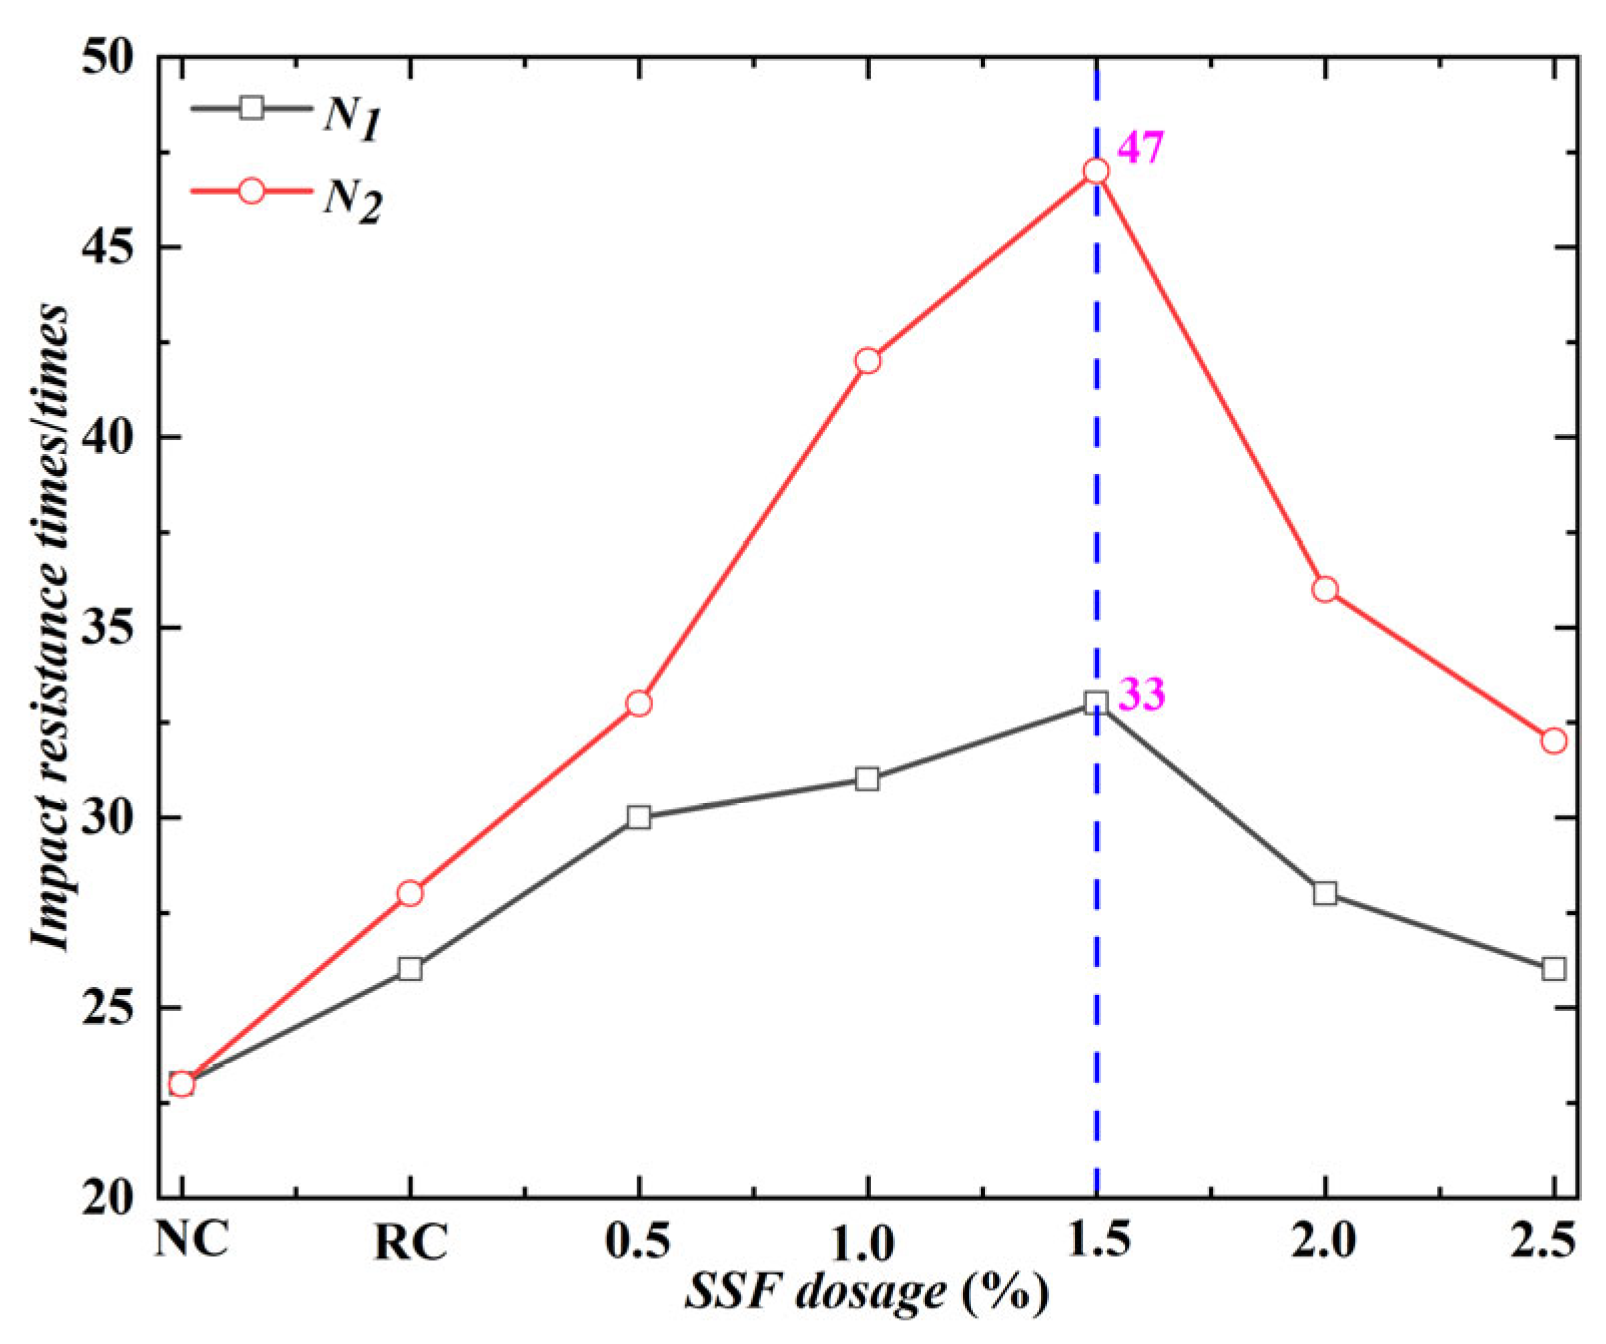
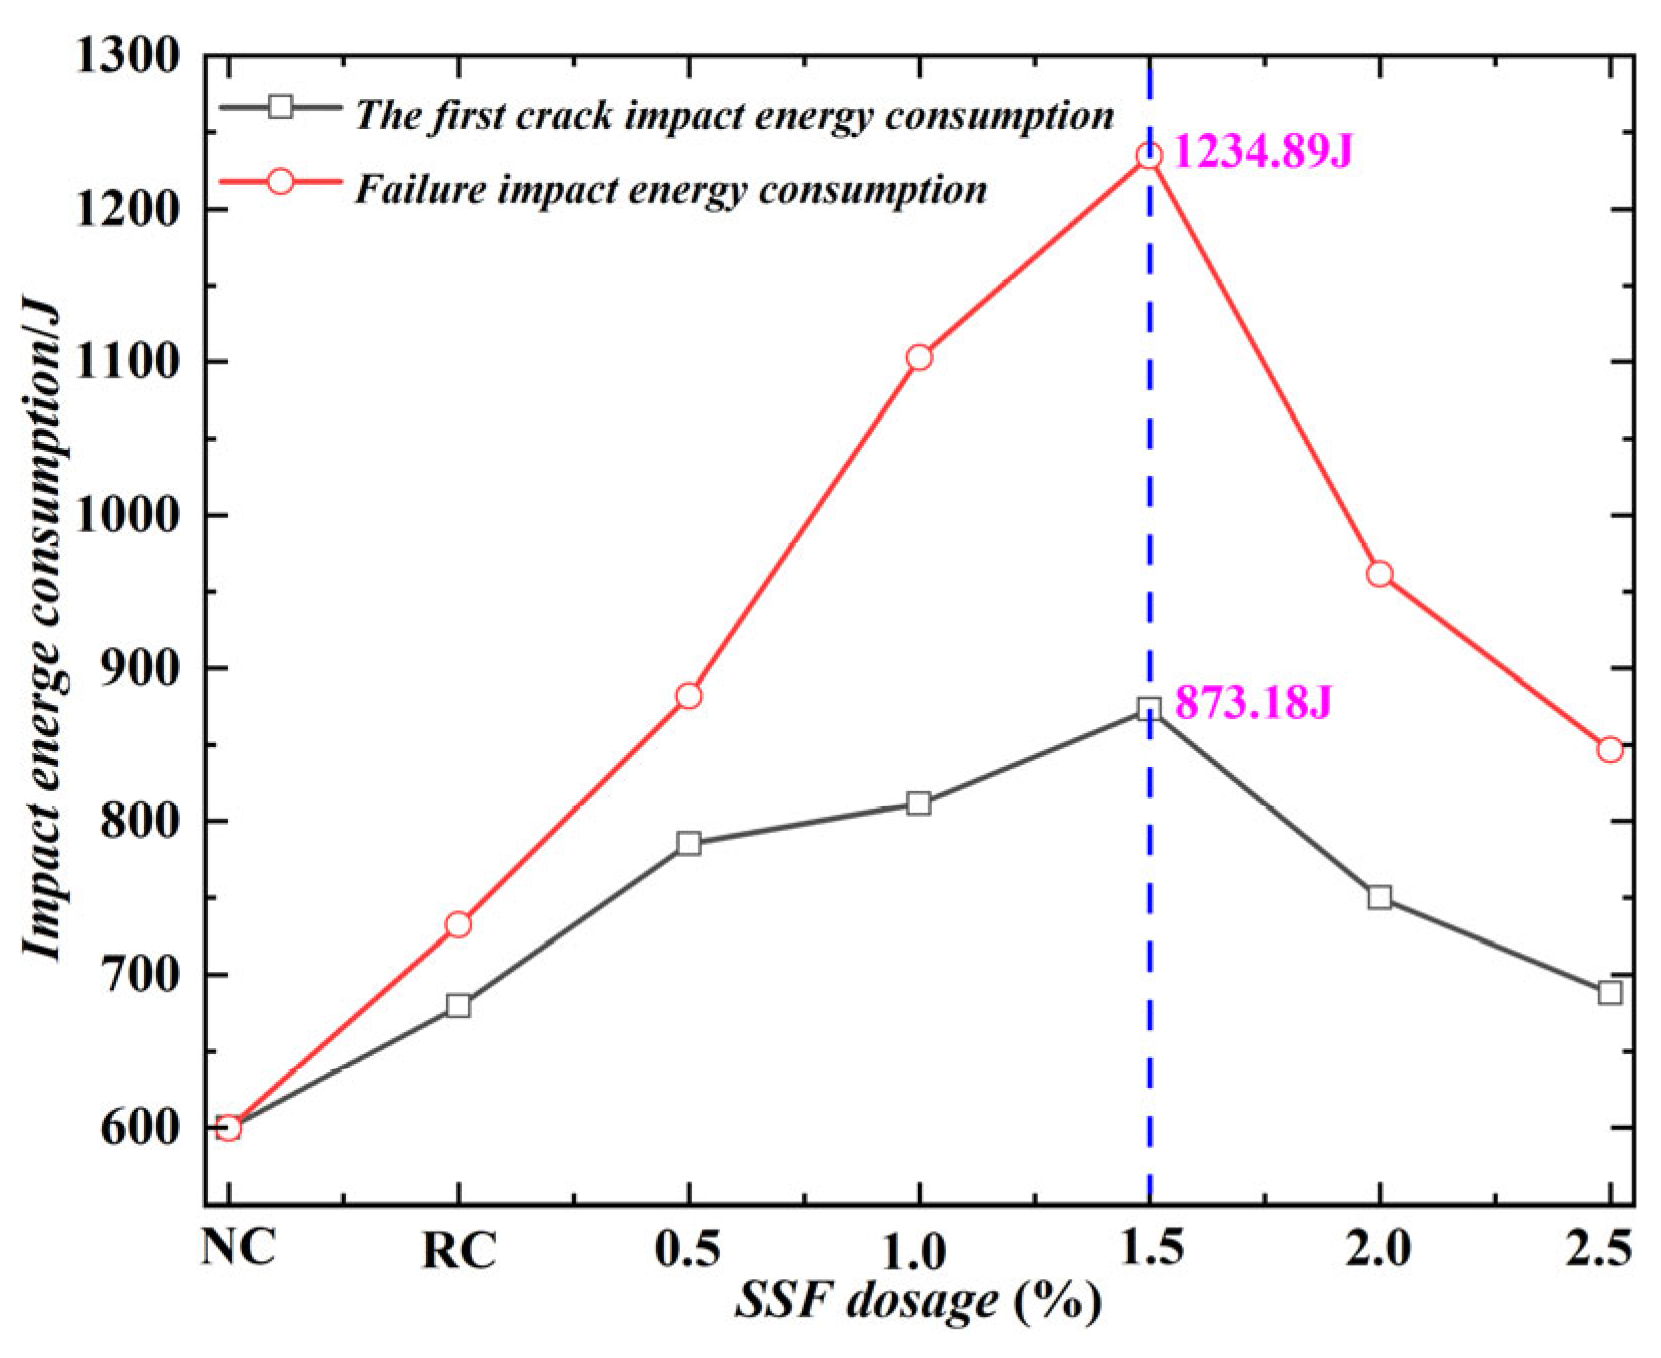
Figure 14 and Figure 15 show the impact resistance times and energy consumption of concrete when the weight of the drop hammer is 6.0 kg and the drop height is 450 mm. The N1 and N2 of NC are 23 and 23, respectively, and the weight of the drop hammer is 4.5 kg, which still has the standard brittle feature. The N1 and N2 level of RC was increased by 13 and 22%, respectively, compared to NC, reaching 26 and 28. The N1 of SSFRC with five dosages was increased by 30, 35, 43, 22, and 13%, respectively, compared with NC. It was increased by 15, 19, 27, 8, and 0%, respectively, compared with RC. N2 was increased by 43, 83, 104, 57, and 39%, respectively, compared with NC. Compared with RC, they were respectively increased by 18, 50, 68, 29, and 14%.
Consistent with the test results of a 4.5 kg drop hammer weight, the N1 and N2 of SSFRC, as well as the energy consumption against the first crack and failure, showed a trend of first increasing and then decreasing with the increase of SSF dosage. When the dosage of SSF is 1.5%, the impact resistance times and energy consumption during impact resistance of SSFRC reach their maximum values, and its impact resistance performance is the best. N1 and N2 are 33 and 47 times, respectively. The energy consumption for the first crack and failure is 873.18 and 1234.89 J, respectively. Its impact resistance is twice that of NC and 1.7 times that of RC.

3.5. Quantitative Analysis of Performance of SSFRC

Based on the above study, the optimal dosage of SSF and key data for the compressive and impact resistance performance of SSFRC are summarized in Table 9.
The elastic buffering of rubber particles and the bridging energy dissipation of SSF are in synergy to effectively resist impact loads such as vehicle rolling and heavy object falling, reduce the occurrence of cracks, and extend the service life of the road surface or protective structure, etc.

4. Numerical Simulation and Analysis

4.1. Finite Element Model

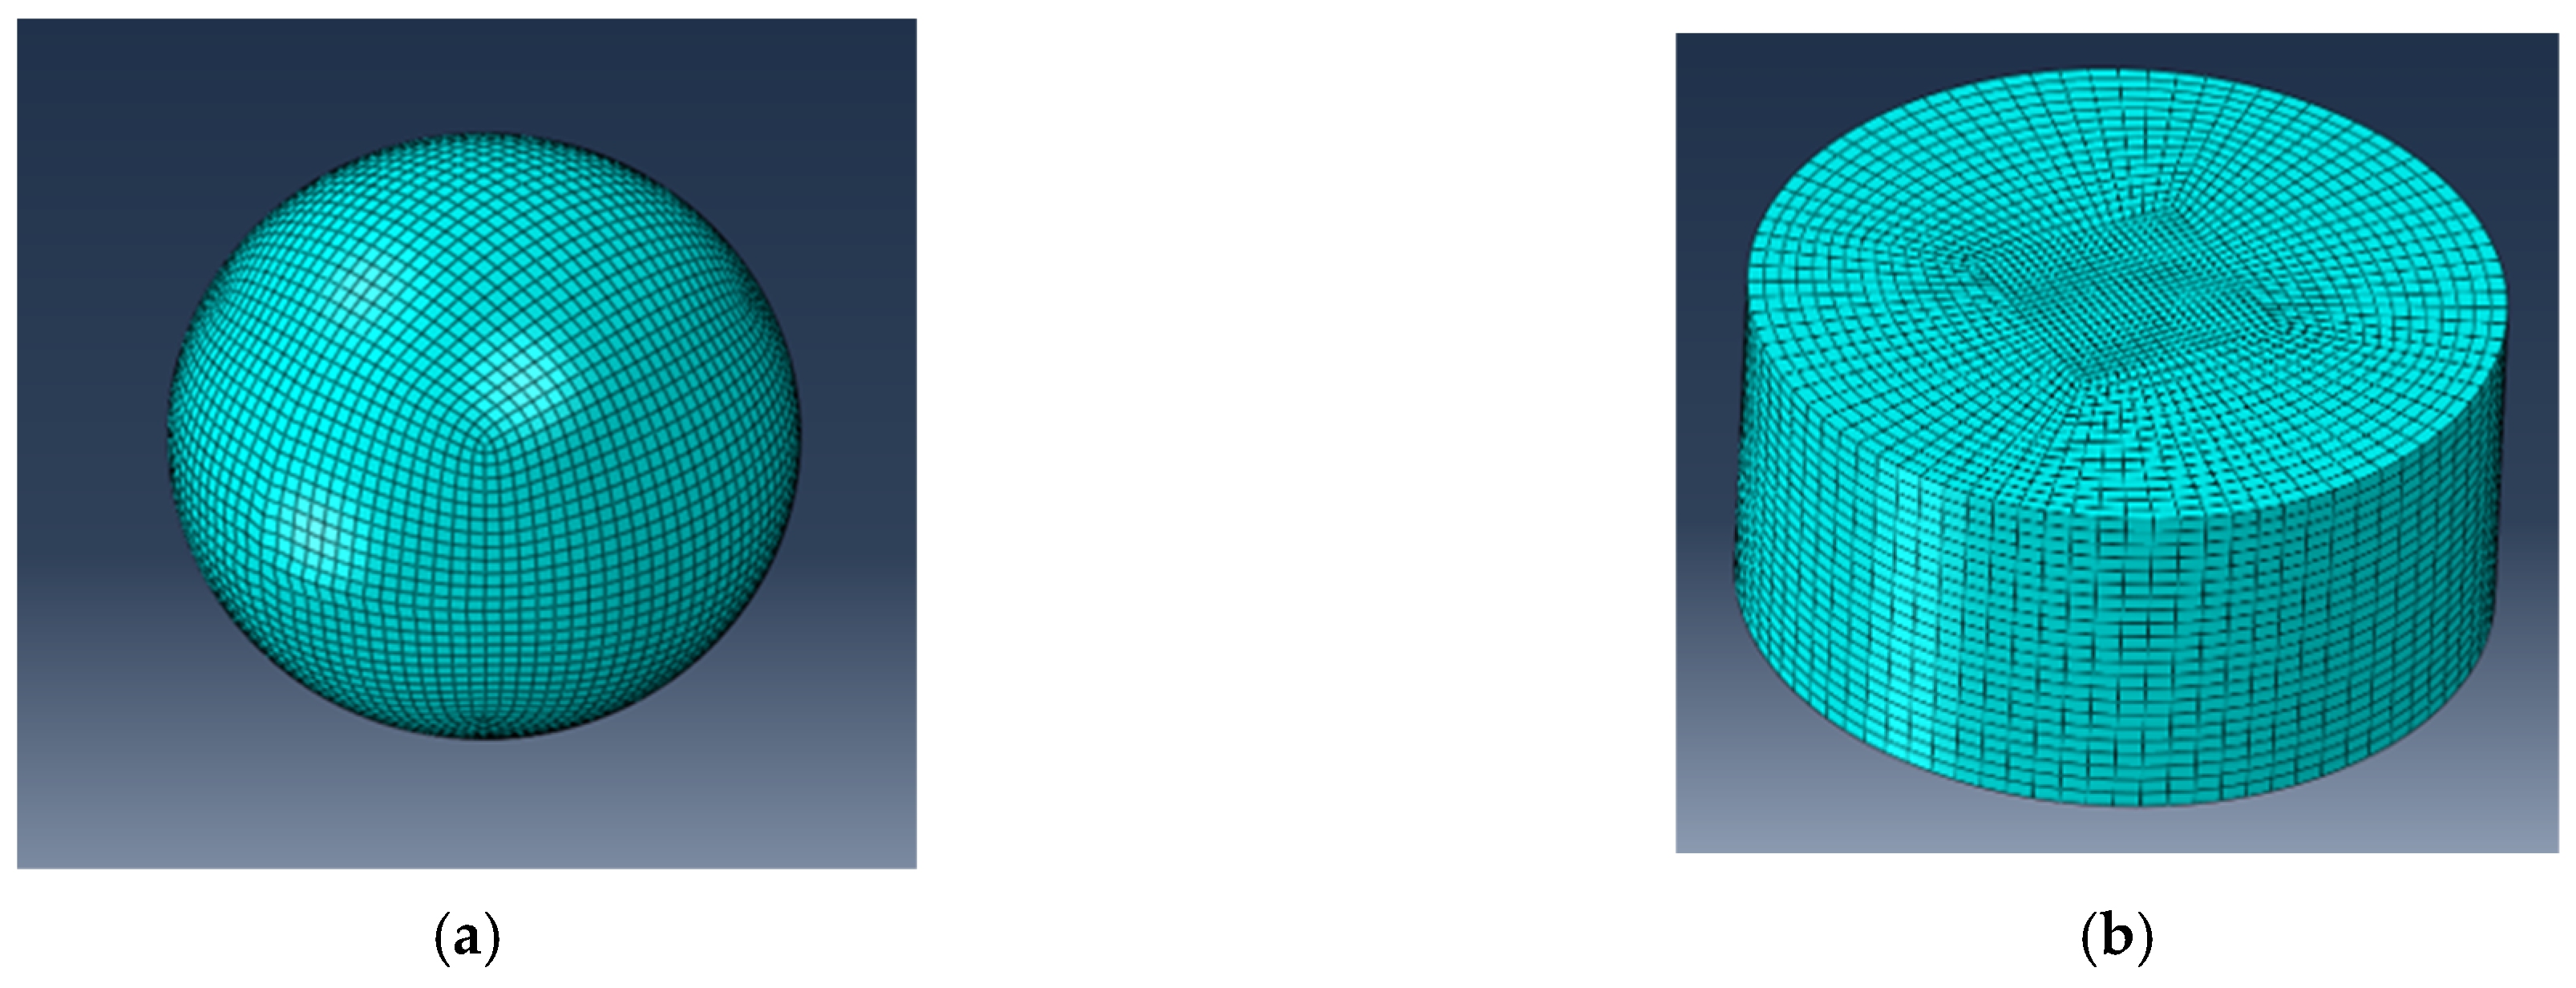
Based on the above test results, NC and SSFRC with SSF dosage of 1.5% were selected for simulation, and the solid element was used as the type of element for simulation. In this study, an integral model was selected to simulate the impact resistance test of SSFRC. In the simulation, C3D8R (three-dimensional solid linear shrinkage integrating unit) suitable for concrete specimens was selected. The main reason for choosing this type of unit is that it has a higher computing speed compared to the complete integration unit, and it is also easier to achieve refinement during the meshing process. For the drop hammer, due to its spherical shape characteristics, R3D4, a four-node three-dimensional bilinear rigid quadrilateral element, was selected for simulation. This type of unit can well describe the rigidity characteristics of the drop hammer while maintaining the calculation speed and accuracy during the simulation process. The finite element model is shown in Figure 16.
For grid division, if the grid is too dense, the computing time and storage space requirements will increase significantly, thereby affecting the simulation efficiency. On the contrary, overly sparse grids may lead to inaccurate simulation results, thereby affecting the reliability of the research. Hence, the simulation selects a mesh fabric type with an approximate global size of 3 mm. This kind of grid division can balance the demands of calculation accuracy and efficiency, making the simulation results both reliable and efficient. Meanwhile, to enhance the simulation accuracy, grid densification treatment was carried out at the contact area between the cylindrical specimen and the iron ball. The diagram of grid division can be referred to in Figure 17.
The CDP model was selected as the constitutive relation of concrete. This model integrates the advantages of plasticity theory and damage theory and is applicable to various loading conditions. It also incorporates the characteristics of compressive failure and tensile cracking and has good convergence. The basic parameter values of CDP materials are shown in Table 10. The parameters in Table 10 are adjusted based on the mechanical properties of the concrete measured from the cube compressive strength test results. The key damage parameters of the CDP model are calibrated in combination with the crack development characteristics in the test.
When setting boundary constraint conditions and load situations, it is necessary to fully consider the impact effect of the free fall of the iron ball on the specimen during the test, and the specimen is subjected to the vertical impact force exerted by the iron ball. Therefore, when establishing the finite element model, constraints were imposed on the rotation of the iron ball and its movements other than those in the vertical direction. Meanwhile, to ensure the stiffness of the specimen, fixed constraints were applied to the bottom surface of the cylindrical specimens in the finite element model to guarantee the stability of the specimens during the impact process.
In this study, a set of impact loads from the experiments were selected. According to the physics Equation (2), the load was generated by a 4.5 kg drop hammer freely falling from a height of 450 mm, and the impact velocity was calculated as v = 2.97 m/s.
H = 1 2 g t 2 v = g t v = 2 g H

4.2. Numerical Simulation Results and Comparative Analysis

When using the ABAQUS CAE 2023 to simulate the damage of concrete specimens, it is necessary to calculate and output the damage factors. Taking SSFRC as an example, under the impact of iron balls, the specimen is subjected to pressure. Due to the influence of Poisson’s ratio, the bottom of the concrete specimen is subjected to tensile stress, resulting in compressive damage and tensile damage in different areas of the specimen. After the simulation results are out, the development trend of cracks can be inferred by observing the cloud graph trends of the compressive damage factor (DAMAGEC) and tensile damage factor (DAMAGET) of concrete.

4.2.1. NC Simulation Results Compared with Experimental Results

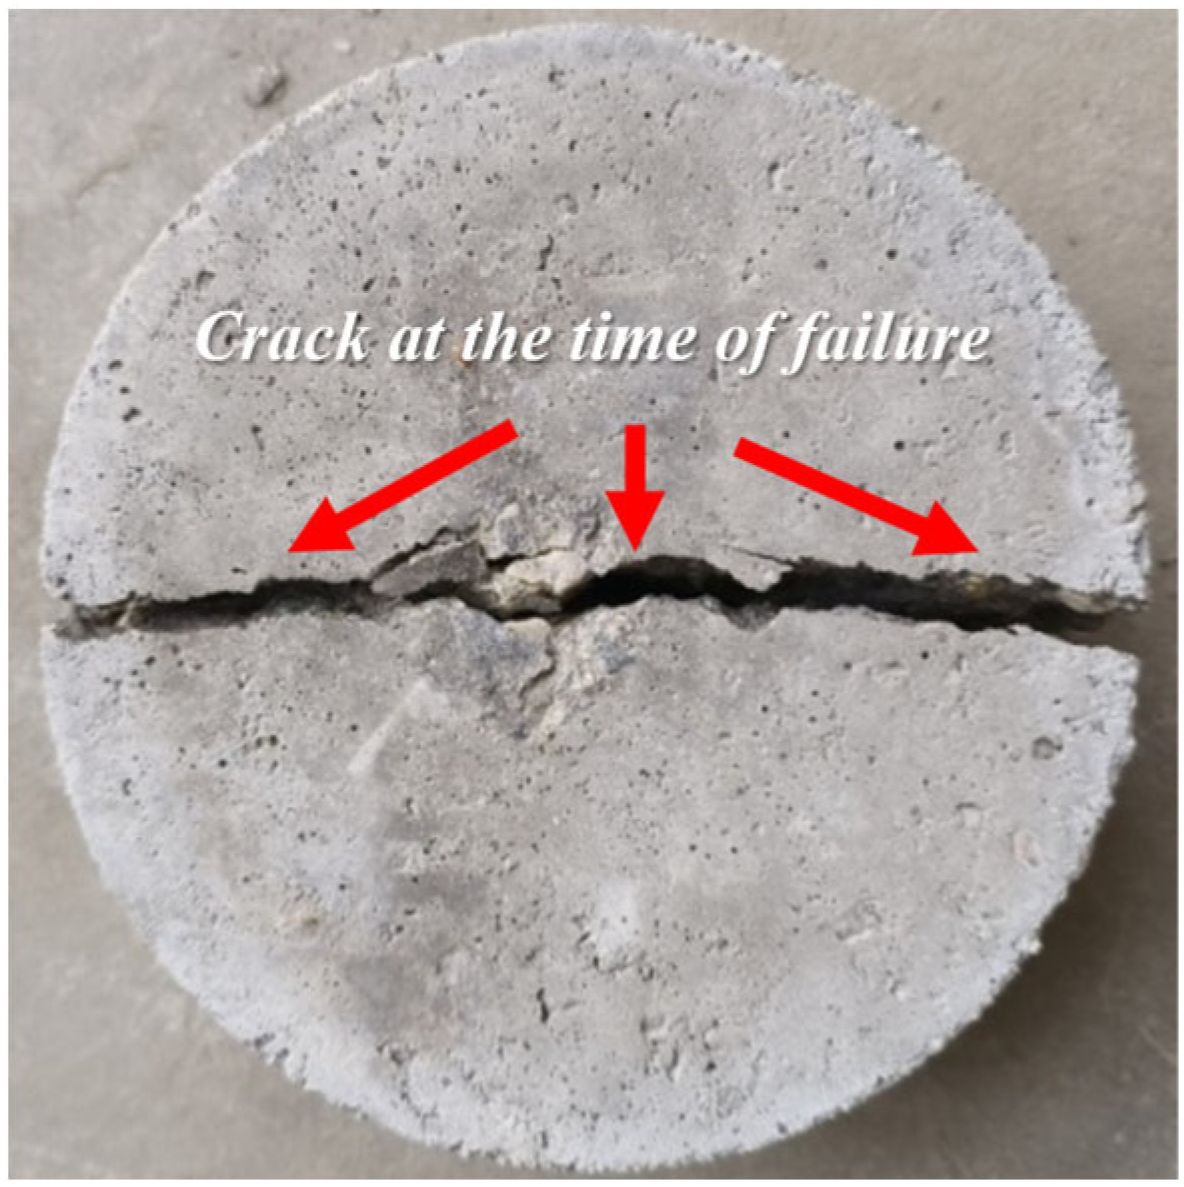
Figure 18 shows the failure mode of NC in the drop hammer impact test. Figure 19 and Figure 20 respectively show the DAMAGEC and DAMAGET of NC obtained from the numerical simulation of drop hammer impact.
According to the DAMAGEC of NC (Figure 19), it can be seen that during the repeated impact of the drop hammer, the compressive damage of the cylindrical specimen is mainly concentrated in the core area of its surface. Moreover, under the impact, the failure of the concrete starts from the central area of the drop hammer impact, involving only a small range. With the increase in the number of impacts, the area of compression damage gradually expands, and the degree of damage also intensifies accordingly.
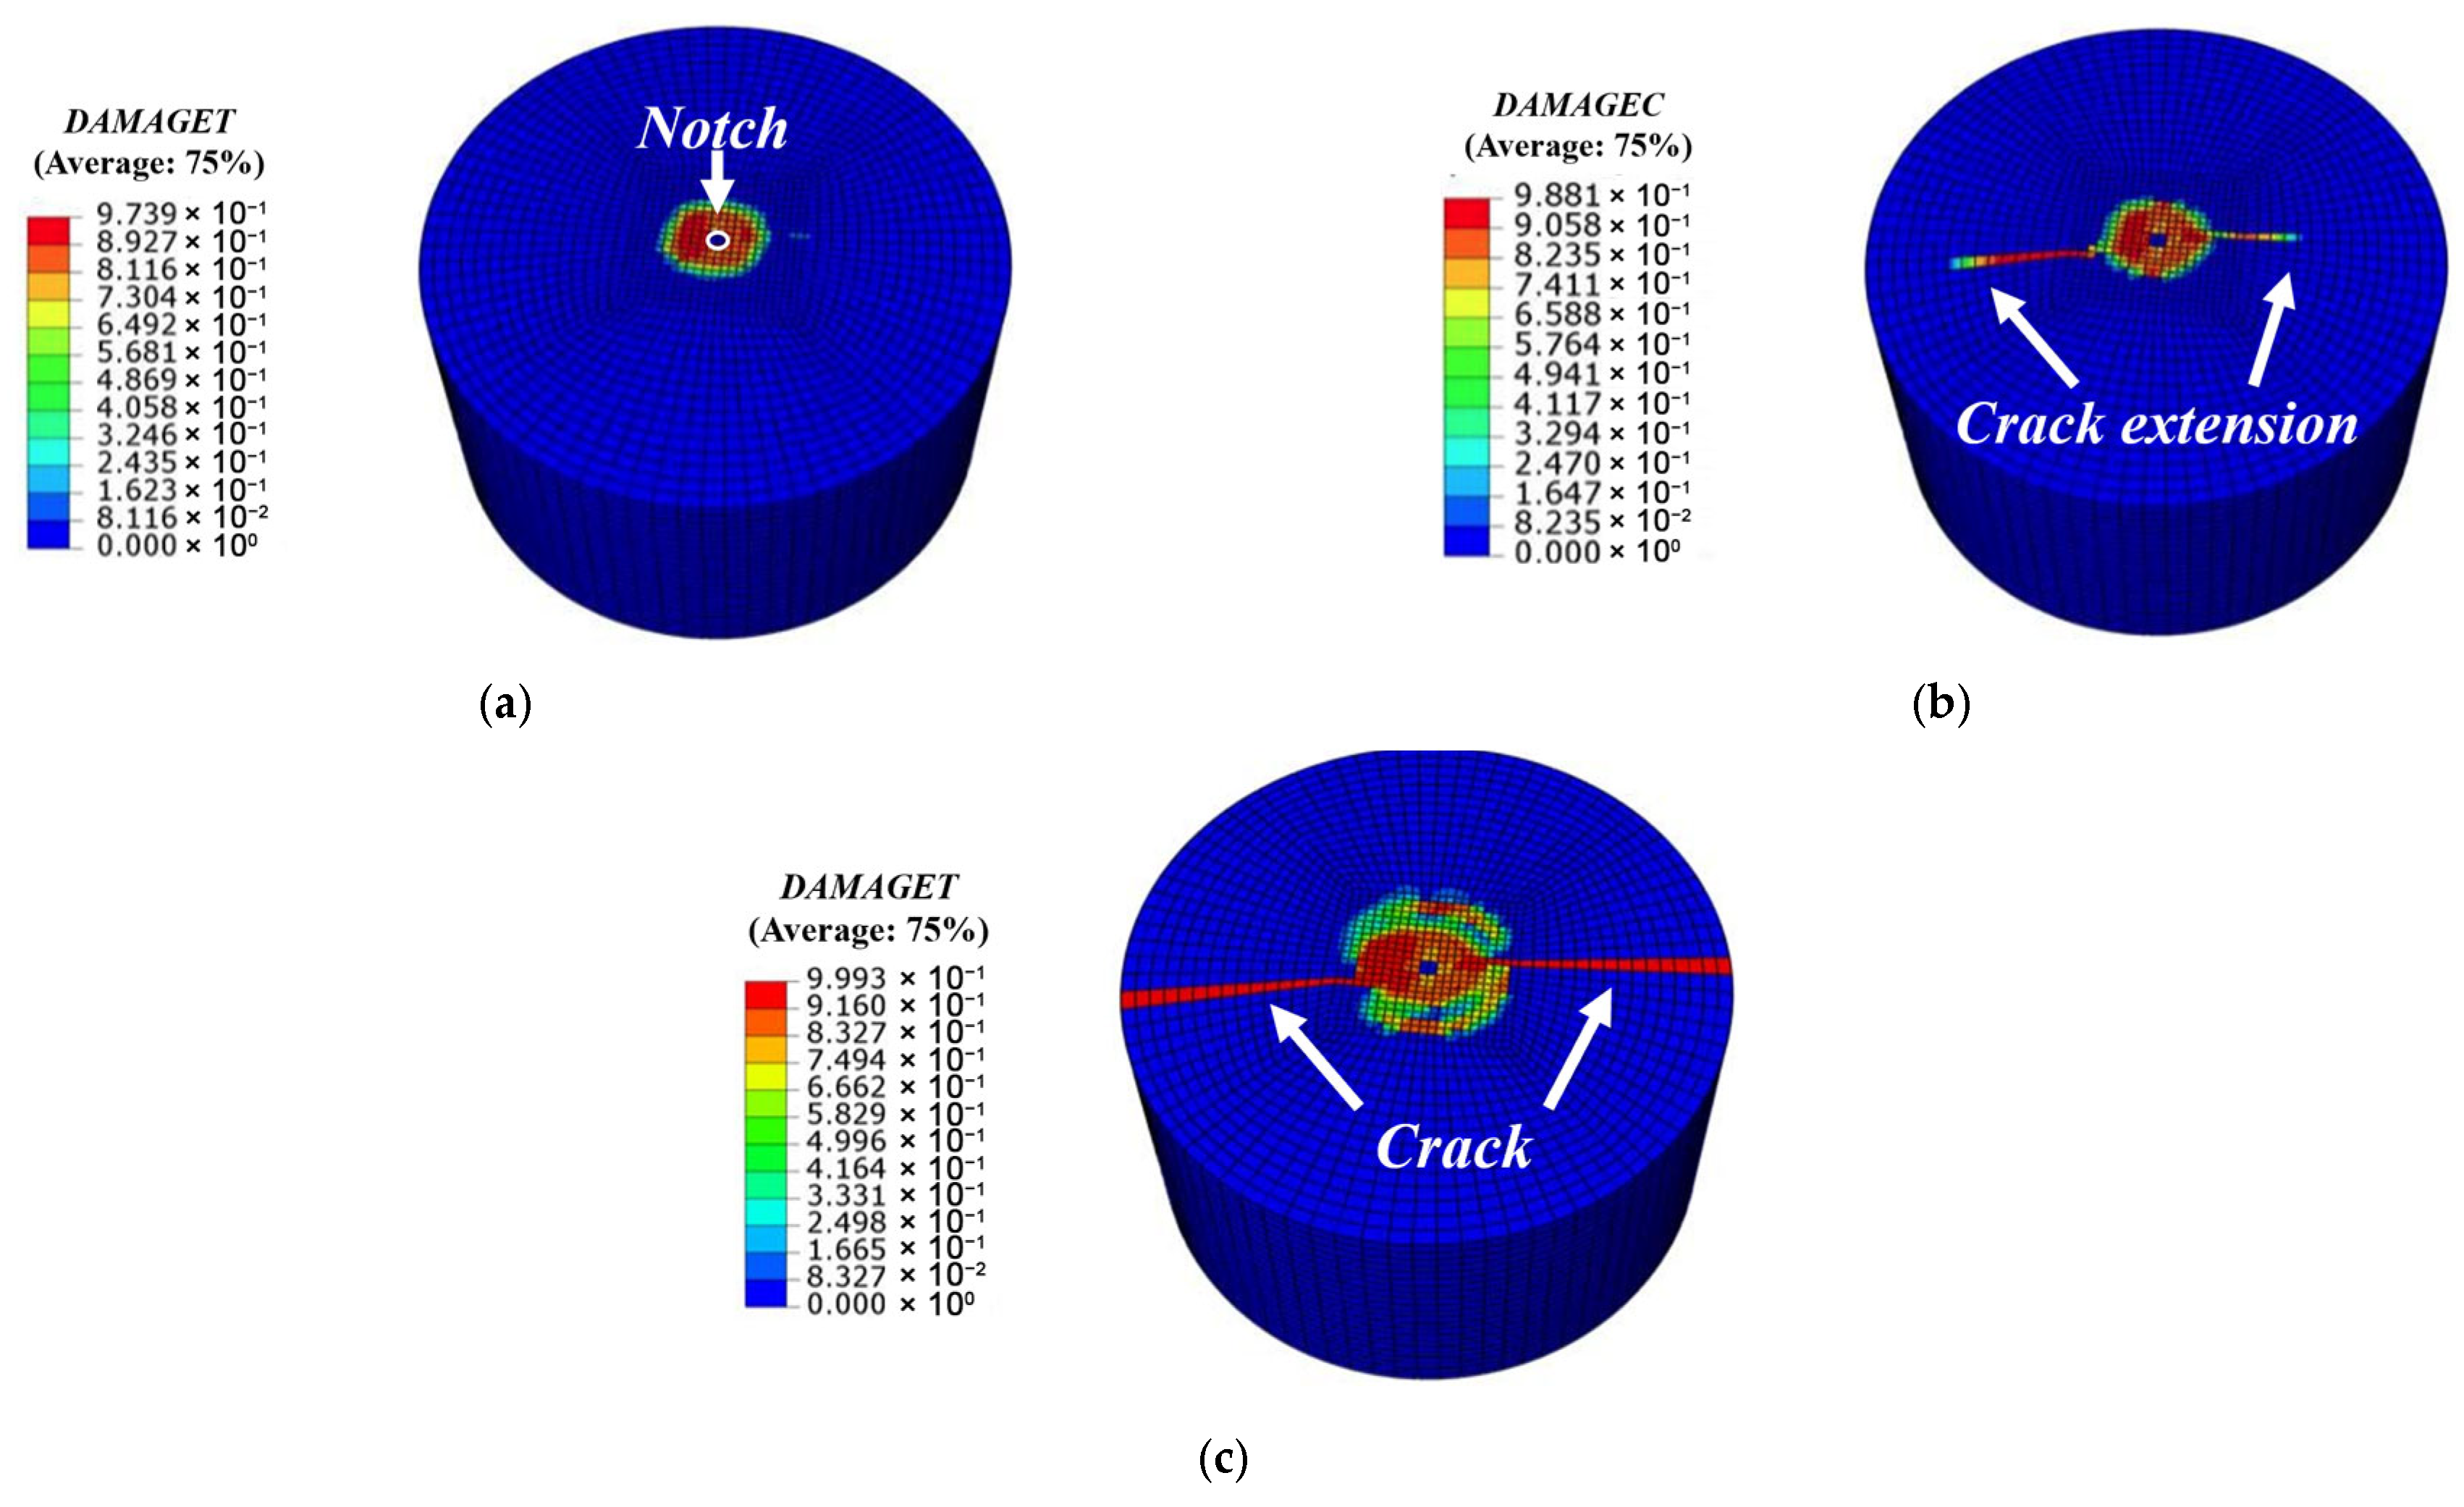
According to the DAMAGET of NC (Figure 20), during the process of the NC surface being impacted by the drop hammer, a small notch appeared at the position in contact with the drop hammer after damage. As the two sides of the notch are subjected to further impact, tensile stress forms and causes tensile damage to the concrete. As the number of impacts increases, straight cracks appear on the upper surface of the specimen, and then the straight cracks widen and extend to the edge of the cylinder. When the final failure occurs, the linear cracks extend downward to the bottom. The concrete is penetrated by the linear cracks that expand from the center to both sides, causing the material to break and the sample to be divided into two parts. This damage pattern is highly similar to the actual failure pattern of concrete specimens after being subjected to impact loads, indicating that the numerical simulation results have a good consistency with the test results.

4.2.2. SSFRC Simulation Results Compared with Experimental Results

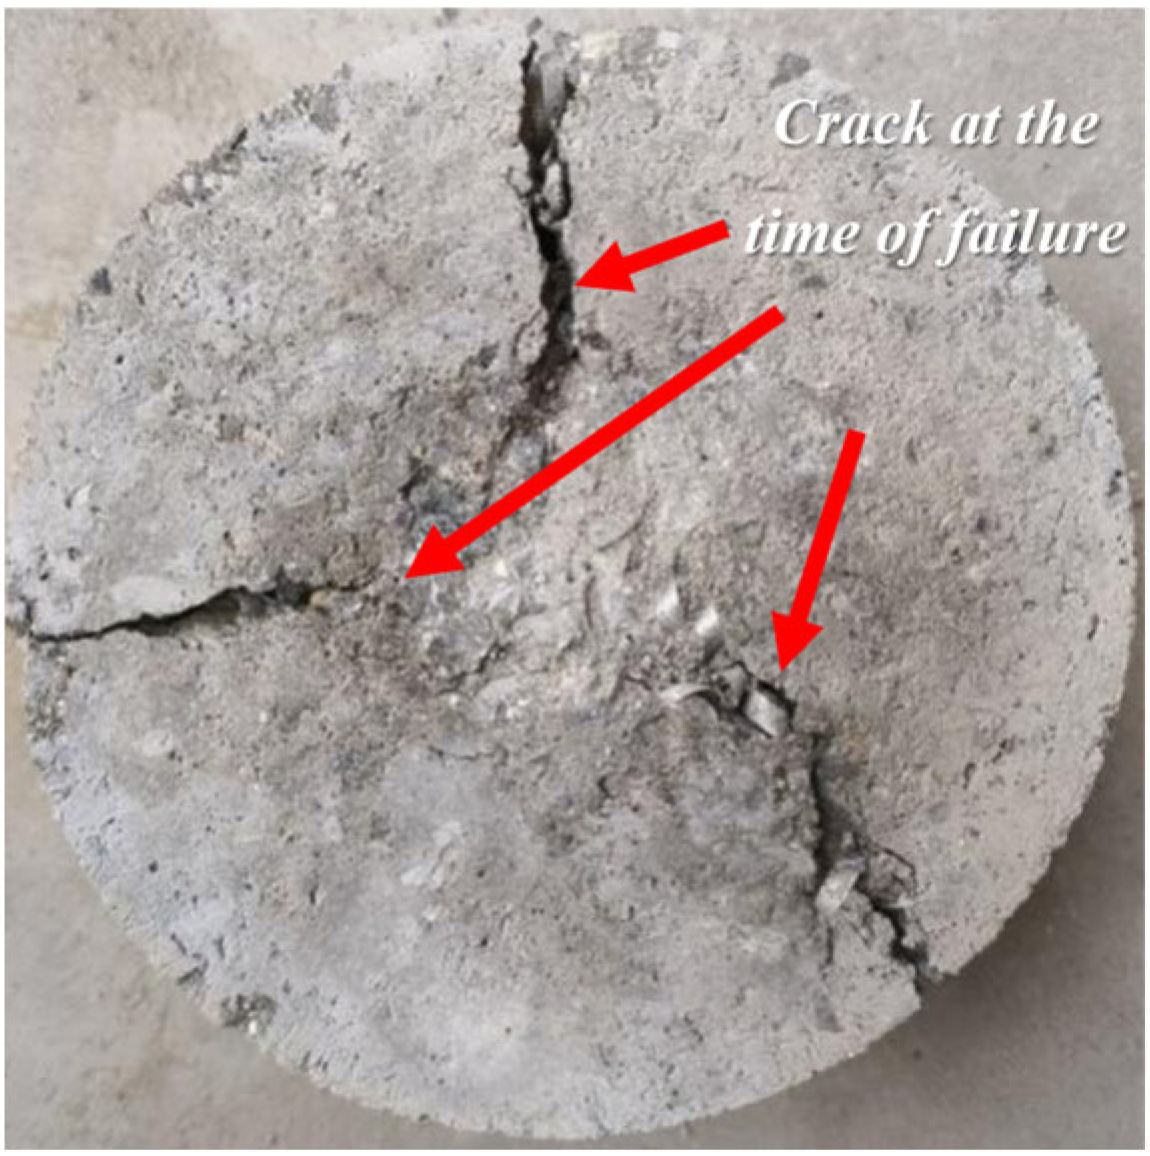
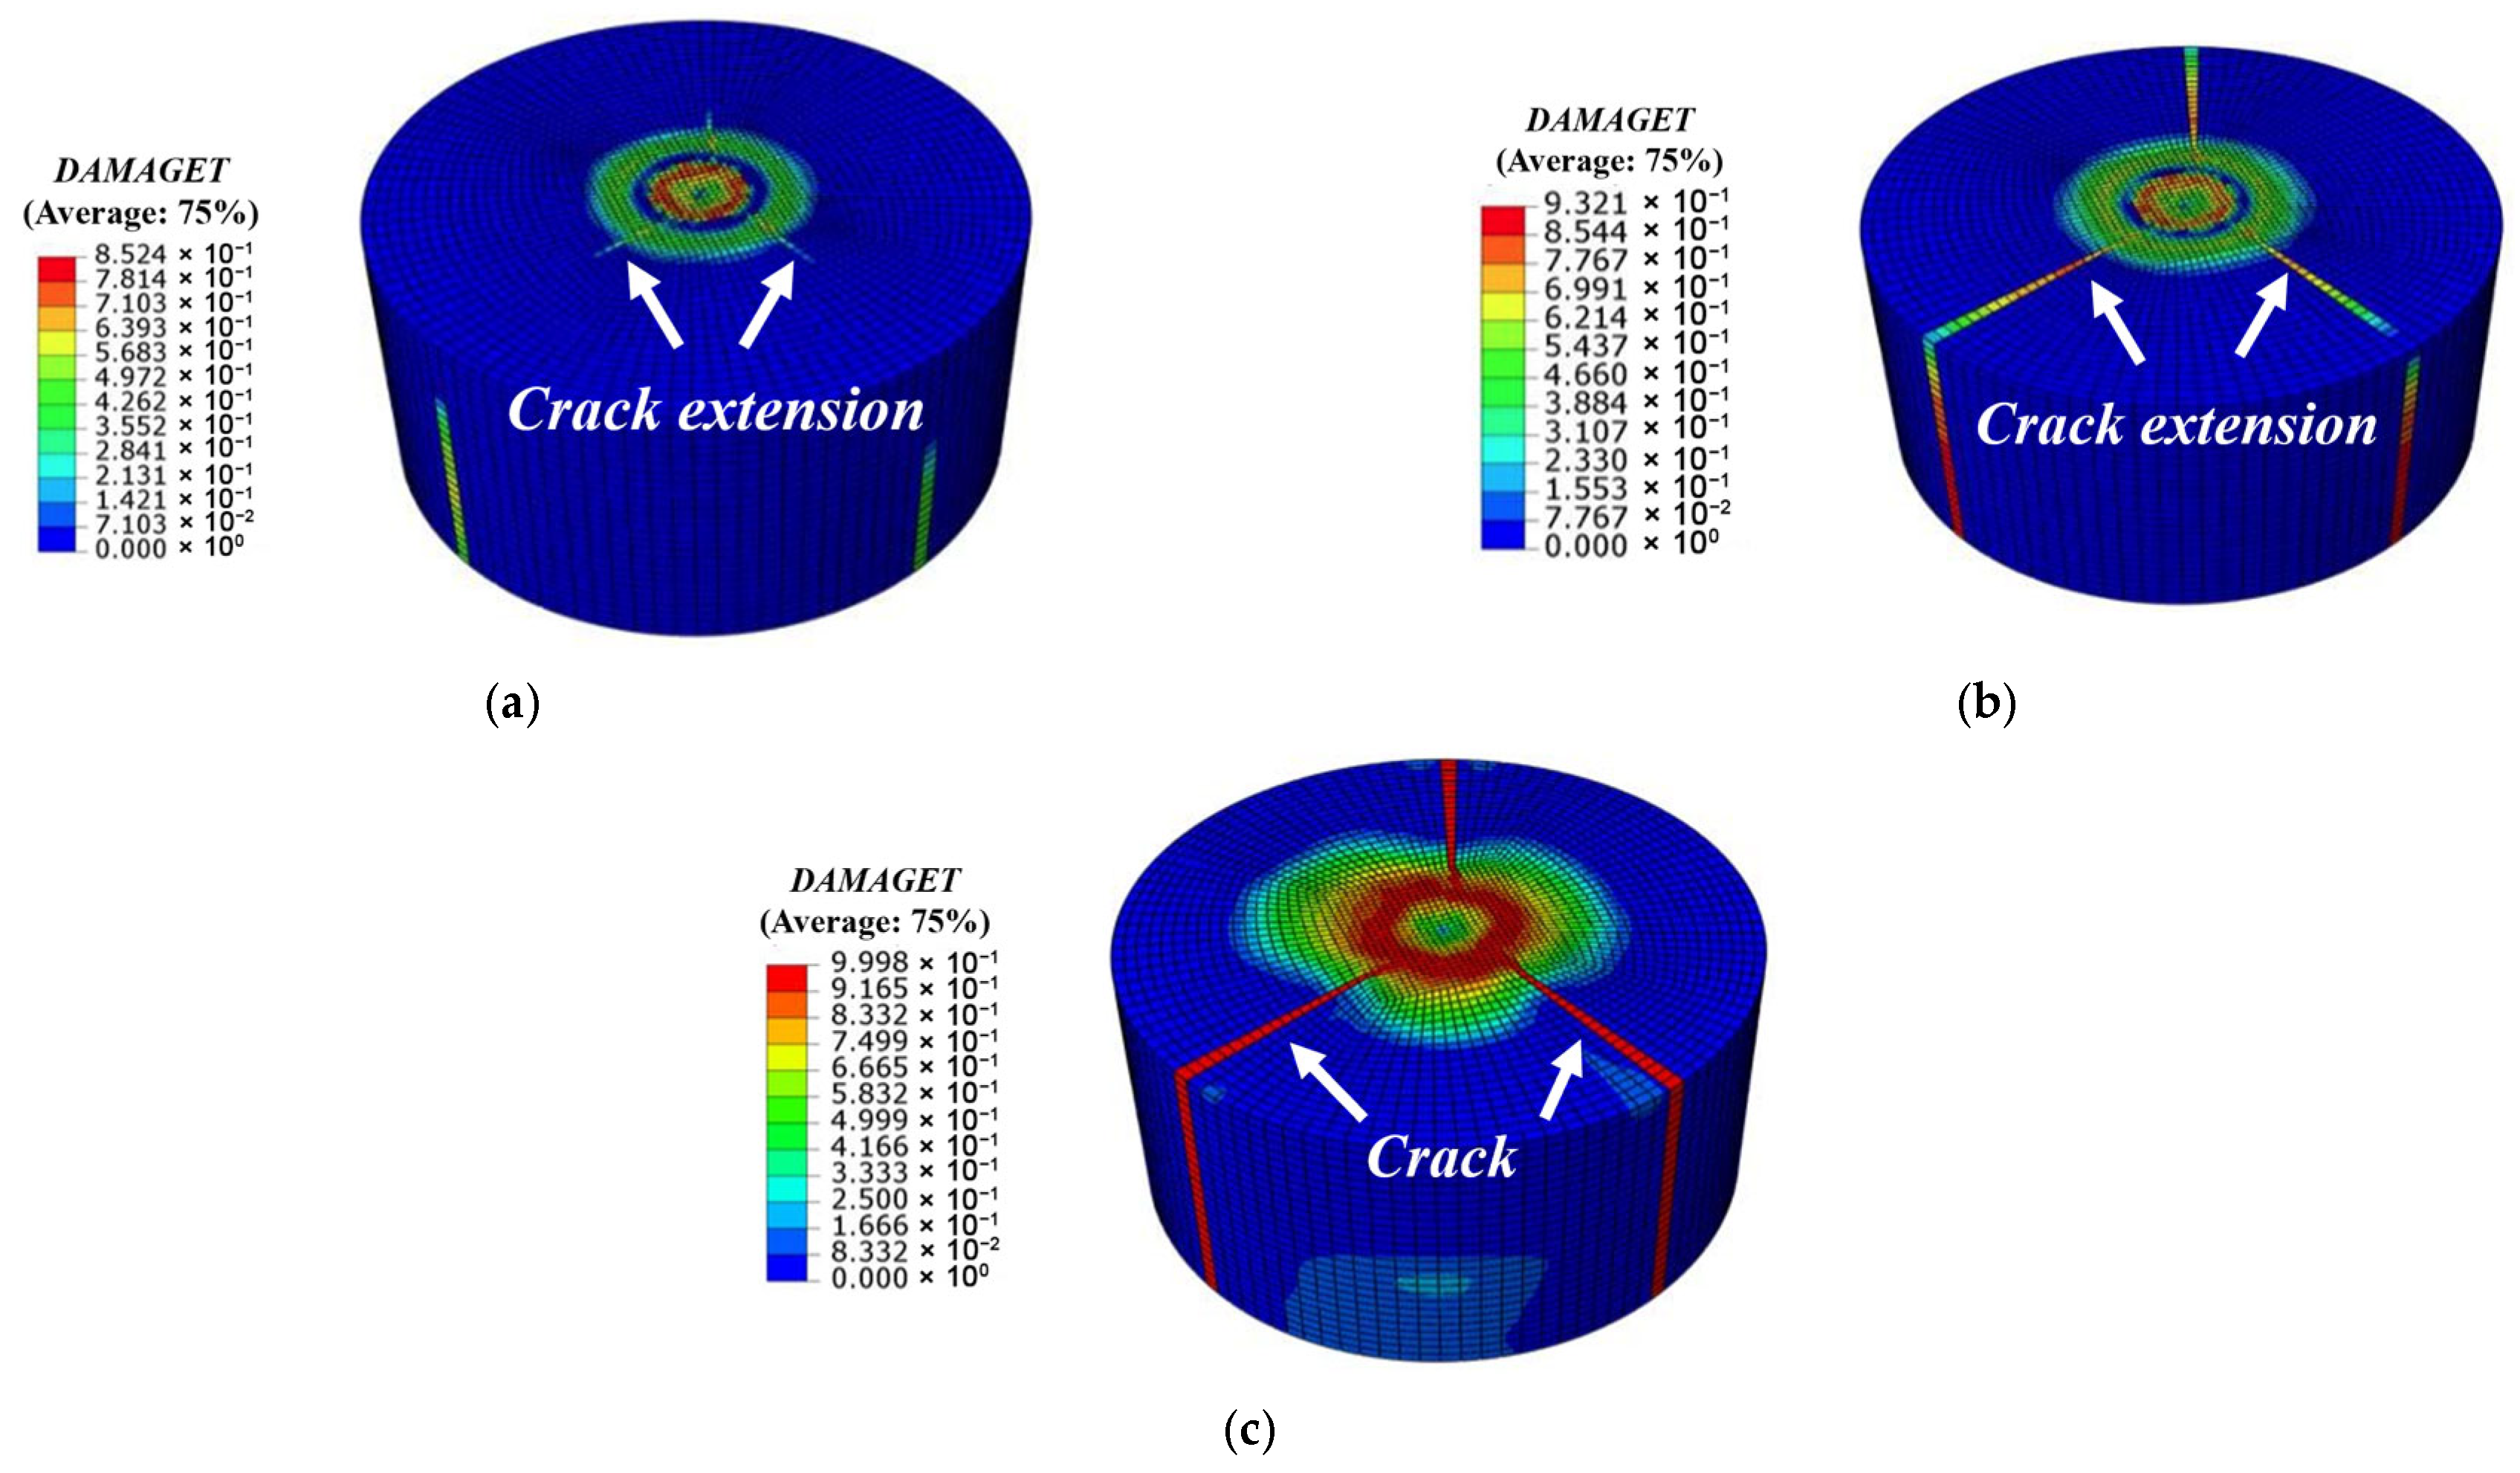
Figure 21 shows the failure mode of SSFRC in the drop hammer impact test. Figure 22 and Figure 23 respectively show the DAMAGEC and DAMAGET of SSFRC obtained from the numerical simulation of drop hammer impact.
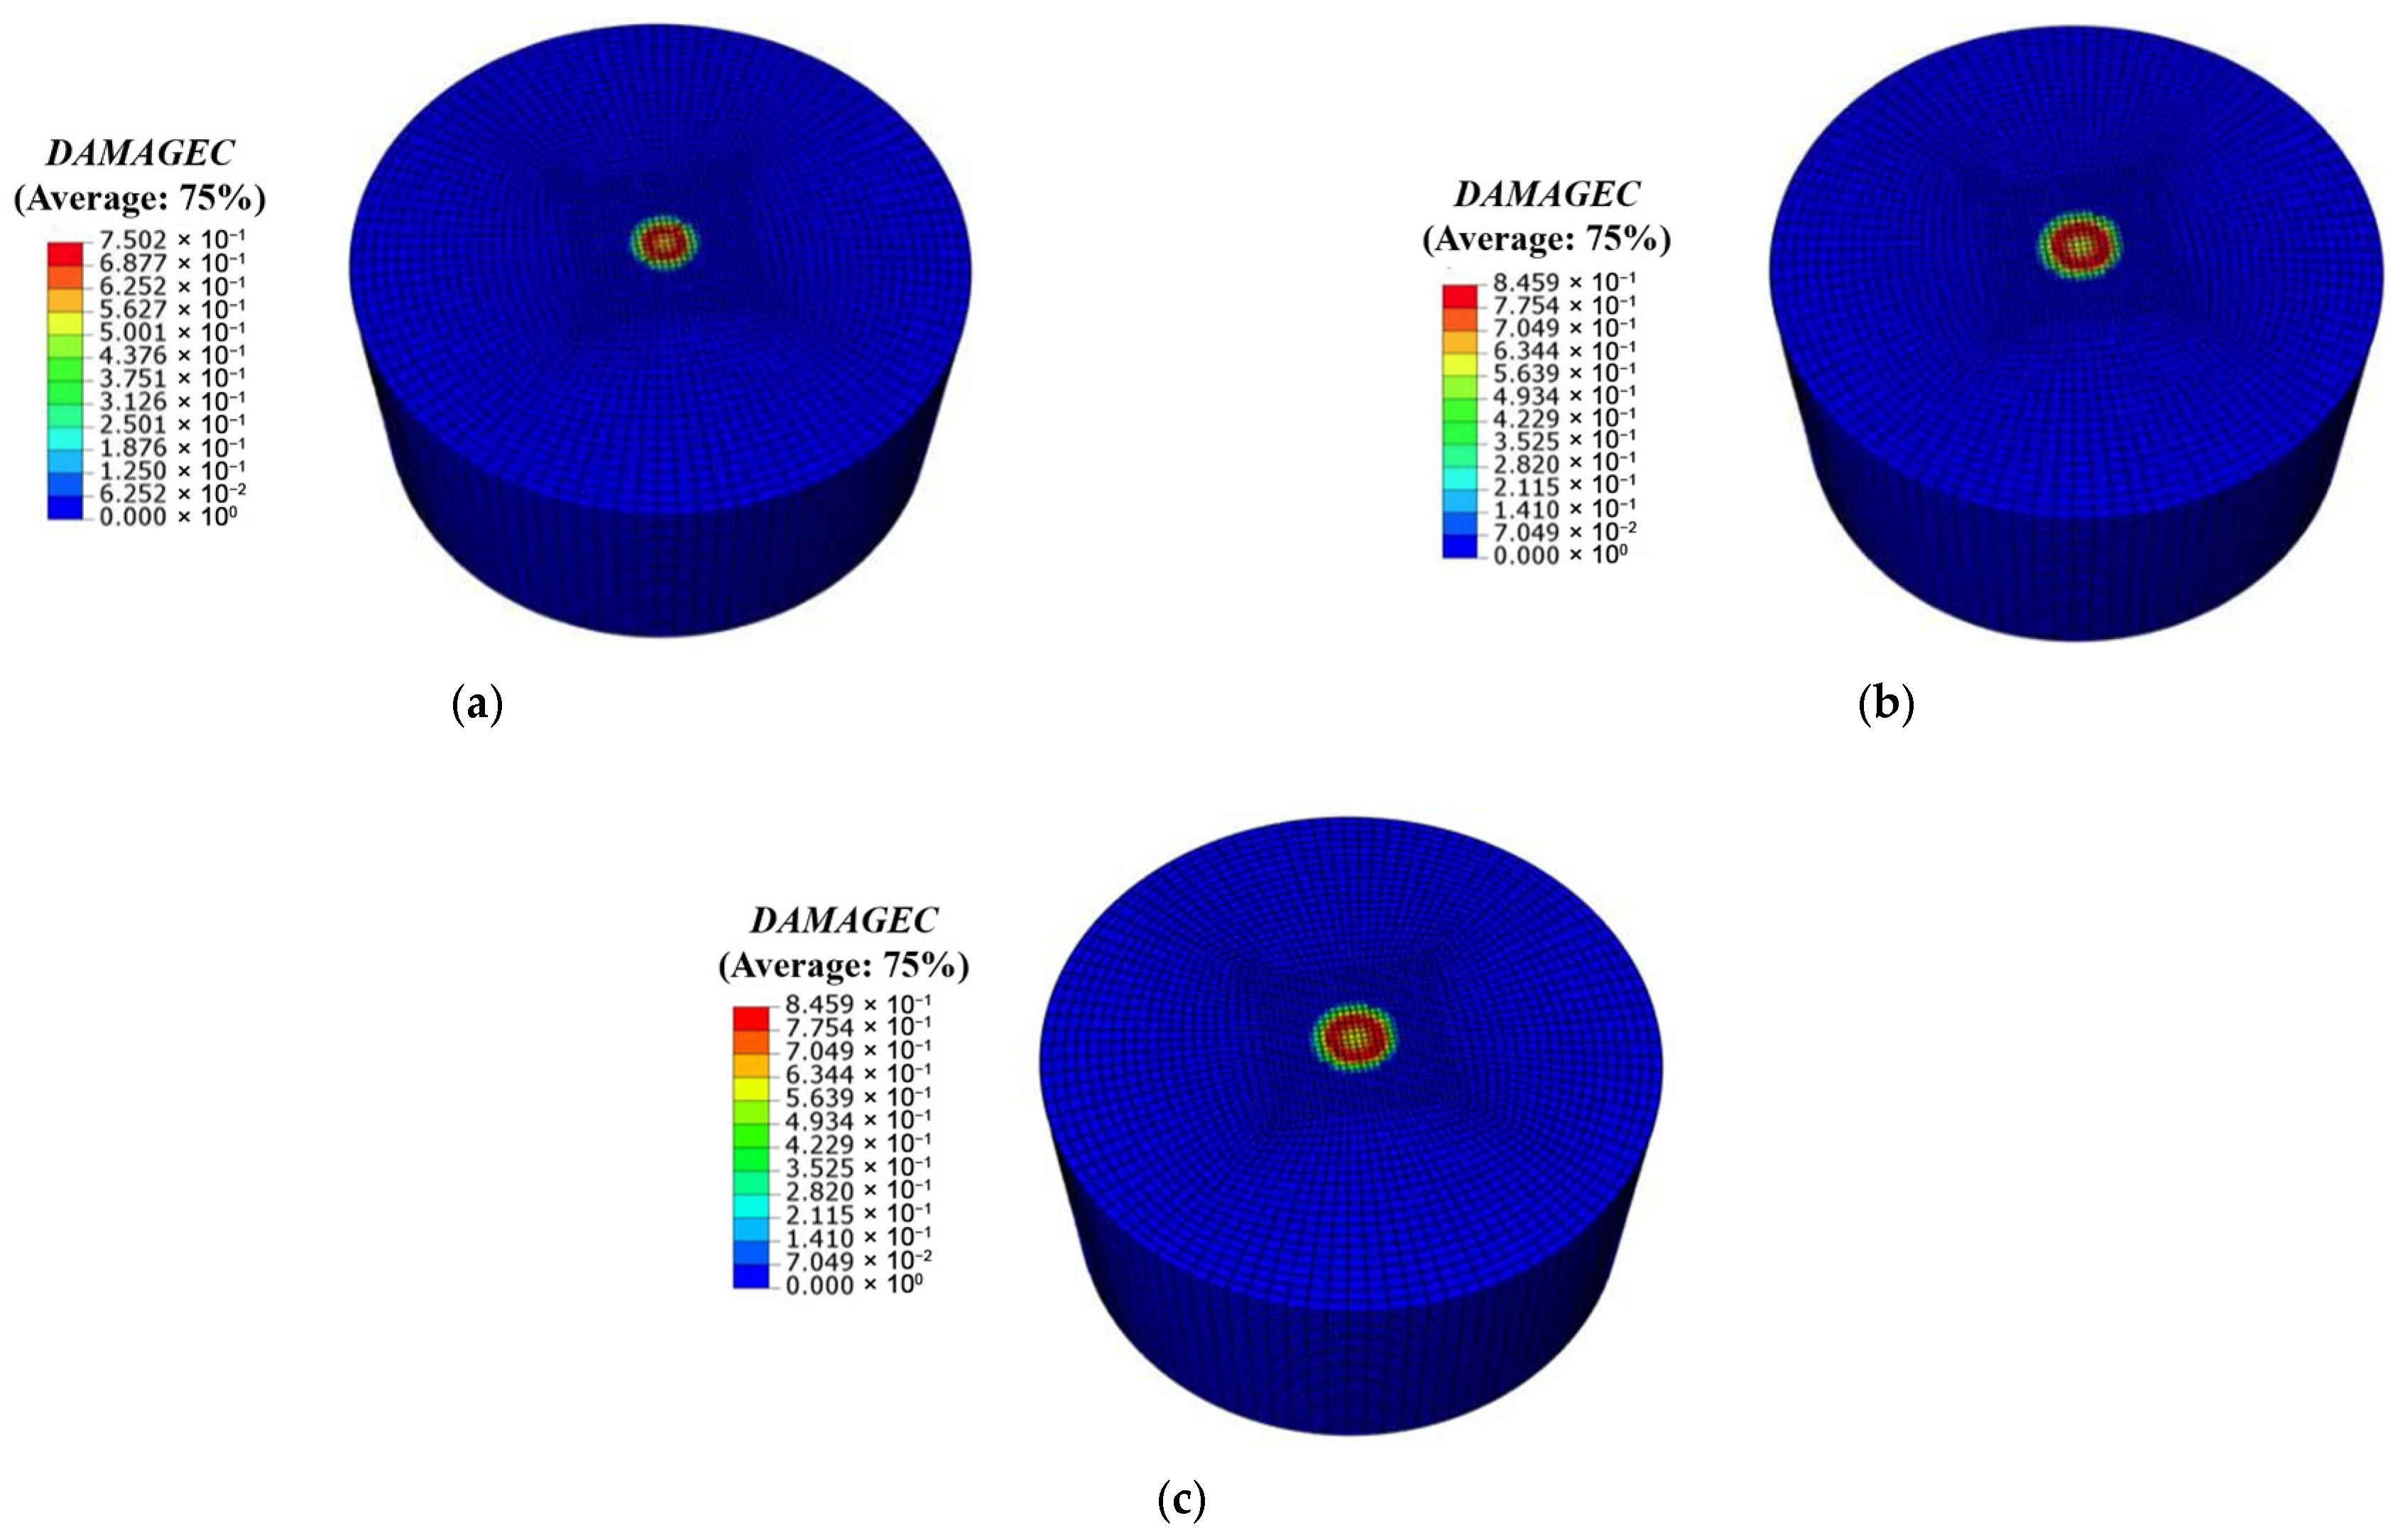
According to the DAMAGEC of SSFRC (Figure 22), it can be seen that in terms of compressive damage, SSFRC is also limited to the upper surface of the specimen only. During multiple impacts, a central circular damage area appeared at the center of the upper surface of the specimen. The damage gradually spread outward along the circular damage area from the center point of the impact. It is worth noting that in the initial impact stage, the degree of damage suffered by SSFRC is slightly lower than that of NC, and the area size is basically the same. However, as the number of impacts increases, by the time of failure and destruction, the damage area of SSFRC expands more than that of NC, and the degree of pressure damage is more severe.
According to the DAMAGET of SSFRC (Figure 23), it can be seen that three cracks were formed during the impact process. The formation and expansion process of the cracks began from the bottom surface. First, tensile damage occurred in the bottom area, and then it extended upward along the cylindrical specimen. As the number of impacts that SSFRC is subjected to increases, the area of the central circular fracture zone formed in the cylindrical specimen becomes larger and larger, and the width of these cracks will increase significantly. During the entire impact process, the upper surface also presented a large tensile failure area. Despite this, the specimen did not completely fail, demonstrating that the used steel fibers were closely embedded and connected to the matrix under dynamic impact loads, and the matrix inhibited the development of cracks. It was not until the bottom crack extended along the side and penetrated the upper surface that the specimen failed.

4.3. Error Analysis

Table 11 shows the comparison between the simulated values (s) and the test values (t). It can be seen from the table that the first crack test value (t1) of NC is 45, the first crack simulation value (s1) is 38, and the error between the simulation value and the test value is 15.5%. The failure test value (t2) is 45, the failure simulation value (s2) is 39, and the error between the test value and the simulated value is 13.3%. Given the high complexity of dynamic mechanics problems involved in impact simulation, this leads to more significant errors compared to static mechanics. In addition, in the impact test, the numerical values of the relevant times of NC during the process of the first crack generation and final failure are relatively low, so the error value is slightly larger, but still within an acceptable range.
The first crack t1 of SSFRC is 87, and the first crack s1 is 76. The error between the simulated value and the test value is 12.6%. This might be due to the insufficiently uniform distribution of rubber particles and steel fibers during the test process. The failure t2 is 129, the failure s2 is 115, and the error between the test value and the proposed value is 10.8%. Therefore, the errors between the test values and the simulated values for the initial cracking and failure of the specimens are all within a reasonable range.
The possible reasons for the error are that in the simulation process using the ABAQUS CAE 2023 software, units with isotropic and uniform distribution characteristics were selected. However, these units cannot precisely reproduce the internal structure of the material in the test. In actual concrete tests, it is quite difficult to achieve a completely uniform distribution when steel fibers are incorporated into concrete materials, which leads to a certain degree of discreteness in the data. In ABAQUS, the density of cell mesh division also has an impact on the accuracy of the results. In addition, the accuracy of concrete parameters in ABAQUS will also have an impact on the simulation results. In further research, the spatial distribution characteristics of SSF and the interface behavior of the matrix will be simulated through a discrete element model. Or random distribution scenarios of SSF can be generated through random methods (such as the Monte Carlo), and after multiple simulations, the discreteness of fibers distribution in actual materials is reflected.

5. Conclusions

In this study, SSF was added to prepare SSFRC. The matrix strength of SSFRC was C30, rubber was 10%, and the dosages of SSF were 0, 0.5, 1.0, 1.5, 2.0, and 2.5%. The specimens underwent cube compression tests, and repeated drop hammer impact tests were conducted on the SSFRC concrete specimens from three aspects: SSF content, drop hammer weight, and drop height. Finally, ABAQUS was used to establish NC and SSFRC with 1.5% SSF dosage impact finite element models to verify the test results, and the following conclusions were drawn:
  • After the incorporation of SSF, the failure mode of SSFRC in the cube compression test and the drop hammer impact test exhibited the characteristics of “cracking but not scattering, breaking but not shattering”. Meanwhile, its failure process is plastic failure with good integrity. The results show that the impact resistance of SSFRC has been greatly improved due to the incorporation of SSF.
  • In the cube compressive test, the optimal dosage of SSF in SSFRC is 1.0%, at which point its compressive strength reaches the maximum value, with a growth rate of 10.6% compared to NC. The growth rate reached 23.4% compared with RC. In terms of compressive strength, due to the addition of SSF, the compressive capacity of SSFRC has a better improvement effect than that of RC, indicating that SSF offsets the adverse effect of rubber particles on the strength of concrete.
  • Impact resistance tests were conducted on SSFRC to study the effects of drop weight, drop height, and SSF dosage. The results showed that compared with NC, the addition of SSF increased N1 and N2, and both N1 and N2 increased with the increase of SSF dosage. The maximum is reached when the steel fiber dosage is 1.5%. When the drop height is fixed, the greater the weight of the drop hammer, the smaller N1 and N2 will be. When the weight of the drop hammer is fixed, the greater the drop height, the smaller N1 and N2 will be.
  • By comparing the failure modes of NC cylindrical specimens and SSFRC cylindrical specimens with the numerical simulation results, it was found that the overall failure trend and failure state were consistent, which confirmed that the numerical simulation had high accuracy. The damage degree and area of SSFRC are significantly higher than those of NC, which indicates that SSFRC has a higher impact load-bearing capacity. Although there are certain differences between the experimental data of N1 and N2 and the simulated data, such differences are still within an acceptable range.
In this study, the finite element model assumes that the scrap steel fibers are uniformly distributed and does not reflect the agglomeration phenomenon at high dosages. Moreover, only short-term mechanical properties are studied, lacking the analysis of the impact of environmental aging on long-term performance. Further research can be carried out in directions such as optimizing numerical models considering the non-uniform distribution of fibers and exploring long-term durability performance.

Author Contributions

Conceptualization, Y.G.; methodology, Y.G.; software, C.W.; validation, C.W.; formal analysis, Y.L.; investigation, Y.L.; resources, M.L.; data curation, M.L.; writing—original draft preparation, M.L.; writing—review and editing, T.F. All authors have read and agreed to the published version of the manuscript.

Funding

This research was funded by the Jiangxi Province Intelligent Building Engineering Research Center Open Fund Project (No. HK20231009), the National Natural Science Foundation of China (51978088), and the State Key Laboratory of Geological Disaster Prevention and Geological Environmental Protection of Chengdu University of Technology, grant numbers 2015BAK09B01 and SKLGP2019K019.

Data Availability Statement

Data will be made available upon request.

Acknowledgments

The authors of the paper would like to thank the editors and reviewers for their guidance and feedback on this paper.

Conflicts of Interest

The authors declare that they have no known competing financial interests or personal relationships that could have appeared to influence the work reported in this paper.

References

  1. Pereiro, B.; Lenz, E.; Torres, B.; Estevan, L. Mechanical properties of recycled aggregate concrete reinforced with conventional and recycled steel fibers and exposed to high temperatures. Constr. Build. Mater. 2024, 452, 138976. [Google Scholar] [CrossRef]
  2. Zhao, X.H.; Jiang, G.; Yang, L.; Jia, Y.S.; Fang, H.Y.; Sun, J.S.; Zhao, H.N. Experimental study on the damage characteristics of steel fiber reinforced concrete slabs attacked by chloride ion under contact explosion. Appl. Ocean Res. 2024, 153, 104270. [Google Scholar] [CrossRef]
  3. Palacio, A.J.; Raggiotti, B.B.; Rougier, V.C. Development and experimental verification of a design method for steel fibre-reinforced high strength lightweight self-compacting concrete. Constr. Build. Mater. 2024, 453, 139012. [Google Scholar] [CrossRef]
  4. Mehmandari, T.A.; Shokouhian, M.; Josheghan, M.Z.; Mirjafari, S.A.; Fahimifar, A.; Armaghani, D.J.; Tee, K.F. Flexural properties of fiber-reinforced concrete using hybrid recycled steel fibers and manufactured steel fibers. J. Build. Eng. 2024, 98, 111069. [Google Scholar] [CrossRef]
  5. Esmailzade, M.; Eskandarinia, M.; Aslani, F. Effect of impurities of steel fibers extracted from shredded tires on the behavior of fiber-reinforced concrete. Structures 2024, 45, 1175–1188. [Google Scholar] [CrossRef]
  6. Archibong, F.N.; Sanusi, O.M.; Médéric, P.; Hocine, N.A. An overview on the recycling of waste ground tyre rubbers in thermoplastic matrices: Effect of added fillers. Resour. Conserv. Recycl. 2021, 175, 105894. [Google Scholar] [CrossRef]
  7. Bi, R.S.; Zhang, Y.; Jiang, X.; Yang, H.X. Simulation and techno-economical analysis on the pyrolysis process of waste tire. Energy 2022, 260, 125039. [Google Scholar] [CrossRef]
  8. Arabiourrutia, M.; Lopez, G.; Artetxe, M.; Alvarez, J.; Bilbao, J.; Olazar, M. Waste tyre valorization by catalytic pyrolysis—A review. Renew. Sustain. Energy Rev. 2020, 129, 109932. [Google Scholar] [CrossRef]
  9. Gerges, N.N.; Issa, C.A.; Fawaz, S.A. Rubber Concrete: Mechanical and dynamical properties. Case Stud. Constr. Mater. 2018, 9, e00184. [Google Scholar] [CrossRef]
  10. Thomas, B.S.; Gupta, G.C. A comprehensive review on the applications of waste tire rubber in cement concrete. Renew. Sustain. Energy Rev. 2016, 54, 1323–1333. [Google Scholar] [CrossRef]
  11. Thomas, B.S.; Gupta, G.C. Long term behaviour of cement concrete containing discarded tire rubber. J. Clean. Prod. 2015, 102, 78–87. [Google Scholar] [CrossRef]
  12. Malaiškienė, J.; Astrauskas, T.; Januševičius, T.; Kizinievič, O.; Kizinievič, V. Potential applications of rubber buffing dust and recovered crumb rubber in cement concrete. Results Eng. 2024, 24, 103266. [Google Scholar] [CrossRef]
  13. Ji, Y.C.; Qasem, M.J.S.; Xu, T.D.; Mohammed, A.O.Y. Mechanical properties investigation on recycled rubber desert sand concrete. J. CO2 Util. 2024, 88, 102939. [Google Scholar] [CrossRef]
  14. Adebayo, I.W.; Long, G.C.; Tang, Z.; Ghone, M.O.; Zaland, S.; Garba, M.J.; Yang, K.; Akhunzada, K.; Oluwasina, U.A. Effect of crumb rubber and polyethylene fiber on the strength and toughness of fly ash/slag-based geopolymer concrete. Constr. Build. Mater. 2024, 455, 139133. [Google Scholar] [CrossRef]
  15. Mohseni, E.; Koushkbaghi, M. Recycling of landfill waste tyre in construction materials: Durability of concrete made with chipped rubber. Constr. Build. Mater. 2023, 409, 134114. [Google Scholar] [CrossRef]
  16. Shahjalal, M.; Islam, K.; Batool, F.; Tiznobaik, M.; Hossain, F.M.; Ahmed, K.S.; Alam, M.S.; Ahsan, R. Fiber-reinforced recycled aggregate concrete with crumb rubber: A state-of-the-art review. Constr. Build. Mater. 2023, 404, 133233. [Google Scholar] [CrossRef]
  17. Peng, M.; Gao, Y.T.; Wei, J.C.; Han, Y.; Chen, X.L.; Kou, X.J. Experimental study on mechanical properties and toughness of recycled steel fiber rubber concrete. Case Stud. Constr. Mater. 2024, 21, e03858. [Google Scholar] [CrossRef]
  18. Chen, L.L.; Chen, X.D.; Ren, Y.; Lu, B.Y.; Lv, Z.Y. Integrating machine learning with multi-objective optimization to maximize the ductility of macro-synthetic fiber reinforced rubber concrete. Case Stud. Constr. Mater. 2025, 22, e04647. [Google Scholar] [CrossRef]
  19. Alsaif, A.; Alharbi, Y.R. Strength, durability and shrinkage behaviours of steel fiber reinforced rubberized concrete. Constr. Build. Mater. 2022, 345, 128295. [Google Scholar] [CrossRef]
  20. Lai, D.; Demartino, C.; Xiao, Y. High-strain rate compressive behavior of fiber-reinforced rubberized concrete. Constr. Build. Mater. 2022, 319, 125739. [Google Scholar] [CrossRef]
  21. Dong, S.; Zhao, Q.H.; Zhu, H. Mechanical properties and constitutive model of steel fiber-reinforced rubberized concrete. Constr. Build. Mater. 2022, 327, 126720. [Google Scholar] [CrossRef]
  22. Zhao, Y.F.; Peng, S.; Yu, Z.P.; Du, X.Q. Research and mechanism analysis on dynamic compressive behavior of steel fiber reinforced concrete. Constr. Build. Mater. 2023, 368, 130358. [Google Scholar] [CrossRef]
  23. Gao, Y.T.; Wang, B.; Liu, C.J.; Hui, D.; Xu, Q.; Zhao, Q.H.; Qin, Y.W.; Dong, W. Experimental investigation on static compressive toughness of steel fiber rubber concrete. Rev. Adv. Mater. Sci. 2022, 61, 576–586. [Google Scholar] [CrossRef]
  24. Zhuang, J.P.; Xu, R.X.; Pan, C.Y.; Li, H.X. Dynamic stress–strain relationship of steel fiber-reinforced rubber self-compacting concrete. Constr. Build. Mater. 2022, 344, 128197. [Google Scholar] [CrossRef]
  25. Noaman, A.T.; Bakar, B.H.; Akil, H. Experimental investigation on compression toughness of rubberized steel fibre concrete. Constr. Build. Mater. 2016, 115, 163–170. [Google Scholar] [CrossRef]
  26. Luo, T.; Zhang, C.; Sun, C. Experimental investigation on the freeze-thaw resistance of steel fibers reinforced rubber concrete. Materials. 2020, 13, 1260. [Google Scholar] [CrossRef]
  27. Alsaif, A.; Bernal, S.A.; Guadagnini, M.; Pilakoutas, K. Freeze-thaw resistance of steel fibre reinforced rubberised concrete. Constr. Build. Mater. 2019, 195, 450–458. [Google Scholar] [CrossRef]
  28. Noaman, A.T.; Bakar, B.H.; Akil, H.; Alani, A.H. Fracture characteristics of plain and steel fibre reinforced rubberized concrete. Constr. Build. Mater. 2017, 152, 414–423. [Google Scholar] [CrossRef]
  29. Zhang, X.G.; Li, Y.L.; Fan, Y.H.; Zhou, G.Q.; Huang, Y.J.; Xu, P.; Ding, Y.H. Analysis on the impact resistance of steel fiber reinforced recycled aggregate concrete. Structures 2025, 75, 108599. [Google Scholar] [CrossRef]
  30. Cao, Y.; Alyousef, R.; Baharom, S.; Shah, S.N.; Alaskar, A.; Alabduljabbar, H.; Mohamed, A.M.; Assilzadeh, H. Dynamic attainment of mixed aspect ratio for concrete members reinforced with steel fiber under impact loading. Mech. Adv. Mater. Struc. 2020, 29, 1986–1995. [Google Scholar] [CrossRef]
  31. Hao, Y.F.; Huang, X.; Hao, H. Mesoscale modelling of concrete reinforced with spiral steel fibres under dynamic splitting tension. Adv. Struct. Eng. 2018, 21, 1197–1210. [Google Scholar] [CrossRef]
  32. Yoo, D.Y.; Yoon, Y.S. Influence of steel fibers and fiber-reinforced polymers on the impact resistance of one-way concrete slabs. J. Compos. Mater. 2014, 48, 695–706. [Google Scholar] [CrossRef]
  33. Sun, X.W.; Zhao, K.; Li, Y.C.; Huang, R.Y.; Ye, Z.B.; Zhang, Y.L.; Ma, J. A study of strain-rate effect and fiber reinforcement effect on dynamic behavior of steel fiber-reinforced concrete. Constr. Build. Mater. 2018, 158, 657–669. [Google Scholar] [CrossRef]
  34. Jin, L.; Hao, H.M.; Zhang, R.B.; Du, X.Y. Mesoscale simulation on the effect of elevated temperature on dynamic compressive behavior of steel fiber reinforced concrete. Fire Technol. 2020, 56, 1801–1823. [Google Scholar] [CrossRef]
  35. Su, Y.; Li, J.; Wu, C.Q.; Wu, P.T.; Li, Z.X. Effects of steel fibres on dynamic strength of UHPC. Constr. Build. Mater. 2016, 114, 708–718. [Google Scholar] [CrossRef]
  36. Zhang, X.G.; Zhu, Y.N.; Fan, Y.H.; Zhou, G.Q.; Huang, Y.J.; Li, M.B.; Shen, W.L. Experimental study on impact resistance and dynamic constitutive relation of steel fiber reinforced recycled aggregate concrete. Constr. Build. Mater. 2024, 449, 138396. [Google Scholar] [CrossRef]
  37. Guo, S.Q.; Ding, Y.H.; Xu, P.; Wu, J.; Bao, J.W. Stress-strain relationship of steel fiber reinforced fully recycled coarse/fine aggregate concrete under cyclic loading. Case Stud. Constr. Mater. 2025, 22, e04139. [Google Scholar] [CrossRef]
  38. Chen, C.; Zhang, X.H.; Hao, H.; Sarker, P.K. Experimental and numerical study of steel fibre reinforced geopolymer concrete slab under impact loading. Eng. Struct. 2025, 322, 119096. [Google Scholar] [CrossRef]
  39. Liu, S.; Zhu, D.J.; Li, G.S.; Yao, Y.M.; Ou, Y.F.; Shi, C.J.; Du, Y.X. Flexural response of basalt textile reinforced concrete with pre-tension and short fibers under low-velocity impact loads. Case Stud. Constr. Mater. 2018, 169, 859–876. [Google Scholar] [CrossRef]
  40. Ramesh, A.; Rajeev, P.; Xu, S.Q.; Sanjayan, J.; Lu, G.X. Impact response of textile-reinforced 3D printed concrete panels. Eng. Struct. 2024, 315, 118489. [Google Scholar] [CrossRef]
  41. Lv, J.; Han, W.C.; Zheng, J.L.; Lin, S.A.; Yuan, S.J. Effects of basalt fibre and rubber particles on the mechanical properties and impact resistance of concrete. Structures 2024, 65, 106677. [Google Scholar] [CrossRef]
  42. Youssf, O.; ElGawady, M.A.; Mills, J.E. Experimental investigation of crumb rubber concrete columns under seismic loading. Structures 2015, 3, 13–27. [Google Scholar] [CrossRef]
  43. Yu, Y.; Jin, Z.Q.; Shen, D.X.; An, J.L.; Sun, Y.Y.; Li, N. Microstructure evolution and impact resistance of crumb rubber concrete after elevated temperatures. Constr. Build. Mater. 2023, 384, 131340. [Google Scholar] [CrossRef]
  44. Dong, J.Y.; Liu, Y.C.; Yuan, S.C.; Li, K.P.; Zhang, F.Y.; Guan, Z.W.; Chai, H.K.; Wang, Q.Y. Mechanical behavior and impact resistance of rubberized concrete enhanced by basalt fiber-epoxy resin composite. Constr. Build. Mater. 2024, 435, 136836. [Google Scholar] [CrossRef]
  45. Chen, J.X.; Zhuang, J.P.; Shen, S.Z.; Dong, S.Q. Experimental investigation on the impact resistance of rubber self-compacting concrete. Structures 2022, 39, 691–704. [Google Scholar] [CrossRef]
  46. Ofuyatan, O.M.; Muhit, I.B.; Babafemi, A.J.; Osibanjo, I. Evaluation of self-compacting rubberized concrete properties: Experimental and machine learning approach. Structures 2023, 58, 105423. [Google Scholar] [CrossRef]
  47. Gonen, T. Freezing-thawing and impact resistance of concretes containing waste crumb rubbers. Case Stud. Constr. Mater. 2018, 177, 436–442. [Google Scholar] [CrossRef]
  48. Gupta, T.; Sharma, R.K.; Chaudhary, S. Impact resistance of concrete containing waste rubber fiber and silica fume. Int. J. Impact Eng. 2015, 83, 76–87. [Google Scholar] [CrossRef]
  49. AbdelAleem, B.H.; Ismail, M.K.; Hassan, A.A. The combined effect of crumb rubber and synthetic fibers on impact resistance of self-consolidating concrete. Constr. Build. Mater. 2018, 162, 816–829. [Google Scholar] [CrossRef]
  50. GB 175-2023; Common Portland Cement. State Administration for Market Regulation and Standardization Administration of the People’s Republic of China: Beijing, China, 2023.
  51. CECS13:2009; Standard for Test Methods of Fiber-reinforced Concrete. China Engineering Construction Association Standard: Beijing, China, 2009.
  52. JGJ55-2011; Code for Design of Mix Proportions of Ordinary Concrete. Ministry of Housing and Urban-Rural Development of the People’s Republic of China: Beijing, China, 2011.
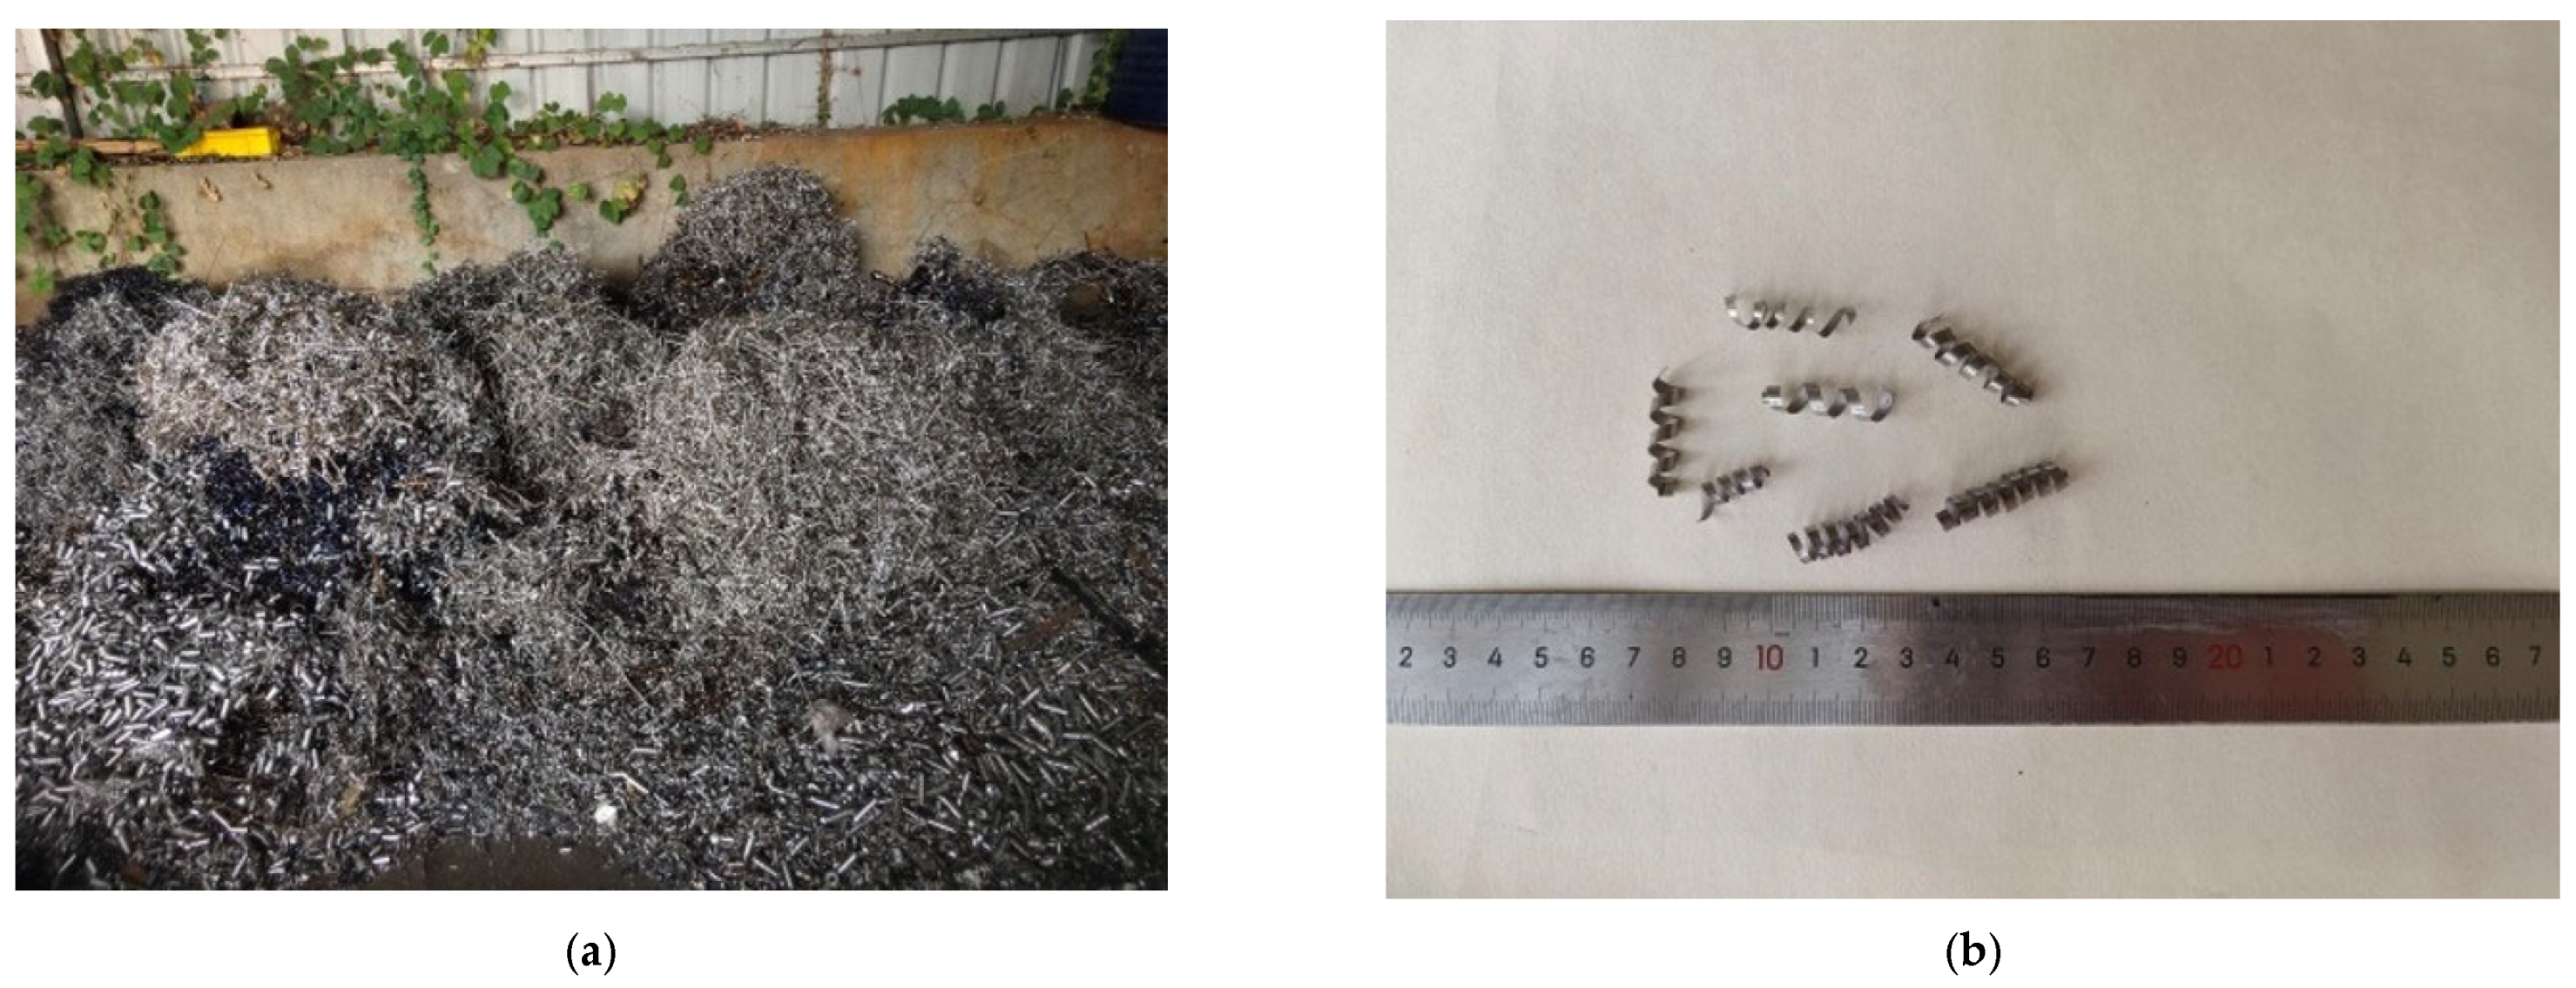
Figure 1. Selection process of SSF treatment. (a) Unprocessed SSF; (b) processed SSF.
Buildings 15 02857 g001
Figure 2. Rubber particles’ morphology.
Buildings 15 02857 g002
Figure 3. The specimen preparation flowchart.
Buildings 15 02857 g003
Figure 4. Specimens’ maintenance process. (a) Cover the mold with film; (b) maintenance in water; (c) specimens’ maintenance to complete.
Buildings 15 02857 g004
Figure 5. Diagram of the test device and WHY-1000 testing machine. (a) Test device and model; (b) WHY-1000 testing machine.
Buildings 15 02857 g005
Figure 6. Cubic compressive strength and strength ratio.
Buildings 15 02857 g006
Figure 7. Compressive failure mode of concrete. (a) NC; (b) SSF0.0-RC10.0; (c) SSF0.5-RC10.0; (d) SSF1.0-RC10.0; (e) SSF1.5-RC10.0; (f) SSF2.0-RC10.0.
Buildings 15 02857 g007
Figure 8. Relationship between the number of hammer strikes and the dosage of SSF (the first crack appears). (a) W = 4.5 kg; (b) W = 6.0 kg; (c) W = 7.5 kg.
Buildings 15 02857 g008
Figure 9. Relationship between the number of hammer strikes and the dosage of SSF (specimen failure). (a) W = 4.5 kg; (b) W = 6.0 kg; (c) W = 7.5 kg.
Buildings 15 02857 g009
Figure 10. Relationship between impact energy and the dosage of SSF (the first crack appears). (a) W = 4.5 kg; (b) W = 6.0 kg; (c) W = 7.5 kg.
Buildings 15 02857 g010
Figure 11. Relationship between impact energy and the dosage of SSF (specimen failure). (a) W = 4.5 kg; (b) W = 6.0 kg; (c) W = 7.5 kg.
Buildings 15 02857 g011
Figure 12. Impact resistance times of concrete (4.5 kg).
Buildings 15 02857 g012
Figure 13. Concrete resists impact energy consumption (4.5 kg).
Buildings 15 02857 g013
Figure 14. Impact resistance times of concrete (6.0 kg).
Buildings 15 02857 g014
Figure 15. Concrete resists impact energy consumption (6.0 kg).
Buildings 15 02857 g015
Figure 16. Finite element model.
Buildings 15 02857 g016
Figure 17. Grid division diagram. (a) Grid division of drop hammer; (b) grid division of concrete.
Buildings 15 02857 g017
Figure 18. Failure of NC.
Buildings 15 02857 g018
Figure 19. Development process of DAMAGEC of NC. (a) The hammer has just touched the concrete; (b) the first crack appears; (c) specimen failure.
Buildings 15 02857 g019
Figure 20. Development process of DAMAGET of NC. (a) The hammer has just touched the concrete; (b) the first crack appears; (c) specimen failure.
Buildings 15 02857 g020
Figure 21. Failure of SSFRC.
Buildings 15 02857 g021
Figure 22. Development process of DAMAGEC of SSFRC. (a) The hammer has just touched the concrete; (b) the first crack appears; (c) specimen failure.
Buildings 15 02857 g022
Figure 23. Development process of DAMAGET of SSFRC. (a) The hammer has just touched the concrete; (b) the first crack appears; (c) specimen failure.
Buildings 15 02857 g023
Table 1. Mechanical properties of scrap steel fibers.
Length (L)/mmThickness (T)/mmAverage Tensile Strength (ft)/MPaElastic Modulus (E)/×105 MPaExternal
Characteristics
20–40<0.5>3802.053D spiral
Table 2. Concrete mix proportion.
Specimen
Number
Concrete
Strength
Dosage of SSF
(%)
Material Consumption per Unit Volume (kg/m3)
ConcreteStoneSandWaterSSFRubber
(10%)
NCC300339.61241.1639.318000
SSF0.0-RC10.00339.61241.1639.3180032
SSF0.5-RC10.00.5339.61241.1639.318039.532
SSF1.0-RC10.01.0339.61241.1639.31807932
SSF1.5-RC10.01.5339.61241.1639.3180118.532
SSF2.0-RC10.02.0339.61241.1639.318015832
SSF2.5-RC10.02.5339.61241.1639.3180197.532
Note: NC indicates normal concrete, SSF1.0-RC10.0 indicates RC with 1.0% SSF dosage, and so on. The rubber particles dosage of 10% is determined based on the research content [21].
Table 3. Specimen grouping.
Specimen
Number
Specimen
Specification
(mm)
Cube Compression
(Group × Number)
Specimen
Specification
(mm)
Impact Resistance
(Group × Number)
NC100 × 100 × 1001 × 3φ 150 × 659 × 3
SSF0.0-RC10.01 × 39 × 3
SSF0.5-RC10.01 × 39 × 3
SSF1.0-RC10.01 × 39 × 3
SSF1.5-RC10.01 × 39 × 3
SSF2.0-RC10.01 × 39 × 3
SSF2.5-RC10.01 × 39 × 3
Total21189
Table 4. Cube compressive strength and strength ratio.
Specimen
Number
Concrete
Strength
Cube Compressive StrengthStrength Ratio
NCC3037.681
SSF0.0-RC10.033.770.896
SSF0.5-RC10.036.150.959
SSF1.0-RC10.041.681.106
SSF1.5-RC10.038.121.012
SSF2.0-RC10.037.911.006
SSF2.5-RC10.037.791.003
Table 5. Impact lifetimes of NC (times).
Height (mm)
Weight (kg)
450575700
N1N2Number of CracksN1N2Number of CracksN1N2Number of Cracks
4.5484912929115151
454522425211111
414112626113141
Average44.6745.001.3326.3326.671.3313.0013.331.00
6.02222111111671
2525213131771
2121112131662
Average22.6722.671.3312.0012.331.006.336.671.33
7.514151661342
10101562221
13142551331
Average12.3313.001.335.335.671.332.673.001.33
Table 6. Impact lifetimes of SSFRC (times) (4.5 kg).
Height (mm)
Dosage (%)
450575700
N1N2Number of CracksN1N2Number of CracksN1N2Number of Cracks
0555833234217193
525433539312142
495233134315182
Average52.0054.673.0032.6735.672.6714.6717.002.33
0.5677433335316193
616723742319213
697433237415193
Average65.9771.672.6734.0038.003.3316.6719.673.00
1.07710333545220262
869943947416214
7110743141417253
Average78.00103.003.6735.0044.333.3317.6724.003.00
1.58812733958223324
8113134163319293
9112944567421325
Average86.67129.03.3341.6762.673.0021.0031.004.00
2.06910523552322293
7511243755420313
7810443853418265
Average74.00107.03.3336.6753.333.6720.0028.673.67
2.5627933445317242
578753640416234
557433346518213
Average58.0080.003.6734.3343.674.0017.0022.673.00
Table 7. Impact lifetimes of SSFRC (times) (6.0 kg).
Height (mm)
Dosage (%)
450575700
N1N2Number of CracksN1N2Number of CracksN1N2Number of Cracks
02629214162891
2728217181793
2426313163782
Average25.6727.672.3314.6716.672.007.338.672.00
0.532363151728103
29333161939124
28312171949113
Average29.6733.332.6716.0018.333.008.6711.003.00
1.031422172449112
293931622310134
32444162349123
Average30.6741.673.0016.3323.003.679.3312.003.00
1.5334641827211153
37493172539153
294541826410165
Average33.0046.673.6717.6726.003.0010.0015.333.67
2.028392162338133
25373152459122
32334172148124
Average28.3336.333.0016.0022.674.008.3312.333.00
2.525314131727103
2633315194795
27323172038113
Average26.0032.003.3315.0018.673.007.3310.003.67
Table 8. Impact life times of SSFRC (times) (7.5 kg).
Height (mm)
Dosage (%)
450575700
N1N2Number of CracksN1N2Number of CracksN1N2Number of Cracks
013153683342
11132781462
14162792443
Average12.6714.672.336.678.332.003.674.672.33
0.5151927102463
172238122562
162029123573
Average16.0020.332.338.0011.332.334.676.332.67
1.01825310143583
1623311153574
172447123682
Average17.0024.003.339.3313.673.005.337.673.00
1.519283111737114
19294121736103
18274101848124
Average18.6728.003.6711.0017.333.337.0011.003.67
2.0152348133684
162249134693
1522410143583
Average15.3322.334.009.0013.333.335.678.333.33
2.5131838103354
141847113454
131738113453
Average13.3317.673.337.6710.673.003.675.003.67
Table 9. Quantitative analysis of SSFRC.
Performance
Metrics
Optimal Dosage of SSFKey Quantitative
Data
Comparison
Benchmark
Compressive property1.0%The cube compressive strength reaches 41.68 MPa, and the strength ratio is 1.106.About 23.4% higher than RC
Impact resistance performance N11.5%Under a 4.5 kg drop hammer and a height of 450 mm, N1 is 87 times, and the corresponding energy is 1719.97 J.About 230% higher than RC
Impact resistance performance N21.5%Under a 4.5 kg drop hammer and a height of 450 mm, N2 is 129 times, and the corresponding energy is 2560.01 J.About 360% higher than RC
Table 10. CDP basic parameter selection.
NameSymbolUnitNumerical Value
Young’s modulusEMPa30,000
Poisson’s ratioν--0.2
Expansion angleφ°30
Eccentricity ratioλ--0.1
fb0/fc0----1.16
Projection shape parameterK--0.6667
Viscosity parameterμ--0.0005
Table 11. Comparison between s and t of specimens’ impact resistance.
NumberNCSSFRC
t14587
s13876
t1/s11.181.14
Error15.5%12.6%
t245129
s239115
t2/s21.151.12
Error13.3%10.8%
Disclaimer/Publisher’s Note: The statements, opinions and data contained in all publications are solely those of the individual author(s) and contributor(s) and not of MDPI and/or the editor(s). MDPI and/or the editor(s) disclaim responsibility for any injury to people or property resulting from any ideas, methods, instructions or products referred to in the content.