Article

MBAV: A Positional Encoding-Based Lightweight Network for Detecting Embedded Parts in Prefabricated Composite Slabs

1
College of Hydraulic and Civil Engineering, Xinjiang Agricultural University, Urumqi 830052, China
2
Xinjiang BIM and Prefabricated Engineering Technology Research Center, Urumqi 830052, China
*
Author to whom correspondence should be addressed.
Buildings 2025, 15(16), 2850; https://doi.org/10.3390/buildings15162850
Submission received: 16 July 2025 / Revised: 3 August 2025 / Accepted: 9 August 2025 / Published: 12 August 2025
(This article belongs to the Section Building Structures)

Abstract

The accurate detection of embedded parts and truss rebars in prefabricated concrete composite slabs before casting is essential in ensuring structural safety and reliability. However, traditional inspection methods are time-consuming and lack real-time monitoring capabilities, limiting their suitability for modern prefabrication workflows. To address these challenges, this study proposes MBAV, a lightweight object detection model for the quality inspection of prefabricated concrete composite slabs. A dedicated dataset was built to compensate for the absence of public data and to provide sufficient training samples. The proposed model integrates positional encoding into a lightweight architecture to enhance its ability to capture multiscale features in complex environments. Ablation and comparative experiments on the self-constructed dataset show that MBAV achieves an mAP50 of 91% with a model size of only 5.7 MB—8% smaller than comparable models. These results demonstrate that MBAV is accurate and efficient, with its lightweight design showing strong potential for real-time quality inspection in prefabricated concrete production.

1. Introduction

Precast concrete structures offer improved control over energy use and carbon emissions, aligning with the goals of green building and sustainable development [1,2,3]. As a result, their adoption is increasing globally. These structures involve the offsite fabrication of components that are later assembled onsite [4,5]. Inadequate quality control during prefabrication can lead to costly repairs; thus, key precasting stages, such as reinforcement and formwork setup, must be rigorously inspected to ensure first-time casting quality [6,7].
Prefabricated slabs, which are essential horizontal load-bearing elements, typically comprise composite slabs, truss bars, reinforcement, junction boxes, and embedded parts to ensure structural integrity [8]. Prior to casting, factories inspect the arrangement of internal components. Manual inspection based on standard guidelines is labor-intensive and inefficient, leading to the widespread use of visual inspection. However, visual methods are prone to subjectivity, omissions, and errors, especially when inspecting large quantities of components [9]. The truss bars and embedded parts are densely arranged in staggered patterns, often with similar shapes, making accurate boundary segmentation challenging [10].
With the rapid advancement of artificial intelligence, deep convolutional neural networks (CNNs) have been increasingly applied to production quality and safety inspections, offering a low-cost and efficient alternative to traditional methods [11]. Deep learning techniques have shown strong performance in image classification [12], object detection [13], and segmentation [14], all of which are relevant to quality and safety assessment. In civil engineering, object detection has been widely employed to address inspection challenges, including defect detection in sewage pipelines [15], railway component evaluation [16], and concrete surface analysis [17]. In parallel with vision-based inspection, probabilistic machine learning frameworks have advanced structural health monitoring (SHM) data modeling. Recent work by Wang et al. [18,19,20] demonstrates that enhanced sparse Bayesian learning and heteroscedastic Gaussian process models can reconstruct and forecast heterogeneous SHM measurements with high precision under complex conditions such as typhoon events.
Within vision-based quality assessment, object detection algorithms remain central and can be broadly categorized into two-stage and one-stage models. During training, two-stage models divide the object detection process into candidate region extraction and object recognition. Representative methods include R-CNN [21] and Faster R-CNN [22]. Subsequent two-stage variants have pushed the detection accuracy even further. Mask R-CNN augments Faster R-CNN with a parallel mask branch and reports 38 AP for bounding boxes on MS-COCO, establishing a strong baseline for high-quality detection and instance segmentation [23]. Cascade R-CNN introduces multistage IoU refinement and surpasses all single-model detectors on the COCO benchmark at higher quality thresholds [24]. More recently, DetectoRS combines a recursive feature pyramid with switchable atrous convolutions, pushing the box AP to 55.7 on COCO test-dev [25].
Although two-stage models perform well in terms of accuracy, their detection speed is relatively slow. One-stage models, on the other hand, treat object detection as a regression problem, predicting and locating target areas directly using initial anchor points, thereby achieving end-to-end object detection [26]. Major representatives include the You Only Look Once (YOLO) series [27] and SSD [28]. Although one-stage models have slightly lower accuracy, their detection speed is significantly faster than that of two-stage models, making them more suitable for industrial real-time object detection scenarios.
Various improvements to the YOLO detection method have been proposed, and many scholars have verified the application of these algorithms in quality and safety inspections. Yu et al. [29] used an improved YOLOv3 model for part defect detection, adding an attention mechanism to the network to improve the detection accuracy, but its accuracy was lower than that of the CNN approach. Li et al. [30] proposed a YOLOv4 model with a custom receptive field structure for steel strip surface defect detection, which improved the network’s feature extraction capabilities, but its ability to detect small targets was still insufficient. Liang et al. [31] designed a lightweight YOLOv5 model for road surface crack detection, which met the requirements for efficient detection but still required improvements in recognition accuracy. Wang et al. [32] proposed an enhanced edge algorithm combined with YOLOv6, which could maintain high accuracy while recognizing the sizes of metal parts, but the measurement size had significant errors, and the network’s robustness was poor. Ye et al. [33] designed a new block to replace the original module in YOLOv7, greatly improving the accuracy of concrete surface crack detection, but the weight of the network model increased significantly, raising the requirements for operating equipment. Despite the YOLO series network models being applied to quality and safety inspections and achieving some improvements, effectively improving the accuracy and speed of such models remains an unresolved issue. YOLOv8, as a classic method in the YOLO series, is widely used in various object detection tasks due to its fast speed, high detection accuracy, and small model size. Therefore, to address the above limitations, we propose an algorithm based on the YOLOv8 detection framework for accurate prefabricated part quality inspection.
The main contributions of this study are as follows: (a) This paper creates a target detection dataset for prefabricated components of composite slabs to meet research needs. To enhance network robustness, various data augmentation strategies are employed to enrich the dataset’s diversity. (b) For the task of detecting the quality of prefabricated components, two new modules are designed within the YOLOv8 framework, namely the MBCA module and the Si-AVG-FPN framework connection method, along with a position encoding technique. (c) Compared to the unoptimized model, this model improves both the accuracy and speed, validating its effectiveness in the field of prefabricated component quality inspection.

2. Prefabricated Components and Dataset Preparation

2.1. Prefabricated Slab Components

The dataset used in this study comprises images of prefabricated laminated slabs captured prior to concrete pouring, focusing on embedded parts that are essential for transportation, installation, and system integration. Missing or misaligned elements may delay site delivery or require factory rework.
Junction boxes, typically embedded to support future lighting and electrical systems, are installed to interface with the cast-in-place concrete layer above. As shown in Figure 1a,b, these boxes are composed of metal or plastic, with standard dimensions of around 10 cm × 10 cm. Truss reinforcements, which span 2–3 m longitudinally, provide structural stability during handling (Figure 1c). Additional short rebars (length 10–20 cm, diameter < 1 cm) are placed near lifting points to resist localized stress. Reserved holes, approximately 15 cm in diameter, are formed with inserts before pouring to allow the post-installation of mechanical or electrical conduits, as illustrated in Figure 1d.
Smaller or less distinctive components—such as rebars and plastic boxes—are more prone to omission, especially when overlapping or partially occluded. The accurate detection of all embedded parts is therefore crucial to ensuring the quality, safety, and delivery readiness of prefabricated slabs.

2.2. Dataset Preparation

Due to the limited research on prefabricated slab components in the field of object detection, existing public datasets do not include this category. Therefore, a dedicated dataset was constructed for this study. It consists of images depicting prefabricated slabs with embedded parts prior to concrete pouring. Data collection was conducted through onsite photography and manual annotation at a prefabrication factory.
Given the complexity of annotating images containing multiple embedded parts and the need to balance the annotation workload with the research objectives, a total of 307 original images were captured, mostly with a resolution of 1024 × 768 pixels.
As data acquisition was performed indoors, image quality was affected by the factory lighting conditions and camera performance. To simulate real-world variability and mitigate the risk of overfitting during training, a range of data augmentation techniques—such as exposure adjustment, brightness reduction, noise addition, and sharpening—were applied. Specifically, exposure adjustment was implemented using brightness and contrast scaling factors randomly sampled from within [0.8, 1.2]. Gaussian noise with zero mean and a standard deviation in the range of [5,15] (pixel scale 0–255) was injected to simulate sensor noise. Image sharpening was also applied, with the strength randomly selected from within [1.0, 2.0]. These augmentations were consistently applied throughout training to enhance model robustness and ensure reproducibility. As a result, the dataset was expanded to include 1535 images of prefabricated slabs with embedded parts.
All images were manually annotated using the labelme-5.3.1 tool on a Windows 11 system. Annotations were performed in the form of object contours to generate detection labels, covering various embedded elements and truss reinforcement structures. For model training, the dataset was randomly split into training, validation, and test sets at a ratio of 7:2:1, with each image paired with a corresponding label file. The distribution of images is summarized in Table 1, while the detailed component counts are listed in Table 2.

3. Network Architecture Design for the MBAV Detection Model

To meet the dual demands of high accuracy and lightweight deployment in factory environments, this study proposes the MBAV model, an enhanced version of YOLOv8 tailored to detecting embedded parts in prefabricated slabs. Technically, MBAV introduces targeted improvements to both the backbone and neck. In the backbone, selected C2f modules are replaced with the novel MBCA module, which integrates MBConv and coordinate attention to enhance spatial perception while reducing parameter redundancy. In the neck, a lightweight bidirectional fusion structure is constructed using GSConv and the proposed AVCM module, which employs asymmetric vector attention to improve the detection of small and less distinctive components. Unlike prior lightweight architectures such as YOLOv8-n, YOLOv5-s, or YOLOv7-tiny—which often focus on a single structural refinement—MBAV achieves joint optimization across feature extraction and aggregation, forming a cohesive and efficient end-to-end detection pipeline.
The optimized model, built upon the YOLOv8 architecture, is referred to as MBAV. This section elaborates on the architectural enhancements made to its backbone and neck components.

3.1. Design of the Backbone Network

3.1.1. MBCA Module

The backbone employs the MBCA module, an optimized form of MBConv [34] designed for prefabricated component detection. The original MBConv, first used in MobileNetV2, combines depthwise separable and pointwise convolutions within an inverted bottleneck. This structure captures local and global features while keeping the parameters and FLOPs low, making it suitable for mobile or edge deployment.
Traditional backbones emphasize interchannel correlations but largely ignore spatial dependencies. In prefabricated slabs, however, components follow clear spatial patterns: truss reinforcements run longitudinally, and rebars appear in symmetric rows. To exploit these regularities, we embed coordinate attention (CA) [35] into MBCA. CA encodes positional information into the attention weights, guiding the network to regions of interest without losing spatial context. This integration improves the recognition accuracy by aligning the model with the structural layout of prefabricated components.
The improved MBCA module, shown in Figure 2, contains two key blocks: a depthwise separable convolution and a coordinate attention (CA) unit. Depthwise separable convolution operates in two steps. First, the depthwise stage applies a k × k filter to each input channel independently. Second, the pointwise stage merges the resulting channels with a 1 × 11\times 11 × 1 convolution. For an input tensor of size (H, W, C) and kernel size k, the output tensor has dimensions (H, W, C′). The corresponding parameter counts for a standard convolution (P1) and a depthwise separable convolution (P2) are computed as follows:
P 1 = k 2 × C × C
P 2 = C × k 2 + C
where k 2 typically refers to the ratio of the number of parameters in a depthwise separable convolution compared to a standard convolution.
The number of parameters in depthwise separable convolution is approximately 1 k 2 of that in ordinary convolution, resulting in a significant reduction in network parameters and facilitating an increase in the detection speed of the prefabricated component detection model.

3.1.2. Coordinate Attention Mechanism

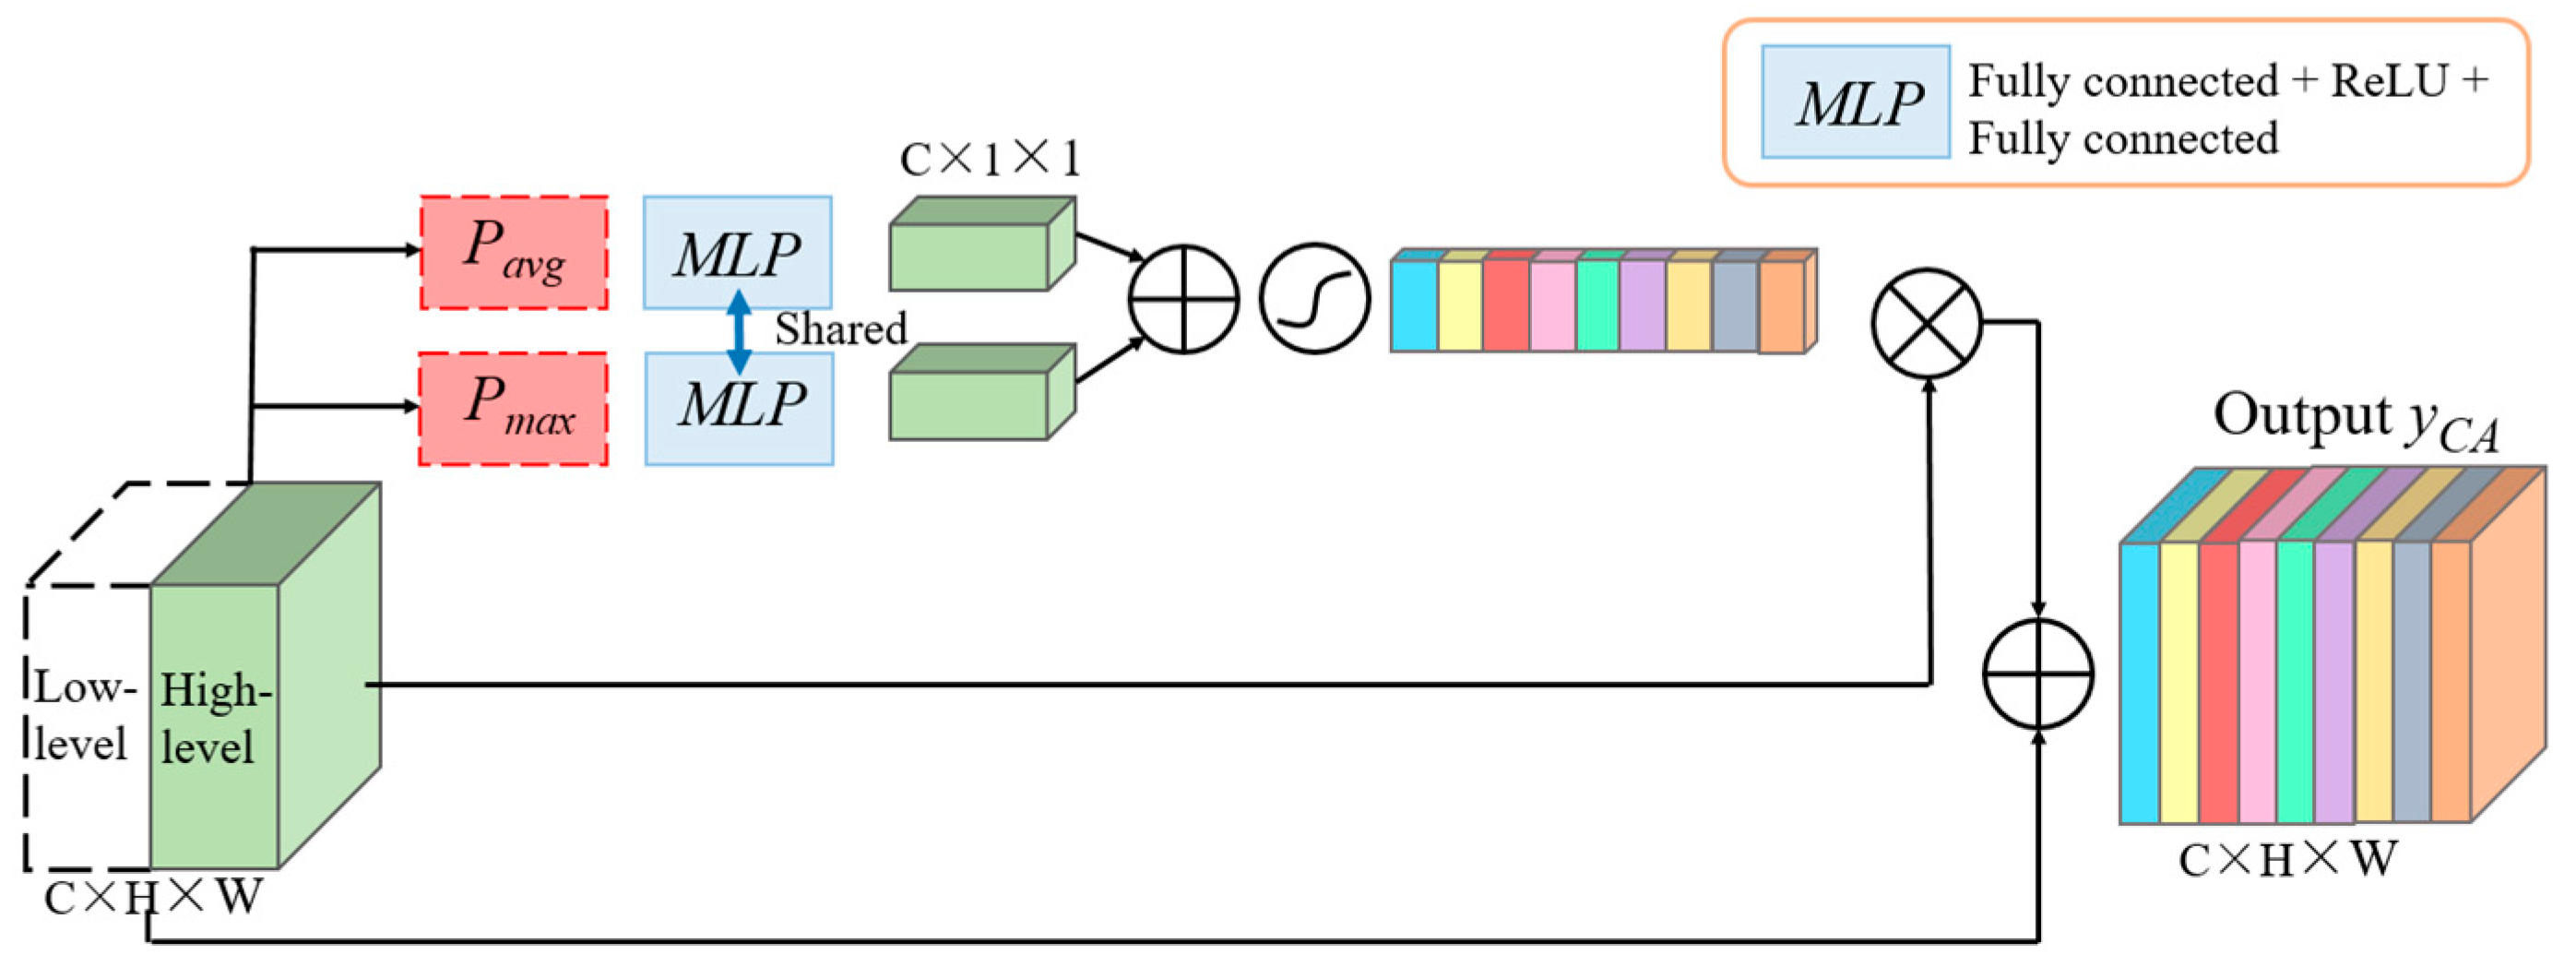
The coordinate attention (CA) mechanism (Figure 3) first decouples global average pooling. For an input tensor of size C   ×   H   ×   W , it applies average pooling along the horizontal and vertical axes, yielding context tensors of size C   ×   H   ×   1 and C   ×   1   ×   W . This design preserves two-dimensional positional cues while reducing computation.
For later analysis, we define the target set X n , which includes various types of precast component features, such as reinforcing bars (RR), plastic junction boxes (PJB), metal junction boxes (MJB), truss beams (TB), and reserved holes (RH).
X n = X R R , X P J B , X M J B , X T B , X R H
Next, we quantify the aggregate behavior of the component set Xn. Equation (4) defines the average feature value G a v g X n . We first sum the individual feature maps in Xn and then normalize the result by the target height H n and width W n . The resulting global descriptor represents the overall feature level of the slab and provides a basis for subsequent analysis.
G a v g X n = 1 H n × W n i = 1 H n j = 1 W n X n i , j
After calculating the average feature value G a v g X n using Equation (4), we turn our attention to assessing the peak performance of the individual features within the set X n . To achieve this, we apply Equation (5) to determine the maximum feature value G m a x X n . This maximum value highlights the highest recorded feature within the set, providing insight into the most prominent characteristics of the precast components. By evaluating both the average and maximum values, we can obtain a comprehensive understanding of the feature distribution and identify potential areas for improvement in the design and quality of the precast elements.
G m a x X n = m a x i , j X n i , j
Having established the maximum feature value G m a x X n through Equation (5), we now shift our focus to understanding the context of this value within the larger framework of feature types. Specifically, we consider the set of features represented by the index n , which includes different components, such as RR, PJB, MJB, TB, and RH, as outlined in Equation (6). By analyzing the maximum values corresponding to each feature type, we can draw meaningful comparisons and insights regarding their individual performance, which is crucial in optimizing the overall design and functionality of the precast components. This transition from a single peak value to a comparative analysis across multiple feature types allows for a more nuanced understanding of their respective characteristics and contributions.
n R R , P J B , M J B , T B , R H
Next, the results along the spatial dimensions are concatenated. Convolution is then used to compress the channels, followed by splitting. A 1   ×   1 convolution is used to adjust the number of channels in the bidirectional feature vectors to accommodate spatial dimension weighting, which integrates spatial information.
Overall, the CA mechanism not only focuses on channel information but also includes directional and positional sensitivity information. This prevents the loss of positional information that typically occurs in 2D global pooling, and it effectively extracts the location information of prefabricated components in prefabricated slabs. To complement the average feature-based output E a v g n from Equation (7), the model also incorporates the maximum feature value, recognizing that peak values can capture critical localized information about component X n .
E a v g n = σ W 1 n G a v g X n
where E a v g n is the output based on the average feature value of component X n , W 1 n is the weight parameter applied to the average value, and σ is the activation function introducing nonlinearity to the model.
Thus, Equation (8) applies a similar transformation using the maximum feature value, ensuring that the model balances both average and extreme responses:
E m a x n = σ W 2 n G m a x X n
where E m a x n represents the output derived from the maximum feature value of component X n .
After computing the average feature response E a v g n and the maximum feature response E m a x n , Equation (9) integrates this information by summing the two responses and applying the nonlinear activation function σ . This process ensures that the model leverages both global and local features to generate a more representative feature map A . The combined feature response A captures enriched information from both average and maximum responses:
A = σ W 3 E a v g n + E m a x n
Building on this, Equation (10) uses these refined features to generate the updated component set X n , ensuring that each element—such as X R R , X P J B , and others—benefits from the enhanced feature representation for more accurate detection and segmentation.
X n = X R R , X P J B , X M J B , X T B , X R H

3.2. Design of the Neck Network

3.2.1. Feature Fusion Enhancement

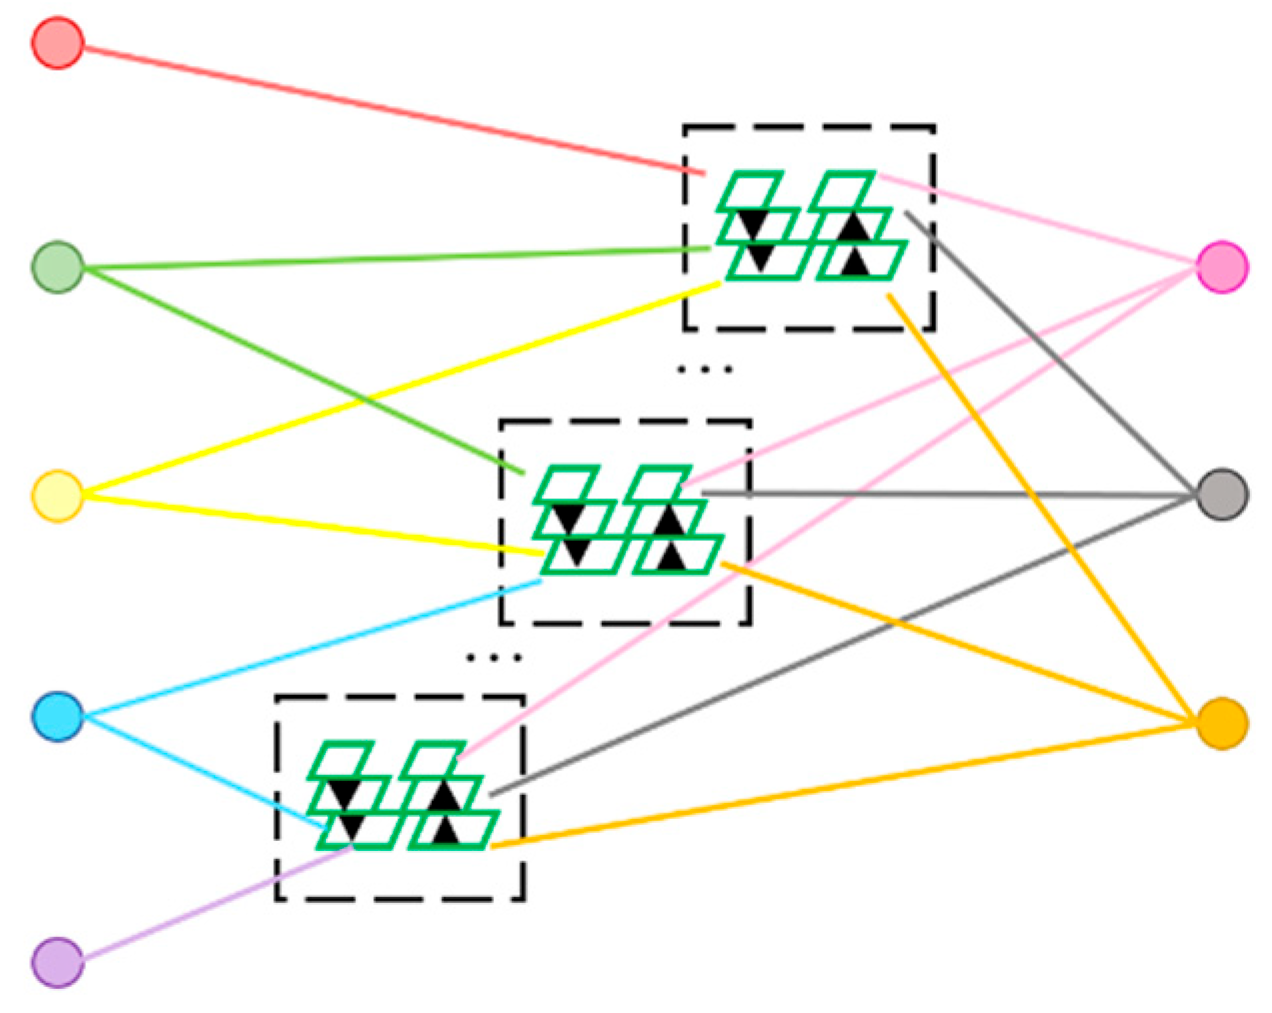
Due to the notable size disparity between truss reinforcements and reinforcement rebars in the prefabricated component dataset, the original network struggles with effective feature fusion. Reinforcement rebars, in particular, are difficult to detect using local features alone and require a slightly larger receptive field. To address this, additional shallow network outputs are introduced into the deep layers for feature fusion, as illustrated in Figure 4 and Figure 5. This design enables the local information from the P17 layer to incorporate shallow contextual features, improving the detection of small targets such as rebars and reducing the risk of information loss, thereby enhancing the overall recognition accuracy.
Building upon the linear combination of the low-level and deep feature maps in Equation (11), where the fused feature map F f u s e d n is represented as a weighted sum of F l n and F d n with corresponding weights α and β , we can also represent the fused feature map through the concatenation of these two feature maps without the explicit weighting.
F f u s e d n = α F l n + β F d n
where F f u s e d n is the fused feature map at level nnn, combining the low-level feature map F l n and the deep feature map F d n with weights α and β .
This leads us to Equation (12), where F f u s e d n is defined as the concatenation of F l n and F d n , allowing for the retention of all feature information while preparing for further processing. The fused feature map F f u s e d n is obtained by concatenating the low-level feature map F l n and the deep feature map F d n . This concatenation retains all the information from both feature maps. However, to further enhance the effectiveness of the feature representation and reduce redundant information, we apply a 1   ×   1 convolution operation to the concatenated feature map.
F f u s e d n = C o n c a t F l n + F d n
This process is reflected in Equation (13), where F f u s e d n extracts more discriminative features from the concatenated feature map, thus providing a more refined feature representation for subsequent model processing.
F f u s e d n = C o n v 1 × 1 C o n c a t F l n + F d n
where F f u s e d n is derived from applying a 1   ×   1 convolution to the concatenated low-level and deep feature maps.
In Figure 5, horizontal arrows indicate top-down pathways that transfer semantic information from higher-level features. Downward arrows represent bottom-up pathways conveying positional information from lower layers. Arrows spanning across the same layer denote newly added lateral connections between input nodes. Compared to Bi-FPN, the Bi-AV-FPN structure eliminates nodes with only one input, as no fusion occurs at these points; their removal simplifies the network, with a minimal impact on the detection performance. The added blue sections maximize feature fusion while maintaining an acceptable computational overhead to enhance the accuracy. Traditional fusion methods, such as Concat or Shortcut, often treat all features equally. However, due to differences in resolution, the feature contributions vary. To address this, Bi-AV-FPN adopts fast normalized fusion—a lightweight, Softmax-like weighting mechanism that scales contributions to the [0, 1] range. This method offers both fast training and high efficiency. The corresponding formula is as follows:
O = i w i × I i ε + j w j
where O is the output, w i denotes the corresponding weights assigned to each input, ε is a small constant added to prevent division by zero, and j w j is the total sum of the weights.
Taking the fusion of two features in the P6 layer as an example, the formula for feature fusion is as follows:
P 6 t d = C o n v w 1 × P 6 i n + w 2 × R e s i z e P 7 i n w 1 + w 2 + ε
P 6 o u t = C o n v w 1 × P 6 i n + w 2 × P 6 t d + w 3 × R e s i z e P 5 o u t w 1 + w 2 + w 3 + ε
Among them,   P 6 t d represents the input parameter of the intermediate node in P6, P 6 i n represents the input of the first node in the P6 layer, w represents the learned parameter, which is the weight of each feature map, Resize represents the upsampling or downsampling operation, and Conv represents the convolution operation for feature processing. Overall, Bi-AV-FPN is composed of the addition of a weighted feature fusion mechanism with repeated bidirectional cross-scale connections based on Bi-FPN, as well as the addition of the AVCStem module, making it more robust in dealing with prefabricated target feature detection.

3.2.2. VoVGSCSP: A Lightweight Feature Extraction Module Based on GSConv

To improve the detection balance among truss reinforcements, reinforcement rebars, and embedded boxes, an additional feature fusion path was introduced. This mitigates the information loss caused by size disparities. However, while enhancing the detection accuracy, the modification also increased the number of parameters. In practical engineering applications, efficiency and low memory consumption on deployment devices are critical. To address this, the VoVGSCSP module [36] is adopted due to its lower complexity compared to the C2f module. It replaces standard convolution with the lightweight GSConv, which maintains a comparable learning capacity. The structure of the VoVGSCSP module is illustrated in Figure 6.

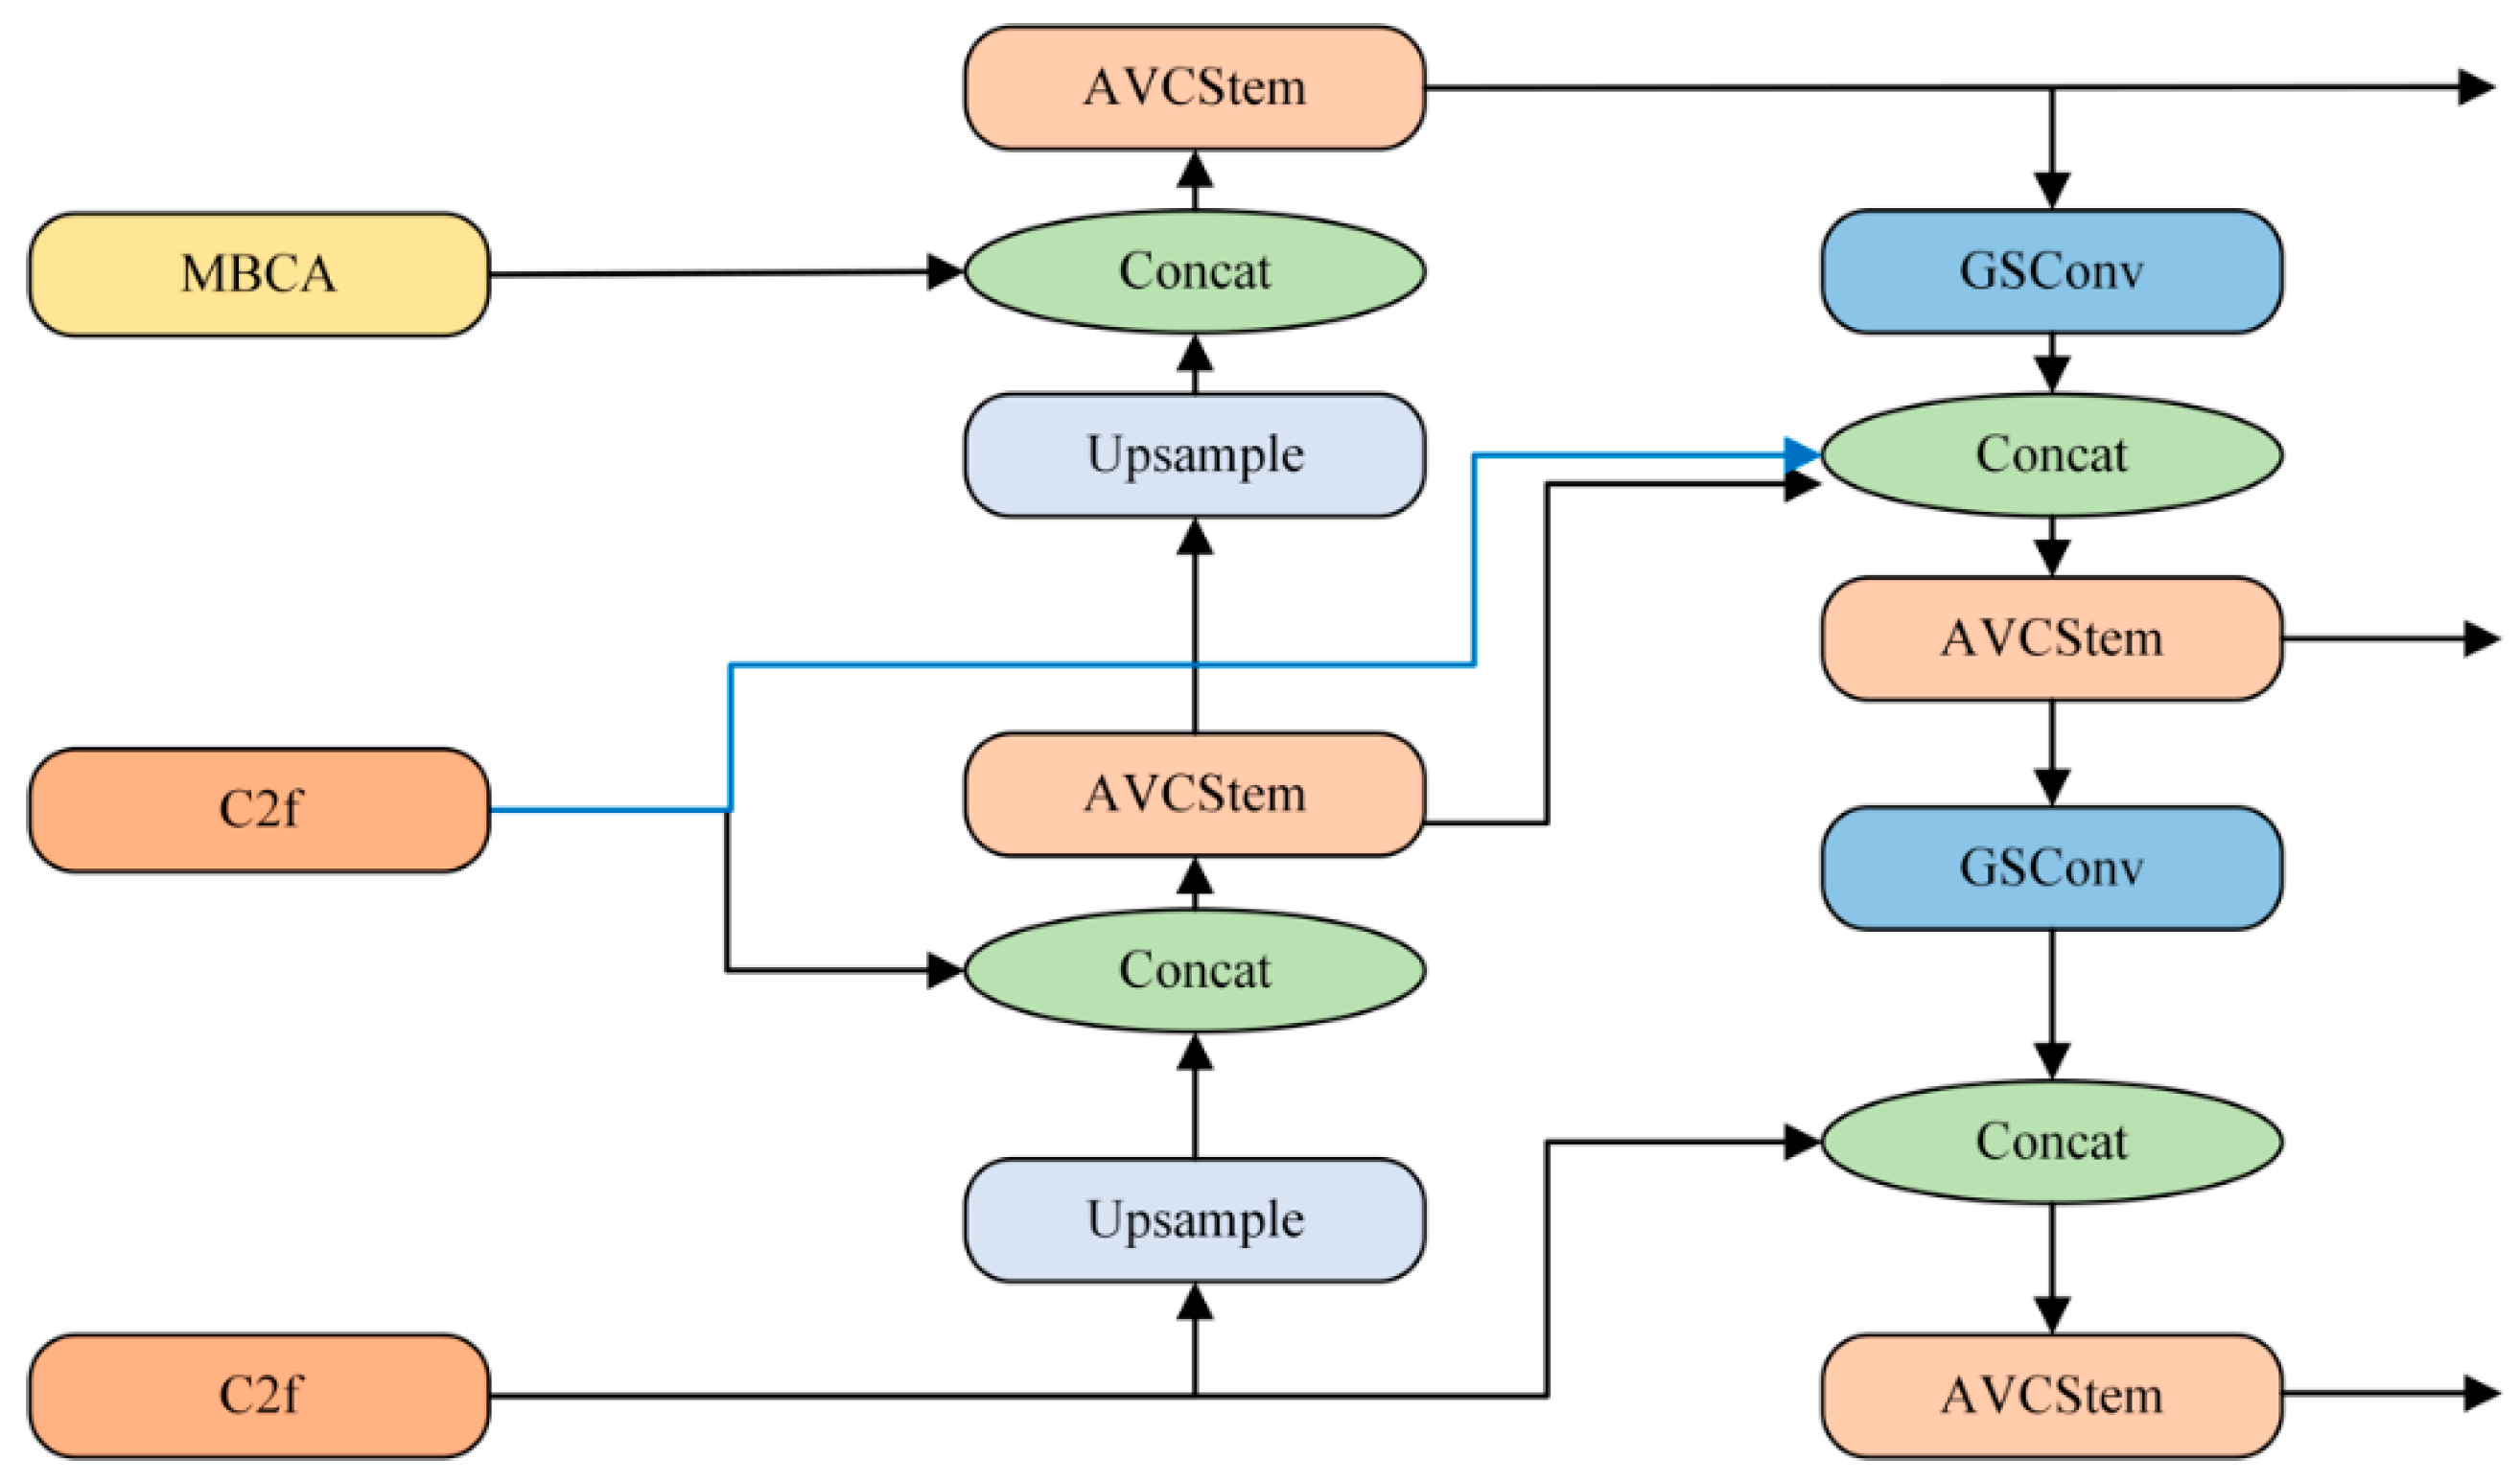
3.2.3. AVCM: Attention-Based Fusion Module

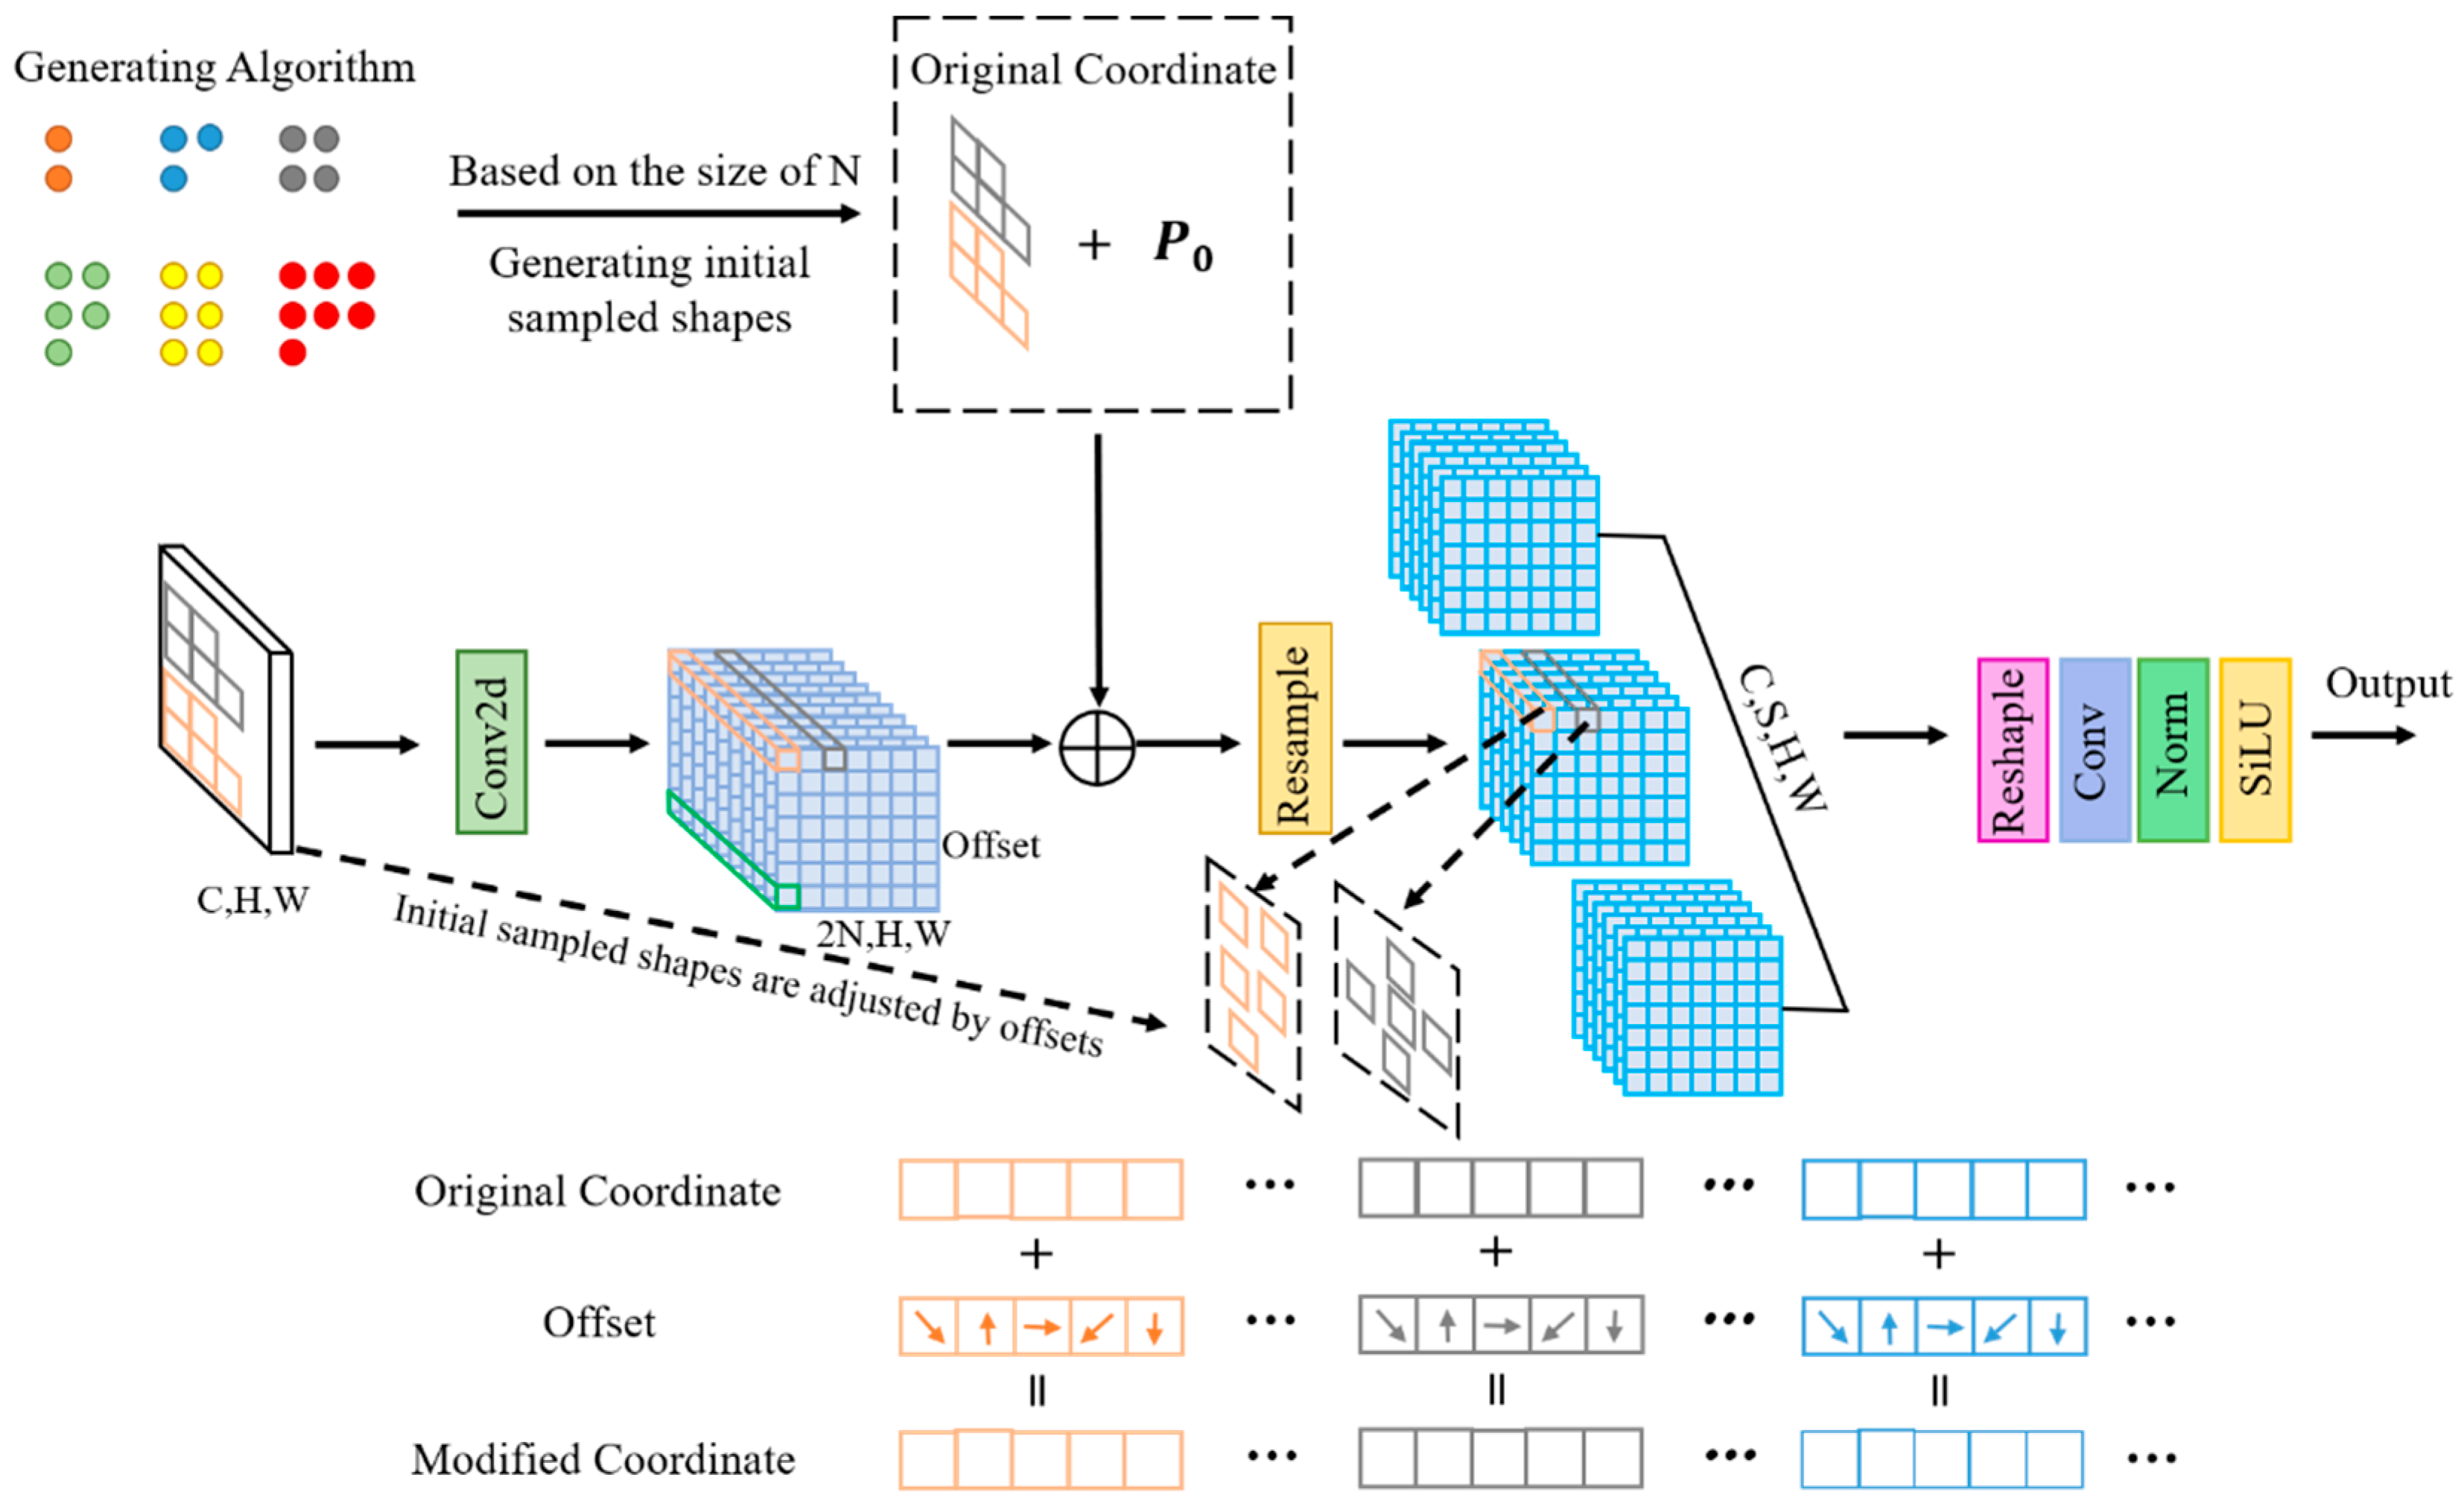
We propose a new module, AVCM, as shown in Figure 7. To enhance the detection accuracy while preserving the lightweight design of the VoVGSCSP module, the standard convolution following feature fusion is replaced with adaptive kernel convolution (AKConv) [37]. Unlike traditional fixed-kernel convolutions, AKConv dynamically adjusts its kernels based on the size and number of input feature maps, enabling more flexible and effective feature extraction. This adaptability improves the model’s ability to capture the varying characteristics of prefabricated components. In the AVCM module, AKConv is applied after the Concat operation to enhance the extraction of fused features. The structure of AKConv is illustrated in Figure 8.
In Equation (17), the convolution operation C o n v P 0 computes the local feature representation at a specific position P 0 by performing a weighted summation over the input feature points P n .
C o n v P 0 = P n X n w p n × x P 0 + P n
where C o n v P 0 represents the convolution operation at position P 0 , summing the contributions of all surrounding points P n in the set X n , each scaled by its corresponding weight w p n .
Subsequently, Equation (18) associates this local feature with the weight matrix W n , defining the weights W n i , j , m , k as the output of the function G w n X n . This association helps to leverage the extracted feature information in subsequent calculations, enhancing the accuracy and efficiency of feature fusion.
W n i , j , m , k = G w n X n
where W n i , j , m , k   denotes the weight matrix generated from the input set X n for layer n , mapping spatial dimensions i , j and feature dimensions m , k .
Subsequently, in Equation (19), the weight matrix W k is utilized to aggregate the information from the input X n . In this process, we apply these weights at each position i , j while considering the influence of the surrounding area, resulting in a comprehensive output Y n i , j . This output not only includes the convolution results of the weighted sum but also incorporates the convolution operation from the position P 0 to fully leverage contextual information and enhance the expressiveness of the output.
Y n i , j = m = 0 n 1 k = 0 n 1 W k i , j , m , k · X n i + m , j + k +   C o n v P 0
where Y n i , j aggregates the output values from the weight matrix W k applied to the input X n across the specified ranges m and k , while incorporating the convolution result from P 0 .
Therefore, in Equation (20), we define a set Y that includes the outputs of all different types of prefabricated components—specifically, Y R R , Y P J B , Y M J B , Y T B , Y R H . This set not only integrates diverse feature representations but also provides a rich information foundation for subsequent processing and analysis.
Y = Y R R , Y P J B , Y M J B , Y T B , Y R H
To further enhance the model’s capabilities, we introduce a fixed 2D sinusoidal positional encoding (PE) technique in the following equations. The PE is precomputed with a canonical frequency base of 10,000 and is channel-matched to each layer. In Equations (21), we define the position encoding for y R R , where even indices utilize the sine function and odd indices employ the cosine function to capture positional information within the sequence. This encoding effectively aids the model in understanding the relative positions and order of different inputs. Similarly, in Equations (22), we apply the same encoding strategy for y T B . The introduction of this position encoding not only enriches the representation of input features but also enhances the model’s sensitivity to positional information, thereby improving its ability to comprehend complex structures and relationships.
P E R R y R R , 2 i = sin y R R 10000 2 i / d m o d e l P E R R y R R , 2 i + 1 = cos y R R 10000 2 i / d m o d e l
P E T B y T B , 2 i = sin y T B 10000 2 i / d m o d e l P E T B y T B , 2 i + 1 = cos y T B 10000 2 i / d m o d e l
In Equations (23) and (24), we define the combined position encoding P E c o m b i n e d , which integrates the individual encodings from both y R R and y T B . This combination is achieved by summing the sine and cosine values from each encoding at both even and odd indices. By merging the position encodings in this manner, we enhance the model’s ability to capture relationships across different types of prefabricated components, thereby providing a richer contextual understanding that is essential for subsequent processing and analysis.
P E c o m b i n e d y R R , y T B , 2 i = P E R R y R R , 2 i + P E T B y T B , 2 i
P E c o m b i n e d y R R , y T B , 2 i + 1 = P E R R y R R , 2 i + 1 + P E T B y T B , 2 i + 1
In the original VoVGSCSP module, feature fusion is performed by directly concatenating the outputs of standard convolution and GSbottleneck. However, due to the complex background and weak feature contrast in prefabricated slab images, such direct fusion—after only a single convolution and channel transformation—fails to balance the outputs effectively. To address this, the fusion process in this study adjusts the weights of the two branches using pretrained weights, thereby preserving key target features and improving the model stability and accuracy.
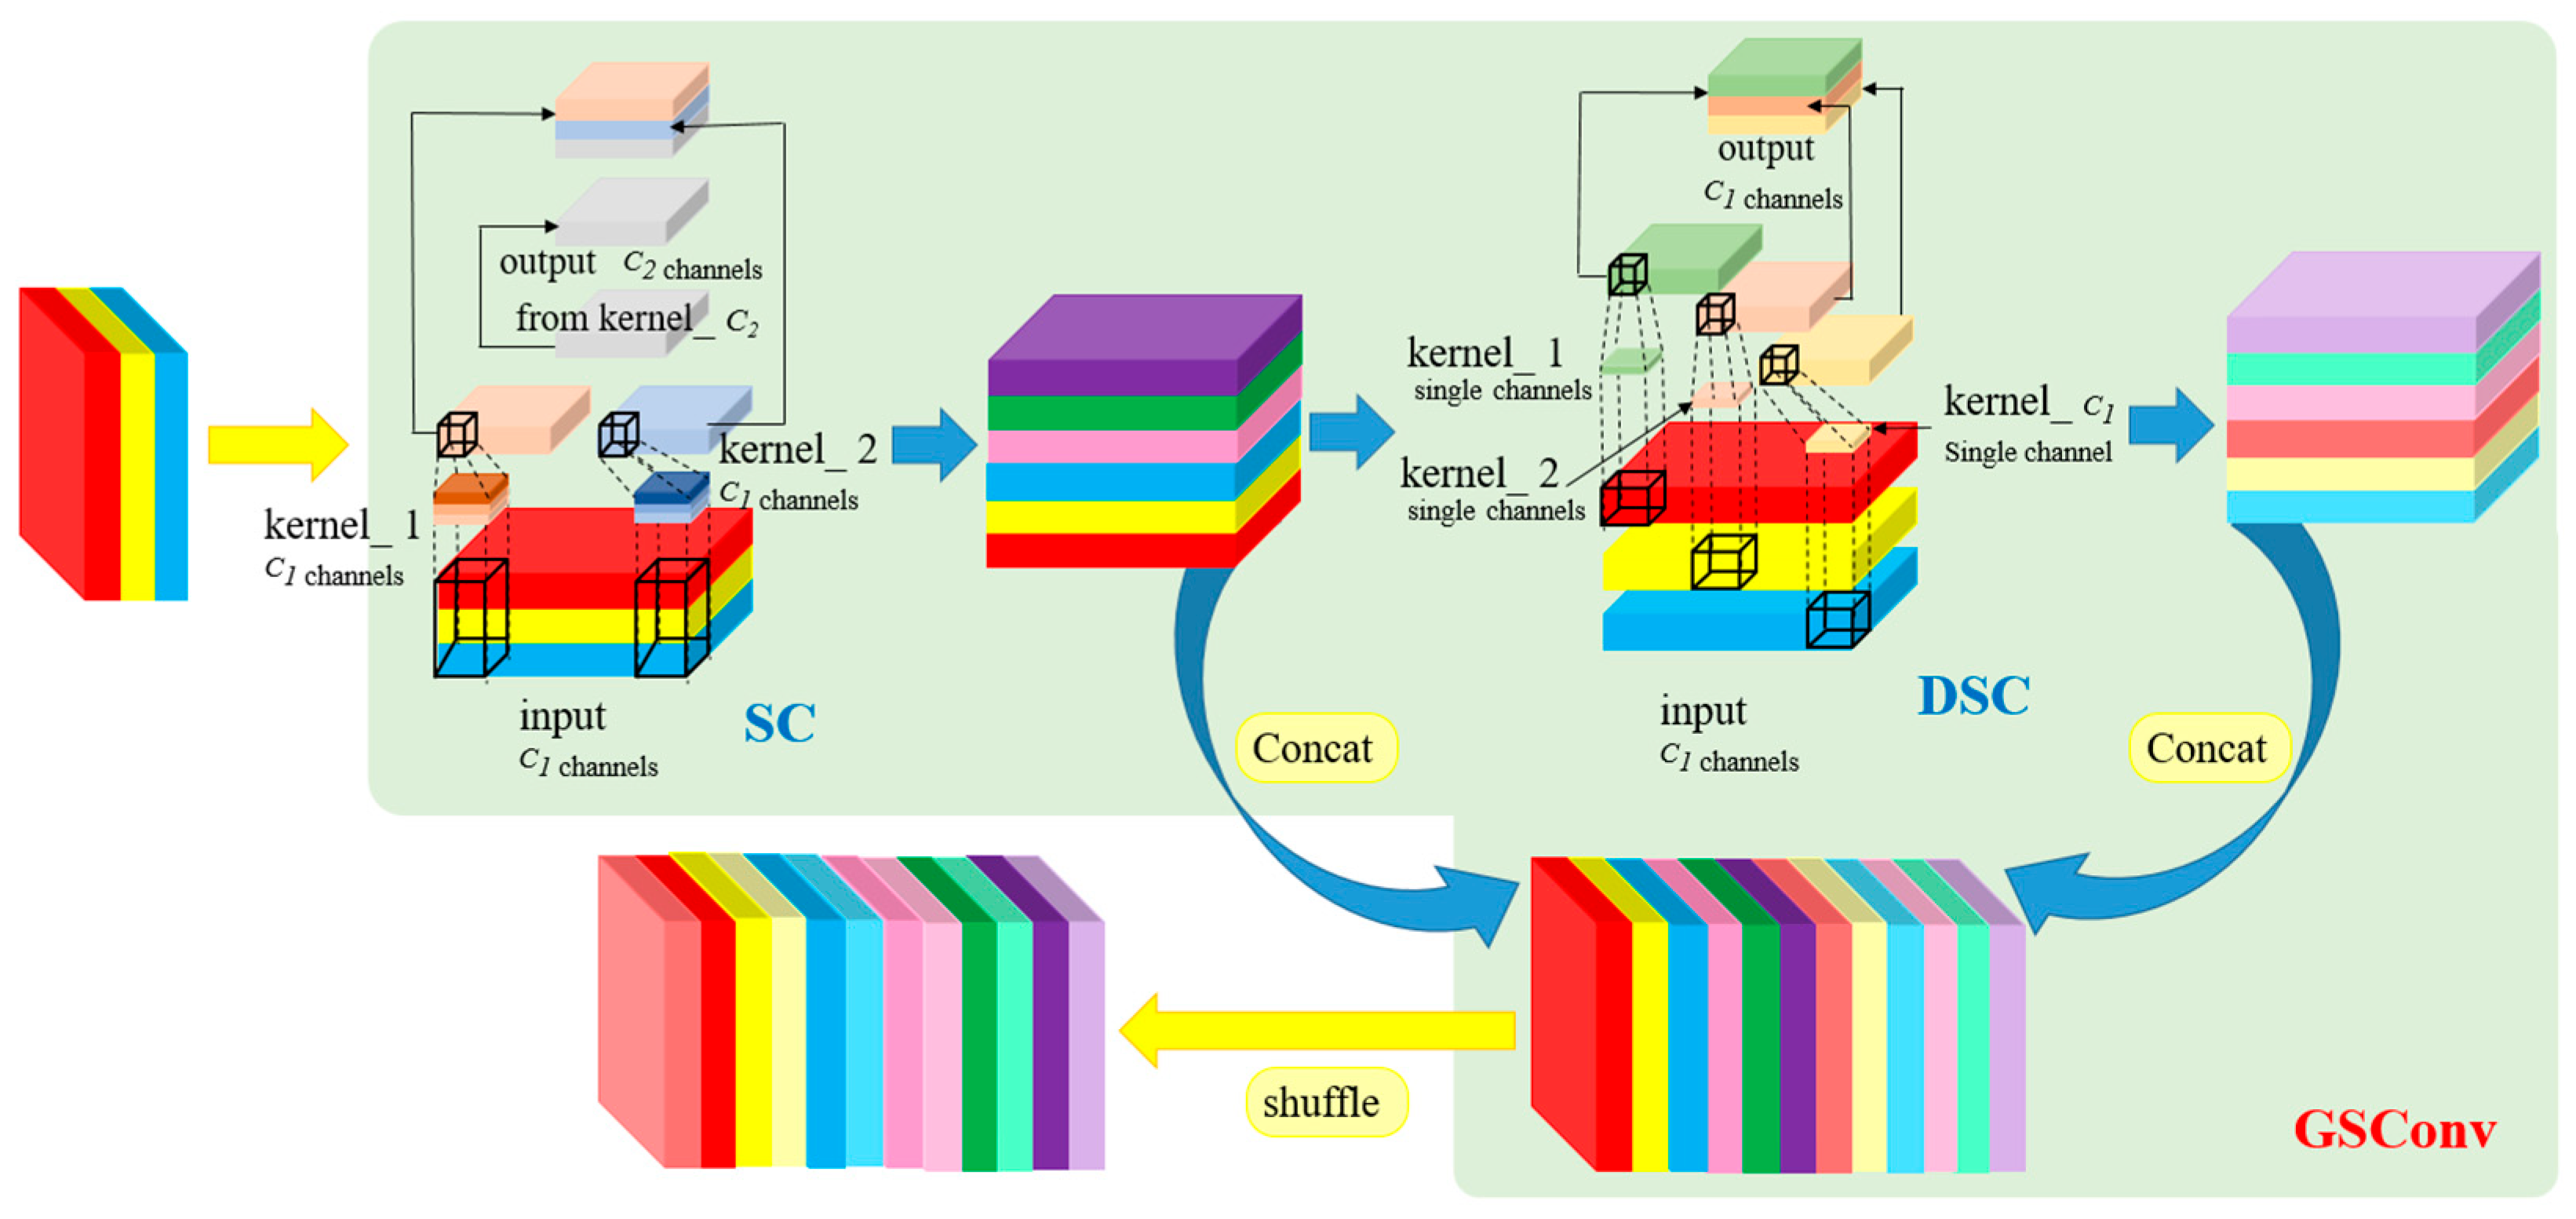
To further reduce the model complexity while maintaining the performance, the C2f module is replaced with the AVCStem module, and all standard convolutions are substituted with GSConv operations. As shown in Figure 9, GSConv reduces the input channels via standard convolution, applies depthwise convolution, and fuses them using concatenation and channel shuffling. This structure captures both local and global features while preserving efficiency. GSConv is particularly effective in aggregating small targets, such as reinforcement rebars, with contextual information. Since AVCStem already integrates GSConv, extending GSConv throughout the neck ensures consistency and avoids excessive structural disruption, while enhancing the lightweight and high-accuracy performance. Equation (25) defines the first output X f i r s t n through standard convolution, facilitating global feature extraction:
X f i r s t n = C o n v n X n
Subsequently, in Equation (26), we introduce the depthwise convolution operation, represented as X S e c o n d n . This operation focuses on enhancing the model’s ability to extract finer features by applying separate filters to each channel of the input X n , thereby preserving the spatial relationships while reducing the computational complexity. This transition from standard convolution to depthwise convolution allows the model to leverage both global and local features for more effective learning and representation.
X S e c o n d n = D W C o n v n X n
Subsequently, in Equation (27), we combine the first output X f i r s t n and the second output X S e c o n d n to form a new tensor X t h i r d n . This combination not only helps to integrate feature representations from different convolution operations but also enables the model to leverage both global and local information, enhancing the diversity and expressive power of the features. By merging these two distinct sources of features, the model can better capture complex input patterns, thereby improving the overall performance.
X t h i r d n = X f i r s t n , X S e c o n d n
Next, in Equation (28), we perform the Shuffle operation on X t h i r d n . This process aims to reorder the data tensor’s sequence to enhance the model’s ability to learn features. By employing this Shuffle operation, we introduce more contextual information and feature diversity across different channels, thereby optimizing the feature fusion effect. As a result, the model can effectively leverage existing features while enhancing the flow of information, ultimately improving the overall performance.
X f o u r t h n = S h u f f l e X t h i r d n , G
where Shuffle refers to the operation that reorders the data tensor by group, and G indicates the number of channels in each group.

4. Experimental Preparation

All experiments were conducted on a Linux operating system using two NVIDIA A100 GPUs (80 GB each) for training and testing. The software environment included Python 3.8.0 and PyTorch 1.11.0 as the deep learning framework. During training, the batch size was set to 16, and models were trained for 300 epochs. Optimization was performed using stochastic gradient descent (SGD) with momentum of 0.937, weight decay of 0.0005, and a fixed learning rate of 0.001, which was selected to balance the convergence speed and detection performance.

5. Experiments and Results

5.1. Evaluation Indicators

To accurately and fairly evaluate the performance of the proposed object detection model, we adopt four evaluation metrics widely used in other models, namely the precision, recall, F1-score, and mean average precision (mAP) [38,39,40,41]. The definitions of these three metrics are as follows:
P r e c i s i o n = T P T P + F P
R e c a l l = T P T P + T N
F 1 = 2 × P r e c i s i o n × R e c a l l P r e c i s i o n + R e c a l l
m A P = 1 m n = 1 m A P n
where TP indicates the number of true positives, FP indicates the number of false positives, and TN indicates the number of false negatives.
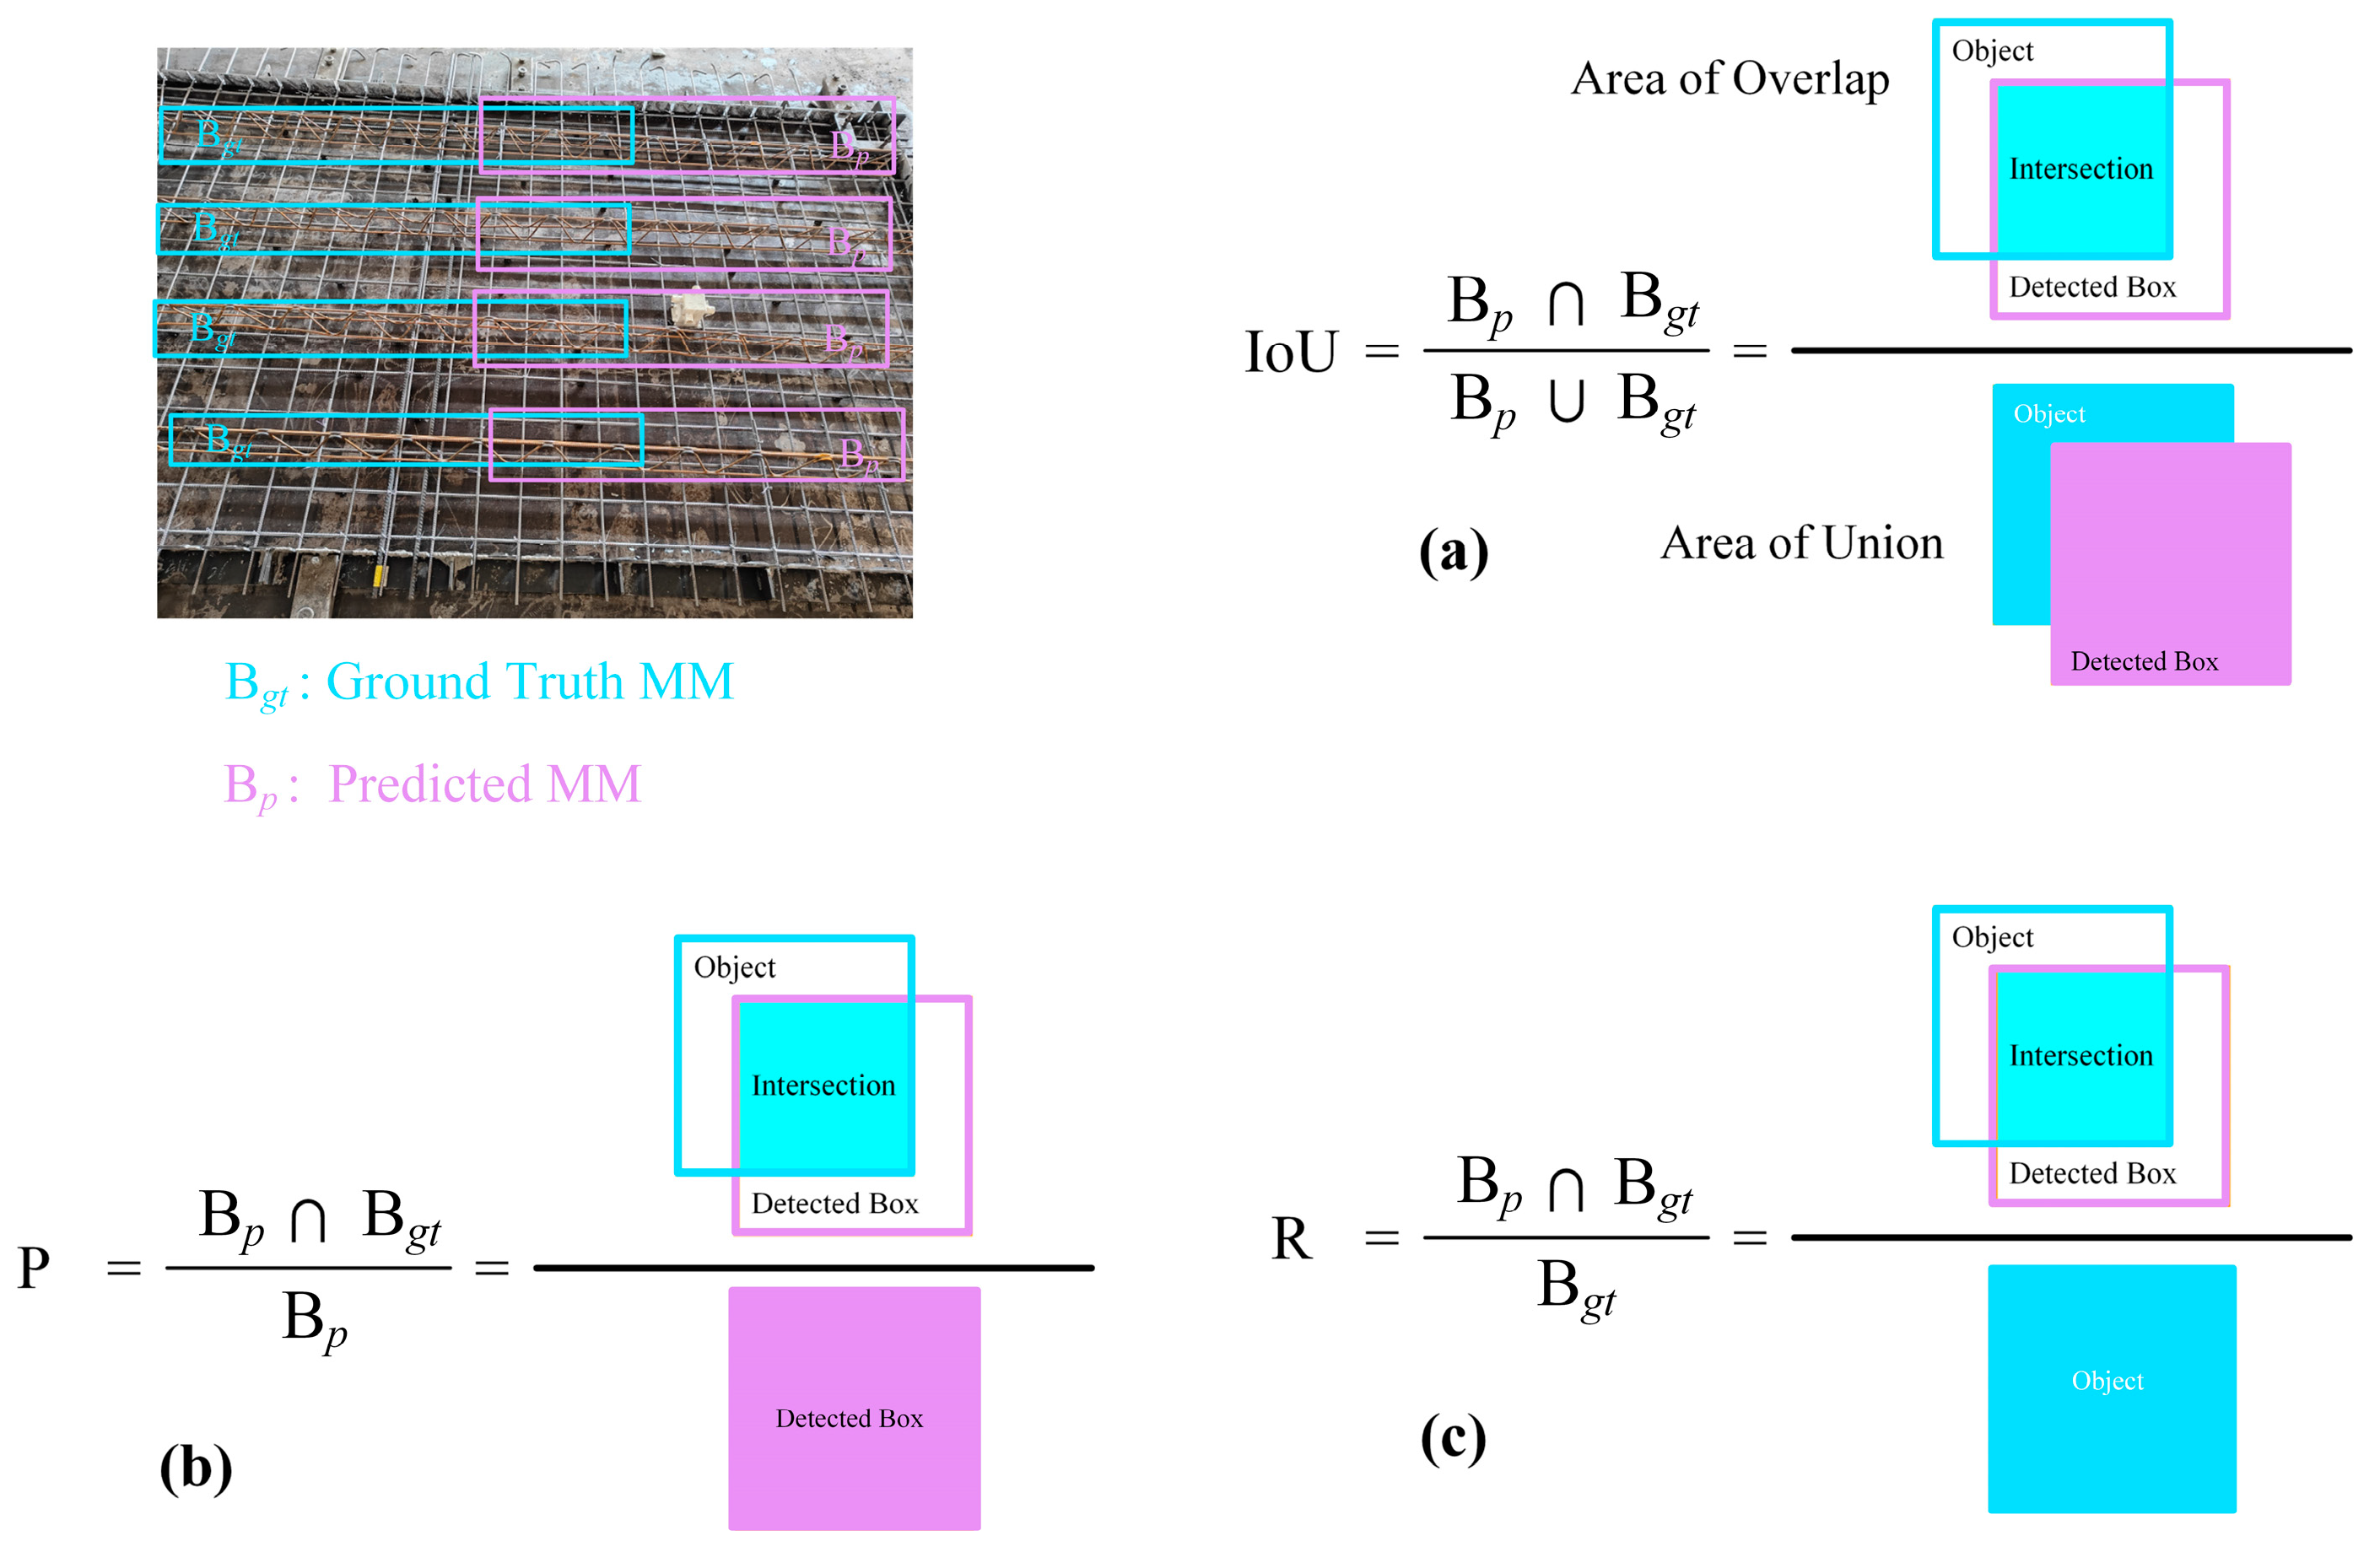
For practical purposes, the higher the values of precision, recall, and mAP, the more accurate the detection of prefabricated components. The smaller the Params and GFLOP values, the lower the computational power required by the model. For the F1-score, a value of 1 indicates optimal performance. Additionally, the IoU ranges between 0 and 1, and the closer the IoU is to 1, the higher the accuracy of the object detector. When classifying objects, IoU ≥ 0.5 can be used as the criterion to define a classified object as a true positive, while IoU < 0.5 can indicate that it is a false positive, as shown in Figure 10.
To support these evaluation metrics, the model parameters and GFLOPs were computed offline using THOP 0.1.1 on a Linux workstation equipped with dual NVIDIA A100 GPUs (80 GB each) and an Intel Xeon Gold 6230 CPU (2.1 GHz, 192 GB RAM). For all inference tests, we used a batch size of 1 and the default PyTorch FP32 execution, with no acceleration backends enabled. By emphasizing GFLOPs rather than FPS, we provide a hardware-independent measure of computational efficiency that ensures a fair comparison across platforms.

5.2. Ablation Experiment

To evaluate the effectiveness of the proposed modules and their impacts on the detection performance, ablation experiments were conducted based on the YOLOv8 framework. Although module replacement or addition typically aims to improve the model’s speed, accuracy, and efficiency, inappropriate modifications may lead to performance degradation. Therefore, ablation studies are essential to assess the contributions of each component and guide further optimization.
This study introduces several targeted improvements for the prefabricated component detection task. The MBCA module is proposed for the backbone network to enhance location-aware feature extraction. For the neck network, a Bi-AV-FPN structure is designed based on reconfigured connection nodes with the backbone, further integrating positional encoding and pointwise convolution modules.
The final model, MBAV, is constructed by combining these enhancements. This section presents a detailed analysis of the detection accuracy associated with different module combinations (Table 3), thereby validating the effectiveness of each component and their interactions.
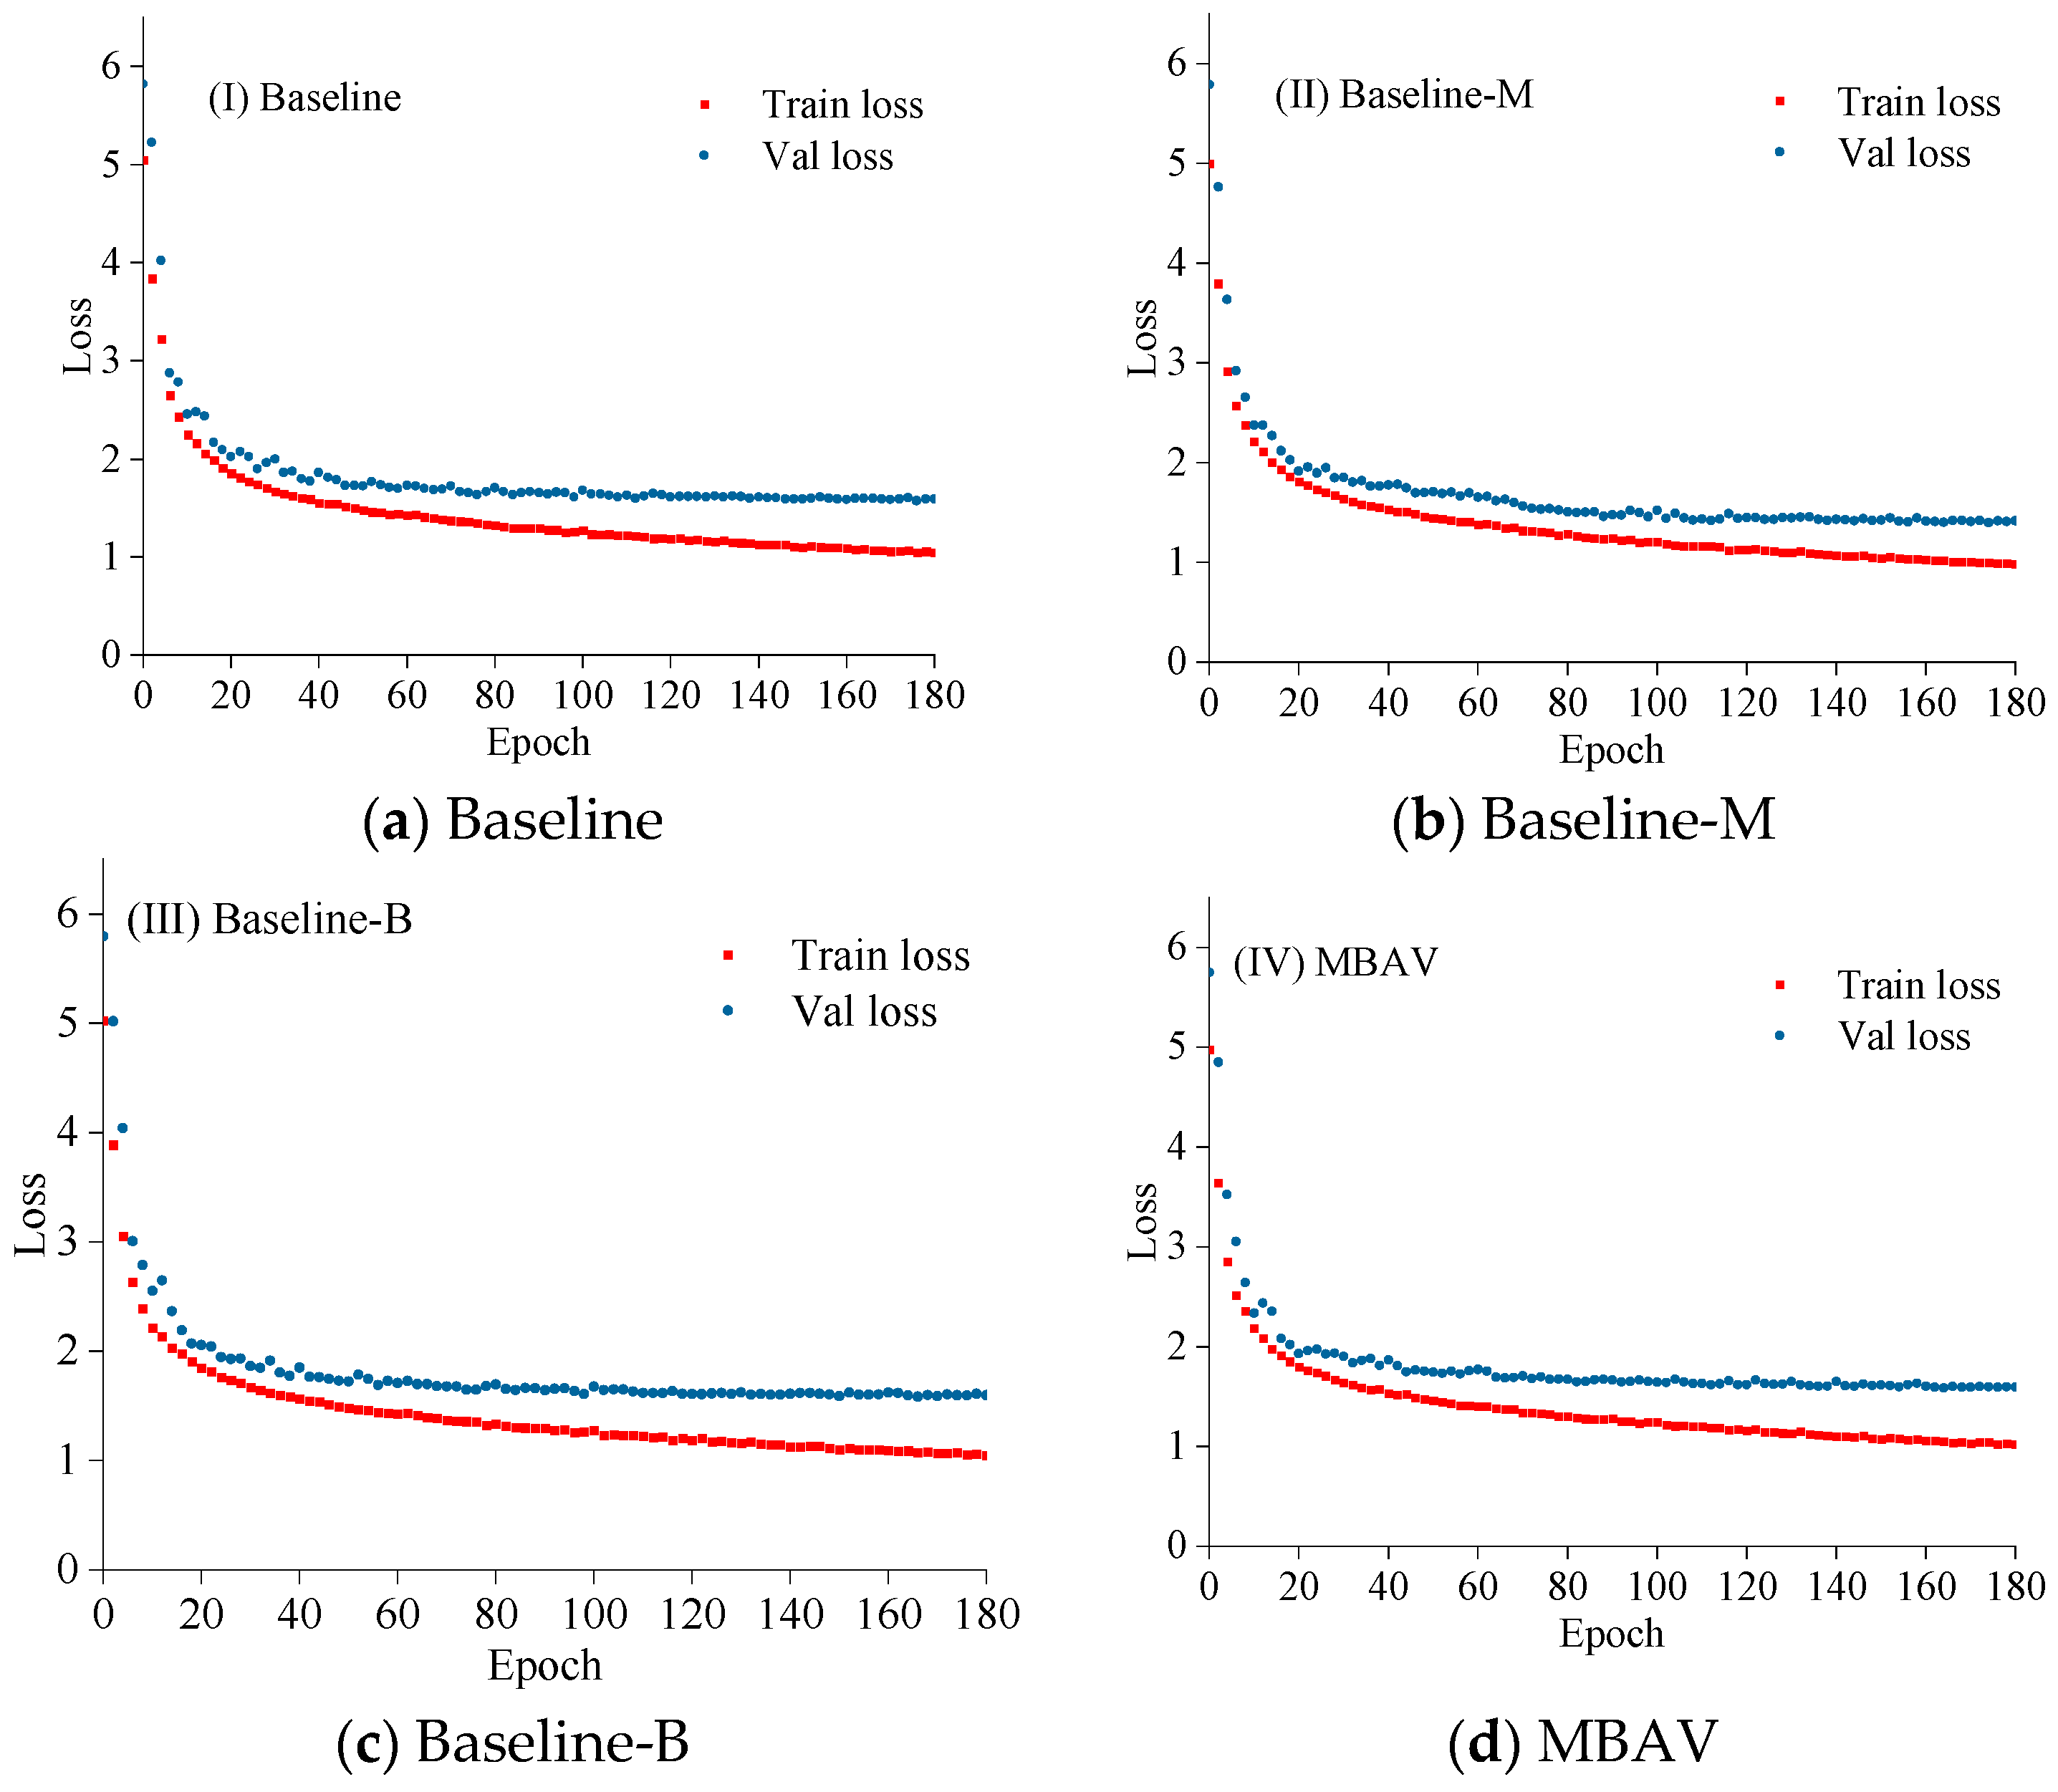
To evaluate the effectiveness of the proposed modules, MBCA and Bi-AV-FPN were individually integrated into the backbone and neck of the baseline model. The corresponding training loss curves are presented in Figure 11. As illustrated, after an initial phase of fluctuations, the loss for each model variant, particularly MBAV (Baseline-M and Baseline-B), stabilizes after approximately 100 epochs. The smooth convergence of the loss curves indicates that the models achieved effective training and stable optimization performance.
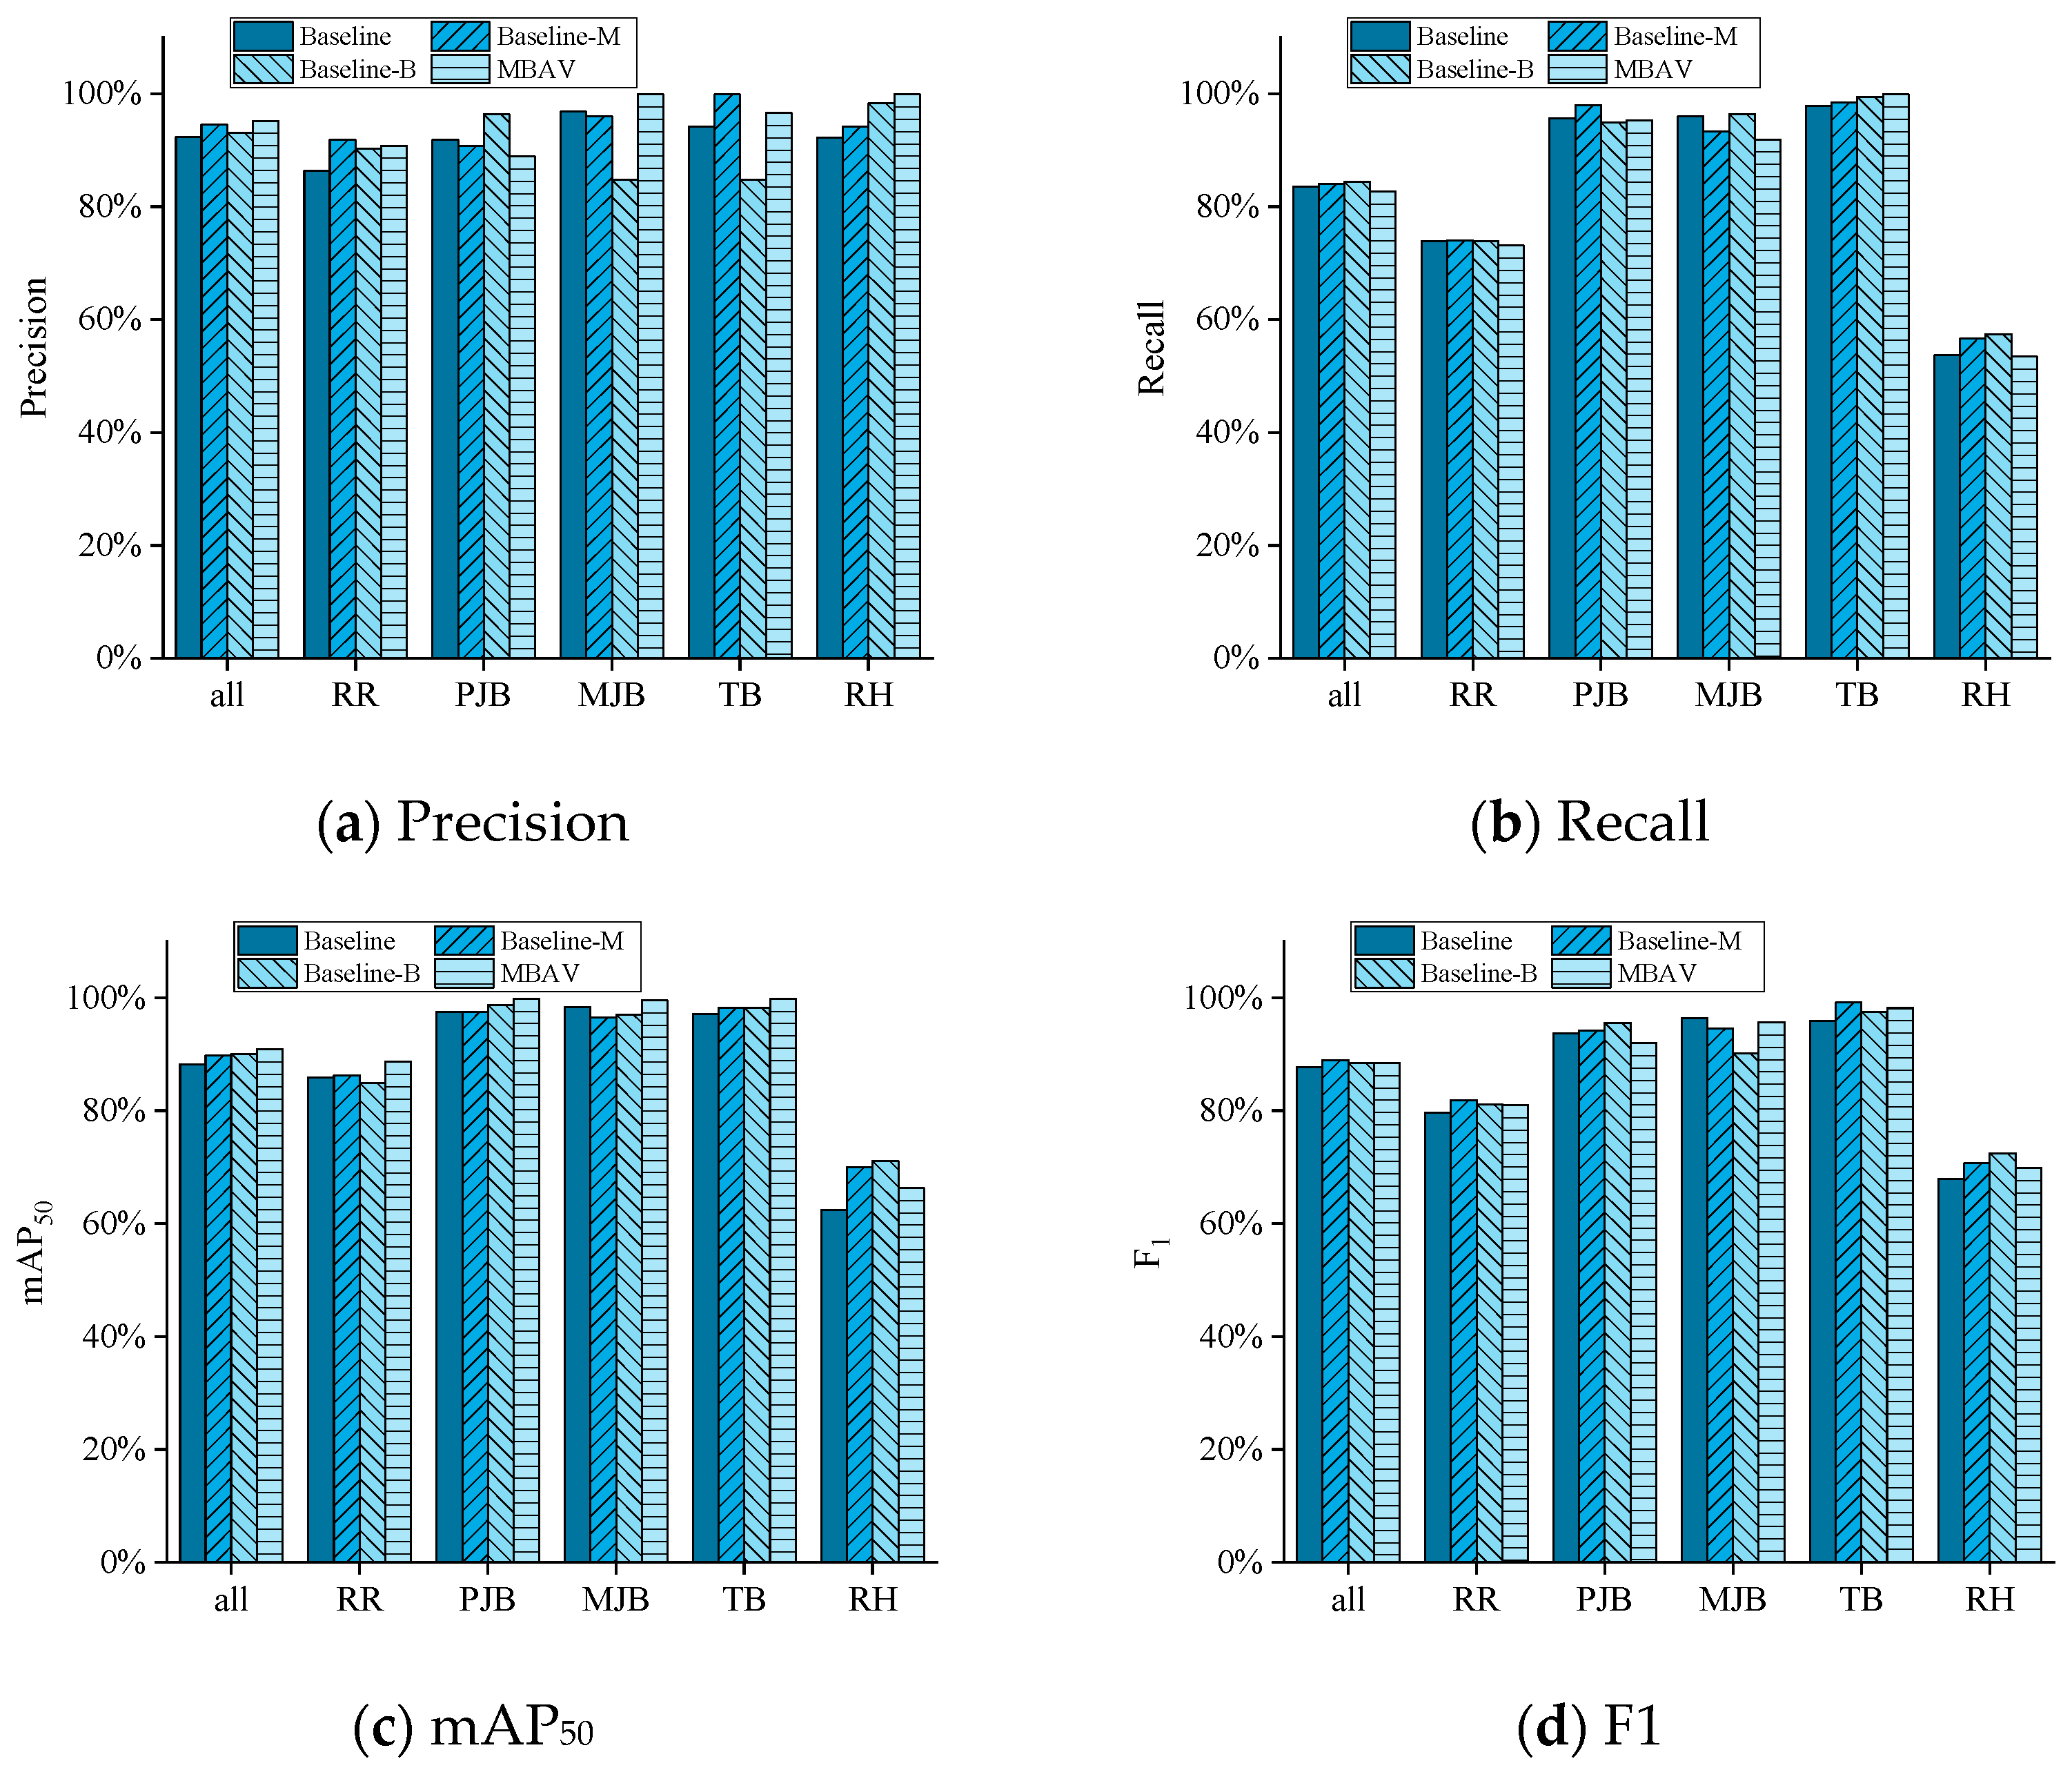
To address the scale discrepancy among truss rebars, junction boxes, and reserved holes, the MBCA module was introduced into the backbone to enhance multiscale feature representation. In parallel, the CA attention mechanism dynamically adjusted the channelwise feature importance, enabling the model to better capture key features of junction boxes and rebars, particularly under conditions of significant scale variation. Compared with the Baseline model, the MBCA-enhanced model (Baseline-M) achieved mAP improvements of 1.2% and 8.2% for plastic junction boxes and reserved holes, respectively.
For truss rebars and reinforcement bars, the integration of Bi-AV-FPN and positional encoding in the neck network leveraged their typical vertical spatial arrangement, improving the model’s ability to resolve overlapping features and enhance structural awareness. As a result, the mAP increased by 0.4% for truss rebars and by 9% for reinforcement bars. Additionally, the introduction of Bi-AV-FPN led to a reduction in model complexity, decreasing the parameter count by 11%, as detailed in Table 4.
Across all component categories in the precast slab, the integration of the MBCA module into the backbone network yielded notable performance gains, with the accuracy, recall, and mAP improved by 2.2%, 0.6%, and 1.5%, respectively. These improvements were achieved with only a marginal increase of 1.1% in the parameter count, indicating that the enhancement maintained a relatively lightweight structure.
To further reduce the model complexity while enhancing the detection performance, the proposed Bi-AV-FPN neck network (Baseline-B) was introduced. Compared to the original neck design, it improved the mAP by 1.8% and reduced the parameter count by 11%. These gains are attributed to the adoption of the Bi-FPN topology for efficient multiscale feature fusion and the integration of the VoVGSCSP module, which leverages a one-time aggregation strategy from cross-stage partial networks to balance performance and efficiency. Moreover, the replacement of standard AKConv with its adaptive variant contributed to both a reduction in parameters and an improvement in detection accuracy. Overall, the neck network redesign achieved simultaneous improvements in both accuracy and computational efficiency.
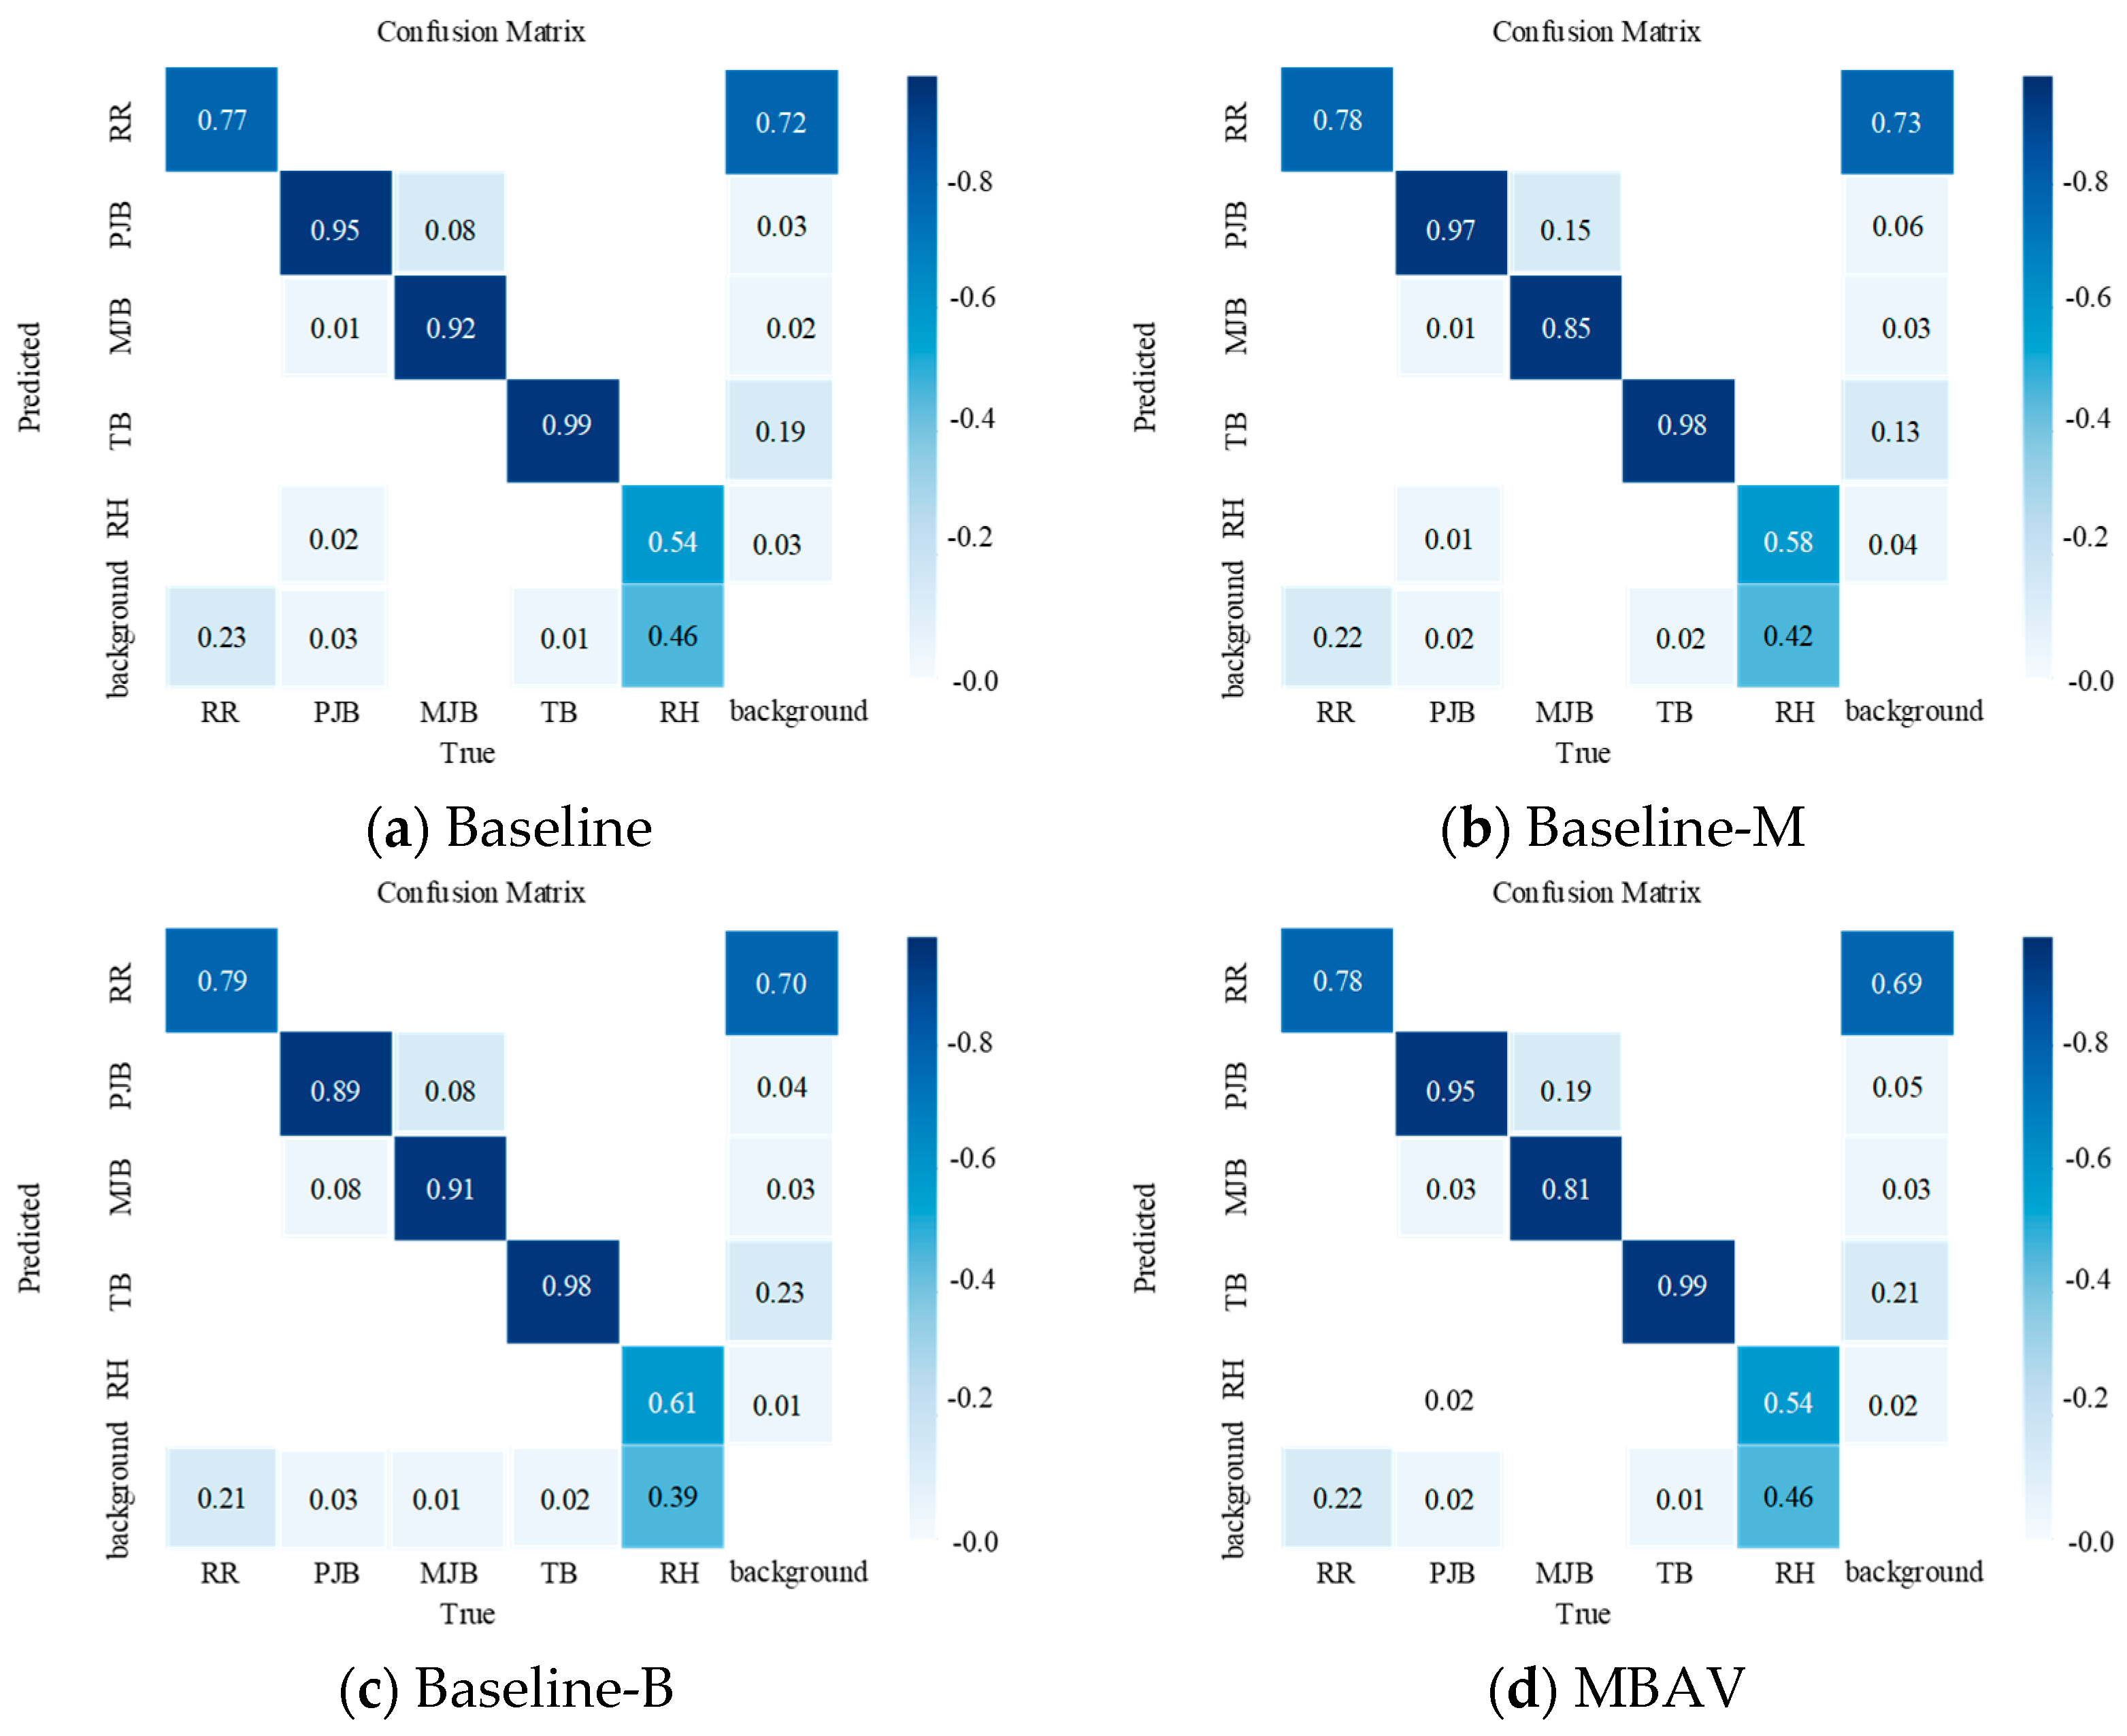
The final proposed model, MBAV, integrates the optimized backbone and neck networks and demonstrates significant overall performance improvements. Compared to the Baseline, MBAV achieved reductions of 8% in the model size and 10% in the parameter count, reflecting enhanced model compactness. In terms of detection performance, the model attained a 2.9% increase in accuracy, with the overall mAP reaching 90.9%, marking a substantial improvement in detection effectiveness. These results confirm the enhanced adaptability and efficiency of the MBAV model for object detection in prefabricated component datasets, as illustrated in Figure 12 and Figure 13.

5.3. Comparison with Other Methods

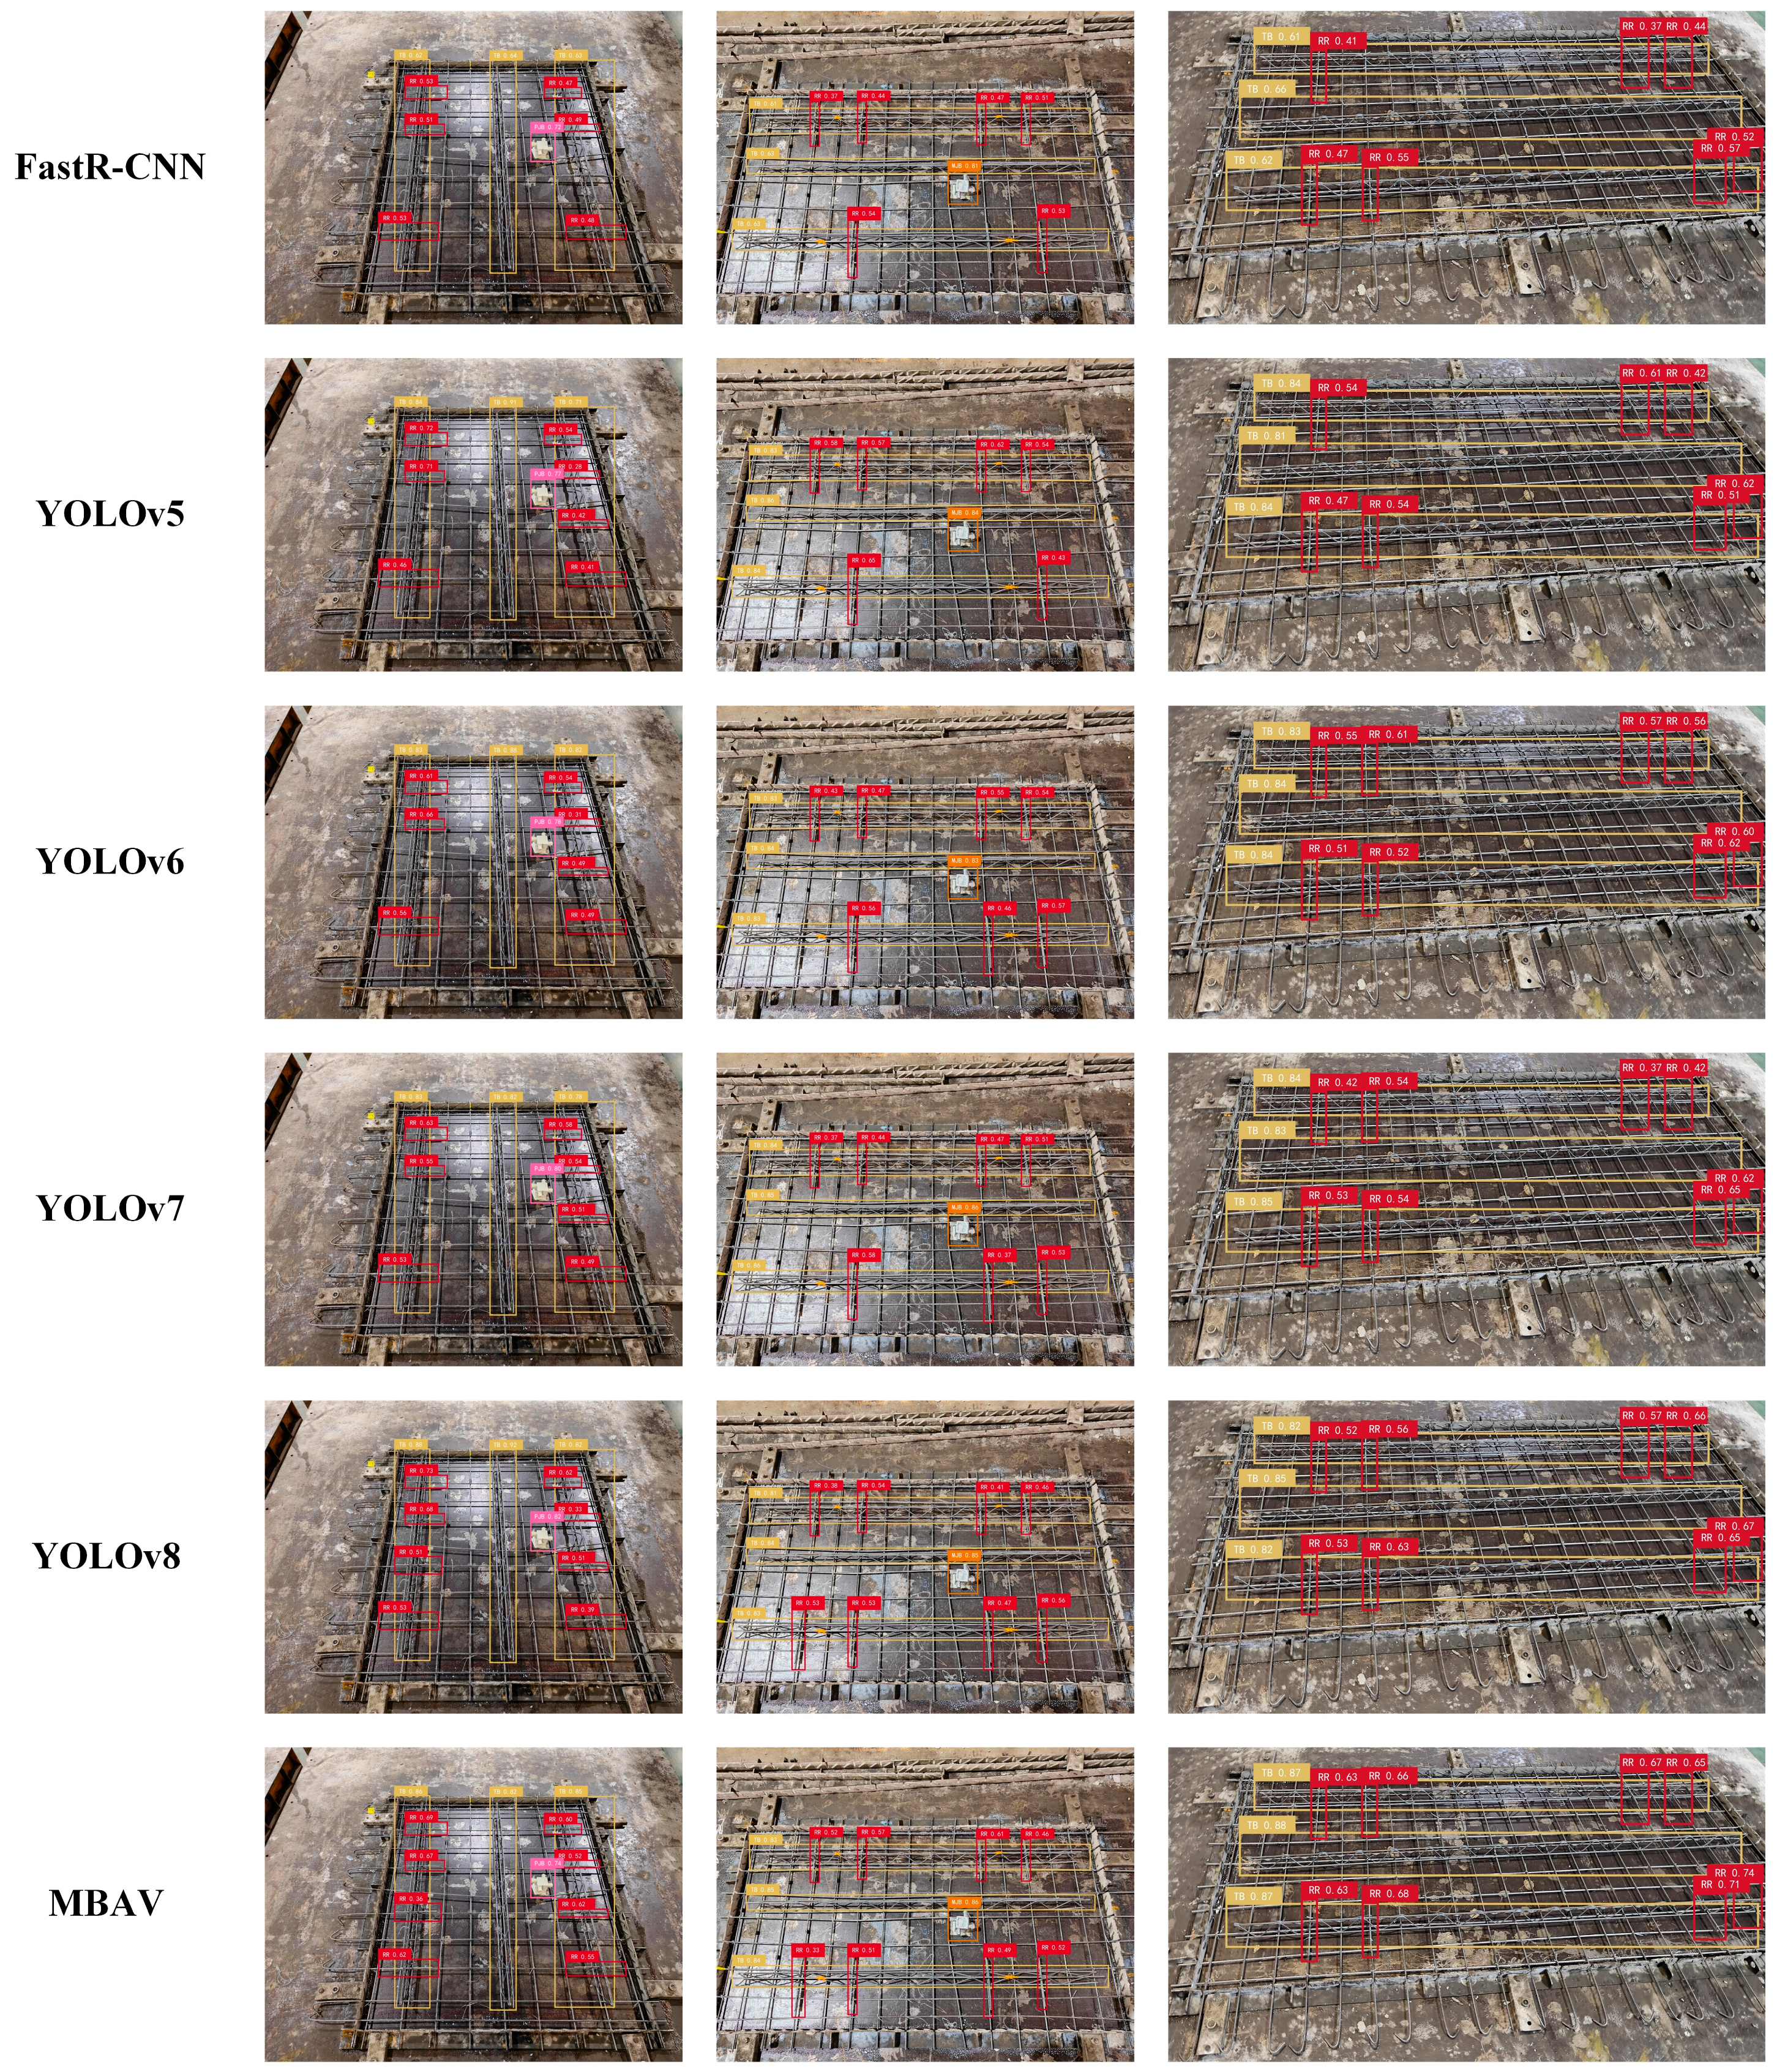
Table 5 summarizes the performance comparison of six models in terms of the precision, recall, mAP, and F1-score, while Figure 14 illustrates the detection outcomes. In terms of performance, MBAV achieves the highest mAP50 (91%) and F1-score (0.89) among all compared models, while also maintaining one of the lowest model sizes (5.7 MB) and a moderate computational cost (14.9 GFLOPs). Compared to YOLOv5 and YOLOv7—two widely used detectors—MBAV improves the mAP50 by +3% and +2%, respectively, while reducing the model size by approximately 20% relative to YOLOv5 and by over 90% relative to YOLOv7. Unlike YOLOv6, which has a higher computational overhead (45.17 GFLOPs) but significantly lower accuracy (63% mAP50), MBAV offers a far better trade-off. Even compared to our YOLOv8-based baseline, MBAV delivers a +3% gain in mAP50 with fewer parameters, highlighting the effectiveness of the proposed structural enhancements. These results confirm that MBAV not only achieves state-of-the-art detection accuracy for prefabricated components but also maintains lightweight and efficient performance, with its low FLOPs and a compact model size indicating strong potential for real-time industrial deployment.
As shown in Figure 15, MBAV also performs robustly under complex conditions. In the third example image, which involves distant and overlapping prefabricated elements, MBAV successfully identifies all targets—including the reinforcement bars in the upper-left region—whereas other models fail due to the low resolution and occlusion. This illustrates MBAV’s improved capabilities in detecting small and low-visibility objects.
Based on the comparative analysis and visual results, it can be concluded that MBAV achieves a superior balance between detection accuracy and model efficiency, outperforming existing mainstream models in both quantitative metrics and qualitative robustness. Its compact architecture enables real-time deployment, while its enhanced backbone and neck design allow it to reliably detect small, overlapping, or low-contrast prefabricated components under complex visual conditions. These strengths make MBAV particularly well suited for practical applications in industrial prefabrication environments where both speed and precision are critical.

6. Conclusions

To address the inefficiency and subjectivity of manual inspection in prefabricated construction, this study constructs a dedicated embedded-part detection dataset and proposes a lightweight, high-accuracy detection model, MBAV, optimized from the YOLOv8 framework. The main conclusions are as follows:
(1)
A specialized dataset was built for embedded-part detection in composite slabs, covering five typical categories—truss bars, reinforcement rebars, metal junction boxes, plastic junction boxes, and reserved holes—with a total of 1535 images and 13,680 annotated instances collected from multiple factory environments.
(2)
The proposed MBAV network integrates the MBCA module in the backbone and the AVCStem + AKConv structure with positional encoding in the neck, effectively enhancing feature extraction and fusion for small, overlapping, or low-contrast targets.
(3)
On the constructed dataset, MBAV achieves an mAP50 of 91%, outperforming the baseline YOLOv8 by three percentage points, while reducing the parameter count by 8.06% to 5.7M. The classwise accuracy improves by 1.2–2.8%, confirming its robustness under real-world factory conditions.
(4)
The model demonstrates strong potential for the real-time, automated quality inspection of prefabricated components and offers a practical foundation for the further development of intelligent quality control systems in industrialized construction.
This study has several limitations: (1) the dataset was collected from a single factory, which may limit the model’s generalizability to different production environments; (2) the current work does not include a detailed deployment strategy for integration into actual production lines. To address these issues, future work will focus on (1) cross-site data collection and expansion of the dataset size, diversity, and coverage; (2) a quantitative evaluation of the real-time performance; and (3) the development of a deployment framework involving camera integration, automated data flow, and system compatibility for practical application in prefabricated construction.

Supplementary Materials

The following supporting information can be downloaded at: https://www.mdpi.com/article/10.3390/buildings15162850/s1, Table S1: Notation table.

Author Contributions

Funding acquisition, Q.J.; software, L.Y.; writing—original draft, F.Y.; writing—review and editing, Q.J. and D.H. All authors have read and agreed to the published version of the manuscript.

Funding

This research was funded by the National Natural Science Foundation of China, grant number 42462030. The APC was funded by the authors.

Data Availability Statements

The original contributions presented in this study are included in the article/Supplementary Materials. Further inquiries can be directed to the corresponding author(s).

Conflicts of Interest

The authors declare no conflicts of interest.

References

  1. Jaillon, L.; Poon, C.S. Life cycle design and prefabrication in buildings: A review and case studies in Hong Kong. Autom. Constr. 2014, 39, 195–202. [Google Scholar] [CrossRef]
  2. Li, Z.; Shen, G.Q.; Xue, X. Critical review of the research on the management of prefabricated construction. Habitat Int. 2014, 43, 240–249. [Google Scholar] [CrossRef]
  3. Polat, G. Factors affecting the use of precast concrete systems in the United States. J. Constr. Eng. Manag. 2008, 134, 169–178. [Google Scholar] [CrossRef]
  4. Navaratnam, S.; Satheeskumar, A.; Zhang, G.; Nguyen, K.; Venkatesan, S.; Poologanathan, K. The challenges confronting the growth of sustainable prefabricated building construction in Australia: Construction industry views. J. Build. Eng. 2022, 48, 103935. [Google Scholar] [CrossRef]
  5. Yin, J.; Huang, R.; Sun, H.; Cai, S. Multi-objective optimization for coordinated production and transportation in prefabricated construction with on-site lifting requirements. Comput. Ind. Eng. 2024, 189, 110017. [Google Scholar] [CrossRef]
  6. Li, Q.; Yang, Y.; Yao, G.; Wei, F.; Xue, G.; Qin, H. Multiobject real-time automatic detection method for production quality control of prefabricated laminated slabs. J. Constr. Eng. Manag. 2024, 150, 05023017. [Google Scholar] [CrossRef]
  7. Atmaca, E.E.; Altunişik, A.C.; Günaydin, M.; Atmaca, B. Collapse of an RC building under construction with a flat slab system: Reasons, calculations, and FE simulations. Buildings 2024, 15, 20. [Google Scholar] [CrossRef]
  8. Ma, Z.; Liu, Y.; Li, J. Review on automated quality inspection of precast concrete components. Autom. Constr. 2023, 150, 104828. [Google Scholar] [CrossRef]
  9. Yao, G.; Liao, G.; Yang, Y.; Li, Q.; Wei, F. Multi-objective intelligent detection method of prefabricated laminated sheets basedon convolutional neural networks. J. Civ. Environ. Eng. 2024, 46, 93–101. (In Chinese) [Google Scholar] [CrossRef]
  10. Wei, W.; Lu, Y.; Zhang, X.; Wang, B.; Lin, Y. Fine-grained progress tracking of prefabricated construction based on component segmentation. Autom. Constr. 2024, 160, 105329. [Google Scholar] [CrossRef]
  11. Hinton, G.E.; Osindero, S.; Teh, Y.W. A fast learning algorithm for deep belief nets. Neural Comput. 2006, 18, 1527–1554. [Google Scholar] [CrossRef]
  12. Krizhevsky, A.; Sutskever, I.; Hinton, G.E. ImageNet classification with deep convolutional neural networks. Commun. ACM 2017, 60, 84–90. [Google Scholar] [CrossRef]
  13. Ren, S.; He, K.; Girshick, R.; Sun, J. Faster R-CNN: Towards real-time object detection with region proposal networks. IEEE Trans. Pattern Anal. Mach. Intell. 2016, 39, 1137–1149. [Google Scholar] [CrossRef] [PubMed]
  14. Long, J.; Shelhamer, E.; Darrell, T. Fully convolutional networks for semantic segmentation. In Proceedings of the IEEE Conference on Computer Vision and Pattern Recognition, Boston, MA, USA, 7–12 June 2015; pp. 3431–3440. [Google Scholar]
  15. Guo, J.; Liu, P.; Xiao, B.; Deng, L.; Wang, Q. Surface defect detection of civil structures using images: Review from data perspective. Autom. Constr. 2024, 158, 105186. [Google Scholar] [CrossRef]
  16. Tang, Y.; Wang, Y.; Qian, Y. Railroad missing components detection via cascade region-based convolutional neural network with predefined proposal templates. Comput.-Aided Civ. Infrastruct. Eng. 2024, 39, 3083–3102. [Google Scholar] [CrossRef]
  17. Ye, G.; Dai, W.; Tao, J.; Qu, J.; Zhu, L.; Jin, Q. An improved transformer-based concrete crack classification method. Sci. Rep. 2024, 14, 6226. [Google Scholar] [CrossRef]
  18. Wang, Q.A.; Dai, Y.; Ma, Z.G.; Wang, J.F.; Lin, J.F.; Ni, Y.Q.; Ren, W.X.; Jiang, J.; Yang, X.; Yan, J.R. Towards high-precision data modeling of SHM measurements using an improved sparse Bayesian learning scheme with strong generalization ability. Struct. Health Monit. 2023, 23, 588–604. [Google Scholar] [CrossRef]
  19. Wang, Q.A.; Wang, H.B.; Ma, Z.G.; Ni, Y.Q.; Liu, Z.J.; Jiang, J.; Sun, R.; Zhu, H.W. Towards high-accuracy data modelling, uncertainty quantification and correlation analysis for SHM measurements during typhoon events using an improved most likely heteroscedastic Gaussian process. Smart Struct. Syst. 2023, 32, 267–279. [Google Scholar]
  20. Wang, Q.A.; Liu, Q.; Ma, Z.G.; Wang, J.F.; Ni, Y.Q.; Ren, W.X.; Wang, H.B. Data interpretation and forecasting of SHM heteroscedastic measurements under typhoon conditions enabled by an enhanced hierarchical sparse Bayesian learning model with high robustness. Measurement 2024, 230, 114509. [Google Scholar] [CrossRef]
  21. Girshick, R.; Donahue, J.; Darrell, T.; Malik, J. Rich feature hierarchies for accurate object detection and semantic segmentation. In Proceedings of the IEEE Conference on Computer Vision and Pattern Recognition, Columbus, OH, USA, 23–28 June 2014; pp. 580–587. [Google Scholar]
  22. Girshick, R. Fast r-cnn. In Proceedings of the IEEE International Conference on Computer Vision, Santiago, Chile, 7–13 December 2015; pp. 1440–1448. [Google Scholar]
  23. He, K.; Gkioxari, G.; Dollár, P.; Girshick, R. Mask R-CNN. In Proceedings of the IEEE/CVF International Conference on Computer Vision, Venice, Italy, 22–29 October 2017; pp. 2961–2969. [Google Scholar]
  24. Cai, Z.; Vasconcelos, N. Cascade R-CNN: Delving into high-quality object detection. In Proceedings of the IEEE/CVF Conference on Computer Vision and Pattern Recognition, Salt Lake City, UT, USA, 18–23 June 2018; pp. 6154–6162. [Google Scholar]
  25. Qiao, S.; Chen, L.C.; Yuille, A. DetectoRS: Detecting objects with recursive feature pyramid and switchable atrous convolution. In Proceedings of the IEEE/CVF Conference on Computer Vision and Pattern Recognition, Nashville, TN, USA, 20–25 June 2021; pp. 10213–10224. [Google Scholar]
  26. Ye, G.; Qu, J.; Tao, J.; Dai, W.; Mao, Y.; Jin, Q. Autonomous surface crack identification of concrete structures based on the YOLOv7 algorithm. J. Build. Eng. 2023, 73, 106688. [Google Scholar] [CrossRef]
  27. Redmon, J.; Divvala, S.; Girshick, R.; Farhadi, A. You only look once: Unified, real-time object detection. In Proceedings of the IEEE Conference on Computer Vision and Pattern Recognition, Las Vegas, NV, USA, 27–30 June 2016; pp. 779–788. [Google Scholar]
  28. Liu, W.; Anguelov, D.; Erhan, D.; Szegedy, C.; Reed, S.; Fu, C.Y.; Berg, A.C. Ssd: Single shot multibox detector. In Proceedings of the European Conference on Computer Vision, Amsterdam, The Netherlands, 11–14 October 2016; Springer International Publishing: Cham, Switzerland, 2016; pp. 21–37. [Google Scholar]
  29. Yu, L.; Zhu, J.; Zhao, Q.; Wang, Z. An efficient yolo algorithm with an attention mechanism for vision-based defect inspection deployed on FPGA. Micromachines 2022, 13, 1058. [Google Scholar] [CrossRef] [PubMed]
  30. Chen, X.; An, Z.; Huang, L.; He, S.; Zhang, X.; Lin, S. Surface defect detection of electric power equipment in substation based on improved YOLOv4 algorithm. In Proceedings of the 2020 10th International Conference on Power and Energy Systems (ICPES), Chengdu, China, 25–27 December 2020; pp. 256–261. [Google Scholar]
  31. Liang, Y.; Li, S.; Ye, G.; Jiang, Q.; Jin, Q.; Mao, Y. Autonomous surface crack identification for concrete structures based on the you only look once version 5 algorithm. Eng. Appl. Artif. Intell. 2024, 133, 108479. [Google Scholar] [CrossRef]
  32. Wang, H.; Xu, X.; Liu, Y.; Lu, D.; Liang, B.; Tang, Y. Real-time defect detection for metal components: A fusion of enhanced Canny–Devernay and YOLOv6 algorithms. Appl. Sci. 2023, 13, 6898. [Google Scholar] [CrossRef]
  33. Ye, G.; Li, S.; Zhou, M.; Mao, Y.; Qu, J.; Shi, T.; Jin, Q. Pavement crack instance segmentation using YOLOv7-WMF with connected feature fusion. Autom. Constr. 2024, 160, 105331. [Google Scholar] [CrossRef]
  34. Tan, M.; Le, Q. Efficientnet: Rethinking model scaling for convolutional neural networks. In Proceedings of the International Conference on Machine Learning, PMLR, Long Beach, CA, USA, 10–15 June 2019; pp. 6105–6114. [Google Scholar]
  35. Hou, Q.; Zhou, D.; Feng, J. Coordinate attention for efficient mobile network design. In Proceedings of the IEEE/CVF Conference on Computer Vision and Pattern Recognition, Nashville, TN, USA, 20–25 June 2021; pp. 13713–13722. [Google Scholar]
  36. Li, H.; Li, J.; Wei, H.; Liu, Z.; Zhan, Z.; Ren, Q. Slim-neck by GSConv: A better design paradigm of detector architectures for autonomous vehicles. arXiv 2022, arXiv:2206.02424. [Google Scholar]
  37. Zhang, X.; Song, Y.; Song, T.; Yang, D.; Ye, Y.; Zhou, J.; Zhang, L. AKConv: Convolutional Kernel with Arbitrary Sampled Shapes and Arbitrary Number of Parameters. arXiv 2023, arXiv:2311.11587. [Google Scholar]
  38. Yuen, K.V.; Ye, G. Adaptive feature expansion and fusion model for precast component segmentation. In Computer-Aided Civil and Infrastructure Engineering; Wiley: Hoboken, NJ, USA, 2025. [Google Scholar]
  39. Powers, D.M.W. Evaluation: From precision, recall and F-measure to ROC, informedness, markedness and correlation. arXiv 2020, arXiv:2010.16061. [Google Scholar]
  40. Li, L.; Jiang, Q.; Ye, G.; Chong, X.; Zhu, X. ASDS-you only look once version 8: A real-time segmentation method for cross-scale prefabricated laminated slab components. Eng. Appl. Artif. Intell. 2025, 153, 110958. [Google Scholar] [CrossRef]
  41. Everingham, M.; Van Gool, L.; Williams, C.K.; Winn, J.; Zisserman, A. The pascal visual object classes (voc) challenge. Int. J. Comput. Vis. 2010, 88, 303–338. [Google Scholar] [CrossRef]
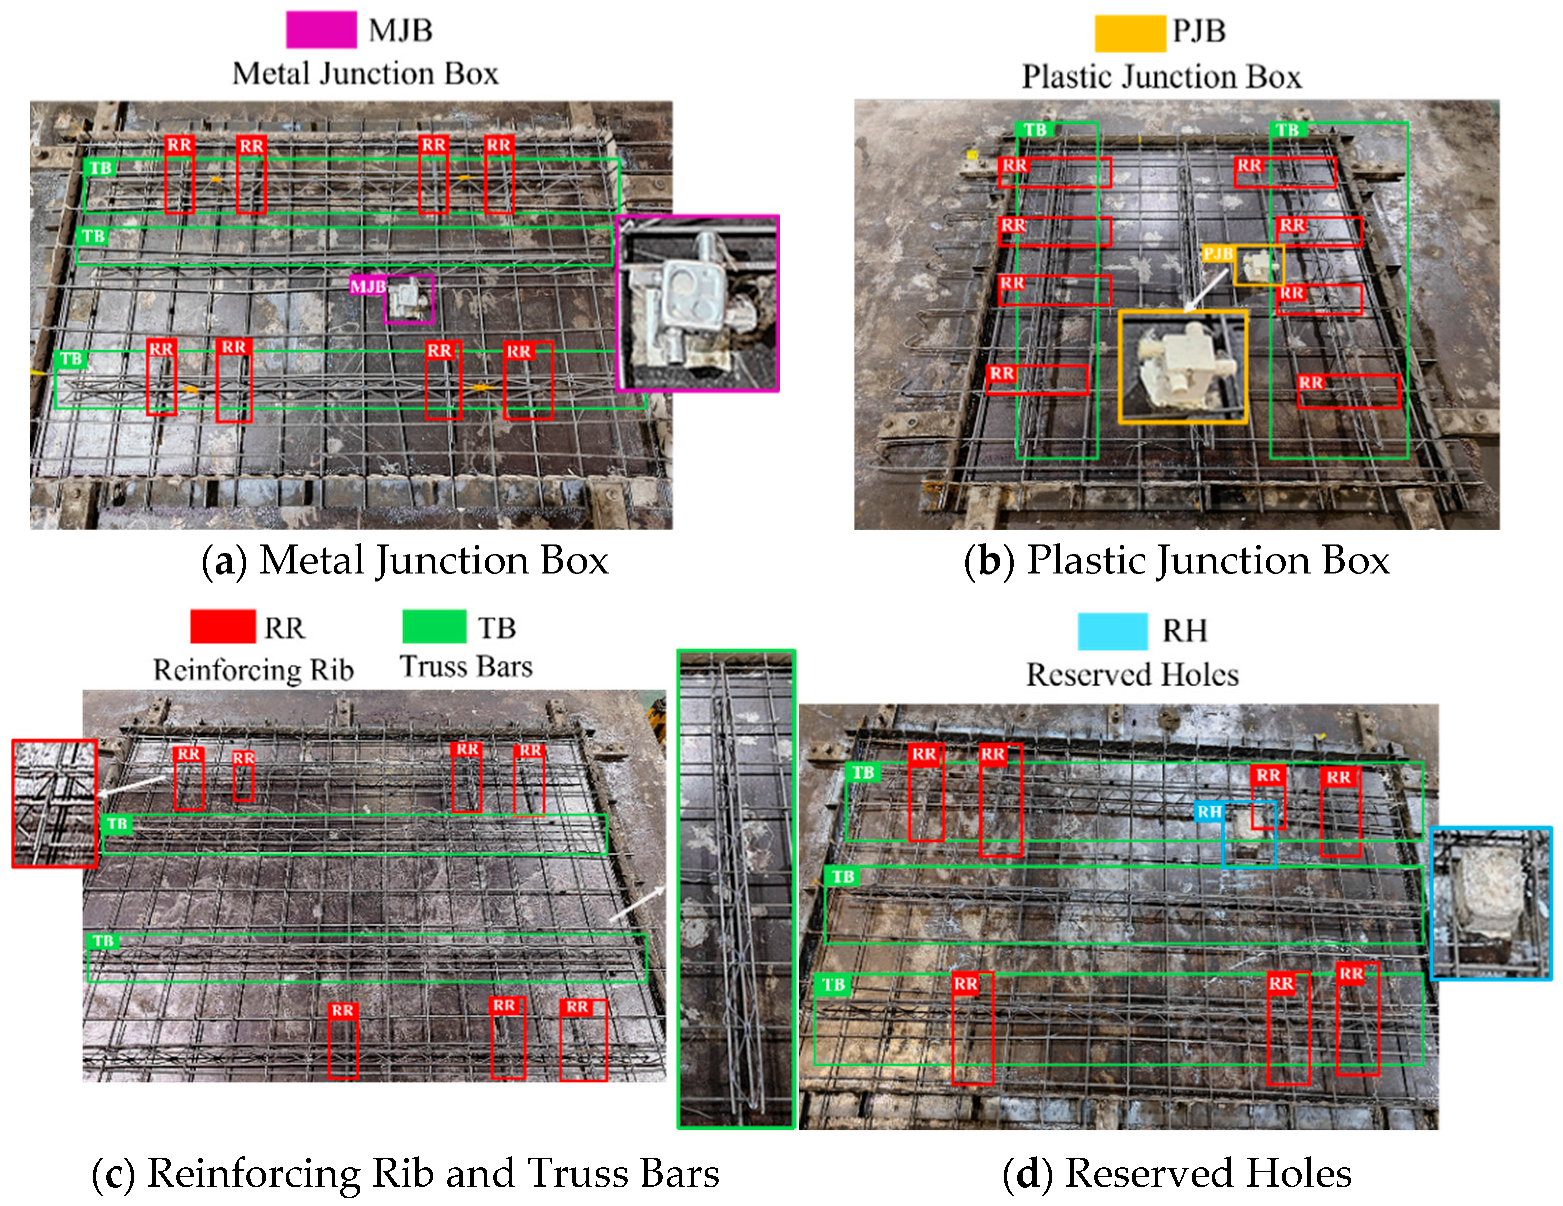
Figure 1. Labeled drawings of different prefabricated components.
Buildings 15 02850 g001
Figure 2. MBCA structure.
Buildings 15 02850 g002
Figure 3. CA structure.
Buildings 15 02850 g003
Figure 4. Structure of Bi-FPN.
Buildings 15 02850 g004
Figure 5. Structure of the Si-AVG-FPN neck used for multiscale feature fusion.
Buildings 15 02850 g005
Figure 6. VoVGSCSP module.
Buildings 15 02850 g006
Figure 7. AVCStem module.
Buildings 15 02850 g007
Figure 8. AKConv structure.
Buildings 15 02850 g008
Figure 9. GSConv module.
Buildings 15 02850 g009
Figure 10. Evaluation metrics for detection of prefabricated components: (a) IoU; (b) precision; (c) recall.
Buildings 15 02850 g010
Figure 11. Calculation loss of Baseline after adding different modules.
Buildings 15 02850 g011
Figure 12. Confusion matrices of different modules.
Buildings 15 02850 g012
Figure 13. Detection results using different modules for five types of embedded components.
Buildings 15 02850 g013
Figure 14. Visual comparison of detection results from different models on prefabricated laminated slab components.
Buildings 15 02850 g014
Figure 15. Recognition results of various models on representative prefabricated slab images.
Buildings 15 02850 g015
Table 1. Number of images in the dataset.
Image TypeNumber of Images for TrainingNumber of Images for ValidationNumber of Images for TestingTotal
Number of Images10703051601535
Table 2. Details of the proposed datasets.
Type of DataNumber of Labels for TrainingNumber of Labels for ValidationNumber of Labels for Testing
Metal junction box2207045
Plastic junction box830250110
Reserved holes40011595
Truss bars41351195560
Reinforcement rebars809523151190
Total13,68039452000
Table 3. Comparative study of the results with different modules.
Used
Network
Adopted
Module
BoxParams (M)F1GFLOPsSize
PrecisionRecallmAP50
BaselineYOLOv892.383.588.33,006,62387.78.16.2
Baseline-MMBCA94.584.189.83,038,71589.08.76.3
Baseline-BBi-AV-FPN93.184.490.12,675,28788.57.35.6
MBAVMBCA + Bi-AV-FPN95.282.790.92,707,37988.58.05.7
Table 4. The mAP50 values of different models for various embedded part types.
ModuleAll-mAP50RR-mAP50PJB-mAP50MJB-mAP50TB-mAP50RH-mAP50
Baseline88.3%85.9%97.6%98.4%97.2%62.5%
Baseline-M89.8%85.0%98.8%97.1%98.3%70.7%
Baseline-B90.1%86.3%97.6%96.6%98.3%71.7%
MBAV90.9%88.0%99.9%99.6%99.9%66.3%
Table 5. Comparison of the results of different network models.
Used
Network
BoxSize (M)F1GFLOPs
PrecisionRecallmAP50
Fast R-CNN87%62%82%-0.72-
YOLOv592%83%88%7.10.8715.8
YOLOv682%48%63%18.50.6045.17
YOLOv793%83%89%61.90.88103.2
Baseline92%84%88%6.20.8812.0
MBAV95%83%91%5.70.8914.9
Disclaimer/Publisher’s Note: The statements, opinions and data contained in all publications are solely those of the individual author(s) and contributor(s) and not of MDPI and/or the editor(s). MDPI and/or the editor(s) disclaim responsibility for any injury to people or property resulting from any ideas, methods, instructions or products referred to in the content.