1. Introduction
Excessive residual deformation in a structure following a major earthquake significantly compromises its post-earthquake structural safety and reparability. In light of such challenges, reducing residual deformation has become a key focus in current research efforts. Post-tensioned, unbonded, prestressed, dry-connected frame structures have been extensively studied and widely applied [
1,
2]. By introducing prestressing force, these structures can not only enhance the stiffness and bearing capacity but also provide a restoring force after deformation, thereby substantially reducing post-earthquake residual deformation [
3,
4,
5,
6,
7].
The energy dissipation capacity of post-tensioned, unbonded, prestressed, dry connections is limited, as the prestressing tendons generally remain elastic during structural deformation. Under seismic loading, energy dissipation is critical for reducing the structural response. Energy-dissipating reinforcement or dedicated energy dissipators should therefore be incorporated into the connections of prestressed, precast beam–column structures to enhance their energy dissipation capacity [
4,
8,
9,
10].
In the 1990s, members of the U.S.–Japan joint research PRESSS project investigated hybrid frame, unbonded, prestressed, precast beam–column connections suitable for high seismic intensity zones [
4]. In this system, prestressing tendons are placed at the center of the beams, aiding in maintaining their elasticity under strong seismic events, thereby preserving the prestressing force and ensuring a favorable overall structural performance. The symmetrical arrangement of energy-dissipating reinforcement at the top and bottom of the connection significantly enhances its energy dissipation capacity. However, the promotion of the Hybrid Frame system has not met expectations. This system involves complex construction and imposes excessively high requirements on construction technology and quality [
8].
Connection configurations that enhance the energy dissipation performance through the installation of energy dissipators have also been extensively studied. In 2015, Song L.L. [
5] proposed a self-centering, prestressed, concrete moment-resisting frame system, in which channel steel extending from the column is clamped to the beam ends with bronze friction shims and high-strength bolts, with frictional sliding induced by relative deformation between the beam and column utilized to enhance the connection’s energy dissipation capacity. This configuration improves energy dissipation by utilizing friction generated from the relative deformation between beams and columns. The study results demonstrated that the connection possesses excellent energy dissipation capacity and self-centering behavior.
Han (2015) [
11] investigated a prestressed assembled frame structure connection incorporating an additional damper and found that the structure exhibited favorable energy dissipation capacity, deformation recovery, and ductility. Wu Congxiao et al. (2023) [
12] proposed a rotating damper–twisted steel tube damper designed for beam–column connections and energy dissipation in prefabricated assembled structures. Huang Linjie et al. (2020) [
13] proposed a self-centering, prestressed concrete beam-to-column connection, in which friction dampers are placed in the upper and lower parts of the beam-to-column connections to provide energy dissipation ability. The results of their study demonstrated that the twisted steel tube damper possessed excellent rotational deformation capacity, energy dissipation capacity, and fatigue resistance. Li et al. (2024) [
14] proposed a new type of post-tensioned, self-centering joint to avoid the serial connection of beams. By employing steel beams to serve as the anchorages of PT tendons, each bay of the frame is separately prestressed. External friction dampers are installed to enhance the energy dissipation capacity of the connection. Although connections with additional energy dissipators exhibit superior performance, their relatively complex construction and high cost currently limit their widespread adoption in practical engineering applications.
Ji et al. (2025) [
15] proposes a kind of novel precast prestressed steel-reinforced concrete (SRC) composite frames with high-strength bolted connections and fiber-reinforced engineered cementitious composite cast-in-place beam–column joints. The findings reveal that substituting ordinary concrete with fiber-reinforced ECC material at beam–column joints can significantly enhance the energy dissipation capacity, ductility, cracking resistance, and shear capacity. The disadvantage of this type of joint is that fiber-reinforced ECC material is prone to damage under large deformations, resulting in irreparable injuries. Its deformation capacity and replaceability are still insufficient compared with metal components.
Aiming to improve construction efficiency in assembled concrete frame structures, Guo Haishan et al. proposed a novel post-tensioned, unbonded, prestressed, precast concrete beam–column connection, which possesses the following advantages [
8]:
1. Streamlined component fabrication and assembly convenience.
2. Enhanced construction quality assurance.
3. Optimized comprehensive economic benefits.
4. Superior seismic performance characteristics.
Compared to the Hybrid Frame system, the studied connection features energy-dissipating steel installed solely at the upper ends of beams. These bars connect on-site to column-embedded reinforcements using threaded couplers, eliminating the need for preformed slots in the precast beams and bypassing the complex grouting process, thereby achieving efficient and simplified construction. The implementation of precast laminated beams provides on-site operational space for installing energy-dissipating steel while ensuring full integration with composite slabs through cast-in-place concrete layers. Post-tensioned tendons are positioned centrally or near the soffit of the precast beam sections, which not only enhances the flexural capacity but also significantly improves the structure’s self-centering capability under lateral loads.
In this paper, we present a theoretical analysis of the connection’s mechanical mechanism and establish an analytical model for its M-θ relationship. The connection represents an asymmetrical post-tensioned, unbonded, prestressed, dry beam–column connection, and its energy dissipation calculation differs from that of conventional symmetrically reinforced connections. In this study, the formula for calculating the energy dissipation coefficient was derived, and a parametric analysis was conducted to facilitate the engineering application. Lastly, the effectiveness of the proposed model was validated through a comparison with the experimental results
2. Connection Construction
The connection consists of a precast column passing through the connection, with pre-installed tendon ducts located at the beam and column. Partially precast composite beams and composite slabs are employed for the structure. The precast beams are connected to the column using post-tensioned, prestressing strands, which pass through the lower–middle portion of the beams and the column body—specifically positioned at approximately one-half to one-third of the beam height above the bottom edge of the beam section. The longitudinal mild steel connecting the upper part of the beam to the column is embedded in the cast-in-place composite layer of the beam. This mild steel is locally debonded and reduced to improve deformation capacity and energy dissipation, and is anchored to the column’s pre-embedded reinforcement through mechanical rebar connectors. Lastly, cast-in-place concrete is poured over the assembled precast composite beams and slabs to integrate the connection into a monolithic structure (
Figure 1).
The connection possesses the following advantages:
1. The columns, beams, and floor slabs are prefabricated, resulting in a high degree of assembly and reduced on-site labor requirements.
2. The columns are designed without corbels, the beams have no protruding reinforcement at their ends, and the floor slabs are standardized components, thereby enhancing factory production efficiency.
3. The use of a cast-in-place laminated reinforced concrete (RC) layer facilitates the installation of embedded pipelines and enables adjustments to construction tolerances.
4. All energy-dissipating reinforcement bars are positioned in the upper laminated layer of the beams to improve construction efficiency. Moreover, the reinforcement incorporates a locally debonded and weakened segment to enhance the connection’s deformation capacity and energy dissipation performance. Reinforcement deformation is concentrated in the weakened segment; setting the unbonded segments allows the rebar’s deformation to fully develop within the unbonded segments, enhancing its energy-dissipating deformation.
5. Post-tensioned, straight, unbonded, prestressing tendons are employed to simplify the construction process. In addition, to improve the negative bending moment capacity of the connection, the tendons are placed in the middle lower part of the beam section.
Compared to conventional connections, the proposed connection features reduced construction complexity, enhanced manufacturing/transportation/assembly efficiency, lower construction costs, and superior seismic performance [
8].
3. Theoretical Analytical Model of the Beam–Column Contact Surface M-θ Relationship
In designing the connection analyzed in this paper, to ensure adequate shear capacity, the minimum prestressing force for tendons shall be calculated according to the following formula as specified in ACI T1.2-03 (Special Hybrid Moment Frames Composed of Discretely Jointed Precast and Post-Tensioned Concrete Members) Section 6.2.1. This requirement guarantees that the shear capacity of the precast beam–column connection provided by the prestressing is capable of resisting the shear load at the connection, while the shear contributions from the cast-in-place concrete topping and mild steel reinforcement are treated as an additional safety reserve.
In ACI T1.2-03 6.2.1, the minimum prestress force
shall be as follows:
where
is the area of the post-tensioning tendons crossing the beam–column interface,
is the effective stress in the post-tensioning tendons (after allowance for all prestress losses),
is the coefficient of friction and is equal to 0.6; and
ф (0.75) is the strength reduction factor for the shear specified in Section 9.3.2.3 of ACI 318.
is the shear force due to the unfactored dead load, and
is the shear force due to the unfactored live load.
In ACI T1.2-03 6.2.1, the yield force in the special reinforcement shall satisfy the following requirement:
where
is the area of the special top reinforcement crossing the beam–column interface, and
is the specified yield strength of the special reinforcement.
The post-tensioned, unbonded, prestressed beam–column connection investigated in this study complies with the aforementioned shear capacity design criteria (ACI T1.2-03 Section 6.2.1), ensuring that the shear failure and contact surface slide do not occur during bending deformation.
3.1. Bending Curve of the Contact Surface
Unlike traditional cast-in-place connections, the deformation in prestressed assembled dry connections is primarily concentrated at the contact surface; therefore, this paper, we focus on investigating the mechanical properties of the contact surface.
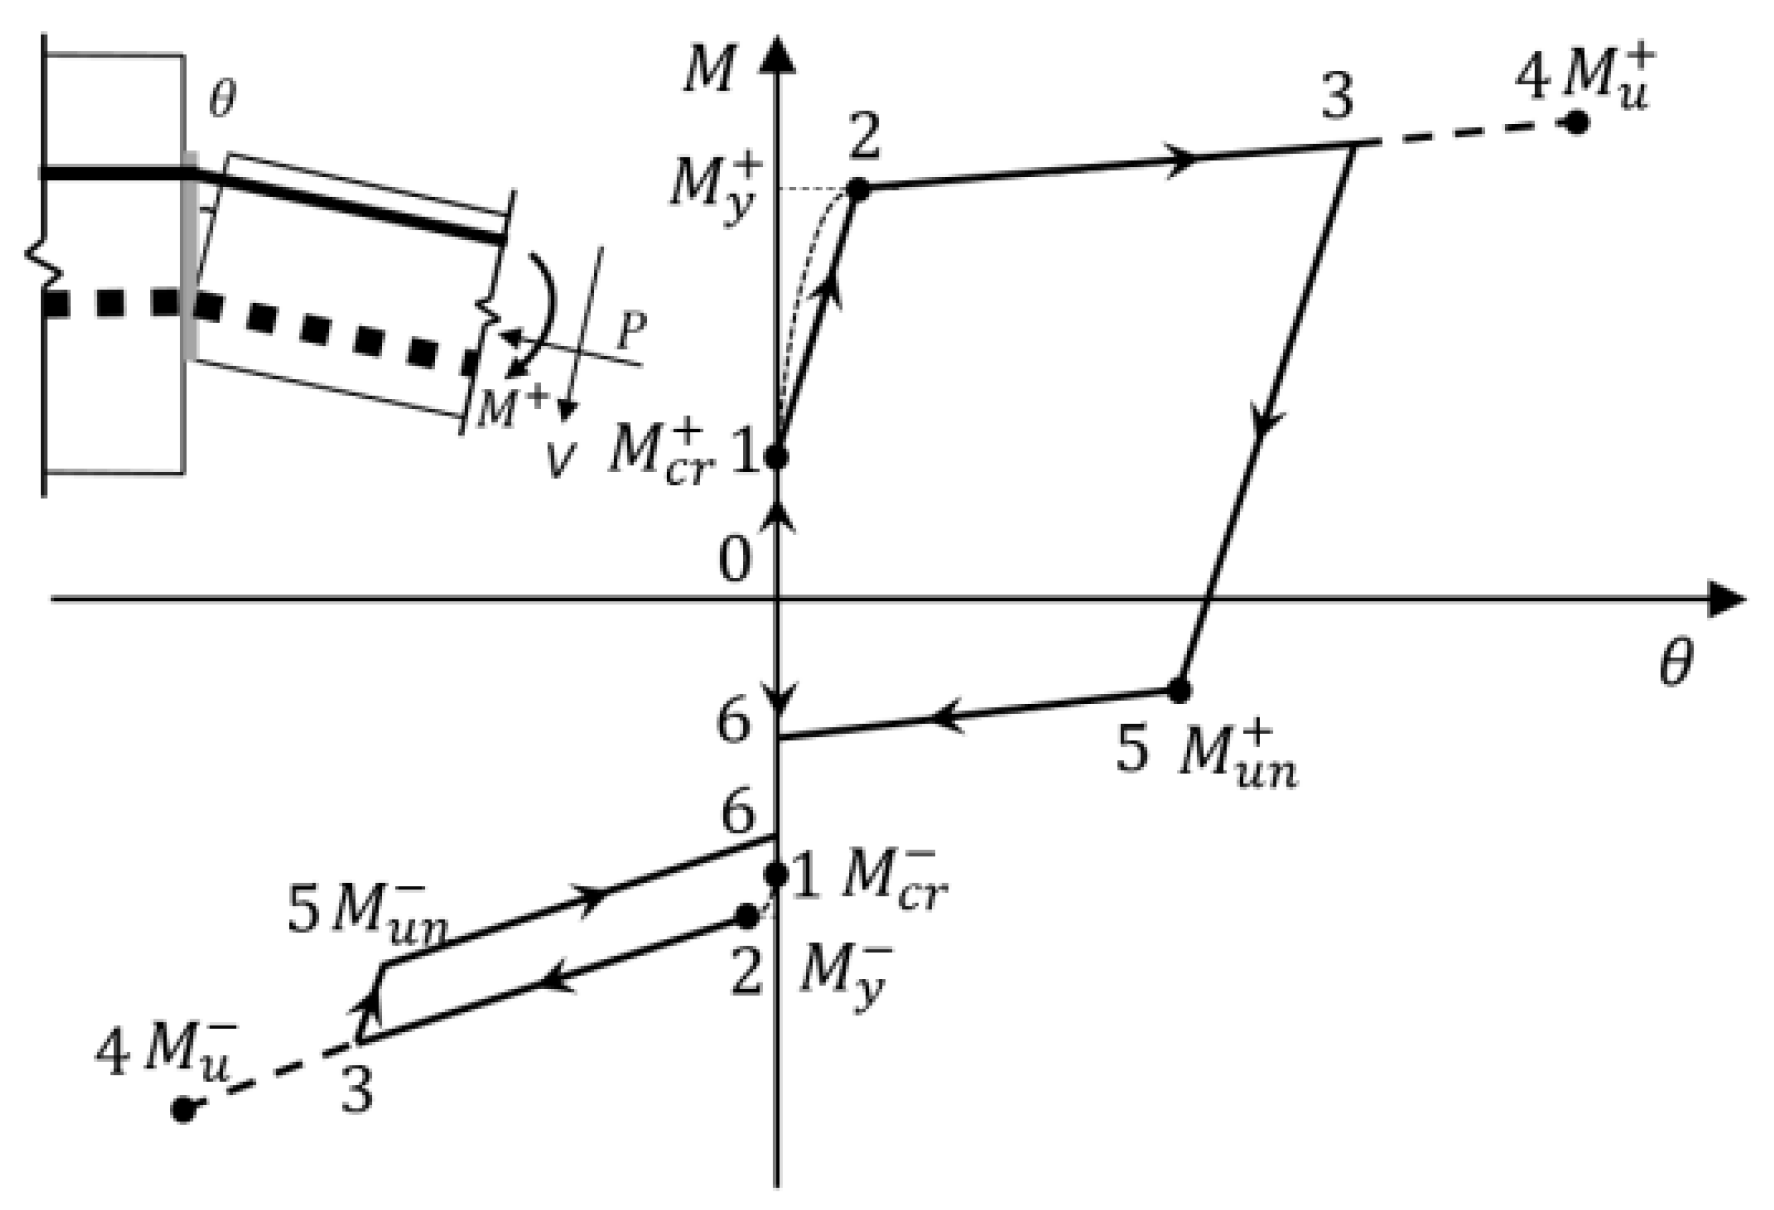
The contact surface at the beam end is subjected to the bending moment, axial force, and shear force. The shear force is resisted by friction; in comparison, the axial force generates compressive stress between the contact surfaces, thereby influencing the flexural capacity of the surface. The bending moment induces rotational deformation at the contact surface, which may, over time, lead to damage. Compared to the bending moment, axial and shear forces have a relatively minor impact on connection damage and generally do not govern structural failure. Under cyclic loading, the moment–rotation (M–θ) relationship at the contact surface exhibits an asymmetric flag-shaped hysteresis curve, as illustrated in
Figure 2 [
2,
9], where θ denotes the relative rotation angle at the surface.
3.1.1. Positive Loading
In the upper left corner of
Figure 2, a schematic diagram of the connection forward loading deformation is presented. When the load increases to Point 1 (first quadrant in
Figure 2), the compressive stress at the upper end of the contact surface decreases to zero, and the beam end resists the critical bending moment
(
Figure 2). As the load continues to increase, the contact surface begins to open, the neutral axis shifts downward, and the height of the compressive zone decreases rapidly before stabilizing. Simultaneously, the stiffness of the contact surface decreases sharply. Upon reaching Point 2, the energy-dissipating reinforcement yields, and the contact surface enters the yielding state. At this stage, the beam end bears the yielding bending moment
(
Figure 2). With further loading, the flexural capacity of the beam end either remains approximately constant or increases gradually. When the load reaches Point 4, the energy-dissipating reinforcement fractures, the structure loses its load-bearing capacity, and failure occurs. At this point, the beam end resists the ultimate bending moment
. If unloading begins from Point 3 (before Point 4), the tensile force in the energy-dissipating reinforcement decreases rapidly, resulting in a corresponding rapid decrease in the bending moment at the beam end. As the load decreases to Point 5, the energy-dissipating reinforcement yields in compression. Thereafter, the flexural capacity of the contact surface remains almost constant until Point 6, at which point the upper end of the contact surface reestablishes contact with the column.
3.1.2. Negative Loading
When the load is increased to Point 1 (third quadrant in
Figure 2), the pressure at the lower end of the contact surface is zero and at this time, the bending moment borne by the end of the beam is the critical bending moment
. Because the prestressing tendons are located in the middle–lower part of the section, the absolute value of
exceeds that of
. As the load increases, the contact surface opens, the neutral axis shifts upward, and the height of the contact surface pressure zone and the stiffness of the contact surface decrease rapidly. When the load is increased to Point 2, the height of the contact surface compression zone tends to stabilize, and the contact surface enters the yielding state; at this point, the beam end bears the yield bending moment
(
Figure 2). As the load continues to increase, the bending moment at the beam end gradually increases. When the load increases to Point 4, the prestressing tendon yields or pulls off, resulting in structural failure; at this point, the beam end bears the ultimate bending moment
. If the structure is unloaded at Point 3 (before Point 4), slight changes in the stress of the prestressing tendons and energy-dissipating reinforcement cause a slight reduction in the bending moment of the contact surface; this process continues until Point 6, when the lower end of the contact surface reestablishes contact with the column.
3.2. Decompression Moment
When the beam end rotates, the pre-pressure of the tension side of the contact surface gradually decreases to zero (from Point 0 to Point 1 in
Figure 2), and the corresponding bending moment at Point 1 is defined as the decompression moment
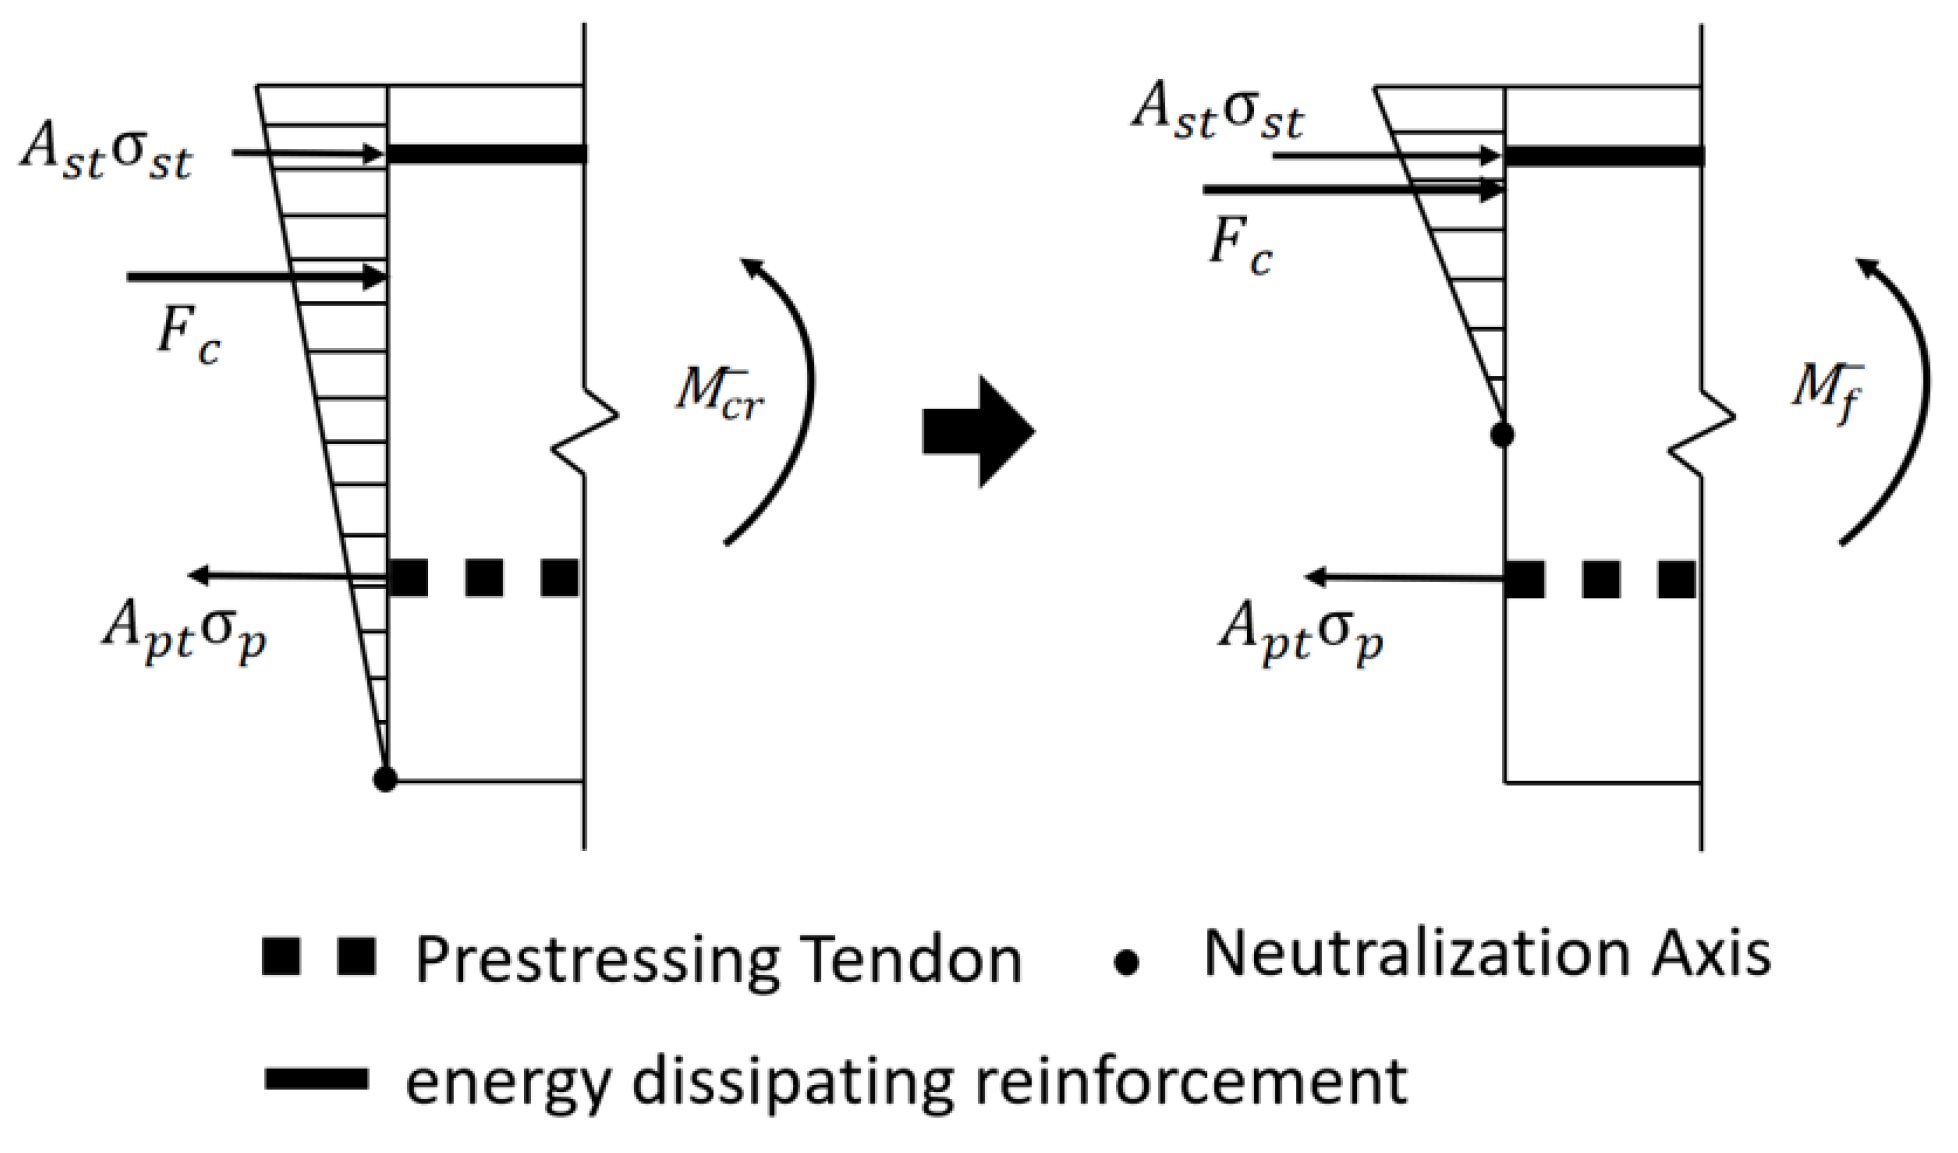
. As the structure remains in the elastic stage during decompression, deformation of the contact surface is minimal. Consequently, the stress of the mild steel can be negligible. The compressive stress distribution of the contact surface can be approximated as triangular (
Figure 3).
During positive loading, the moment equilibrium about the central axis of the contact surface can be expressed as follows:
During negative loading, the moment equilibrium about the central axis of the contact surface can be expressed as follows:
Considering that the contact surface remains closed at this time, the strain increase in the mild steel and prestressing tendons can be negligible; it follows that
(
is the initial prestress) and
. The formula simplifies as follows:
Equation (5) represents the bending moment balance under decompression conditions. It can be seen from Equation (5) that when [H/3, 2H/3], the decompression bending moment is active and the beam–column contact surface is closed in the initial state. Otherwise, the contact surface cracks under the initial prestressing.
3.3. Yield Bending Moment
3.3.1. Positive Loading
Following the decompression of the upper end of the contact surface, loading continues until the contact surface yields (corresponding to the process from Point 1 to Point 2 in the upper right corner of
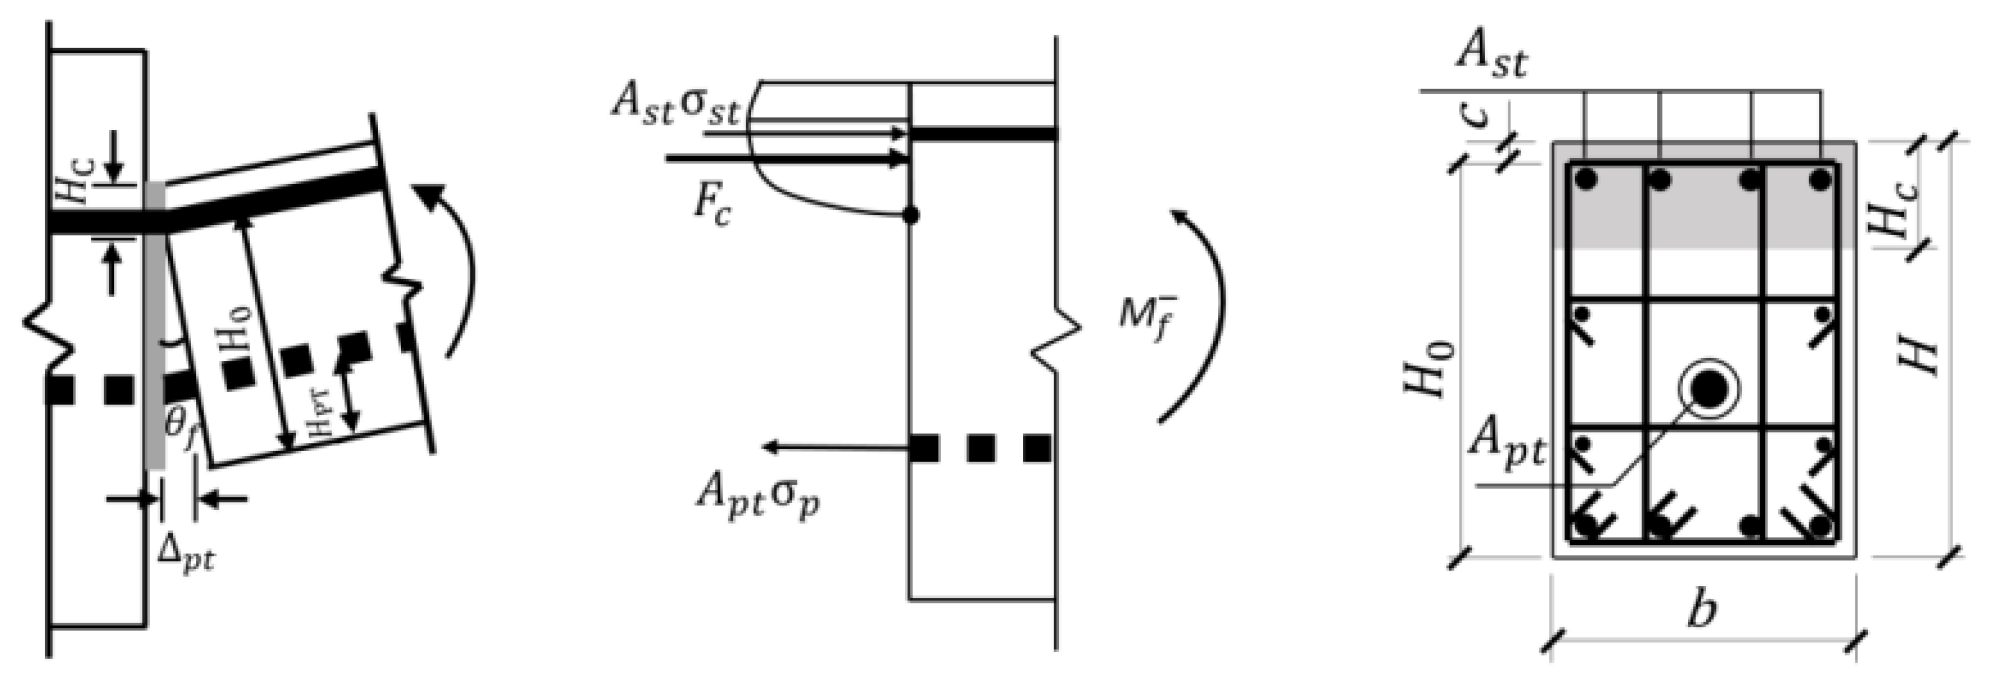
Figure 2). During this stage, the neutral axis of the contact surface gradually shifts downward, and the section stiffness decreases progressively (
Figure 4). Simultaneously, slight spalling occurs in the protective concrete layer at the lower part of the section. The actual M–θ curve of the structure is represented by the dashed line in
Figure 2. In this study, the theoretical model simplifies this curve into a straight line.
Assuming that the concrete stress distribution in the compression zone of the contact surface is rectangular, and the moment equilibrium is taken for the position of compressive resultant force (
Fc), the yield bending moment at the contact surface is calculated as follows:
When the compressive stress in the compression zone is linearly distributed, the stress profile is triangular, resulting in a compression zone height of
. At the yield state, the compression zone transitions to nonlinear behavior, and its height is further reduced compared to the elastic state—falling between
and
. Assuming an equivalent rectangular stress distribution, the height of the stress block is taken as 0.8 times the distance from the edge of the contact surface to the neutral axis. Accordingly, the position of the neutral axis is taken as
(
Figure 5).
At Point 2 (
Figure 2), the stress in the reinforcement is
and the elongation of the mild steel is
(
Figure 6).
is the length of the deformed part of the mild steel, including the length of the unbonded part of the mild steel
and stress penetration length
[
16];
,
.
When the contact surface at the beam end yields, the rotation angle can be calculated as follows:
At Point 2, the strain increment of the prestressing tendon is as follows:
From Equations (6)–(9), it can be seen that iterative calculations are required to obtain the accurate value of ; therefore, the following simplified calculation method is employed in this study.
Given that the prestressing tendon in the connection is located at the lower part of the contact surface and is very close to the neutral axis, its axial deformation is minimal. Furthermore, the axial compression deformation of the connection surface further reduces the axial elongation of the prestressing tendon. In addition, the unbonded length of the prestressing tendon (denoted as
) is relatively long; it can therefore be assumed that
. Moreover, during design, the effect of stirrup confinement on concrete strength can be neglected; therefore,
Hc can be calculated as follows:
By substituting Equation (10) into Equation (6), the yield bending moment can be calculated as follows:
Equation (11) represents the bending moment balance in yield bending conditions, during positive loading.
3.3.2. Negative Loading
Following decompression of the lower end of the contact surface, as the contact surface angle increases, the surface opens, the neutral axis shifts upward, and the height of the compression zone decreases. As the contact surface opens, the stress in the prestressing tendons begins to increase, together with the compressive stress in the energy-dissipating reinforcement. The authors of Reference [
17] define the linear limit bending moment of unbonded, prestressed beam–column connections as the limit bending moment under the combined effects of self-weight and frequent seismic events (
Figure 7). The bending moment corresponding to the condition in which the neutralization axis coincides with the centroidal axis of the cross-section is defined as the linear limit bending moment. Accordingly, the linear limit bending moment of the connection in this study is determined as follows.
The distance from the prestressing tendon to the resultant force point of the concrete compression zone is given by
. In the linear limit state, the rotation at the beam end is small, and due to the large unbonded length of the prestressing tendons, the increase in tendon stress can be neglected. Although the stress in the energy-dissipating reinforcement increases, its proximity to the resultant force point of the concrete compression zone results in a negligible contribution to the load-bearing capacity. The beam-end bending moment can therefore be calculated as follows:
Beyond the linear limit state, as the load continues to increase, the beam-end rotation increases further, leading to non-negligible changes in the stresses of the prestressing tendons and reinforcement. The concrete compression zone gradually enters a nonlinear state (
Figure 8). The height of the equivalent rectangular compression zone is assumed to be
.
The distance from the prestressing tendon to the centroid of the concrete compression zone is denoted as , and is calculated as . Accordingly, the beam-end bending moment can be computed as follows:
The prestressing tendon elongation is as follows:
The strain of the energy-dissipating reinforcement is as follows:
The bending moment of the contact surface is as follows:
The derivation of Equation (13) leads to the beam-end rotational stiffness:
In Equation (14), all parameters, excluding the height of the compression zone
, are constants. The variation in
follows the process of initially decreasing gradually and then tending to stabilize. As the contact surface angle increases further, the concrete in the upper protective layer at the beam end gradually spalls off. Subsequently,
tends to increase slowly. At the linear limit state, the height of the equivalent rectangular compression zone is half the height of the compression zone (
Figure 7), i.e.,
. It is reduced further thereafter, under the assumption that the height of the equivalent rectangular compression zone should be greater than twice the thickness of the protective concrete layer, i.e.,
. Assuming that the thickness of the protective layer is
, then
. That is, after the linear limit state, the height of the equivalent rectangular compression zone is reduced from
to
, with a small magnitude of change. Therefore,
can be considered to stabilize after the linear limit state. Based on Equation (14), all parameters are constants excluding
; it can therefore be assumed that the bending capacity of the beam end undergoes linear changes after the linear limit state.
Before the linear limit state, the height of the concrete compression zone at the contact surface is high; thereafter, the rotational stiffness of the contact surface decreases drastically due to the sharp reduction in compression zone height. Therefore, the linear limit state also marks a point of sudden change in the contact surface bending moment stiffness. In this paper, the linear limit state point is defined as the beam-end bending yield point, i.e., as follows:
Equation (15) represents the bending moment balance in yield bending conditions, during negative loading.
3.4. Post-Yield Bending Moment
3.4.1. Positive Loading
When the contact surface continues to be loaded post-yielding (along the loading path between Points 2 and 3 in the first quadrant of
Figure 2), tension stress growth remains slow due to the mild steel yielding and the proximity of the prestressing tendons to the compression zone. Consequently, the total pressure variation in the contact surface compression zone is minimal. As the rotation angle of the contact surface increases, the spalling of the cover concrete at the bottom of the section intensifies, and the height of the compression zone at the contact surface gradually rises. When the energy-dissipating reinforcement fractures (Point 4), the structure reaches its ultimate load-bearing state. At this stage, the concrete cover in the compression zone is considered to have completely spalled, losing its load-bearing capacity, and the height of the compression zone at the contact surface is calculated as follows:
In Equation (16), the parameter denotes the ultimate stress of the energy dissipation reinforcement, and represents the ultimate stress of the confined concrete.
The limit angle of the contact surface is calculated as follows:
The ultimate bending moment of the contact surface is calculated as follows:
Equations (16)–(19) can yield exact solutions by solving the system of equations. Given that the prestressed tendons are arranged in the lower–middle section of the structure, causing the prestressed tendons to be located near the neutral axis where their deformation is minimal, the stress increase in the tendons can be consequently neglected. The ultimate bending moment is then calculated as follows:
Equation (20) represents the bending moment balance in ultimate bending conditions, during positive loading. A straight line is employed to connect the yield point and the ultimate point.
3.4.2. Negative Load
As demonstrated in
Section 3.3.2, the post-yield bending capacity of the contact surface shows an approximately linear relationship with the contact surface angle. At the limit state (Point 4 in
Figure 2), the concrete protective layer undergoes complete spalling. Thereafter, the energy dissipation reinforcement yields, and the compression zone height (
) of the contact surface can be determined as follows:
The ultimate bending moments can then be calculated as follows:
Equation (21) represents the bending moment balance in ultimate bending conditions, during negative loading.
The contact surface rotation angle at this time is as follows:
3.5. Unloading Bending Moment
3.5.1. Unloading After Positive Loading
During unloading after positive loading, if the contact surface has not reached the yield state, the moment–rotation relationship of the contact surface retraces its original path. If the contact surface reaches the yield state, the contact surface moment rapidly drops to zero, followed by reverse loading until the energy-dissipation reinforcement yields in compression. Thereafter, the contact surface moment stabilizes (see Point 3 to Point 5 in the first quadrant of
Figure 2).
The compression zone height () during unloading is determined by the following:
The bending moment during unloading is as follows:
At the unloading state corresponding to Point 5, the stress in energy-dissipating reinforcement reaches
, where
represents the yield strength of the reinforcement. We therefore obtain the following:
- 2.
Unloading stiffness:
By differentiating Equation (23) with respect to
, the structural unloading stiffness can be calculated as follows:
Owing to variations in reinforcement tension, the compression zone height evolves from to . Consequently, the unloading stiffness computed via Equation (26) varies continuously. Assuming , at this time remains constant, rendering the segment between Points 3 and 5 linear.
Therefore, the following applies:
3.5.2. Unloading After Negative Loading
During unloading after negative loading, if the contact surface has not reached the yield state, the moment–rotation relationship of the contact surface retraces its original path. Once the contact surface reaches the yield state, the energy-dissipating reinforcement in the compression zone contributes minimally to the load-bearing capacity of the contact surface. In addition, the prestressing tendons remain in the elastic state. Consequently, the contact surface bending moment demonstrates elastic path recovery. This process explains the path coincidence between the loading branch (2→3) and the unloading branch (5→6) in
Figure 2’s third quadrant.
4. Energy Dissipation Capacity and Ductility
4.1. Energy Dissipation Capacity
The energy dissipation of the connection subjected to a reciprocating load constitutes one of its significant properties.
It is typically quantified by the energy dissipation coefficient
.
represents the ratio of the hysteresis loop area of the connection to the hysteresis loop area of a bilinear elasto-plastic connection with the same flexural load capacity [
5,
18]. The energy dissipation coefficient is an important design parameter for this type of connection, and its value ranges from 0 to 0.5 [
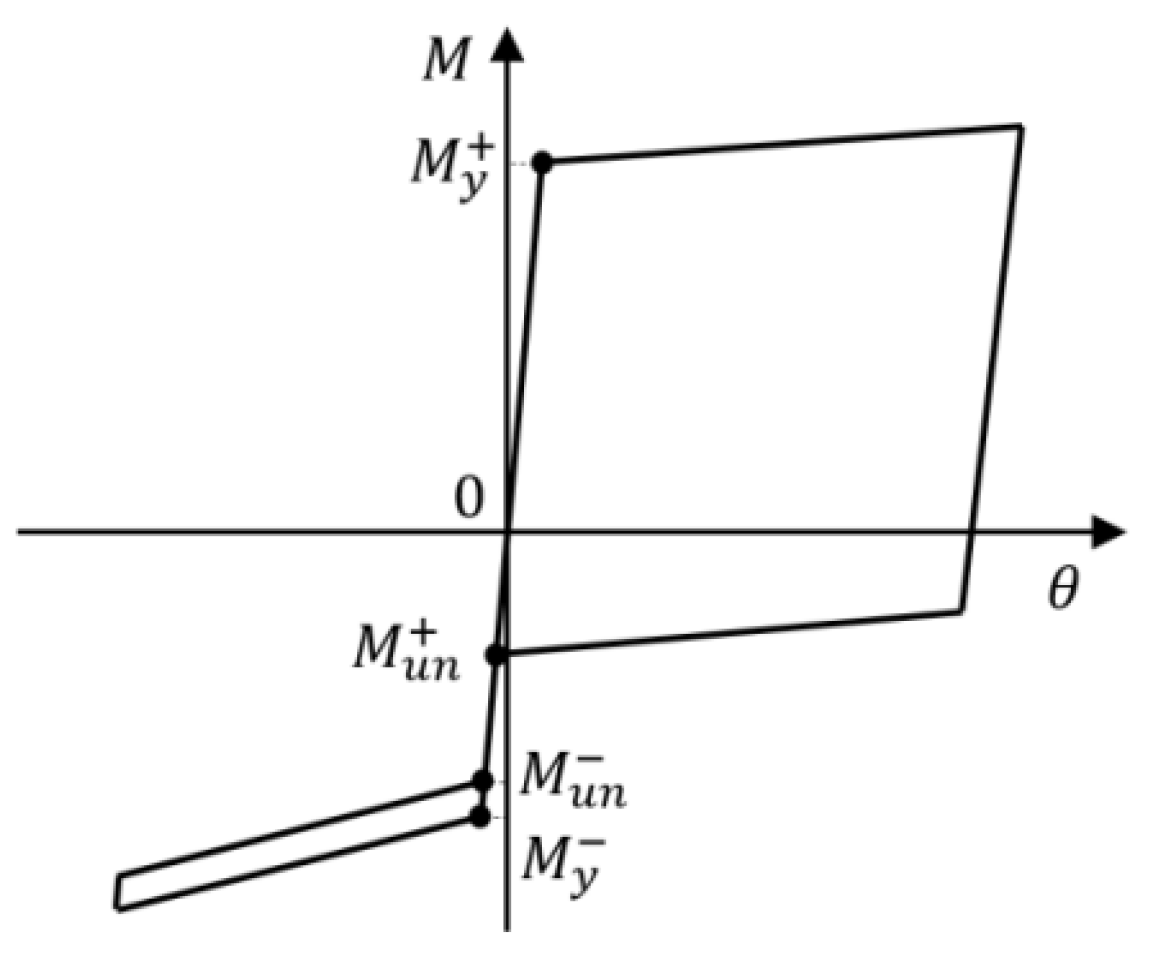
19]. In this paper, the hysteresis curves of the investigated connection are idealized as the flag-shaped curve shown in
Figure 9. Using the method outlined in Reference [
8], the energy dissipation coefficient
is calculated as follows:
When calculating the force state of the contact surface to simplify the calculation, it is assumed that the concrete protective layer remains undamaged and retains its bearing capacity, with the effect of the confined concrete being disregarded. Consequently, Equation (25) can be simplified to the following formula:
Subtract Equation (11) from Equation (29) to obtain the following:
Subtract Equation (11) from Equation (15) to obtain the following:
Then, the following is obtained:
Definitions are as follows:
,
,
. When substituted it into Equation (34), it gives the following:
From Equation (35), it is evident that the calculation of
is independent of the prestressing tendon position
, and thus the prestressing tendon position
has no effect on the energy dissipation capacity of the connection. When the concrete cover thickness varies, the relationship between
and
r is shown in
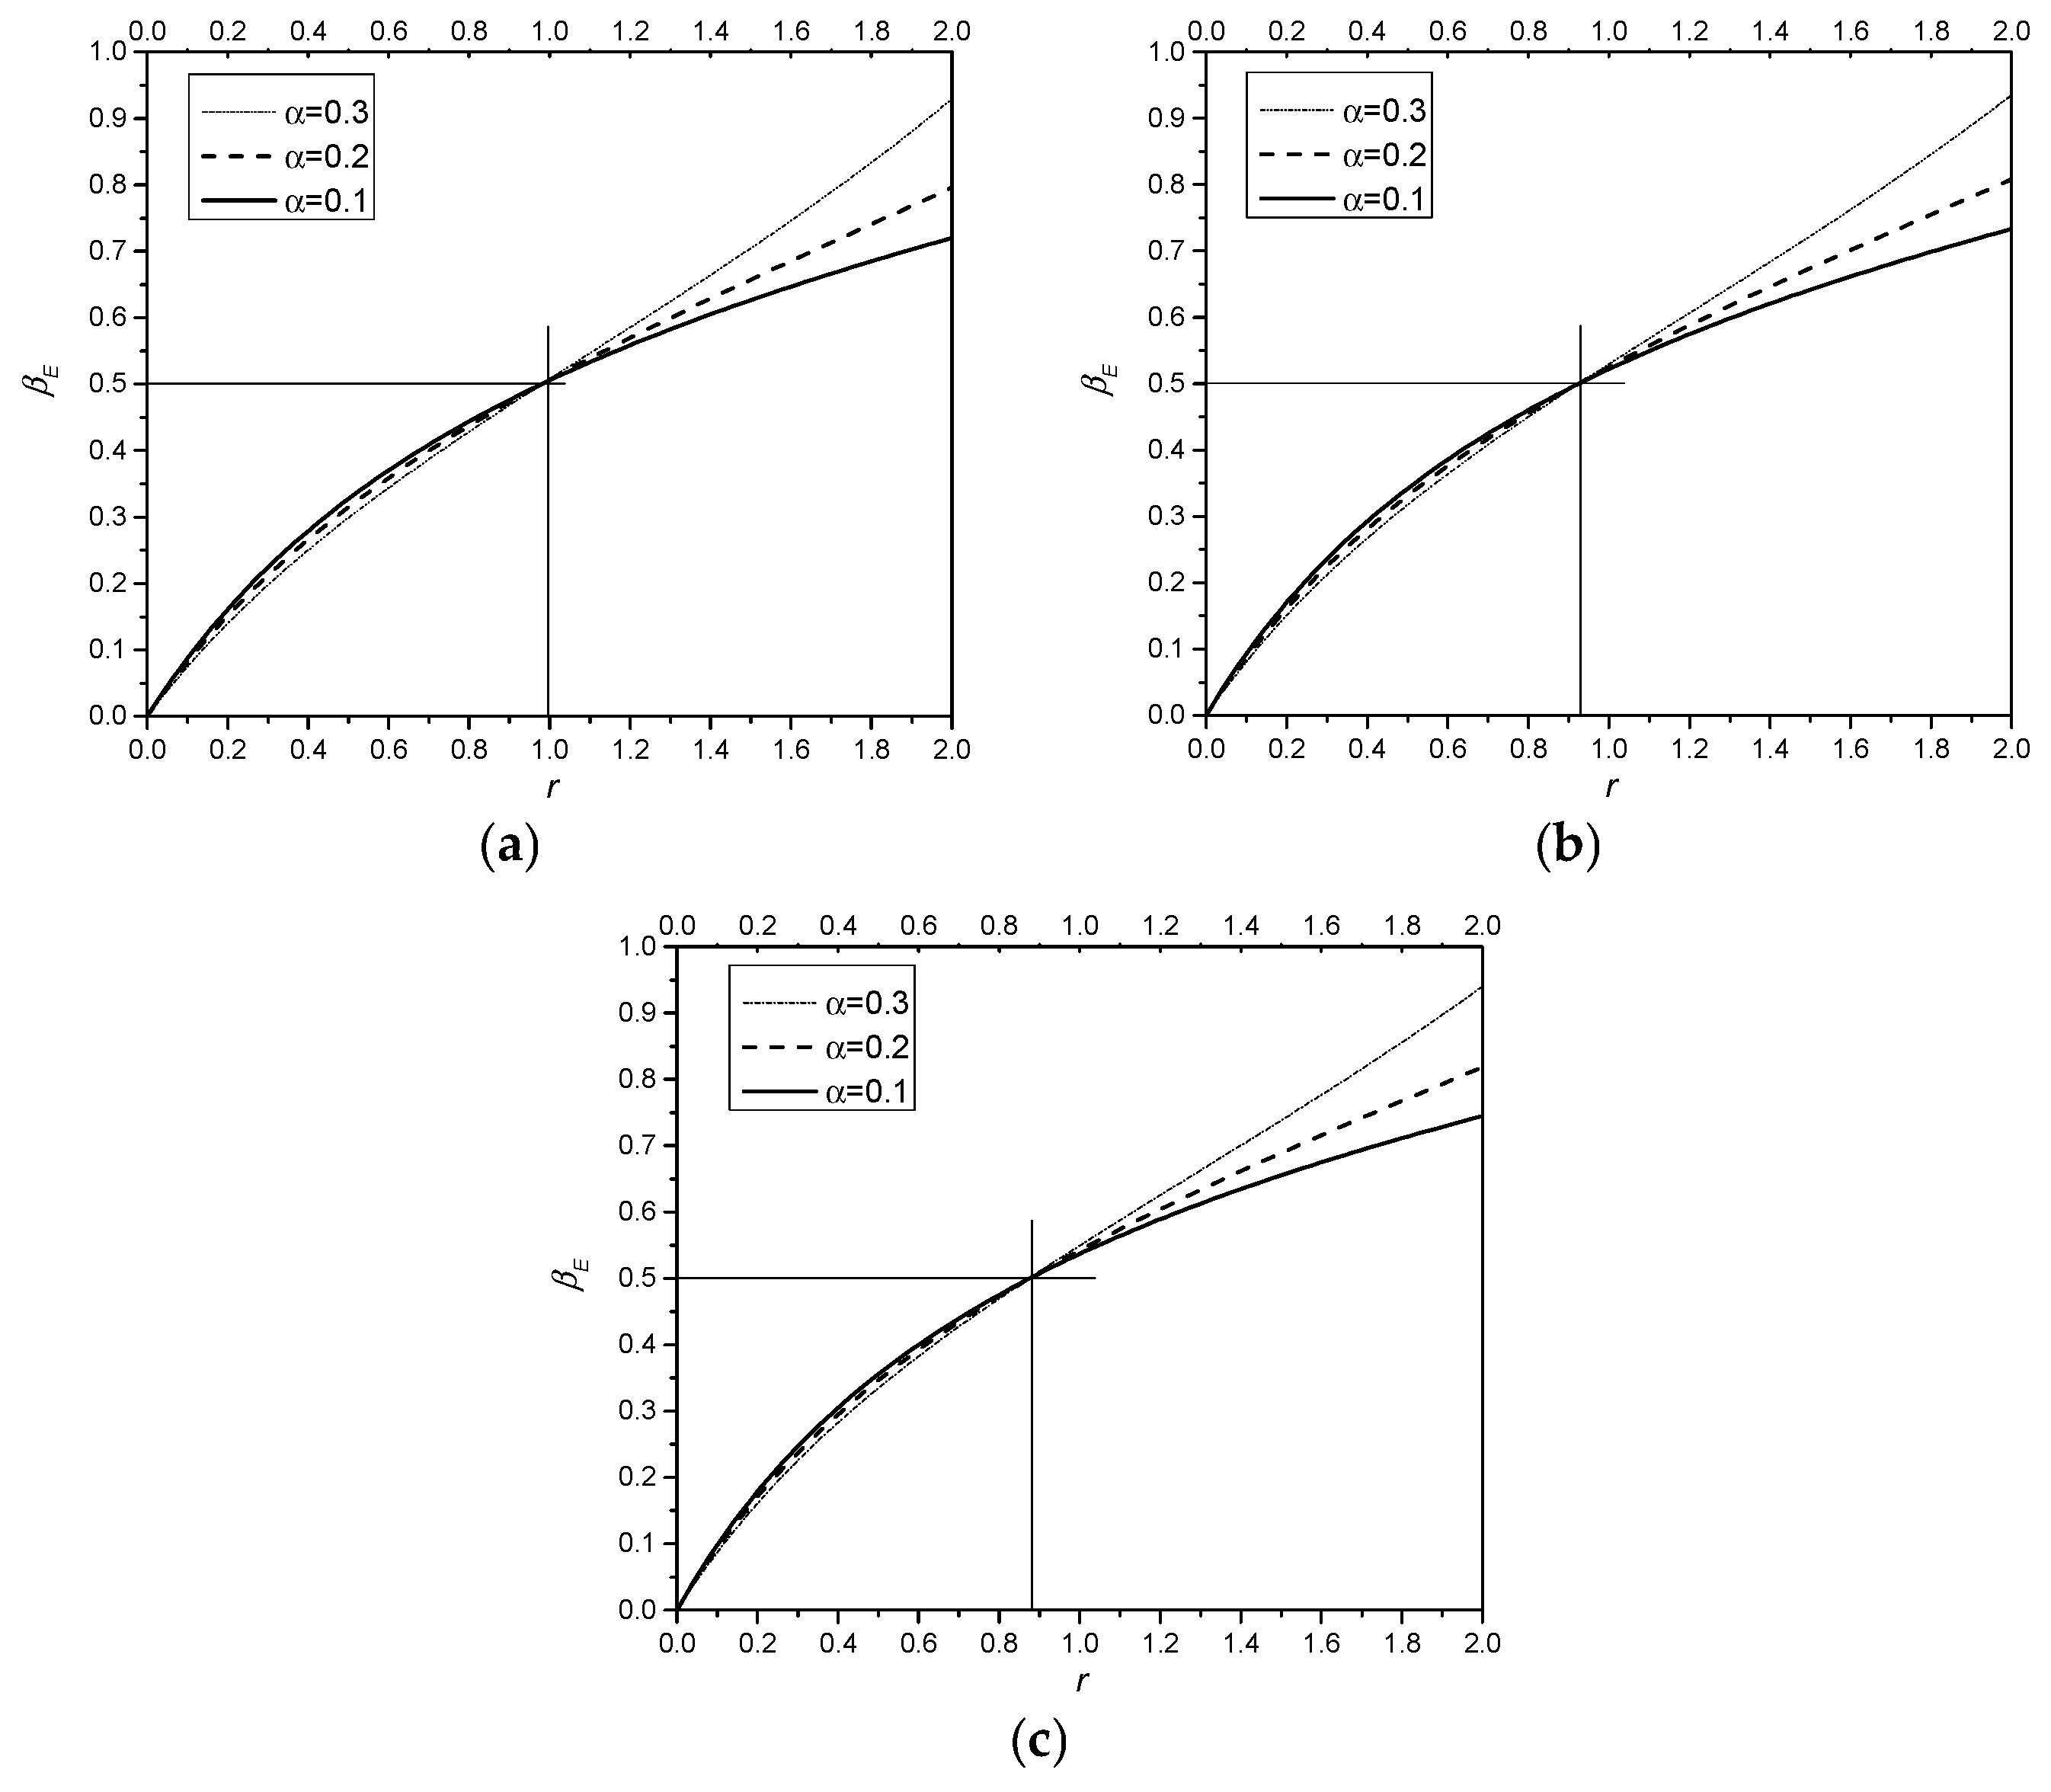
Figure 10.
From
Figure 10, it can be seen that the energy dissipation capacity of the connection increases gradually as
r increases. When
r ≈ 1,
≈ 0.5. Moreover, the growth rate of energy dissipation shows a downward trend as
r increases. The larger
r is, the lower the efficiency of the energy consumption growth of the connection induced by increasing the amount of energy dissipation reinforcement. As the thickness of the concrete protective layer for the energy dissipation reinforcement in the connection increases, the energy consumption capacity of the structure decreases slightly. When
r ≤ 1, the prestressing degree exerts a minimal effect on the structural energy dissipation coefficient. However, when
r > 1, the greater the prestressing degree, the greater the structural energy dissipation capacity.
It also can be seen from
Figure 10 that the ratio of the pre-tension of the prestressed tendons to the yield tension of the energy-dissipating rebars has a significant impact on the energy dissipation capacity. When this ratio is equal to 1, the energy dissipation coefficient
≈ 0.5. According to the research conclusions in Reference [
16], the energy dissipation coefficient of self-centering structures ranges from 0 to 0.5. Therefore, to ensure that the structure has a self-centering function in design, the ratio of the pre-tension of the prestressed tendons to the yield tension of the energy-dissipating rebars should meet the requirement of being set to less than or equal to 1.
4.2. Ductility
Under positive loading, the ductility of the connection primarily depends on the deformation capacity of mild steel in the upper section and the compressive deformation capacity of concrete in the lower zone. Given that the material properties of mild steel and concrete used in this study’s connection are comparable to those in conventional cast-in-place concrete structures, the ductility of the connection thus exhibits equivalence to that of standard cast-in-place systems. Under negative loading, the ductility of the connection primarily depends on the deformation capacity of the unbonded tendon in the lower section and the compressive deformation capacity of concrete in the upper zone. Given that the larger unbonded lengths in prestressing tendons (approximately one-third of the beam span) result in an enhanced deformation capacity, the connection exhibits satisfactory ductility.
5. Self-Centering Properties
The self-centering ability of the structure is defined in the following manner: after an earthquake, the structure returns to its initial position under the influence of prestress, which implies that the structure exhibits no residual deformation after the seismic event. In the case of post-tensioned, unbonded, prestressed beam–column connections with symmetric reinforcement distribution, the authors of Reference [
8] suggest that
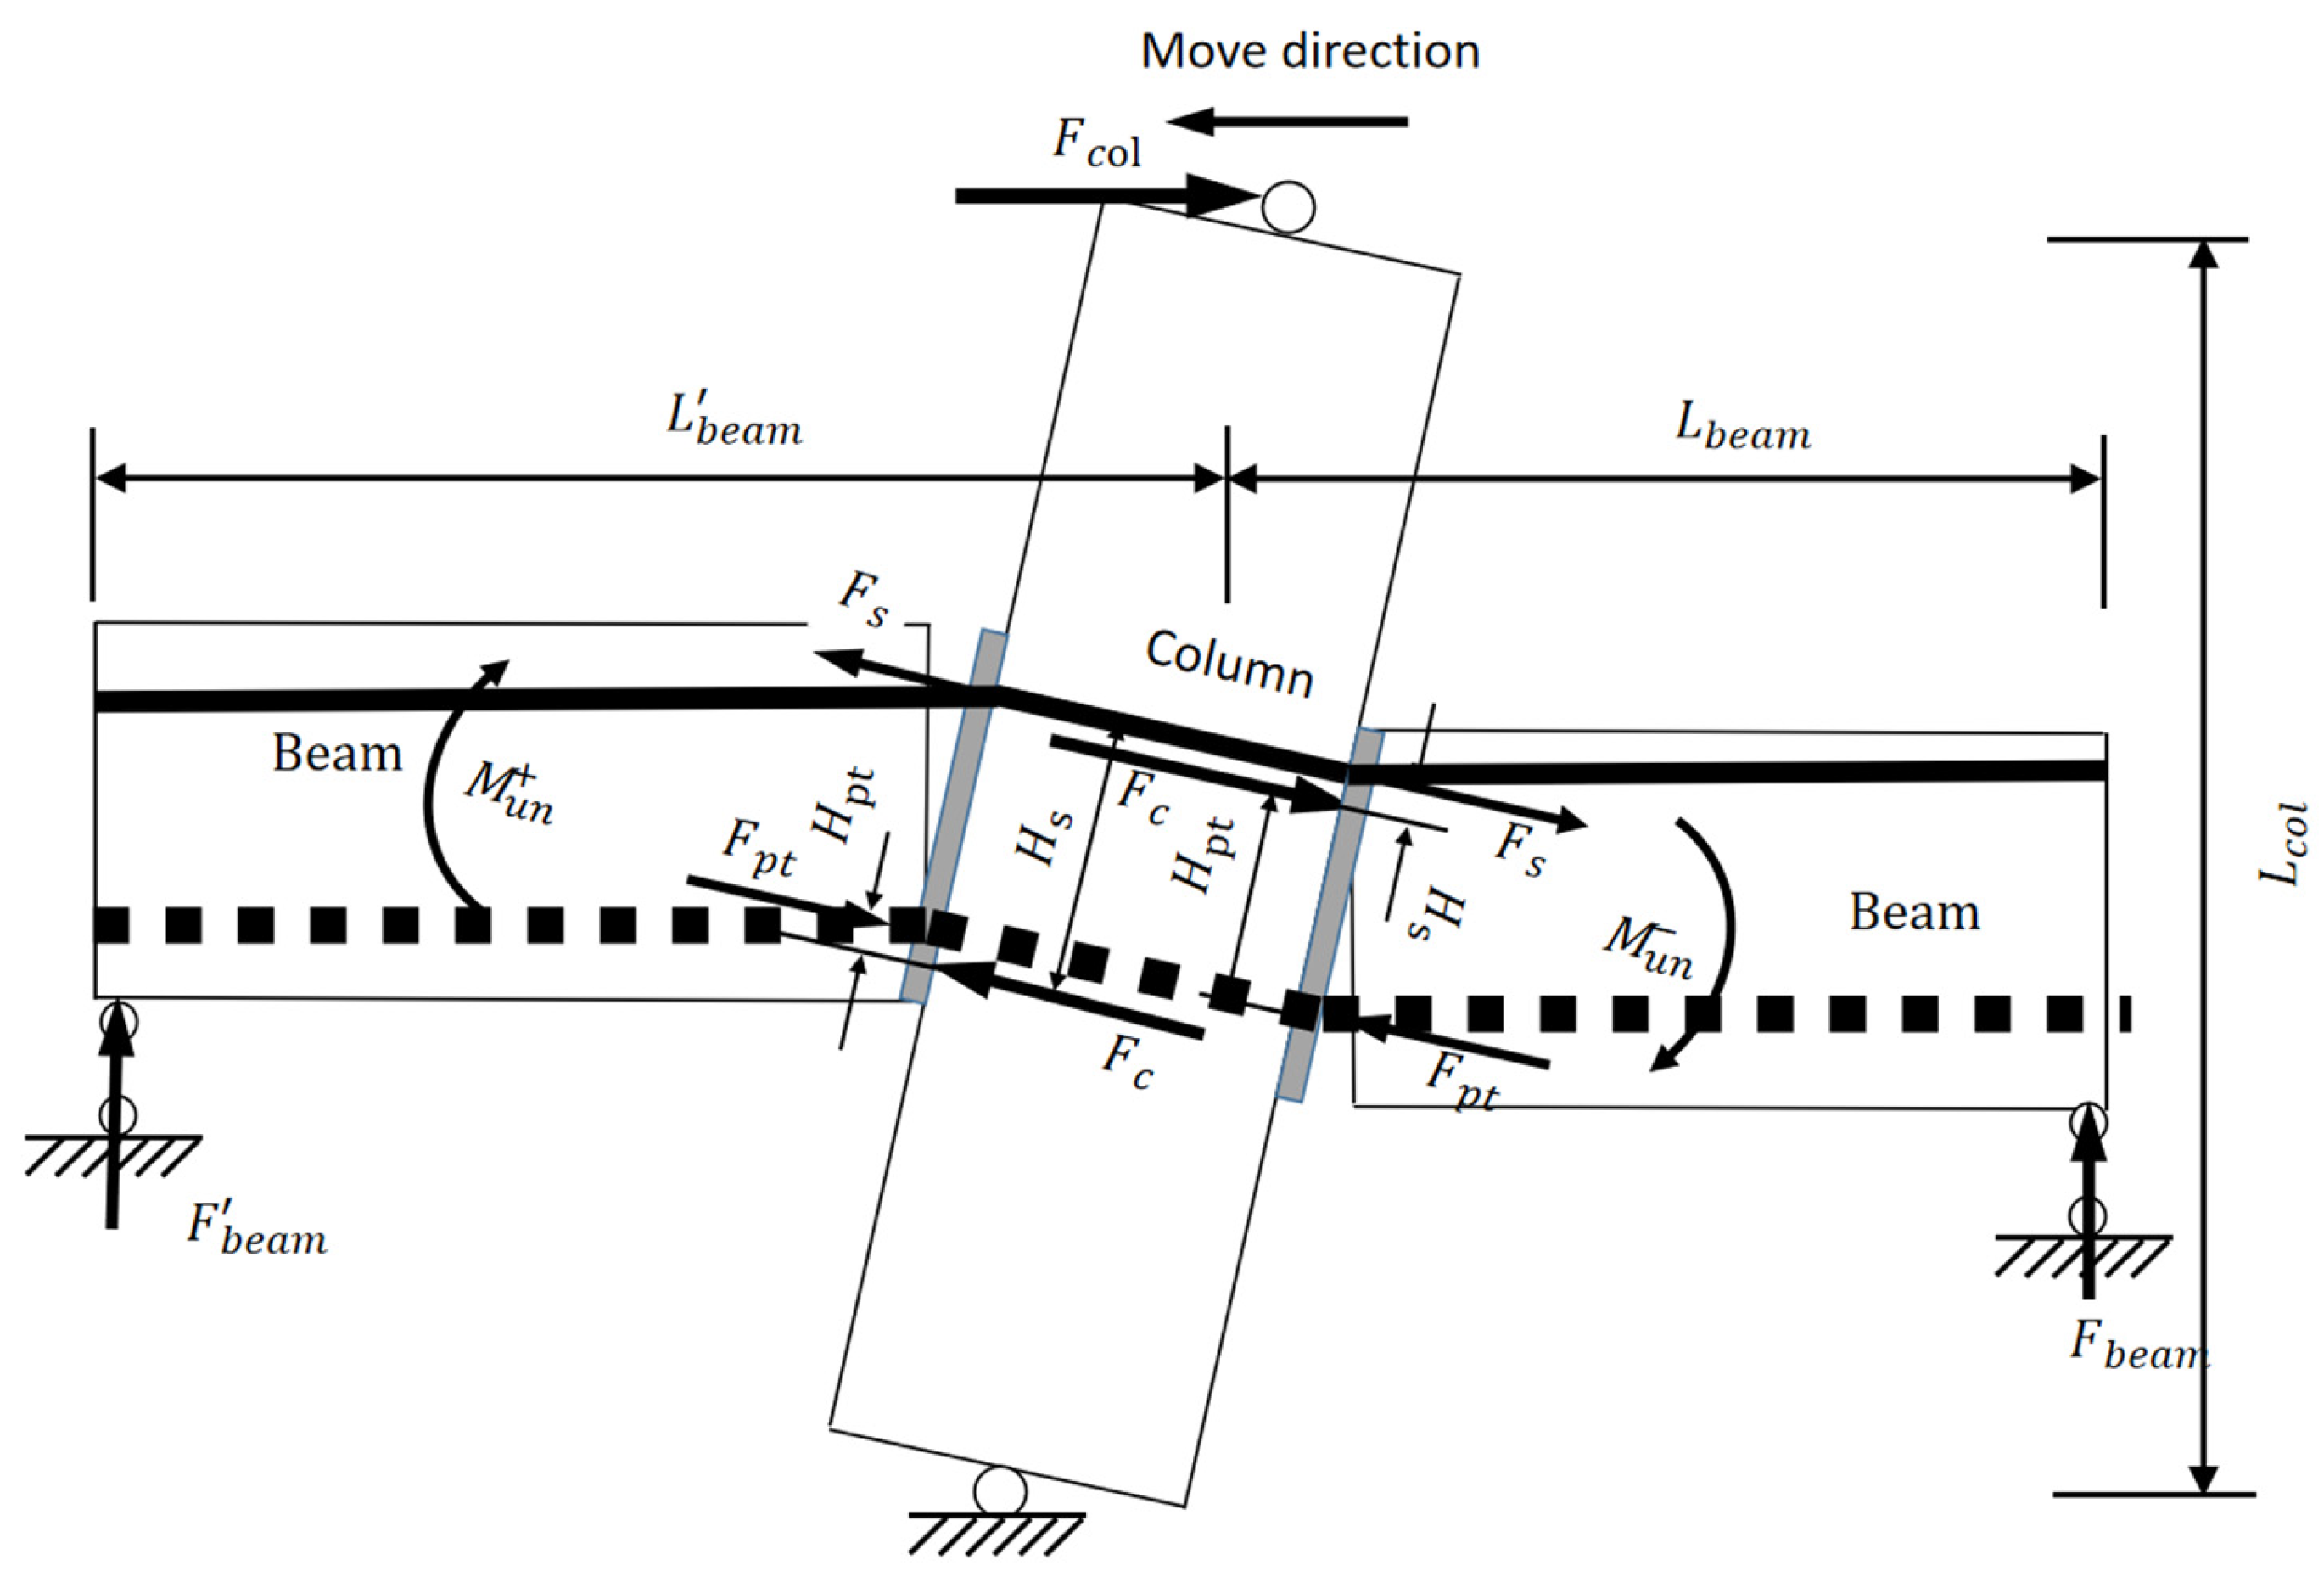
. Regarding the asymmetric connection investigated in the present study, given that the energy-dissipating steel bars are arranged in the upper part of the section, it is difficult to maintain self-centering performance under positive loading (enforcing self-centering performance may lead to an insufficient area of energy-dissipating steel bars and the inadequate energy dissipation capacity of the connection). However, under negative loading, the structure has a stronger self-centering ability. We argue that the self-centering performance of the connection should be considered by integrating both positive and negative loading. Based on the above analysis, this paper defines the self-centering performance of the studied connection in the following manner: After applying a load in the positive direction at the top of the column of the beam–column interior connection (with the loading point moving horizontally to the right), during the unloading process (in which the loading point moves horizontally to the left) until reaching the equilibrium position, the loading force remains positive at all time points (as shown in
Figure 11, the self-centering force analysis diagram;
).
Given that the external bending moment (with the counterclockwise direction being regarded as positive) is in the opposite direction to the internal bending moment generated by the reinforcement, the following applies:
The hysteresis curve of the bending moment induced by the horizontal force at the column top is presented in
Figure 12.
It can be seen in
Figure 12 that although the reinforcement in the connection is not symmetrical, the combined bending moment of the connection exhibits a symmetrical distribution. Evidently, when
, it guarantees that there is no residual deformation when the external load on the connection is unloaded to zero. By substituting the previous expression, we can obtain the relationship between the ultimate tensile force of the mild steel and the pre-tension force of the prestressed tendon as follows:
During the forward loading process, when the contact surface is unloaded to the state corresponding to Point 6 in
Figure 2, the yield stress of the reinforcement attains a value of
. During the reverse loading process, when the contact surface is unloaded to the state corresponding to Point 6 in
Figure 2, the stress of the prestressed tendon becomes
.
Subsequently, we can derive the following:
Based on Equation (40), it can be inferred that for the connection to possess the self-centering performance, the pre-tension force of the structural prestressed tendons should be greater than the yield tensile force of the energy-dissipating reinforcement. Considering that the strength of the energy-dissipating reinforcement increases after yielding, it is advisable to adopt in practical design to ensure the self-centering performance of the connection.
6. Experimental Verification
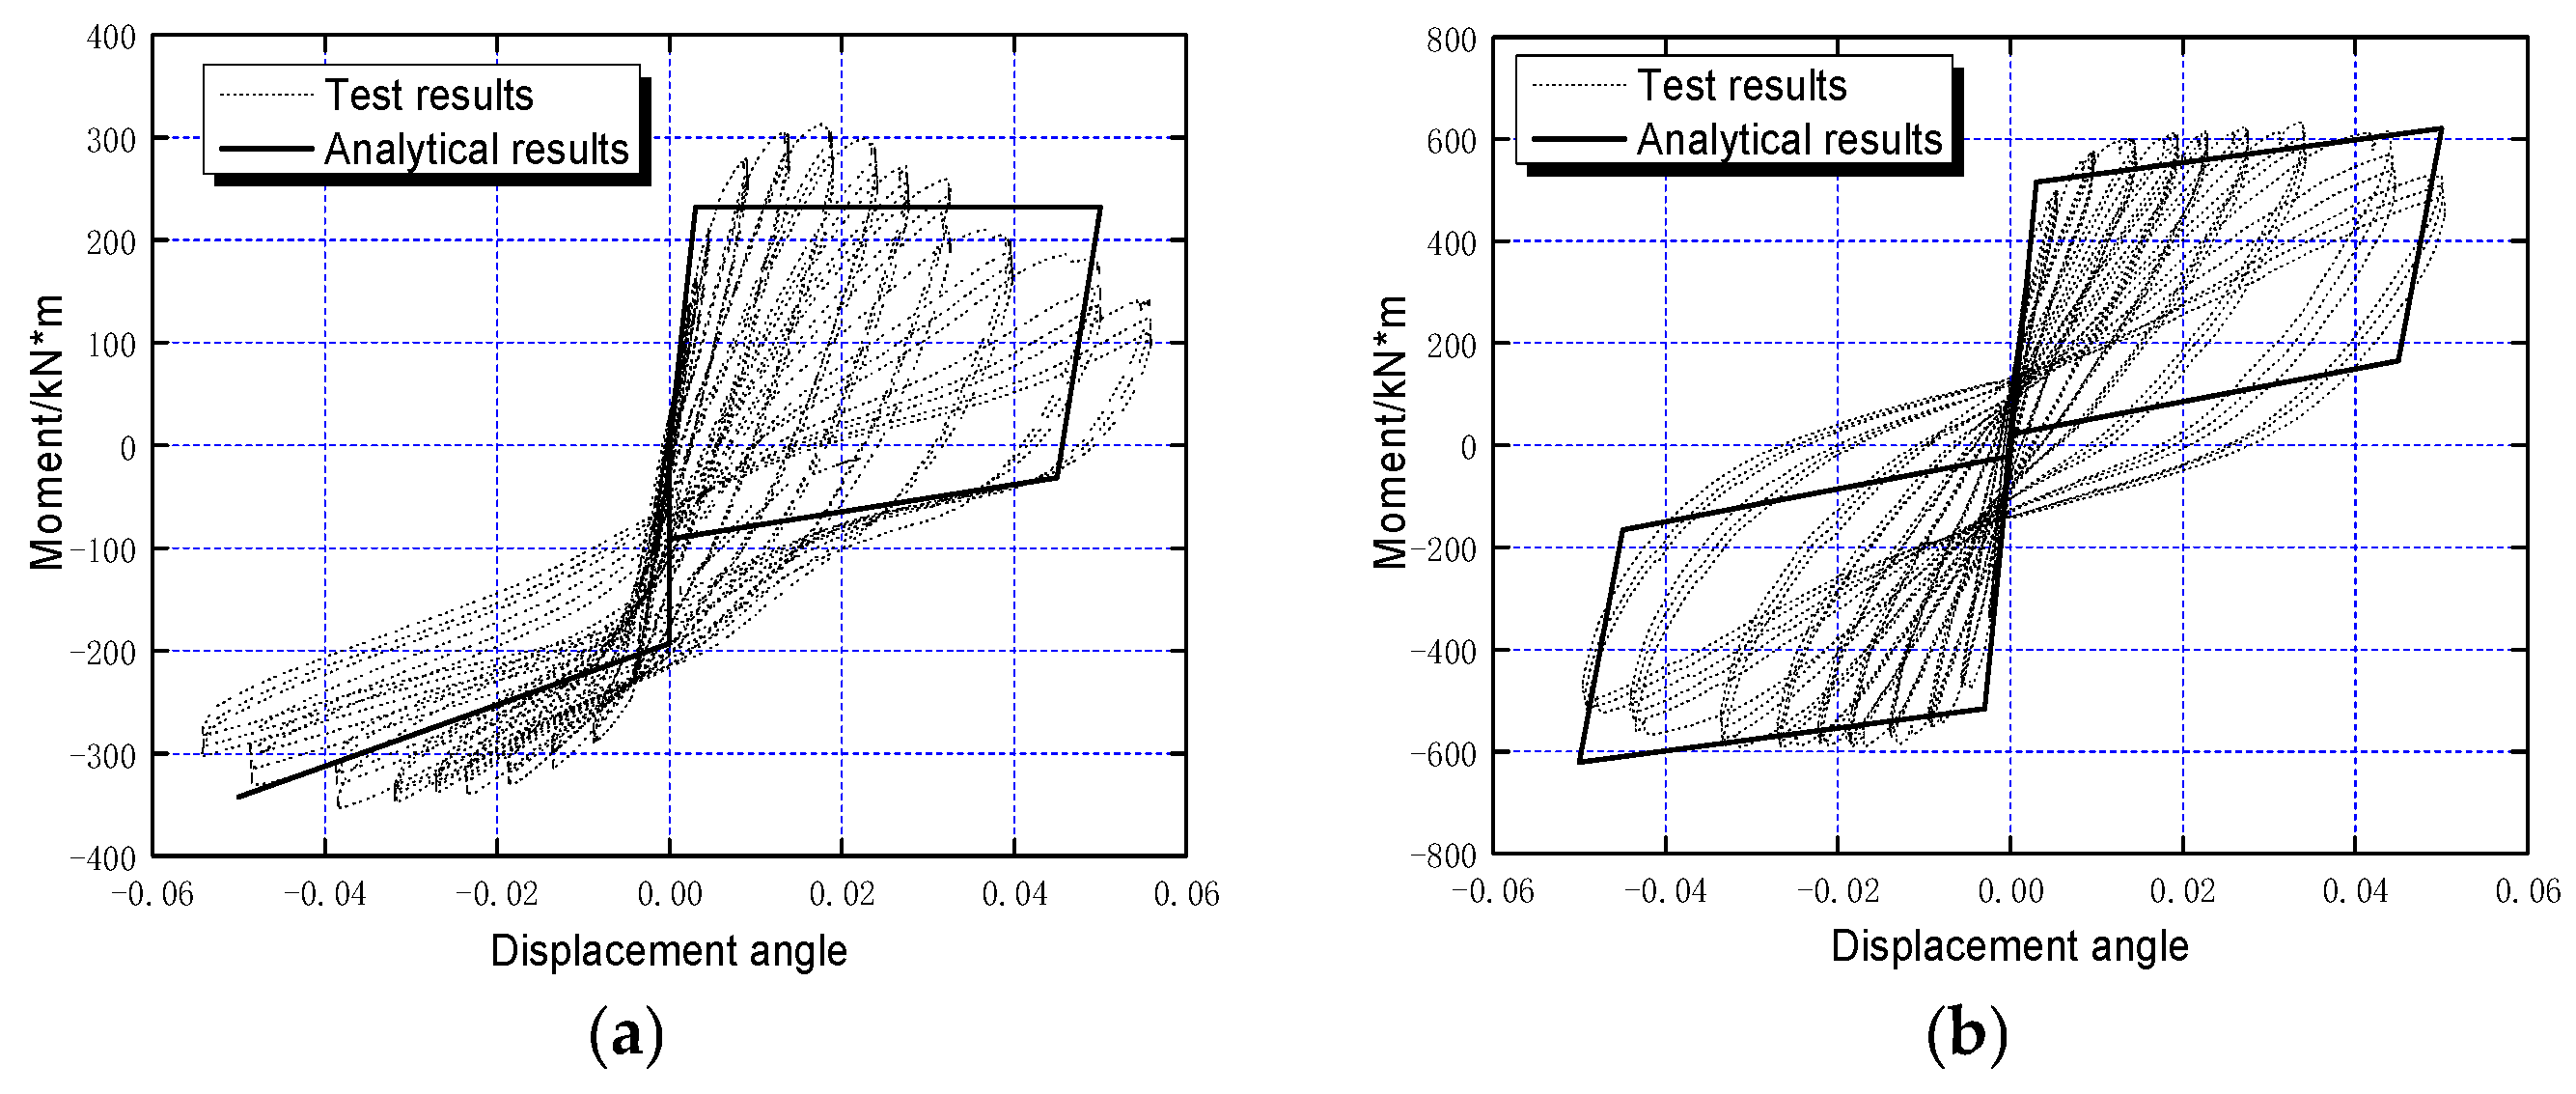
An experimental study of the connection studied in this paper was undertaken at Tsinghua University [
10], with the experimental components consisting of unbonded in-column and unbonded out-of-column frame center connections and edge connections. Two of the test connections are theoretically analyzed in this paper. As depicted in
Figure 13, the results of the theoretical model in this paper are compared with the test results.
As can be seen in
Figure 13, for the side-connection, under positive loading, the stiffness error is 8% and the yield bending moment error is 15.7%; under negative loading, the yield bending moment error is 10.6%. For the middle-connection, under positive loading, the stiffness error is 7.8% and the yield bending moment error is 4.6%; under negative loading, the initial stiffness error is 6.2% and the yield bending moment error is 3.5%. The comparison between the theoretical analysis results and the test results reveals that the analytical results of the mid-connection specimen are in better agreement with the test results. Specifically, the calculations regarding the initial stiffness, yield moment, and ultimate bending moment of the connection are also in better alignment with the test results; however, there are evident differences between the analytical results of the side connection specimen and the test results. The principal factor responsible for this difference is the fact that shear reinforcement [
9] is incorporated into the side connection specimens. These shear reinforcements chiefly function to bear the shear force of the connection. Furthermore, they are also able to bear a larger tensile force, thereby contributing to an increase in the flexural capacity of the section. As the model in this paper neglects the impact of these shear reinforcements, it gives rise to the differences between the calculation results and the test results.
7. Conclusions
In this paper, the principal mechanical properties of a new post-tensioned, unbonded, prestressed beam–column connection have been theoretically analyzed. These properties mainly encompass the M-θ hysteresis curve and energy dissipation capacity. The key findings are presented as follows:
(1) Under cyclic loading conditions, the M-θ relationship of the contact surface at the beam end can be approximated to present an asymmetric double-flag shape. The expressions for the key points of the beam-end moment–rotation hysteresis curve, which include the cracking point, the yielding point, the damage point, and the unloading point, were derived. Consequently, a complete theoretical analysis curve of the M-θ was established.
(2) The calculation formula for the energy dissipation coefficient of the connection was derived, and parametric analysis was conducted. The results demonstrated that as the area of energy dissipation reinforcement increases, the energy dissipation capacity of the connection is enhanced. When the yield tension of the energy dissipation reinforcement equals the pre-tension of the prestressing tendons, the energy consumption coefficient is approximately 0.5.
(3) The connection studied is an asymmetrically reinforced connection. As concerns this kind of connection, we present an evaluation method for self-centering performance, which takes into account the bending moments on both sides of the connection and derives the necessary reinforcement conditions to enable it to meet the self-centering requirements. The results of this study reveal that when the yield tension of the energy dissipation reinforcement is less than the pre-tension of the prestressing tendon, the connection can meet the self-centering performance requirements. Taking into account the post-yield strength enhancement of the energy dissipation reinforcement, it is advisable to ensure the self-centering performance of the connection by setting the yield tension of the reinforcement to be less than or equal to 0.9 times the pre-tension of the prestressing tendon.
(4) A comparison between the calculation results of this model and the test results indicates that the analysis results of this model, including the initial stiffness, yield moment, and ultimate bending moment, are in good agreement with the test results.

