Article

Achieving Optimum Compressive Strength for Geopolymers Manufactured at Both Low and High Si:Al Values

1
Future Battery Industries Cooperative Research Centre, The Hub Technology Park, Perth, WA 6102, Australia
2
John de Laeter Research Centre, Curtin University, Perth, WA 6845, Australia
*
Author to whom correspondence should be addressed.
Buildings 2025, 15(16), 2822; https://doi.org/10.3390/buildings15162822
Submission received: 3 July 2025 / Revised: 23 July 2025 / Accepted: 3 August 2025 / Published: 8 August 2025

Abstract

Numerous researchers have successfully made alkali-activated material or geopolymer using fly ash, ground granulated blast furnace slag, or metakaolin, either individually or in combination. However, few researchers first determined the reactive Si:Al of their solid precursor and then used this information to develop a formulation with a specific targeted Si:Al for their alkali-activated material. Even if a targeted Si:Al is chosen, few researchers check if the actual Si:Al of the geopolymer matches the targeted values. Characterisation of the precursor, setting target Si:Al values for the geopolymer and verifying target Si:Al values are present in the geopolymer are all part of quality control and essential if high quality products are to be manufactured. Quality control is critical but does not provide the target Si:Al value. This work presents results from a range of geopolymers made with different Si:Al values using sodium aluminate, sodium hydroxide and sodium silicate, either by themselves or in combination. Results reveal, surprisingly, for samples tested, that compressive strength exhibits a maximum for samples with Si:Al less than and greater than the starting Si:Al of the precursor. A strength minimum was found to be present close to the starting Si:Al of the precursor and between the strength maxima. This new information extends the usability range of aluminosilicate precursors and at the same time, makes available a broader range of applications based on Si:Al. Selection of an optimum Si:Al for a geopolymer based on strength can only be made when first a complete spectrum of Si:Al ratios have been evaluated.

1. Introduction

Alkali-activated materials (AAMs), often called geopolymers, are produced when poorly ordered or X-ray amorphous aluminosilicates are activated by an aqueous alkali. The more common aluminosilicates are metakaolin [1,2,3,4,5,6], coal fired power station fly ash [7,8] and ground granulated blast furnace slag (GGBFS) [9,10,11,12]. After dissolution of the amorphous precursor, SiO4 and AlOH4 tetrahedra join to form a three-dimensional structure with cations such as Na+, providing charge balancing [13,14]. After setting and curing, the resultant geopolymer is X-ray amorphous, exhibiting several superior properties compared with Ordinary Portland Cement (OPC) such as lower equivalent CO2, and improved fire and acid resistance [15,16,17].
As a relatively new technology, geopolymer raises the hopes and expectations of individuals striving for industrial sustainability [18,19]. What better way to convert industrial and previously labelled wastes into industrial by-products for use as precursors to make a cement-like binder with many superior qualities than ordinary cement, while at the same time performing so with a lower carbon footprint and reduced cost [15]. While geopolymer can be manufactured from clays such as metakaolin, its key advantage arises when industrial by-products such as fly ash and slag are used as precursors with the concomitant advantages of reducing land required for waste repositories and lowering man-made generation of carbon dioxide [20,21,22].
Utilisation of waste-derived material is often treated with caution as there is often an unfounded expectation that the final product may be inferior to those made from virgin materials. This is generally not the case with geopolymer made from fly ash and/or slag. In fact, most geopolymers made from these precursors have vastly superior properties to ordinary cement products, including greater fire resistance [23,24], better acid resistance [25] and properties that can be tailored to specific applications [26,27,28,29,30,31].
So why do we not have more geopolymer products utilised in society? There are several reasons for this: The first is that as a relatively new technology, it must demonstrate to government regulators, engineers and architects that it is dependable and durable, and this takes time. The second reason is that organisations involved with the existing technology such as Ordinary Portland Cement products see geopolymer technology as disruptive. Another reason is that governments at both a national level and state level are cautious about introducing regulations proposing mandatory use of industry residue [32]. Until this changes and performance-based selection is introduced extensively, utilisation of industry residues will not occur [33].
A commonly adopted approach in the manufacture of geopolymer is to start with measurement of the quantity of X-ray amorphous silicon and aluminium in the solid precursor and thus calculate its Si:Al ratio [34,35,36]. This data can then be used to select the composition of the alkali required for a targeted Si:Al in the geopolymer. This is usually based on the assumption that all the available amorphous component is dissolved. In practice, complete dissolution of the amorphous component rarely occurs, resulting in a mismatch between the targeted Si:Al and actual Si:Al [36]. Nevertheless, this approach is the best way that is likely to be achieved when mixing a solid and liquid with the minimum water-to-solid ratio.
Williams et al. (2011) [37] conducted a thorough analysis of the amount of metakaolin that had reacted in forming geopolymer using two X-ray diffraction (XRD) methods, scanning electron microscopy (SEM) imaging and energy dispersive X-ray analysis (EDS). The authors were able to show good correlation between the techniques. The XRD methods were quicker to implement and analysed a larger information volume than the SEM/EDS techniques. However, all techniques were time consuming, preventing them from being adopted routinely. Longhi et al. (2019) [38] opted for a double dissolution process to separate water-soluble material followed by an acid dissolution step to extract the geopolymer, leaving unreacted metakaolin. As with the approach taken by Williams et al. (2011) [37], the Longhi et al. (2019) [38] method is very time consuming. Until a rapid method is found for identifying the amount and composition of geopolymer, future geopolymer formulation development and verification will be limited.
Once the amount and composition of the amorphous component in the precursor and specifically its Si:Al has been determined, a target Si:Al can be set for the geopolymer. This enables the composition of the alkali to be calculated. For instance, with metakaolin, the starting Si:Al is approximately one, and if aiming for a Si:Al of two in the geopolymer, then sodium silicate with appropriate modulus (SiO2: Na2O ratio) is selected to achieve the target value. In addition to setting a target Si:Al, there is also a requirement to select Na:Al of around one. This latter ratio provides Na+ ions for charge balancing of AlO4 tetrahedra [13]. Excess Na+ leads to unacceptable efflorescence [5]. Another constraint in developing an geopolymer formulation is the water/solids ratio or H:Si. Excess water leads to geopolymers with higher porosity, less dissolved precursor and poor mechanical properties such as compressive strength [39], while insufficient water leads to dry mixes with low workability that are difficult to place in moulds. In practice, fly ash-based geopolymer requires less water than metakaolin-based geopolymer due largely to different particle morphology [40].
An example of formulation development and the resultant impact on strength is provided in Table 1, where fly ash and metakaolin with different starting Si:Al but similar product target values of Si:Al and Na:Al are selected. In this paper, mix ratios are presented as molar ratios of the amorphous component. For metakaolin, the alkali used was a combination of sodium hydroxide and sodium silicate, while for the fly ash, a combination of sodium hydroxide and sodium aluminate was used. The higher water demand for the metakaolin is very apparent, needing almost double that required for the fly ash. Another important observation for the fly ash was that the Si:Al of the whole sample, based on XRF, is 1.82 compared with a considerably higher value of 4.91 of the amorphous component. This large difference needs to be considered when developing a geopolymer formulation. Otherwise, targeted ratios and actual ratios will vary dramatically, leading to unpredictable properties.
The design formulations in Table 1 are a good starting point but do not reveal how the strength will vary if different target ratios are selected. Subaer and van Riessen (2007) [41] showed compressive strength variations for metakaolin-based geopolymer using different Si:Al and Na:Al. For Na:Al equal to 0.6 and 0.8, there was a clear strength maximum. Meanwhile for Na:Al of 1.0, the maximum Si:Al of 2.0 prevented observation of an anticipated drop in strength at Si:Al > 2. Rowles and O’Connor (2003) [36], using a metakaolin precursor, developed strength contour plots versus Na:Al and Si:Al. However, the Si:Al ratio was not extended below 1.0, preventing identification of a strength peak at lower Si:Al. The impact on strength by selecting Si:Al values with a greater range, and therefore with both lower and higher Si:Al, is not obvious and needs to be explored if a better understanding of geopolymer is to be achieved. The aim of the research presented in this paper is to investigate a wide range of Si:Al for fixed Na:Al for both metakaolin and fly ash-based geopolymer to ascertain the impact on strength.

2. Experimental Details

Two kaolin (WA Kaolin Ltd., Wikepin, Australia, K99 and Prestige kaolin, Sibelco, McIntyre, GA, USA) and four fly ash samples (Synergy Muja power station, sampled in 2022 and 2023 from the hopper, 2022 sample from the Muja containment dam and a historic sample from the Collie power station, also operated by Synergy) were selected for this experiment. The kaolin samples were calcined at 750 °C for 8 h to convert it to metakaolin. The fly ash samples were generated from burning subbituminous coal and sampled over several years.
X-ray fluorescence (XRF) was used to obtain the elemental composition (as oxides) of the samples and bulk Si:Al values (Table 2). The XRF and Loss on Ignition (LOI) were determined by a commercial laboratory (Intertek, Perth, Western Australia), using fusion beads, calibrated with relevant certified standards.
Quantitative XRD provided abundance of the crystalline phases and the amount of amorphous material (Table 3). It should be noted that for the fly ash samples, two quartz components have been modelled [37]: Quartz 1 was modelled with a large crystallite size and represents large quartz particles that are separate from the fly ash spheres. Quartz 2 was modelled with a small crystallite size and is present within fly ash spheres as exsolved quartz from the breakdown of kaolin into quartz and mullite during burning of coal [42]. The composition of the amorphous materials can be calculated by subtracting the elemental component of all the crystalline phases from the bulk XRF elemental data (Table 4).
Using the amorphous Si:Al values as a starting point, geopolymer formulations were developed with Si:Al target values both lower and higher than the solid precursor starting values. To enable comparisons between formulations, the Na:Al was set to 1.0, and the water content was set to 35 w/w% for the metakaolin samples and 18 w/w% for the fly ash samples. The NaOH (Rowe Scientific, Perth, Australia, ≥99 wt.%) was selected to provide a target Si:Al the same as the precursor starting value, while sodium aluminate (Coogee, Kwinana, Western Australia with Al2O3:Na2O = 0.745 and Sigma Adrich, Melbourne, Australia withAl2O3:Na2O = 1.33) was used to achieve lower target Si:Al values and sodium silicate (Coogee, H-grade, SiO2:Na2O = 2.32). Additionally, silica fume (Sigma Aldrich, 00 wt.%) was used to achieve higher target Si:Al values. The formulations used in this experiment were not selected for maximum strength but to enable ready comparisons between mixes.
The following mixing, casting and curing process was adopted:
The alkali activator was prepared following a controlled sequence where deionized water was first added to a mixing vessel, followed by the gradual addition of NaOH pellets. This process caused an exothermic reaction, leading to a rise in temperature, which peaked at Tmax. Once the temperature dropped to 90% of Tmax, sodium silicate or sodium aluminate was introduced. This moment was designated as Time = 0, and the activator was allowed to mix for 30 min before use [43]. If no additional water was used, NaOH was dissolved directly in the silicate or aluminate solution. The solid aluminosilicate precursor was then added to the liquid activator and mixed for 5 min in a planetary mixer (Spar, SP-800A). The resulting paste was placed in 25 mL polypropylene vials, followed with 30 s of vibration. The vials were sealed prior to being placed in an oven for curing at 70 °C for 21 h. After, the curing samples were demoulded, sealed in plastic bags and stored for 24 h. Approximately 48 h after, the mixing samples were tested for compressive strength based on ASTM C39 [44]. Fragments from the compressive strength test were used for XRD and SEM analysis.
For XRD analysis, both precursor and geopolymer samples were prepared similarly, except that geopolymer fragments were first ring-milled into a fine powder. The powders were then micronised in a McCrone mill with ethanol (8 mL of laboratory-grade) and corundum grinding media for 5 min. To facilitate quantitative XRD of the precursor samples, 11 wt.% corundum internal standard was added. The subsequent suspension was poured into a polypropylene dish, dried at 40 °C for 24 h and packed into a poly(methyl methacrylate) sample holder for XRD analysis. Details of the diffractometer and the operating parameters are provided in van Riessen et al. [1].
The amount of amorphous material and its composition were used to make geopolymers with a range of Si:Al values. This necessitated using either NaOH, NaOH + Na silicate and NaOH + Na aluminate to achieve the targeted range of Si:Al values (Table 5). Both the fly ash geopolymer systems and metakaolin systems were formulated with a Na:Al ratio of 1.0. The water content (H:Si ratio) was selected to ensure sufficient workability across the range of targeted Si:Al ratios.

3. Results and Discussion

3.1. Precursors

3.1.1. Particle Size Distribution

Figure 1 shows the particle size cumulative and differential percentages of the six precursors. The results show that the four fly ashes have a similar particle size distribution with a broad peak centred at approximately 20 µm. The broad range of particle sizes is made up of large quartz grains and carbon flakes at the large end (≥100 µm) with a wide spread of fly ash spheres right down to ≤1 µm. The two metakaolin samples were also found to be similar to each other, with MK2 having the finest fraction. Overall, the metakaolin samples exhibit a smaller size fraction than the fly ash samples. The combination of smaller particle size and platy morphology results in a higher water demand for the metakaolin precursors compared to the fly ash precursors.

3.1.2. X-Ray Diffraction

Figure 2 shows the XRD pattern of MK1 that exhibits the characteristic asymmetric amorphous hump at approximately 23° 2θ, with crystalline impurity phases shown by the sharp reflections superimposed on the background and amorphous hump. MK1 was found to have minor impurity phases of quartz and muscovite while MK2 has impurity phases of quartz and anatase (Table 2).
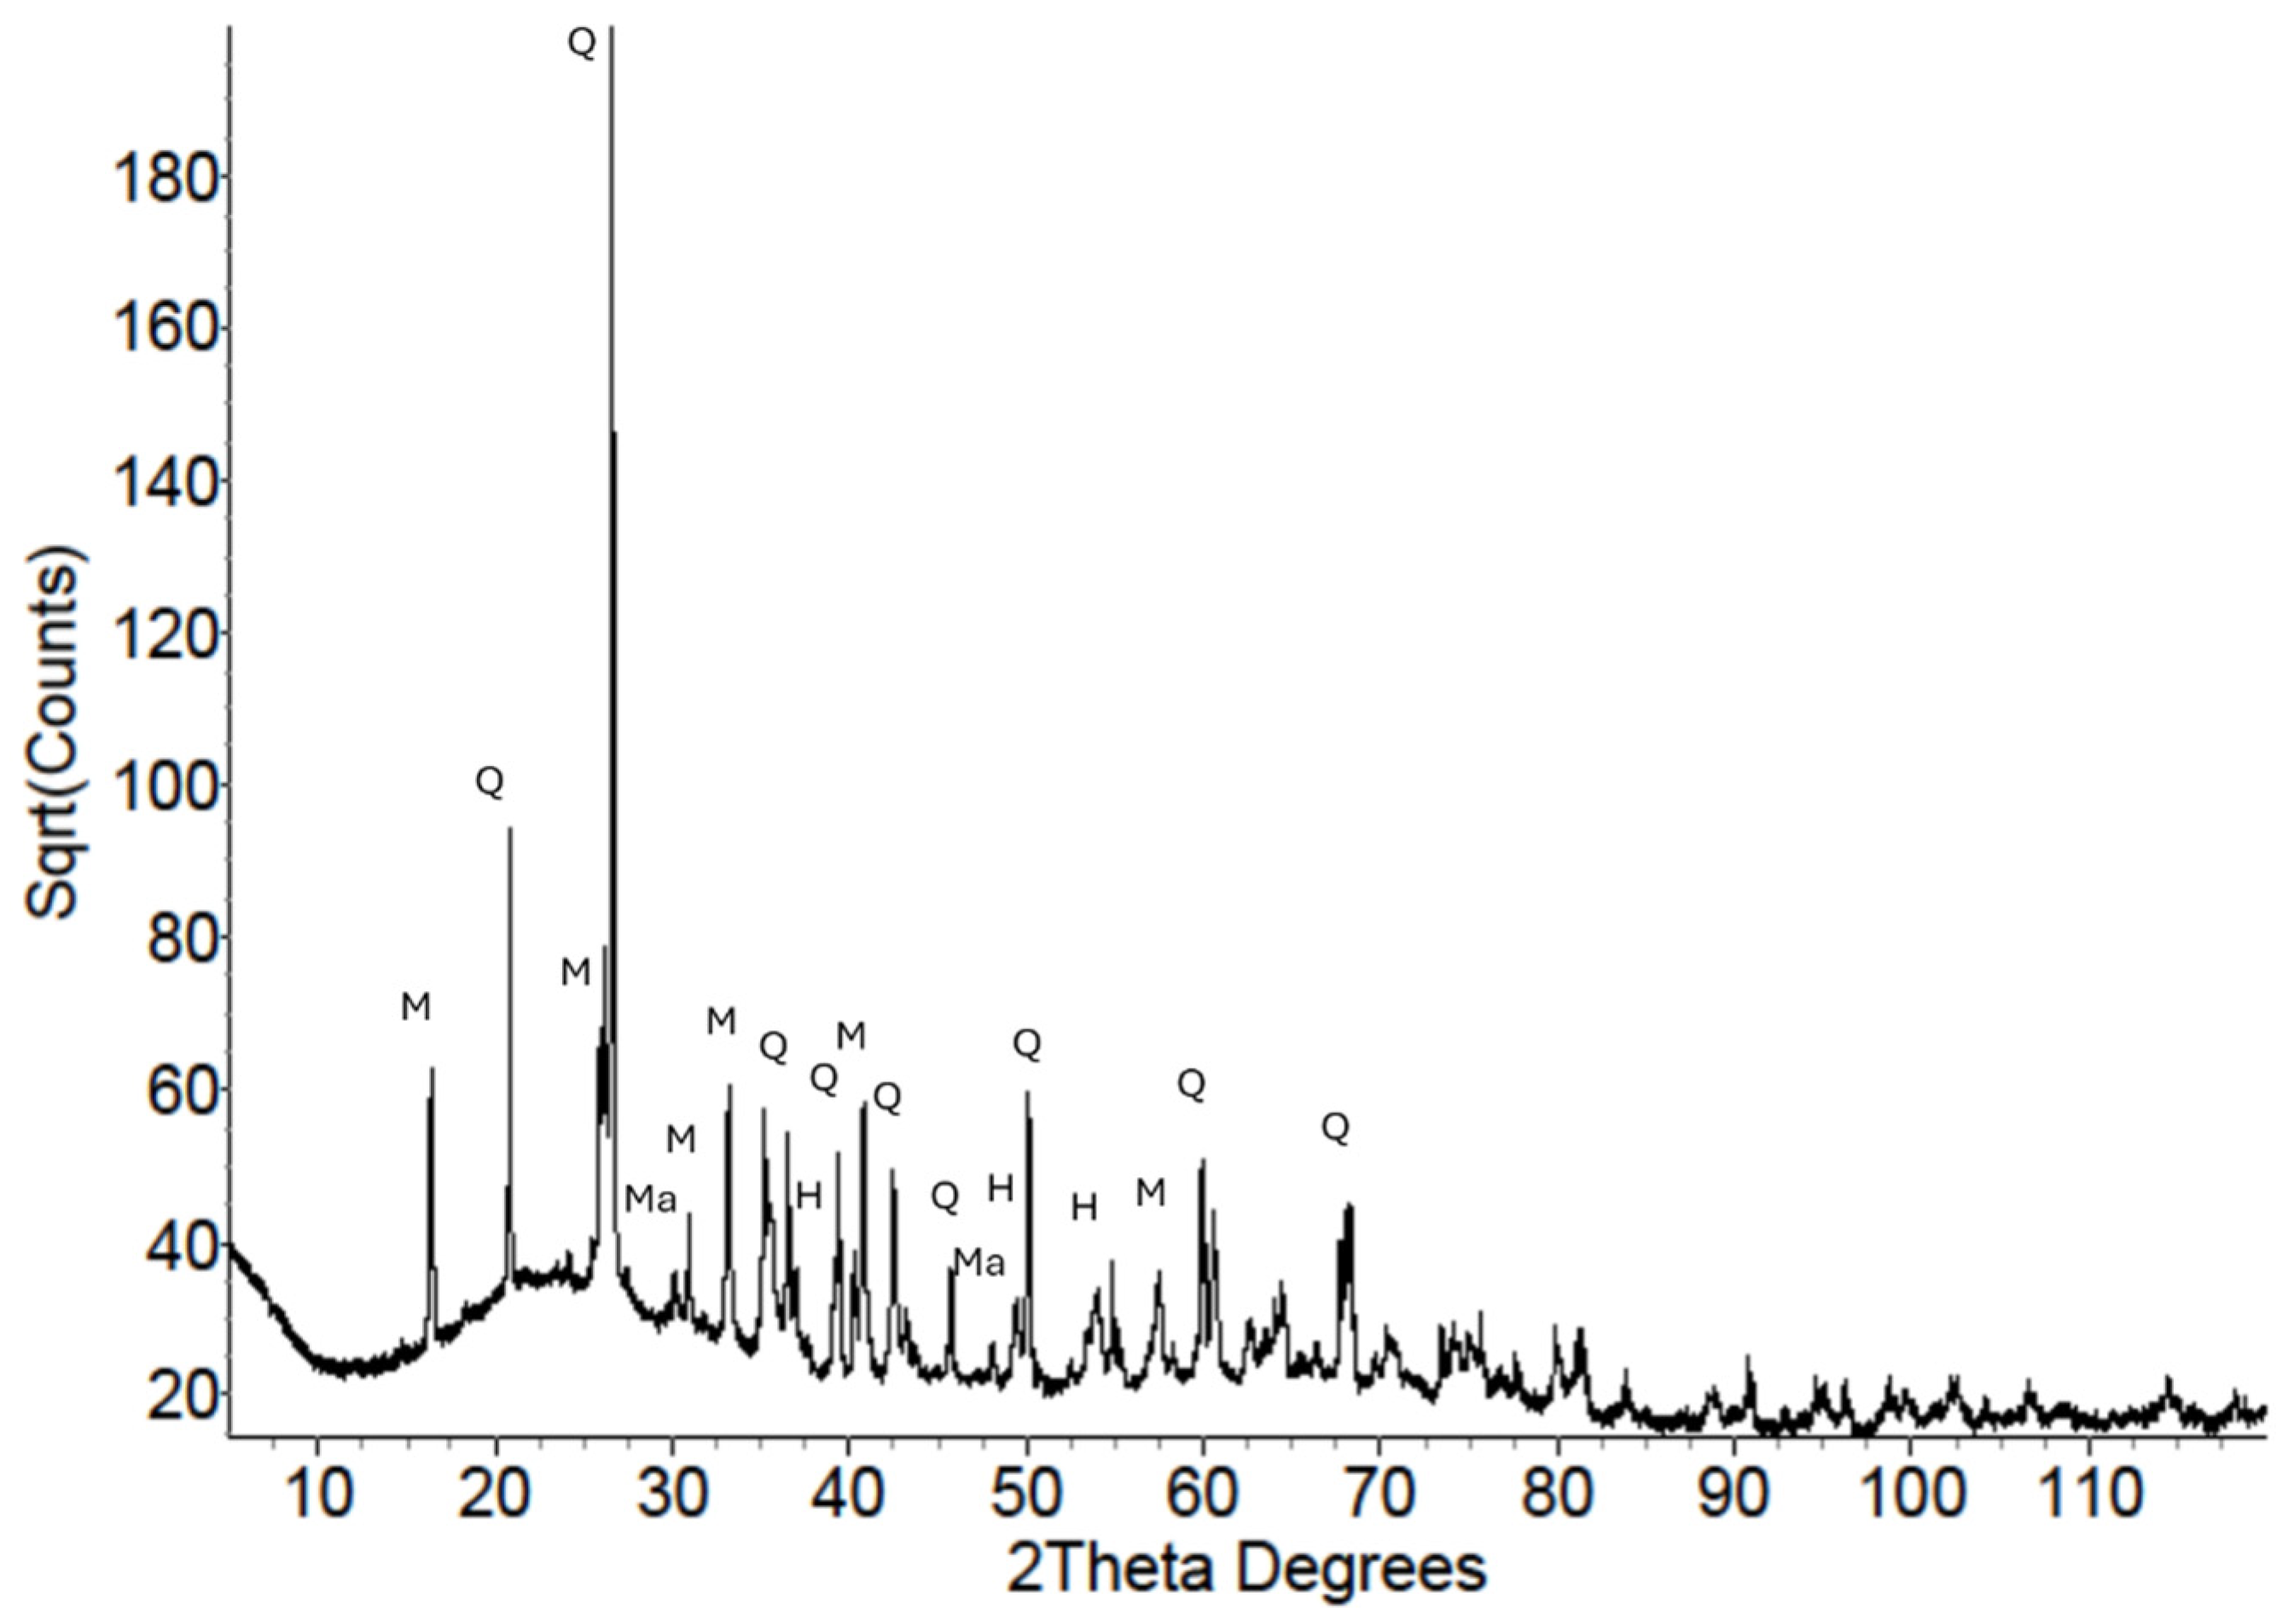
Figure 3 shows the XRD pattern of FA1. The amorphous hump is more subdued when compared with the MK2 sample, and there are many more crystalline reflections present arising from mullite, quartz, hematite and magnetite. The measured impurity phases in metakaolin amount to 2–4 wt.% compared to 48 wt.% for fly ash.

3.2. Geopolymers

3.2.1. X-Ray Diffraction

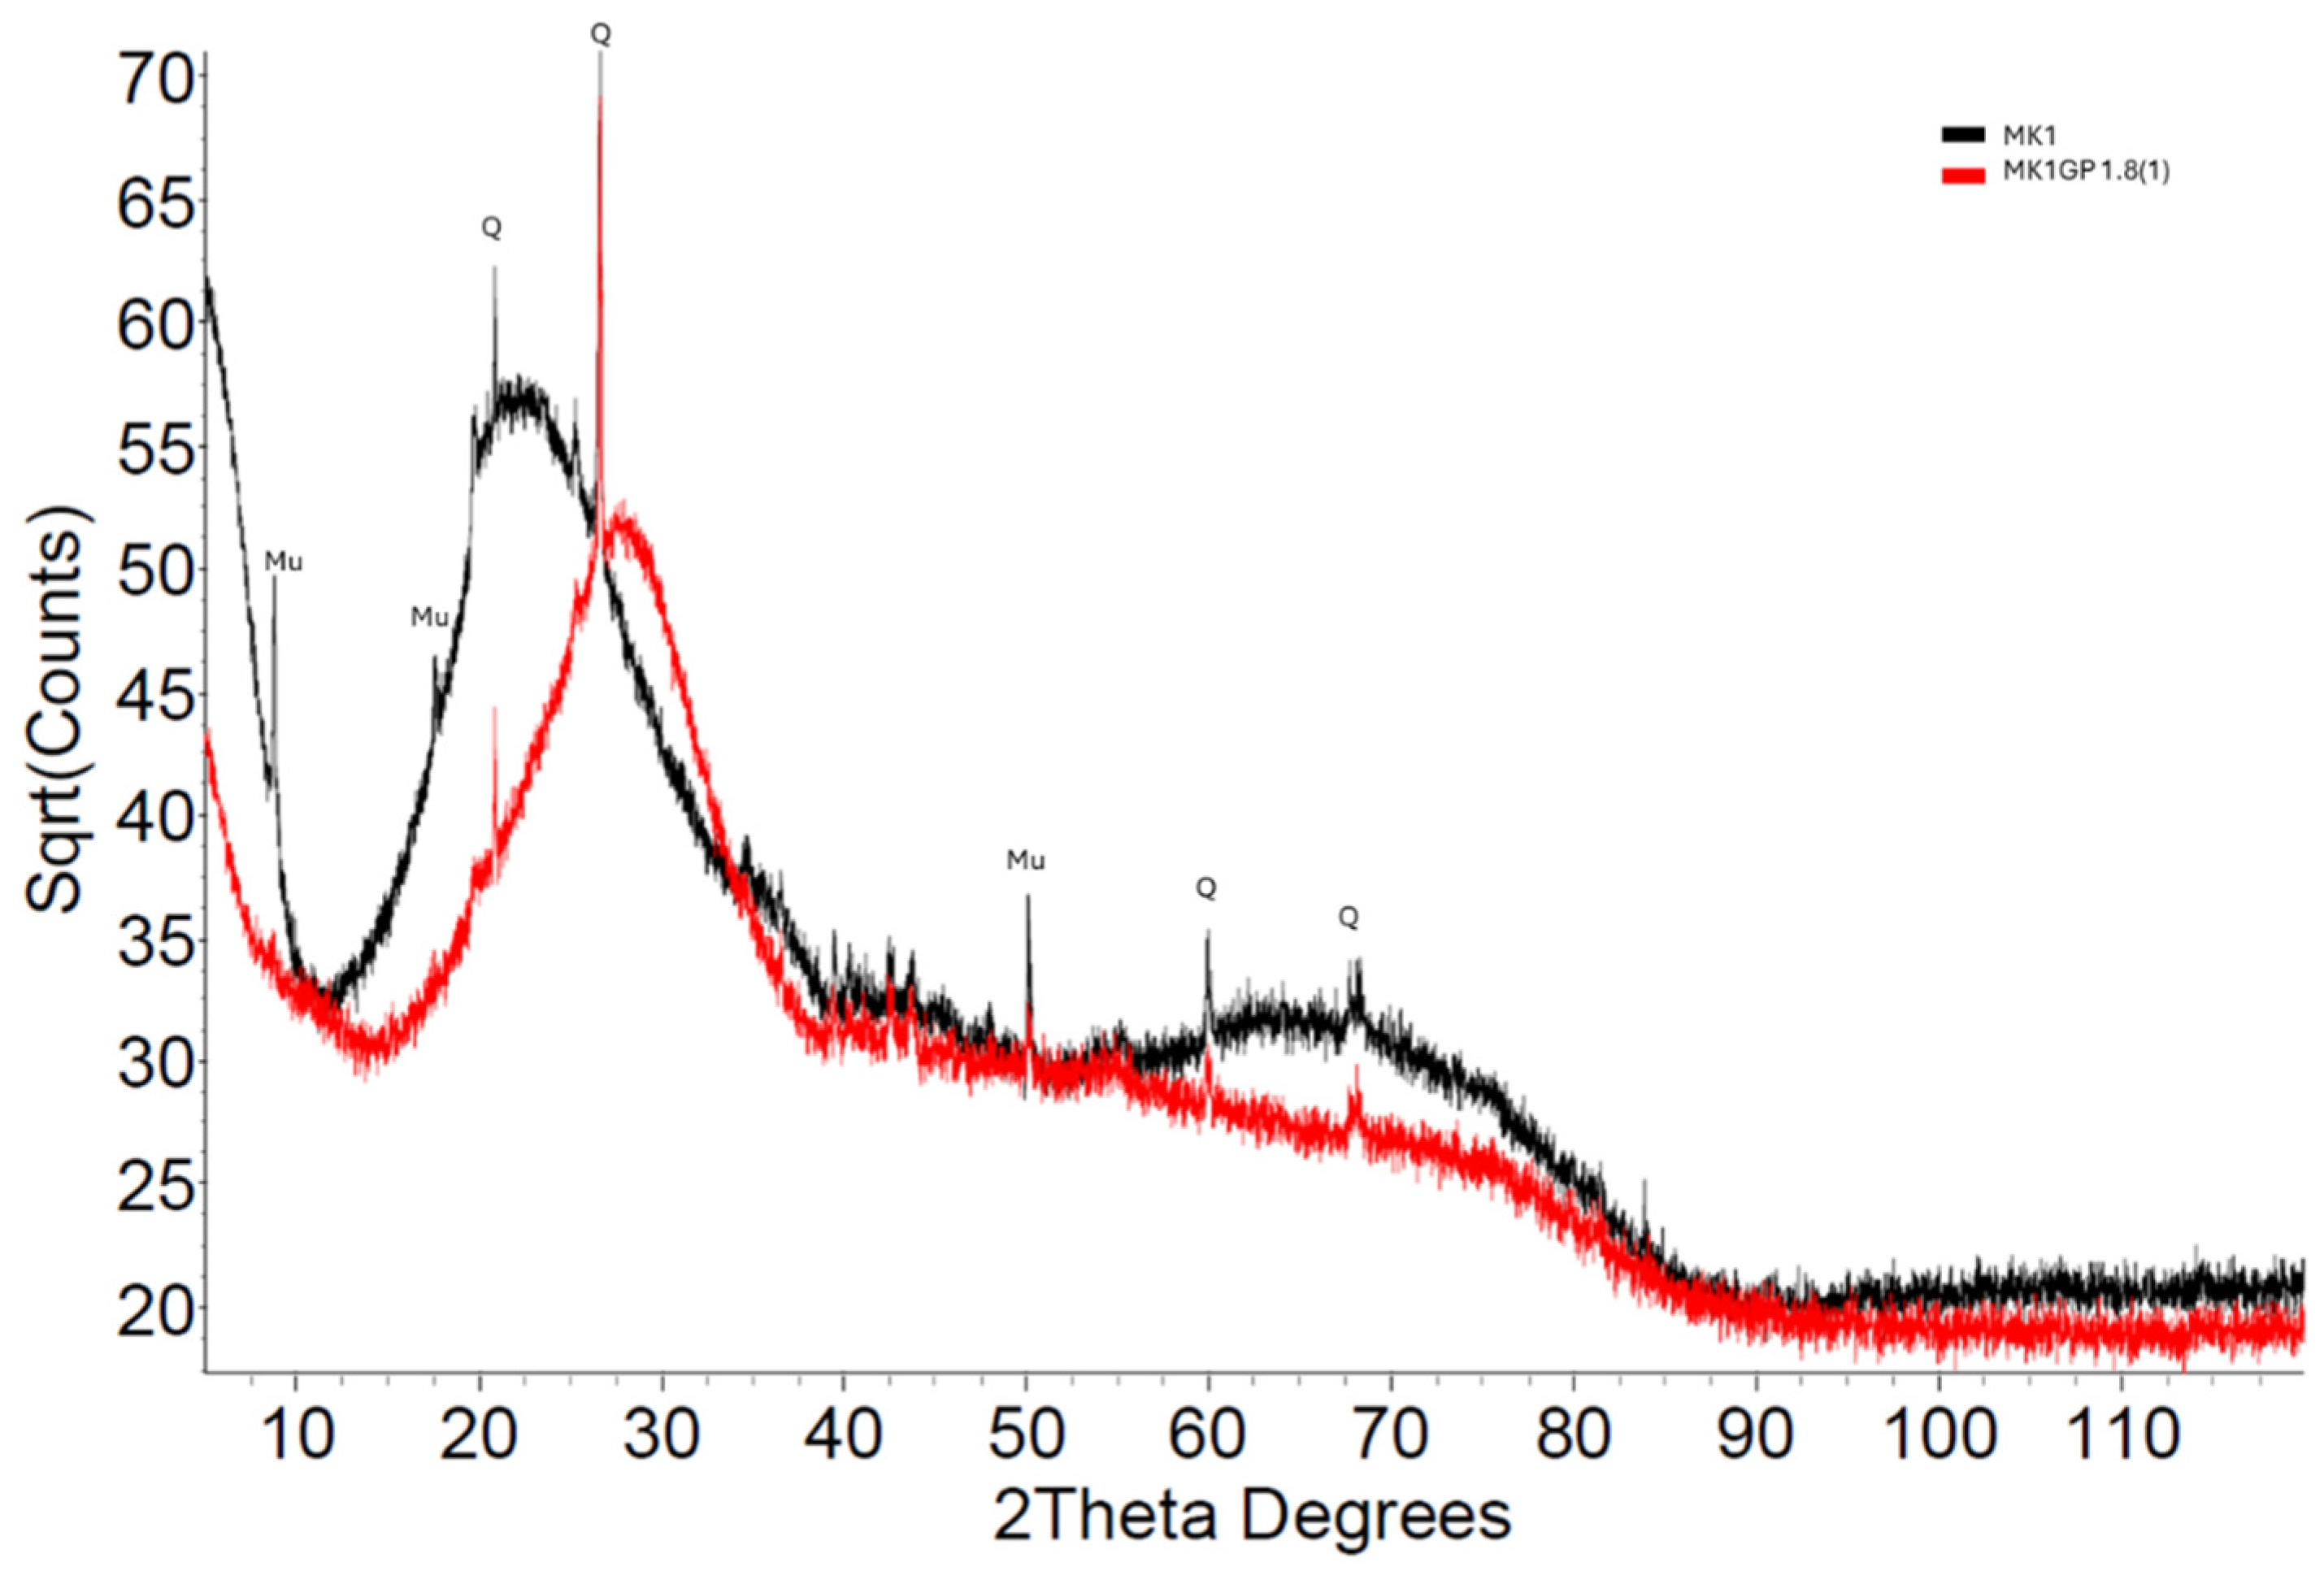
Figure 4 shows the XRD pattern of the MK1GP (Si:Al = 1.8 and Na:Al = 1) superimposed on the MK1 pattern. Of note is the obvious shift in the amorphous hump of MK1GP to higher 2θ relative to the amorphous hump position of MK1. This amorphous hump shift can be accurately measured and correlated with strength [1]. The muscovite and quartz impurities are present in both precursor and AAM as they have not played a role in the geopolymerisation process.
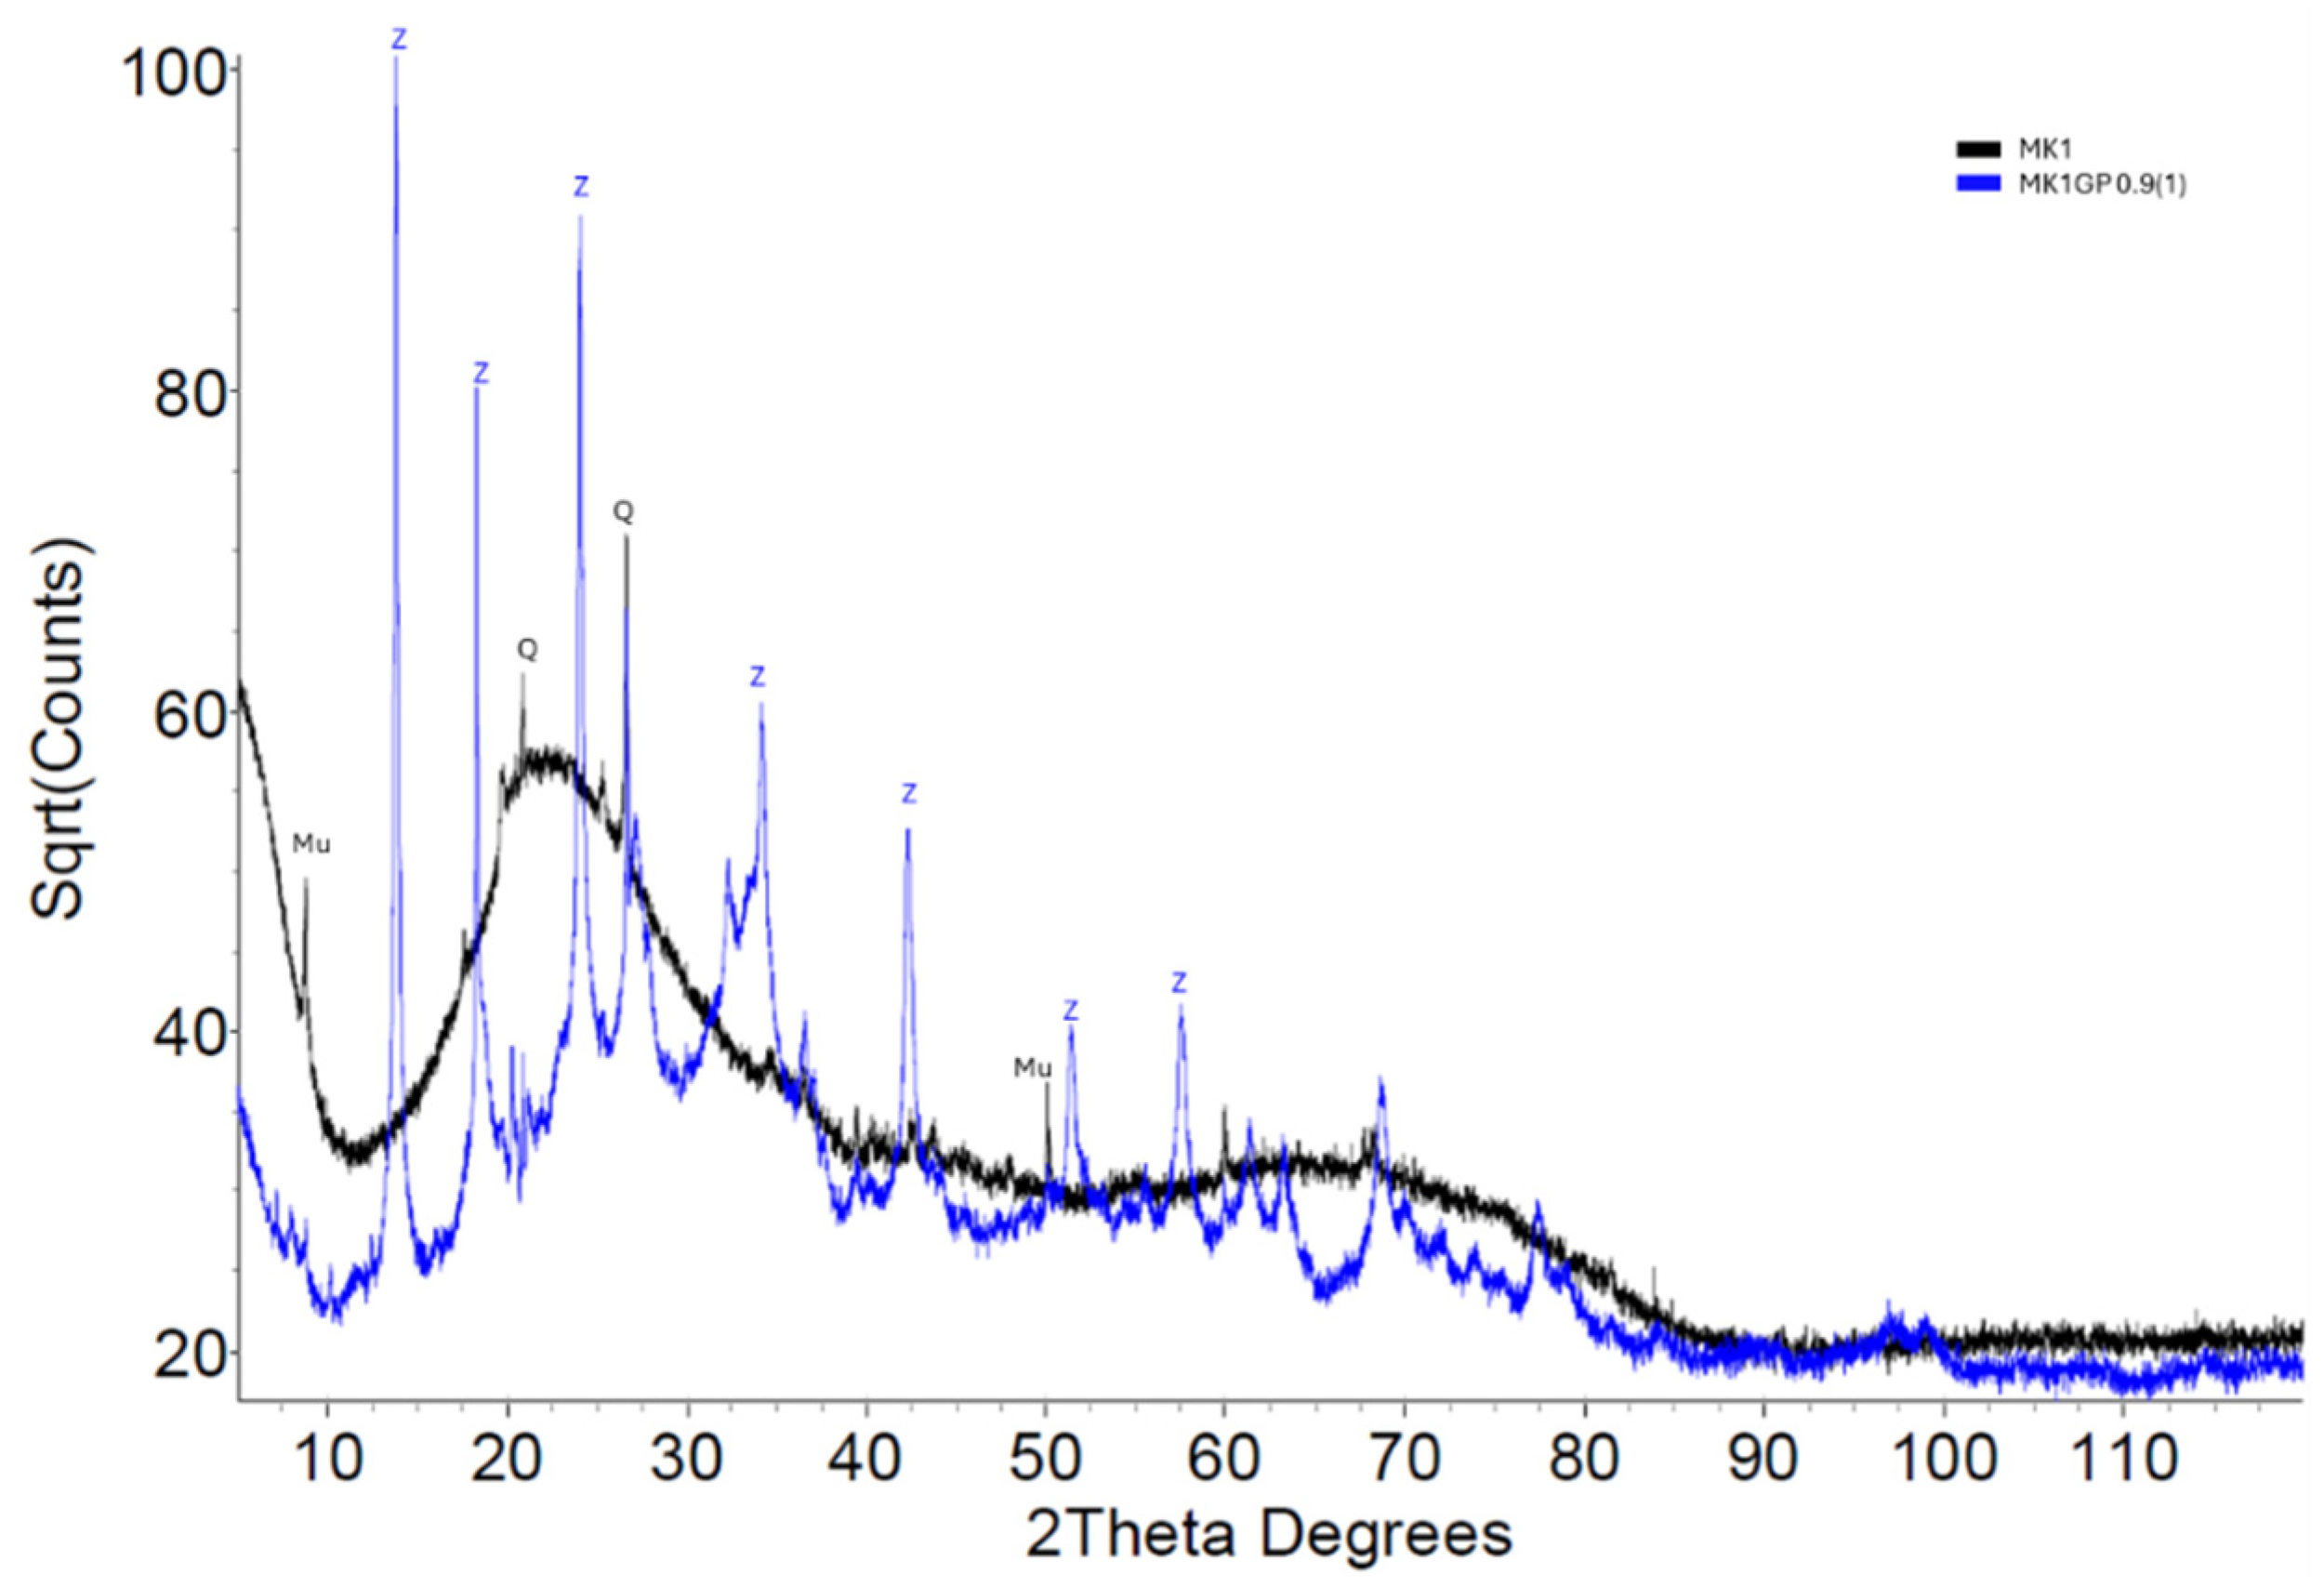
For MK1GP with Si:Al of 0.9 (Figure 5) and activated with an aluminate-based activator, zeolite A was identified, and MK1GP with Si:Al of 0.8, nosean and gibbsite was found to be present. Nosean is a member of the sodalite group and closely related to zeolite A. Zeolites are frequently found to be present in geopolymers with low Si:Al and elevated water content [45,46].
The XRD patterns of FA1 and FA1GP (Si:Al = 3.0, Na:Al = 1) are shown superimposed in Figure 6. A silicate-based activator was used with this precursor. As with the metakaolin geopolymer, the amorphous hump of the FA1GP is present at a higher 2θ than the amorphous hump of the FA1 precursor. And as expected, the crystalline phases in FA1 precursor are also present in the FA1GP.
The XRD patterns of FA1GP with Si:Al = 1.6 and activated with sodium aluminate are presented in Figure 7.

3.2.2. Compressive Strength

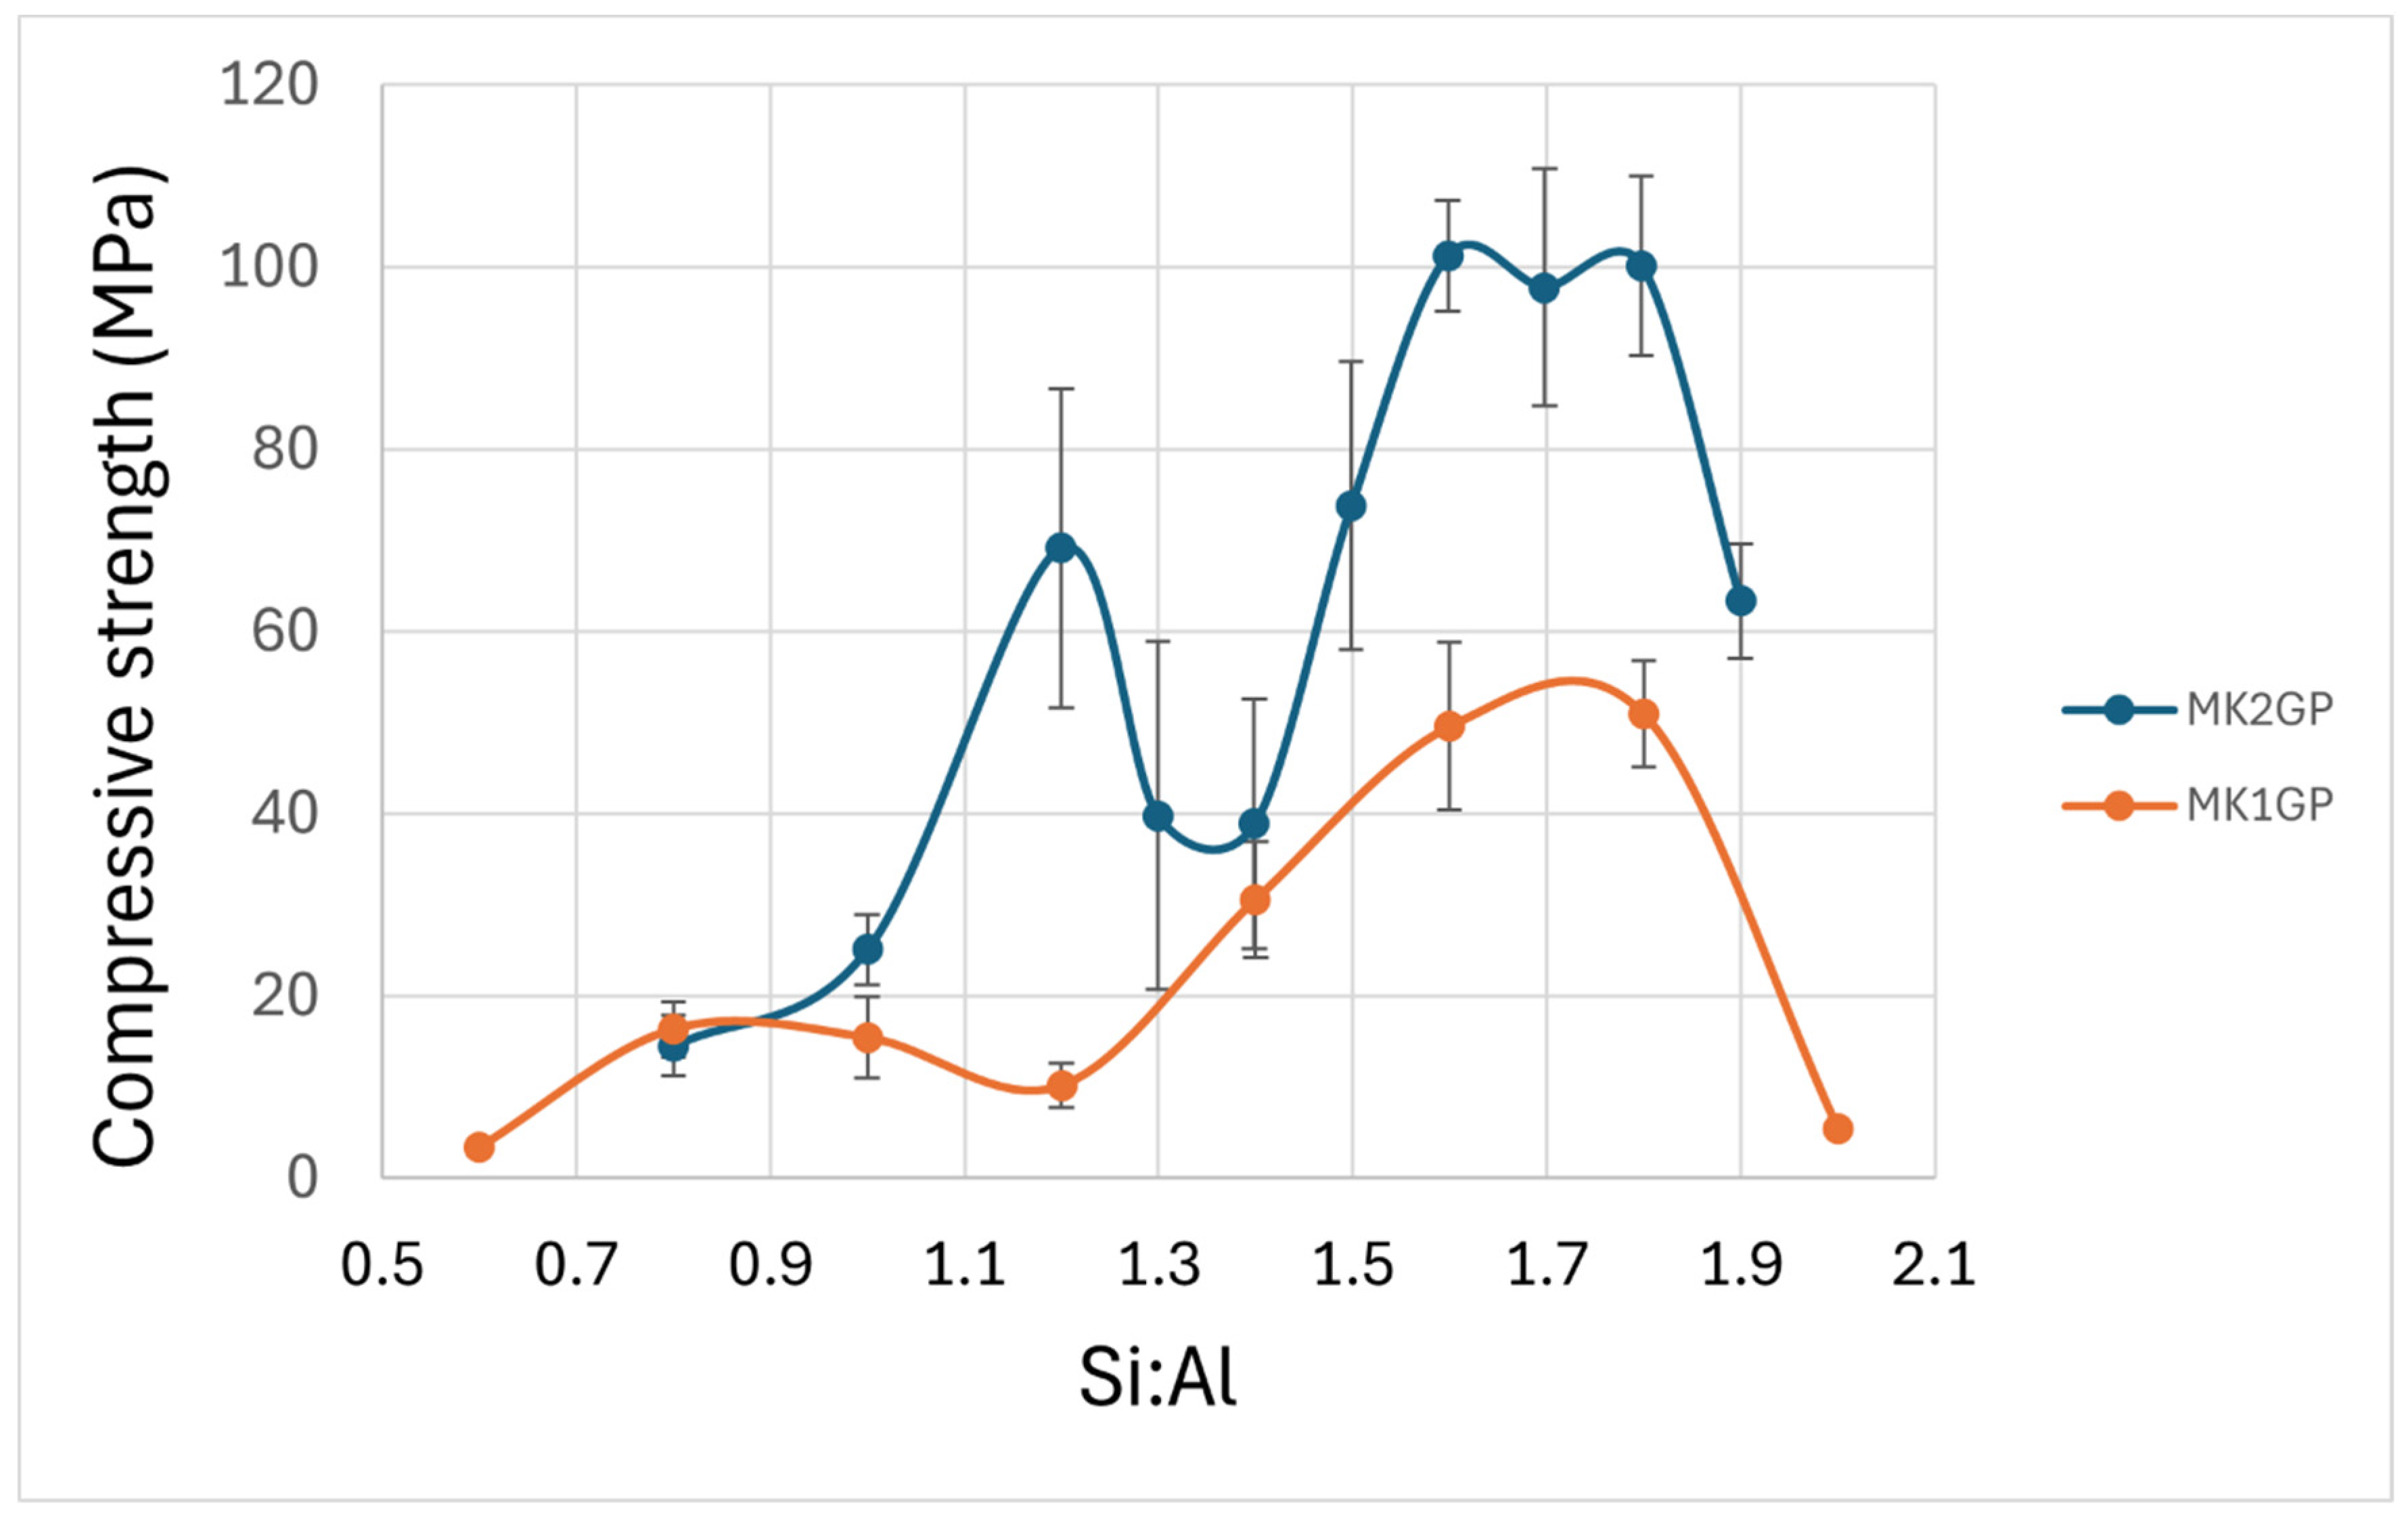
Figure 8 presents a summary of the compressive strength values obtained from geopolymers made from the two metakaolin-based precursors. It is evident that for each sample there are two strength peaks, classified here as peak-low and peak-high. The minimum in strength for each sample occurs around the original precursor Si:Al value and coincides with use of only NaOH as the activator.
A standout is MK2GP that achieves strength peaks after activation with NaOH + sodium silicate for both Si:Al of approximately 1.2 (69 MPa) and 1.6 (100 MPa), with a minimum for Si:Al of 1.4. Activation by NaOH is obviously not conducive to dissolution and subsequent condensation of the geopolymer only achieving 25 MPa. MK2GP also has peak-low and peak-high separated by a Si:Al of 0.4, which is a very narrow window in which strength properties vary dramatically. Poor quality control during sample preparation could result in samples achieving a much lower strength than anticipated. Although enough samples with different Si:Al have been made and tested to be confident of the trends discussed above, it should be noted that the uncertainties are large, indicating considerable variation in strength within each batch. MK2GP samples that achieved impressive strength values (~100 MPa) for Si:Al of 1.6, 1.7 and 1.8 all exhibited dense microstructures with minimal unreacted metakaolin precursor. Quantitative energy dispersive X-ray analysis on one of the MK2GP samples confirmed close alignment of the target Si:Al = 1.8 and measured Si:Al = 1.7(1), where the number in brackets represents twice the standard deviation. For MK1GP, the overall trend is like that of MK2GP but with a peak-low that exhibits very low strength.
Figure 9 shows the strength versus Si:Al for the fly ash-based geopolymers. FA2GP results are worthy of comment. With a precursor Si:Al of 2.95 activation with NaOH + sodium silicate is only able to make a weak geopolymer with 13 MPa strength. However, using NaOH + sodium silicate generates an acceptable sample with 35 MPa. The difference between Si:Al for peak-low and peak-high for FA2GP is a substantial value of 2. It is likely that many researchers working with this sample would have targeted a Si:Al of around 2.5 and achieved less than 10 MPa, declaring this fly precursor unacceptable. Yet a strength of 35 MPa by aluminate activation would result in a geopolymer with acceptable strength and potentially good fire resistance properties [16].
Samples made from FA1, FA2 and FA4 all exhibit similar trends with Si:Al for peak-high slightly higher than the precursor Si:Al. Distinct peak-low strength values for these samples are similar to peak-high strength values, creating more formulations with acceptable strength but different Si:Al for a greater variety of applications.
Table 6 shows peak-low Si:Al and associated maximum strength, as well as peak-high Si:Al and associated maximum strength. The Si:Al values that provide peak strengths for the suite of samples tested ranges from 0.8 to 3.5. This large range significantly expands the choice of formulations that can be used to produce geopolymers with acceptable strength. In addition, having a choice of both low and high Si:Al formulations provides more options to select a Si:Al to match specific geopolymer properties.

4. Discussion

Based on the compressive strength versus Si:Al data, the obvious conclusion is that NaOH by itself is far from ideal for dissolution of fly ash and metakaolin precursors and subsequent condensation of SiO4 and AlO4 tetrahedra into geopolymer. While increasing activator concentration generally accelerates the dissolution of aluminosilicate precursors by providing more hydroxide ions [47,48], excessively high [OH] can paradoxically hinder the overall process due to various “shielding effects” [49,50,51]. Rapid initial dissolution at the particle surface can lead to local supersaturation and the precipitation of initial reaction products (i.e., NASH gel) [52]. This can form a relatively dense, less permeable layer (coagulated structure) on the particle surface, physically shielding the unreacted core from further alkaline attack and effectively passivating the material [49,53]. Additionally, highly concentrated activator solutions exhibit significantly increased viscosity [53,54], which inherently impedes mass transport processes like diffusion [47,55,56]. Approaching the “gel point”, the diffusion of OH ions to the reactive surface can be slowed, as can the diffusion of dissolved silicate and aluminate species away from the surface [49,53]. This hindered transport is believed to contribute to local supersaturation and potential passivation, impacting overall dissolution kinetics [49,53,57,58]. The high ionic strength and associated cation adsorption might also electrostatically screen reactive sites [59]. These combined effects limit the access of hydroxide ions to the bulk precursor material, explaining why an optimal, rather than maximal, activator concentration often yields the most effective dissolution and subsequent geopolymerisation [49,50,51].
An alternative view is that the NaOH can dissolve the Si and Al from the precursor, but the low Si and Al concentration is not ideal to create geopolymer. There are studies that have successfully used NaOH to determine the reactive component of aluminosilicates in fly ash which suggest that the former view is not correct [60]. This leads to the conclusion that the activating alkali requires both the necessary pH for dissolution as well as a Si and/or Al to catalyse the condensation process. Adding soluble alkali silicates to the geopolymerisation process significantly speeds it up by influencing several key aspects. Firstly, the presence of soluble silica enhances the dissolution of the solid precursor material by continuously reacting with the released silicate and aluminate species, effectively pulling the dissolution equilibrium towards more dissolution [61,62,63]. This also prevents the unwanted precipitation of aluminium hydroxide, ensuring that aluminium remains available for the geopolymer network [64]. Soluble silica also allows for direct control over the final Si:Al ratio, which in turn affects the structure and properties of the resulting gel [65,66]. Finally, it greatly facilitates the nucleation and condensation stages by providing reactive silicon-containing species and acting as nucleation sites, thus lowering the energy barrier for the formation of the geopolymer gel and leading to faster setting and strength development [56,67].
Several papers have identified the need for an activator with a relatively high soluble silicate content to ensure the adequate dissolution of the precursor and subsequent condensation of geopolymer gel [52]). This understanding has been supported by observations where an increase in compressive strength occurs as Si:Al increases with a maximum occurring around Si:Al = 2 [16,41,68,69], using sodium silicate/sodium hydroxide to activate fly ashes with relatively low precursor amorphous Si:Al to achieve impressive compressive strengths, in some instances greater than 120 MPa. However, for fly ashes with higher amorphous Si:Al (~5–9), Rickard et al. (2012) [69] used sodium aluminate-based activator and only achieved modest compressive strength results. For both sodium silicate- and sodium aluminate-activated fly ashes, the target Si:Al was from 2 to 3. What is becoming obvious is that the research focus has been on achieving target Si:Al of the order of two, either by silicate- or aluminate-based activators. It may be because the aluminate-based activators did not result in high compressive strengths that less effort was expended on this activator. The results presented in this paper show that there is clearly an opportunity to explore a much wider Si:Al with the concomitant benefit of manufacturing geopolymers with specific properties such as fire resistance [16,69]. Based on the results presented in this paper, higher aluminate activators appear to have the same potential to dissolve aluminosilicate precursors as well as create the right environment for polycondensation.
Although the data presented is not able to reveal specific dissolution and subsequent condensation processes, it is evident that careful selection of Si:Al is essential in achieving targeted compressive strength values. In addition, the Si:Al in the final product needs to match the product application. The above comments need to be tempered by the fact that the targeted Si:Al is likely to be different from the actual Si:Al. Until a fast and accurate method becomes available to ascertain the actual Si:Al in an geopolymer, methods described by Williams et al. (2011) [37] can be used to verify both the extent of reaction of the precursor and the composition of the geopolymer binder, signalling a major step towards quality control and quality assurance systems.

5. Conclusions

In summary:
  • Four fly ash-based geopolymers and two metakaolin-based geopolymers with a wide range of Si:Al ratios have revealed a novel feature of dual compressive strength peaks.
  • In all cases investigated, the strength peaks of the geopolymers were present for Si:Al values greater and less than the Si:Al of the precursor aluminosilicate.
  • This new information considerably expands the dynamic Si:Al range of geopolymers.
  • In essence, a greater choice of product end use can now be considered: low Si:Al-based AAM for fire resistance or higher Si:Al-based geopolymer for structural applications.
  • What is particularly important is that precursors that might previously have been classified as unusable due to an unacceptably high Si:Al can be prepared as AAMs with target Si:Al of 3 or as low as 1.3.
  • Another key revelation is that between the two strength peaks, there is a valley where strength may be unacceptably low for targeted applications.
  • As this valley may be very narrow, a small miscalculation in targeted Si:Al may result in a very low strength geopolymer. Thus, sample preparation must be undertaken precisely to ensure that the optimum strength is attained.

6. Future Studies

The samples tested in this paper were all made with Na:Al = 1. It is recommended that this be duplicated for Na:Al values less and greater than 1. Previous work by Subaer and van Riessen [41] and Rowles and O’Connor [36] on metakaolin-based geopolymer revealed that increasing the Na:Al resulted in the strength maximum occurring at higher Si:Al. It is anticipated that repeating the work reported in this paper with different Na:Al will result in similar trends with dual strength peaks offset from those prepared with Na:Al = 1 and possibly extend the range of usable Si:Al of geopolymers even further.
As mentioned in the Experimental Details section, geopolymer formulations were not developed to achieve maximum strength, albeit the MK2GP achieved impressive strength values of approximately 100 MPa for Si:Al = 1.6–1.8. It is suggested that further work be conducted where a suite of samples are first optimised for maximum strength before comparing how strength varies with differing Si:Al values.

Author Contributions

A.v.R. and E.J. conceived and designed the experiment. Sample preparation was conducted by H.G., with software support from R.S., H.G. and J.A. who conducted characterisation. H.G. and R.S. analysed the X-ray data. All authors contributed to writing the paper. All authors have read and agreed to the published version of the manuscript.

Funding

This project was undertaken as part of the Process Legacy Project, with financial support from the Future Battery Industries Cooperative Research Centre, established under the Australian Government’s Cooperative Research Centres Program.

Data Availability Statement

The original contributions presented in this study are included in the article, and further inquiries can be directed to the corresponding author.

Conflicts of Interest

All authors were employed by the company Future Battery Industries Cooperative Research Centre. Authors declare that the research was conducted in the absence of any commercial or financial relationships that could be construed as a potential conflict of interest.

References

  1. van Riessen, A.; Jamieson, E.; Gildenhuys, H.; Skane, R.; Allery, J. Using XRD to Assess the Strength of Fly-Ash- and Metakaolin-Based Geopolymer. Materials 2025, 18, 2093. [Google Scholar] [CrossRef]
  2. Kim, B.; Lee, S. Review on characteristics of metakaolin-based geopolymer and fast setting. J. Korean Ceram. Soc. 2020, 57, 368–377. [Google Scholar] [CrossRef]
  3. Scherb, S.; Köberl, M.; Beuntner, N.; Thienel, K.-C.; Neubauer, J. Reactivity of Metakaolin in Alkaline Environment: Correlation of Results from Dissolution Experiments with XRD Quantifications. Materials 2020, 13, 2214. [Google Scholar] [CrossRef] [PubMed]
  4. Jiang, T.; Liu, Z.; Tian, X.; Wu, J.; Wang, L. Review on the impact of metakaolin-based geopolymer’s reaction chemistry, nanostructure and factors on its properties. Constr. Build. Mater. 2024, 412, 134760. [Google Scholar] [CrossRef]
  5. Longhi, M.A.; Rodriguez, E.D.; Walkley, B.; Zhang, Z.; Kirchheim, A.P. Metakaolin-based geopolymers: Relation between formulation, physicochemical properties and efflorescence formation. Compos. Part B Eng. 2020, 182, 107671. [Google Scholar] [CrossRef]
  6. N’Cho, W.C.; Gharzouni, A.; Jouin, J.; Rossignol, S. Impact of different metakaolin mixtures on oligomer formation and geopolymer properties: Impurity effect. Open Ceram. 2023, 15, 100411. [Google Scholar] [CrossRef]
  7. Kuenzel, C.; Ranjbar, N. Dissolution mechanism of fly ash to quantify the reactive aluminosilicates in geopolymerisation. Resour. Conserv. Recycl. 2019, 150, 104421. [Google Scholar] [CrossRef]
  8. Singh, N.B. Fly Ash-Based Geopolymer Binder: A Future Construction Material. Minerals 2018, 8, 299. [Google Scholar] [CrossRef]
  9. Abdulkareem, M.; Komkova, A.; Havukainen, J.; Habert, G.; Horttanainen, M. Identifying Optimal Precursors for Geopolymer Composite Mix Design for Different Regional Settings: A Multi-Objective Optimization Study. Recycling 2023, 8, 32. [Google Scholar] [CrossRef]
  10. Muthukrishnan, S.; Ramakrishnan, S.; Sanjayan, J. Rapid early age strength development of in-line activated geopolymer for concrete 3D printing. Constr. Build. Mater. 2023, 406, 133312. [Google Scholar] [CrossRef]
  11. Segura, P.I.; Luukkonen, T.; Yliniemi, J.; Sreenivasan, H.; Damø, A.J.; Jensen, L.S.; Canut, M.; Kantola, A.M.; Telkki, V.-V.; Jensen, P.A. Comparison of one-part and two-part alkali-activated metakaolin and blast furnace slag. J. Sustain. Metall. 2022, 8, 1816–1830. [Google Scholar] [CrossRef]
  12. Lau, C.; Rowles, M.; Parnham, G.; Htut, T.; Ng, T.S. Investigation of geopolymers containing fly ash and ground-granulated blast-furnace slag blended by amorphous ratios. Constr. Build. Mater. 2019, 222, 731–737. [Google Scholar] [CrossRef]
  13. Barbosa, V.F.F.; MacKenzie, K.J.D.; Thaumaturgo, C. Synthesis and characterisation of materials based on inorganic polymers of alumina and silica: Sodium polysialate polymers. Int. J. Inorg. Mater. 2000, 2, 309–317. [Google Scholar] [CrossRef]
  14. Walkley, B.; Rees, G.J.; San Nicolas, R.; van Deventer, J.S.J.; Hanna JVProvis, J.L. New structural model of hydrous sodium aluminosilicate gels and the role of charge-balancing extra-framework Al. J. Phys. Chem. C. 2018, 122, 5673–5685. [Google Scholar] [CrossRef]
  15. McLellan, B.C.; Williams, R.P.; Lay, J.; van Riessen, A.; Corder, G.D. Costs and carbon emissions for geopolymer pastes in comparison to ordinary Portland cement. Aust. J. Clean. Prod. 2011, 19, 1080–1090. [Google Scholar] [CrossRef]
  16. Rickard, W.D.A.; Williams, R.; Temuujin, J.; van Riessen, A. Assessing the suitability of three Australian fly ashes as an aluminosilicate source for geopolymers in high temperature applications. Mater. Sci. Eng. A 2011, 528, 3390–3397. [Google Scholar] [CrossRef]
  17. Temuujin, J.; Lee, M.; Chen-Tan, N.; van Riessen, A. Characterisation of class F fly ash geopolymer pastes immersed in acid and alkaline solutions. Cem. Concr. Compos. 2011, 33, 1086–1091. [Google Scholar] [CrossRef]
  18. Provis, J.L. Alkali-activated materials. Cem. Concr. Res. 2018, 114, 40–48. [Google Scholar] [CrossRef]
  19. Kriven, W.M.; Leonelli, C.; Provis, J.L.; Boccaccini, A.R.; Attwell, C.; Ducman, V.S.; Ferone, C.; Rossignol, S.; Luukkonen, T.; van Deventer, J.S.J.; et al. Why geopolymers and alkali-activated materials are key components of a sustainable world: A perspective contribution. J. Am. Ceram. Soc. 2024, 107, 5159–5177. [Google Scholar] [CrossRef]
  20. Jamieson, E.; McLellan, B.; van Riessen, A.; Nikraz, H. Comparison of embodied energies of Ordinary Portland Cement with Bayer-derived Geopolymer products. J. Clean. Prod. 2015, 99, 112–118. [Google Scholar] [CrossRef]
  21. Wudil, Y.S.; Al-Fakih, A.; Al-Osta, M.A.; Gondal, M.A. Effective carbon footprint assessment strategy in fly ash geopolymer concrete based on adaptive boosting learning techniques. Environ. Res. 2025, 266, 120570. [Google Scholar] [CrossRef] [PubMed]
  22. Turner, L.K.; Collins, F.G. Carbon dioxide equivalent (CO2-e) emissions: A comparison between geopolymer and OPC cement concrete. Constr. Build. Mater. 2013, 43, 125–130. [Google Scholar] [CrossRef]
  23. Luhar, S.; Nicolaides, D.; Luhar, I. Fire Resistance Behaviour of Geopolymer Concrete: An Overview. Buildings 2021, 11, 82. [Google Scholar] [CrossRef]
  24. Amran, M.; Huang, S.-S.; Debbarma, S.; Rashid, R.S.M. Fire resistance of geopolymer concrete: A critical review. Constr. Build. Mater. 2022, 324, 126722. [Google Scholar] [CrossRef]
  25. Yang, W.; Zhu, P.; Liu, H.; Wang, X.; Ge, W.; Hua, M. Resistance to Sulfuric Acid Corrosion of Geopolymer Concrete Based on Different Binding Materials and Alkali Concentrations. Materials 2021, 14, 7109. [Google Scholar] [CrossRef]
  26. Alzeer, M.I.M.; MacKenzie, K.J.D.; Keyzers, R.A. Porous aluminosilicate inorganic polymers (geopolymers): A 26 new class of environmentally benign heterogeneous solid acid catalysts. Appl. Catal. A Gen. 2016, 524, 173–181. [Google Scholar] [CrossRef]
  27. Luukkonen, T.; Heponiemi, A.; Runtti, H.; Pesonen, J.; Yliniemi, J.; Lassi, U. Application of alkali-activated materials for water and wastewater treatment: A review. Rev. Env. Sci. Biotechnol. 2019, 18, 271–297. [Google Scholar] [CrossRef]
  28. Yu, Y.; Perumal, P.; Corfe, I.J.; Paul, T.; Illikainen, M.; Luukkonen, T. Combined granulation–alkali activation–direct foaming process: A novel route to porous geopolymer granules with enhanced adsorption properties. Mater. Des. 2023, 227, 111781. [Google Scholar] [CrossRef]
  29. Toniolo, N.; Bednarzig, V.; Roether, J.A.; Rost, H.; Boccaccini, A.R. Advancing processing technologies for designed geopolymers: 3D printing and mechanical machining. Interceram 2019, 68, 18–21. [Google Scholar] [CrossRef]
  30. Ricciotti, L.; Apicella, A.; Perrotta, V.; Aversa, R. Geopolymer materials for bone tissue applications: Recent advances and future perspectives. Polymers 2023, 15, 1087. [Google Scholar] [CrossRef]
  31. Sazama, P.; Bortnovsky, O.; Dědeček, J.; Tvarůžková, Z.; Sobalík, Z. Geopolymer based catalysts—New group of catalytic materials. Catal. Today 2011, 164, 92–99. [Google Scholar] [CrossRef]
  32. Sutter, L.L.; Hooton, H.D. Progress towards sustainability through performance-based standards and specifications. Cem. Concr. Res. 2023, 174, 107303. [Google Scholar] [CrossRef]
  33. Beers, D.; Corder, G.; Bossilkov, A.; van Berkel, R. Industrial symbiosis in the Australian minerals industry. J. Ind. Ecol. 2007, 11, 55–72. [Google Scholar] [CrossRef]
  34. van Riessen, A.; Rickard, W.D.A.; Williams, R.P.; van Riessen, G.A. Methods for Geopolymer Formulation Development and Microstructural Analysis. J. Ceram. Sci. Technol. 2017, 08, 421–431. [Google Scholar]
  35. Williams, R.; van Riessen, A. Determination of the reactive component of fly ashes for geopolymer production using XRF and XRD. Fuel 2010, 89, 3683–3692. [Google Scholar] [CrossRef]
  36. Rowles, M.; O’Connor, B. Chemical optimisation of the compressive strength of aluminosilicate geopolymers synthesised by sodium silicate activation of Metakaolinite. J. Mater. Chem. 2003, 13, 1161–1165. [Google Scholar] [CrossRef]
  37. Williams, R.; Hart, R.; van Riessen, A. Quantification of the extent of reaction of metakaolin based geopolymers using XRD, SEM and EDS. J. Am. Ceram. Soc. 2011, 94, 2663–2670. [Google Scholar] [CrossRef]
  38. Longhi, M.A.; Walkley, B.; Rodriguez, E.D.; Kirchheim, A.P.; Zhang, Z.; Wang, H. New selective dissolution process to quantify reaction extent and product stability in metakaolin-based geopolymers. Compos. Part B 2019, 176, 107172. [Google Scholar] [CrossRef]
  39. Vitola, L.; Pundiene, I.; Pranckeviciene, J.; Bajare, D. The Impact of the Amount of Water Used in Activation Solution and the Initial Temperature of Paste on the Rheological Behaviour and Structural Evolution of Metakaolin-Based Geopolymer Pastes. Sustainability 2020, 12, 8216. [Google Scholar] [CrossRef]
  40. Abbass, A.M.; Firdous, R.; Djobo, J.N.Y.; Stephan, D.; Elrahman, M.A. The role of chemistry and fineness of metakaolin on the fresh properties and heat resistance of blended fly ash-based geopolymer. SN Appl. Sci. 2023, 5, 136. [Google Scholar] [CrossRef]
  41. Subaer; van Riessen, A. Thermo-mechanical and microstructural characterisation of sodium-poly (sialate-siloxo) (Na-PSS) geopolymers. J. Mater. Sci. 2007, 42, 3117–3123. [Google Scholar] [CrossRef]
  42. Lee, S.; Moon, H.-S. Phase Transformation Sequence from Kaolinite to Mullite Investigated by an Energy-Filtering TEM. J. Am. Ceram. Soc. 1999, 82, 2841–2848. [Google Scholar] [CrossRef]
  43. Skane, R.; Schneider, P.A.; Jones, F.; van Riessen, A.; Jamieson, E.; Sun, X.; Rickard, W.D.A. Predicting the stability of geopolymer activator solutions for optimised synthesis through thermodynamic modelling. Chem. Eng. J. 2025, 515, 163543. [Google Scholar] [CrossRef]
  44. ASTM C39/C39M—21; Standard Test Method for Compressive Strength of Cylindrical Concrete Specimens. ASTM International: West Conshohocken, PA, USA, 2021. [CrossRef]
  45. Krol, M.; Minkiewicz, J.; Mozgawa, W. IR spectroscopy studies of zeolites in geopolymeric materials derived from kaolinite. J. Mol. Struct. 2016, 1126, 200–206. [Google Scholar] [CrossRef]
  46. Wan, Q.; Rao, F.; Song, S.; García, R.E.; Estrella, R.M.; Patino, C.L.; Zhang, Y. Geopolymerization reaction, microstructure and simulation of metakaolin-based geopolymers at extended Si/Al ratios. Cem. Concrette Compos. 2017, 79, 45–52. [Google Scholar] [CrossRef]
  47. Lasaga, A.C. Chemical kinetics of water-rock interactions. J. Geophys. Res. Solid Earth 1984, 89, 4009–4025. [Google Scholar] [CrossRef]
  48. Brady, P.V.; Walther, J.V. Controls on silicate dissolution rates in neutral and basic pH solutions at 25 °C. Geochim. Cosmochim. Acta 1989, 53, 2823–2830. [Google Scholar] [CrossRef]
  49. Alonso, S.; Palomo, A. Alkaline activation of metakaolin and calcium hydroxide mixtures: Influence of temperature, activator concentration and solids ratio. Mater. Lett. 2001, 47, 55–62. [Google Scholar] [CrossRef]
  50. Khale, D.; Chaudhary, R. Mechanism of geopolymerization and factors influencing its development: A review. J. Mater. Sci. 2007, 42, 729–746. [Google Scholar] [CrossRef]
  51. Rattanasak, U.; Chindaprasirt, P. Influence of NaOH solution on the synthesis of fly ash geopolymer. Miner. Eng. 2009, 22, 1073–1078. [Google Scholar] [CrossRef]
  52. Lee, W.K.W.; van Deventer, J.S.J. Structural reorganisation of class F fly ash in alkaline silicate solutions. Colloids Surf. A Physiochem. Eng. Asp. 2002, 211, 49–66. [Google Scholar] [CrossRef]
  53. Iler, R.K. The Chemistry of Silica: Solubility, Polymerization, Colloid and Surface Properties, and Biochemistry; John Wiley & Sons: New York, NY, USA, 1979. [Google Scholar]
  54. Provis, J.L.; Van Deventer, J.S.J. (Eds.) Geopolymers: Structures, Processing, Properties and Industrial Applications; Elsevier: Amsterdam, The Netherlands, 2009; Chapter 4; p. 51. [Google Scholar]
  55. Barton, J.L.; Milshtein, J.D.; Hinricher, J.J.; Brushett, F.R. Quantifying the impact of viscosity on mass-transfer coefficients in redox flow batteries. J. Power Sources 2018, 399, 133–143. [Google Scholar] [CrossRef]
  56. Brinker, C.J. Hydrolysis and condensation of silicates: Effects on structure. J. Non-Cryst. Solids 1988, 100, 31–50. [Google Scholar] [CrossRef]
  57. Rees, C.A.; Provis, J.L.; Lukey, G.C.; Van Deventer, J.S. The mechanism of geopolymer gel formation investigated through seeded nucleation. Colloids Surf. A Physicochem. Eng. Asp. 2008, 318, 97–105. [Google Scholar] [CrossRef]
  58. Heah, C.Y.; Kamarudin, H.; Al Bakri, A.M.; Bnhussain, M.; Luqman, M.; Nizar, I.K.; Ruzaidi, C.M.; Liew, Y.M. Study on solids-to-liquid and alkaline activator ratios on kaolin-based geopolymers. Constr. Build. Mater. 2012, 35, 912–922. [Google Scholar] [CrossRef]
  59. Chen, H.; Gao, Y.; Li, J.; Sun, C.; Sarkar, B.; Bhatnagar, A.; Bolan, N.; Yang, X.; Meng, J.; Liu, Z.; et al. Insights into simultaneous adsorption and oxidation of antimonite [Sb (III)] by crawfish shell-derived biochar: Spectroscopic investigation and theoretical calculations. Biochar 2022, 4, 37. [Google Scholar] [CrossRef]
  60. Chen-Tan, N.W.; van Riessen, A.; Ly, C.V.; Southam, D.C. Determining the Reactivity of a Fly Ash for Production of Geopolymer. J. Am. Ceram. Soc. 2009, 92, 881–887. [Google Scholar] [CrossRef]
  61. Le Chatelier’s Principle and Dynamic Equilibria. Chemistry LibreTexts. 2023. Available online: https://chem.libretexts.org/Bookshelves/Physical_and_Theoretical_Chemistry_Textbook_Maps/Supplemental_Modules_(Physical_and_Theoretical_Chemistry)/Equilibria/Le_Chateliers_Principle/Le_Chatelier’s_Principle_and_Dynamic_Equilbria (accessed on 30 March 2025).
  62. Hajimohammadi, A.; Provis, J.L.; van Deventer, J.S. The effect of silica availability on the mechanism of geopolymerisation. Cem. Concr. Res. 2011, 41, 210–216. [Google Scholar] [CrossRef]
  63. Siyal, A.A.; Mohamed, R.M.S.R.; Shamsuddin, R.; Ridzuan, M.B. A comprehensive review of synthesis kinetics and formation mechanism of geopolymers. RSC Adv. 2024, 14, 446–462. [Google Scholar] [CrossRef] [PubMed]
  64. Hind, A.R.; Bhargava, S.K.; Grocott, S.C. The surface chemistry of Bayer process solids: A review. Colloids Surf. A Physicochem. Eng. Asp. 1999, 146, 359–374. [Google Scholar] [CrossRef]
  65. Puertas, F.; Fernández-Jiménez, A. Mineralogical and microstructural characterisation of alkali-activated fly ash/slag pastes. Cem. Concr. Compos. 2003, 25, 287–292. [Google Scholar] [CrossRef]
  66. Provis, J.L.; Fernández-Jiménez, A.; Kamseu, E.; Leonelli, C.; Palomo, A. Binder Chemistry—Low-Calcium Alkali-Activated Materials. In Alkali-Activated Materials: State-of-the-Art Report; RILEM TC 224-AAM; Springer: Dordrecht, The Netherlands, 2014. [Google Scholar]
  67. McCutchin, C.A.; Edgar, K.J.; Chen, C.L.; Dove, P.M. Silica–Biomacromolecule Interactions: Toward a mechanistic understanding of silicification. Biomacromolecules 2024, 26, 43–84. [Google Scholar] [CrossRef] [PubMed]
  68. Duxson, P.; Mallicoat, S.W.; Lukey, G.C.; Kriven, W.M.; van Deventer, J.S.J. The effect of alkali and Si/Al ratio on the development of mechanical properties of metakaolin-based geopolymers. Colloids Surf. A Physicochem. Eng. Asp. 2007, 292, 8–20. [Google Scholar] [CrossRef]
  69. Rickard, W.; van Riessen, A.; Temuujin, J. Thermal analysis of geopolymer pastes synthesised from five fly ashes of variable composition. J. Non-Cryst. Solids 2012, 358, 1830–1839. [Google Scholar] [CrossRef]
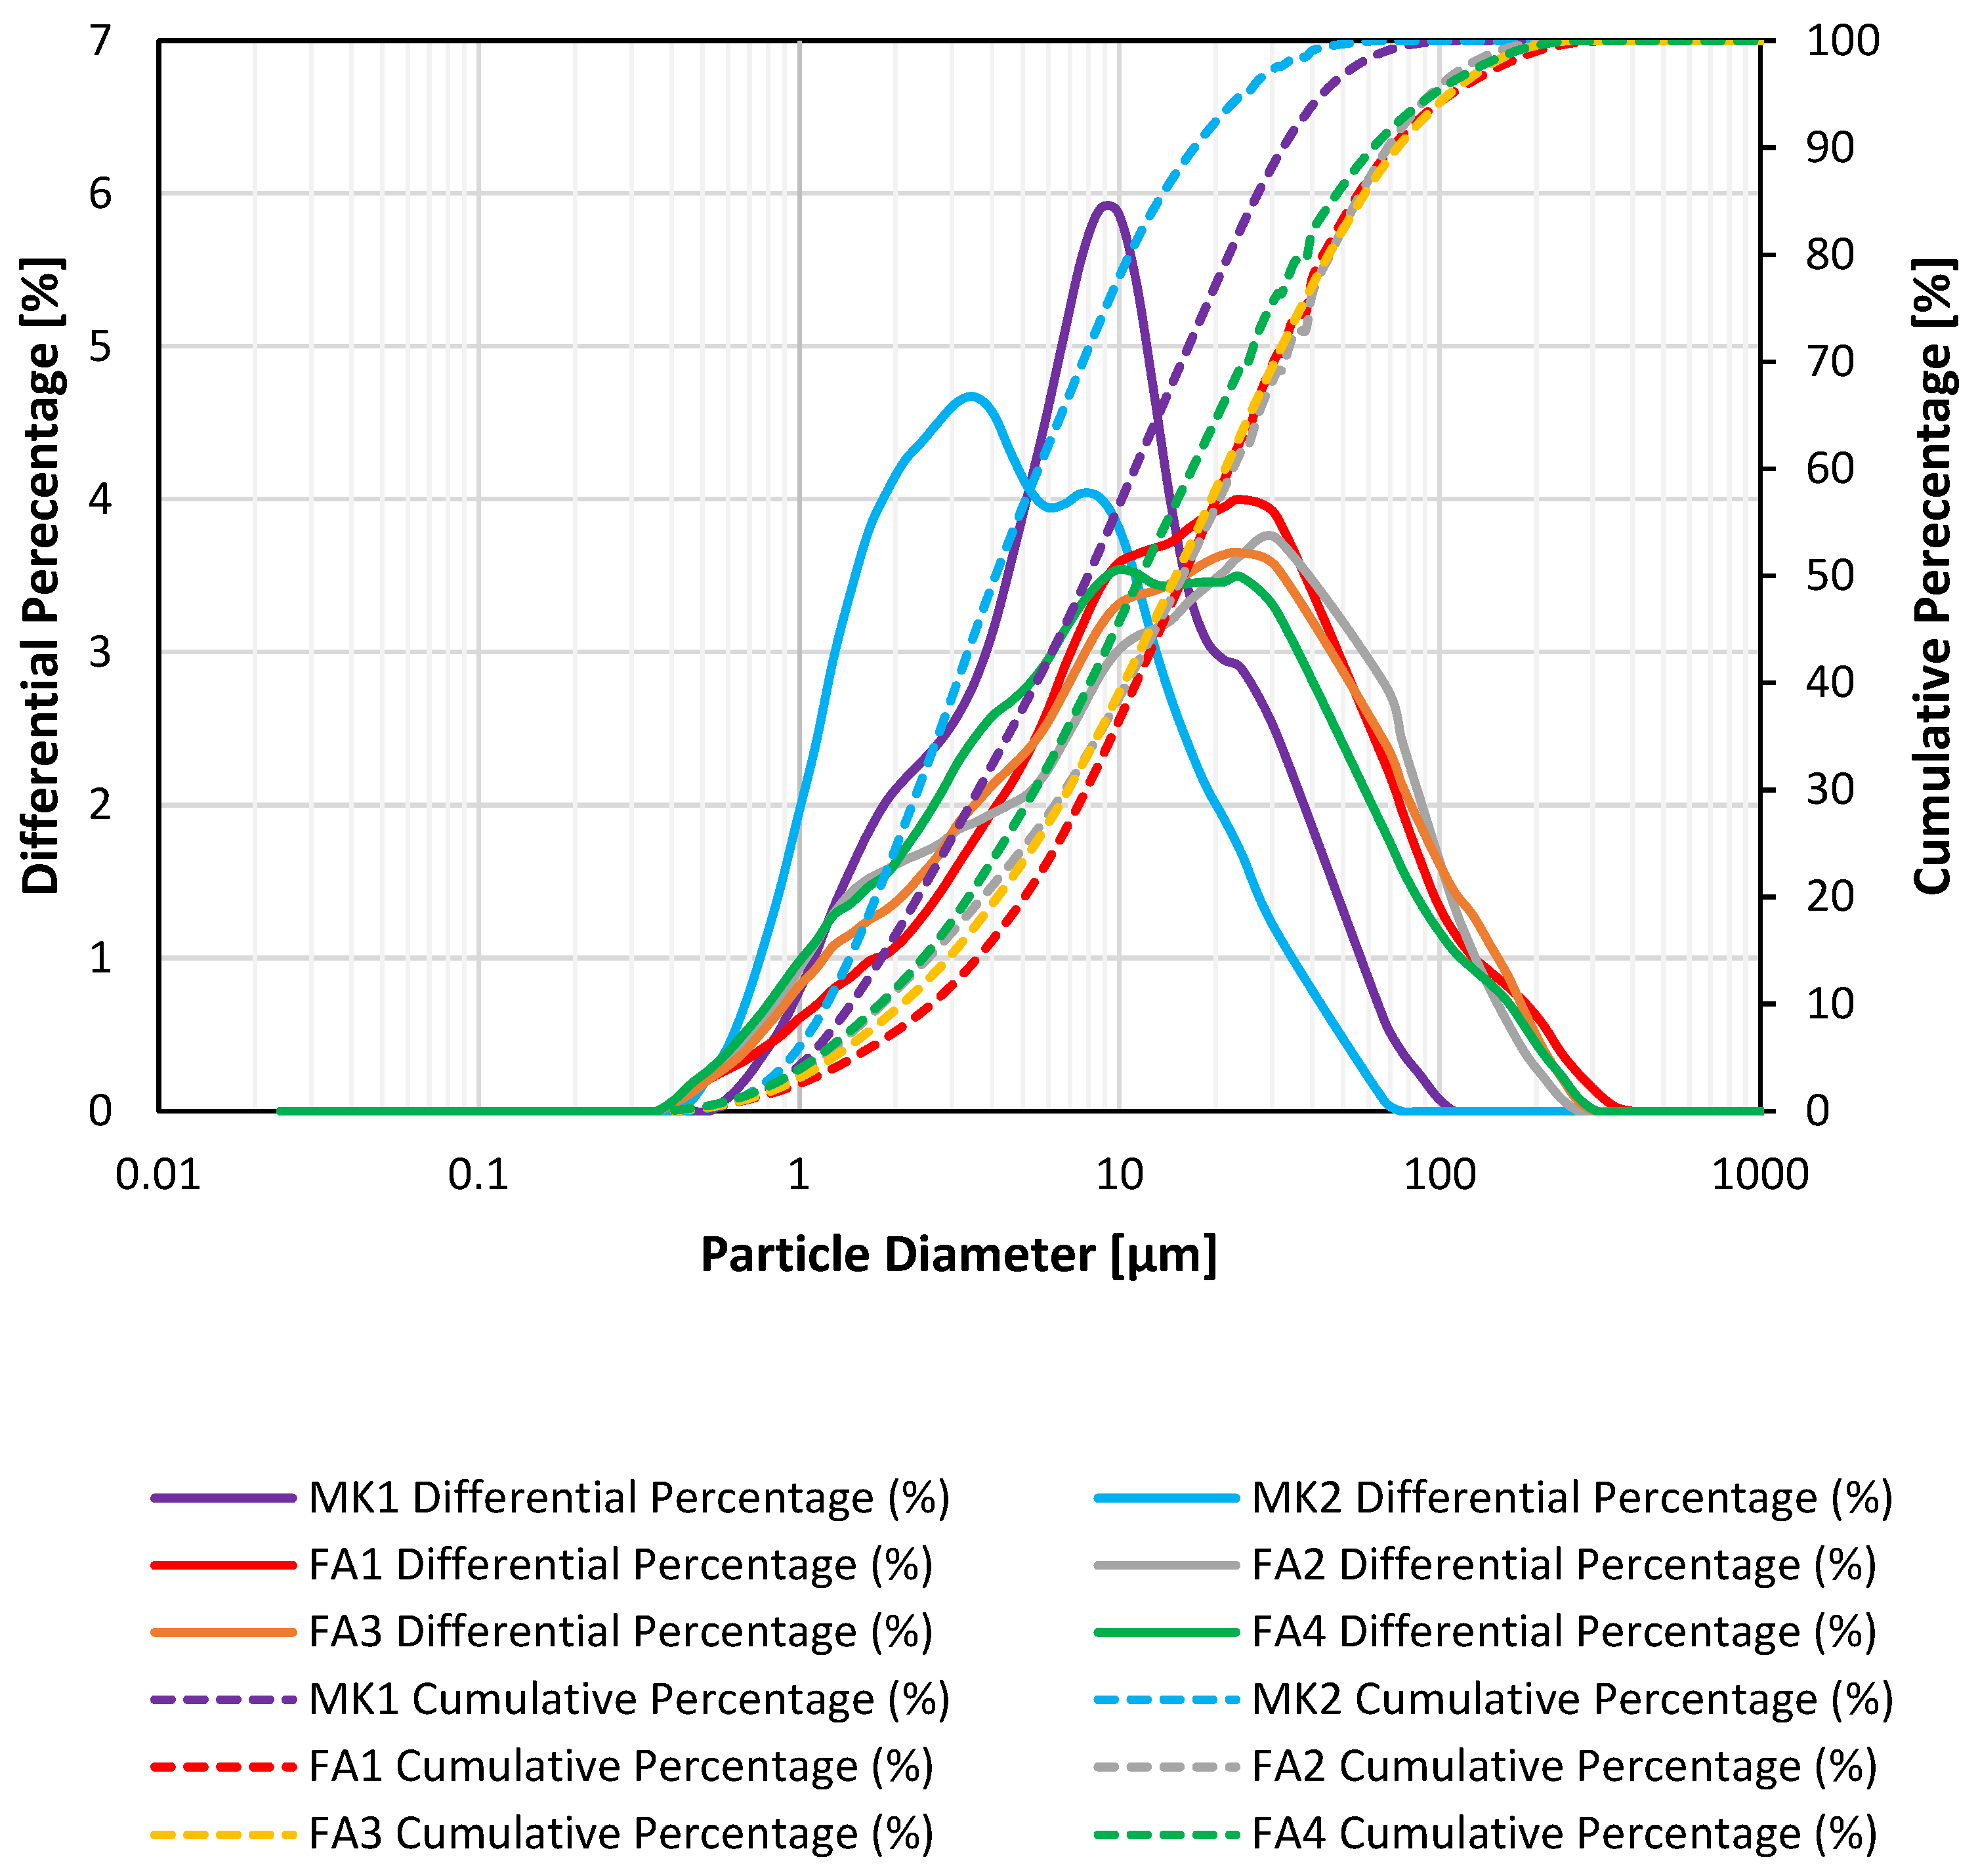
Figure 1. Particle size distributions for the six precursors.
Buildings 15 02822 g001
Figure 2. XRD pattern of MK1 precursor, highlighting the amorphous hump. The sharp reflections are from impurity phases. Q = quartz and Mu = muscovite.
Buildings 15 02822 g002
Figure 3. XRD pattern of FA1 precursor. The amorphous hump is clearly visible but subdued relative to MK1 due to the presence of more crystalline materials. Q = quartz, M = mullite, Ma = magnetite and H = hematite.
Buildings 15 02822 g003
Figure 4. Overlay of diffraction patterns from MK1 precursor (Si:Al = 1.8 and Na:Al = 1) and MK1GP. Impurity reflections are from Q = quartz and Mu = muscovite. Silicate-based activator.
Buildings 15 02822 g004
Figure 5. XRD pattern of MK1GP (Si:Al = 0.9, Na:Al = 1) (blue) overlayed with the MK precursor (black). Impurity reflections are Q = quartz, Mu = muscovite and Z = zeolite. Aluminate-based activator.
Buildings 15 02822 g005
Figure 6. XRD pattern of FA1GP (Si:Al = 3 and Na:Al = 1) (red) overlayed with the FA precursor (black). M = mullite. Impurity reflections are Q = quartz, Ma = magnetite and H = hematite. Silicate-based activator.
Buildings 15 02822 g006
Figure 7. XRD pattern of FA1GP (Si:Al = 1.6 and Na:Al = 1) (blue) overlayed with the FA1 precursor (black). M = mullite, Q = quartz, Ma = magnetite, H = hematite and Z = zeolite. Aluminate-based activator.
Buildings 15 02822 g007
Figure 8. Compressive strength versus Si:Al of metakaolin-based geopolymers. Error bars represent two standard deviations of the average value.
Buildings 15 02822 g008
Figure 9. Compressive strength versus Si:Al of fly ash-based geopolymers. Error bars represent two standard deviations of the average value.
Buildings 15 02822 g009
Table 1. Example AAM formulations for fly ash and metakaolin precursors. For strength the number in brackets represents the uncertainty of two standard deviations. Note: Molar ratios.
Precursor
Type
Precursor (Amorphous)
Si:Al
Target
Si:Al
Target Na:AlTarget
H:Si
Total Water w/w%Compressive Strength (MPa)
Metakaolin1.011.61.07.233550(9)
Fly Ash4.911.51.05.801835(4)
Table 2. Elemental compositions, expressed as oxides, of the metakaolin (MK) and fly ash (FA) samples as determined by XRF (wt.%).
AnalyteMK1MK2FA1FA2FA3FA4
Al2O344.8141.9929.7229.825.7424.96
BaO0.01X0.30.270.20.45
CaO0.010.110.760.671.78
Cr2O3XX0.020.020.020.02
Fe2O30.061.098.879.548.0616.72
K2O0.290.250.50.480.460.61
MgO0.060.20.660.740.81.31
MnOXX0.050.050.050.1
Na2O0.030.030.220.250.240.35
P2O50.010.021.230.740.381.524
SO30.05X0.260.120.180.33
SiO253.2753.453.9453.9860.4250.1
TiO20.281.131.831.821.851.39
LOI (1000 °C)0.911.651.171.030.740.33
Total99.899.8699.9499.8499.86100.23
Si:Al (wt%)1.051.121.601.602.071.77
Molar Si:Al 1.011.081.541.541.991.70
“X” means the analyte is below detection limit of 0.01%.
Table 3. Quantitative XRD data (wt.%) for the six precursors plus the calculated molar Si:Al. See text for justification for selecting two quartz phases.
MK1MK2FA1FA2FA3FA4
Amorphous Content98.2995.9652515258
Amorphous Molar Si:Al0.991.012.402.952.582.10
Quartz 1 (SiO2)1.133.2813142015
Quartz 2 (SiO2)--6353
Mullite (Al4+2xSi2-2xO10−x)--25262114
Hematite (Fe2O3)--1223
Magnetite (Fe3O4)--2213
Spinel (MgAl2O4)--12-4
Muscovite (KAl3Si3O10)0.47-----
Anatase (TiO2)-0.76----
Table 4. Composition of amorphous component (wt.%) of the six precursors.
MK1MK2FA1FA2FA3FA4
Al2O344.6141.9910.208.819.9411.56
SiO251.9150.1228.8130.6030.2728.67
CaO0.010.101.000.760.671.78
Fe2O30.061.096.956.625.6012.34
K2O0.230.250.500.480.460.61
Na2O0.030.030.220.250.240.35
MgO0.060.200.380.170.800.18
TiO20.280.371.831.821.851.39
SiO2:Al2O31.161.192.833.473.042.48
Si:Al1.031.052.493.072.692.19
Table 5. Geopolymer formulations showing two metakaolin and four fly ash precursors, and target Si:Al and H:Si. The Na:Al was set to 1.0 for all samples.
PrecursorSi:AlH:Si
MK12.06.40
MK11.86.79
MK11.67.23
MK11.47.73
MK11.28.31
MK11.08.98
MK10.89.56
MK10.610.20
MK21.95.86
MK21.85.02
MK21.75.17
MK21.65.34
MK21.55.54
MK21.45.76
MK21.36.02
MK21.26.32
MK21.07.32
MK20.88.28
FA 13.44.31
FA 13.24.48
FA 13.04.68
FA 12.84.98
FA 12.55.33
FA 12.45.48
FA 12.05.65
FA 11.85.77
FA 11.65.91
FA 11.46.09
FA 11.26.34
FA 11.06.69
FA 10.87.20
FA 24.04.16
FA 23.84.34
FA 23.54.54
FA 23.05.10
FA 22.55.23
FA 22.05.44
FA 21.55.78
FA 21.06.47
FA 33.43.39
FA 33.23.53
FA 33.03.69
FA 32.83.87
FA 32.64.07
FA 32.44.27
FA 32.24.35
FA 32.04.43
FA 31.84.53
FA 31.64.65
FA 31.34.86
FA 30.85.66
FA 43.24.16
FA 42.94.43
FA 42.74.65
FA 42.54.91
FA 42.35.21
FA 42.15.55
FA 41.95.66
FA 41.75.79
FA 41.55.95
FA 41.36.16
FA 41.16.45
Table 6. Compressive strength and Si:Al for peak values shown in Figure 9.
PrecursorPeak-Low Si:AlMaximum Compressive Strength (MPa)Precursor Amorphous Si:AlPeak-High Si:AlMaximum Compressive Strength (MPa)Difference Between High and Low Si:Al Peaks
MK10.816 (3)0.991.851 (6)1.0
MK21.269 (18)1.011.6101 (6)0.4
FA11.243 (5)2.403.033 (6)1.8
FA21.535 (3)2.953.513 (2)2.0
FA31.351 (1)2.583.070 (9)1.7
FA41.353 (4)2.102.755 (3)1.4
Disclaimer/Publisher’s Note: The statements, opinions and data contained in all publications are solely those of the individual author(s) and contributor(s) and not of MDPI and/or the editor(s). MDPI and/or the editor(s) disclaim responsibility for any injury to people or property resulting from any ideas, methods, instructions or products referred to in the content.