Article

Detonation Dynamics and Damage Behavior of Segmented Tunnel Charges with Shaped Liners

1
College of Architecture and Civil Engineering, Beijing University of Technology, Beijing 100124, China
2
China Tiesiju Civil Engineering Group Co., Ltd., Hefei 230023, China
*
Author to whom correspondence should be addressed.
Buildings 2025, 15(16), 2815; https://doi.org/10.3390/buildings15162815
Submission received: 3 June 2025 / Revised: 26 July 2025 / Accepted: 29 July 2025 / Published: 8 August 2025
(This article belongs to the Special Issue Dynamic Response of Civil Engineering Structures under Seismic Loads)

Abstract

To precisely control the tunnel smooth blasting effect, this study conducts both model experiments and numerical simulations to investigate the impact of shaped charge jet initiation on emulsion explosives and surrounding rock damage fractal characteristics under different ratios of the main-to-secondary charge lengths (L1/L2). The study also includes field validation. The results indicate the following: (1) The Arbitrary Lagrangian–Eulerian (ALE) method can accurately reproduce the formation, motion, impact, initiation, and dynamic damage evolution of a shaped charge jet inside a blast hole, with a deviation of less than 6.4% compared to high-speed photography observations. (2) Under the working conditions in this study, when an axial aluminum energetic liner and two-stage air-segmented charge in the peripheral holes are used, the fractal dimension (Df) initially increases from 1.57 to 1.66 and then decreases to 1.41 as the L1/L2 ratio increases. (3) Field test results demonstrate that, when using a two-segment explosive charge with a 20 cm gap between segments and an L1/L2 ratio of 2, the average over- or under-excavation is controlled within 7 cm, with the maximum deviation not exceeding 12 cm. The corresponding average fragment size (d50) is minimized, resulting in an excellent smooth blasting effect and effectively controlling the fragmentation of the smooth blasting layer. The conclusions of this study provide valuable insights for the development of advanced shaped charge blasting techniques.

1. Introduction

Smooth blasting is the most widely used construction method in underground engineering projects (such as subway tunnels, highway tunnels, and hydropower projects). It ensures adequate rock fragmentation while controlling over- and under-excavation, resulting in a smooth and flat tunnel face profile [1,2,3,4]. However, traditional smooth blasting usually employs a detonator and a blasting fuse combined initiation technique, which has disadvantages such as high cost and limited raw material availability [5,6,7].
The shaped charge tube is a widely used charge structure in tunnel smooth blasting. lt adjusts the explosive energydistribution, suppressing the explosion energy in non-focus directions to reduce damage to the surrounding rock and effectively address over- and under-excavation issues. Many scholars have conducted experimental studies on shaped charge blasting. Hayes [8] used X-ray high-speed photography to study the effect of liner material on the shape and velocity of the jet formation. Fourney et al. [9] made symmetrical double-side cuts on PVC tubular explosive bags and found that the cut-charge bags exhibited distinct directional damage effects. Ma et al. [10] simulated the crack propagation behavior and found it to be significantly influenced by the blast loading rate. The shaped charge device was effective in controlling the crack propagation. Yang et al. [11] used orthogonal design methods to optimize the wall thickness, groove width, groove length, and decoupling coefficient of the cut-charge bags in peripheral holes. Wu et al. [12] studied the effects of cut material, wall thickness, and shaped charge liner geometry on the pre-crack blasting strain data and the distribution of explosive-induced cracks in novel shaped charge bags. Liu et al. [13] proposed reducing the damage from cut-charge bags and shaped charge bags in smooth blasting techniques and conducted a parametric optimization analysis through related experiments. Yin et al. [14] found that decoupling shaped charge technology can achieve optimal fracturing effects on the surrounding rock mass. Song et al. [15,16] found that the decoupling coefficient significantly influences the development of cracks in shaped charge blasting. When the radial decoupling coefficient is 1.67, the fracture zone is larger and the fracturing effect is better. Xu et al. [17,18] compared the formation effects of shaped charge and conventional smooth blasting, concluding that shaped charge blasting technology is more advantageous for tunnel surrounding rock stability. Furthermore, an increasing number of scholars are focusing on the uniformity of charge distribution in peripheral holes as a key factor influencing the formation effects of smooth blasting, in addition to the role of shaped charge tube materials. Based on actual engineering projects, Wang et al. [19] established a shaped charge water-sealing blasting model and derived rational construction solutions through numerical analysis.
Some scholars [20,21,22] have conducted studies on the optimal detonation distance of emulsion explosives, aiming to implement segmented charge placement in peripheral holes. While the findings have clear engineering value, surrounding rock conditions, explosive quality, and plugging quality can all impact the method [23,24]. As a result, new types of shaped charge devices capable of segmented charge placement are gradually being introduced into tunnel blasting projects. Wang et al. [25] discovered that the combination of an axial-shaped charge liner and industrial electronic detonators improve the effectiveness of tunnel smooth blasting while significantly reducing material costs. Liu et al. [26] concluded from model test results that the shape charge jet formed by the new liner significantly increases the detonation distance of emulsion explosives in seamless steel pipes and conducted field verification experiments. Tian et al. [27] designed a new shaped charge tube that combines a PVC semi-tube and a shaped charge liner. This not only allows for accurate control of explosive quantities but also effectively manages tunnel over- and under-excavation. Liu et al. [28] proposed a new shaped charge device and conducted field tests to validate its performance. This work provides direction for the development of new shaped charge blasting technologies.
In summary, the use of smooth blasting technology based on axial-shaped charge liners is gradually becoming a key technique in underground engineering blasting. Research on the technology of new shaped charge liners for smooth blasting mainly focuses on field tests. However, the processes involved in the formation of shaped charge jets, initiation of emulsion explosives, and dynamic damage evolution of surrounding rock are highly complex, leading to certain limitations in understanding the technology based on new shaped charge liners. Therefore, leveraging the tunnel engineering project of Metro Line 5 in Qingdao as a case study, this research utilizes numerical simulations and field tests to reveal the axial detonation characteristics of shaped charge liners and the fractal damage patterns of surrounding rock under different main-to-secondary charge length ratios (L1/L2). The findings have significant implications for the promotion of novel shaped charge smooth blasting techniques and contribute to the ongoing development of precision control in tunnel engineering shaped charge smooth blasting technology.

2. Mechanism of Shaped Charge Jet Impact-Induced Explosive Detonation

In Figure 1a, the metal shaped charge liner and PVC pipe are placed at one end of the emulsion explosive, ensuring that the side of the shaped charge device is aligned with the segment of explosive to be initiated during the loading process. The corresponding process of metal shaped charge jet formation is schematically illustrated in Figure 1b. Under the influence of the detonation wave generated by the explosion, the metal liner is compressed toward the center at high velocity and undergoes collision along the axis. Subsequently, the conical charge liner compresses along the central axis, and in the dynamic coordinate system at the collision point it flows toward the point of impact with a relative velocity V2. After impact, the metal splits into two parts: the jet and the slug. The jet velocity Vj is significantly higher than the slug velocity, with the jet metal constituting approximately 6% to 11% of the total mass of the metal liner [29].
The process of jet impact initiation of explosives is highly complex, and relevant theories are still in the early stages of exploration. According to hotspot theory and the shaped charge effect [30], when a shaped charge structure is used, the explosion of the explosive results in the formation of a high-speed jet from the metal liner (as shown in Figure 1b). When the metal jet strikes the explosive placed at a certain distance, a “hotspot” is formed at the point of impact under the high-speed jet. Eventually, with the propagation of the hotspot, the explosive is initiated. Currently, the mechanism of industrial explosive initiation via jet impact remains in the preliminary stages of investigation. Several scholars have proposed critical initiation criteria, among which Held et al. [31] suggested the following criterion:
K = vj2dj
where vj is the jet velocity and dj is the jet diameter.
Since then, researchers Walker [32] proposed the critical energy criterion, p2τ, based on plate impact.
p2τ = const
In the formula, p is the amplitude of shock wave pressure and τ is the shock wave action time.
James [33] further concluded on the basis of Formula (2):
Ec = puτ
In the equation, Ec represents the critical energy per unit area, p is the shock pressure, u is the particle velocity, and τ is related to the duration of the shock and the shape of the projectile or jet head.
The above criteria lack key parameters for emulsion explosives, and existing methods are insufficient to monitor the process of shaped charge jet impact initiation of emulsion explosives. Therefore, leveraging existing research findings and using numerical simulations for related studies is currently a more feasible approach.

3. Methods

3.1. Experimental Scheme Design

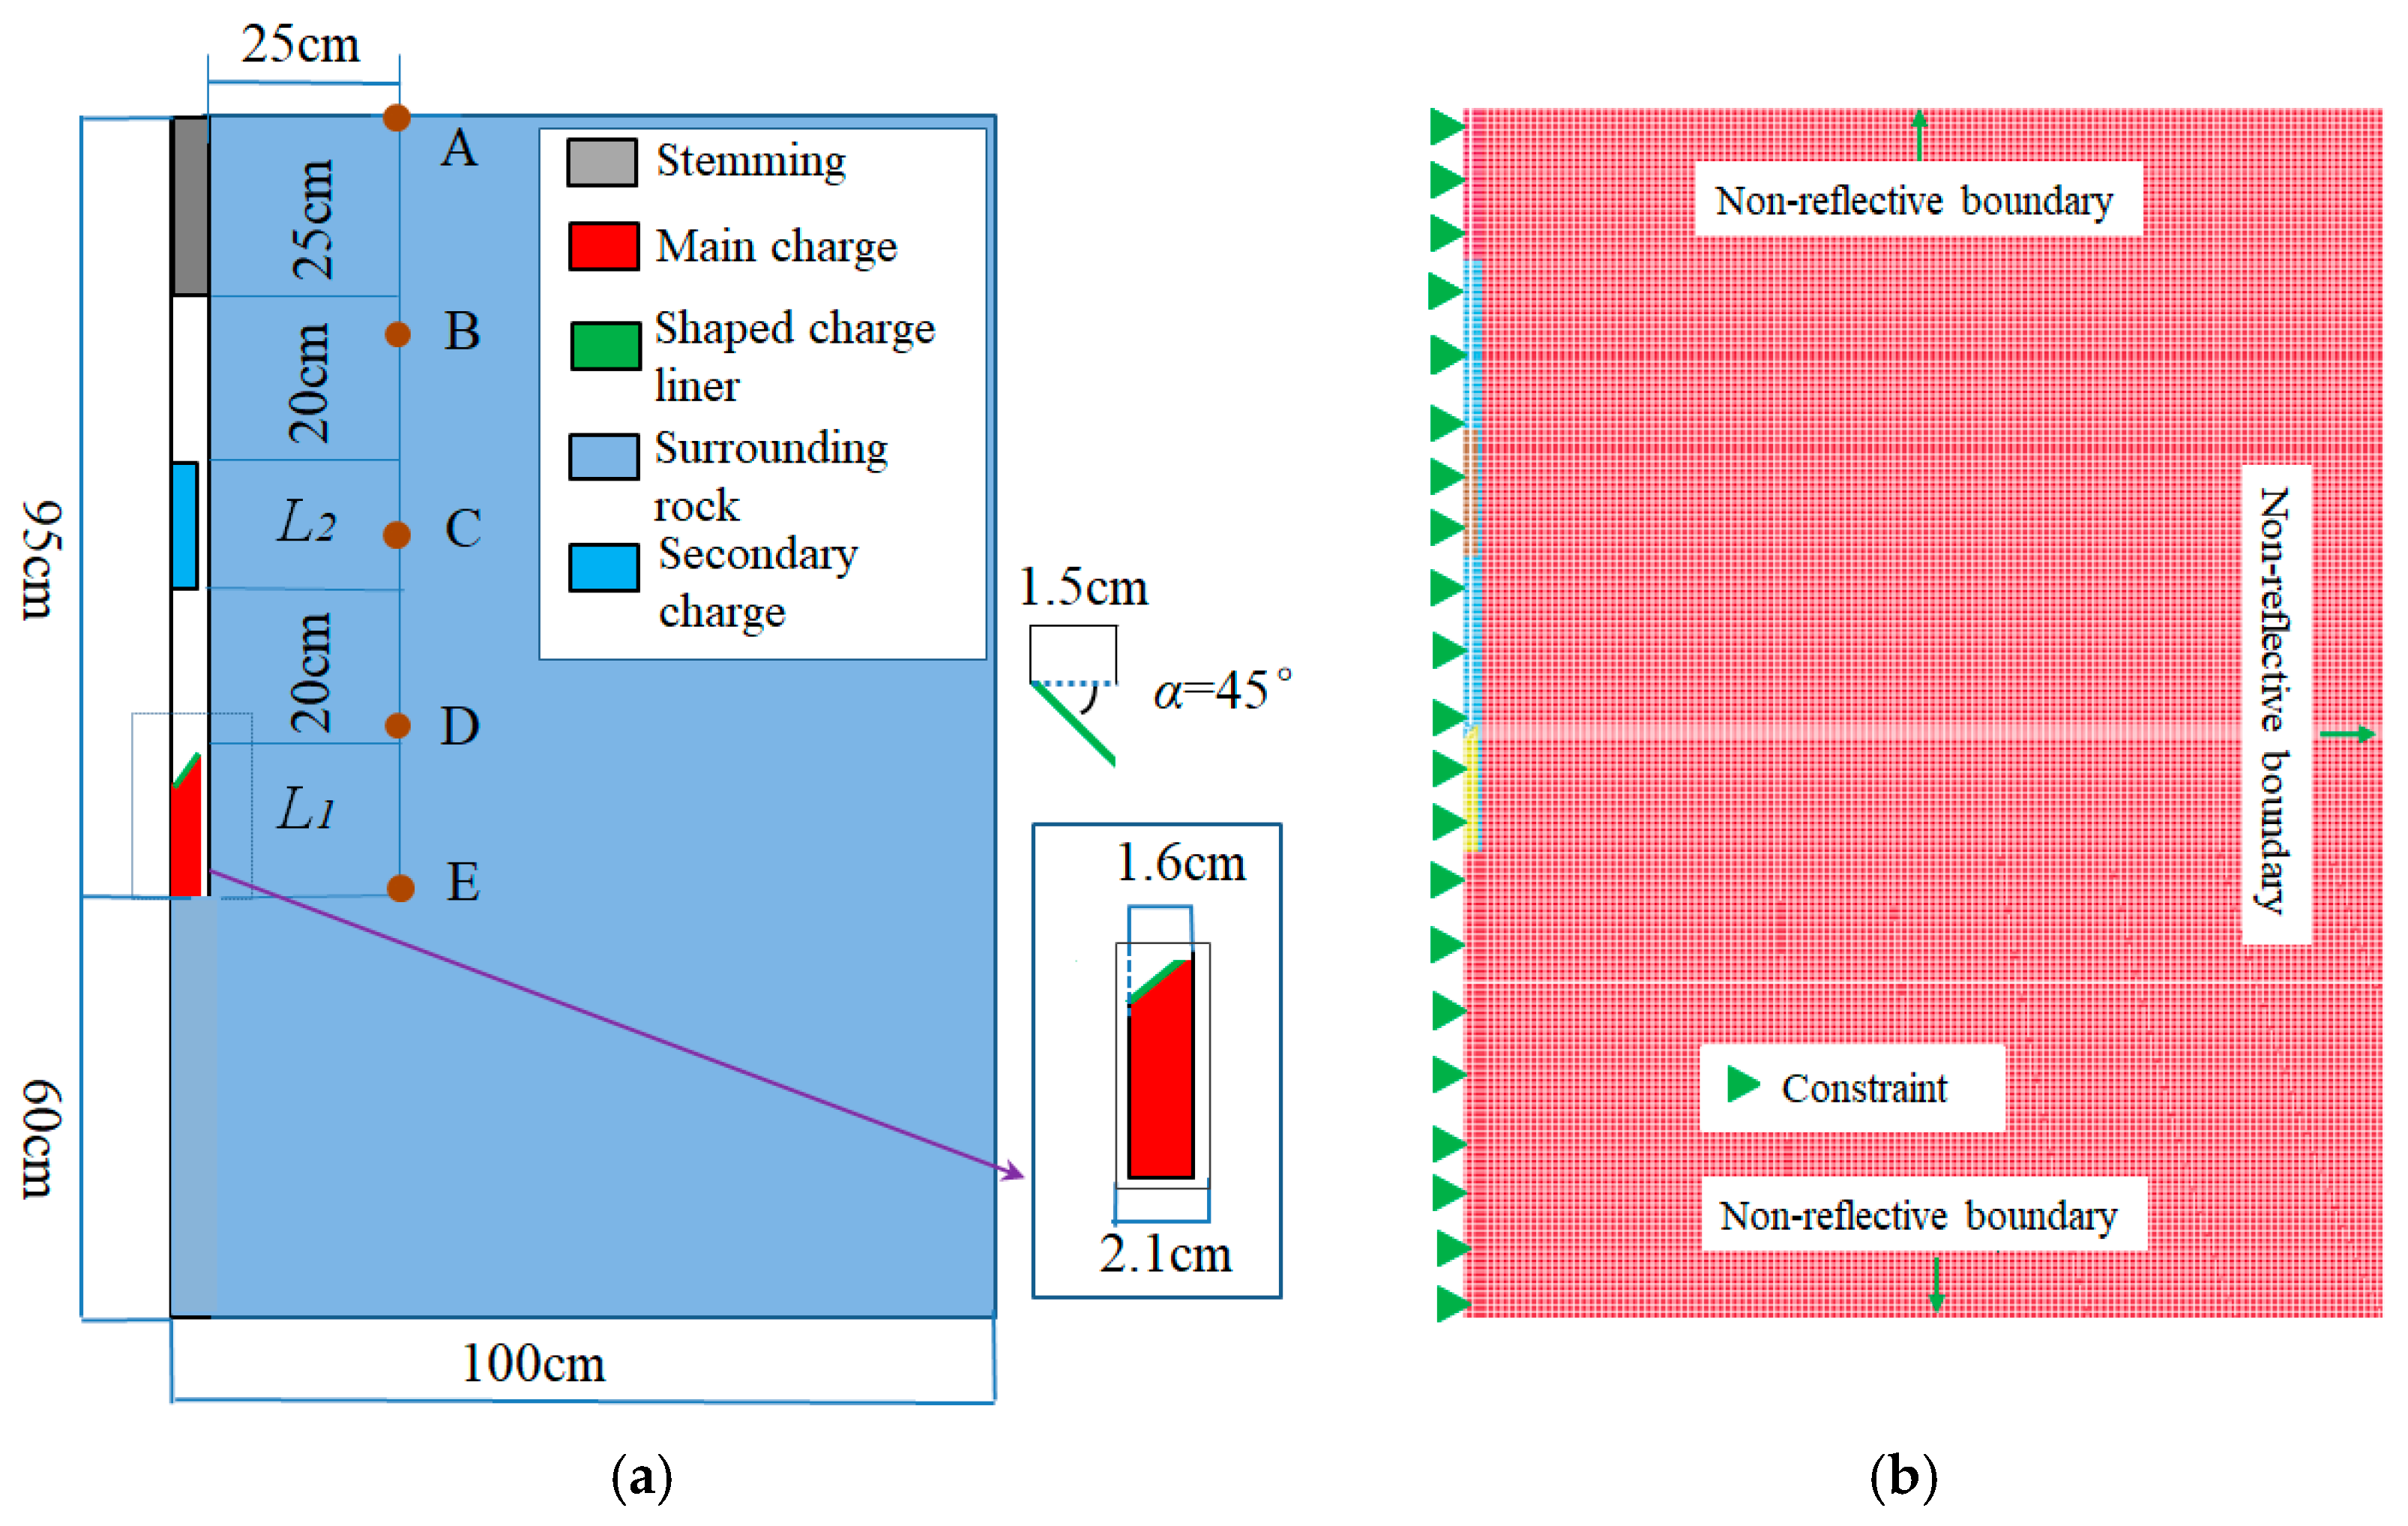
In underground excavation blasting, the surrounding holes significantly impact the formation of smooth blasting effects. To achieve an optimal smooth blasting effect, the surrounding holes typically use an air interval charge structure during construction. Currently, the air interval charge structure for peripheral holes in a section of the Qingdao Metro Line 5 station tunnel is shown in Figure 2. To compare the effects of different charge parameters (the ratio of main charge length L1 to secondary charge length L2) on the smooth blasting effect under the same explosive mass, five charge structures were designed using numerical simulations. The L1/L2 ratios of these structures were 1, 1.3, 1.7, 2.3, and 3.3, with all other parameters held constant.

3.2. Numerical Model Establishment

With the continuous advancement of computer simulation technology, finite element simulation software and high-performance servers allow for numerical simulations to predict and verify the penetration process of shaped charge jets through industrial explosives and key design parameters. This study employs the ALE algorithm in LS-DYNA software (version R14.0.0) to conduct fluid-structure interaction simulations. The specific parameters of the model are shown in Figure 3a,b. To conserve computational resources and improve calculation accuracy, a scaled 1/2-symmetric model was constructed. The grid size for the solid domain is 0.1 cm, and for the fluid domain, it ranges from 0.02 cm to 0.1 cm [34]. The total number of grid elements is 1.04 million, with the unit system being cm-us-g. The blast hole diameter is 2.1 cm, and the explosive diameter is 1.6 cm. Considering the material properties of the liner, industrial batch manufacturing costs, and existing literature reports [25,35], the liner in the numerical model is made of aluminum, with a half-model cone angle of 45° and a thickness of 1.5 mm. Constraints were applied at the symmetry planes of the model, and non-reflective conditions were added at the boundaries. Additionally, monitoring points A to E were placed to compare and analyze the blasting damage effects on the surrounding rock under different schemes.

3.3. Numerical Model Parameter Determination

3.3.1. Rock Mass Parameters

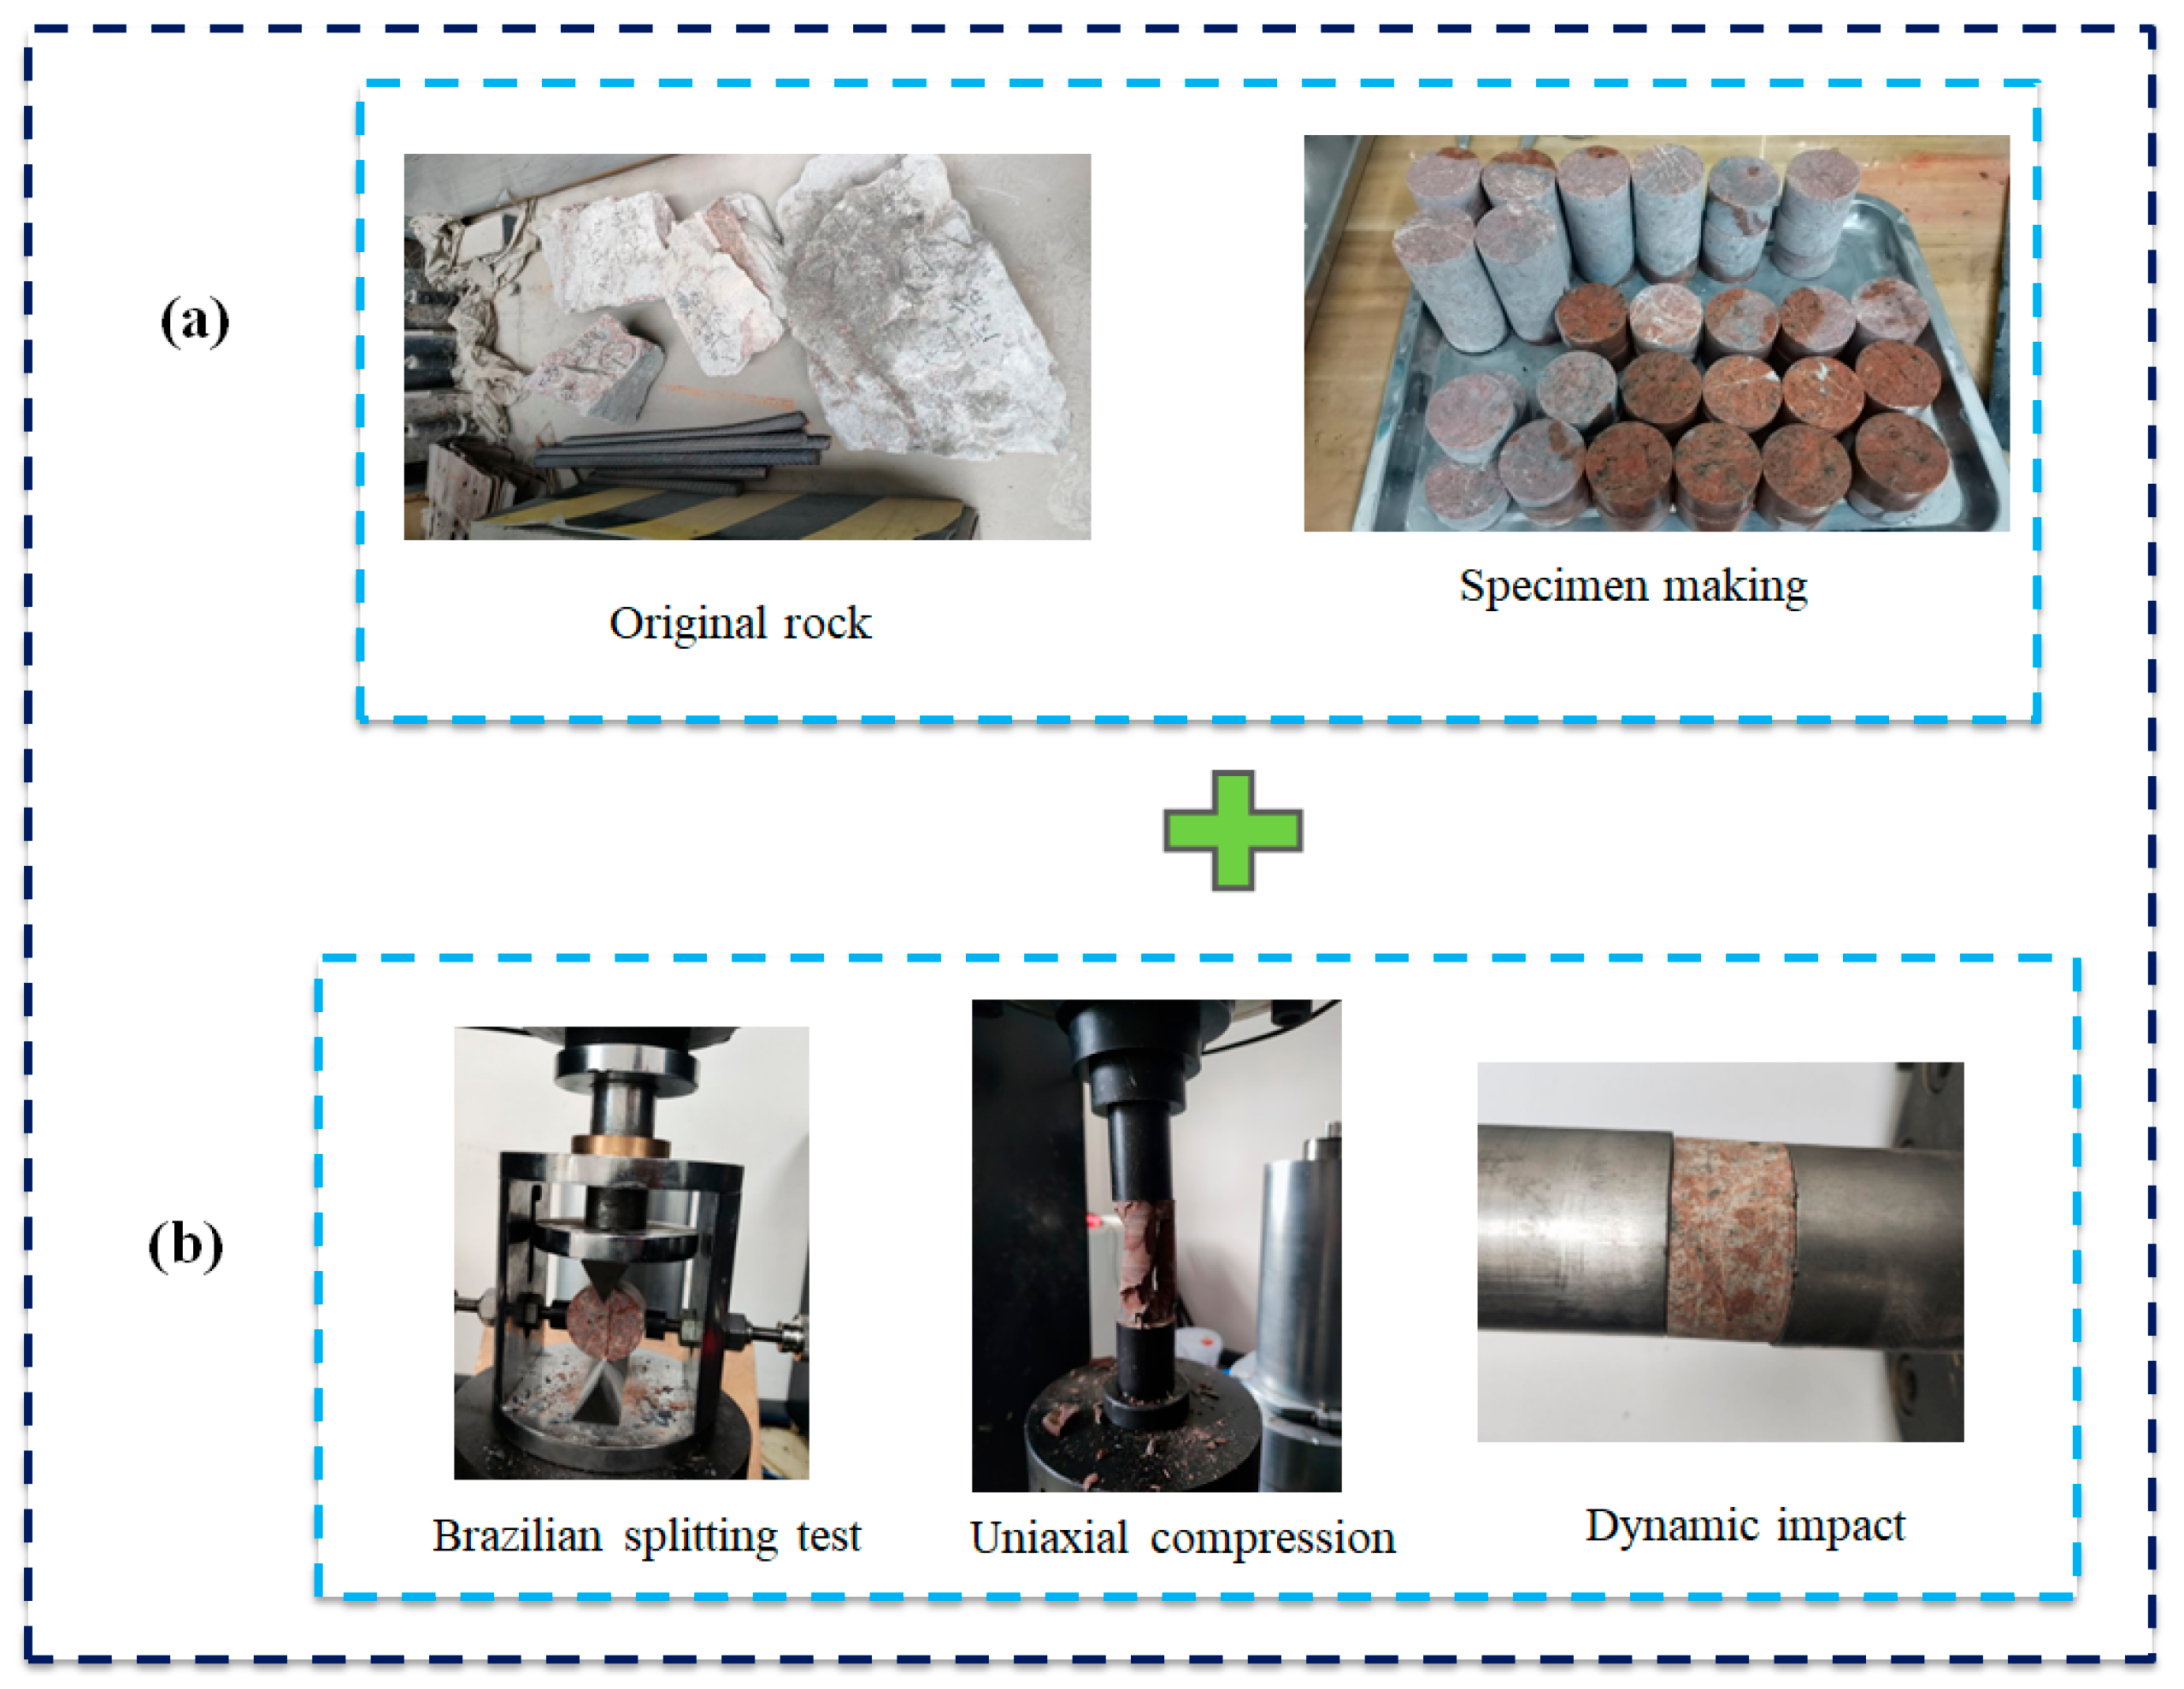
The surrounding rock on site is granite, and the RHT constitutive model from the LS-DYNA material library was used. The constitutive parameters are listed in Table 1, with the specific mechanical testing process shown in Figure 4. The parameter calibration process is referenced from [36].

3.3.2. Liner Parameters

The charge liner uses the Johnson–Cook (JC) constitutive model (Model No. 15) and the Gruneisen equation of state (Model No. 4) to describe its behavior under high-temperature, high-pressure, and high-velocity conditions [37]. The detailed model parameters are provided in Table 2.

3.3.3. Air Material Parameters

The air medium is defined using the 9th NULL constitutive equation and the 1st equation of state [38]. The detailed parameters of the model are shown in Table 3.

3.3.4. Explosive Equation of State and Parameters

The main charge explosive uses the Constitutive Model of High-Energy Explosive No. 8, and the JWL Equation No. 2 is employed to describe its state during detonation. The parameters for emulsion explosives can be found in the literature [39]. Meanwhile, to simulate the initiation process of peripheral explosives under the impact of energetic jets, the peripheral charge is described using the Constitutive Model of Material No. 10 and the Triangular Ignition Growth State Equation No. 7. The Triangular Ignition Growth Model was proposed by Lee and Tarver based on data obtained from the multi-hotspot ignition hypothesis and cylindrical tests [40], and it is one of the most widely used reaction rate models. The Lee-Tarver Triangular Ignition Growth Model primarily includes the state equations for both unreacted and reacted explosives, as well as the reaction rate equation. For unreacted and reacted explosives, the JWL equation is typically used to describe their expansion pressure. The state equation is given in Equation (4), and the JWL parameters for the peripheral charge are listed in Table 4.
P e = A e 1 ω R 1 V e e R 1 V e + B e 1 ω R 2 V e e R 2 V + ω E o V e
The initiation reaction of the explosive under impact mainly consists of three stages: The first stage is the formation and ignition of hotspots. The second stage is the slow reaction growth of the hotspots. The third stage is the convergence of the reaction hotspots. During this stage, the large-scale reaction is rapidly completed under high temperature and pressure. The expression for its state equation is given by Equation (5):
d λ d t = I ( 1 λ ) b ( ρ ρ 0 1 a ) x + G 1 ( 1 λ ) c λ d p y + G 2 ( 1 λ ) e λ g p z
In the equation, the first term is the ignition term, corresponding to the first stage of the triple-reaction-rate equation; the second term is the growth term, corresponding to the second stage; and the third term is the completion term, corresponding to the third stage.
λ is the explosive reaction degree, and t is the reaction time. The adjustable constants a, b, c, d, e, g, x, y, z, I, G1, and G2 control the impact initiation sensitivity of explosives. Due to limited data on the equation of state for No. 2 rock emulsion explosives, relevant parameters were determined by referring to those of the most similar emulsion explosives, as shown in Table 4 [41].

3.4. Validation of Simulation Method

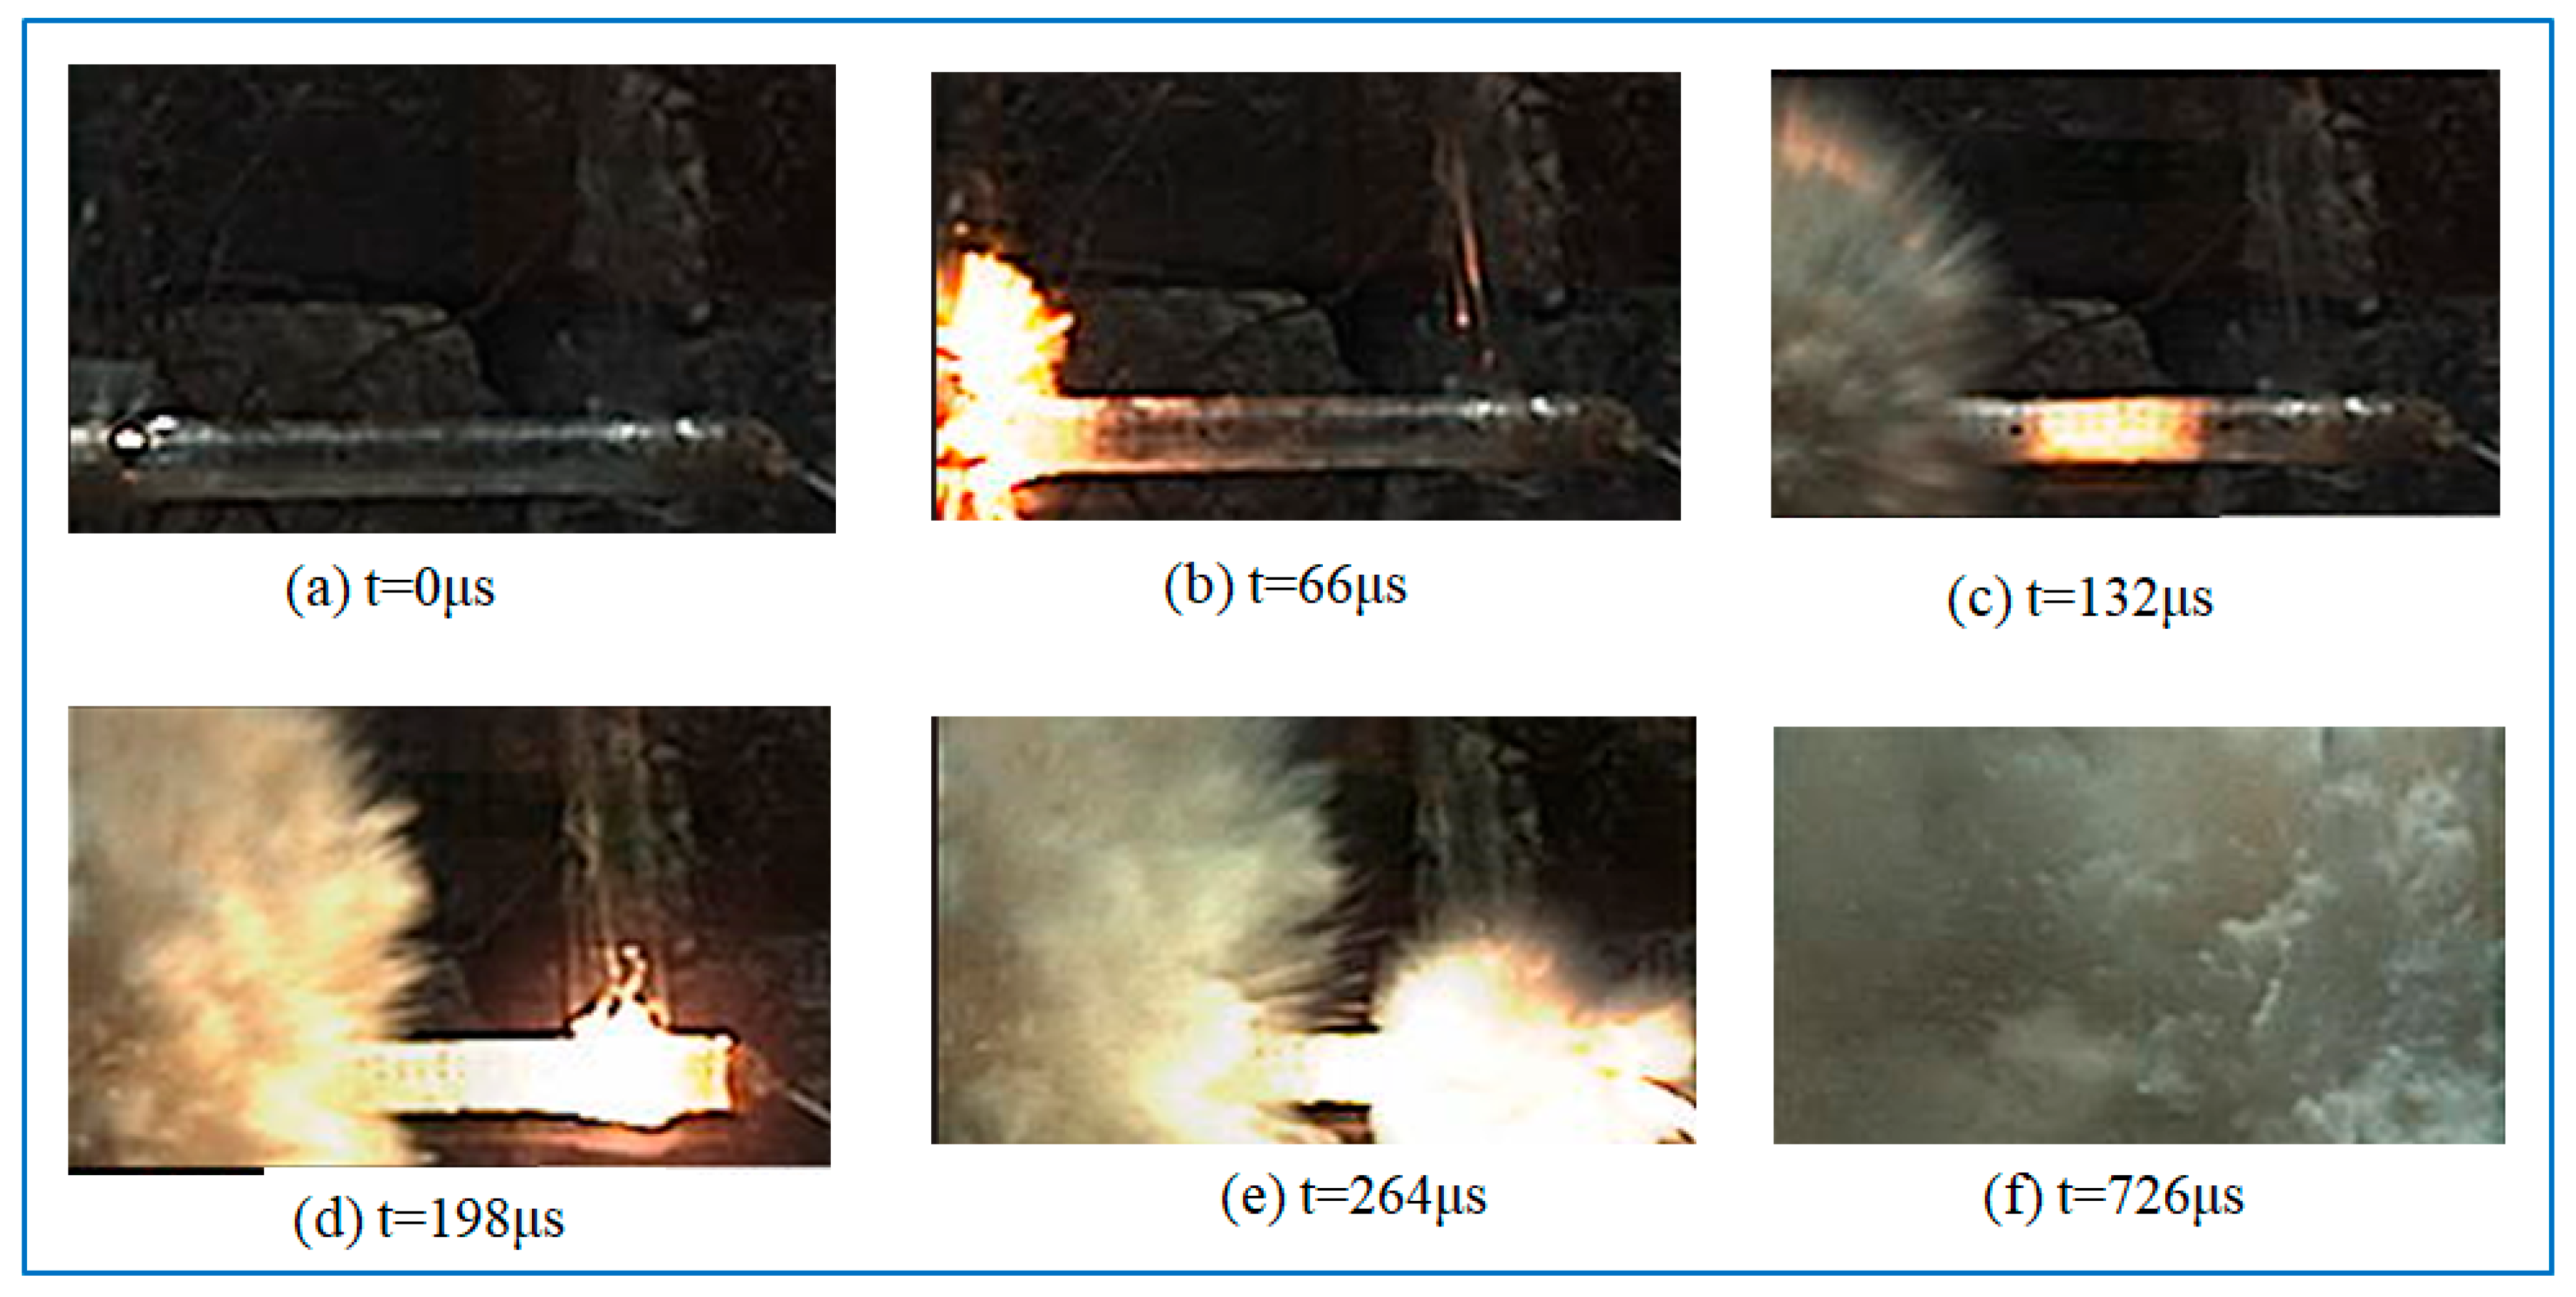
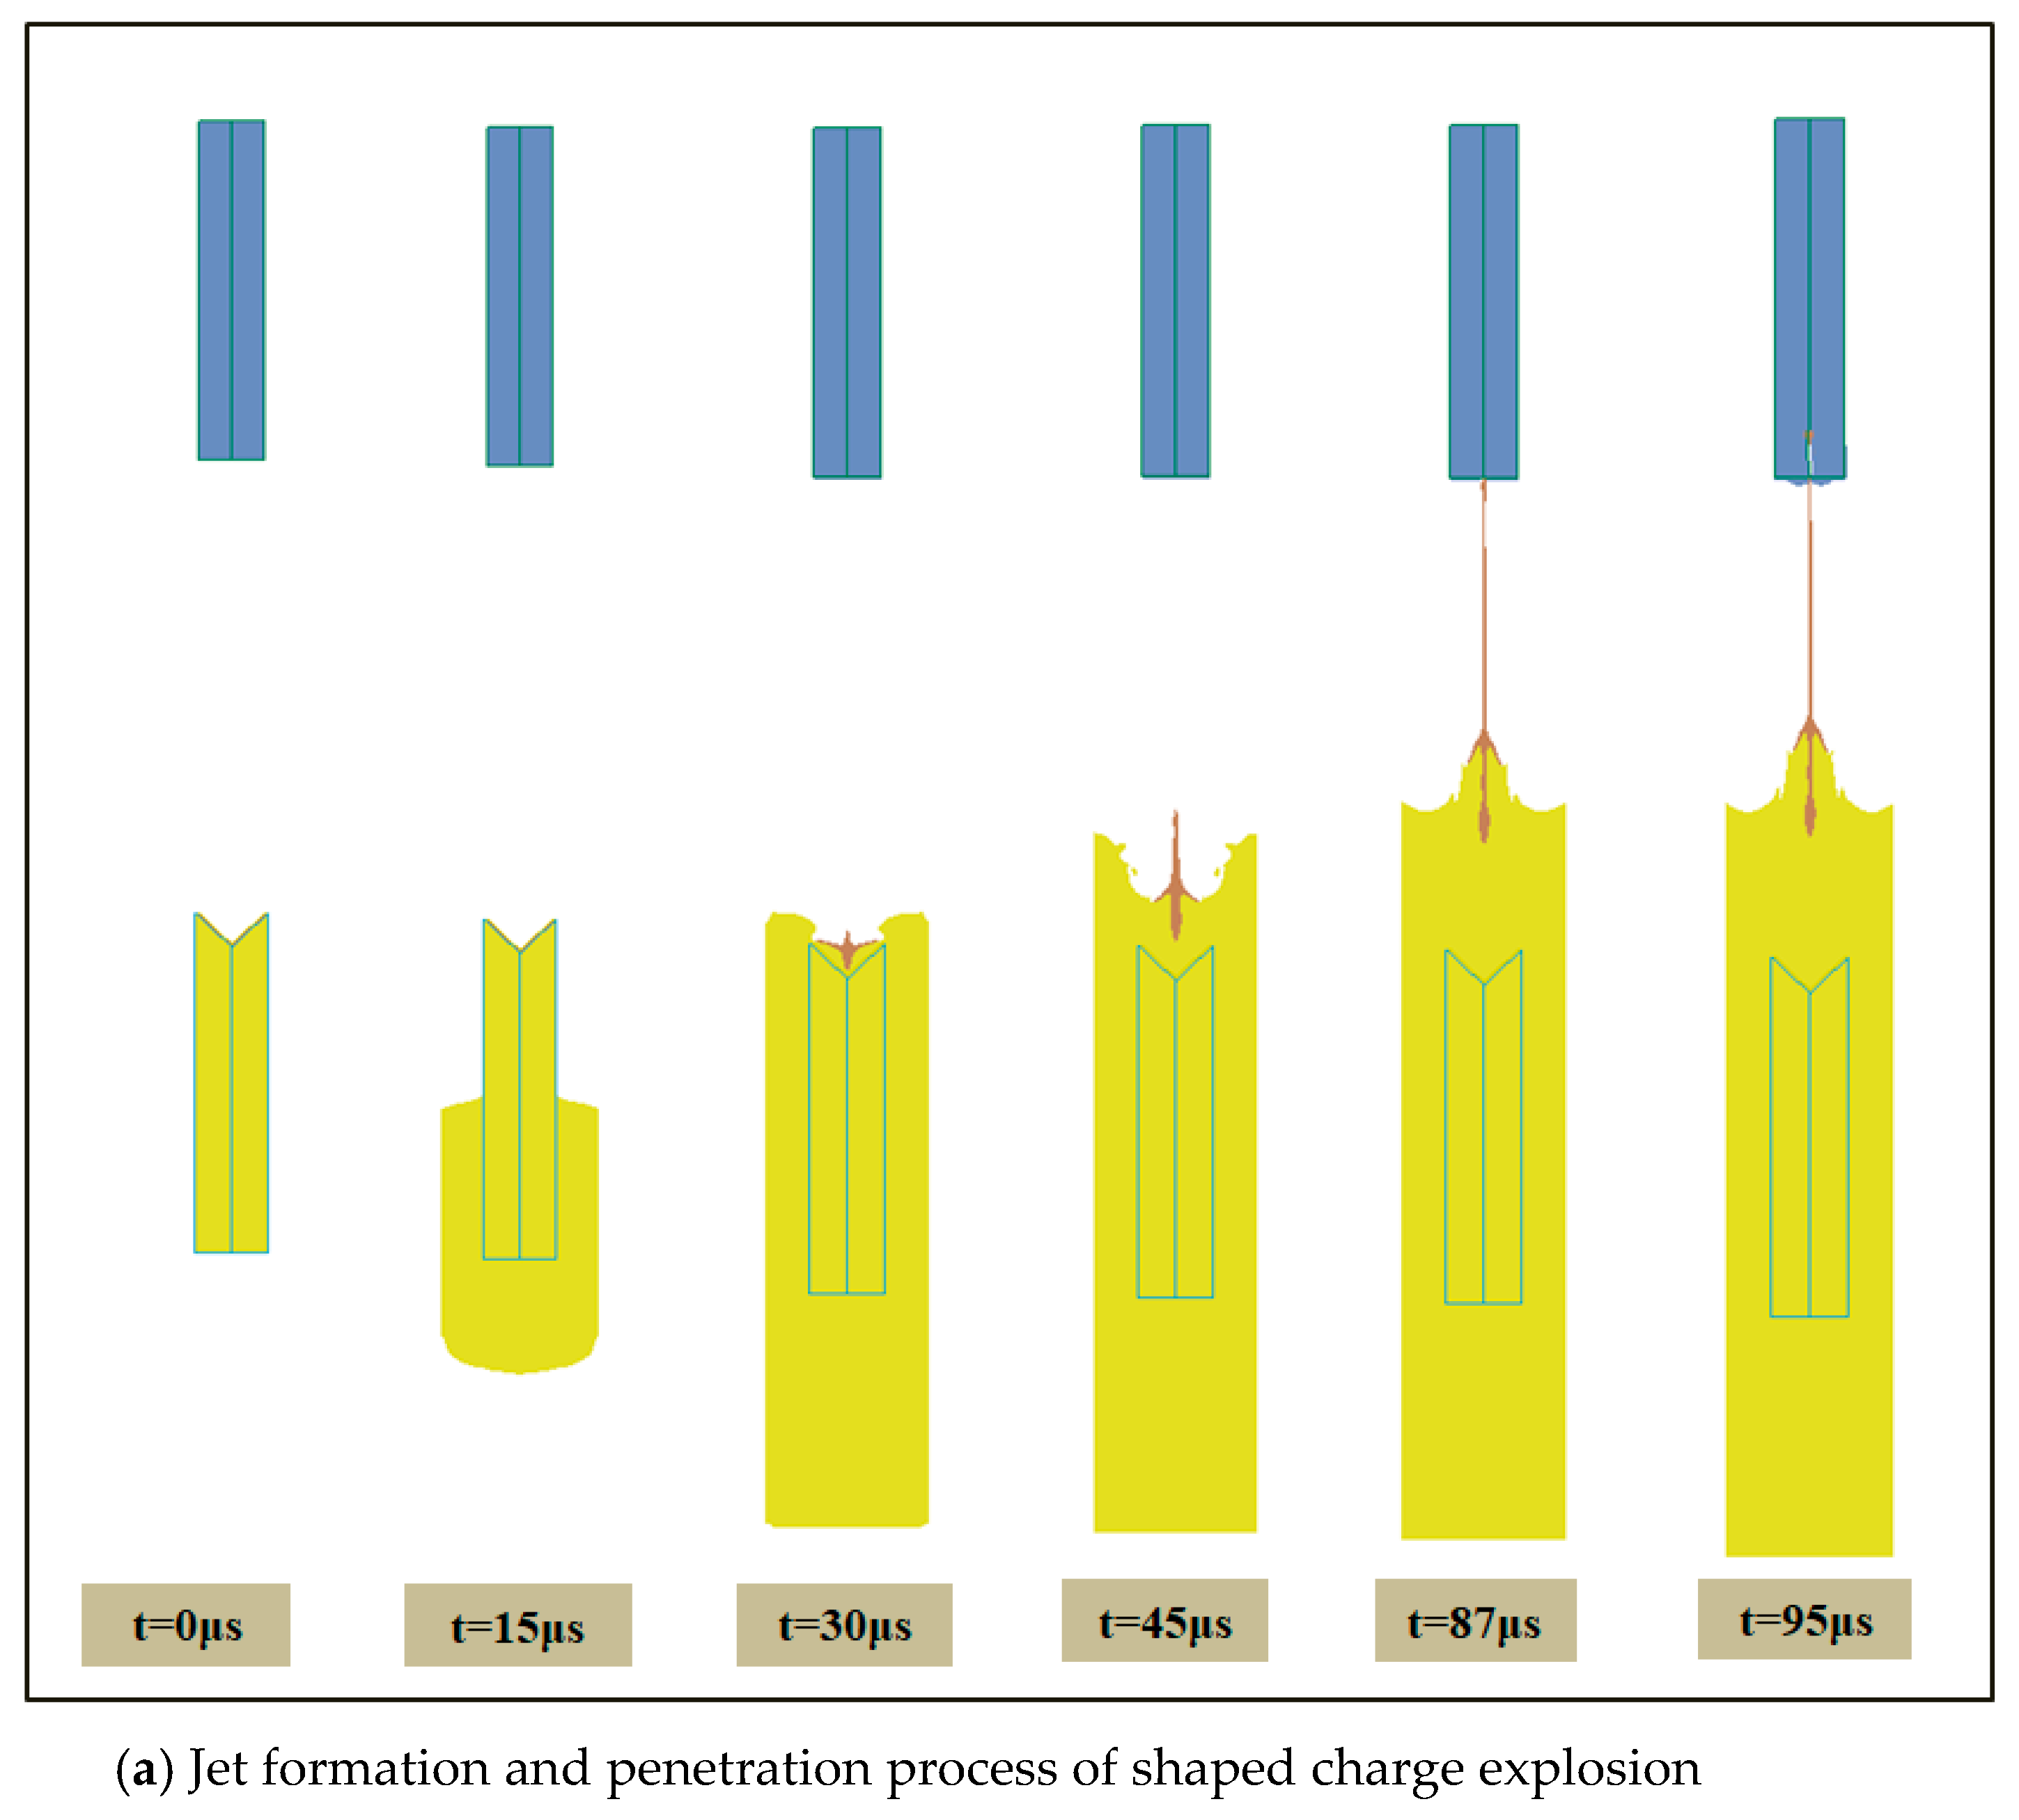
Before conducting the optimization simulation of the shaped charge blasting based on the shaped charge liner, a model test was performed (see Figure 5). The purpose of this test was to provide a theoretical basis for the calibration of calculation parameters in the simulation [42]. Additionally, the results of the model test were used for the calibration and optimization of parameters in subsequent numerical simulations. In the model experiment, the explosive used was Rock No. 2 emulsified explosive, with both the main charge and the secondary charge having a length of 7 cm and a spacing of 25 cm between them. The boundary condition was provided by an acrylic plate, and high-speed photography instruments were arranged at a certain distance for observation.
According to the high-speed photography results shown in Figure 6, the main charge begins to detonate at 0 μs, and at 264 μs the initiated charge exhibits intense reactions accompanied by strong light, indicating that the jet has successfully penetrated the initiated charge. Under the impact of the jet, a large amount of detonation products from the initiated charge begin to spread outward at 726 μs. Model experiments show that when the confinement condition is a plexiglass plate with a spacing of 25 cm, the initiated charge can undergo detonation. Based on the high-speed camera footage, the expansion velocity of the reaction products from the initiated charge is calculated to be approximately 1668 m/s. Since the confinement conditions of the tunnel surrounding rock are superior to the plexiglass plate in the model experiments, it is reasonable to infer that in subsequent experiments, by ensuring that the segmental charge is greater than 70 g and setting the distance between the segmental charges to 20 cm, the conditions will be met for the initiated charge to successfully detonate.
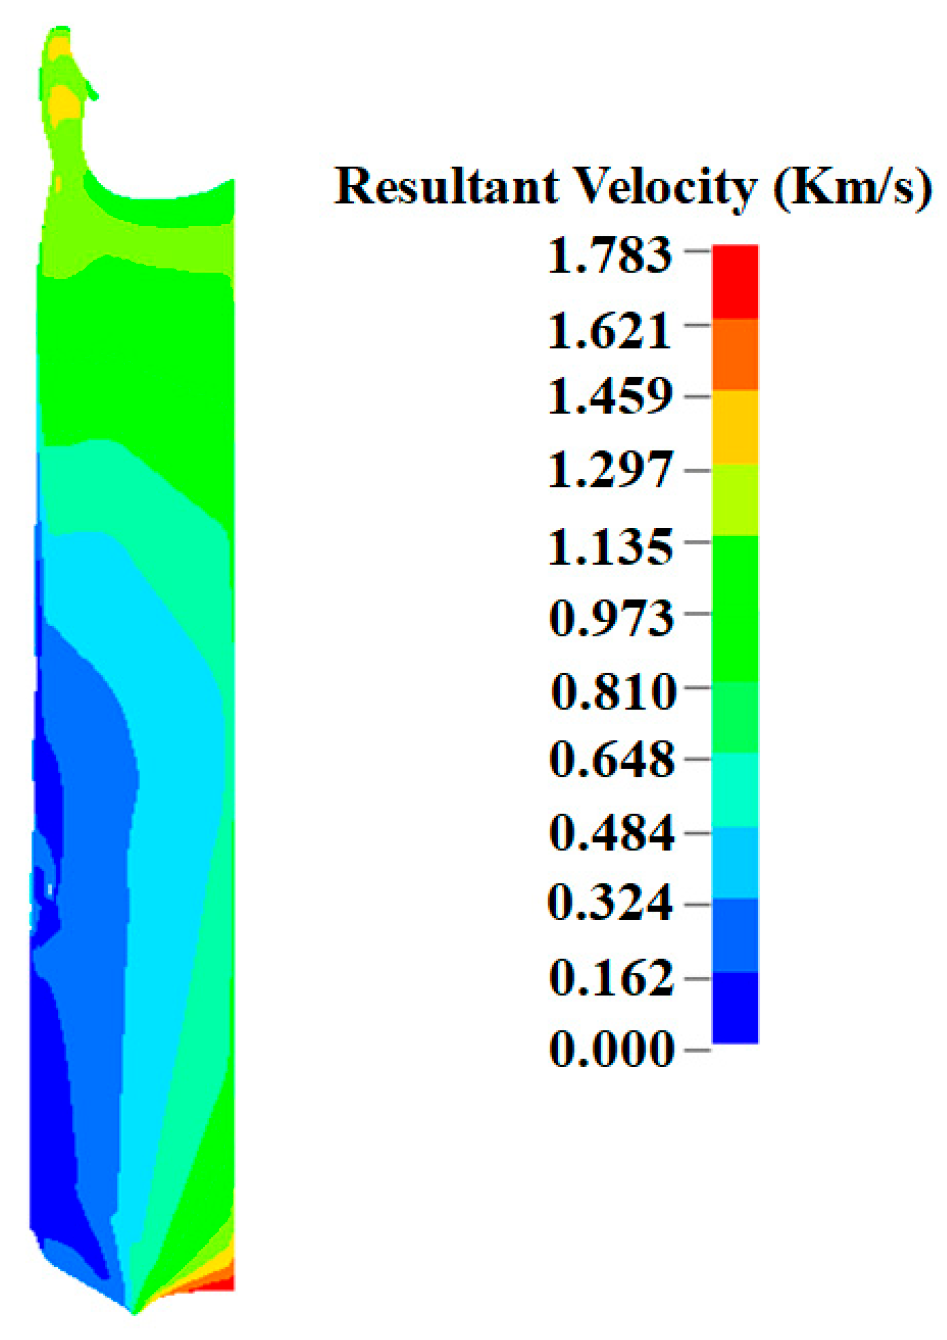
Figure 7 presents the expansion velocity contour map of the reaction products from the initiated charge obtained through numerical simulation of the energetic jet penetration of emulsified explosives. The maximum detonation velocity is found to be approximately 1783 m/s. Based on the results of both numerical simulations and model experiments on explosive detonation, it can be concluded that the expansion velocities of the reaction products obtained by both methods are of the same order of magnitude. The maximum difference between the simulation and experimental results is 6.4%, which suggests that the model parameters and grid size used in the calculations are reasonable and effective.

4. Numerical Simulation Result Analysis

4.1. Formation and Motion Regularity of Shaped Charge Jet

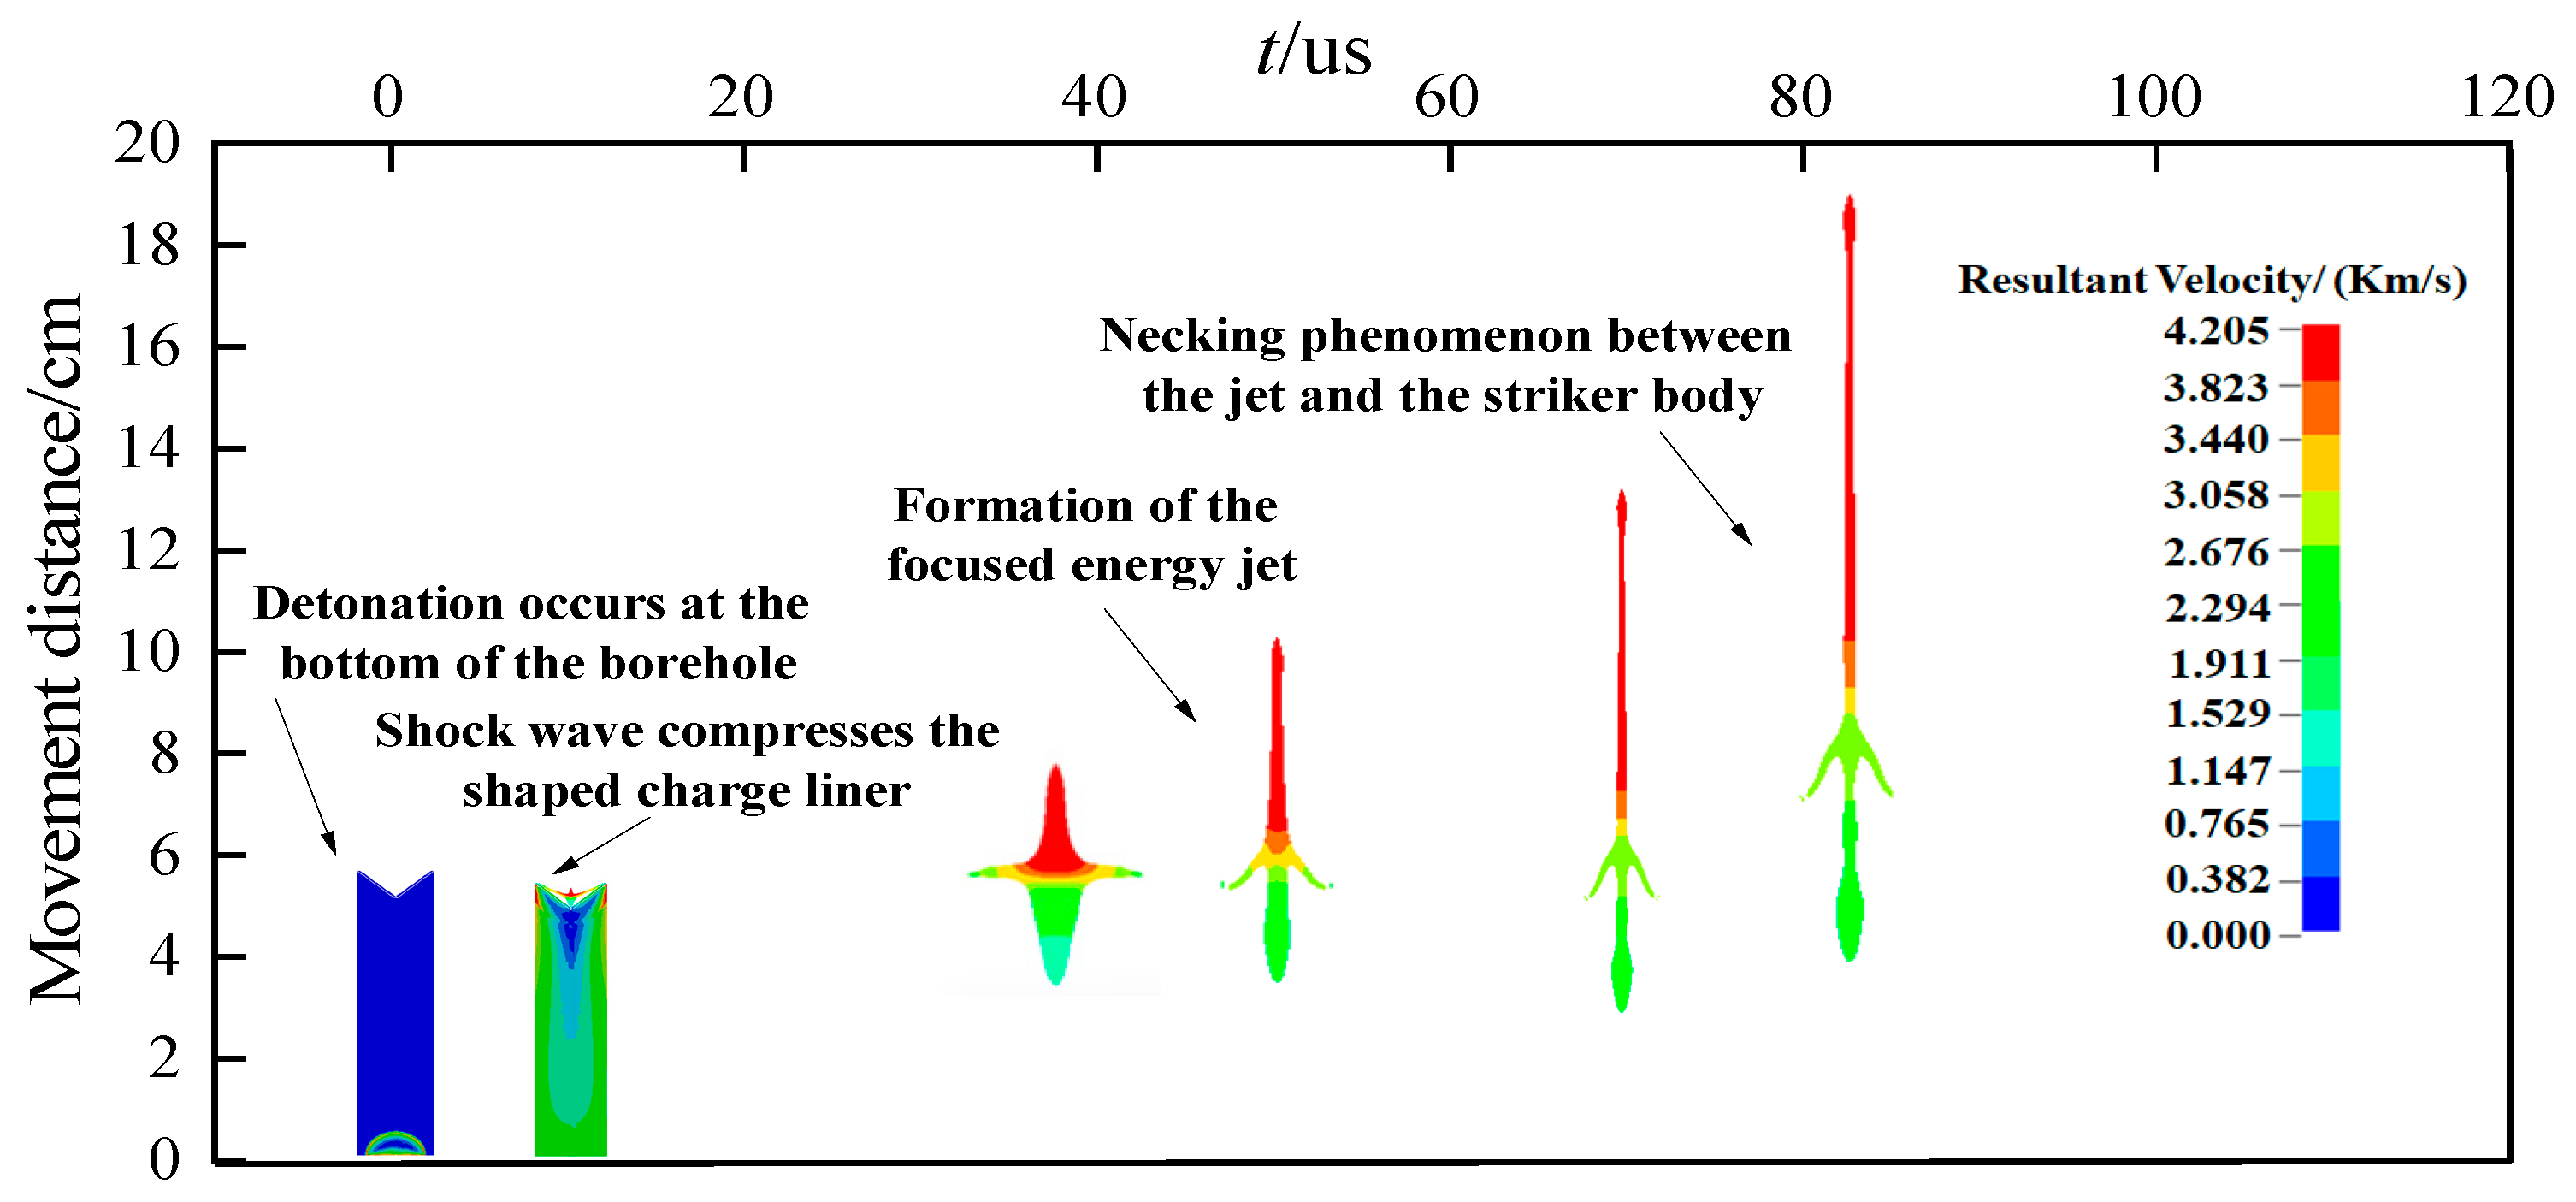
To reveal the formation law of the shaped charge jet, a typical scenario with L1/L2 = 1 was selected, and the velocity contour maps at different time moments corresponding to the shaped charge jet are shown in Figure 8 for analysis.
As shown in Figure 8, based on the morphology of the jet, after the collapse of the energy concentrator (at 12.5 µs), the shaped charge begins to deform under pressure. Between 30 µs and 50 µs, the jet is formed. The jet velocity is significantly greater than the velocity of the slug, and thus, as the jet length increases, a clear “body contraction” phenomenon occurs at 82 µs. According to the velocity contour map, during the formation of the energetic jet, the velocity of the jet’s head at the moment it exits the shaped charge nozzle is approximately 3900 m/s. After a period of motion (25 µs), the velocity of the jet’s head reaches approximately 4205 m/s, indicating that the velocity of the jet head continues to change. Meanwhile, during its motion, there is a distinct velocity gradient at different locations of the jet, which leads to the stretching of part of the jet [43]. According to numerical simulations, at 82 µs, the jet length reaches 15 cm and the jet head moves 19.2 cm. At this point, the velocity difference between the jet and the slug increases significantly. It is expected that as the energetic jet continues to move (i.e., with a larger charge spacing), the jet will gradually break into discontinuous segments.
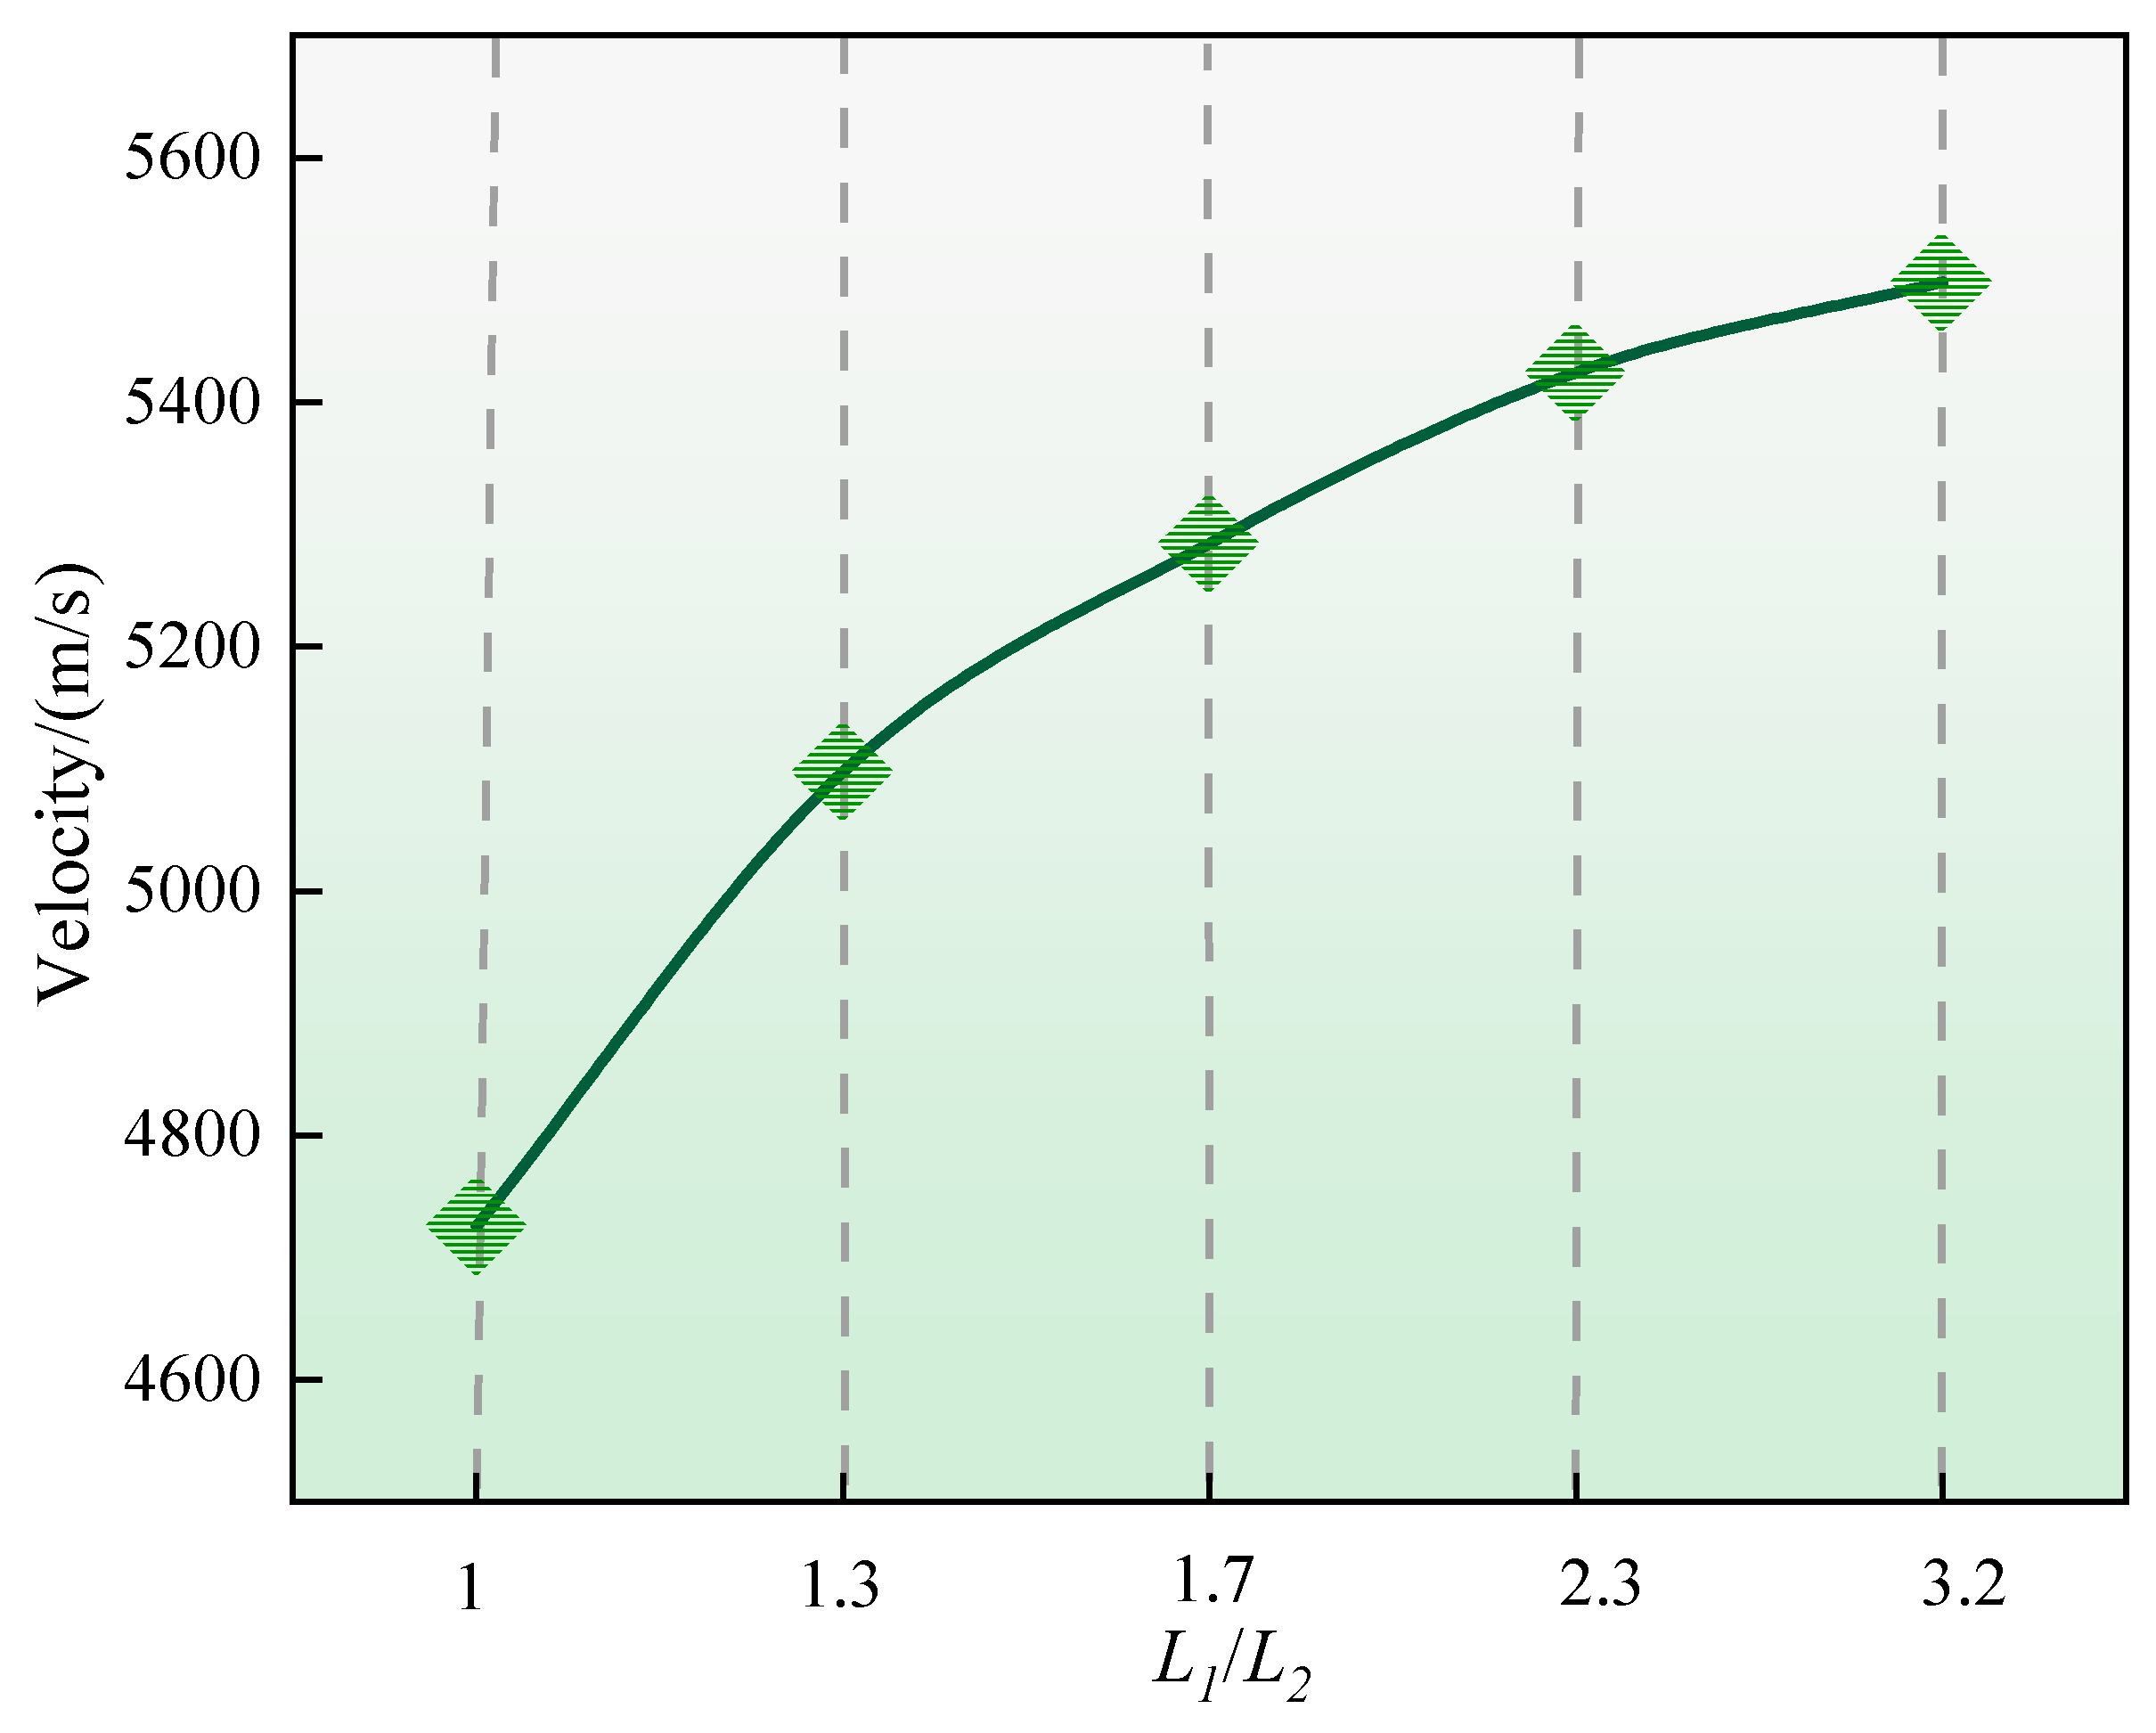
The peak jet velocity was extracted from Figure 8 to form Figure 9 in order to reveal the variation pattern of the energetic jet velocity at different L1/L2 ratios. As shown in Figure 9, with the increase in the L1/L2 ratio, the main charge amount also increases, and the energetic jet velocity shows a certain upward trend. However, when the L1/L2 ratio further increases, the rate of velocity increase gradually slows down. It can be inferred that an increase in the main charge amount (i.e., an increase in the L1/L2 ratio) is beneficial for the formation and velocity enhancement of the energetic jet. However, this increase in velocity becomes more gradual as the L1/L2 ratio further increases.

4.2. Numerical Results of Emulsion Explosive Shock Initiation

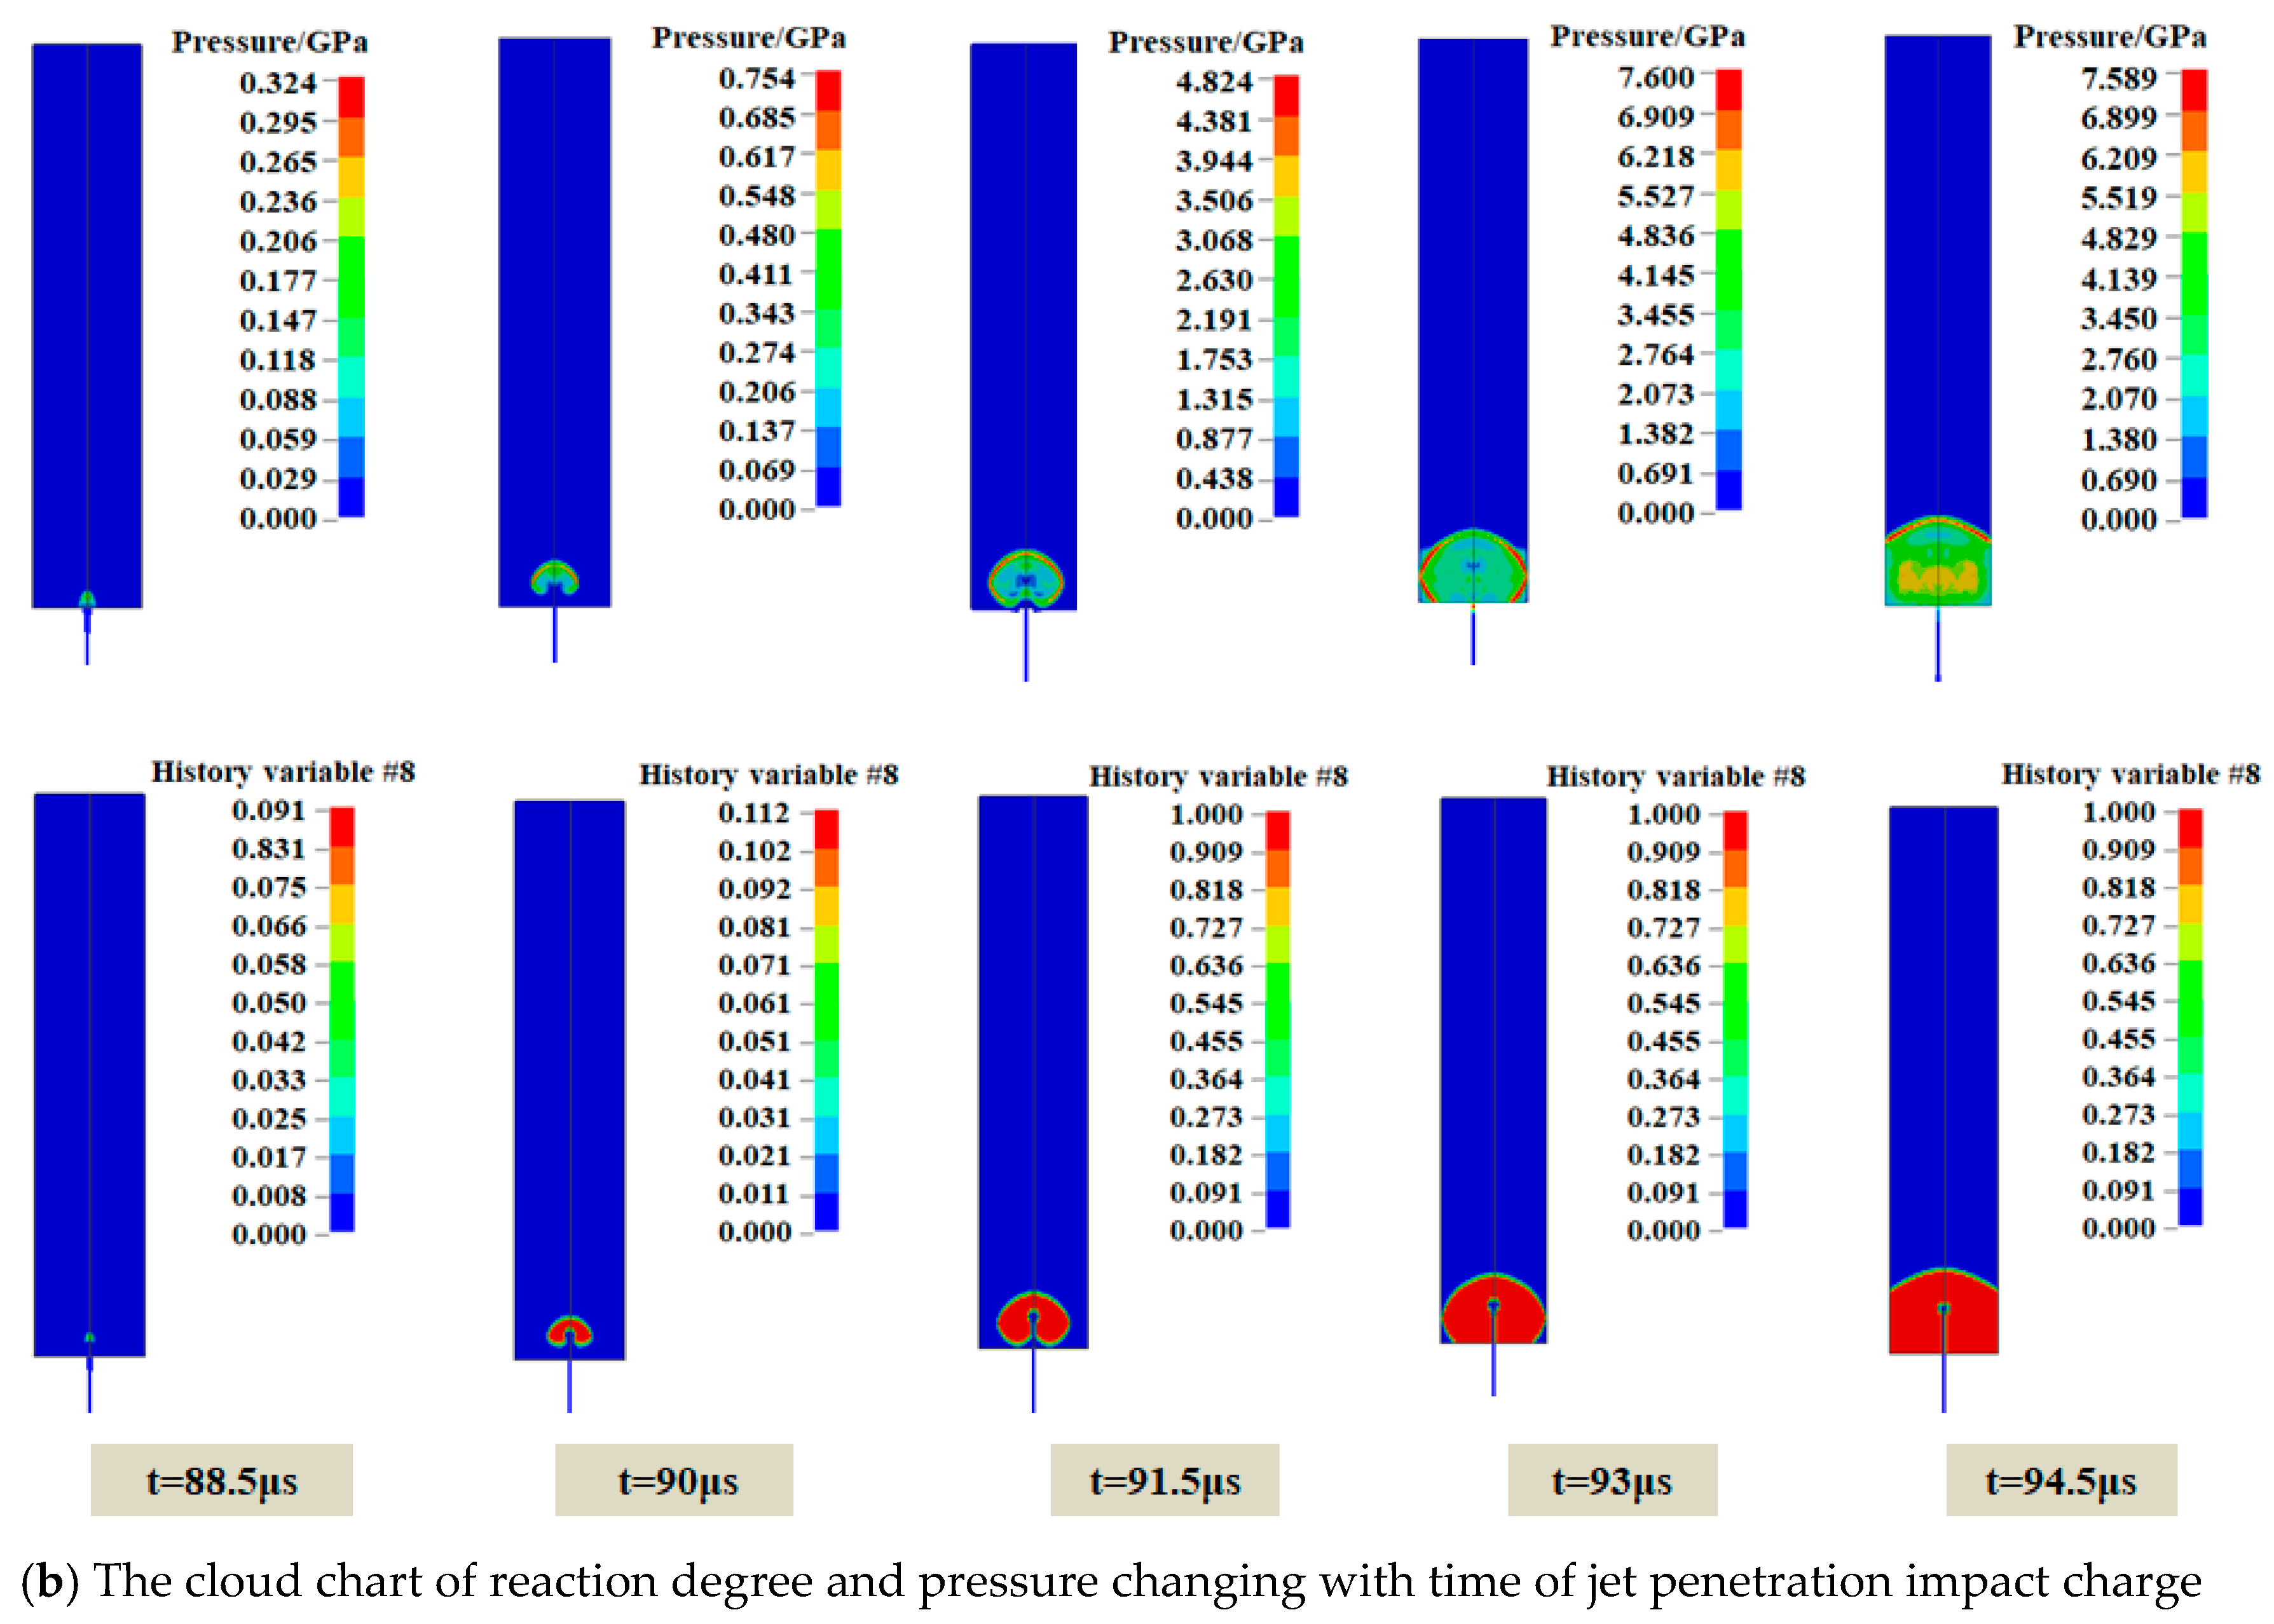
Using the LS-DYNA software’s ALE fluid–solid coupling method, the process of axial energetic charge explosion forming a jet and its impact on the initiation of the secondary charge was reproduced. The numerical simulation results of the energetic charge explosion forming a jet and impacting the initiation of the secondary charge in the L1/L2 = 1 scenario were further analyzed, with the results shown in Figure 10. The detailed analysis is as follows.
The simulation results from Figure 10a,b show that at approximately 88.5 μs, the shockwave generated by the jet impact reaches the surface of the secondary charge, with a peak pressure of about 324 MPa. At this moment, local hotspots in the secondary charge begin to react (λ = 0.09). At around 90 μs, the peak pressure of the secondary charge reaches approximately 754 MPa, at which point the local hotspots in the secondary charge gradually increase and react (reaction degree λ = 0.14). At around 91.5 μs, the peak pressure of the secondary charge reaches approximately 7.6 GPa, at which point multiple hotspots in the secondary charge progressively increase and react (reaction degree λ = 1). As the shockwave generated by the jet impact continues to propagate through the explosive, the pressure of the shockwave gradually increases due to localized reactions in the explosive. From the changes in peak pressure of the secondary charge, it can be observed that between 91.5 and 93 μs a significant step increase in shockwave pressure occurs, indicating that the shockwave has developed into a detonation wave. After this, the peak pressure of the secondary charge stabilizes at approximately 7.6 GPa, maintaining a steady detonation, which is significantly higher than the detonation pressure of emulsified explosives at 3.68 GPa [44]. As shown in Figure 10b, at t = 93 μs, the critical penetration length for the detonation of the secondary charge is 2.6 cm. Therefore, under the experimental conditions of this study, when the minimum length of the secondary charge is greater than 2.6 cm, it can ensure normal detonation. Based on the results presented in Section 4.1 and Section 4.2, the L1/L2 ratio should be maintained within an appropriate range to ensure both a sufficient shaped jet velocity and an adequate length of the secondary charge necessary for reliable detonation transfer.

4.3. Analysis of Stress Propagation Process and Damage Characteristics of Surrounding Rock

4.3.1. Stress Propagation and Damage Evolution Process of Surrounding Rock

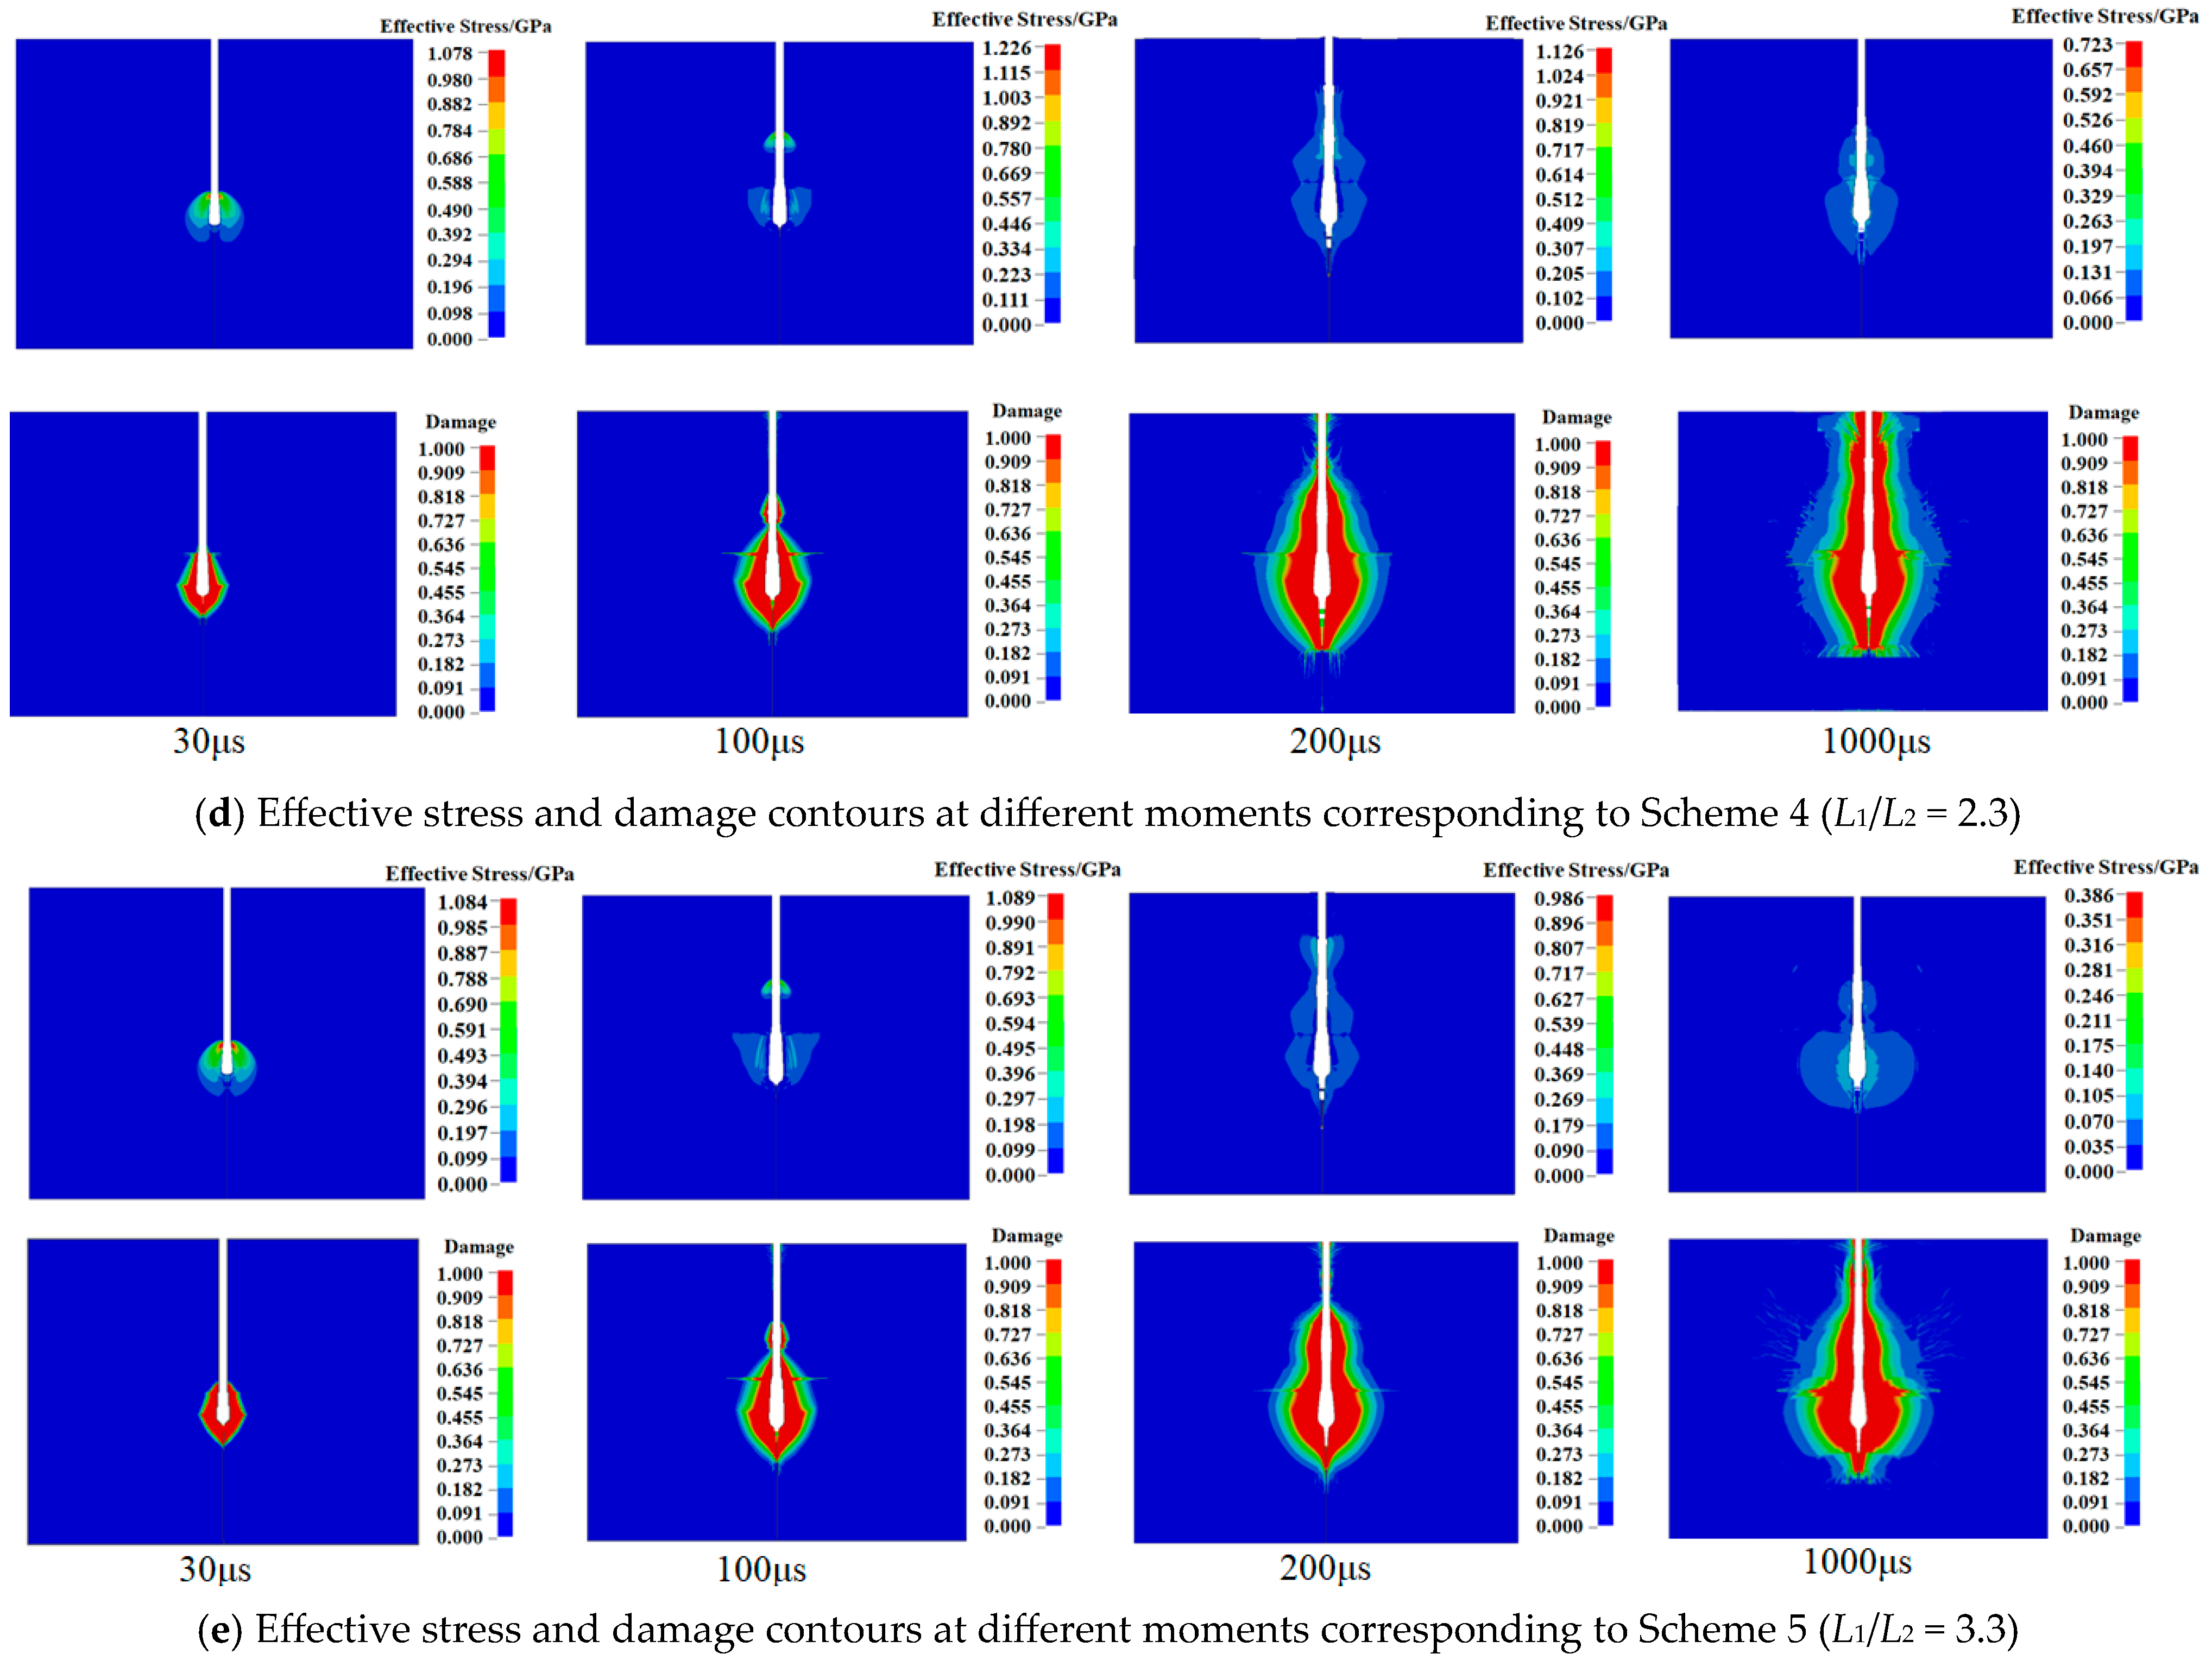
Figure 11 illustrates the stress wave propagation and damage evolution in surrounding rock at various time intervals. It also compares the blasting damage effects of the five different schemes. The analysis proceeds as follows.
Figure 11 shows the dynamic evolution characteristics of the blast process in boreholes under different schemes. Overall, in the five schemes above, during the initial stage, after the initiation of the charge at the bottom of the borehole, the detonation products violently impact the borehole wall, forming strong shock waves near the wall. As the detonation products propagate along the borehole, new shock waves continuously form near the borehole wall. Over time, the shock wave gradually propagates deeper into the rock mass and attenuates into a stress wave. In this stage (t = 30 μs), the combined effect of the stress wave generated by the explosive and the detonation gases causes the rock damage to extend radially along the borehole. The peak effective stress on the borehole wall is approximately 1.23 GPa (Figure 11d), much higher than the rock’s compressive strength of 89 MPa, indicating that the rock experiences a significant dynamic load at this stage. The surrounding rock at the bottom of the borehole is the first to be damaged. As the explosion time increases, after the energetic jet formed by the shaped charge detonates the secondary charge in the borehole (t = 100 μs), an elliptical damage zone forms around the secondary charge. Subsequently, at the upper rock mass of the borehole, reflected tensile waves combine with stress waves generated by explosives at different locations, resulting in a complex superposition (t = 1000 μs), ultimately completing the dynamic fracturing process of the rock.
From Figure 11, it can be concluded that when the L1/L2 ratio is between 1 and 1.3, the distance between the charge at the center of the borehole and the free surface is relatively small. Under this condition, the damage range of the surrounding rock at the borehole mouth and the borehole center is more pronounced. However, due to the significant confinement effect of the surrounding rock at the borehole bottom and the smaller charge amount, the damage effect on the surrounding rock at the borehole bottom is poor. When the L1/L2 ratio is between 1.7 and 2.3, the blasting damage is distributed more uniformly along the axial direction of the borehole and the blasting damage effect is more ideal. When the L1/L2 ratio is between 1.7 and 2.3, the blasting damage is distributed more uniformly along the axial direction of the borehole and the blasting damage effect is more ideal. The above analysis indicates that the L1/L2 ratio has a significant impact on the blasting effect. Optimizing this ratio can effectively improve the blasting damage to the surrounding rock, providing an important reference for practical engineering applications.

4.3.2. The Change Rule of Fractal Dimensions

Developed by Mandelbrot in the 1970s, fractal theory posits that geometric dimensions can be integers or fractional values, enabling quantitative characterization of irregular patterns with self-similarity through fractal geometry [45]. Subsequently, researchers began correlating rock damage with fractal dimensions to quantitatively analyze the damage characteristics of rock masses under blast-induced dynamic loading.
ω = Δ D f D 0 = D f D 0 D 0
where D0 is the fractal dimension of the damage area after blasting, Df is the fractal dimension of the original damage area, and ΔDf is the incremental fractal dimension caused by crack propagation-induced damage extension during blasting.
It is well known that there is a significant linear relationship between rock mass damage and the fractal dimension (Df) under dynamic loading, meaning that the smaller the Df value, the lower the degree of rock damage. Therefore, the Df value can be used to quantitatively describe the variation pattern of rock damage. This relationship enables quantitative characterization of rock damage evolution through Df monitoring. The box-counting dimension has been widely applied in damage quantification due to its intuitive characterization of spatial distribution patterns in target regions and computationally efficient methodology [46]. The calculation principle involves covering the image with grids of side length δ , counting the number of grids N ( δ ) containing image pixels, and iteratively reducing δ . When it approaches 0, the value can be obtained:
D f = lim δ 0 lg N ( δ ) lg δ
Since it is difficult to make the box size δ in the equation approach zero during the calculation, multiple sets of data for δ and N ( δ ) are usually obtained. These data are then processed logarithmically and linearly fitted in a double logarithmic coordinate system to obtain Equation (8). The slope Df is defined as the fractal dimension [47].
lg N ( δ ) = D f lg δ + b
where N ( δ ) is the number of boxes containing image information and δ is the size of the box.
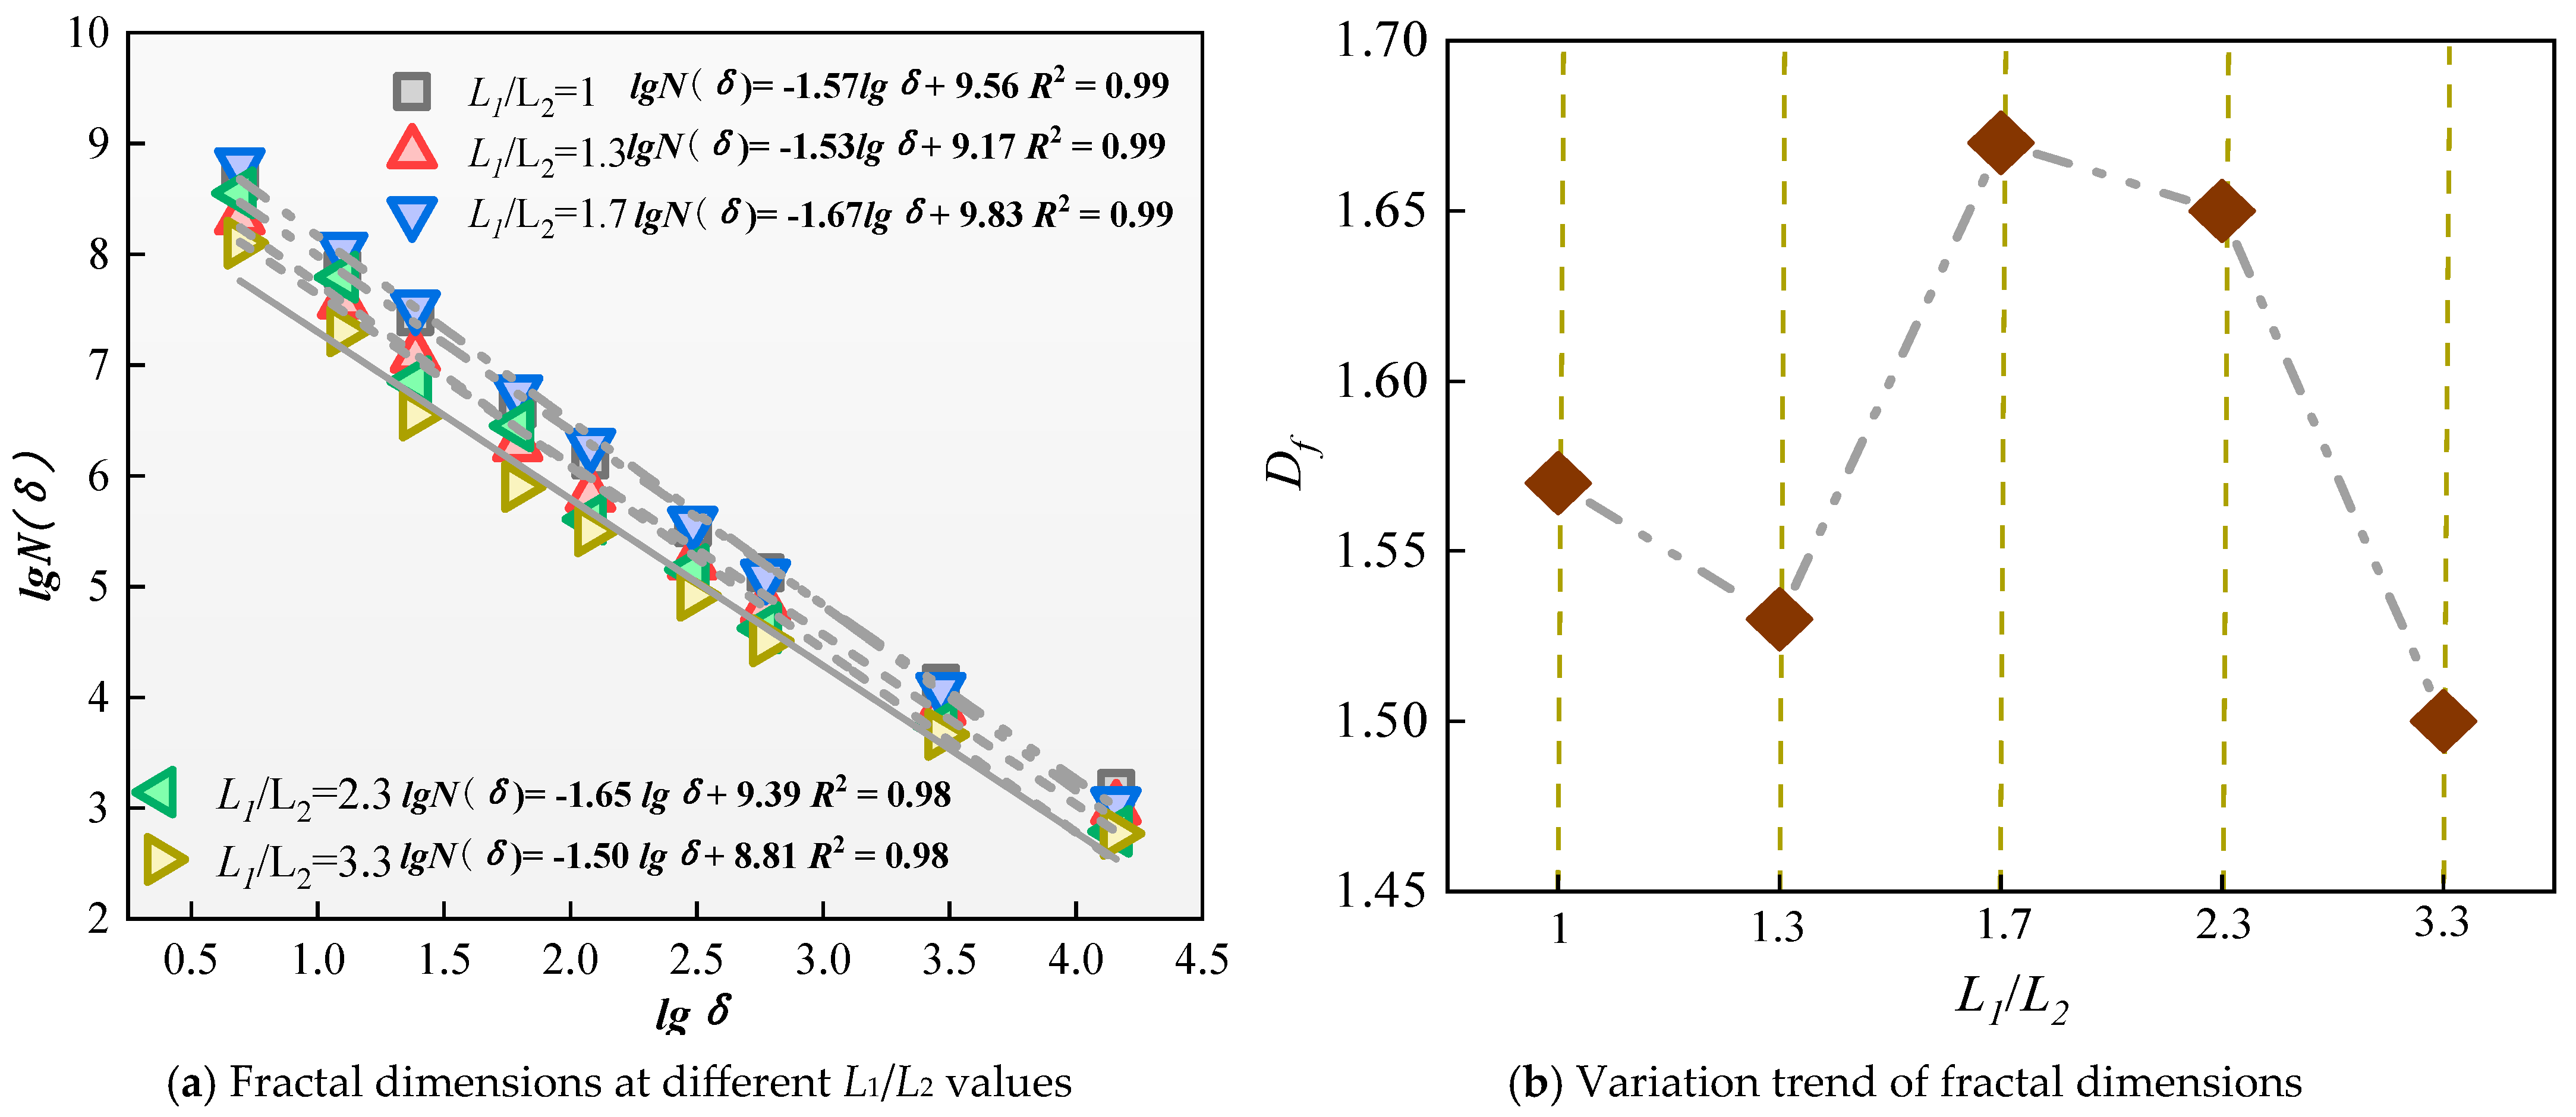
The calculation of the fractal dimension based on the definition of the box-counting dimension in the equation is carried out as follows. First, the post-processing software LS-Prepost (version 4.7) is used to select a reasonable blasting damage cloud image. Then, the ImageJ image processing software (version v1.8.0) is employed to adjust the file threshold and perform the corresponding binary image processing. After that, the number of boxes is set, and the binary image can be automatically identified (the process is shown in Figure 12). Subsequently, the fractal dimension of the image is calculated. Finally, the exported image and related data are subjected to quantitative analysis [48], and the statistical results are shown in Figure 13.
Based on the overall damage fractal characteristics of the model shown in Figure 14, it can be observed that as the L1/L2 ratio increases, the fractal dimension (Df) first increases and then decreases. The corresponding fractal dimension (Df) increases from 1.57 to 1.67 and then decreases to 1.5. The overall damage classification effect of the model is optimal when the L1/L2 ratio is in the range of 1.7 to 2.3. This indicates that a moderate increase in the L1/L2 ratio and a reduction in the length of the secondary charge can effectively enhance the damage effect at the bottom of the borehole and appropriately ensure the formation of damage in the middle and upper parts of the borehole. The degree and uniformity of rock fragmentation are more reasonable compared to other L1/L2 values. In other words, when the L1/L2 ratio falls within this range, while ensuring sufficient fragmentation of the rock mass at the bottom of the borehole, the blast stress wave induces stronger tensile stress in the upper part of the model, thereby improving the uniformity of axial rock mass damage distribution along the borehole. Therefore, optimizing this ratio is of great significance for enhancing the smoothness of the blast contour and improving the fragmentation effect in the surrounding hole regions of tunnel engineering.

4.3.3. Analysis of Blasting Effective Stress and Damage Effect

In addition to the fractal dimension index, the effective stress and the uniformity of damage in the units are also crucial for evaluating the blasting damage effects of surrounding holes [49]. To better quantify the impact of different schemes on blasting damage effects, the peak effective blasting stress and damage degree data from the monitored unit points in Figure 3 were extracted, and based on these Figure 14, Figure 15 and Figure 16 were created to quantitatively describe the blasting damage effects.
From Figure 14, it can be concluded that with the increase in the L1/L2 ratio, the effective stress values at each measurement point exhibit a certain trend of variation. Specifically, when the ratio increases from 1 to 3.3, the average effective stress at the measurement points along the borehole increases from 85.18 MPa to 97.2 MPa and then decreases to 83.2 MPa. This indicates that the average peak stress significantly changes with adjustments to the L1/L2 ratio. In the axial direction of the borehole, the bottom and middle areas are primarily subjected to compression failure caused by the explosive stress wave and the combined effects of the explosion gases, while from the free surface to the borehole opening, the destruction is mainly caused by the reflected tensile waves. When L1/L2 = 3.3, since the explosives are mainly concentrated at the bottom of the borehole, the effective stress at the borehole opening is lower, resulting in less damage at the opening. When the ratio is too small (L1/L2 < 1.7), the effective stress near the bottom of the borehole is relatively low, and the surrounding rock at the borehole bottom is significantly constrained during blasting, which inhibits the development of damage in the surrounding rock.
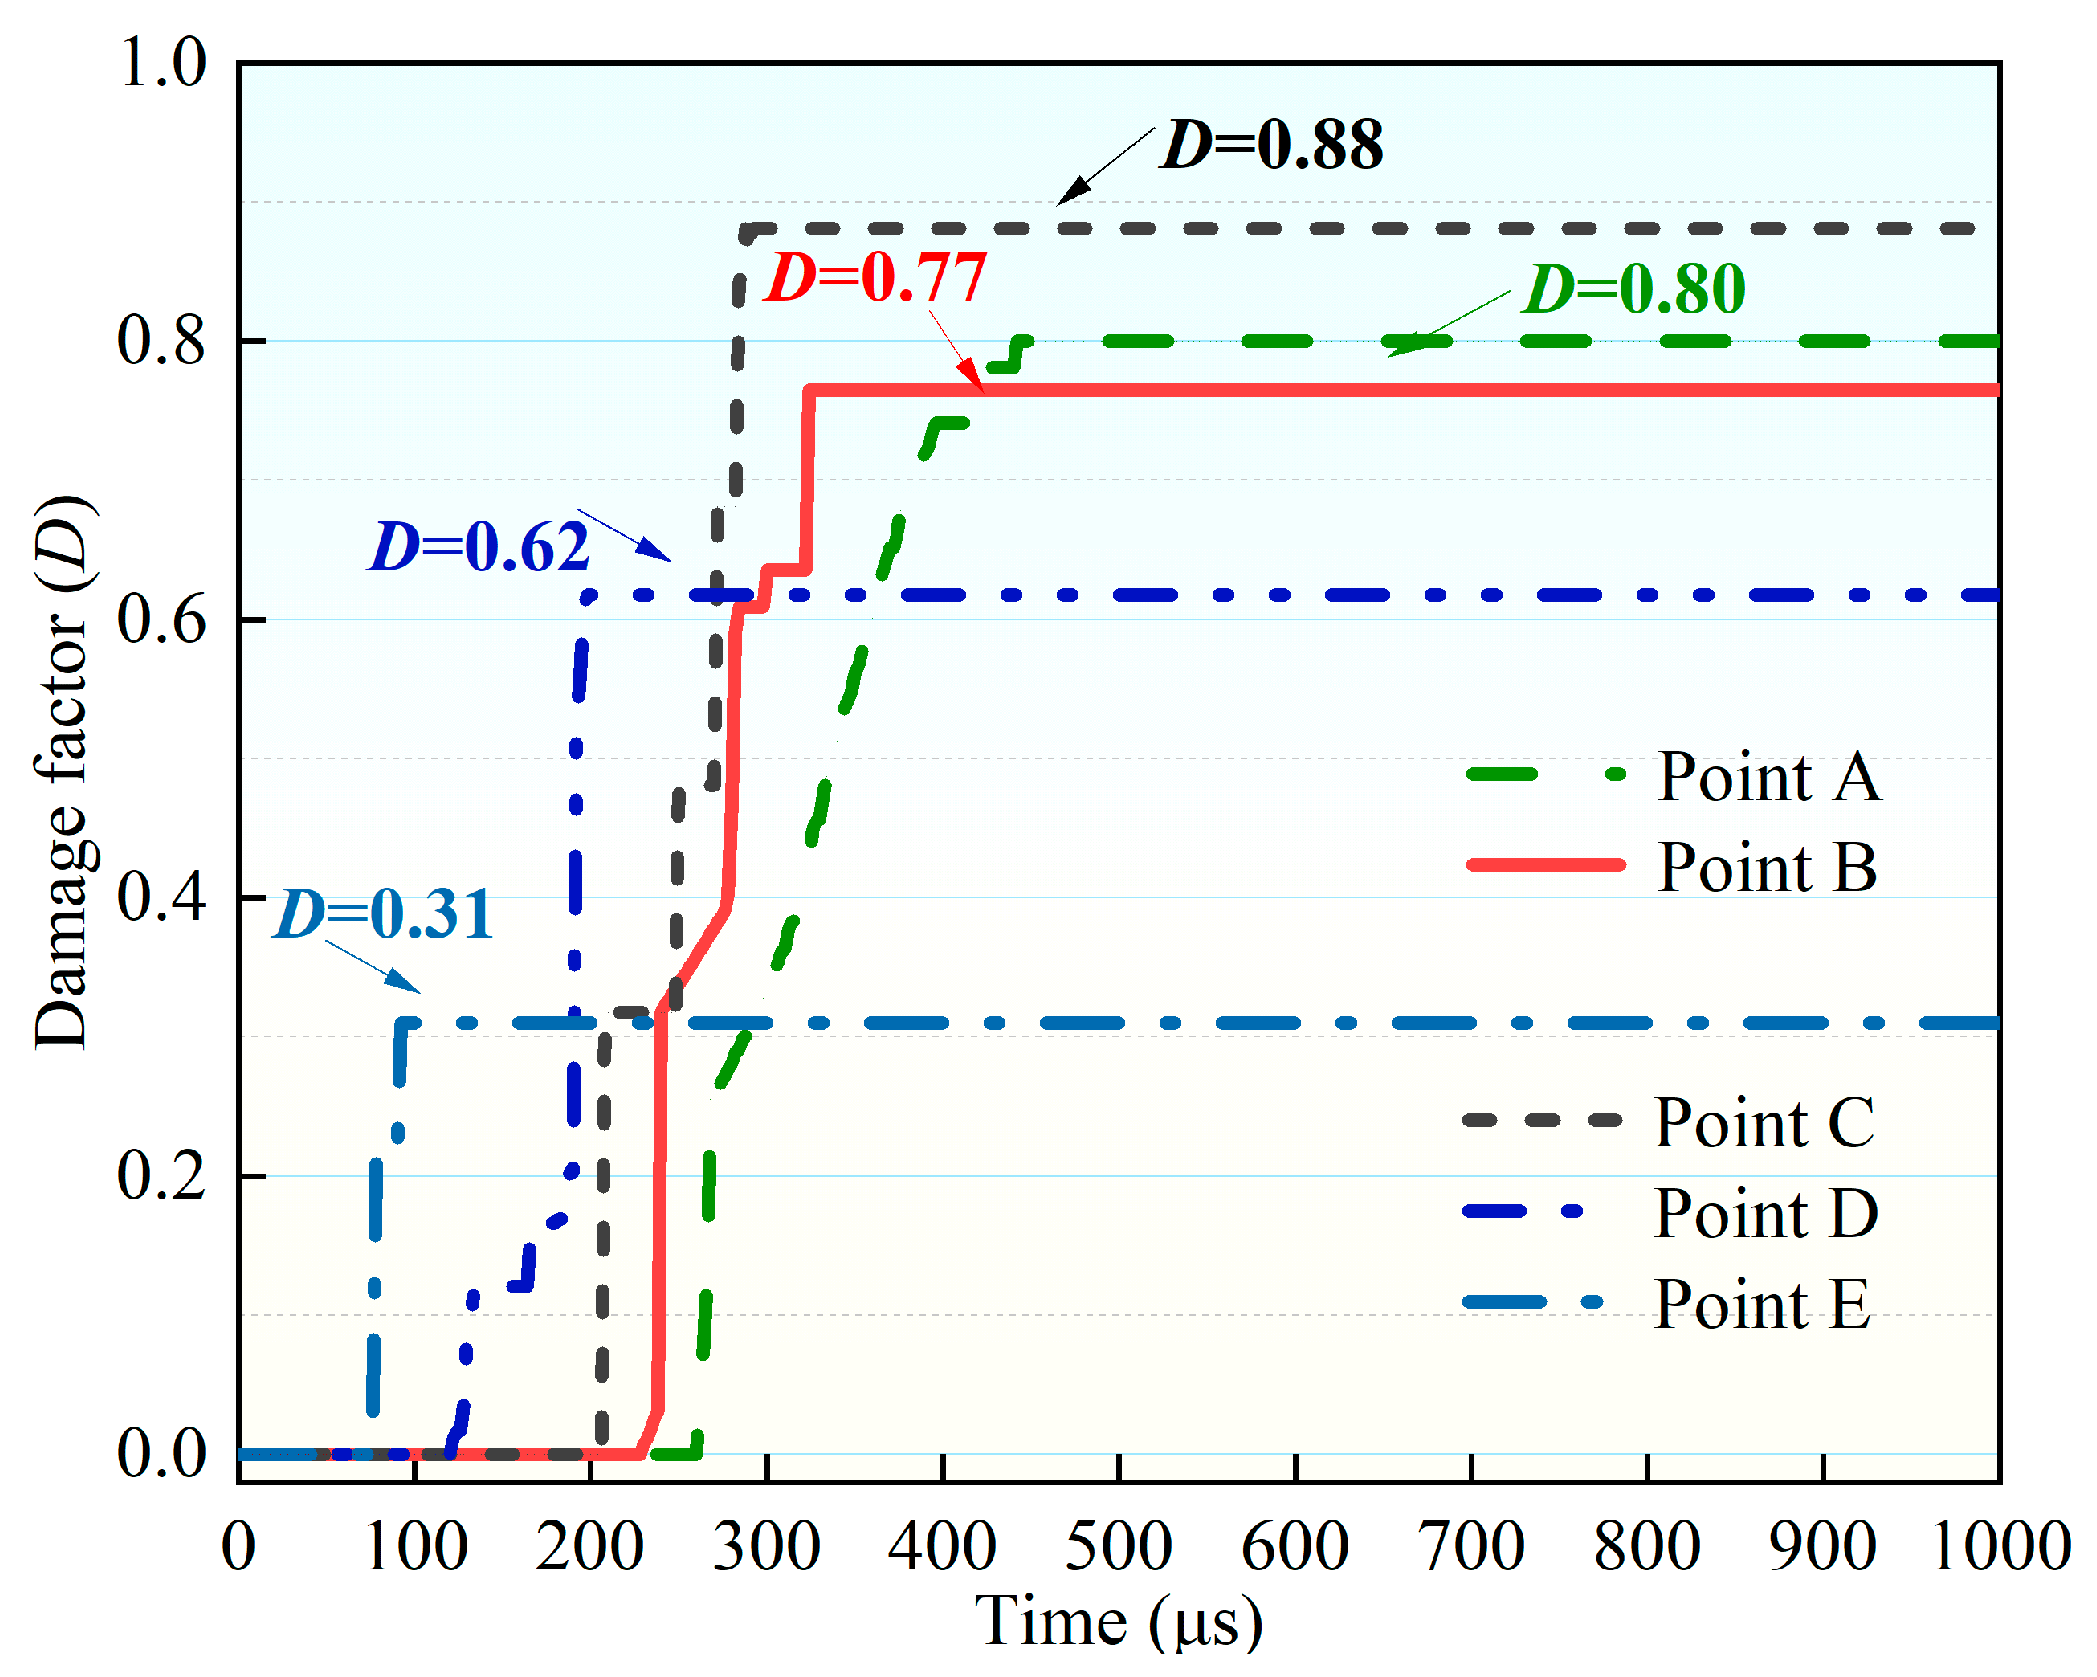
In the DYNA numerical simulation post-processing, it is typically assumed that when 0.2 < D < 0.7, the rock unit experiences mild damage, and when D ≥ 0.7, the rock unit experiences severe damage [50]. Figure 15 shows a typical damage time history curve for the measurement points (L1/L2 = 1), from which it can be inferred that the blasting damage evolution process is mainly completed within 500 μs, and based on this, the final damage degree at 1000 μs was extracted to form Figure 16, in order to evaluate the blasting damage results. Further analysis of the figure shows that when L1/L2 is 1 and 1.3, the damage factor D of unit E at the borehole bottom is <0.7. Further analysis of the figure shows that when L1/L2 is 1 and 1.3, the damage factor D of unit E at the borehole bottom is <0.7. When L1/L2 is 3.3, the damage factor D of unit A at the borehole opening is only 0.25, well below the damage threshold of 0.7. Therefore, when this scheme is adopted, serious under-excavation may occur at the borehole opening.
The above analysis indicates that under the given parameters, the surrounding rock at the borehole bottom is difficult to effectively fracture, thereby affecting the refined blasting effects for smooth blasting. Furthermore, based on the data from Figure 15 and Figure 16, the average stress and standard deviation of the damage degree for each scheme were further calculated, and Table 5 was formed. The data in the table show that with the increase in the L1/L2 ratio, both the sample standard peak stress and the standard deviation of the damage degree initially decrease and then increase. When the ratio is 1.7, the standard deviation of the standard peak stress for the measurement points is 28.68 and 0.09, respectively. When the ratio is 2.3, the standard deviation of the standard peak stress for the measurement points is 28.33 and 0.08, respectively. This indicates that when the L1/L2 ratio is between 1.7 and 2.3, the changes in average effective stress and damage degree at the surrounding rock measurement points are relatively small and the stress wave uniformly forms fracture zones along the borehole segments, with the most uniform distribution of blasting energy. At the same time, the average maximum effective stress reaches its highest value, indicating that the blasting load has the most effective effect on the expansion of the fracture zone at this point.

5. Field Verification and Application

5.1. Site Overview and Blasting Scheme

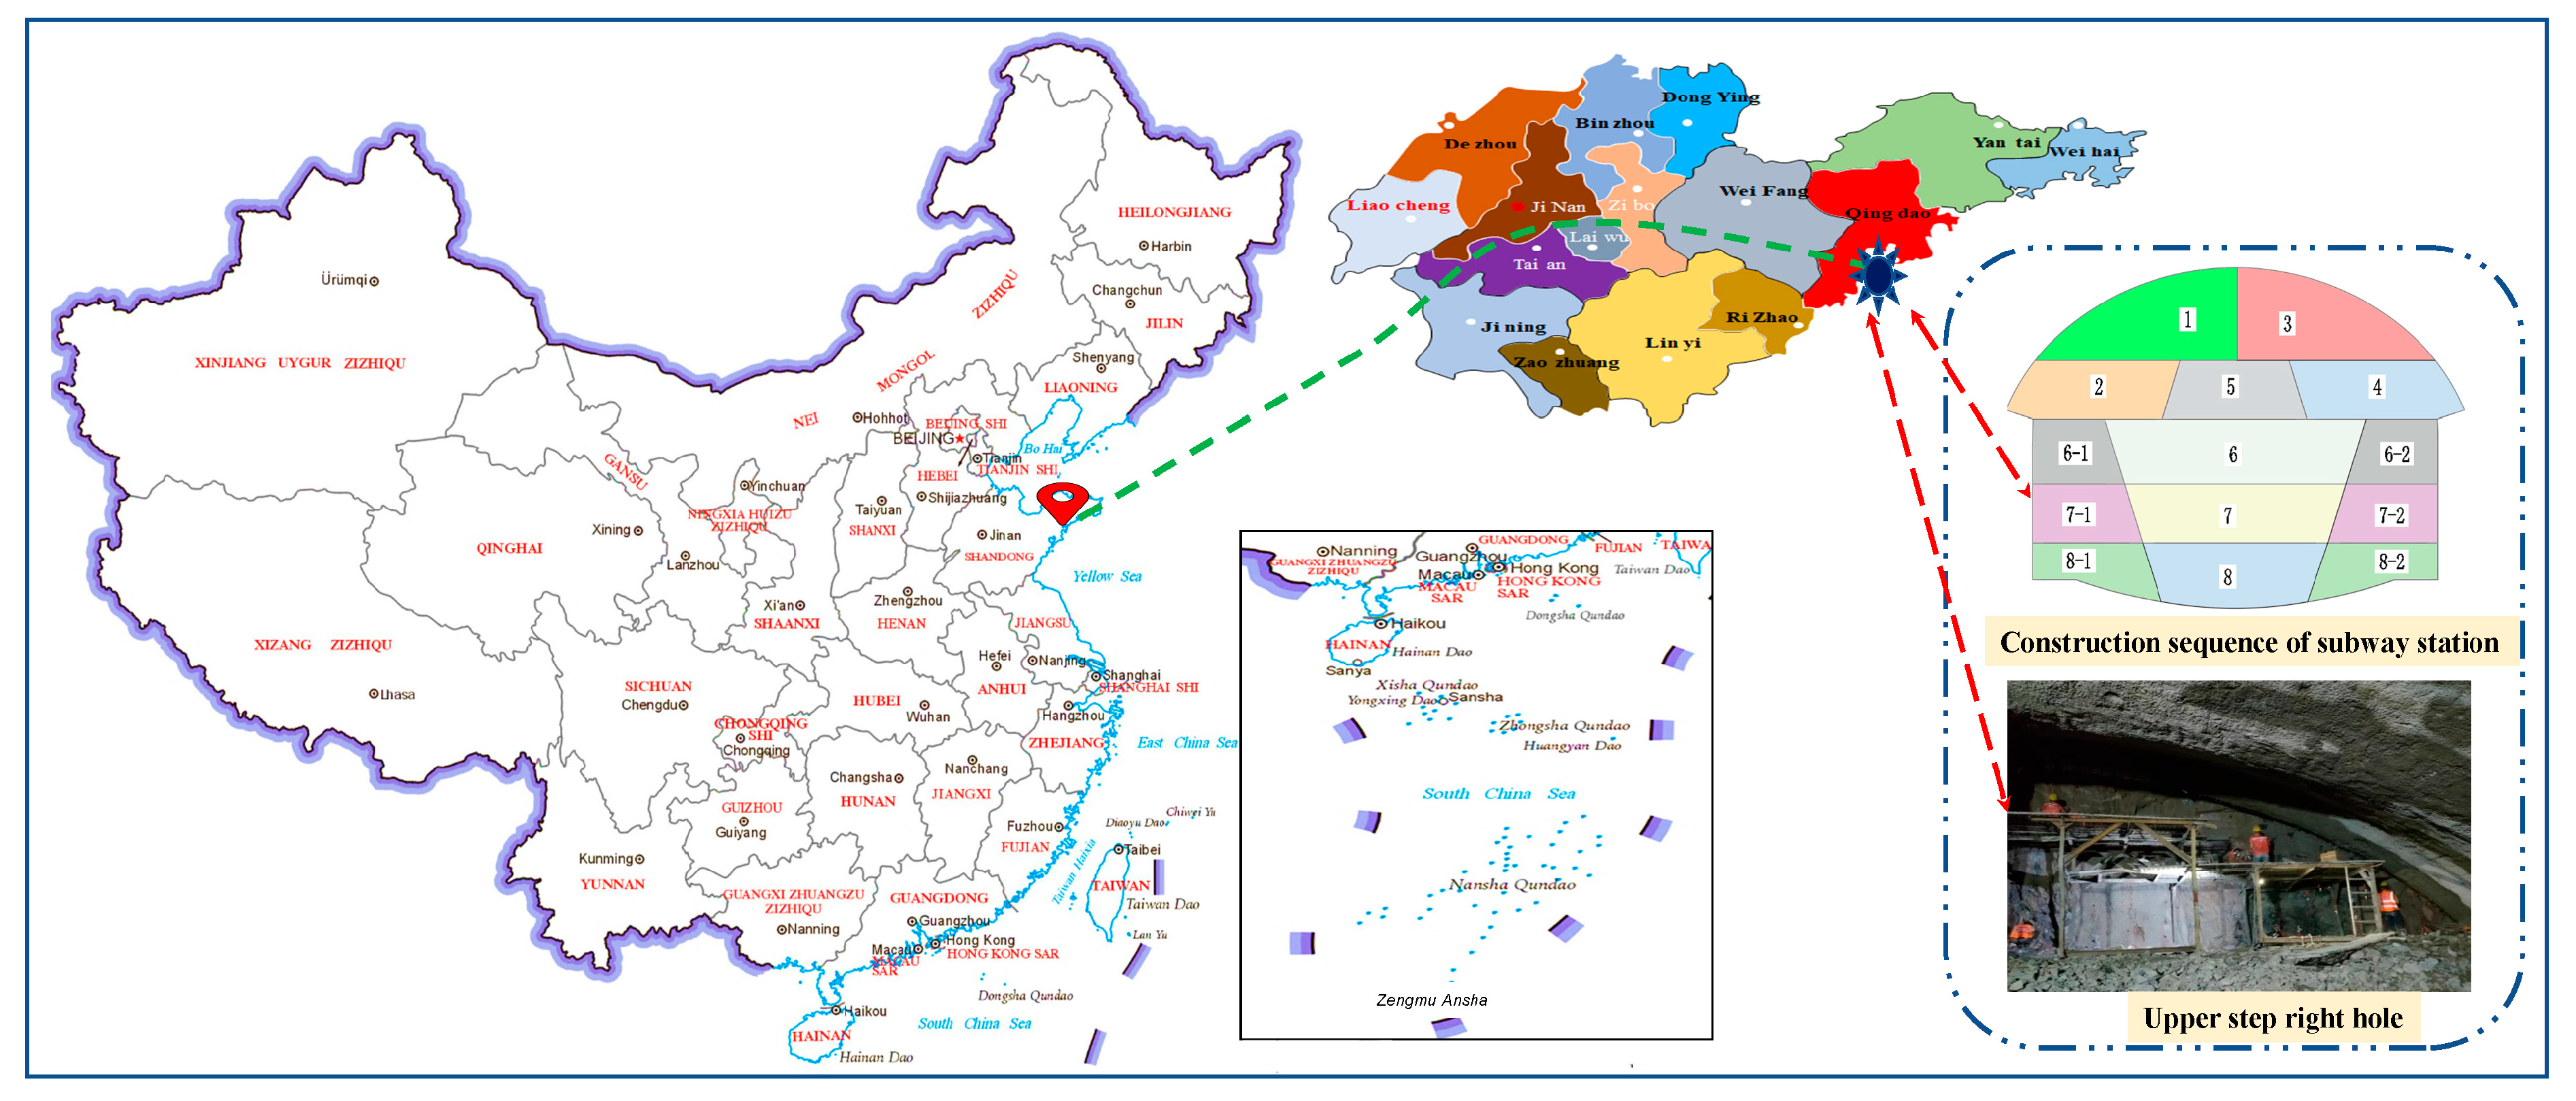
As shown in Figure 17, the construction of a certain station along the Qingdao Metro Line 5 is located in the city’s bustling downtown area, with the main structure situated in slightly weathered granite. The tunnel depth is approximately 35–36 m. Geological data indicates that the RQD value of the surrounding rock in the test section ranges from 39% to 48%, and the surrounding rock is classified as grade IV, predominantly consisting of granite. The surrounding environment of the work area is complex, with densely packed old buildings and structures, and the metro tunnel passes through a complex fault zone. Given the tunnel’s considerable depth, the vibration from the surrounding hole blasting causes minimal disturbance to the surface, and subsequent studies primarily focus on over-excavation and under-excavation conditions.
The excavation of the step-up section of the metro station was carried out using the CD method. The on-site experimental location is the right tunnel area of the step-up section, with a cyclic advance of 0.75 m, and the single-hole charge for surrounding holes is 300 g (length 30 cm), with an insertion angle of 3°. In order to weaken the vibration effect of surface blasting, hole-by-hole delay initiation technology is adopted in the field. The blast hole arrangement is shown in Figure 18 and Table 6, and a three-level wedge-shaped slotting method is adopted.

5.2. Test Preparation

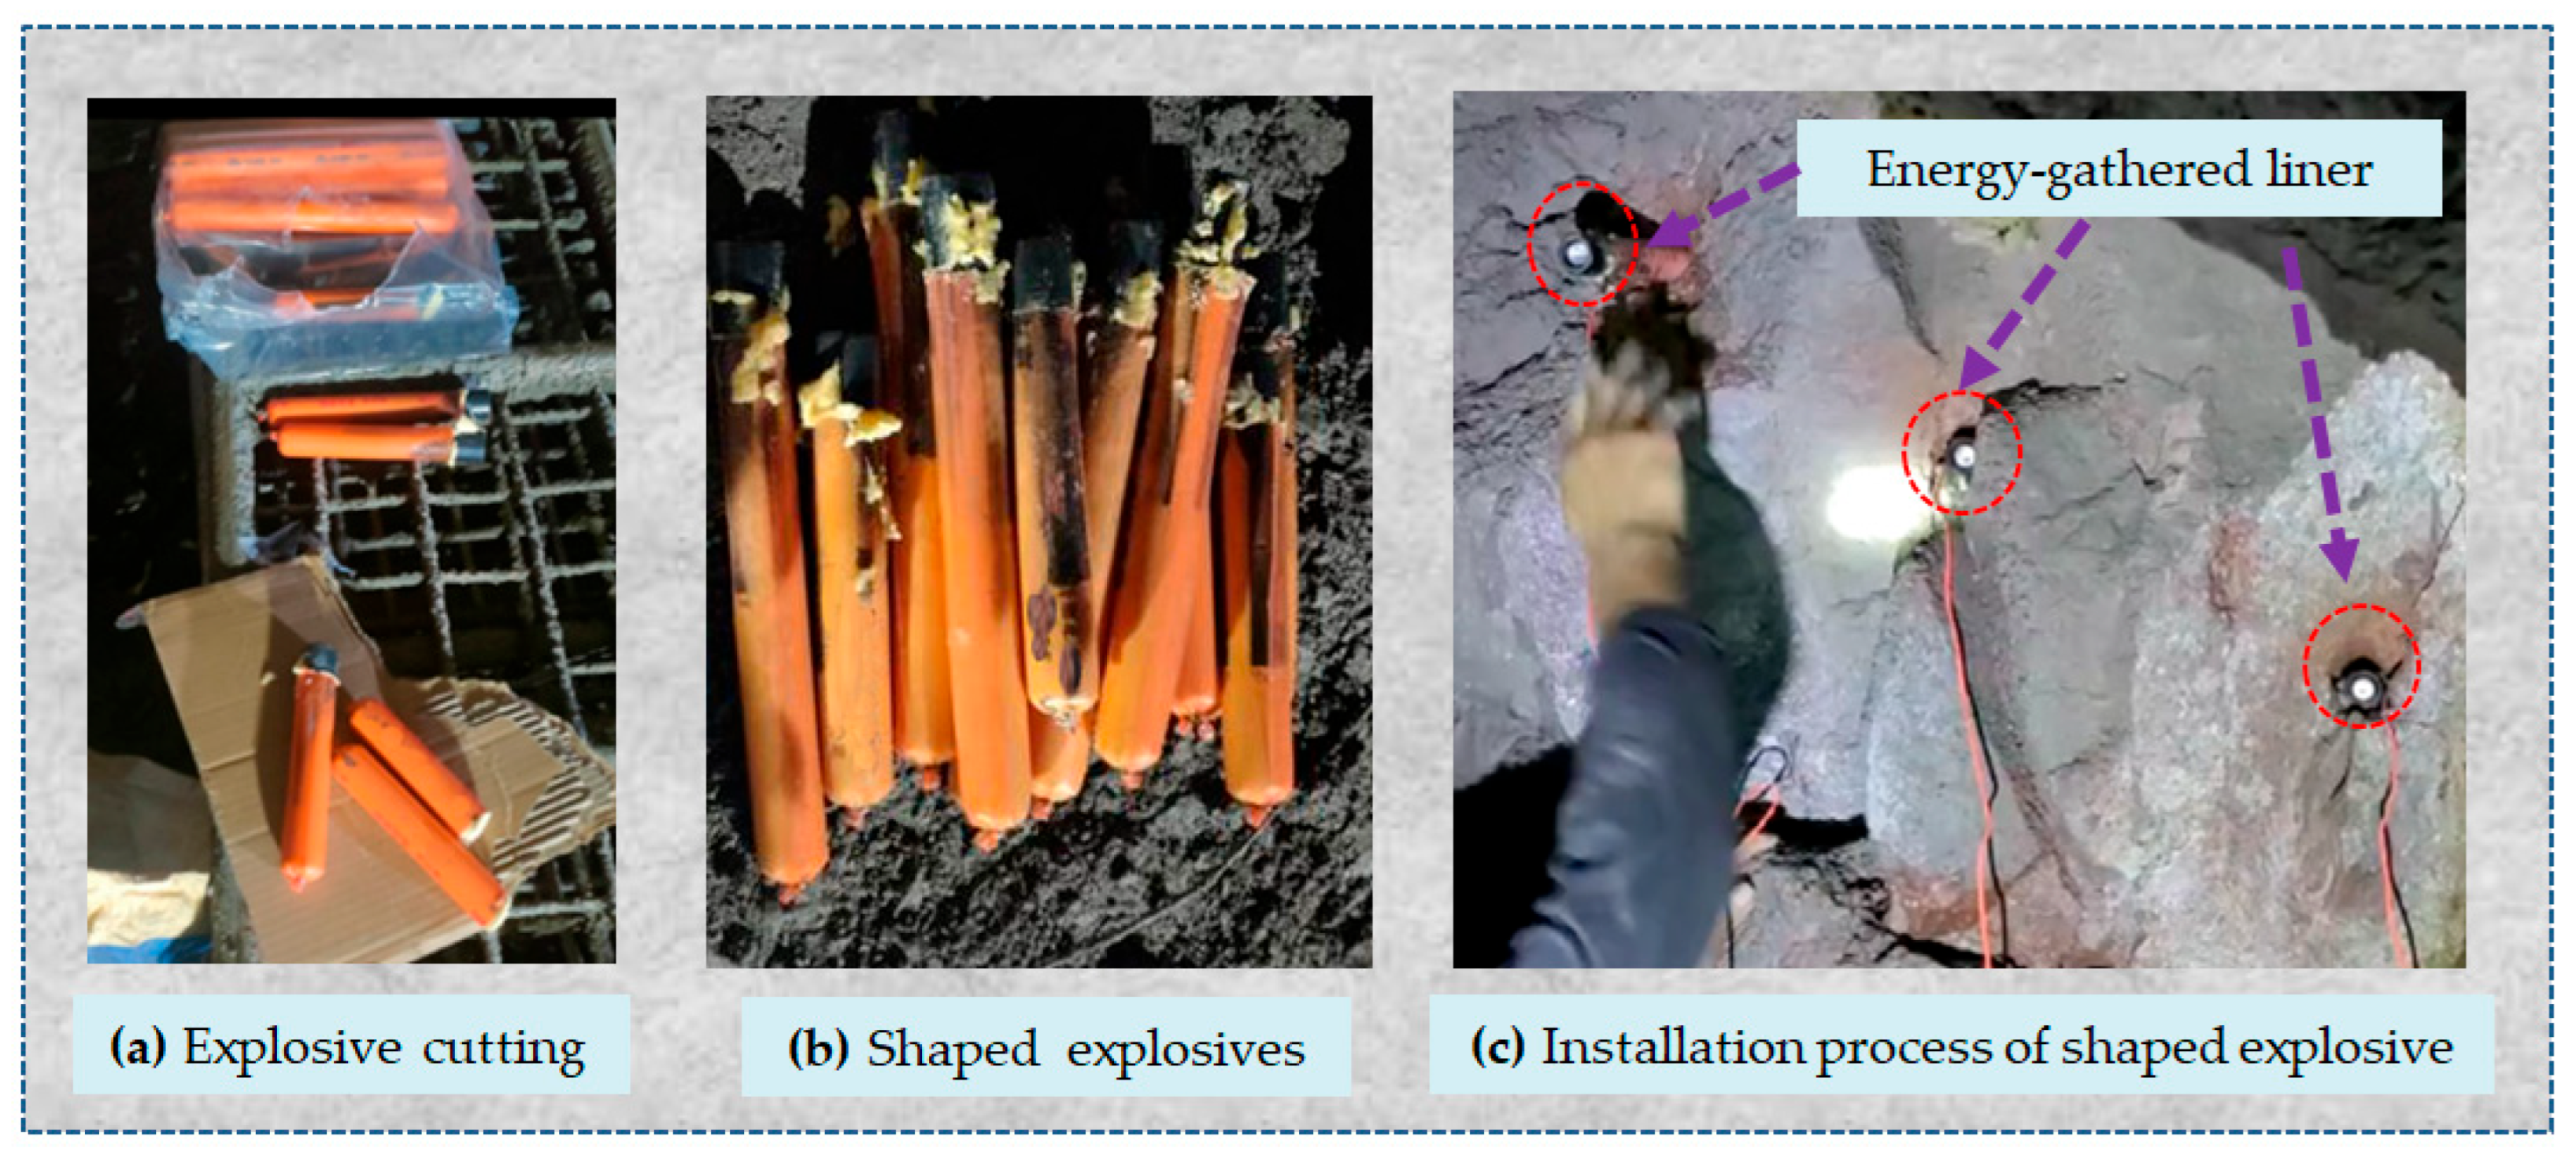
Based on the results of the numerical simulation, relevant field tests were conducted. The test section spans from DK8 + 621.500 to DK8 + 632.500. The field test scheme is consistent with the one shown in Figure 3. Due to constraints imposed by on-site conditions, the L1/L2 length ratios in the field test groups were 1, 2, and 3.3, totaling three groups, with an additional traditional scheme included as a control group. The process of loading the explosives for the field test is shown in Figure 19. First, the explosives were precisely cut to the designed length, as shown in Figure 19a. Then, the assembled shaped charge explosives were placed at the bottom of the blast hole, ensuring that the direction of the shaped charge aligned with the direction of the detonated explosive. A reverse initiation method was employed, and the installation process of the shaped charge is shown in Figure 19c. The material of the energy-gathering liner was an aluminum alloy, and its structural parameters were consistent with the numerical simulation test.

5.3. Field Test Results

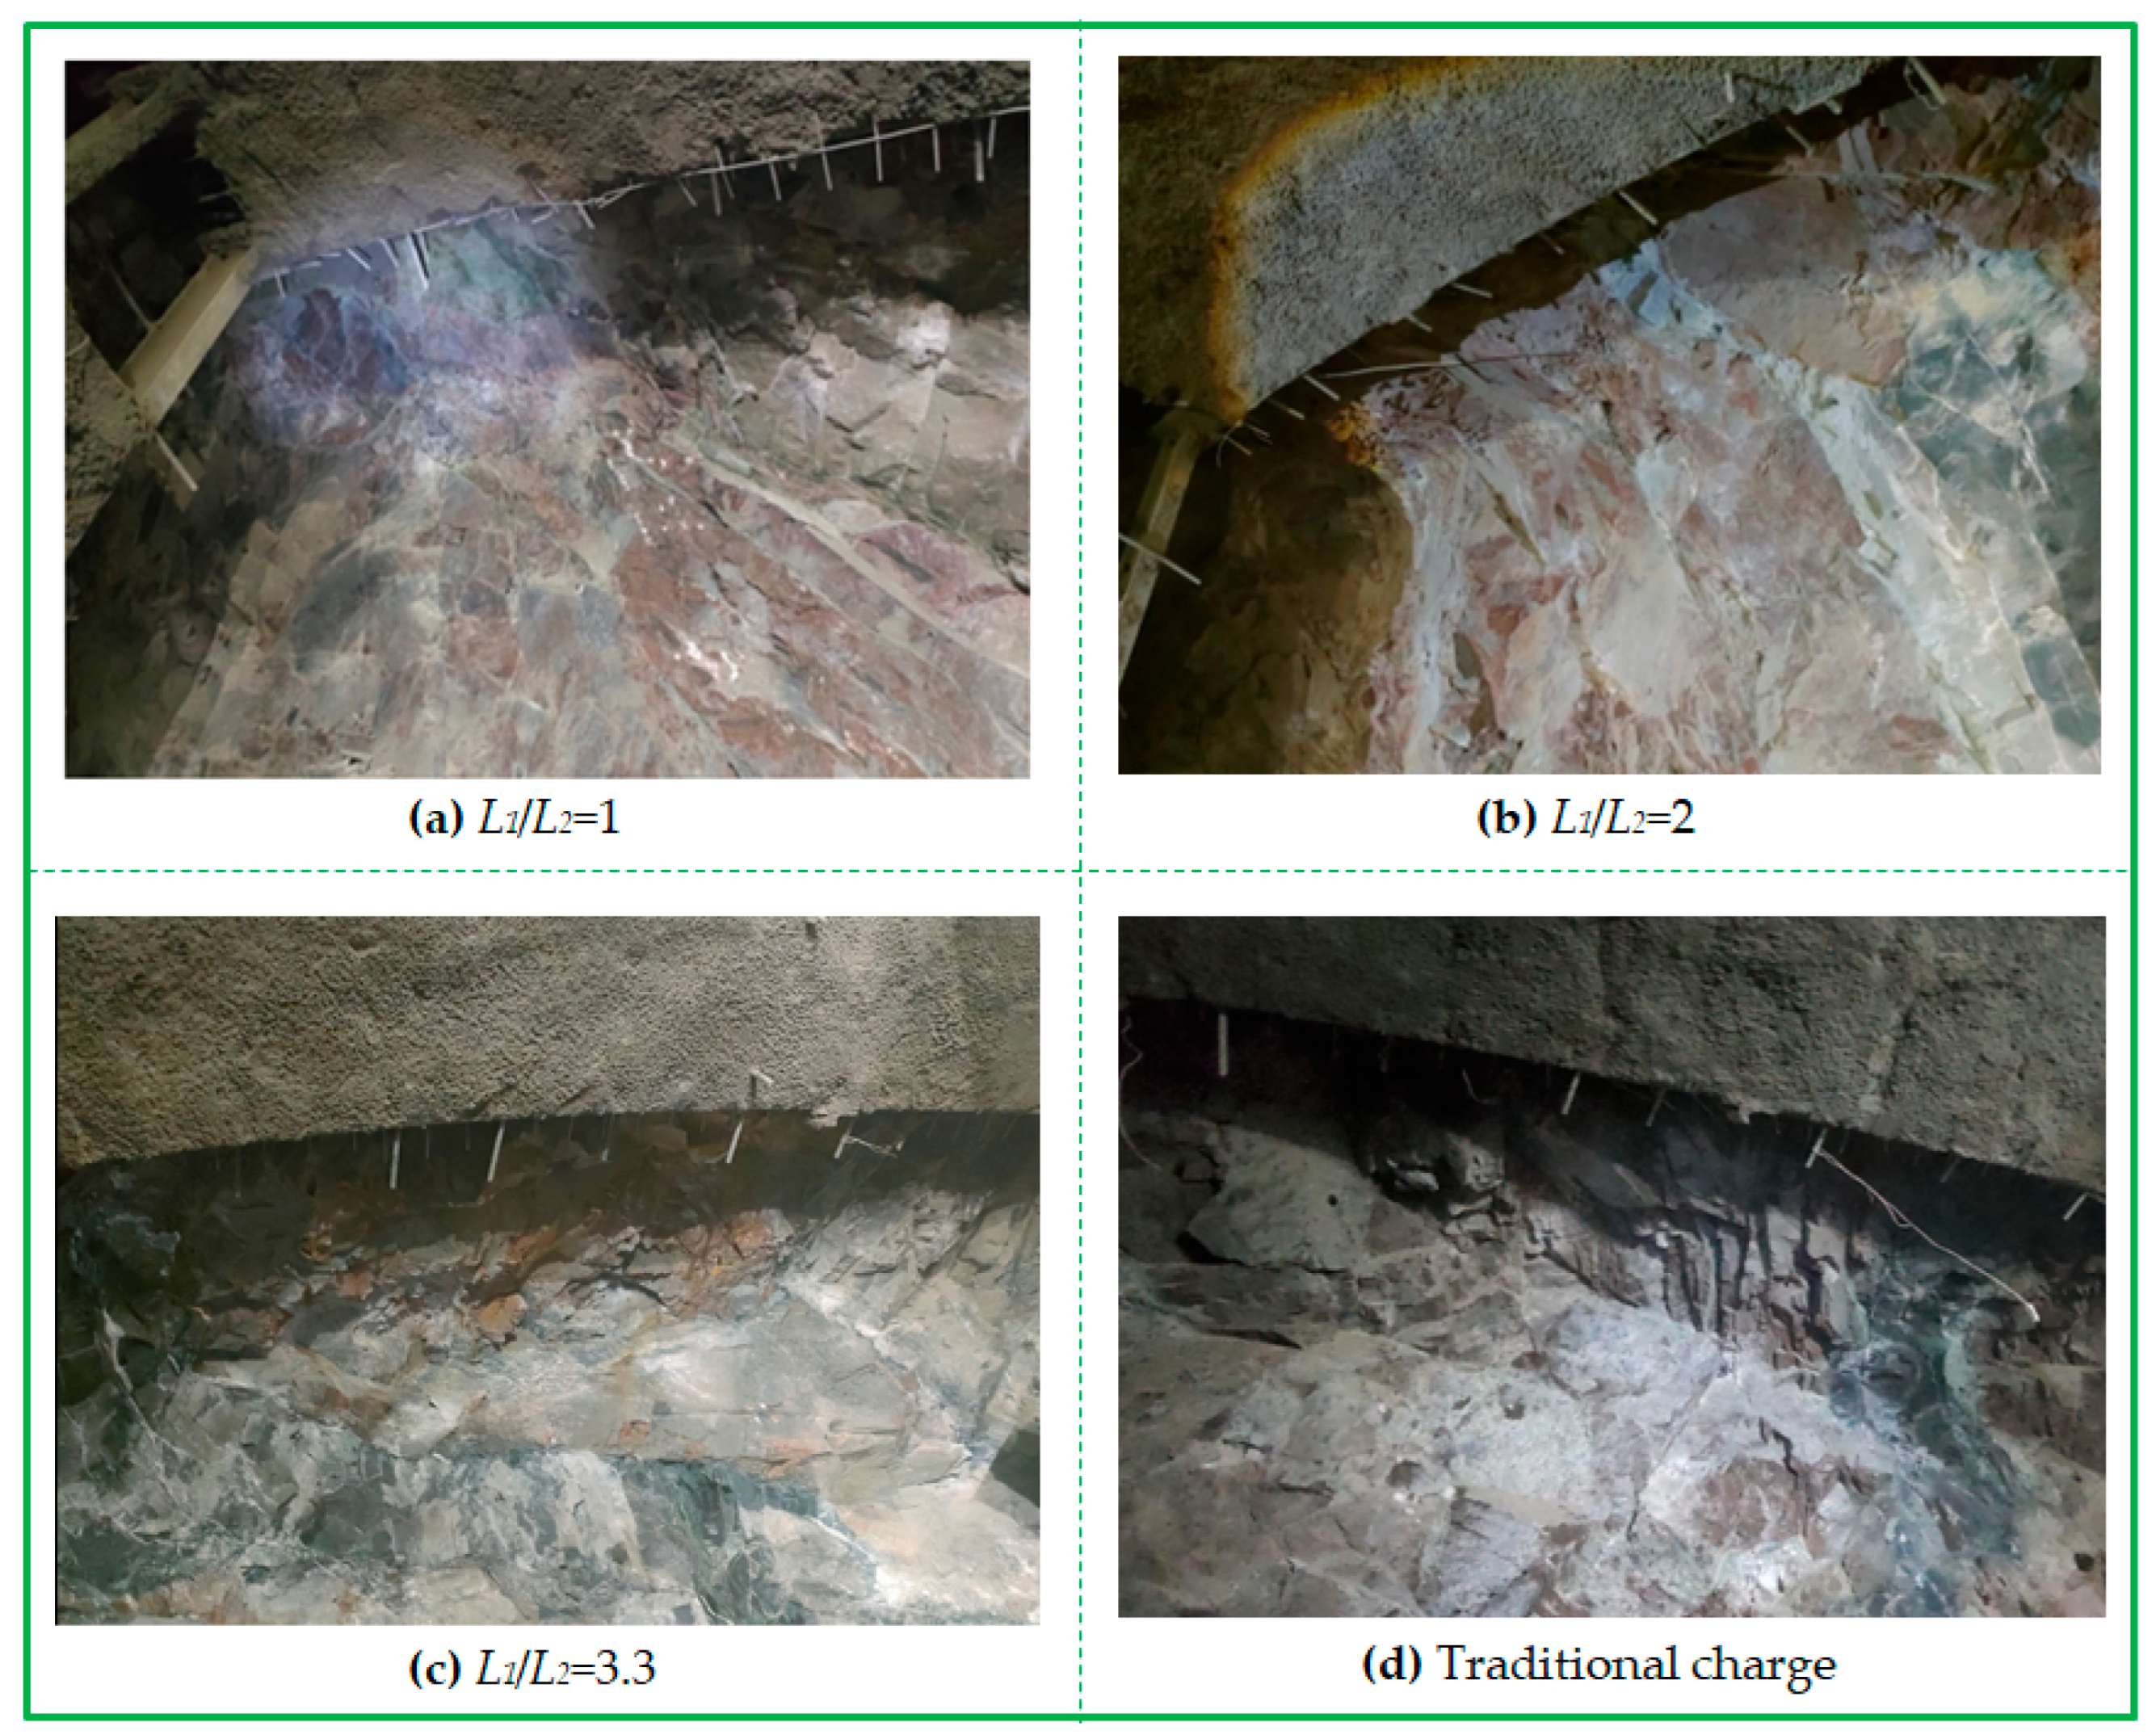
After the field tests were completed, a total station scanner was used to statistically record the smooth blasting effects of each test group. The results are shown in Figure 20 and Figure 21.
After applying the four schemes in the field, the comparison in Figure 21 shows that the under-excavation in experimental group (d) is most significant, with a maximum over-excavation of 24.8 cm and a maximum under-excavation of 10.4 cm, indicating that the conventional charge structure easily causes significant over- and under-excavation. In experimental group (a), the maximum over-excavation is 16.4 cm and the maximum under-excavation is 5.4 cm, which is inferred to result from the small charge at the bottom of the borehole and the significant confinement effect at the borehole bottom. Therefore, when using the segmented charge structure based on energetic liners in actual construction, the charge amount at the bottom section (main charge) should be increased. The results from experimental groups (b) and (c) show that, after increasing the charge amount at the borehole bottom, the confinement effect of the surrounding rock at the borehole bottom can be partially overcome, and the maximum over-excavation is controlled within 15 cm. Among them, Figure 21b yields better overall results than Figure 21c, with the maximum over-excavation further controlled within 12 cm. It should also be noted that, due to the shorter explosive length near the borehole mouth, improper handling during construction may result in the energetic jet formed by the explosive failing to initiate the peripheral charge.
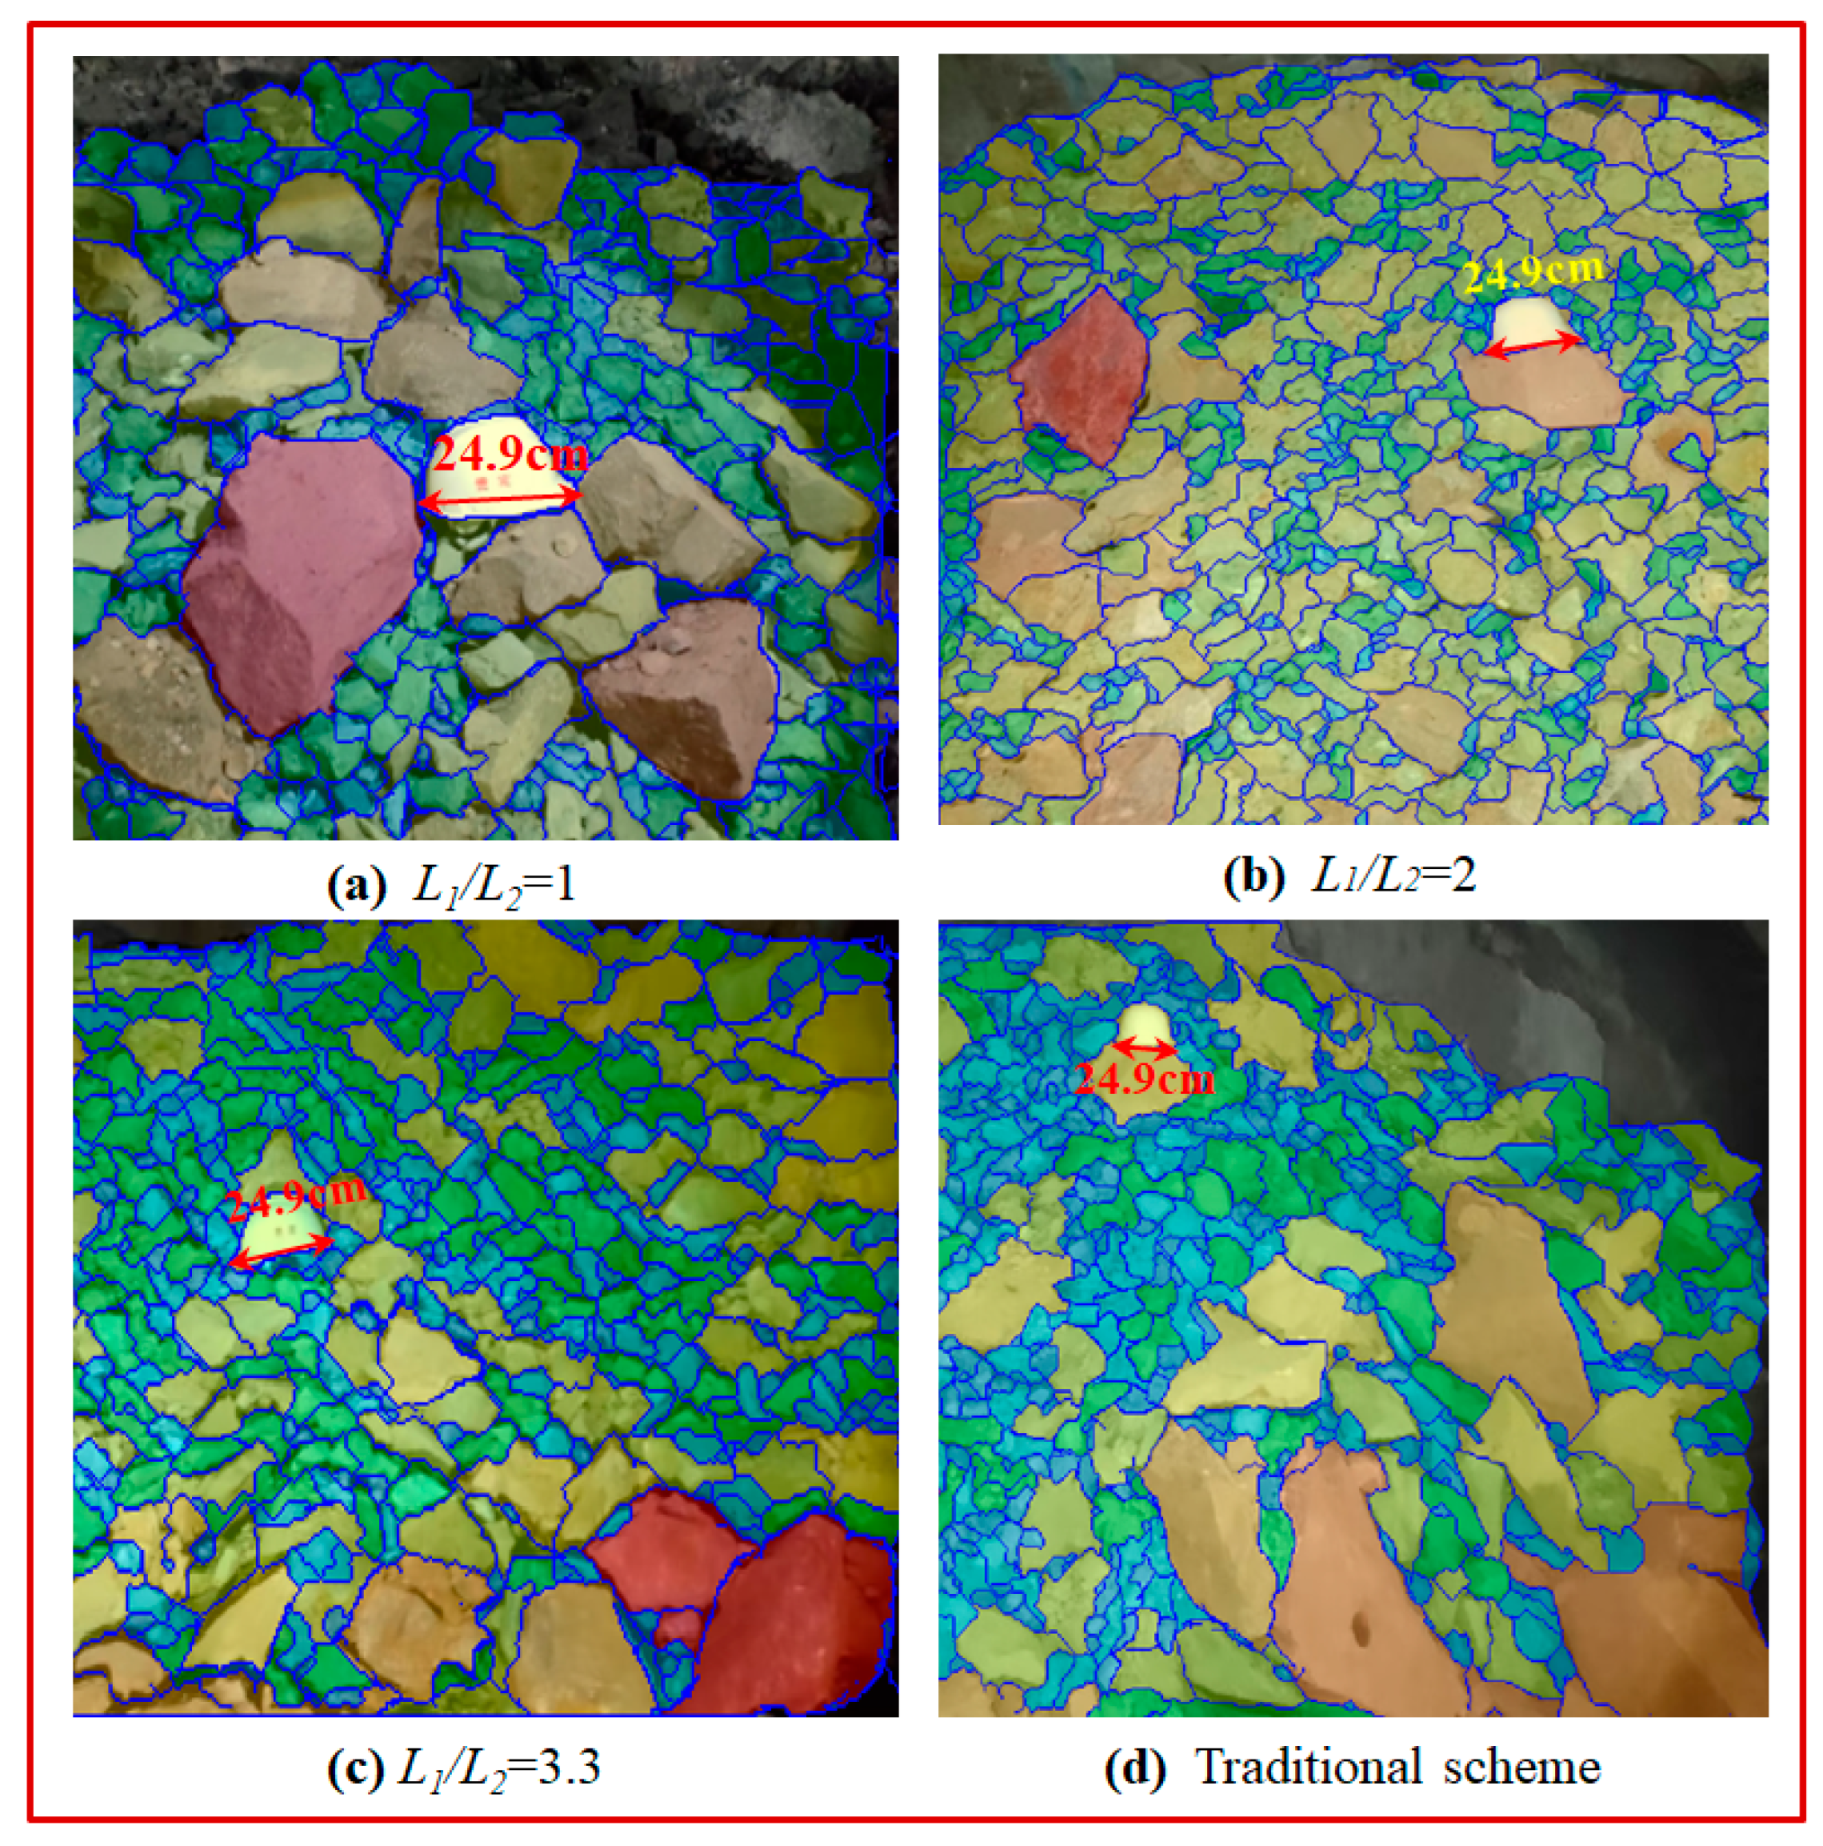
In addition, photographs and statistical processing of the field smooth blasting pile were taken, resulting in Figure 22 and Figure 23. It can be seen from the figures that when L1/L2 = 2, the smooth blasting fragmentation is more uniform. Moreover, using Equation (9), the average fragmentation size (d50) of Figure 21b was calculated to be 23.8 cm [51], which is smaller than in the other three schemes and facilitates excavation and transportation in the later stages of the project. Therefore, it can be concluded that the field test results are generally consistent with the fractal dimension conclusions derived from numerical simulations.
d 50 = d max ( 1 2 ) 1 3 D f
In the formula, dmax is the maximum fragment size.
Combining the numerical simulation and field test results, it can be concluded that Figure 21b is more reasonable. When this charge scheme was used in subsequent construction, the maximum over- or under-excavation was effectively controlled within 12 cm, and the average over- or under-excavation was maintained within 7 cm. Additionally, the peripheral hole smooth blasting based on the new gathering device improves the fragmentation effect of the smooth blast-layer rock mass, effectively addressing the issue of excessive rock debris caused by unreasonable charge parameters in peripheral holes in smooth blasting.

6. Conclusions

(1)
The model tests and numerical simulation results indicate that the ALE method can clearly reproduce the formation and movement of a shaped charge jet in a borehole, the shock initiation of the exposed emulsified explosives, and the evolution of dynamic rock damage. Compared with high-speed photography observations, the error is controlled within 6.4%.
(2)
The formation, movement, and impact-induced detonation process of the shaped jet indicate that although the jet velocity increases with the rise in the L1/L2 ratio, the rate of increase tends to diminish progressively.
(3)
The numerical simulation results indicate that, under the conditions of the current simulation experiment, when the gathering liner and two-stage air-segmented charge arrangement are used in the peripheral holes, the L1/L2 ratio (ranging from 1 to 3.3) significantly affects the surrounding rock damage patterns, blasting fractal dimensions, and damage uniformity. The most reasonable blasting fragmentation size and average damage degree occur when the ratio is between 1.7 and 2.3.
(4)
On-site tests show that, under the given working conditions, when the surrounding holes are charged with two-stage charge rolls with a spacing of 20 cm and an L1/L2 ratio of 2, the average over-excavation and undercut are controlled within 7 cm, with the maximum over-excavation controlled within 12 cm. The corresponding average fragmentation size (d50) is minimized. This suggests that this ratio reduces the fragmentation size of the smooth blasting layer while achieving better smooth blasting effects. It also indicates that the shaped charge can be effectively applied in the surrounding hole segmented charging structure.
(5)
The L1/L2 ratio derived in this study is only applicable to the field conditions discussed in the paper. The value is influenced by several factors, such as surrounding rock type, cycle advance rate, and the spacing between segmented explosives. In other engineering applications, this ratio requires further investigation.
This study, in conjunction with practical engineering, investigates the evolution of gathering jet velocity and its blasting damage characteristics under different main-to-secondary charge ratios, based on the background working conditions. It should be noted that, due to current experimental limitations, the distribution mechanism of explosive energy between jet formation and rock-breaking action under various experimental variables has not yet been revealed. In the future, this issue should be further investigated.

Author Contributions

Z.L.: writing—original draft preparation, methodology, software, validation, formal analysis. Y.W.: writing—original draft preparation, conceptualization. W.G. and H.Y.: writing—original draft preparation, investigation, project administration. X.Z.: resources, data curation, writing—review and editing, funding acquisition, visualization. Z.Z.: writing—original draft preparation, project administration.; B.L.: writing—original draft preparation, resources. All authors have read and agreed to the published version of the manuscript.

Funding

The research received financial support from the National Natural Science Foundation of China (Grant No. 52474123), as well as from the Hubei Key Laboratory of Blasting Engineering Foundation (Grant No. BL2021-23).

Data Availability Statement

Some or all data that support the findings of this study are available from the corresponding author upon reasonable request.

Acknowledgments

Thanks are extended to the editors and reviewers.

Conflicts of Interest

Authors Zhenye Zhu and Ben Lv were employed by the China Tiesiju Civil Engineering Group Co., Ltd. The remaining authors declare that the research was conducted in the absence of any commercial or financial relationships that could be construed as a potential conflict of interest.

Abbreviations

The following abbreviations are used in this manuscript:
L1Length of main charge
L2Length of secondary charge

References

  1. Zhang, W.; Liu, D.; Tang, Y.; Qiu, W.; Zhang, R. Multifractal Characteristics of Smooth Blasting Overbreak in Extra-Long Hard Rock Tunnel. Fractal Fract. 2023, 7, 842. [Google Scholar] [CrossRef]
  2. Zhao, D.; Huang, Y.; Chen, X.; Han, K.; Chen, C.; Zhao, X.; Chen, W. Numerical Investigations on Dynamic Responses of Subway Segmental Tunnel Lining Structures under Internal Blasts. Tunn. Undergr. Space Technol. 2023, 135, 105058. [Google Scholar] [CrossRef]
  3. Cheng, L.; Yang, Z.; Zhao, P.; Li, F. Damage Characteristics of Blasting Surrounding Rock in Mountain Tunnel in Fault Fracture Zones Based on the Johnson—Holmquist-2 Model. Buildings 2024, 14, 3682. [Google Scholar] [CrossRef]
  4. Salum, A.H.; Murthy, V.M.S.R. Optimising Blast Pulls and Controlling Blast-Induced Excavation Damage Zone in Tunnelling Through Varied Rock Classes. Tunn. Undergr. Space Technol. 2019, 85, 307–318. [Google Scholar] [CrossRef]
  5. Zhang, W.; Mei, J.; Sun, K.; Xu, B. Fine Controlled Blasting of Subsurface Excavation for Subway Stations in Soft–Hard Mixed-Medium Rock Mass. Tunn. Undergr. Space Technol. 2025, 158, 106407. [Google Scholar] [CrossRef]
  6. Sumiya, F.; Kato, Y. A Study on Smooth Blasting Technique Using Detonating Cords. Sci. Technol. Energetic Mater. 2007, 68, 167–171. [Google Scholar]
  7. Wang, J.; Cao, A.; Liu, J.; Wang, H.; Liu, X.; Li, H.; Sun, Y.; Long, Y.; Wu, F. Numerical Simulation of Rock Mass Structure Effect on Tunnel Smooth Blasting Quality: A Case Study. Appl. Sci. 2021, 11, 10761. [Google Scholar] [CrossRef]
  8. Hayes, G.A. Linear Shaped-Charge (LSC) Collapse Model. J. Mater. Sci. 1984, 19, 3049–3058. [Google Scholar] [CrossRef]
  9. Fourney, W.L.; Barker, D.B.; Holloway, D.C. Model studies of well stimulation using propellant charges. Int. J. Rock Mech. Min. Sci. Geomech. Abstr. 1983, 20, 91–101. [Google Scholar] [CrossRef]
  10. Ma, G.; An, X. Numerical Simulation of Blasting Induced Rock Fractures. Int. J. Rock Mech. Min. Sci. 2008, 45, 966–975. [Google Scholar] [CrossRef]
  11. Yang, R.; Cao, W.; Gao, X. Experimental Study on Explosion Effect of Slotted Cartridge with Different Structure. J. China Coal Soc. 2015, 41. 32–36+49. [Google Scholar] [CrossRef]
  12. Wu, L.; Zhang, Y.; Hou, T.; Liu, K.; Miao, Y.; Li, J.; Zhao, X.; Zhang, M. Research on Directional Rock Blasting Based on Different Slotted Pipe Materials of the Combined Charge Structure. Sci. Rep. 2024, 14, 7394. [Google Scholar] [CrossRef]
  13. Liu, K.; Zhang, Y.; Peng, Y.; Wu, L. Experimental Research and Application of Drilling and Blasting with Directional Damage-Reduction Shaped Charge. Sci. Rep. 2024, 14, 9549. [Google Scholar] [CrossRef] [PubMed]
  14. Yin, Y.; Sun, Q.; Zou, B.; Mu, Q. Numerical Study on an Innovative Shaped Charge Approach of Rock Blasting and the Timing Sequence Effect in Microsecond Magnitude. Rock Mech. Rock Eng. 2021, 54, 4523–4542. [Google Scholar] [CrossRef]
  15. Song, Y.; Li, X.; Guo, D.; Shi, B. Study on the Decoupled Charge Effect in Deep-Hole Cumulative Blasting of Coal Seam. Adv. Civ. Eng. 2019, 2019, 8486198. [Google Scholar] [CrossRef]
  16. Yang, J.; Fu, Q.; Gao, Y.; Wu, X.; Chang, X.; Li, C. A Novel Method of Combined Deep Hole Blasting for Gob-Side Roadway Protection. Rock Mech. Rock Eng. 2023, 56, 1234–1251. [Google Scholar] [CrossRef]
  17. Xu, S.; Wu, B.; Zhang, H.; Qi, S.; Bian, H.; Wang, J. Directional Crack Propagation and Optimization Strategies for Multi-Hole Shaped Charge Blasting in Tunnel Construction. Structures 2025, 72, 108268. [Google Scholar] [CrossRef]
  18. Xu, S.; Wu, B.; Zhang, H.; Qi, S.; Wang, J.; Bian, H. Study on crack propagation mechanism and charge structure optimization of tunnel shaped charge hydraulic blasting. Case Stud. Constr. Mater. 2024, 21, e3805. [Google Scholar] [CrossRef]
  19. Wang, S.; Gong, M.; Wu, H.; Wu, X.; Liu, X. Optimization Study of Water Interval Charge Structure Based on the Evaluation of Rock Damage Effect in Smooth Blasting. Appl. Sci. 2024, 14, 2868. [Google Scholar] [CrossRef]
  20. Ding, C.; Yang, R.; Zhu, X.; Feng, C.; Zhou, J. Rock Fracture Mechanism of Air-Deck Charge Blasting Considering the Action Effect of Blasting Gas. Tunn. Undergr. Space Technol. 2023, 142, 105420. [Google Scholar] [CrossRef]
  21. Ma, C.; Xie, W.; Liu, Z.; Li, Q.; Xu, J.; Tan, G. A New Technology for Smooth Blasting Without Detonating Cord for Rock Tunnel Excavation. Appl. Sci. 2020, 10, 6764. [Google Scholar] [CrossRef]
  22. Balakrishnan, V.; Pradhan, M.; Dhekne, P.Y. Investigating Rock Fragmentation in Distributed Spherical Air-Gap Blasting Technique. Powder Technol. 2020, 362, 101–110. [Google Scholar] [CrossRef]
  23. Wu, X.; Gong, M.; Wu, Y.; Luo, X.; Wu, H.; Chen, X. Experimental and Numerical Study on the Cumulative-Deck Charging Structure Based on Explosive Sympathetic Detonation in Tunnel Smooth Blasting. Alex. Eng. J. 2025, 116, 561–573. [Google Scholar] [CrossRef]
  24. Shi, S.; Zhou, C.; Gao, W.; Li, Z.; Zhang, X.J. Study on Reasonable Sympathetic Detonation Distance of Emulsion Explosive in Axial Shaped Charge Structure. Blasting 2025, 1–12. Available online: http://kns.cnki.net/kcms/detail/42.1164.tj.20250410.0841.002.html (accessed on 24 April 2025).
  25. Wang, Q.; Wang, T.; Tian, C.; Sun, Y.; Wei, X.; Li, Z.; Wang, X.; Li, Y. Application of Interval Charge of Peripheral Hole Shaped Charge Device in Smooth Blasting. Blasting 2024, 41, 77–84. [Google Scholar]
  26. Liu, Z.; Wang, X.; Wang, Y.; Li, Z.; Liang, L.; Sun, Y.; Tian, C.; Wang, T.; Wang, X. Study on the Effect of Shaped Charge Device on the Detonation Distance of Emulsion Explosive under Constraint Conditions. Blasting 2024, 41, 171–178. [Google Scholar]
  27. Tian, J.; Zhang, C.; Li, Z.; Liao, L. Design and Engineering Application of New Energy-Gathering Tube. Blasting 2025, 42. 159–165+198. [Google Scholar]
  28. Liu, Z.; Yang, R.; Zuo, J.; Xu, P.; Zhao, Y.; Yang, Z. Research on the Crack Formation Mechanism of Shaped Charge Blasting and the New Dual-Shaped Charge Blasting Technology. Mech. Adv. Mater. Struct. 2025, 32, 374–390. [Google Scholar] [CrossRef]
  29. Huang, J. Simulation Study on Oblique Penetration of Shaped Charge Jet into Moving Body. Ph.D. Thesis, North University of China, Taiyuan, China, 2015. [Google Scholar]
  30. Arnold, W.; Rottenkolber, E. High Explosive Initiation Behavior by Shaped Charge Jet Impacts. Procedia Eng. 2013, 58, 184–193. [Google Scholar] [CrossRef]
  31. Held, M. Critical Area for the Initiation of High Explosive Charges. Shock. Waves Condens. Matter 1984, 1983, 555–557. [Google Scholar] [CrossRef]
  32. Peugeot, F.; Quidot, M. Threshold Energy: A Dimensional Extension of the Critical Energy for Jet Attack Application. Propellants. Explos. Pyrotech. 1998, 23, 188–192. [Google Scholar] [CrossRef]
  33. James, H.R. An Extension to the Critical Energy Criterion Used to Predict Shock Initiation Thresholds. Propellants. Explos. Pyrotech. 1996, 21, 8–13. [Google Scholar] [CrossRef]
  34. Wu, B.; Xu, S.; Meng, G.; Cai, J.; Wei, H.; Li, H.; Zhang, J. Study on dynamic evolution law of blasting cracks in elliptical bipolar linear shaped charge blasting. Shock. Vib. 2021, 2021, 5272878. [Google Scholar] [CrossRef]
  35. Zhang, X.; Wang, Z.; Yin, J.; Yi, J.; Wang, H. Damage Mechanism of PTFE/Al Reactive Charge Liner Structural Parameters on a Steel Target. Materials 2021, 14, 3701. [Google Scholar] [CrossRef]
  36. Xie, L.; Lu, W.; Zhang, Q.; Jiang, Q.; Chen, M.; Zhao, J. Analysis of Damage Mechanisms and Optimization of Cut Blasting Design under High In-Situ Stresses. Tunn. Undergr. Space Technol. 2017, 66, 19–31. [Google Scholar] [CrossRef]
  37. Murphy, M.Y.; Baum, D.W.; Kuklo, R.M.; Simonson, S.C. Effect of Multiple and Delayed Jet Impact and Penetration on Concrete Target Borehole Diameter. Proc. 19th Int. Symp. Ballist. 2001, 1553–1559. [Google Scholar]
  38. Li, Z.; Hu, Y.; Wang, G.; Zhou, M.; Hu, W.; Zhang, X.; Gao, W. Study on Cyclic Blasting Failure Characteristics and Cumulative Damage Evolution Law of Tunnel Rock Mass under Initial In-Situ Stress. Eng. Fail. Anal. 2023, 150, 107310. [Google Scholar] [CrossRef]
  39. Zhang, X.; Ma, R.; Yang, Y.; Fu, T.; Tian, Y.; Yan, H.; Wang, D.; Jiao, X.; Zhou, H. Study on the Influence of Notched Empty Hole Parameters on Directional Fracture Blasting Effect. Buildings 2024, 14, 4077. [Google Scholar] [CrossRef]
  40. Shen, S.; Zheng, R.; Wang, W.; Ye, C. Effect of Charge Eccentric Position on the Response of Reinforced Concrete Columns Under Blast Loading. Buildings 2025, 15, 1898. [Google Scholar] [CrossRef]
  41. Ribeiro, J.B.; Silva, C.; Mendes, R. Estimation of the reactive flow model parameters for an ammonium nitrate–based emulsion explosive using genetic algorithms. J. Energetic Mater. 2010, 28, 180–204. [Google Scholar] [CrossRef]
  42. Wang, Z.; Wang, H.; Wang, J.; Tian, N. Finite Element Analyses of Constitutive Models Performance in the Simulation of Blast-Induced Rock Cracks. Comput. Geotech. 2021, 135, 104172. [Google Scholar] [CrossRef]
  43. Anderson, C.E., Jr.; Orphal, D.L. Analysis of the Terminal Phase of Penetration. Int. J. Impact Eng. 2003, 29, 69–80. [Google Scholar] [CrossRef]
  44. Wang, L.; Gao, Y.; Fu, H.; Mu, H.; Liu, Y.; Zuo, C.; Li, Q. Study on Blasting Technology of Long and Short Straight Hole Combined Cutting in Small Section Tunnel. Blasting 2025, 42, 97. [Google Scholar]
  45. Mandelbrot, B.B. The Fractal Geometry of Nature; W.H. Freeman: New York, NY, USA, 1982. [Google Scholar]
  46. You, S.; Yang, R.; Ding, C.; Xiao, C.; Chen, W.; Wang, L.; Chen, J.; Shi, Y.; Miao, H.; Cao, J. Study on the Effect of Blast Delay Time Between Blastholes in Sublevel Caving. Min. Metall. Explor. 2024, 41, 1771–1791. [Google Scholar] [CrossRef]
  47. Ding, X.; Xiao, X.; Cui, J.; Wu, D.; Pan, Y. Damage Evolution, Fractal Dimension and a New Crushing Energy Formula for Coal with Bursting Liability. Process Saf. Environ. Prot. 2023, 169, 619–628. [Google Scholar] [CrossRef]
  48. Wu, Y.; Zhang, X.; Li, Z.; Gao, W.; Xu, Z.; Zhang, Y.; Zhou, J. Effects of In-Situ Stress on Damage and Fractal during Cutting Blasting Excavation. Fractal Fract. 2024, 8, 450. [Google Scholar] [CrossRef]
  49. You, S.; Yang, R.; Xiao, C.; Ding, C.; Li, C.; Yang, Z.; Li, J. Study on the Superposition Effect of Stress Waves and Crack Propagation Law Between Blastholes at Different Angles. Opt. Lasers Eng. 2024, 178, 108193. [Google Scholar] [CrossRef]
  50. Zhang, J.; Yang, W.; Wang, H.; Bai, X.; Zhang, Y.; Fan, Y.; Lv, N.; Yang, B.; Cheng, B.; Yan, G.; et al. Influence of Angle Between Bedding Plane and Blast Hole on Smooth Blasting Effect of Tunnel. Eng. Blasting 2025, 31, 24–33. [Google Scholar] [CrossRef]
  51. Zhou, J. Study on the Influence of Minimum Resistance Line and Decoupling Coefficient on Explosion Energy in Bench Blasting. Ph.D. Thesis, Kunming University of Science and Technology, Kunming, China, 2020. [Google Scholar] [CrossRef]
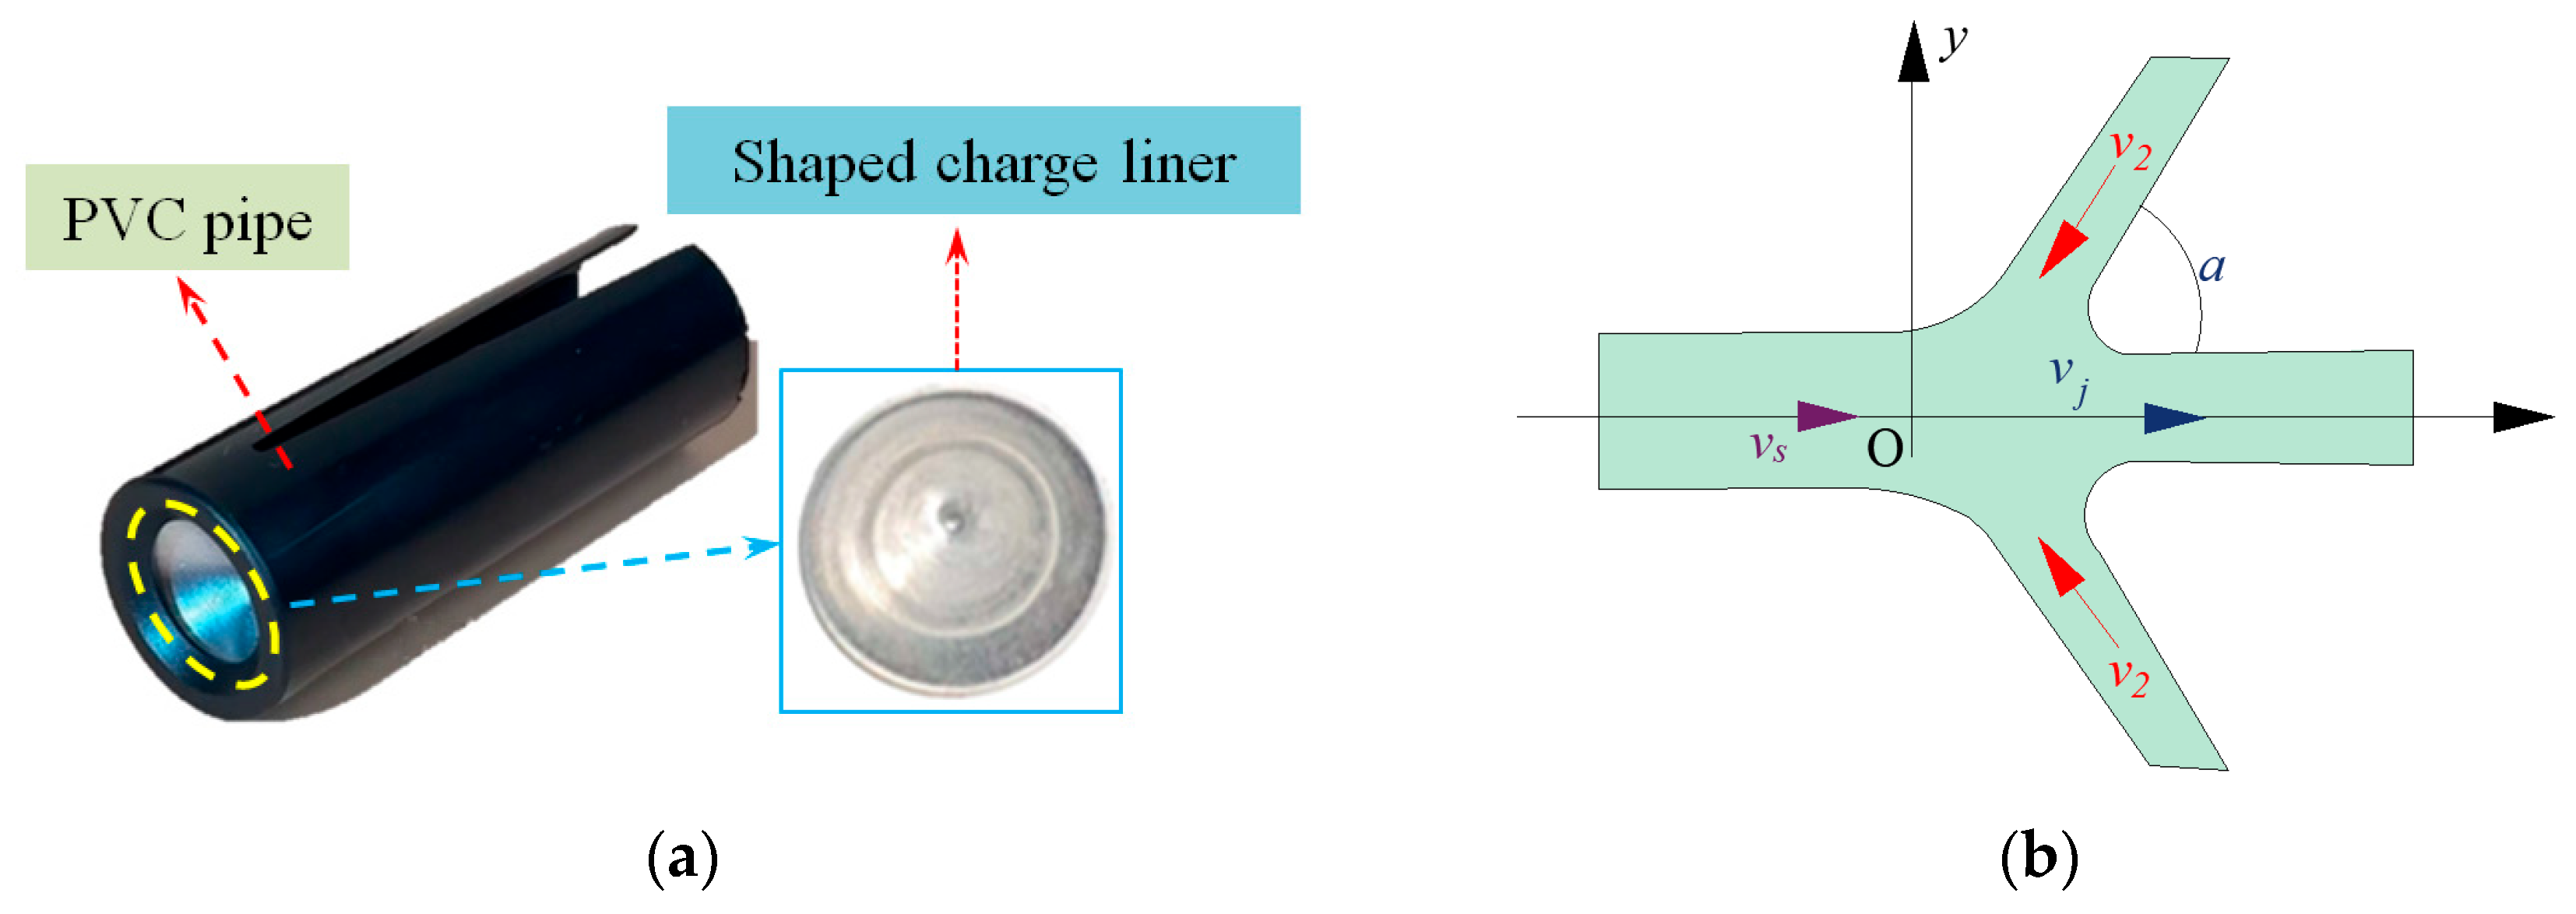
Figure 1. Principle of shaped charge hood and jet. (a) Energy-gathering liner device. (b) Schematic diagram of shaped charge jet formation.
Buildings 15 02815 g001
Figure 2. Smooth blasting charge design.
Buildings 15 02815 g002
Figure 3. Blasting numerical model based on ALE. (a) Numerical model diagram. (b) Finite element model diagram.
Buildings 15 02815 g003
Figure 4. Rock laboratory mechanical test ((a) sample preparation process; (b) laboratory test process).
Buildings 15 02815 g004
Figure 5. Model test.
Buildings 15 02815 g005
Figure 6. Model test process.
Buildings 15 02815 g006
Figure 7. Velocity contour of the detonation products from the secondary charge.
Buildings 15 02815 g007
Figure 8. Velocity contour map during the formation process of the shaped charge jet.
Buildings 15 02815 g008
Figure 9. Variation curve of shaped charge jet velocity under different L1/L2 ratios.
Buildings 15 02815 g009
Figure 10. Simulation results of shaped charge impact response with L1/L2 = 1.
Buildings 15 02815 g010aBuildings 15 02815 g010b
Figure 11. Effective stress and damage evolution nephogram of surrounding rock under different schemes.
Buildings 15 02815 g011aBuildings 15 02815 g011b
Figure 12. Binary thresholding result.
Buildings 15 02815 g012
Figure 13. Change in fractal dimensions.
Buildings 15 02815 g013
Figure 14. Peak effective stress of different structures of two-stage charge.
Buildings 15 02815 g014
Figure 15. Time history curve of damage evolution of typical units (L1/L2 = 1).
Buildings 15 02815 g015
Figure 16. Unit damage degree under different schemes.
Buildings 15 02815 g016
Figure 17. Site of field test.
Buildings 15 02815 g017
Figure 18. The layout of the right hole of the upper step.
Buildings 15 02815 g018
Figure 19. Installation process of shaped explosive.
Buildings 15 02815 g019
Figure 20. Field test smooth blasting effects under different schemes.
Buildings 15 02815 g020
Figure 21. Scanning results for tunnel section under different test schemes (cm).
Buildings 15 02815 g021
Figure 22. Explosive heap under different schemes.
Buildings 15 02815 g022
Figure 23. Fractal law of blasting fragmentation size.
Buildings 15 02815 g023
Table 1. RHT parameters of dolomite.
ρ/(kg/m3)Pel/GPaA2/GPaA3/GPaBB0B1T1/GPaT2/GPa
26006.037.8421.290.051.221.2225.70.0
na0NGQ0βcβt ε ˙ 0 c /ms−1 ε ˙ 0 t /ms−1
1.20.10.760.041.00.0260.00700.007
ft*fs*fc/MPaA1/GPa
0.040.218925.7
Table 2. Parameters of Johnson cook constitutive model for liner material.
MaterialGa/(GPa)Aa/(MPa)Ba/(MPa)naCama
Aluminum282654260.340.0151.0
Table 3. Air material parameters.
ρa/(kg/m3)C0C1C2C3C4C5C6 E 0 e /(GPa) V 0 a
1.290.00.00.00.00.40.40.00.0250.0
Table 4. Reaction rate constants of emulsion explosives.
ParameterValueParameterValueParameterValue
a0.002y2.026e0.534
b0.673c0.407g0.630
x12.291d0.030z3.918
G1116.502G227.957I821,766
Table 5. Probability statistics of stress and damage degree at different L1/L2 ratios.
L1/L2Average Effective Stress of Measuring Points A~E (MPa)Standard Deviation of StressAverage Damage Degree of Measuring Points A~EStandard Deviation of Damage Degree
185.1828.850.680.15
1.386.8829.620.690.11
1.797.228.680.770.09
2.394.3728.330.740.08
3.384.647.310.660.35
Table 6. Typical engineering blasting parameters.
NameHole NumberHole Depth
(m)
Hole Length
(m)
Single-Hole Charge
(kg)
Total Explosives
(kg)
Cutting hole180.951.27/1.22/1.160.65/0.6/0.559.9
Auxiliary hole340.950.950.413.6
Peripheral hole340.950.950.310.2
Bottom hole120.950.950.56.0
Footing98 39.7
Disclaimer/Publisher’s Note: The statements, opinions and data contained in all publications are solely those of the individual author(s) and contributor(s) and not of MDPI and/or the editor(s). MDPI and/or the editor(s) disclaim responsibility for any injury to people or property resulting from any ideas, methods, instructions or products referred to in the content.