Space Gene Quantification and Mapping of Traditional Settlements in Jiangnan Water Town: Evidence from Yubei Village in the Nanxi River Basin


Abstract
1. Introduction
1.1. Research Background
1.2. Literature Review
1.3. Problem Statement and Objectives
2. Materials and Methods
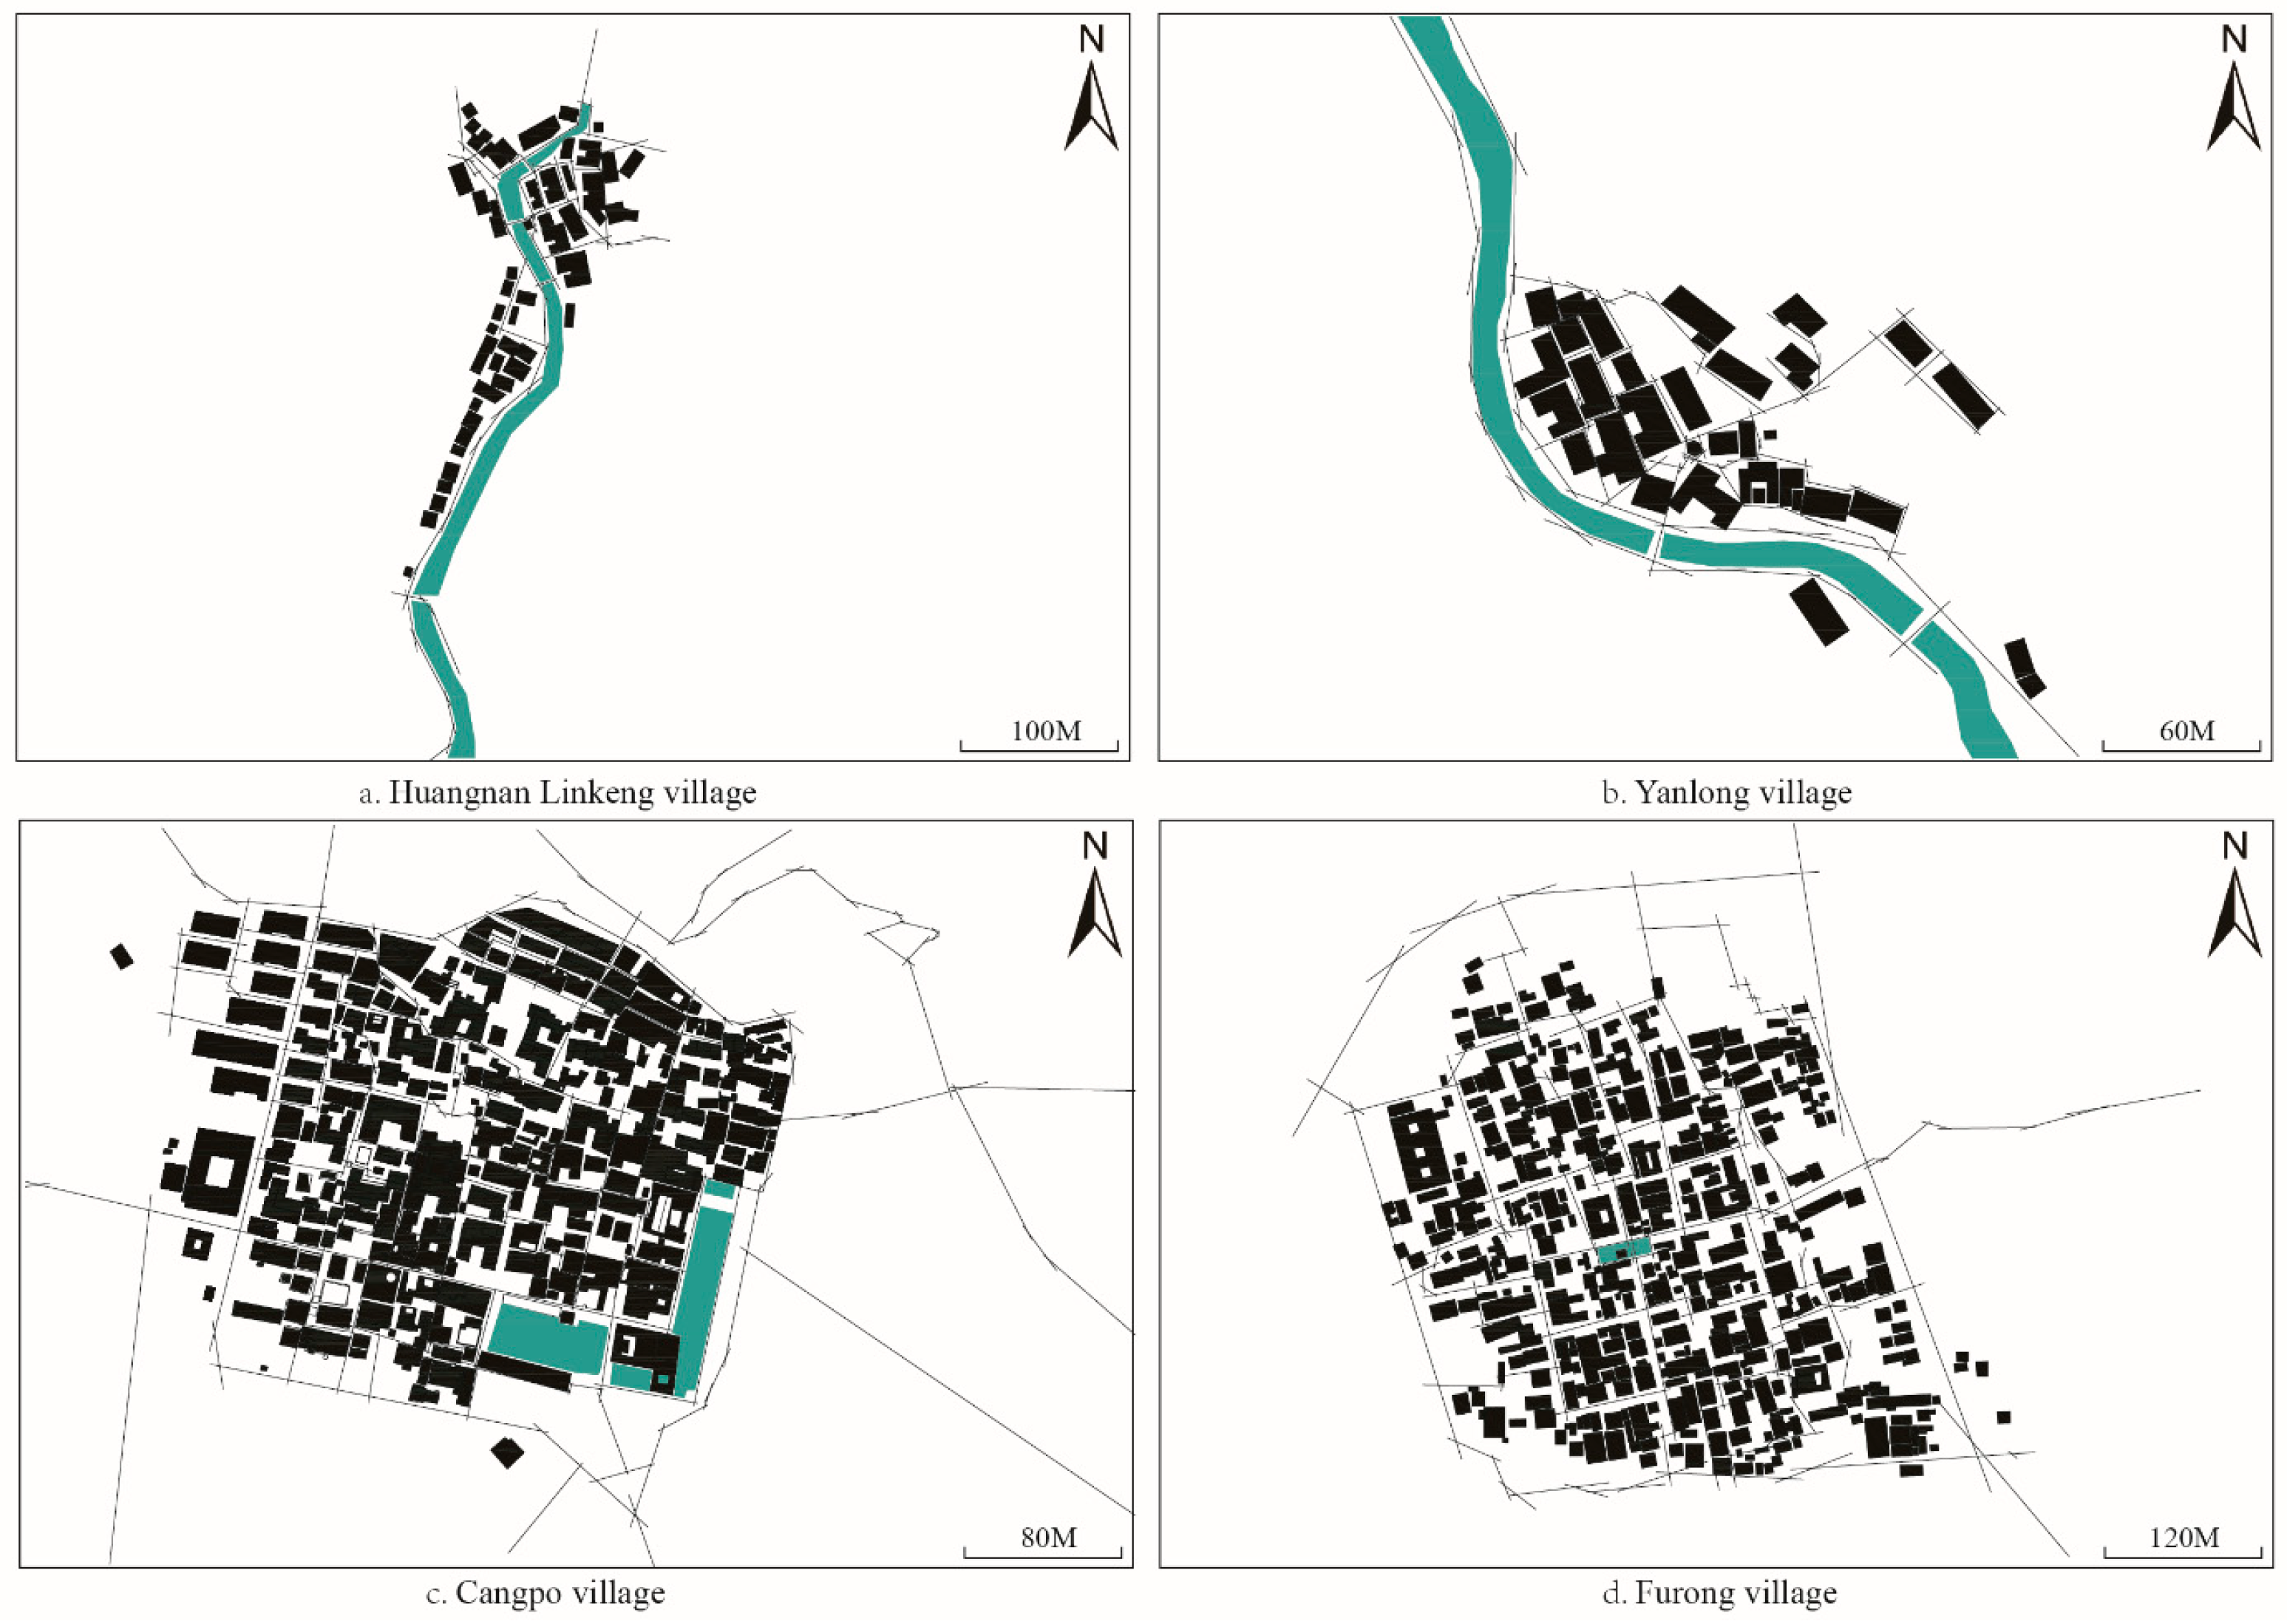
2.1. Study Area
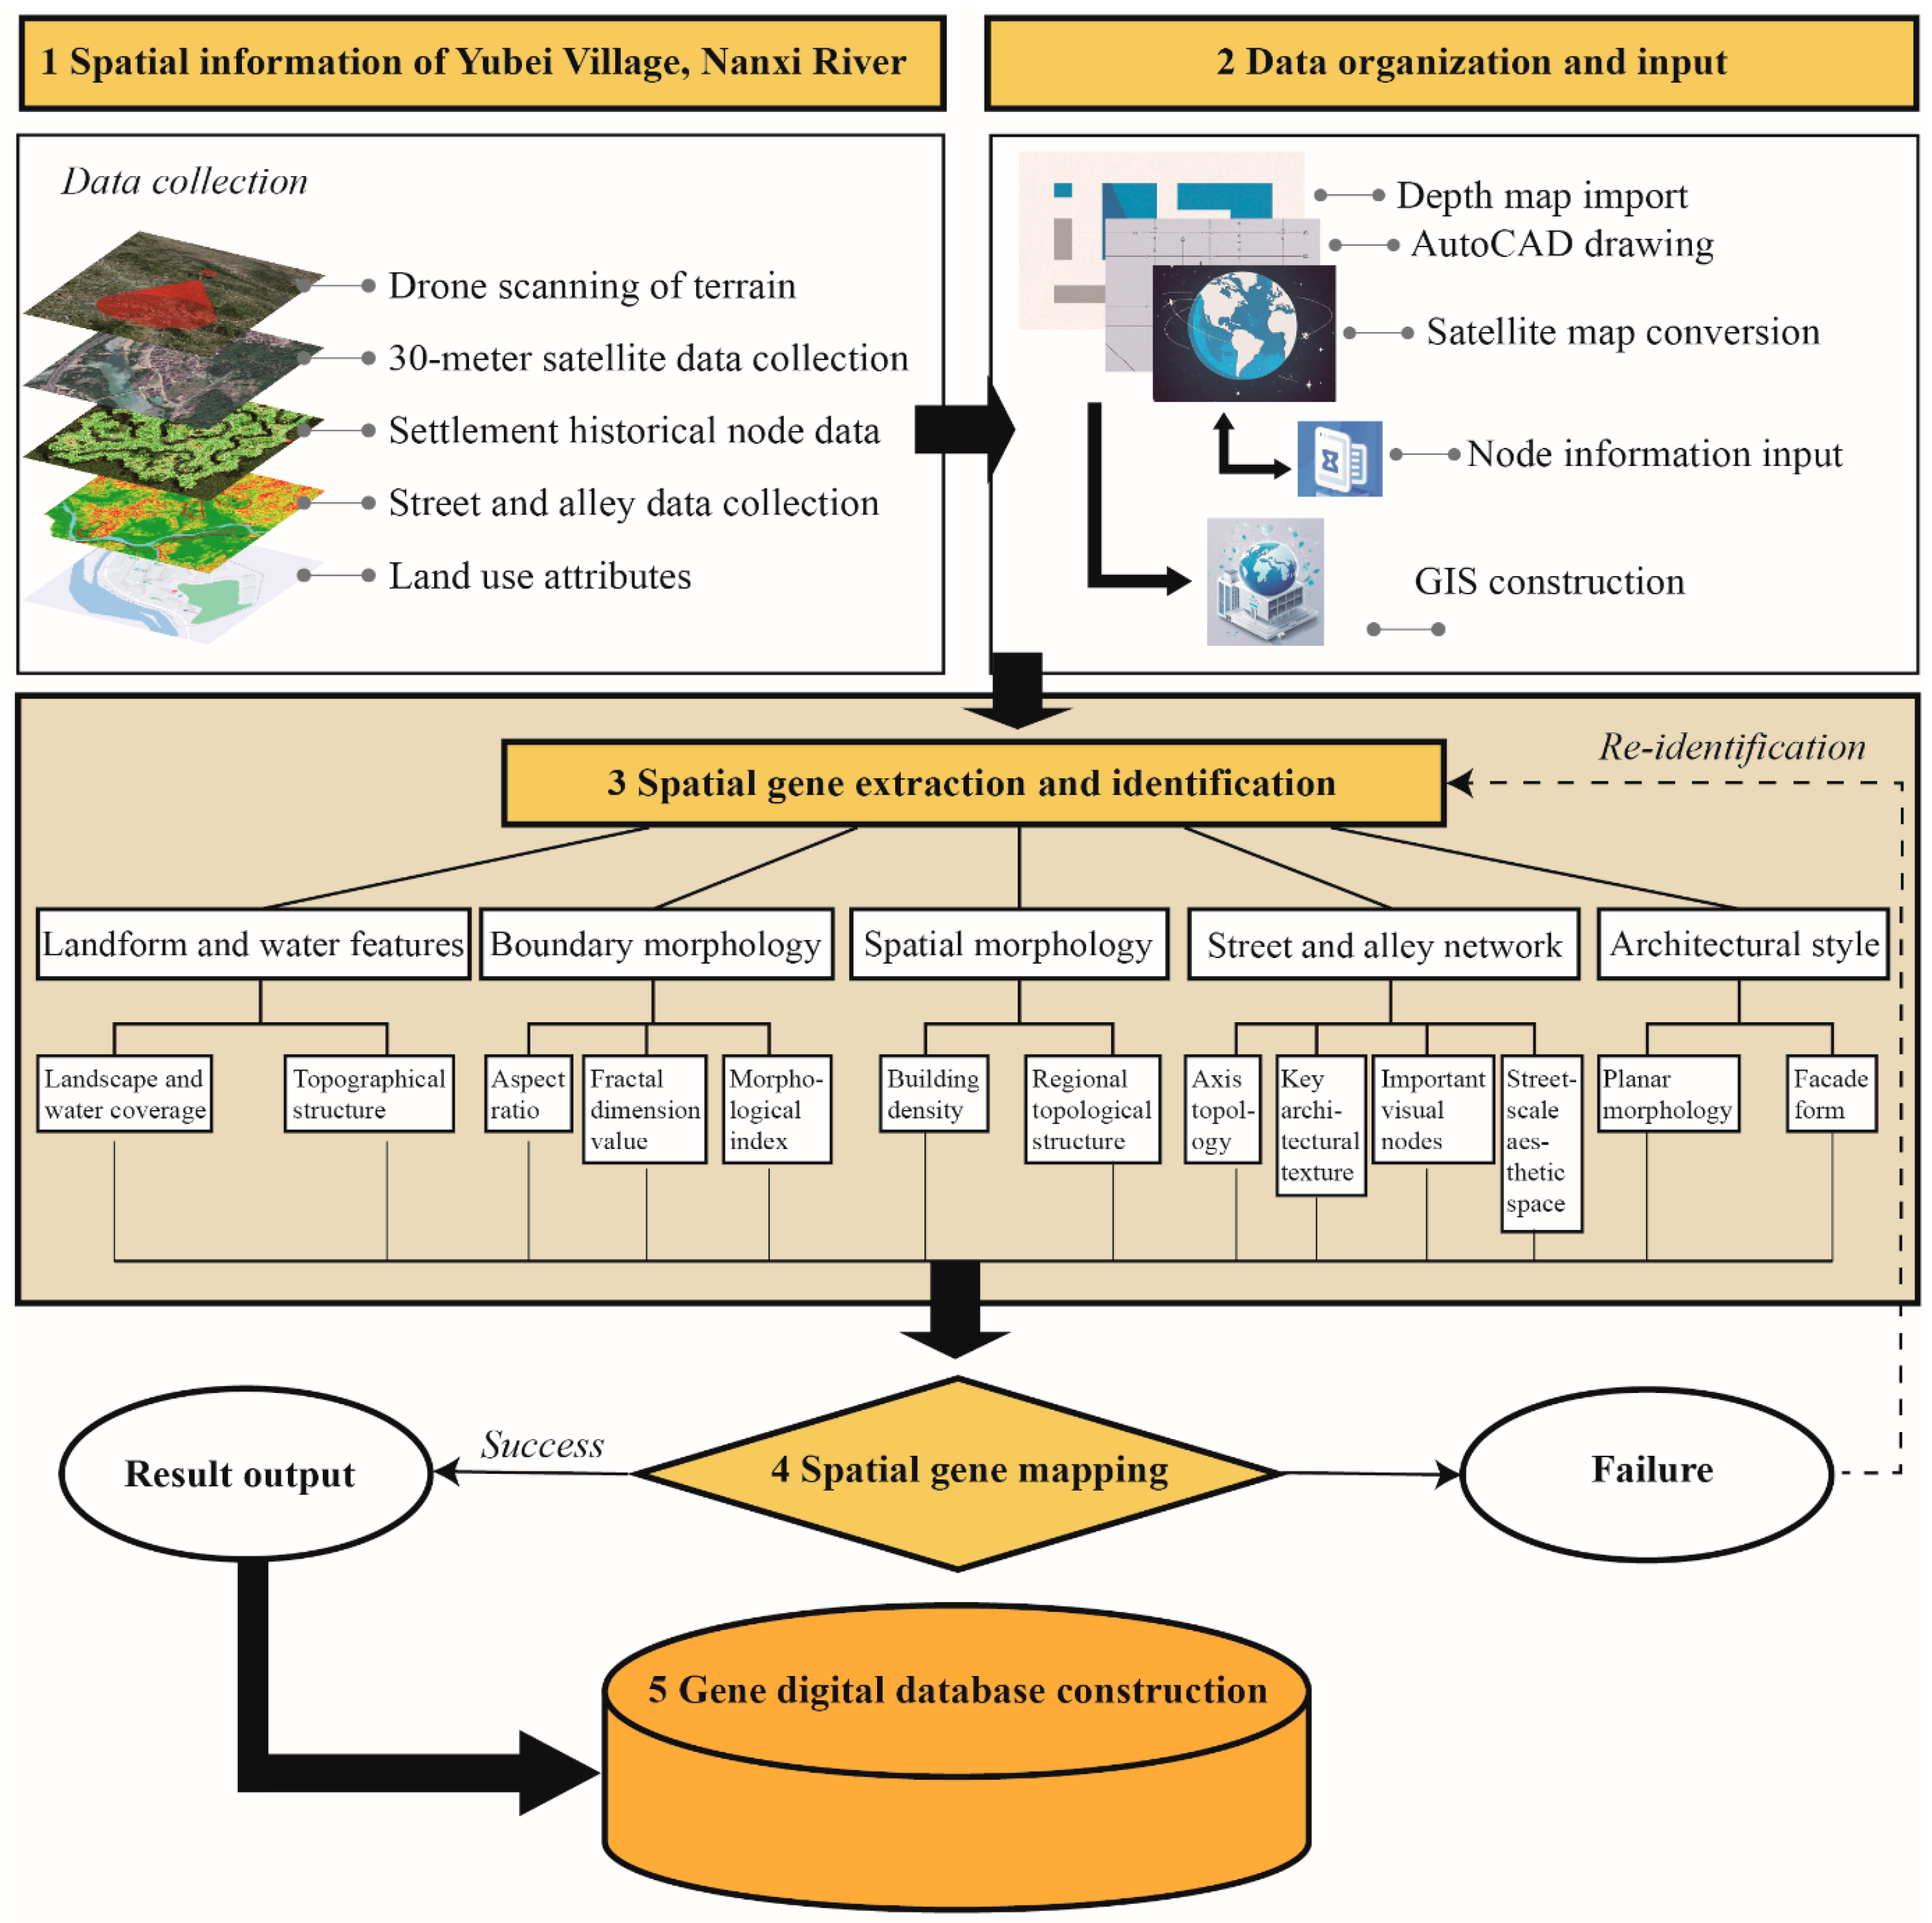
2.2. Methodology
2.3. Data Source
3. Results
3.1. Space Gene Recognition Results
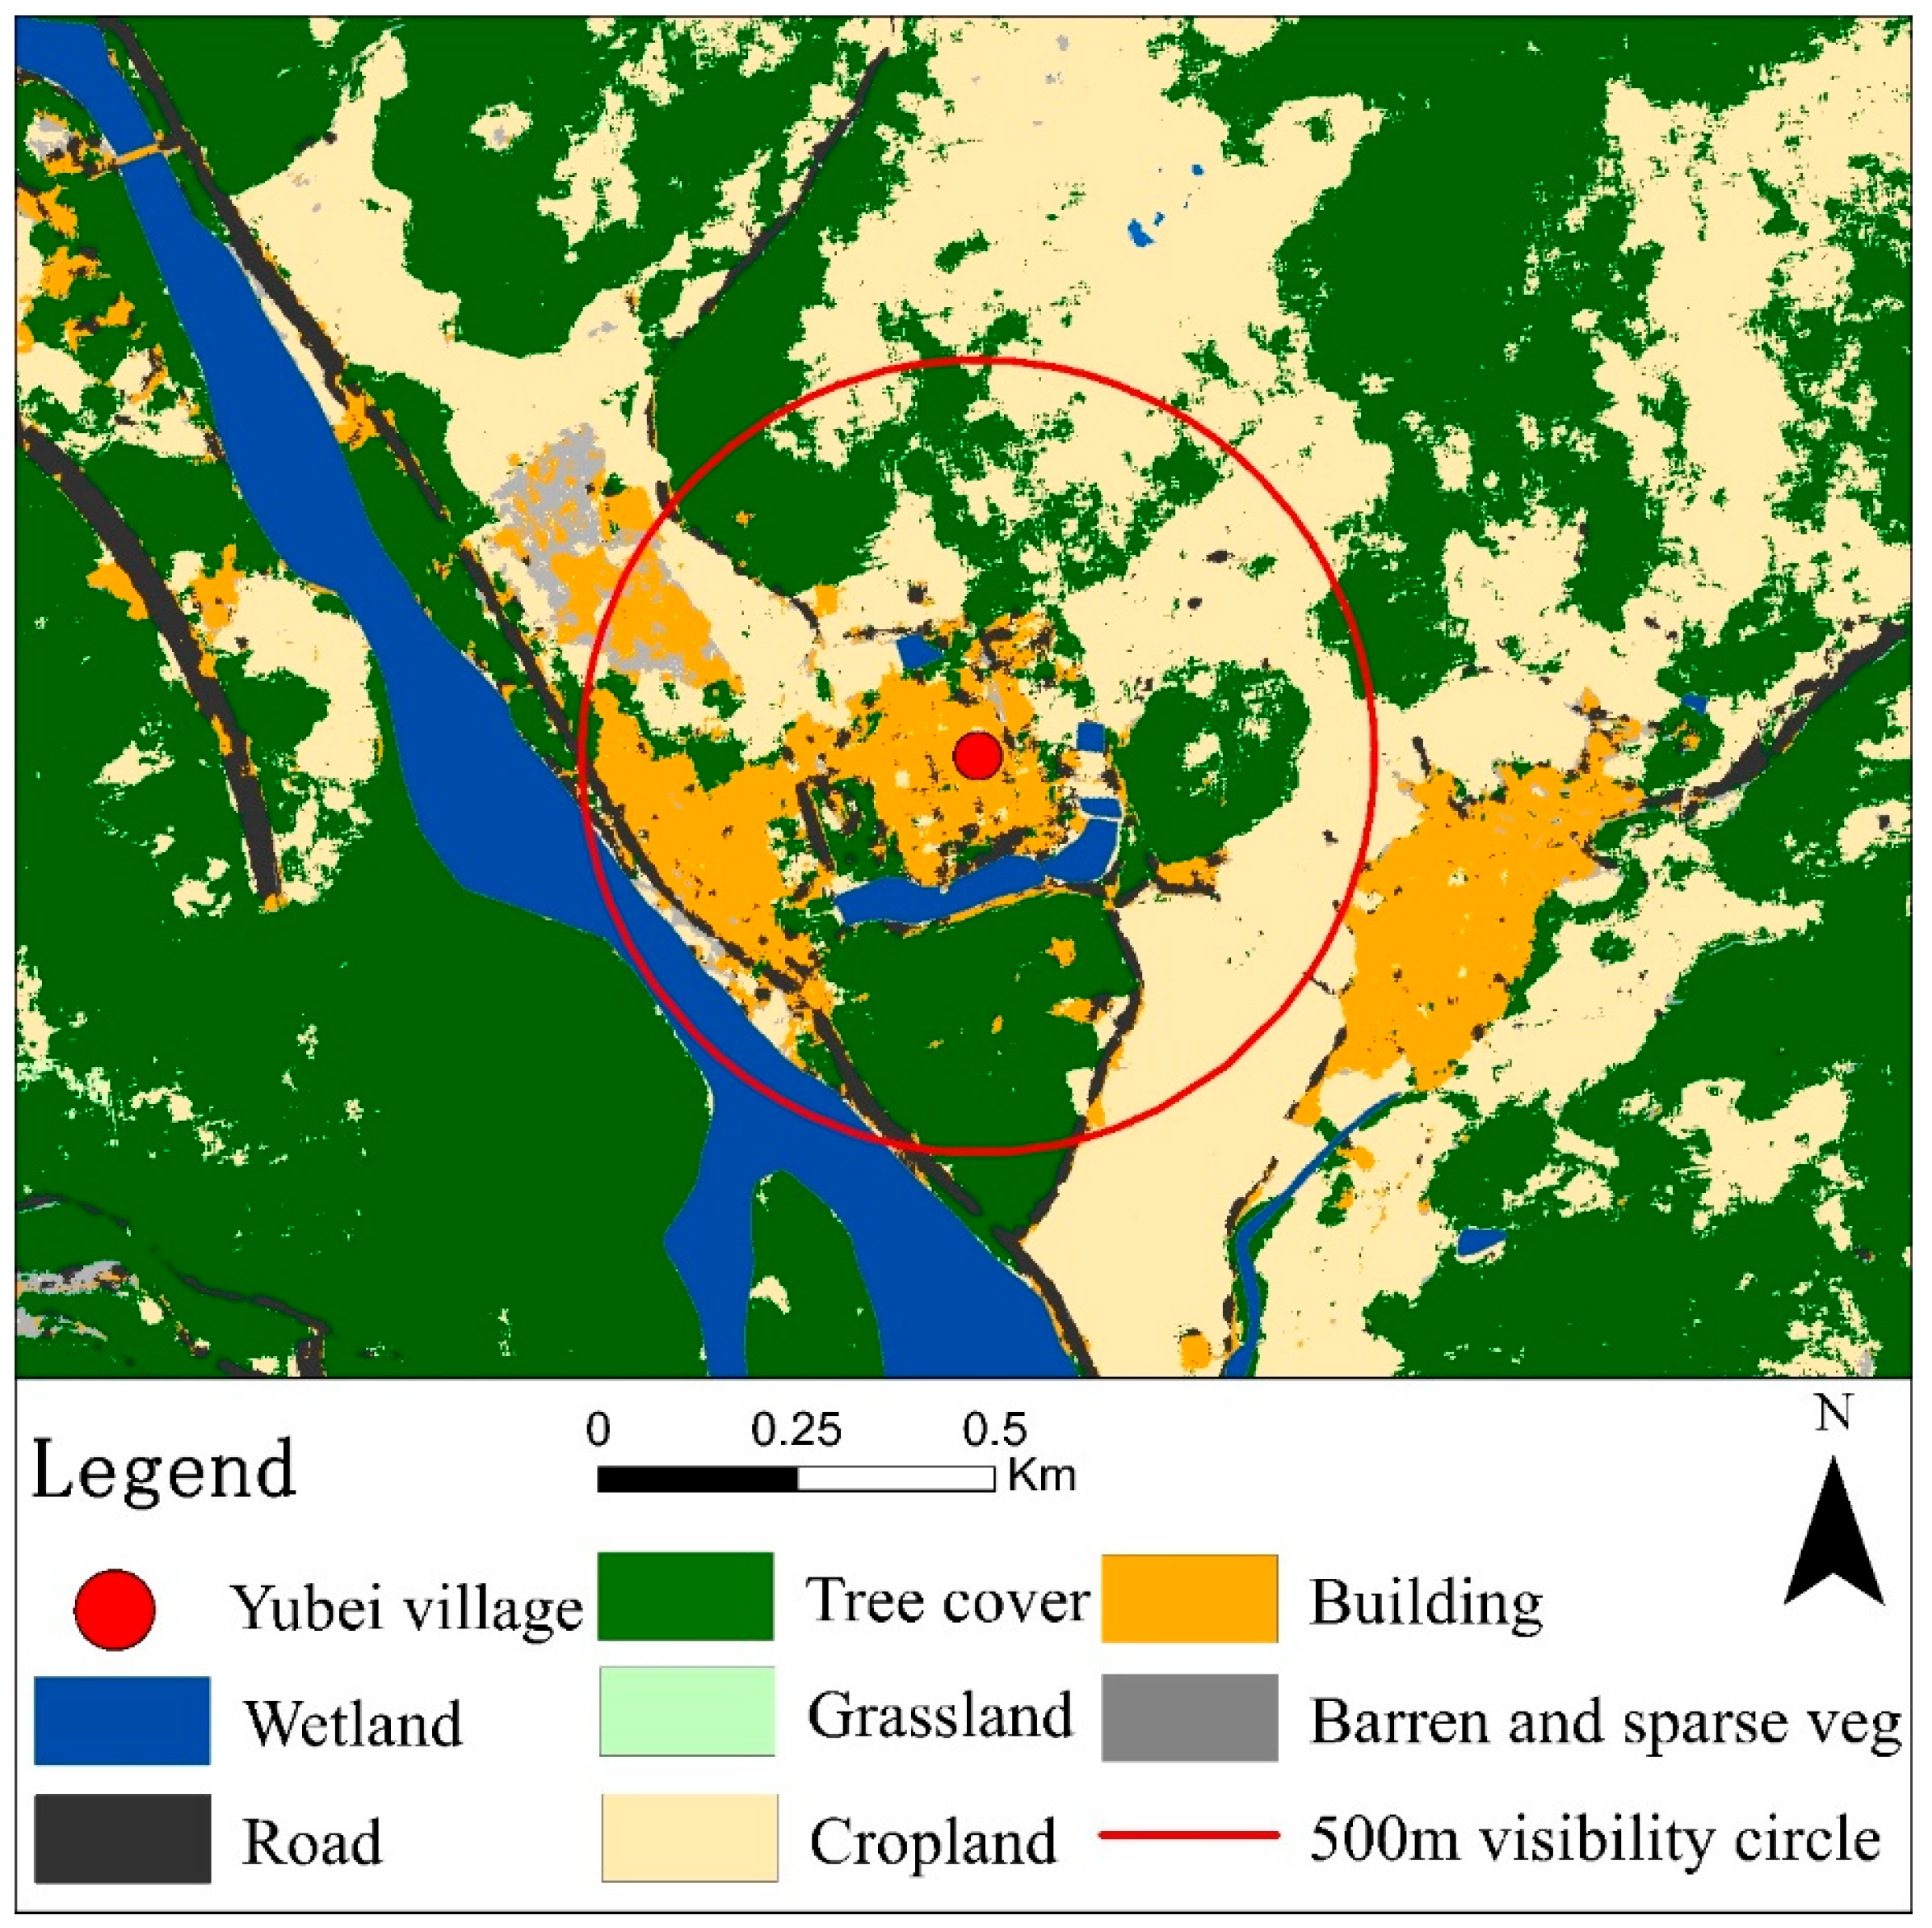
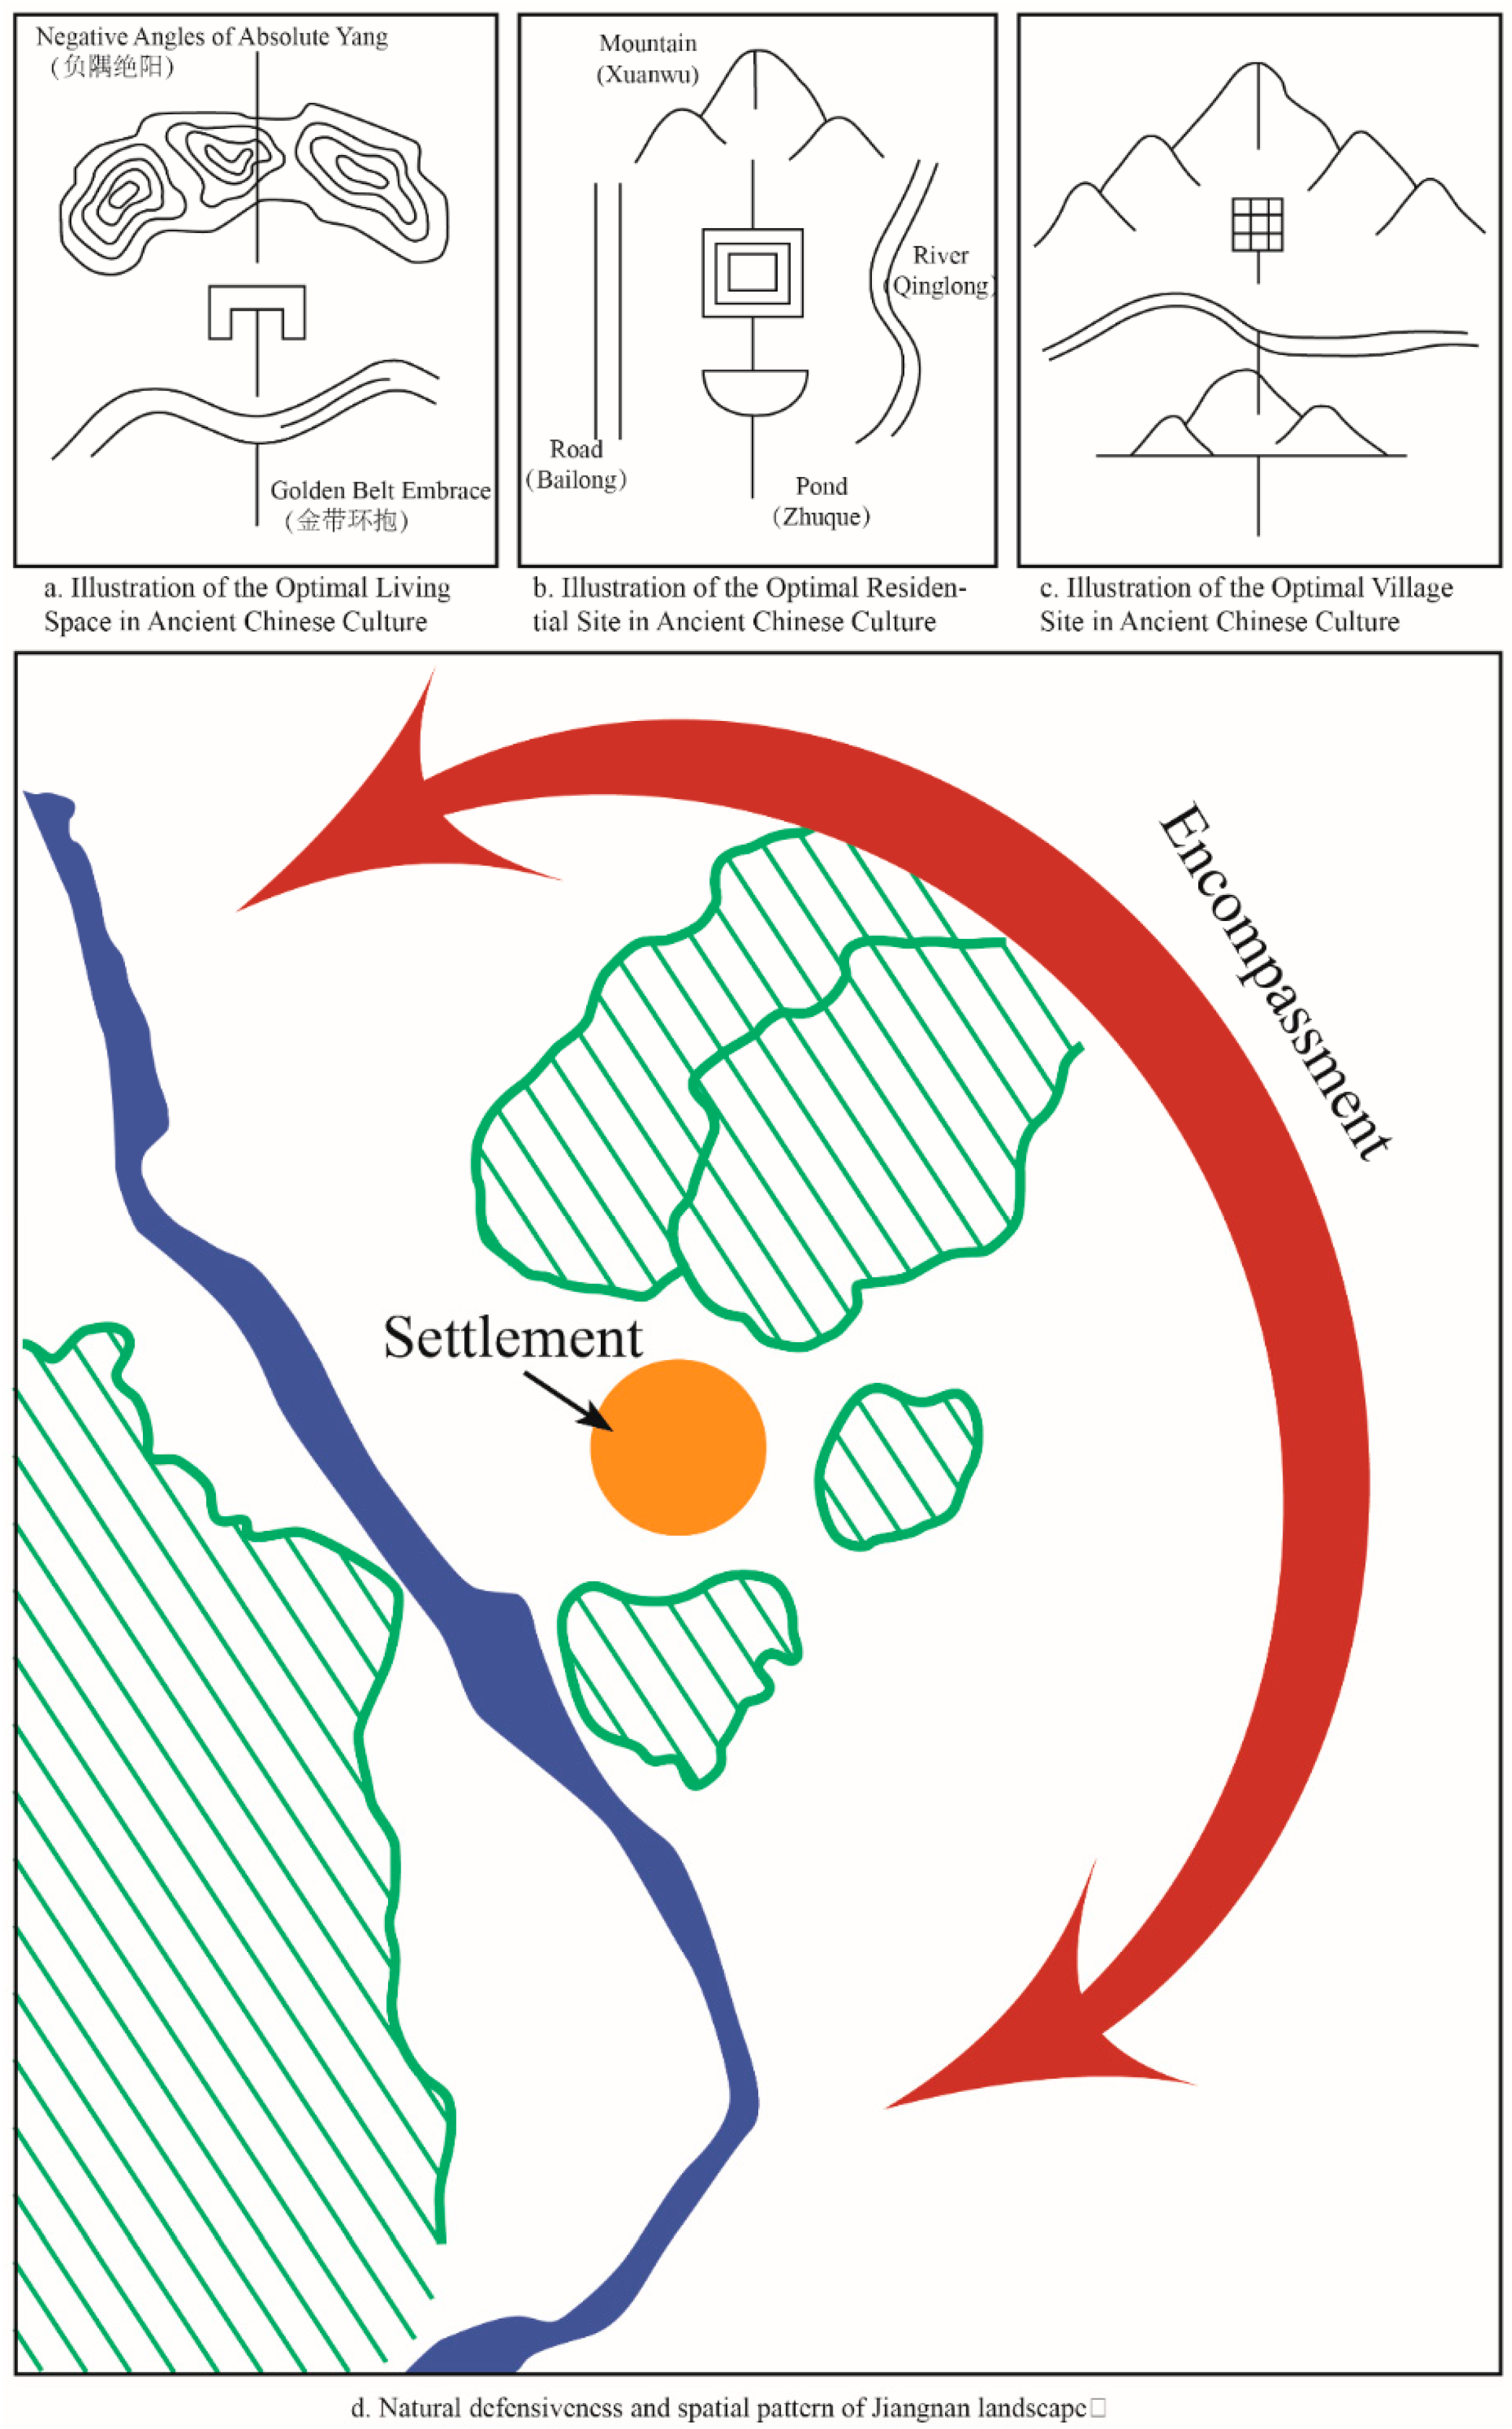
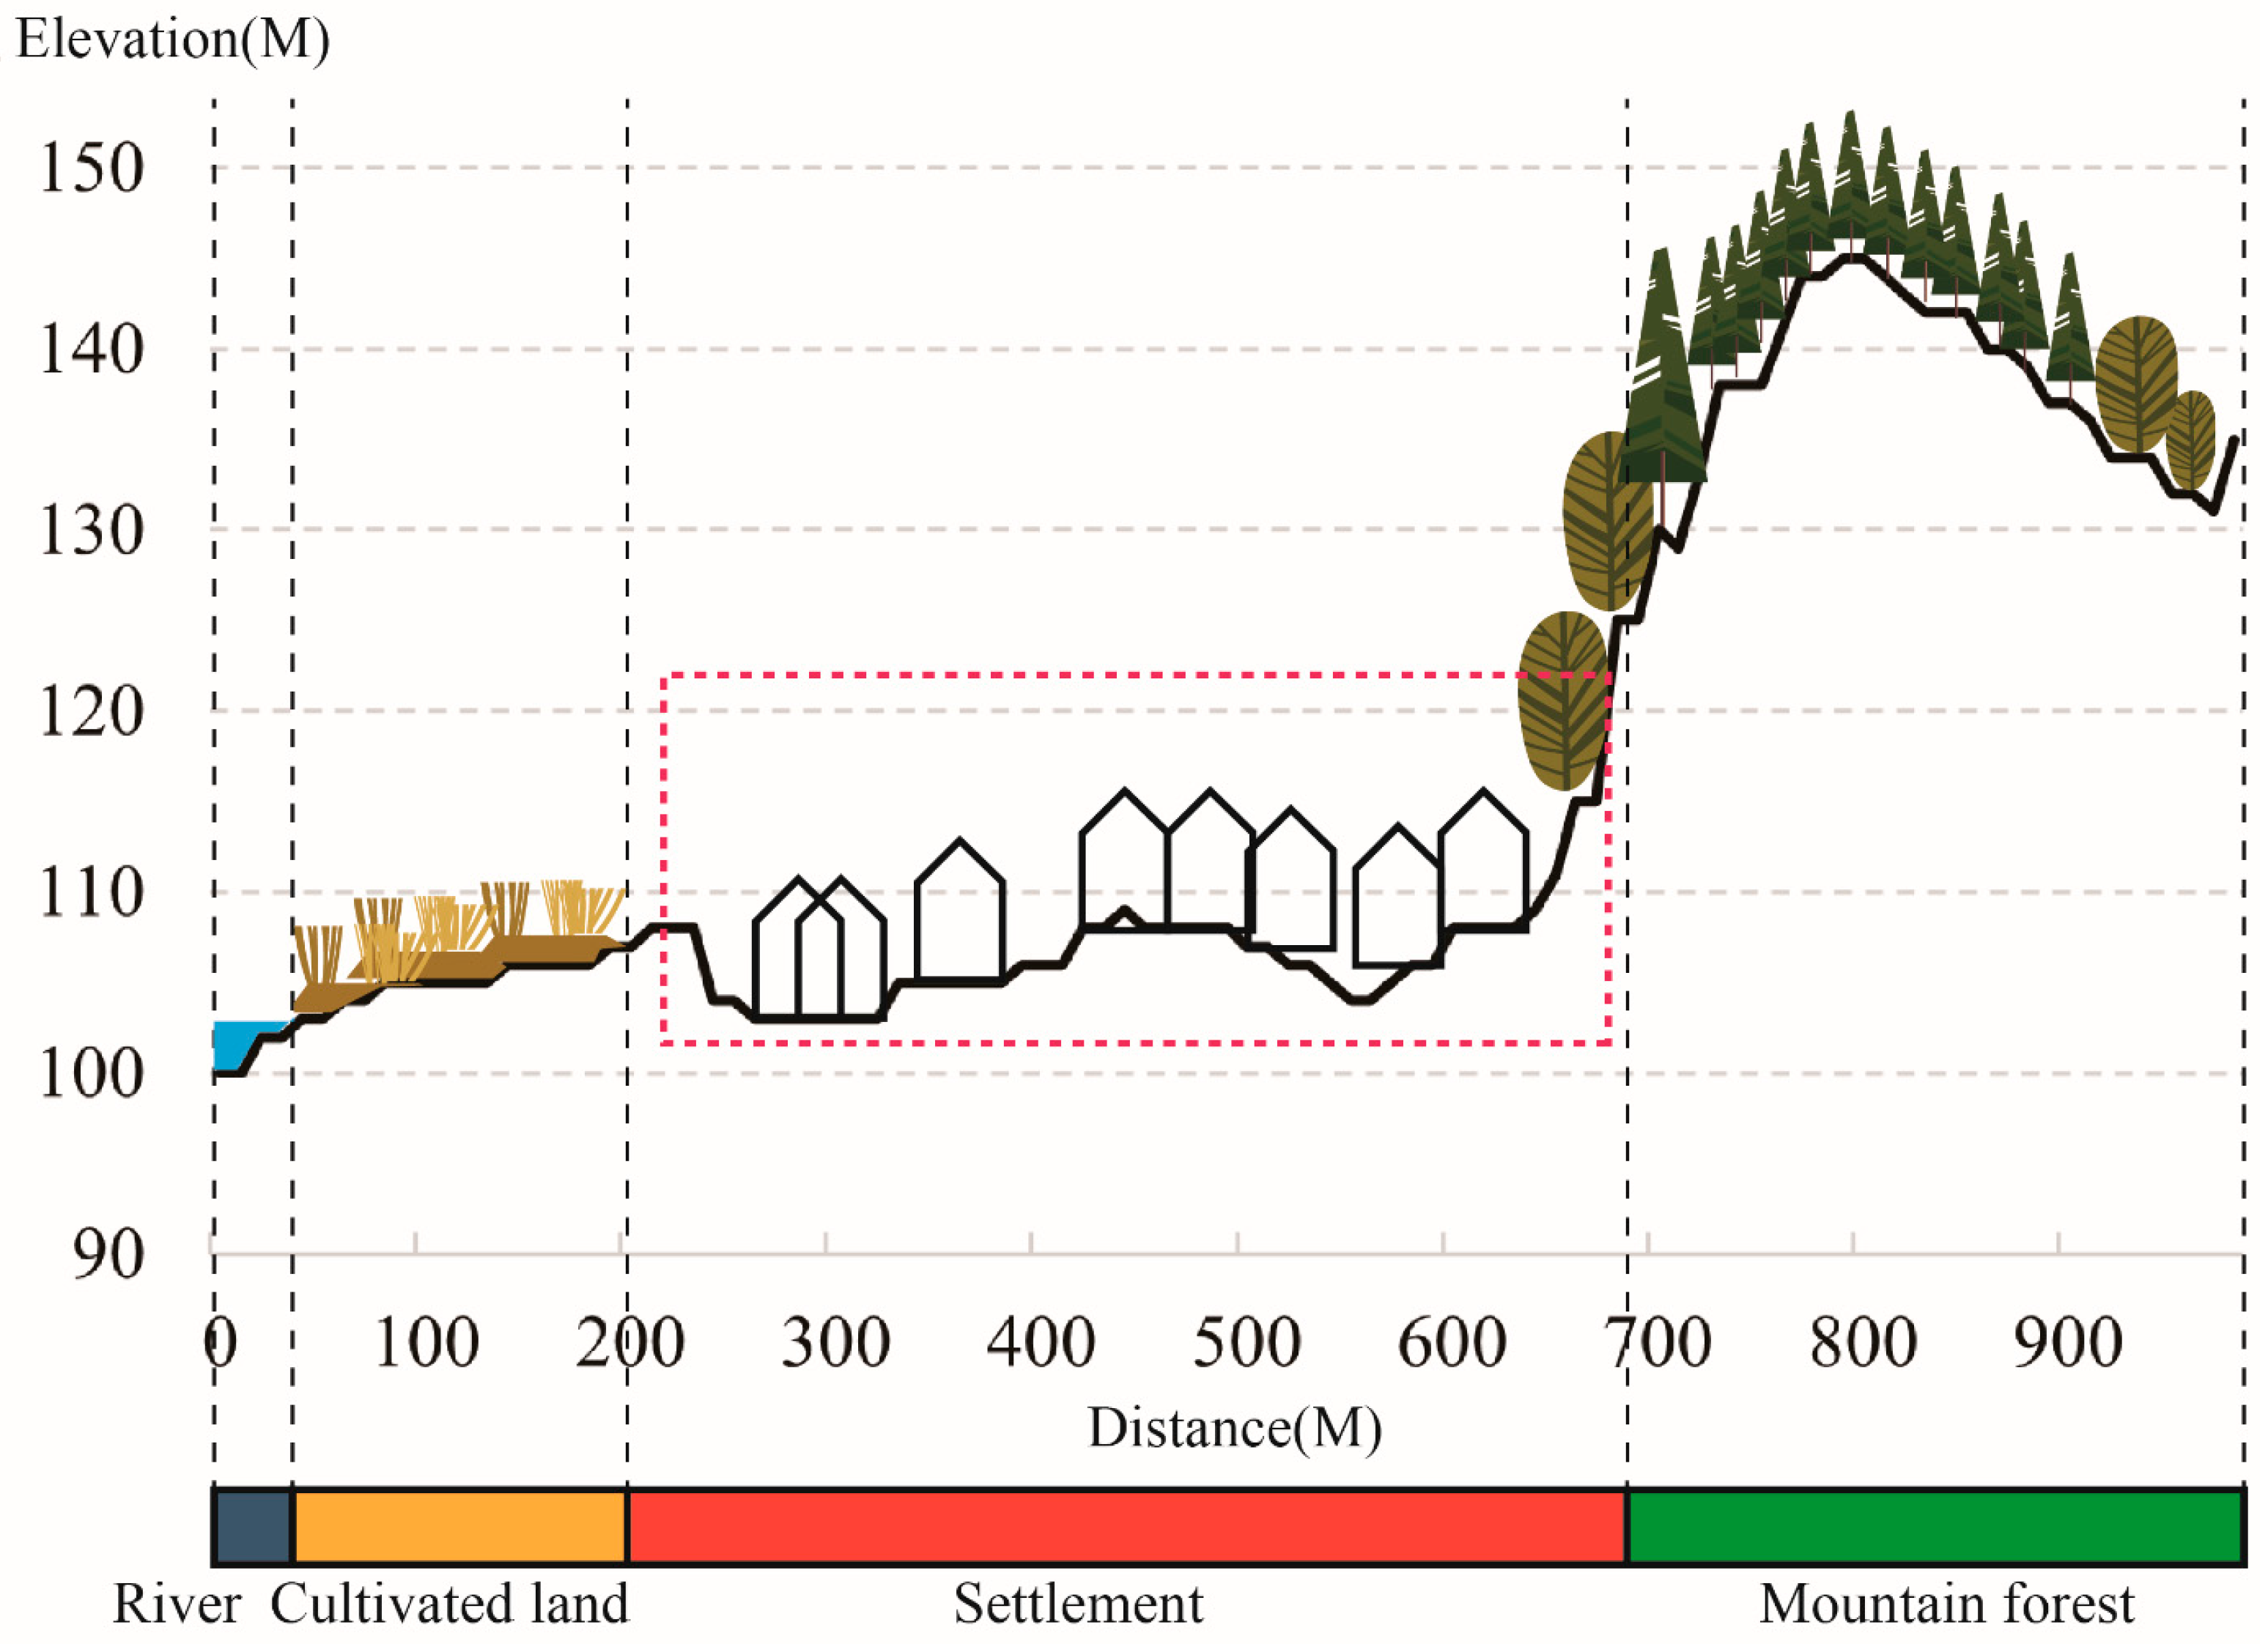
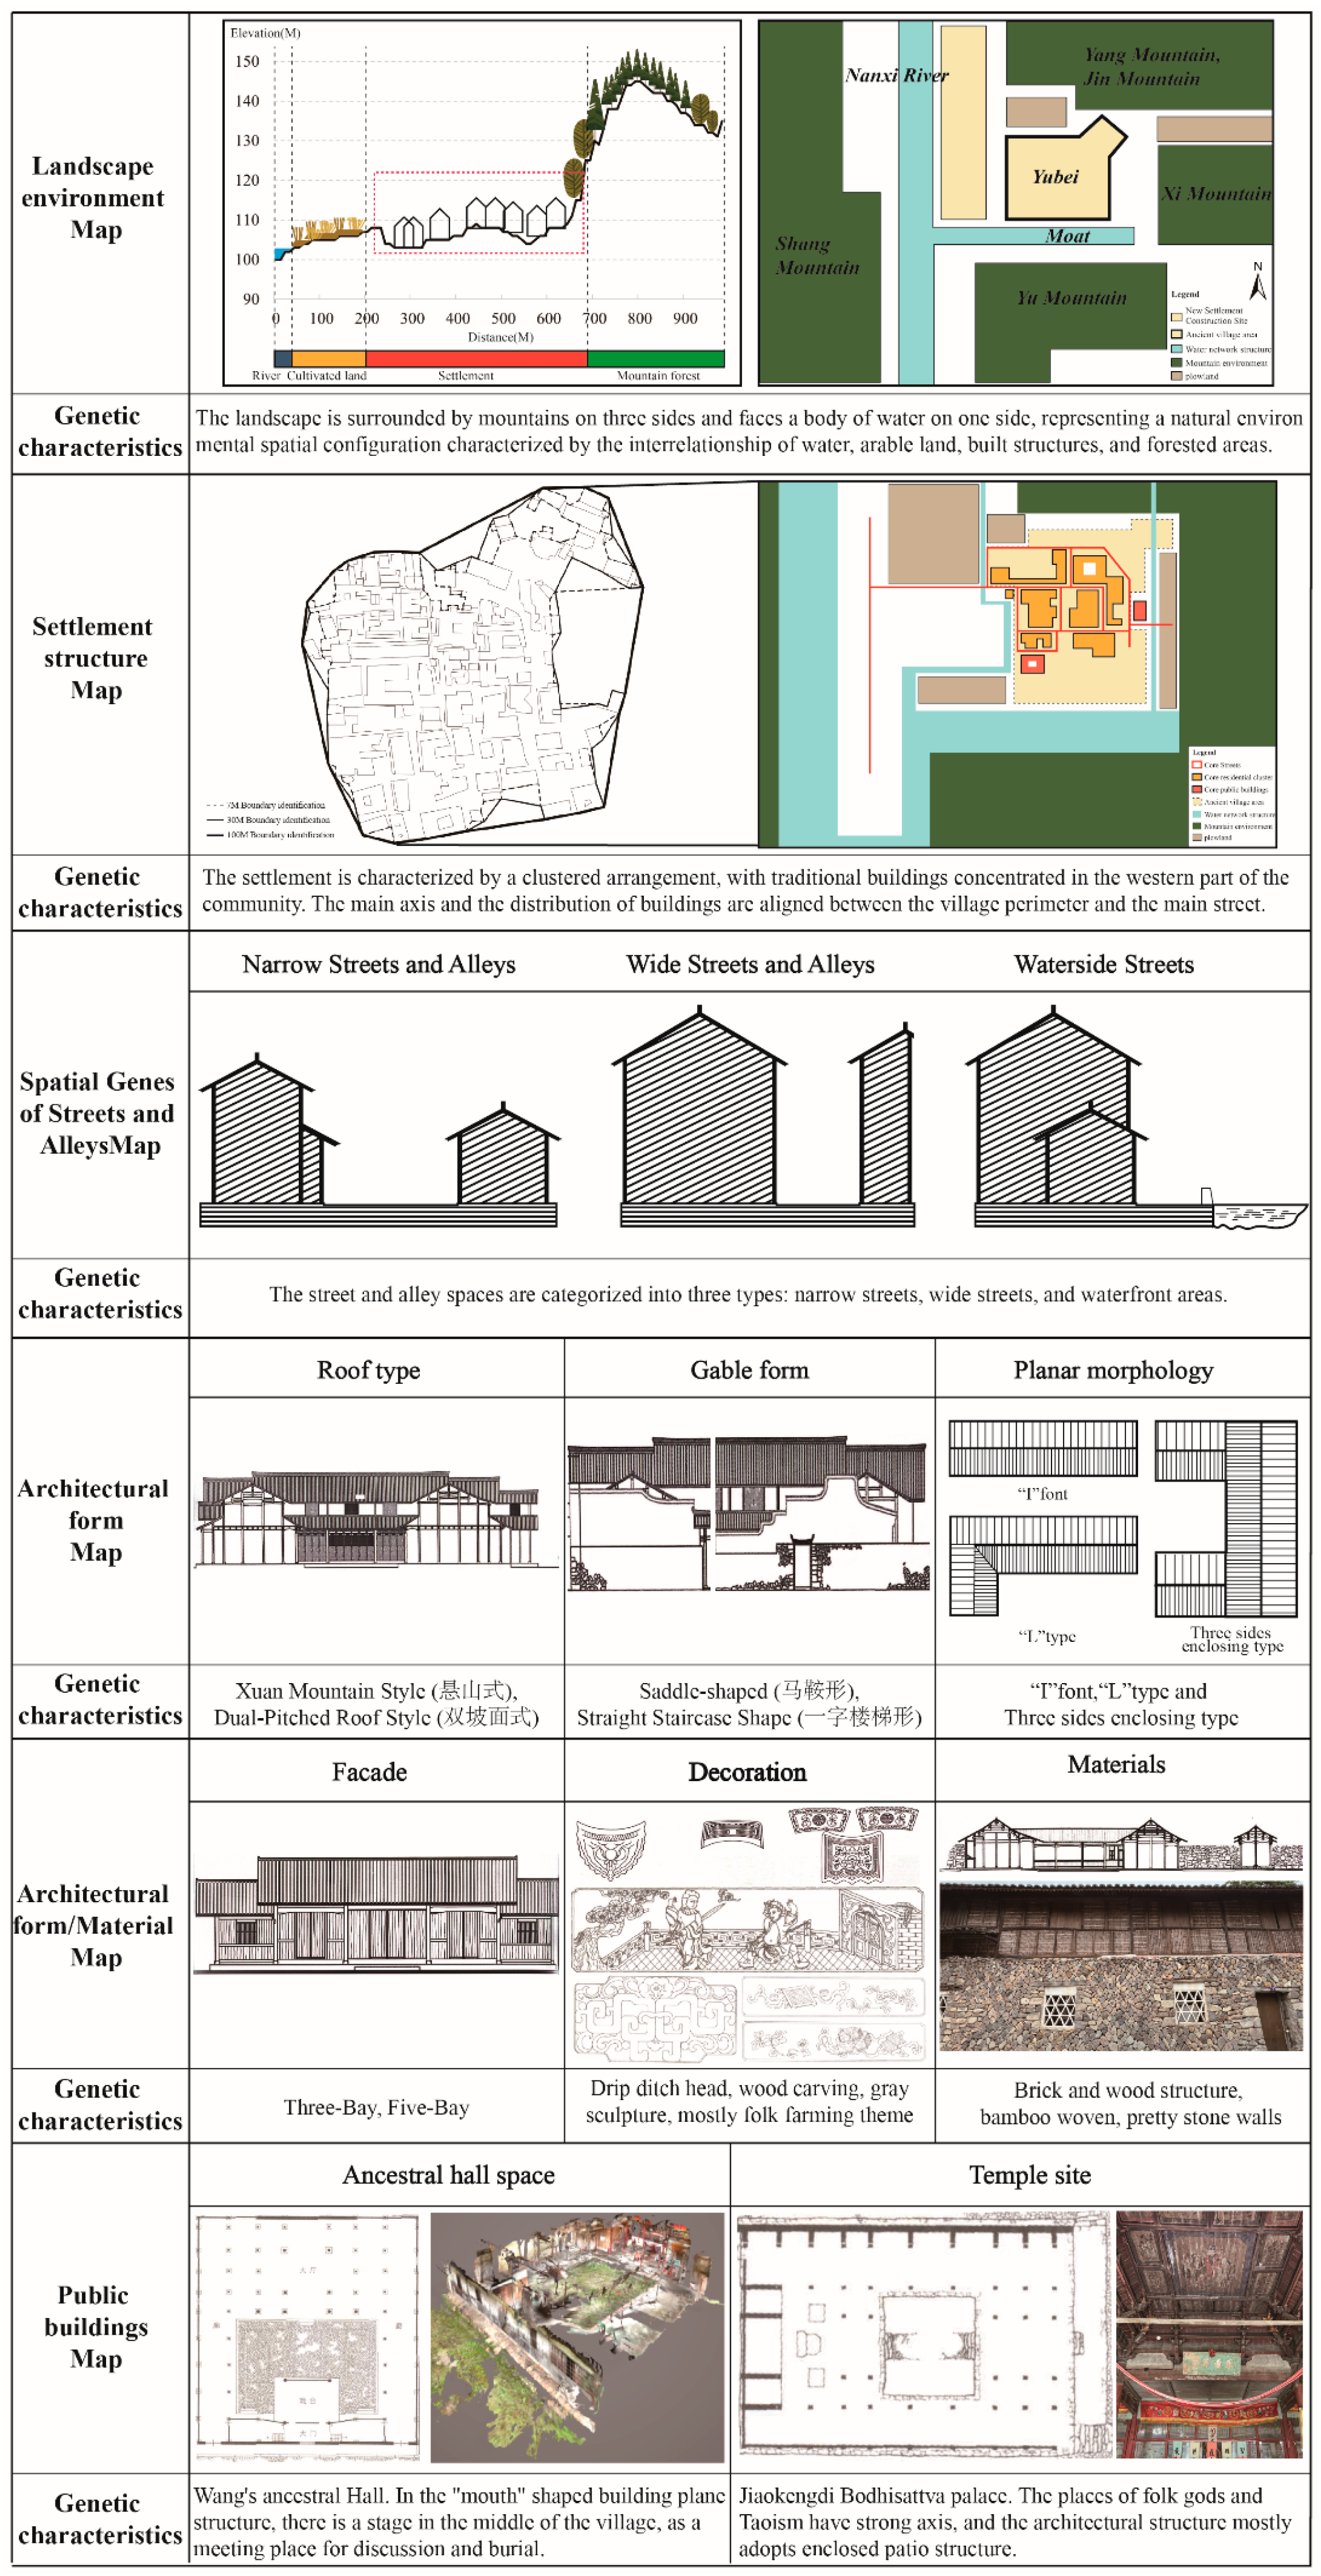
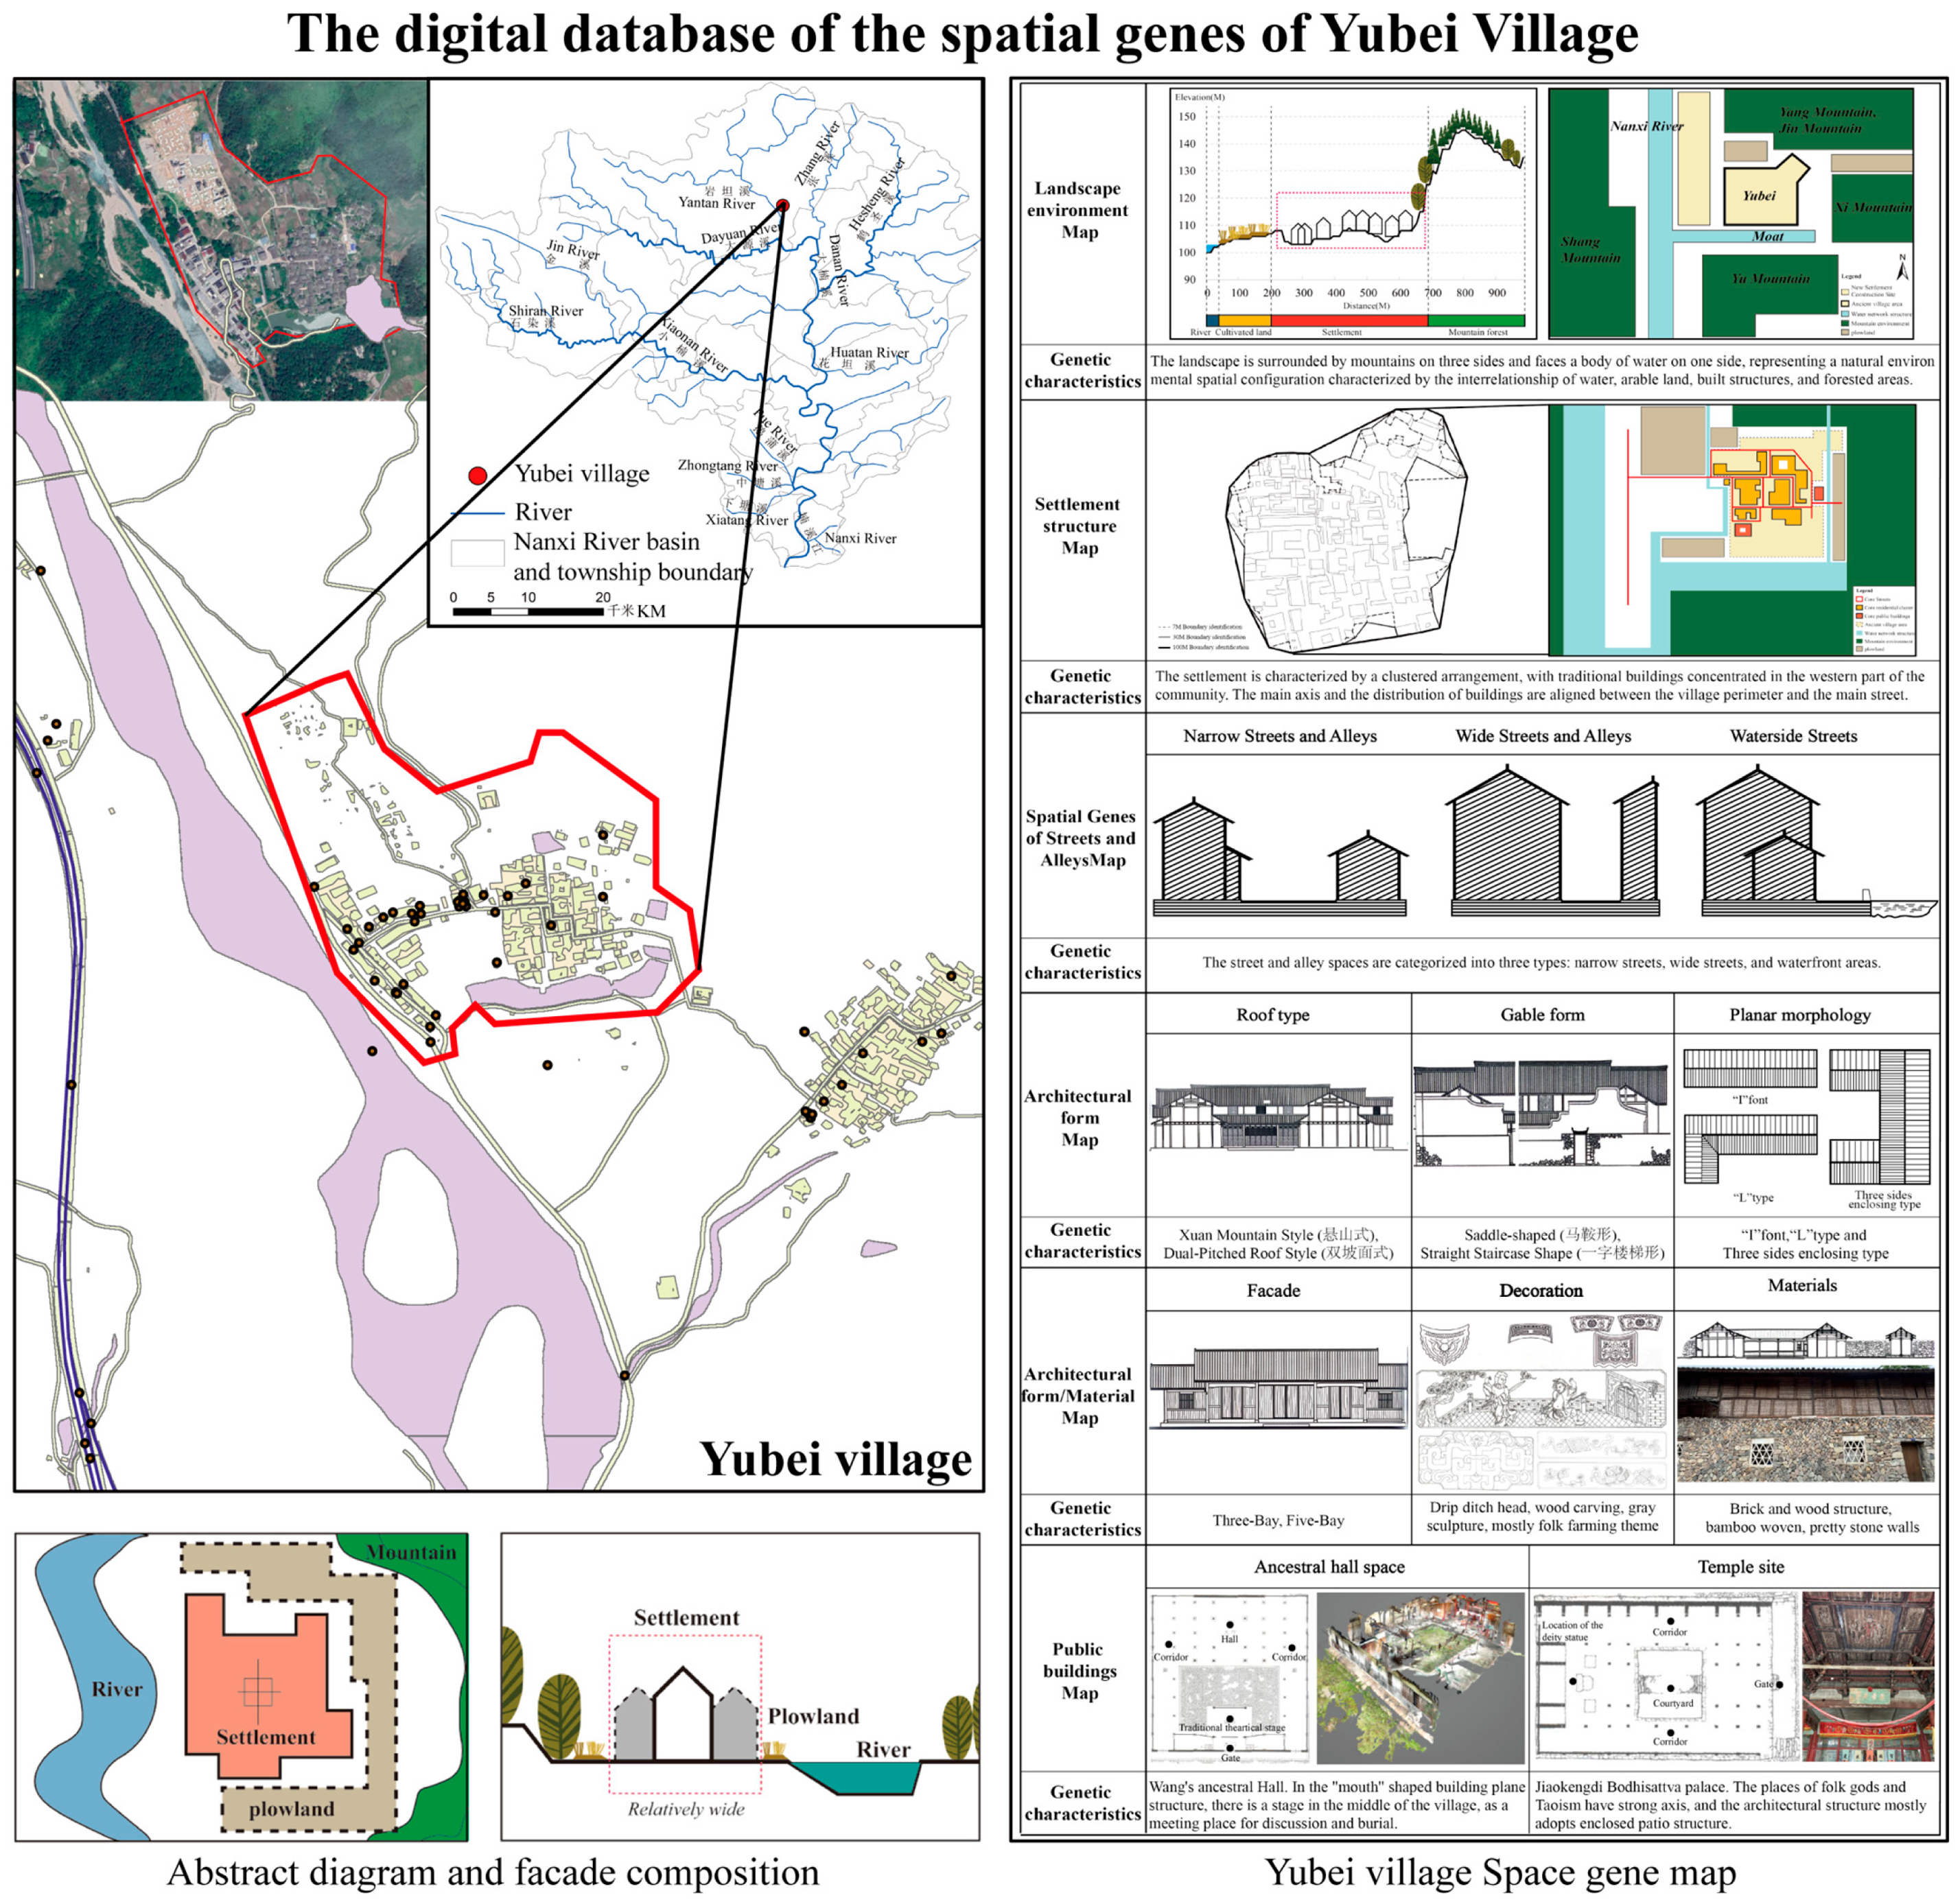
3.1.1. Landform and Water Features (Environment)
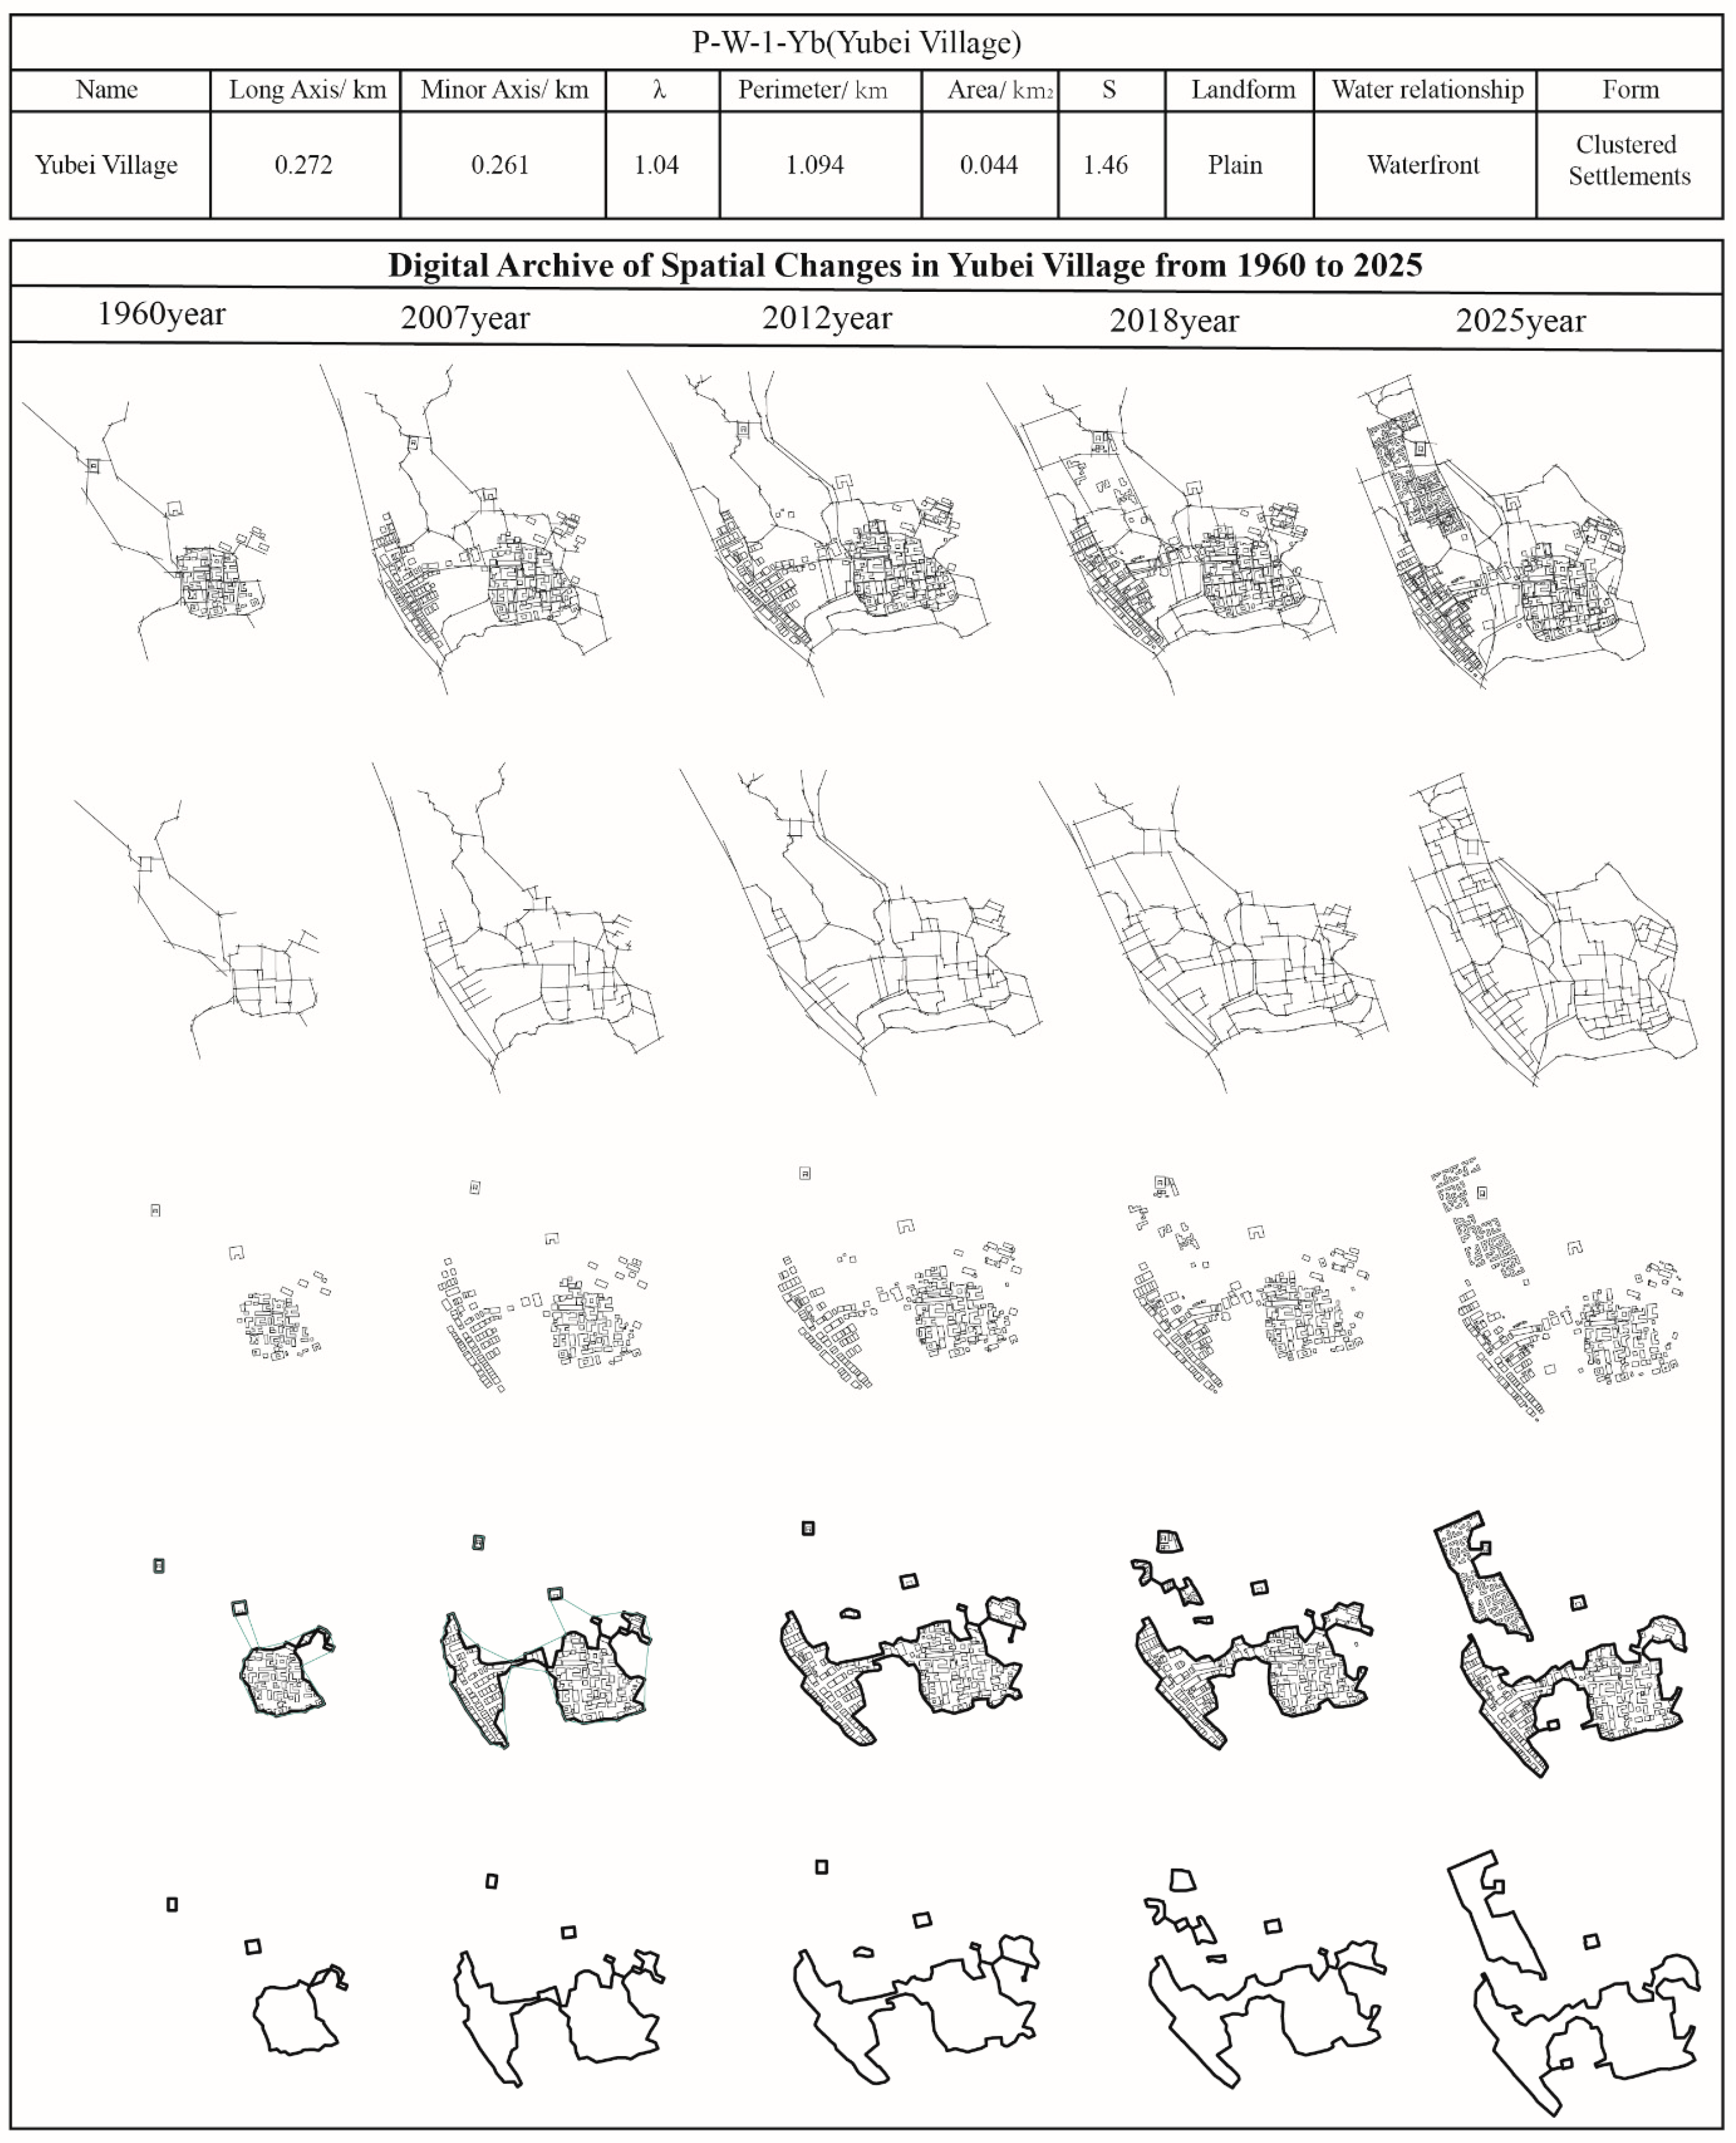
3.1.2. Boundary Morphology
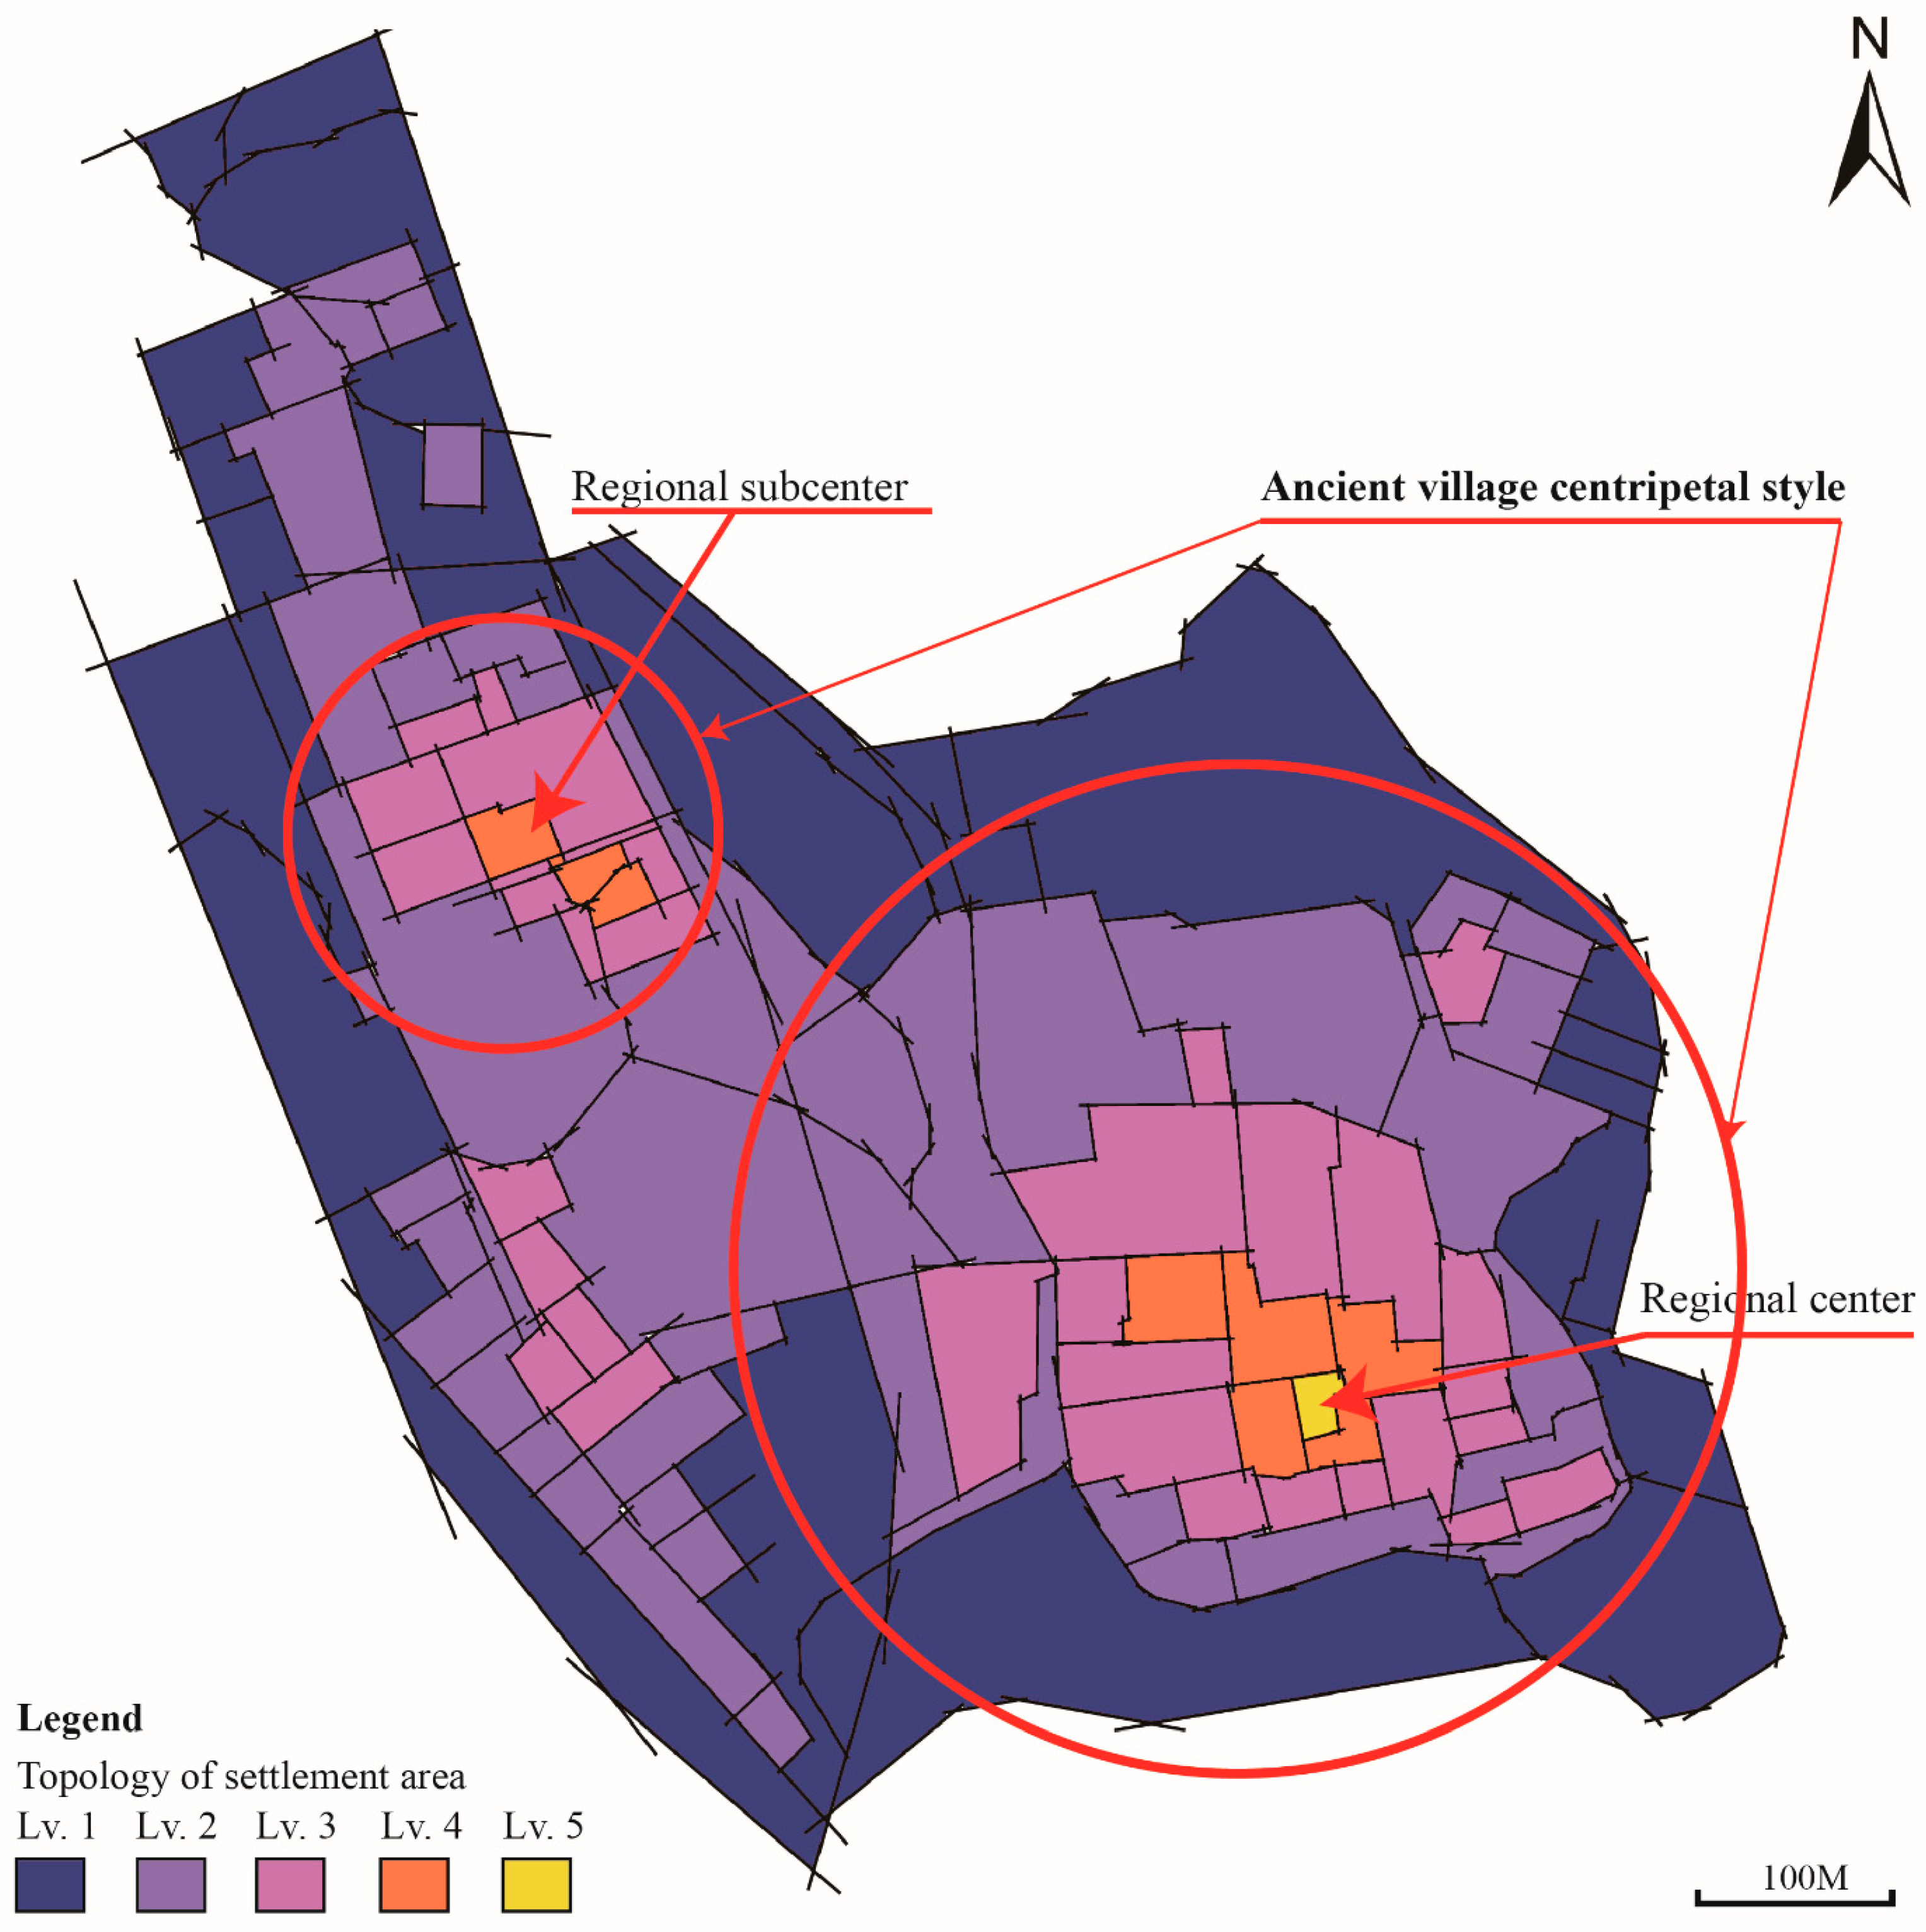
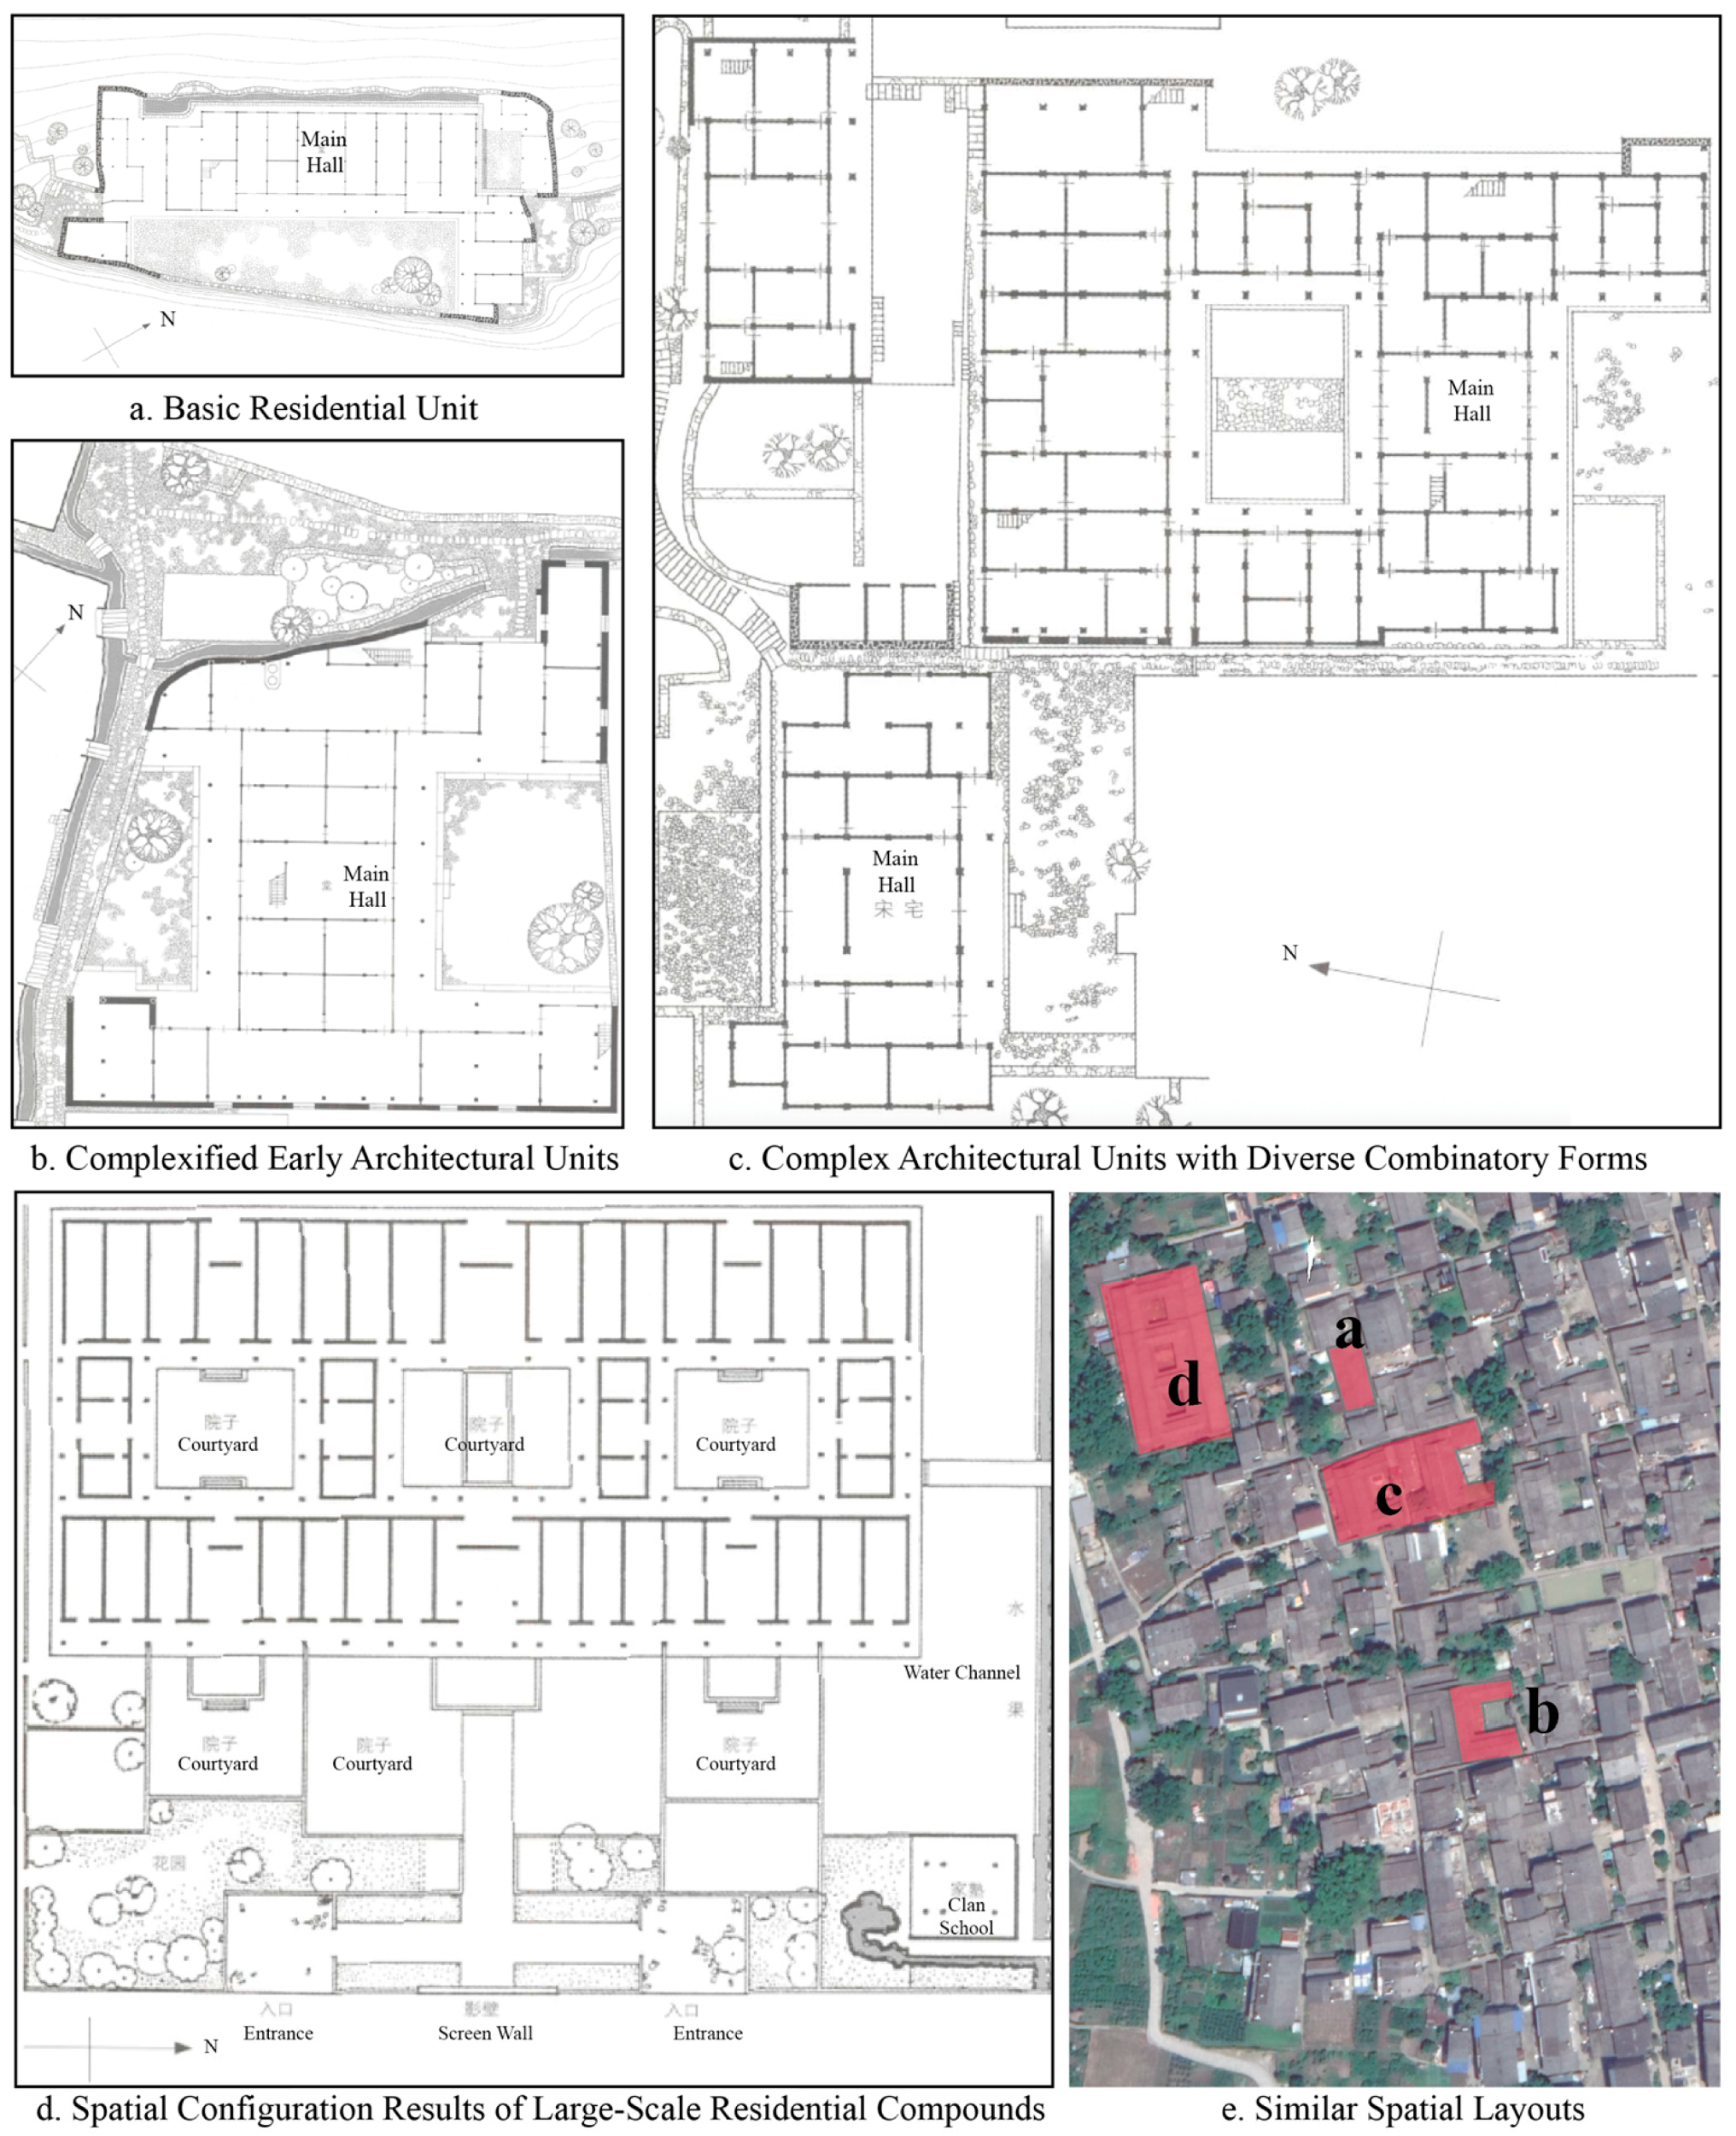
3.1.3. Spatial Structure
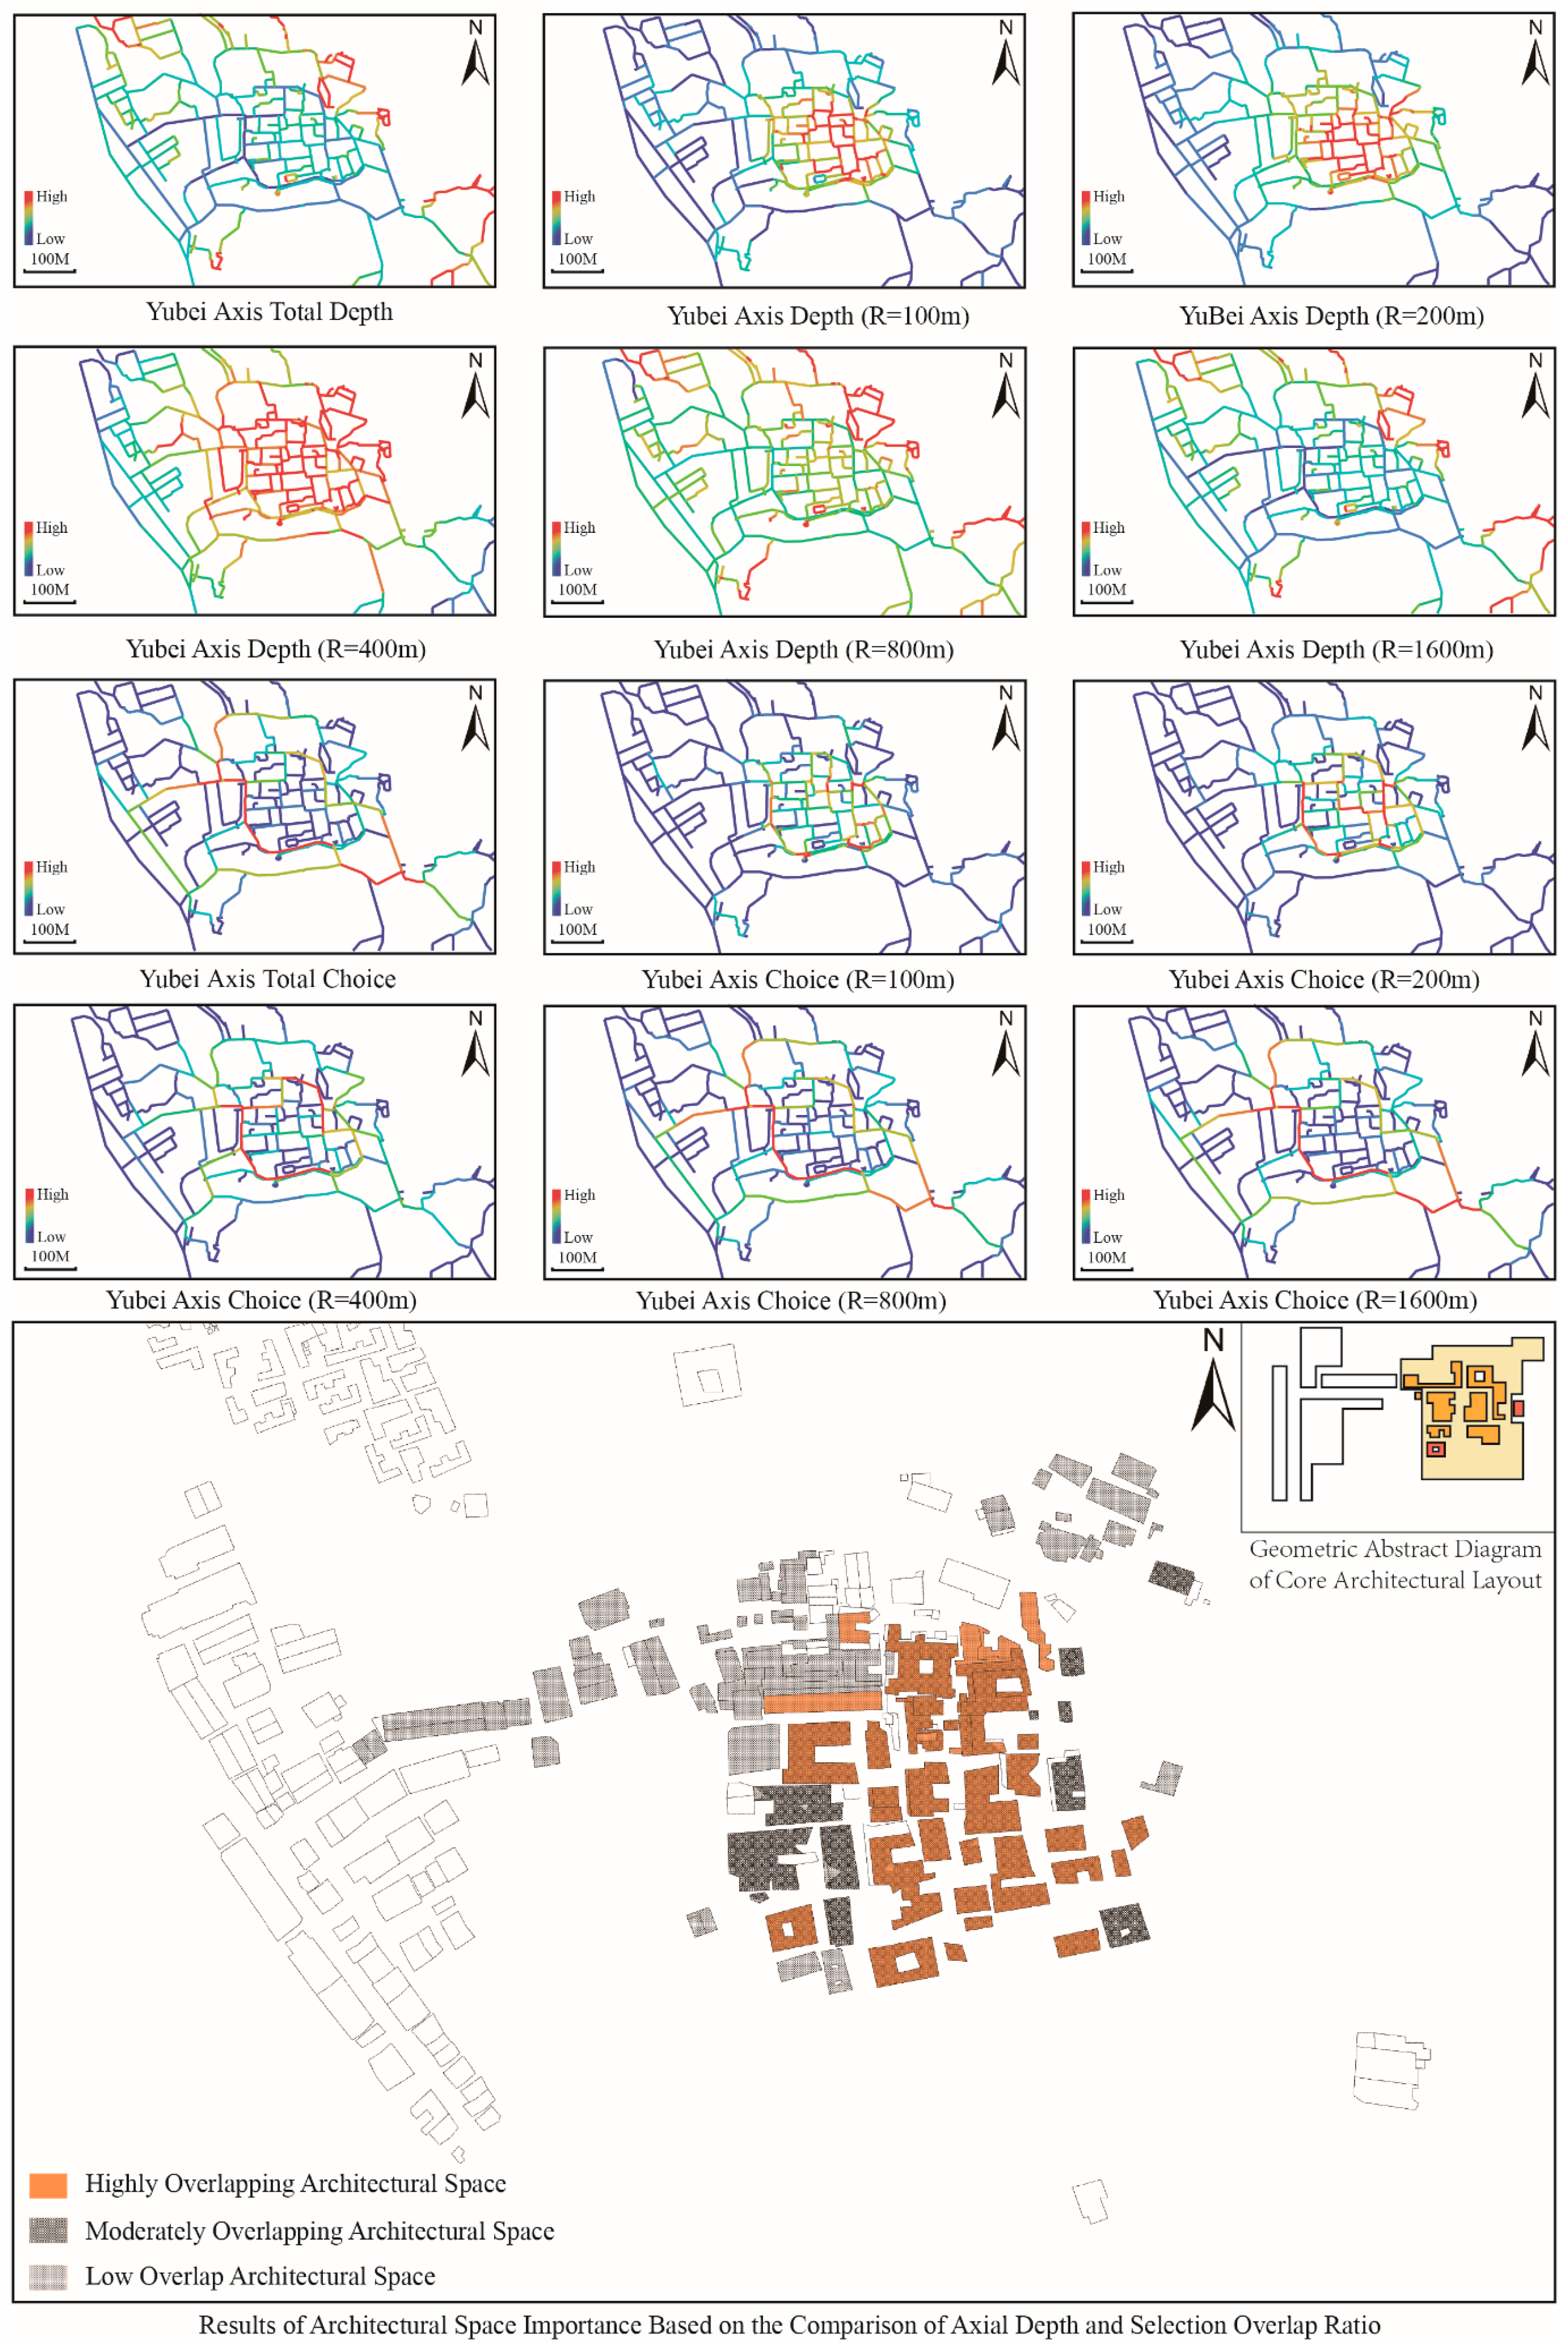
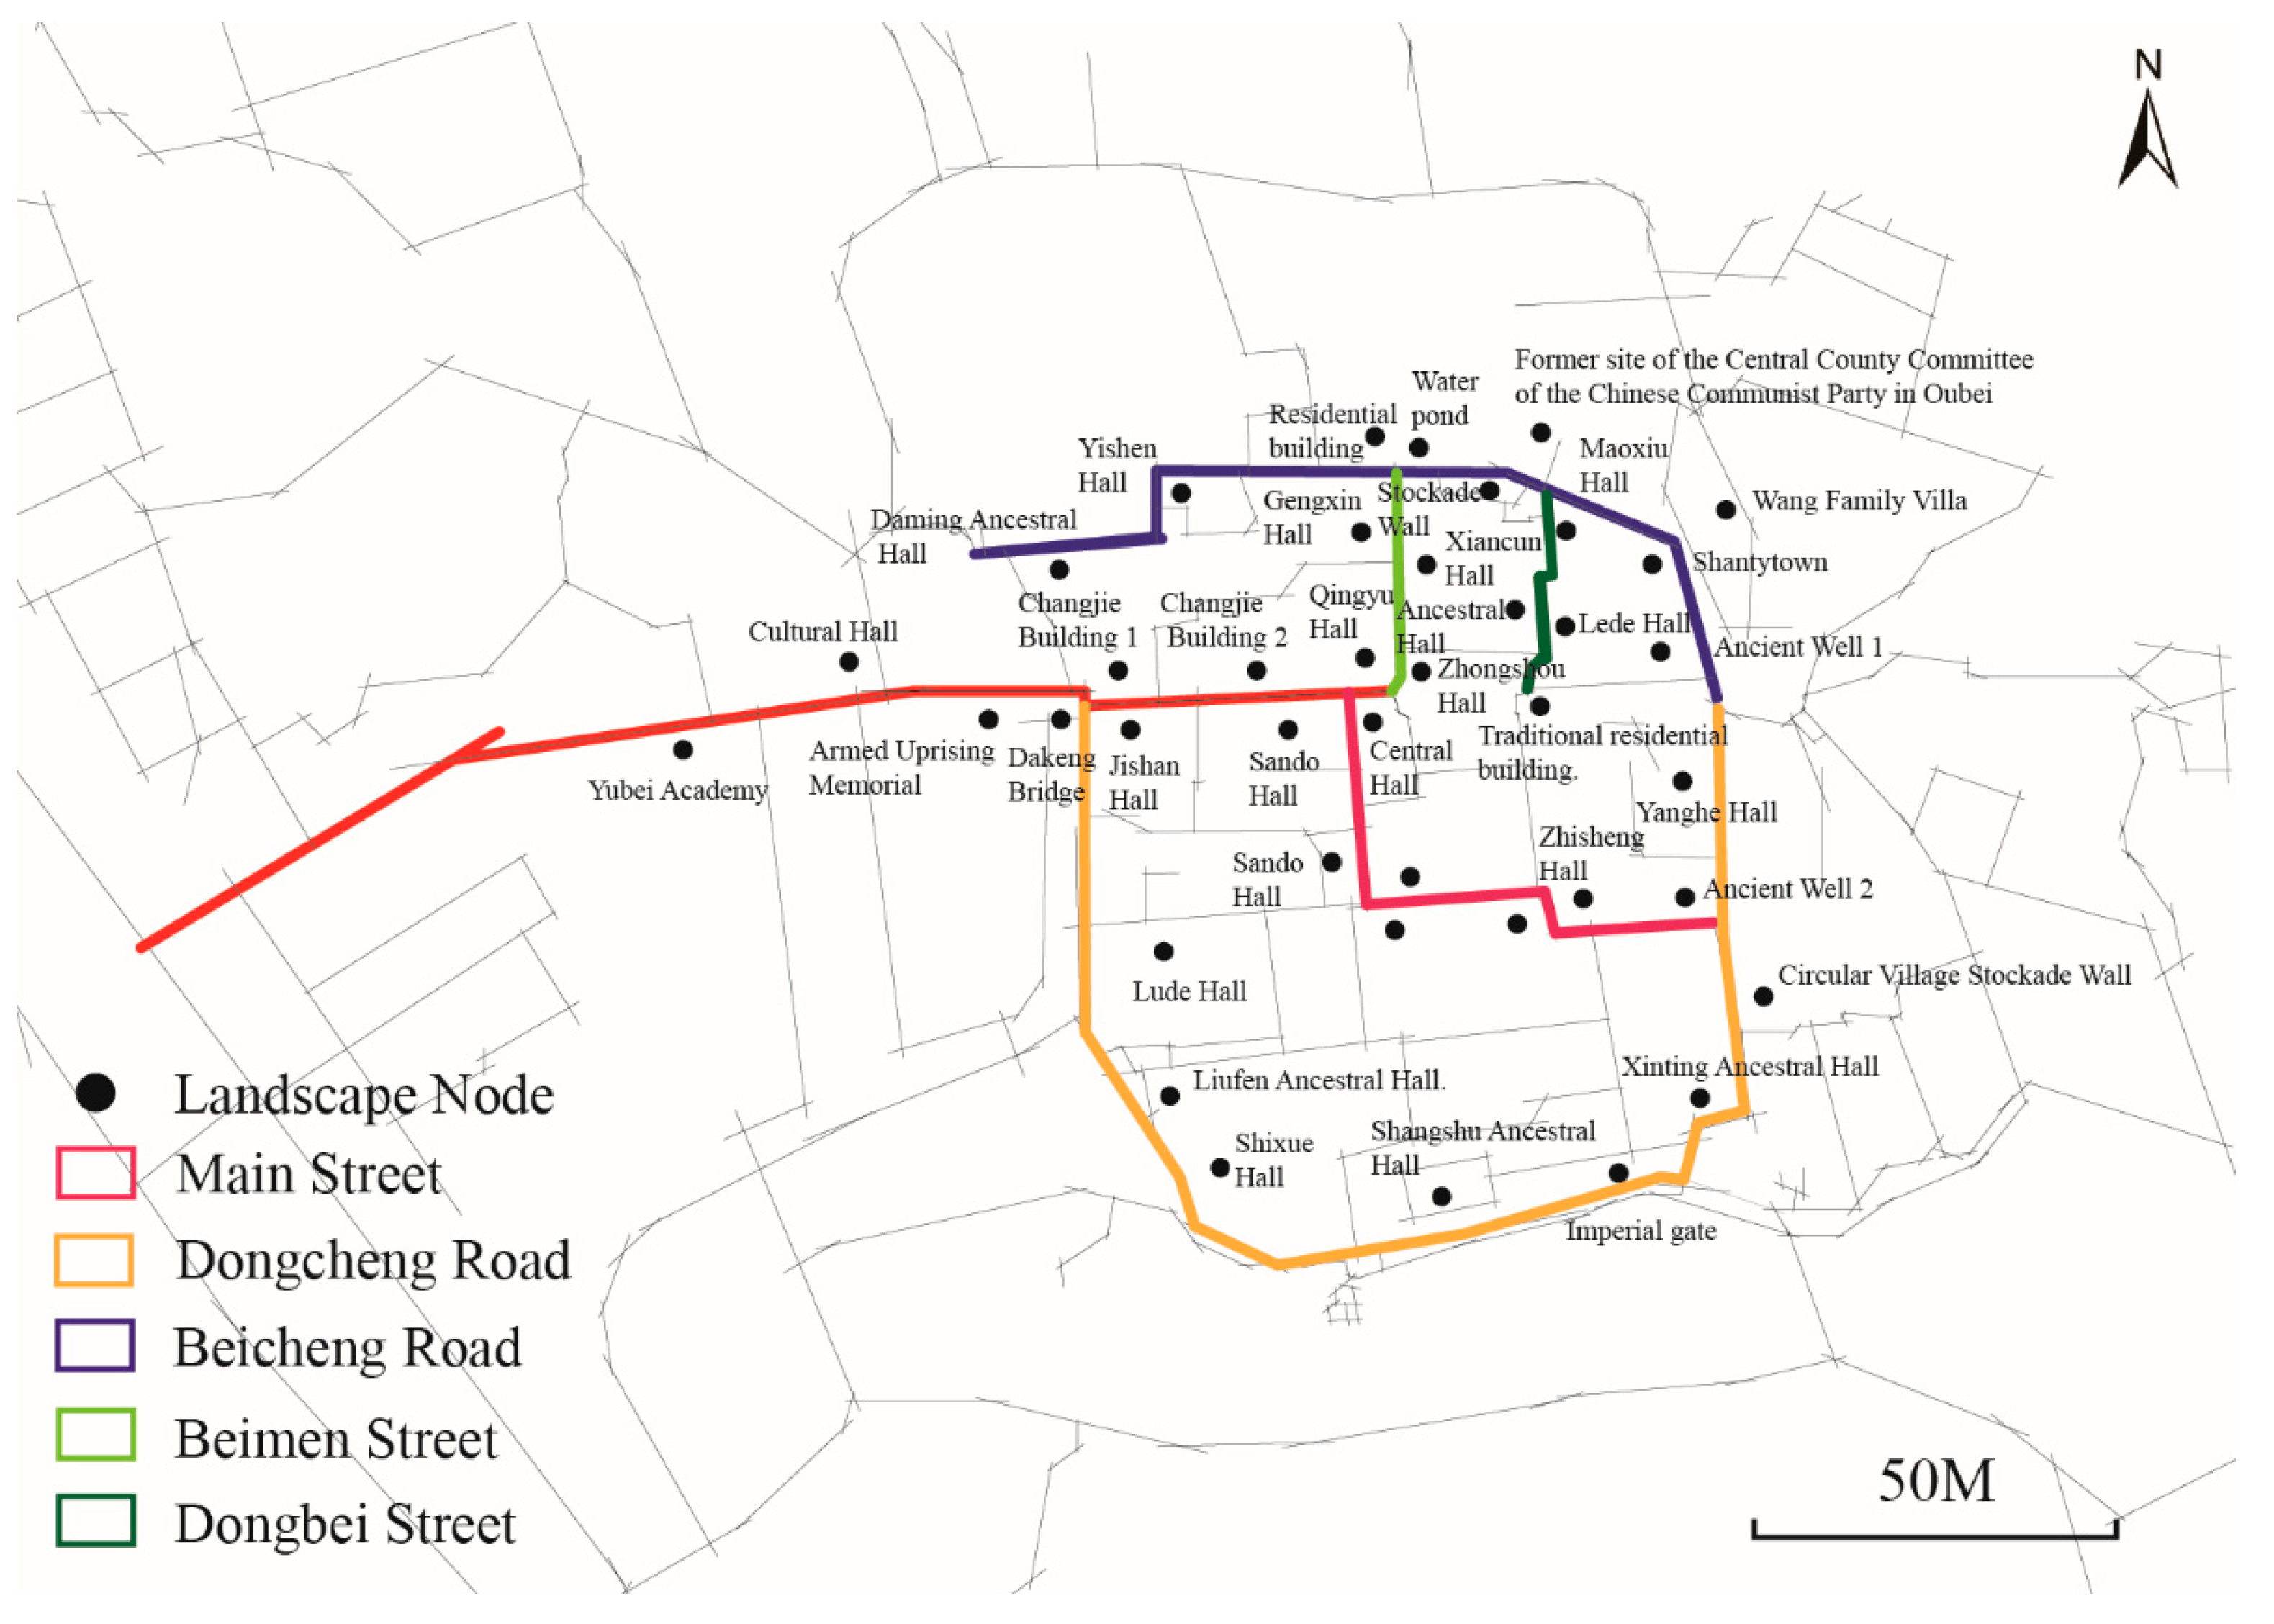
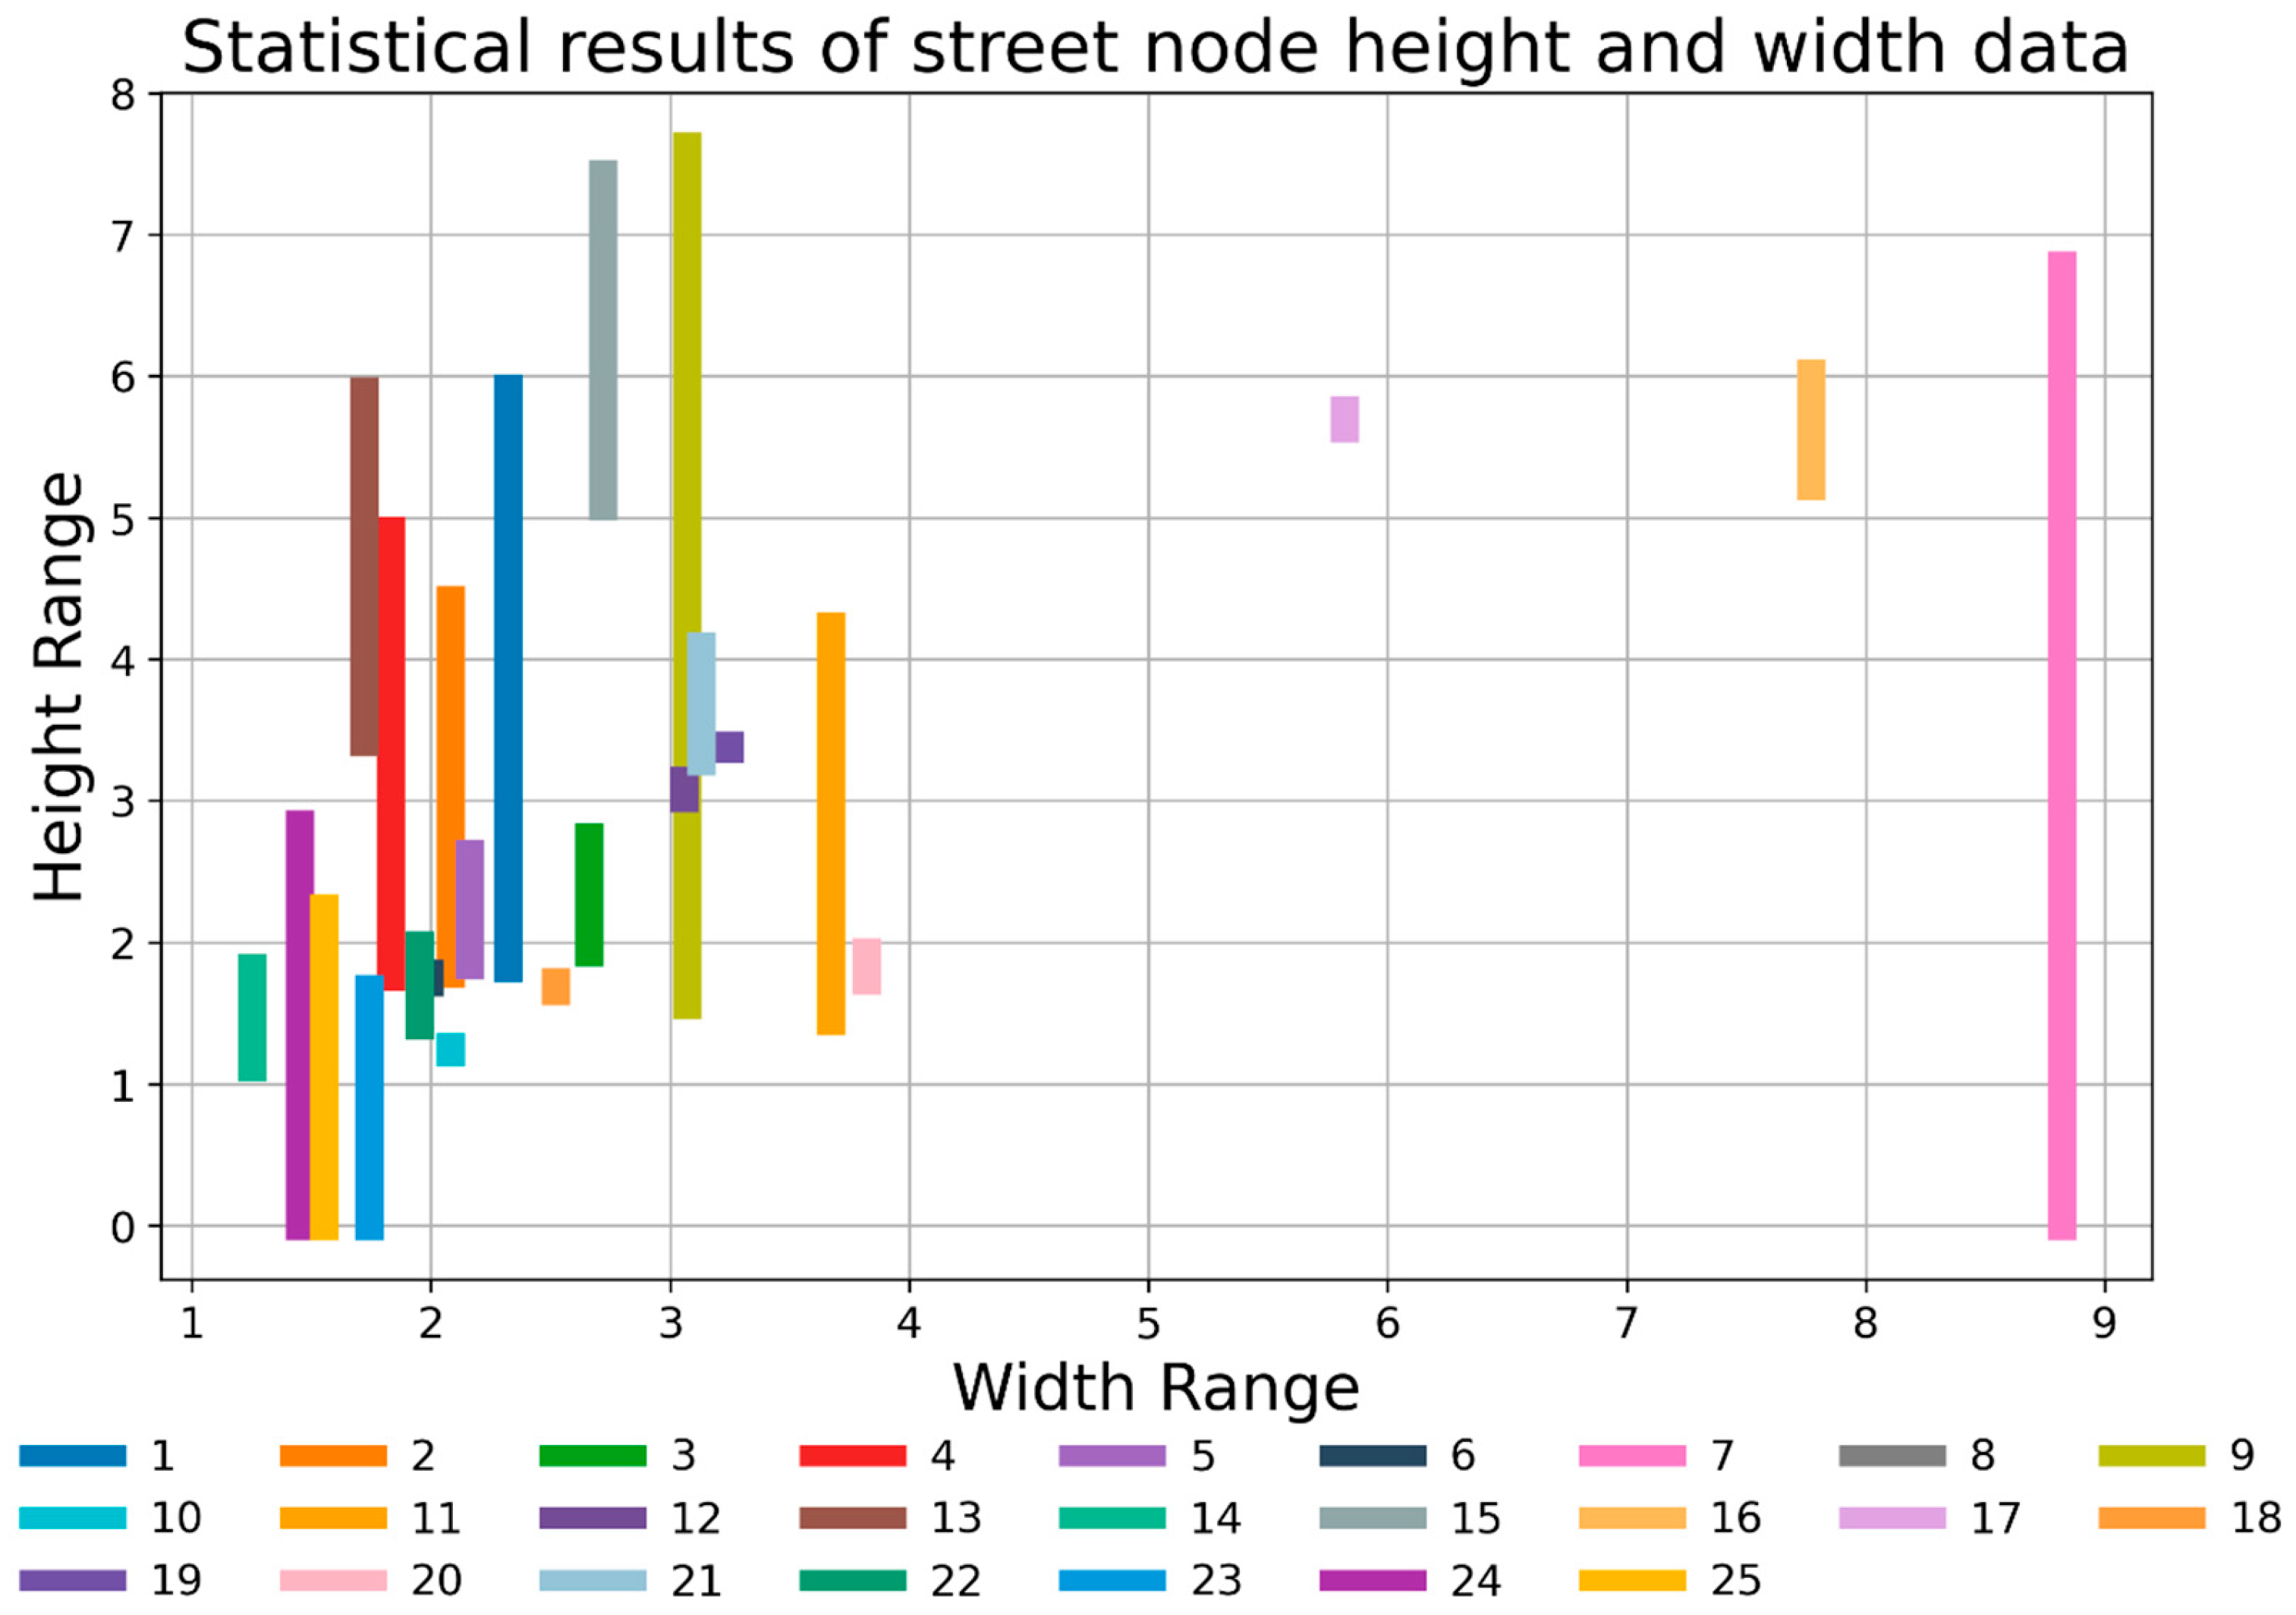
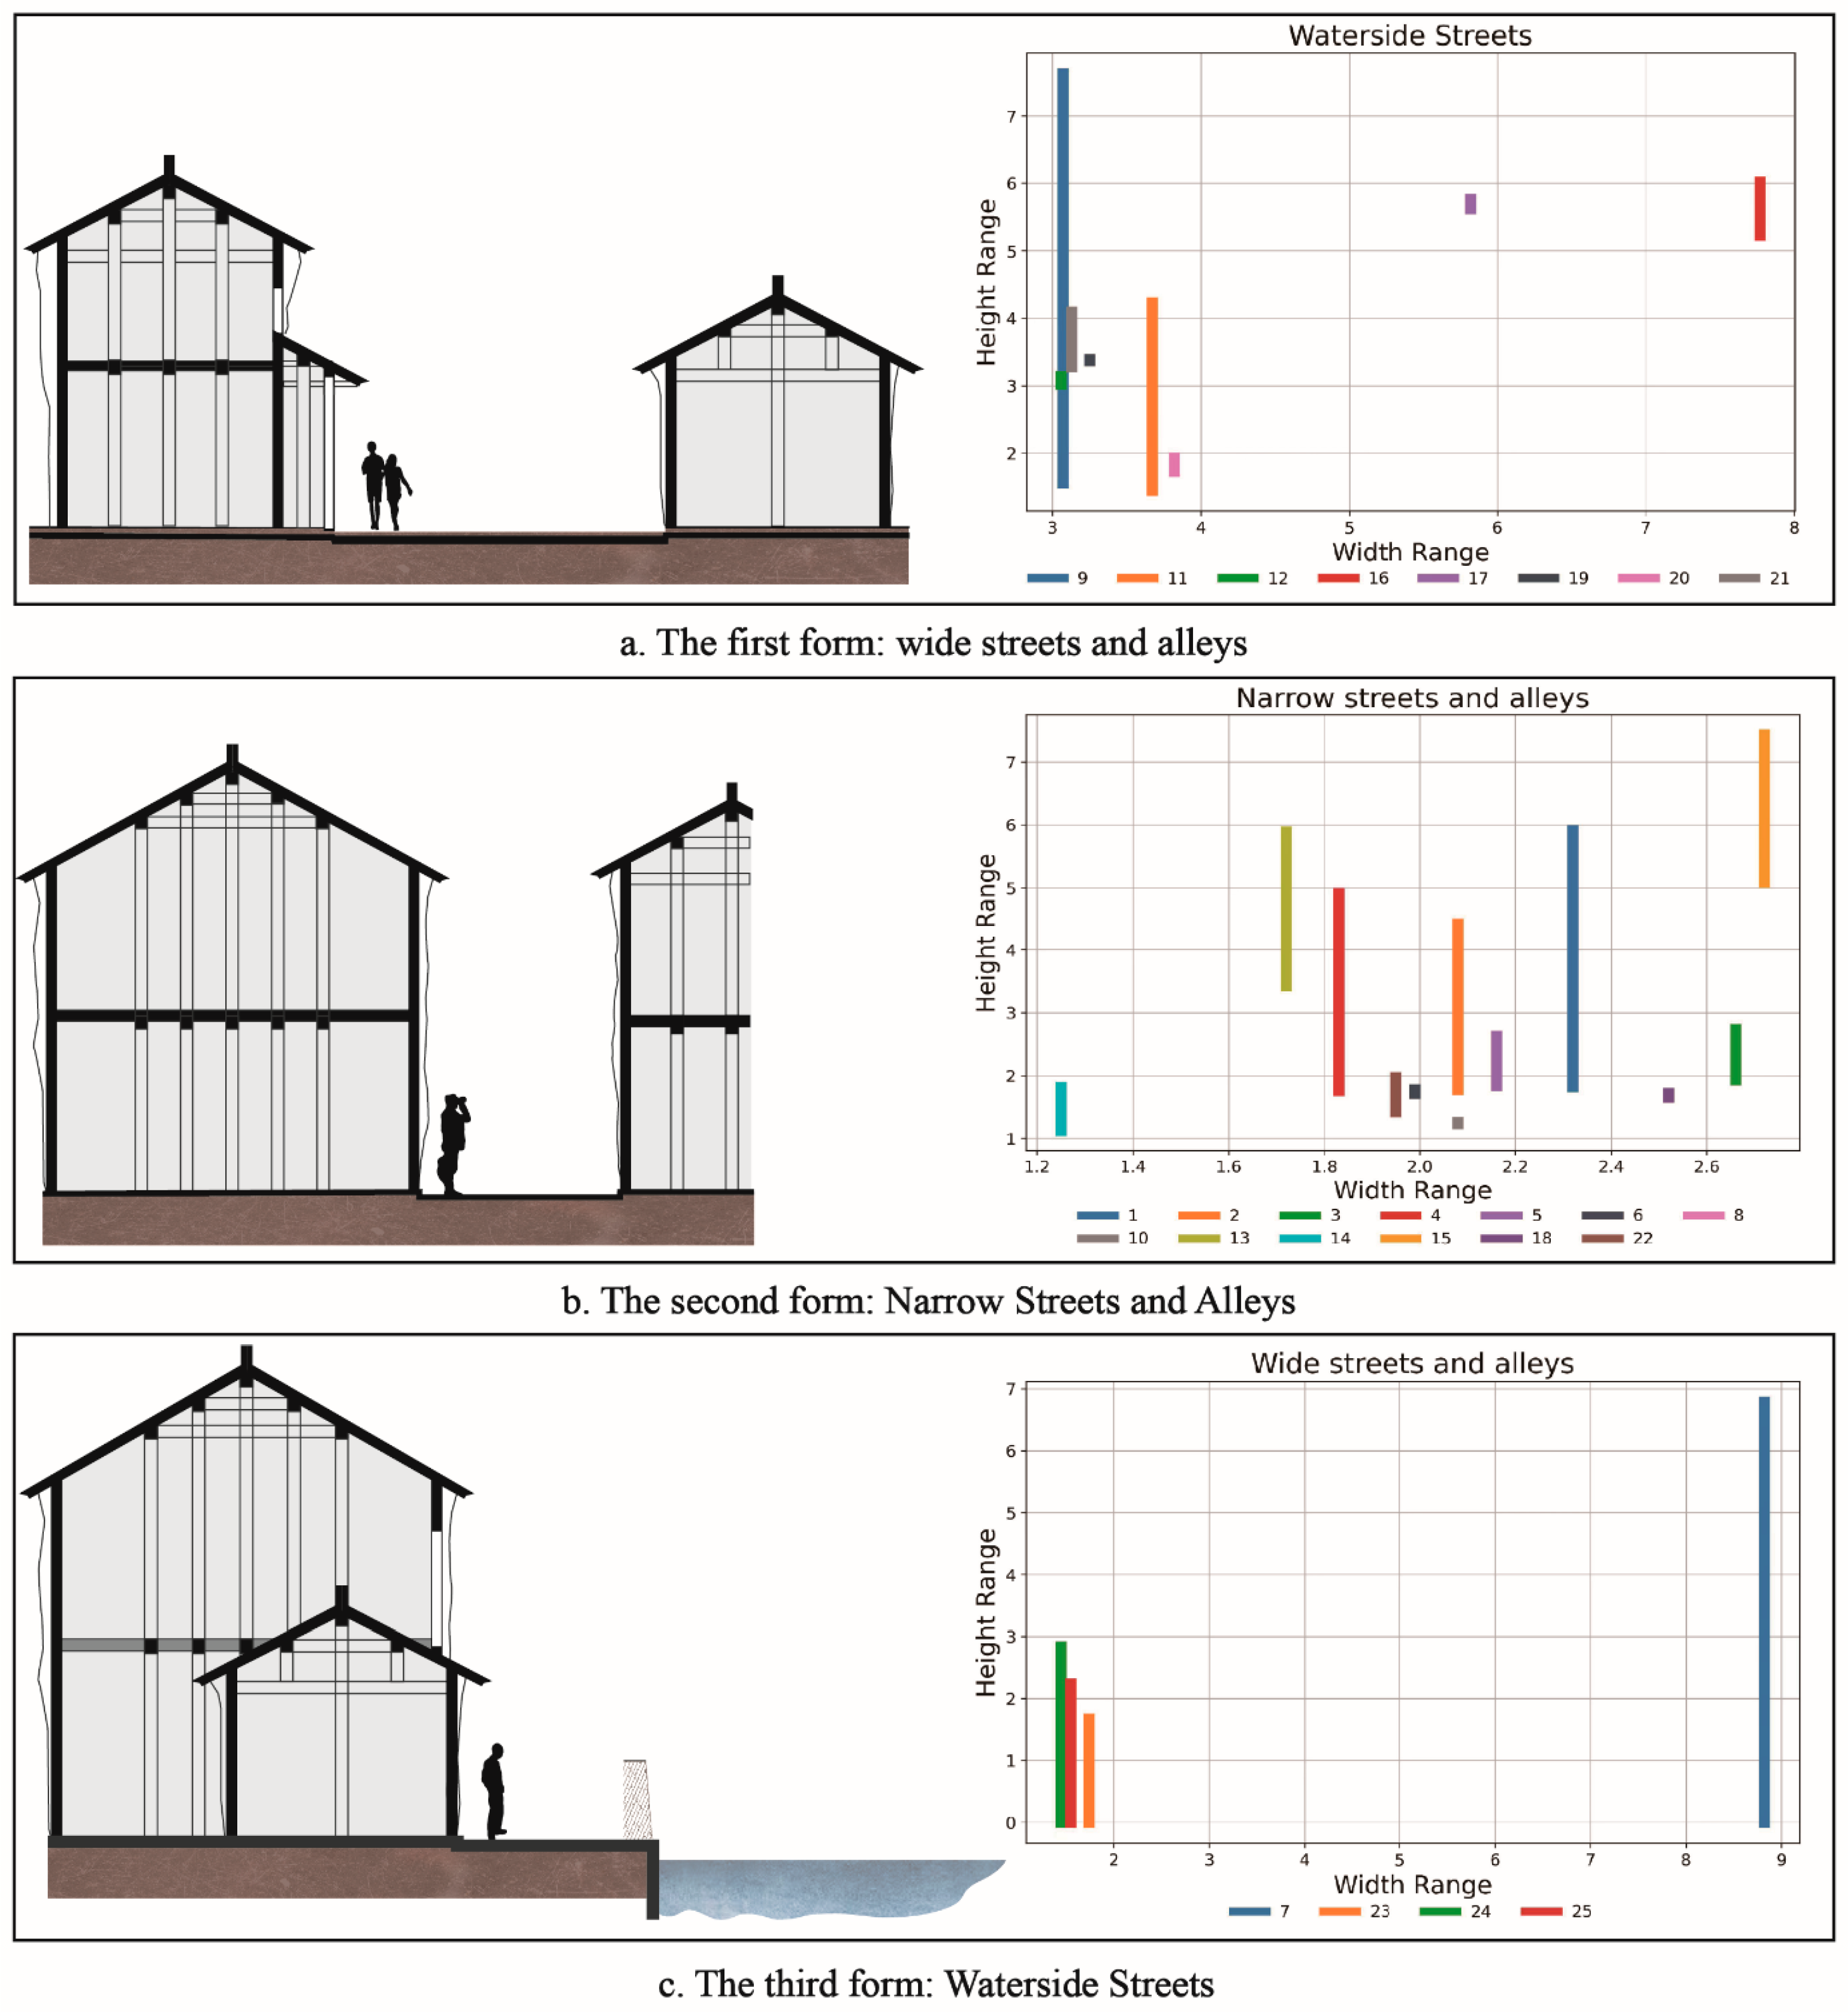
3.1.4. Street and Alley Network
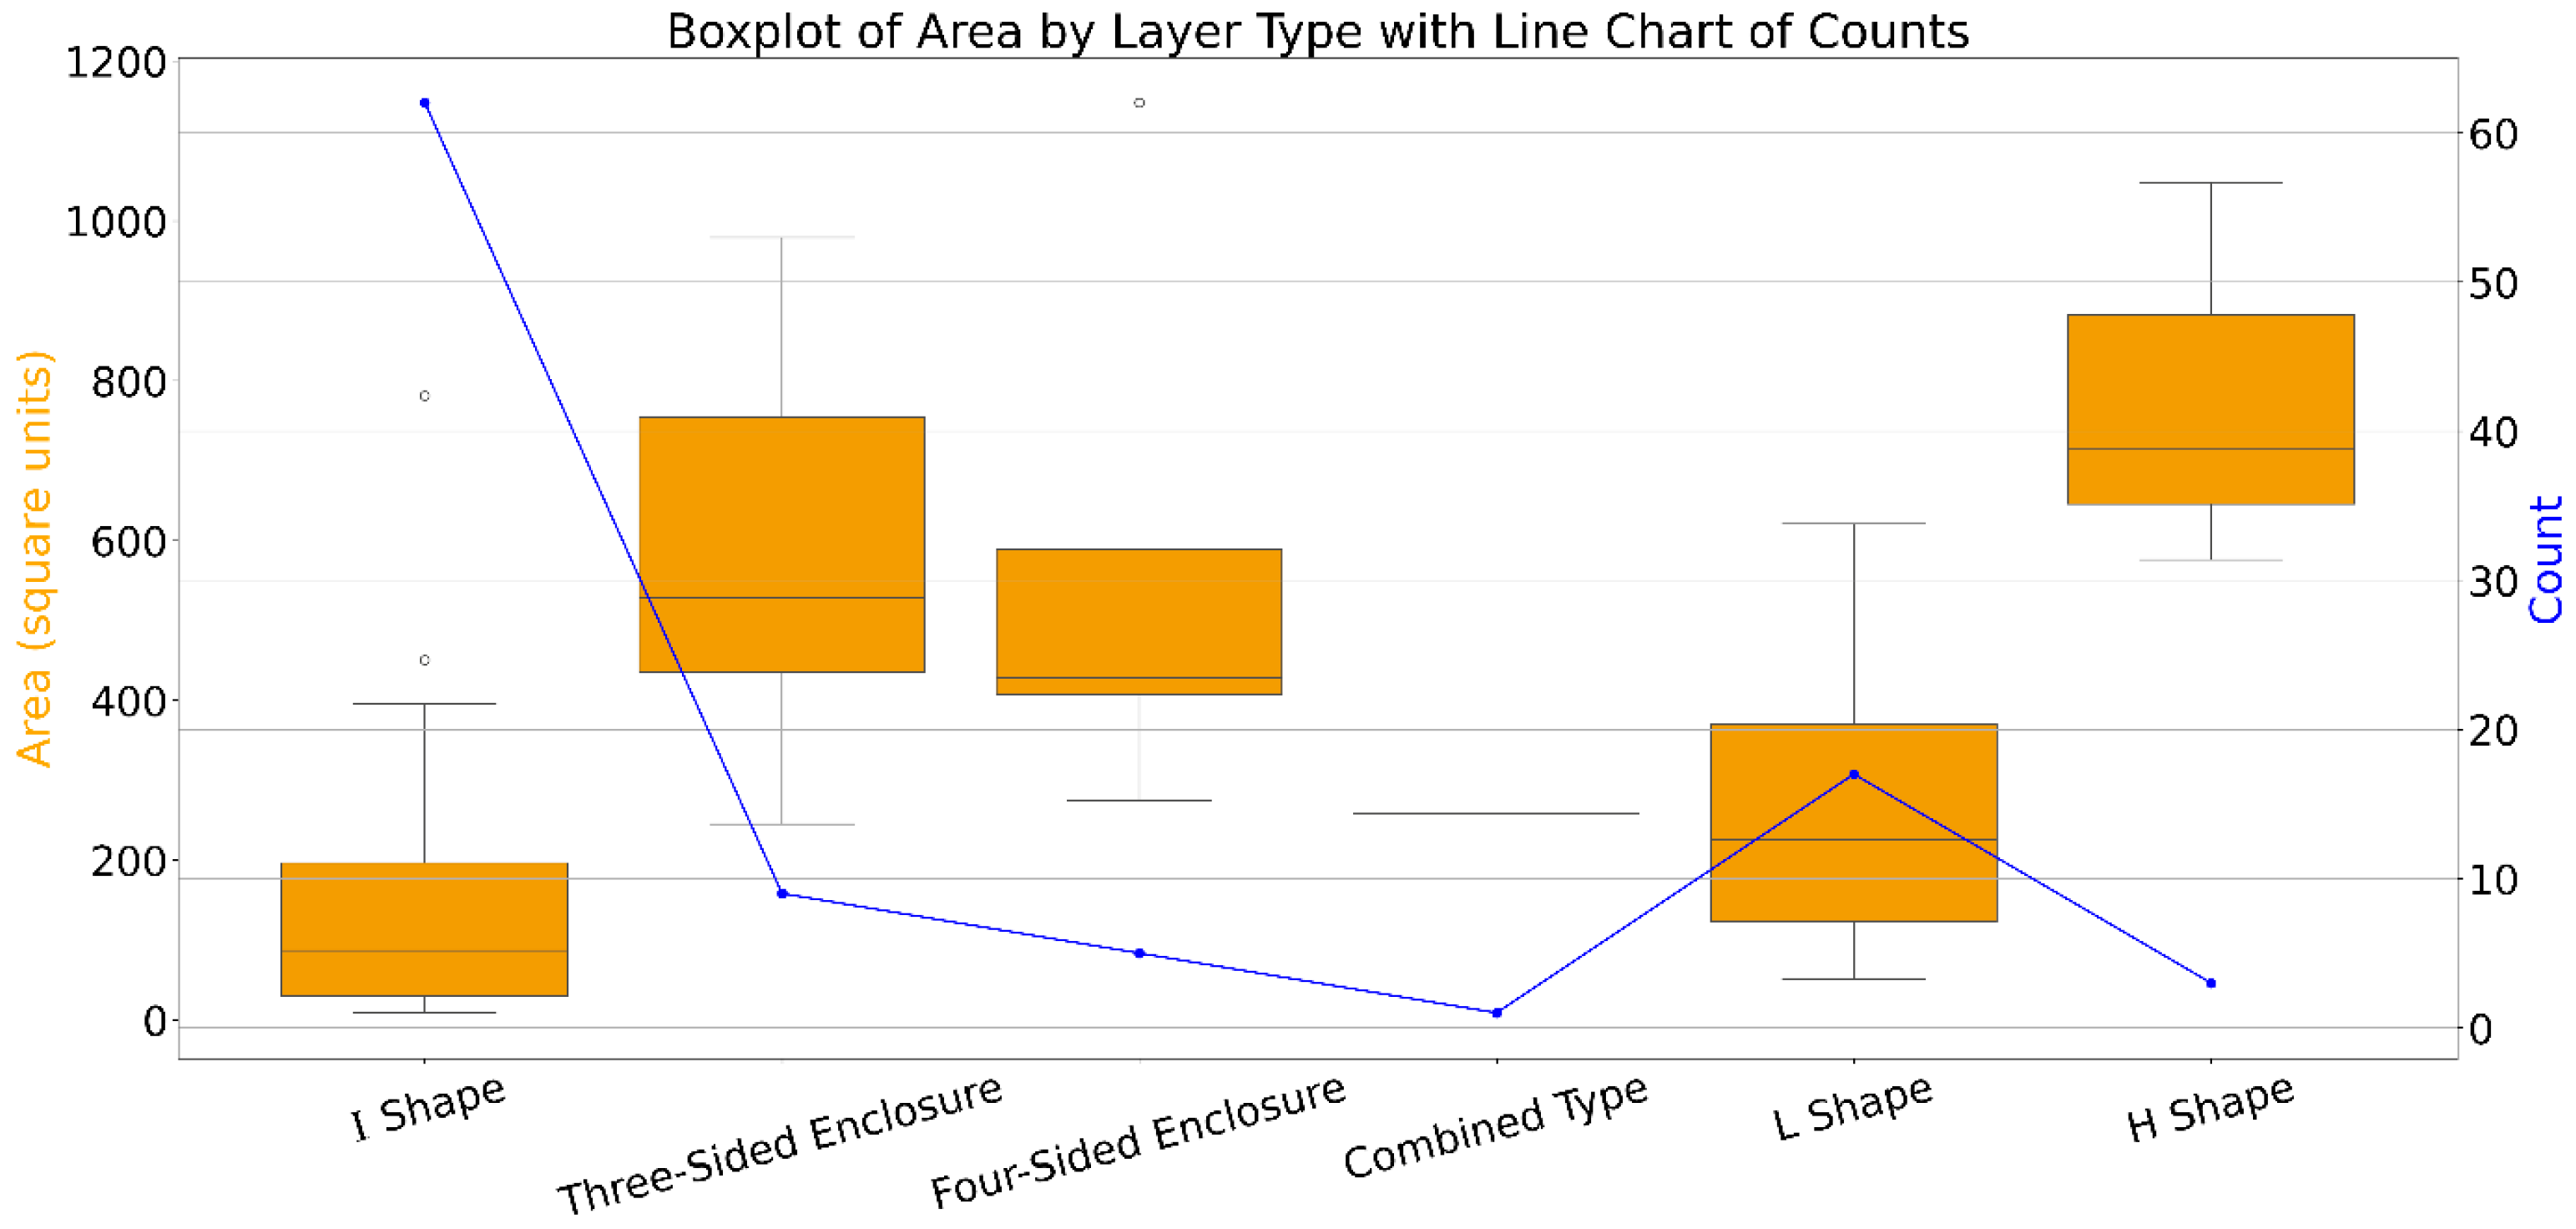
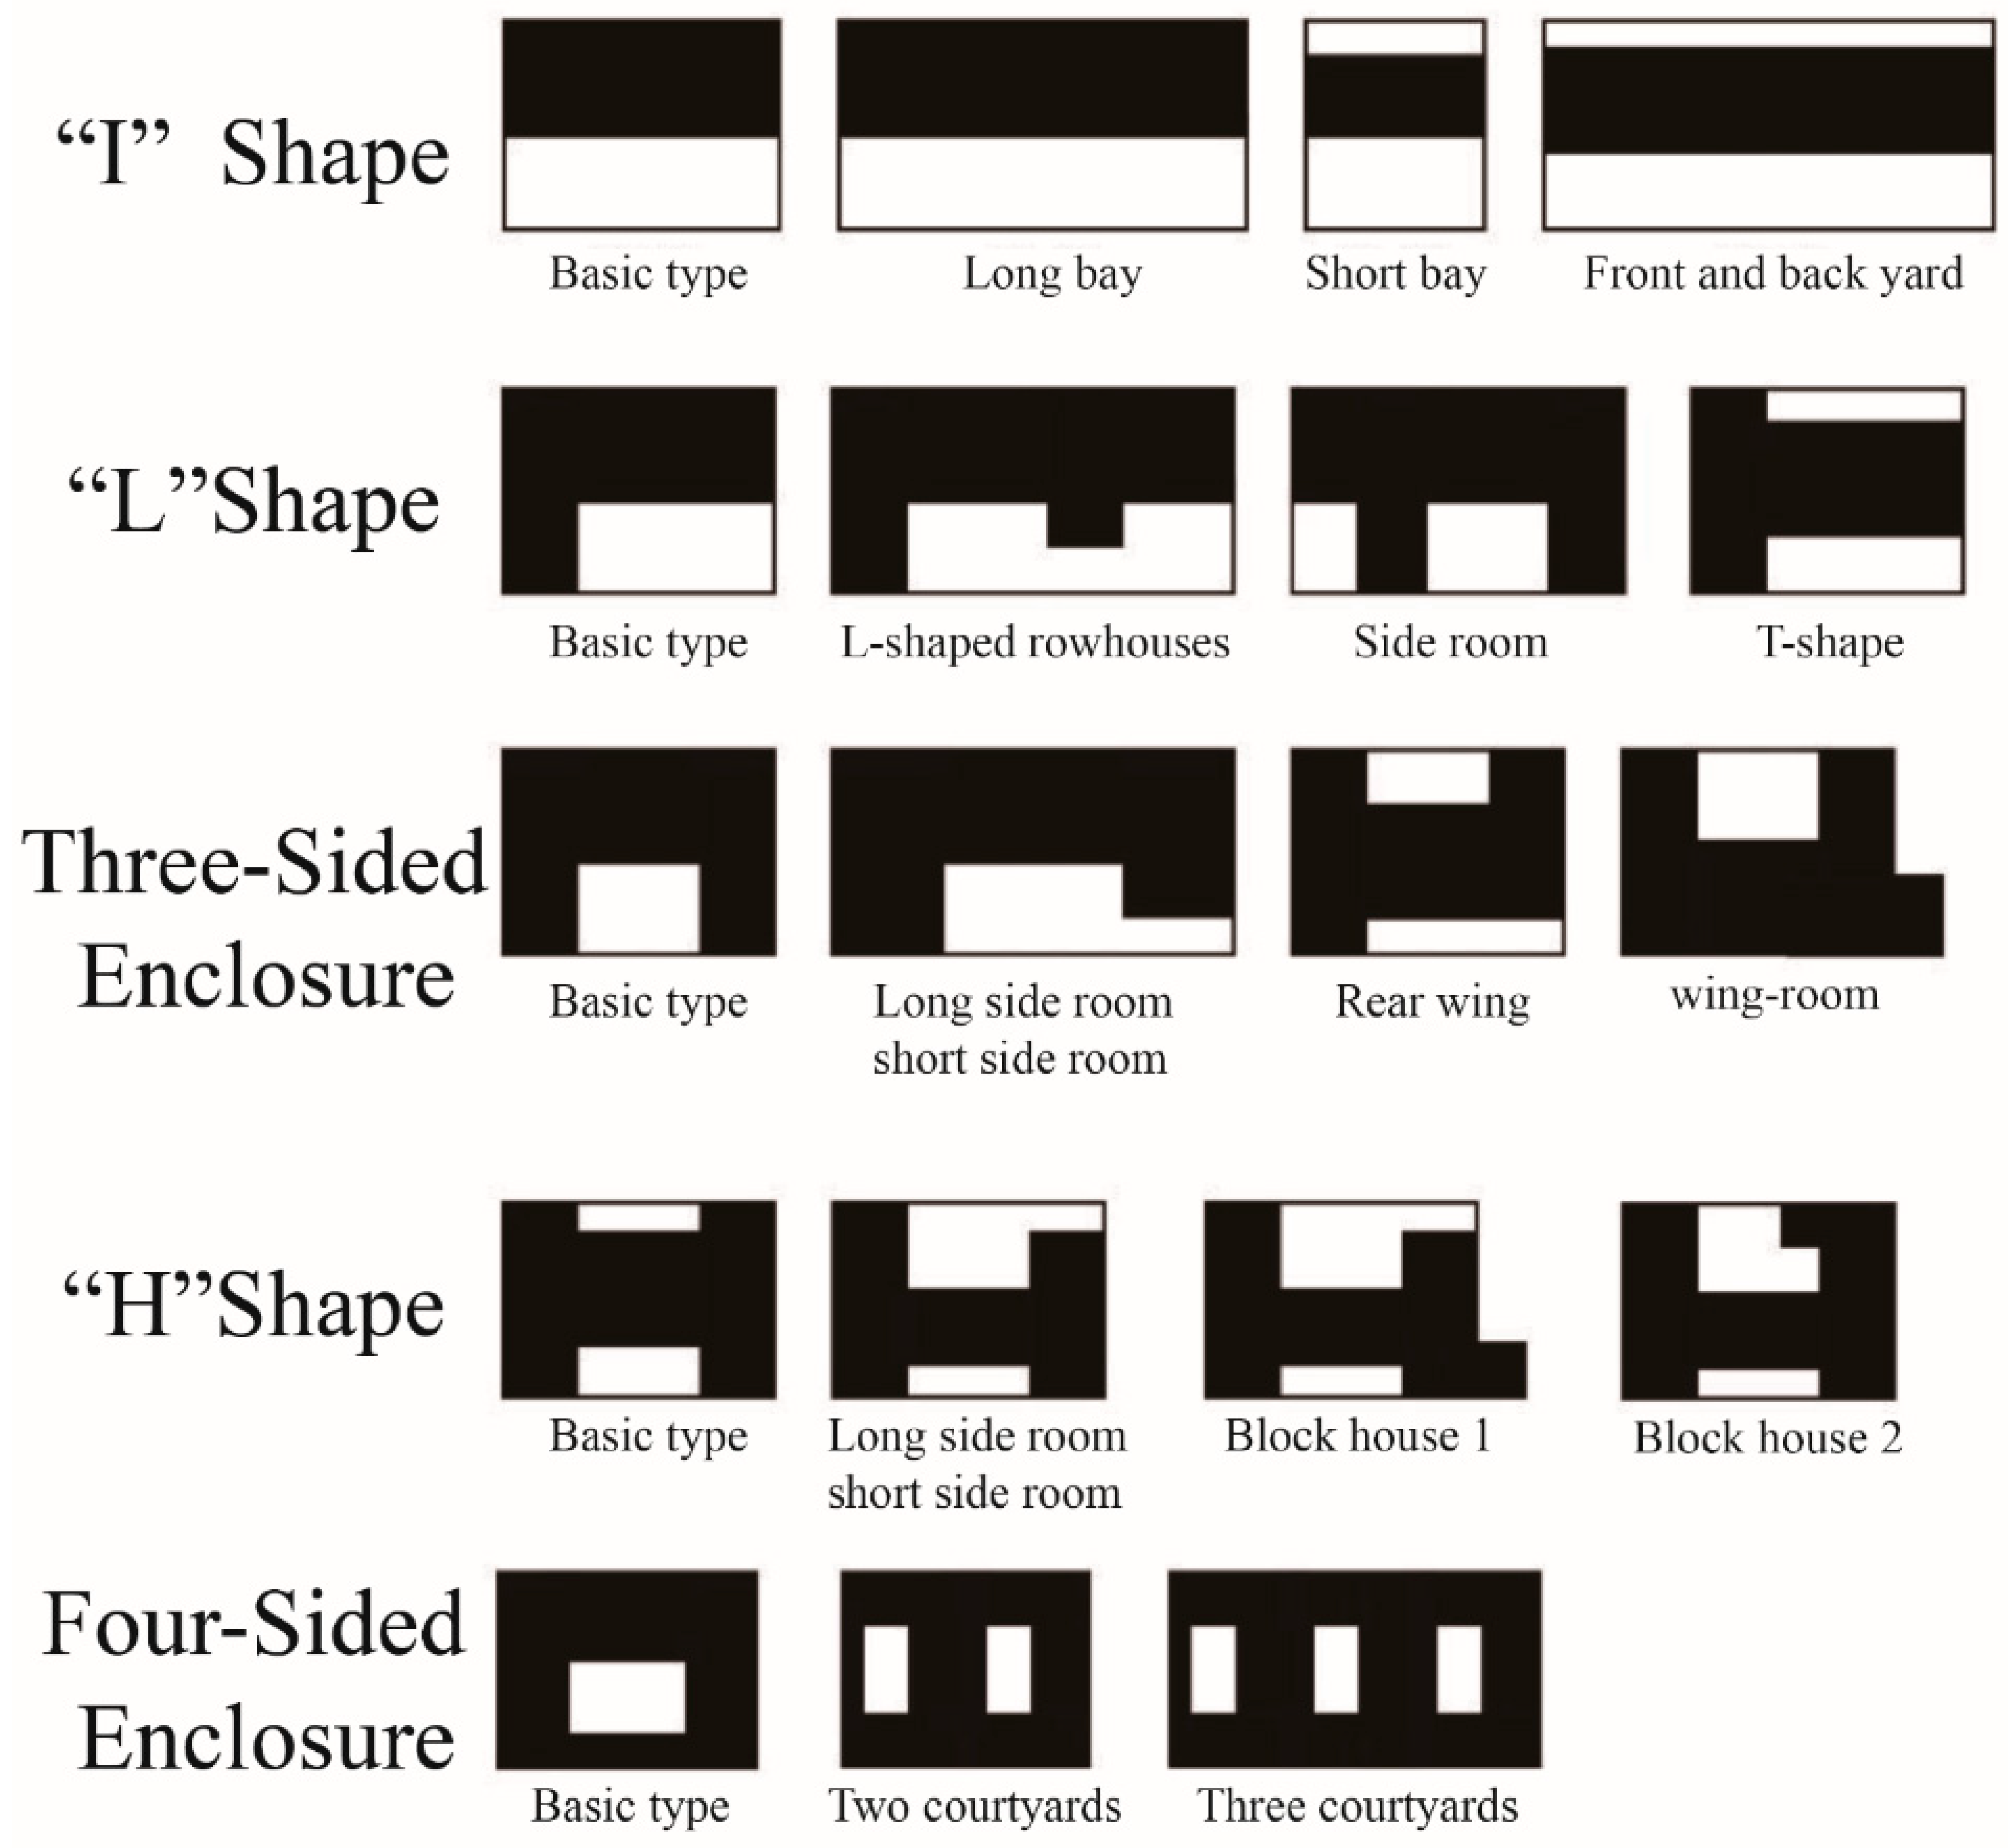
3.1.5. Architectural Style
3.2. Construction of Space Gene Map
3.3. Constructing the Space Gene Digital Database of Traditional Settlements in the Nanxi River Basin
4. Discussion
4.1. Construction of the Spatial Gene Recognition and Extraction Path of the System
4.2. Space Genes Are Identified Only by Visible Material Space
4.3. Enlightenment of Space Gene Inheritance on the Protection of Settlement Style
5. Conclusions
Author Contributions
Funding
Data Availability Statement
Conflicts of Interest
Appendix A. Street Aspect Ratio Data and Elements

| No. | Building Height (Largest Side) | Building Height (Smallest Side) | Street Width | Whether There Is a Stream | The Width of the River Next to the Settlement |
|---|---|---|---|---|---|
| 1 | 5.91 | 1.82 | 2.32 | √ | 3.22 |
| 2 | 4.42 | 1.78 | 2.08 | √ | 3.15 |
| 3 | 2.74 | 1.93 | 2.66 | √ | 3.04 |
| 4 | 4.91 | 1.76 | 1.83 | √ | 2.98 |
| 5 | 2.63 | 1.84 | 2.16 | √ | 3.02 |
| 6 | 1.78 | 1.72 | 1.99 | √ | 2.76 |
| 7 | 6.78 | / | 8.82 | √ | 55.32 |
| 8 | 2.73 | 2.73 | 2.22 | × | / |
| 9 | 7.62. | 1.56 | 3.07 | × | / |
| 10 | 1.23 | 1.26 | 2.08 | × | / |
| 11 | 4.23 | 1.45 | 3.67 | × | / |
| 12 | 3.14 | 3.02 | 3.06 | × | / |
| 13 | 3.42 | 5.89 | 1.72 | × | / |
| 14 | 1.82 | 1.12 | 1.25 | × | / |
| 15 | 7.43 | 5.08 | 2.72 | × | / |
| 16 | 6.02 | 5.23 | 7.77 | × | / |
| 17 | 5.76 | 5.63 | 5.82 | × | / |
| 18 | 1.72 | 1.66 | 2.52 | × | / |
| 19 | 3.37 | 3.39 | 3.25 | × | / |
| 20 | 1.73 | 1.93 | 3.82 | × | / |
| 21 | 4.09 | 3.28 | 3.13 | × | / |
| 22 | 1.98 | 1.42 | 1.95 | × | / |
| 23 | 1.67 | / | 1.74 | √ | 2.33 |
| 24 | 2.83 | / | 1.45 | √ | 0.93 |
| 25 | 2.24 | / | 1.55 | √ | 2.14 |
Appendix B. Statistical Results of the Plan Forms of 86 Buildings in Yubei Village (Excerpt)
| ID | Layer 1 | Area/m2 |
|---|---|---|
| 1 | “I” shape | 396.1431 |
| 2 | Three-sided enclosure | 527.3132 |
| 3 | “I” shape | 337.3313 |
| 4 | Four-sided enclosure | 406.9949 |
| 5 | “I” shape | 201.3015 |
| 6 | Combined type | 258.0958 |
| 7 | Four-sided enclosure | 589.0733 |
| 8 | “I” shape | 232.1382 |
| 9 | “I” shape | 62.20383 |
| 10 | “I” shape | 54.6531 |
| 11 | Four-sided enclosure | 427.7449 |
| 12 | Three-sided enclosure | 244.9682 |
| 13 | L shape | 114.2204 |
| 14 | “I” shape | 90.99632 |
| 15 | “I” shape | 140.075 |
| 16 | “I” shape | 166.2387 |
| 17 | “I” shape | 170.9214 |
| 18 | “I” shape | 122.9714 |
| 19 | “I” shape | 219.5147 |
| 20 | L shape | 217.6934 |
| 21 | “I” shape | 96.74481 |
| 22 | “I” shape | 264.4198 |
| 23 | “I” shape | 120.9382 |
| 24 | L shape | 251.7767 |
| 25 | “I” shape | 21.34879 |
| 26 | H shape | 715.3608 |
| 27 | “I” shape | 30.42728 |
| 28 | L shape | 158.7402 |
| 29 | H shape | 575.8063 |
| 30 | Three-sided enclosure | 435.6568 |
| 31 | “I” shape | 154.8306 |
| 32 | “I” shape | 38.46668 |
| 33 | “I” shape | 15.3639 |
| 34 | “I” shape | 11.96263 |
| 35 | “I” shape | 38.40099 |
| 36 | L shape | 370.0255 |
| 37 | L shape | 169.431 |
| 38 | “I” shape | 781.101 |
| 39 | Three-sided enclosure | 978.6574 |
| 40 | “I” shape | 297.5355 |
| 41 | L shape | 224.7816 |
| 42 | L shape | 432.6237 |
| 43 | “I” shape | 72.84567 |
| 44 | L shape | 231.6481 |
| 45 | “I” shape | 86.8306 |
| 46 | “I” shape | 10.86501 |
| 47 | Three-sided enclosure | 341.4768 |
| 48 | L shape | 122.648 |
| 49 | “I” shape | 87.23013 |
| 50 | “I” shape | 39.2319 |
| 51 | Three-sided enclosure | 506.7036 |
| 52 | L shape | 50.3394 |
| 53 | “I” shape | 47.22619 |
| 54 | “I” shape | 31.26861 |
| 55 | “I” shape | 15.00923 |
| 56 | “I” shape | 28.69611 |
| 57 | “I” shape | 17.07892 |
| 58 | “I” shape | 71.14431 |
| 59 | “I” shape | 17.0617 |
| 60 | L shape | 620.306 |
| 61 | “I” shape | 29.09024 |
| 62 | L shape | 97.28013 |
| 63 | Three-sided enclosure | 754.121 |
| 64 | “I” shape | 74.92229 |
| 65 | H shape | 1048.008 |
| 66 | “I” shape | 92.30636 |
| 67 | “I” shape | 124.8068 |
| 68 | “I” shape | 247.9923 |
| 69 | “I” shape | 73.26572 |
| 70 | Four-sided enclosure | 274.0622 |
| 71 | L shape | 448.2748 |
| 72 | “I” shape | 250.3254 |
| 73 | “I” shape | 42.62873 |
| 74 | “I” shape | 156.403 |
| 75 | “I” shape | 10.27321 |
| 76 | “I” shape | 19.5107 |
| 77 | “I” shape | 246.4357 |
| 78 | “I” shape | 14.53692 |
| 79 | “I” shape | 42.52222 |
| 80 | “I” shape | 8.863731 |
| 81 | “I” shape | 15.87879 |
| 82 | L shape | 105.2498 |
| 83 | “I” shape | 11.85124 |
| 84 | “I” shape | 257.6419 |
| 85 | Three-sided enclosure | 775.7614 |
| 86 | “I” shape | 237.5357 |
References
- Lawrence, D.L.; Low, S.M. The built environment and spatial form. Annu. Rev. Anthropol. 1990, 19, 453–505. [Google Scholar] [CrossRef]
- Crane, T.A. Of Models and Meanings: Cultural Resilience in Social–Ecological. Ecol. Soc. 2010, 15, 19. [Google Scholar] [CrossRef]
- Barbanente, A.; Grassini, L. Fostering transitions in landscape policies: A multi-level perspective. Land Use Policy 2022, 112, 105869. [Google Scholar] [CrossRef]
- Küfeoğlu, S. SDG-11: Sustainable cities and communities. In Emerging Technologies: Value Creation for Sustainable Development; Springer International Publishing: Cham, Switzerland, 2022; pp. 385–408. [Google Scholar]
- Liu, Z.; Huang, S.; Fang, C.; Guan, L.; Liu, M. Global urban and rural settlement dataset from 2000 to 2020. Sci. Data 2024, 11, 1359. [Google Scholar] [CrossRef]
- Li, S.; Yang, R.; Long, H.; Lin, Y.; Ge, Y. Rural spatial restructuring in suburbs under capital intervention: Spatial construction based on nature. Habitat Int. 2024, 150, 103112. [Google Scholar] [CrossRef]
- Blanco, H.; Alberti, M.; Olshansky, R.; Chang, S.; Wheeler, S.M.; Randolph, J.; London, J.B.; Hollander, J.B.; Pallagst, K.M.; Schwarz, T.; et al. Shaken, shrinking, hot, impoverished and informal: Emerging research agendas in planning. Prog. Plan. 2009, 72, 195–250. [Google Scholar] [CrossRef]
- Chapman, S.; Thatcher, M.; Salazar, A.; Watson, J.E.; McAlpine, C.A. The impact of climate change and urban growth on urban climate and heat stress in a subtropical city. Int. J. Climatol. 2019, 39, 3013–3030. [Google Scholar] [CrossRef]
- McCarroll, P.R. Embodying Theology: Trauma Theory, Climate Change, Pastoral and Practical Theology. Religions 2022, 13, 294. [Google Scholar] [CrossRef]
- Huang, Y.; Xia, J.; Chen, Y.; Hong, J. Global research progress on rural settlement spatial patterns from 2000–2024: A comprehensive review of hotspots, frontiers, and emerging trends. Front. Earth Sci. 2024, 12, 1505570. [Google Scholar] [CrossRef]
- Huang, Y.; Huang, Y.; Chen, Y.; Yang, S. Spatial evolution of traditional waterside settlements south of the Yangtze River and the distribution of settlement heritage: Evidence from the Nanxi River Basin. npj Herit. Sci. 2025, 13, 62. [Google Scholar] [CrossRef]
- Jiao, L.; Wu, Y.; Fang, K.; Liu, X. Typo-Morphological Approaches for Maintaining the Sustainability of Local Traditional Culture: A Case Study of the Damazhan and Xiaomazhan Historical Area in Guangzhou. Buildings 2023, 13, 2351. [Google Scholar] [CrossRef]
- Duan, J.; Shao, R.; Lan, W.; Liu, J.; Jiang, Y. Space Gene. China City Plan. Rev. 2022, 31, 6. [Google Scholar]
- Johnson, M.T.; Munshi-South, J. Evolution of life in urban environments. Science 2017, 358, eaam8327. [Google Scholar] [CrossRef] [PubMed]
- Fernández-Güell, J.-M. Complexity and Uncertainty in Contemporary Cities: Toward a New Conceptual Model; Cambridge Scholars Publishing: Cambridge, UK, 2024. [Google Scholar]
- Li, X.; Zhou, X.; Weng, F.; Ding, F.; Yi, Z. Acculturation and translation: Modern architectural heritage of Zhongshan Park in Xiamen from typological perspective. Front. Archit. Res. 2024, 13, 613–624. [Google Scholar] [CrossRef]
- Neuman, M.; Hull, A. The futures of the city region. Reg. Stud. 2009, 43, 777–787. [Google Scholar] [CrossRef]
- Duan, J.; Jiang, Y.; Li, Y.; Lan, W. Space Gene: Connotation and Functional Mechanism. China City Plan. Rev. 2022, 46, 7–14. [Google Scholar]
- Hillier, B. Space Is the Machine: A Configurational Theory of Architecture; Space Syntax: London, UK, 2007. [Google Scholar]
- Wang, Y.; Yuan, Q. Morphological characteristics of rural settlements from morphogenesis perspective: A case study of rural settlements in Heilongjiang Province, China. Energy Procedia 2019, 157, 1266–1277. [Google Scholar] [CrossRef]
- Dovey, K.; van Oostrum, M.; Chatterjee, I.; Shafique, T. Towards a morphogenesis of informal settlements. Habitat Int. 2020, 104, 102240. [Google Scholar] [CrossRef]
- Garcia-Molsosa, A.; Orengo, H.A.; Petrie, C.A. Reconstructing long-term settlement histories on complex alluvial floodplains by integrating historical map analysis and remote-sensing: An archaeological analysis of the landscape of the Indus River Basin. Herit. Sci. 2023, 11, 141. [Google Scholar] [CrossRef]
- Chakraborty, S.; Maity, I.; Patel, P.P.; Dadashpoor, H.; Pramanik, S.; Follmann, A.; Novotný, J.; Roy, U. Spatio-temporal patterns of urbanization in the Kolkata Urban Agglomeration: A dynamic spatial territory-based approach. Sustain. Cities Soc. 2021, 67, 102715. [Google Scholar] [CrossRef]
- Li, B.H.; Li, Z.; Liu, P.L.; Dou, Y.D. Landscape gene variation and differentiation law of traditional villages in Xiangjiang River Basin. J. Nat. Resour. 2022, 37, 362–377. [Google Scholar] [CrossRef]
- He, M.; Liu, H. A study on optimizing public spaces in rural heritage tourist sites from spatial perception: The case of Jinggang historic town. J. Chin. Archit. Urban. 2024, 6, 2481. [Google Scholar] [CrossRef]
- Jochem, W.C.; Leasure, D.R.; Pannell, O.; Chamberlain, H.R.; Jones, P.; Tatem, A.J. Classifying settlement types from multi-scale spatial patterns of building footprints. Environ. Plan. B Urban Anal. City Sci. 2021, 48, 1161–1179. [Google Scholar] [CrossRef]
- Kisiel, P. Unwanted inheritance? Industrial past as the EU heritage. Int. J. Herit. Stud. 2020, 26, 652–666. [Google Scholar] [CrossRef]
- Ali, M.; Ismail, K.M.; Hashim, K.S.H.-Y.; Suhaimi, S.; Mustafa, M.H. Heritage building preservation through building information modelling: Reviving cultural values through level of development exploration. Plan. Malays. 2018, 16, 62–72. [Google Scholar] [CrossRef]
- Sa, Q.; Qu, Z.; Liu, Y.; Shan, W. The strategy of traditional Chinese settlement digitization: A landscape gene information chain theory-based perspective. Herit. Sci. 2024, 12, 234. [Google Scholar] [CrossRef]
- Mohamed, A.A.; Ubarevičienė, R.; Van Ham, M. Morphological evaluation and regeneration of informal settlements: An experience-based urban design approach. Cities 2022, 128, 103798. [Google Scholar] [CrossRef]
- Ran, D.; Hu, Q.; Zhang, Z. Spatial–Temporal Evolution, Impact Mechanisms, and Reclamation Potential of Rural Human Settlements in China. Land 2024, 13, 430. [Google Scholar] [CrossRef]
- Chen, Z.; Dong, H. Spatial and temporal evolution patterns and driving mechanisms of rural settlements: A case study of Xunwu County, Jiangxi Province, China. Sci. Rep. 2024, 14, 24342. [Google Scholar] [CrossRef]
- Wang, J.; Zhang, Y. Analysis on the Evolution of Rural Settlement Pattern and Its Influencing Factors in China from 1995 to 2015. Land 2021, 10, 1137. [Google Scholar] [CrossRef]
- Ma, L.; Li, J.; Wang, X.; Zhang, W.; Tao, T.; Zhong, Y. Evolution and simulation optimization of rural settlements in urban-rural integration areas from a multi-gradient perspective: A case study of the Lan-Bai urban agglomeration in China. Habitat Int. 2024, 153, 103203. [Google Scholar] [CrossRef]
- Ye, X.; Wei, Y.D. Geospatial analysis of regional development in China: The case of Zhejiang Province and the Wenzhou model. Eurasian Geogr. Econ. 2005, 46, 445–464. [Google Scholar] [CrossRef]
- Lin, S.; Li, Z. City profile: Wenzhou-A model city of transitional China. Cities 2019, 95, 102393. [Google Scholar] [CrossRef]
- Weng, S.; Peng, H. Tourism development, rights consciousness and the empowerment of Chinese historical village communities. Tour. Geogr. 2014, 16, 772–784. [Google Scholar] [CrossRef]
- Jiang, L.; Cai, J. Research on the Spatial and Temporal Distribution and Evolution Characteristics of Ancient Architectural Heritage in Southeastern Zhejiang. Sustainability 2023, 15, 16618. [Google Scholar] [CrossRef]
- Huang, Y.; Chen, Y.; Hong, J. Regional spatiotemporal evolution and influencing factors of rural construction areas in the Nanxi River Basin via GIS. Open Geosci. 2025, 17, 20250801. [Google Scholar] [CrossRef]
- Cao, K.; Liu, Y.; Cao, Y.; Wang, J.; Tian, Y. Construction and characteristic analysis of landscape gene maps of traditional villages along ancient Qin-Shu roads, Western China. Herit. Sci. 2024, 12, 37. [Google Scholar] [CrossRef]
- Wang, Q.; Bing, H.; Wang, S.; Xu, Q. Study on the Spatial Distribution Characteristics and Influencing Factors of Famous Historical and Cultural Towns or Villages in Hubei Province, China. Sustainability 2022, 14, 13735. [Google Scholar] [CrossRef]
- An, Y.; Wu, X.; Liu, R.; Liu, L.; Liu, P. Quantitative Analysis Village Spatial Morphology Using “SPSS + GIS” Approach: A Case Study of Linxia Hui Autonomous Prefecture. Sustainability 2023, 15, 16828. [Google Scholar] [CrossRef]
- Huang, Y.; Huang, Y.; Chen, Y.; Yu, Y.; Zheng, L.; Ying, Z. Interpretation of the jiangnan landscape and countryside (shan-shui) pattern: Evidence from the classification and spatial form of traditional settlements in the nanxi river basin. Buildings 2025, 15, 413. [Google Scholar] [CrossRef]
- Wang, R.; Singh, A.K.; Kolan, S.R.; Tsotsas, E. Fractal analysis of aggregates: Correlation between the 2D and 3D box-counting fractal dimension and power law fractal dimension. Chaos Solitons Fractals 2022, 160, 112246. [Google Scholar] [CrossRef]
- Shpuza, E. The shape and size of urban blocks. Environ. Plan. B Urban Anal. City Sci. 2023, 50, 24–43. [Google Scholar] [CrossRef]
- Batty, M. Integrating space syntax with spatial interaction. Urban Inform. 2022, 1, 4. [Google Scholar] [CrossRef]
- Zhou, L.; Lee, J.H.; Ostwald, M.J. Statistical insights into syntactic properties of Sydney’s Chinese ethnic communities: Variability, concentration, and balance. Cities 2024, 153, 105310. [Google Scholar] [CrossRef]
- Pilehvar, A.A. Spatial-geographical analysis of urbanization in Iran. Humanit. Soc. Sci. Commun. 2021, 8, 63. [Google Scholar] [CrossRef]
- Willis, G.B. Analysis of the Cognitive Interview in Questionnaire Design; Oxford University Press: New York, NY, USA, 2015; Available online: https://books.google.com.sg/books?hl=en&lr=&id=vUzCBwAAQBAJ&oi=fnd&pg=PP1&dq=Cognitive+questionnaire+scoring+and+understanding+analysis&ots=AJ9rTGN2Yi&sig=9l8gflm_F9hqnyXZgf1YOdkrO4c&redir_esc=y#v=onepage&q=Cognitive%20questionnaire%20scoring%20and%20understanding%20analysis&f=false (accessed on 13 June 2025).
- El-Darwish, I.I. Fractal design in streetscape: Rethinking the visual aesthetics of building elevation composition. Alex. Eng. J. 2019, 58, 957–966. [Google Scholar] [CrossRef]
- Wurm, M.; Schmitt, A.; Taubenböck, H. Building Types’ Classification Using Shape-Based Features and Linear Discriminant Functions. IEEE J. Sel. Top. Appl. Earth Obs. Remote Sens. 2016, 9, 1901–1912. [Google Scholar] [CrossRef]
- Gorbenkova, E.; Shcherbina, E. Historical-genetic features in rural settlement system: A case study from Mogilev District (Mogilev Oblast, Belarus). Land 2020, 9, 165. [Google Scholar] [CrossRef]
- Hu, Z.; Josef, S.; Min, Q.; Tan, M.; Cheng, F. Visualizing the cultural landscape gene of traditional settlements in China: A semiotic perspective. Herit. Sci. 2021, 9, 115. [Google Scholar] [CrossRef]
- Sun, J.; Shao, L. Interpretation of Historic Urban Landscape Genes: A Case Study of Harbin, China. Land 2024, 13, 1988. [Google Scholar] [CrossRef]
- Hu, Z.; Tan, M. A parameter to featuring the cultural landscape genes of traditional settlements in China: A perspective of geographical information. Herit. Sci. 2024, 12, 140. [Google Scholar] [CrossRef]
- Li, G.; Chen, B.; Zhu, J.; Sun, L. Traditional Village research based on culture-landscape genes: A Case of Tujia traditional villages in Shizhu, Chongqing, China. J. Asian Archit. Build. Eng. 2024, 23, 325–343. [Google Scholar] [CrossRef]


| Space Gene Elements | Element Indicator Content | Operation Method (or Formula) | Analysis Tool |
|---|---|---|---|
| (1) Landform and water features | (a) Relationship between landscape and mountains | Concentric circles with a radius of 500 m were delineated with the settlement center as the center point to detect the coverage area of mountains, cultivated land, and water systems and to conduct data detection [40]. | ArcGIS (10.8 version) |
| (b) Landform and water structure | We analyzed the terrain elevation profile and made a qualitative summary based on the local chronicles or ancient books about the construction of the village [41]. | ArcGIS combined with local digital database and local chronicles | |
| (2) Boundary morphology | (a) Aspect ratio | Settlement morphology ratio Aspect Ratio λ = ( is the major and minor axes of the circumscribed ellipse) [42] | AutoCAD (2020 version) |
| (b) Morphological index | Determination of settlement morphology Morphological Index ( is the perimeter, is the area, and is the aspect ratio). Aspect ratio , shape index . Boundary morphology determination: when , is a finger-like settlement with a clustering tendency, is a finger-like settlement with no clear tendency, and is a finger-like settlement with strip-like tendency; when , is a cluster-like settlement, is a cluster-like settlement with strip-like tendency, and is a strip-like settlement [43]. | AutoCAD | |
| (c) Fractal dimension | Complexity of settlement boundaries S3 = lnA/2lnP [44] | AutoCAD | |
| (3) Spatial structure | (a) Building density | Building core density | AutoCAD and ArcGIS |
| (b) Regional topology | Block topology edge morphology division statistics [45] | AutoCAD | |
| (4) Street network | (a) Axis topological relationship | Integration analysis [46] | AutoCAD and Depthmap |
| (b) Key building texture | Depth and choice analysis [47] | AutoCAD and Depthmap (1.2 version) | |
| (c) Landscape node distribution | Geographic concentration index analysis [48] G is the geographical concentration index of landscape nodes; is the number of landscape nodes in the -th street of the settlement; is the total number of landscape nodes; is the total number of streets. | ArcGIS and Depthmap | |
| (d) Key space nodes | Cognitive questionnaire scoring and understanding analysis [49] | ||
| (e) Street scale aesthetic space | Analysis of 26-node aspect ratio data, clustering 3 types of block relationships. Stream-street–wall–building, house–street–building (two different types of large, small, wide, and narrow structures) [50] | Range Finder (2.1 version), Excel (Mac version 2020) and R (4.5.1 version) | |
| (5) Architectural style | (a) Architectural plan form | We classified the building plane forms and counted the number and area of different forms for analysis [51]. | DJI Mavic 3 Pro and AutoCAD |
| (b) Summary of facade form | Qualitative research and field photography and mapping | 3D scanner APP (2.1.4 version) combines local digital database and expert consultation |
| Classification | Area/m2 | Area Ratio | Area Ratio Squared | Area Ratio Squared Sum | LSDI Index |
|---|---|---|---|---|---|
| Transportation network | 48,681.342 | 0.062 | 0.004 | 0.292 | 0.708 |
| Cultivated land | 293,651.148 | 0.374 | 0.140 | ||
| Buildings | 128,808.964 | 0.164 | 0.027 | ||
| Forest land | 269,371.372 | 0.343 | 0.118 | ||
| Water system | 44,456.634 | 0.057 | 0.003 | ||
| Total area | 784,969.460 | ||||
| Indicators | Long Axis/m | Short Axis/m | Aspect Ratio | |||
|---|---|---|---|---|---|---|
| Statistical results | 272.09 | 261.42 | 1.04 | |||
| 7 m spatial form perimeter/m | 7 m range of morphological area/m2 | 30 m spatial form perimeter/m | 30 m range of morphological area/m2 | 100 m spatial form perimeter/m | 100 m range of morphological area/m2 | |
| Morphological value | 1505.52 | 40,687.08 | 1094.19 | 44,425.57 | 878.50 | 53,661.04 |
| Comprehensive morphological value | 2.10 | 1.46 | 1.07 | |||
| Morphological judgment | 1.53 | |||||
| Fractal dimension value | Clustered settlement | |||||
| Comprehensive fractal dimension value | 1.38 | 1.31 | 1.24 | |||
| Statistical results | 1.31 | |||||
| Note: Comprehensive morphology/fractal index = 7 m morphology/fractal index result ∗ 25% + 30 m morphology/fractal index result ∗ 50% + 100 m morphology/fractal index result ∗ 25%. | ||||||
| No. | Streets and Alleys | Number of Landscape Nodes | Percentage (%) | Cumulative Percentage (%) |
|---|---|---|---|---|
| 1 | Main Street | 16 | 38 | 38 |
| 2 | Dongcheng Road | 8 | 19 | 57 |
| 3 | Beicheng Road | 10 | 24 | 81 |
| 4 | Beimen Street | 3 | 7 | 88 |
| 5 | Dongbei Street | 5 | 12 | 100 |
| No. | Space Nodes | Category | Frequency/% | Global Integration | Local Integration R3 |
|---|---|---|---|---|---|
| 1 | Zhisheng Hall | Residential buildings | 95.6 | 0.707 | 1.772 |
| 2 | Simian Well | Cultural nodes | 78.8 | 0.703 | 2.184 |
| 3 | Jishan Hall | Residential buildings | 92.4 | 0.699 | 2.133 |
| 4 | Yanghe Hall | Residential buildings | 81.4 | 0.680 | 2.208 |
| 5 | Xiancun Hall | Cultural nodes | 76.5 | 0.672 | 1.843 |
| 6 | Yubei Anti-Japanese Memorial and Pavilion | Public buildings | 93 | 0.671 | 1.308 |
| 7 | Liufang Ancestral Hall | Cultural nodes | 89.6 | 0.660 | 2.255 |
| 8 | Xiaoqianjing | Cultural nodes | 70.6 | 0.656 | 1.851 |
| 9 | City walls and moats | Cultural nodes | 84.5 | 0.652 | 1.979 |
| 10 | 800-year-old ginkgo | Public buildings | 65.8 | 0.598 | 1.605 |
| 11 | Chi Gate | Cultural nodes | 88.2 | 0.570 | 1.763 |
| 12 | Wang Clan Ancestral Hall | Public buildings | 82.5 | 0.523 | 0.849 |
| 13 | Yushan Park | Religious buildings | 64.6 | 0.493 | 1.300 |
| 14 | Duanming Academy | Category | 68.9 | 0.460 | 1.702 |
| 15 | Zhijiaokengdi Niangniang Palace | Residential buildings | 57 | 0.365 | 0.422 |
| Indicators | “I” Shape | Combined Type | Four-Sided Enclosure | “H” Shape | “L” Shape | Three-Sided Enclosure |
|---|---|---|---|---|---|---|
| Count | 62 | 1 | 5 | 3 | 17 | 9 |
| Proportion | 63.91% | 1.03% | 5.15% | 3.09% | 17.52% | 9.28% |
| Max/m2 | 781.10 | 258.10 | 1147.43 | 1048.01 | 620.31 | 978.66 |
| Mean/m2 | 130.14 | 258.10 | 569.06 | 779.72 | 257.87 | 583.90 |
| Min/m2 | 8.86 | 258.10 | 274.06 | 575.81 | 122.65 | 244.97 |
| Total area/m2 | 8068.78 | 258.10 | 2845.30 | 2339.17 | 4383.71 | 5255.10 |
Disclaimer/Publisher’s Note: The statements, opinions and data contained in all publications are solely those of the individual author(s) and contributor(s) and not of MDPI and/or the editor(s). MDPI and/or the editor(s) disclaim responsibility for any injury to people or property resulting from any ideas, methods, instructions or products referred to in the content. |
© 2025 by the authors. Licensee MDPI, Basel, Switzerland. This article is an open access article distributed under the terms and conditions of the Creative Commons Attribution (CC BY) license (https://creativecommons.org/licenses/by/4.0/).
Share and Cite
Huang, Y.; Ye, Z.; Zhang, Q.; Chen, Y.; Wu, W. Space Gene Quantification and Mapping of Traditional Settlements in Jiangnan Water Town: Evidence from Yubei Village in the Nanxi River Basin. Buildings 2025, 15, 2571. https://doi.org/10.3390/buildings15142571
Huang Y, Ye Z, Zhang Q, Chen Y, Wu W. Space Gene Quantification and Mapping of Traditional Settlements in Jiangnan Water Town: Evidence from Yubei Village in the Nanxi River Basin. Buildings. 2025; 15(14):2571. https://doi.org/10.3390/buildings15142571
Chicago/Turabian StyleHuang, Yuhao, Zibin Ye, Qian Zhang, Yile Chen, and Wenkun Wu. 2025. "Space Gene Quantification and Mapping of Traditional Settlements in Jiangnan Water Town: Evidence from Yubei Village in the Nanxi River Basin" Buildings 15, no. 14: 2571. https://doi.org/10.3390/buildings15142571
APA StyleHuang, Y., Ye, Z., Zhang, Q., Chen, Y., & Wu, W. (2025). Space Gene Quantification and Mapping of Traditional Settlements in Jiangnan Water Town: Evidence from Yubei Village in the Nanxi River Basin. Buildings, 15(14), 2571. https://doi.org/10.3390/buildings15142571