Article

Rapid Identification Method for Concrete Defect Boundaries Based on Acoustic-Mode Gradient Analysis

1
School of Safety Engineering and Emergency Management, Shijiazhuang Tiedao University, Shijiazhuang 050047, China
2
School of Electrical and Electronic Engineering, Shijiazhuang Tiedao University, Shijiazhuang 050047, China
3
School of Mechanical Engineering, Shijiazhuang Tiedao University, Shijiazhuang 050047, China
*
Author to whom correspondence should be addressed.
Buildings 2025, 15(14), 2569; https://doi.org/10.3390/buildings15142569
Submission received: 18 June 2025 / Revised: 8 July 2025 / Accepted: 18 July 2025 / Published: 21 July 2025
(This article belongs to the Section Building Materials, and Repair & Renovation)

Abstract

Concrete is extensively utilized in infrastructure projects. However, issues like construction quality and external loads can lead to the formation of thin-plate-like voids with considerable aspect ratios, posing serious safety risks and highlighting the need for effective boundary detection. This paper addresses the challenges of traditional acoustic detection methods, which often suffer from low efficiency, poor adaptability to environmental conditions, and difficulties in measuring defect sizes. It explores a spatially diverse MIC Array system. Unlike single-point MIC that can only capture multi-directional sound field information from one excitation point, this array improves efficiency through simultaneous multi-channel data acquisition. This study develops a vibration model for a circular thin plate with fixed boundaries, examines the gradient relationships in various directions, and introduces a method that integrates MIC array technology with acoustic vibration techniques. The focus is on identifying concrete defect boundaries, where a single excitation at the same measurement point can yield different first-order vibration modes recorded by various MICs. A gradient-based approach is proposed to determine defect boundaries based on the locations of different MICs in the array. Experiments were carried out using circular thin-plate concrete samples with pre-existing voids. For instance, at boundary measurement point 15, the first-order modal data collected by MIC0 and MIC4 were 7.80 × 10 4   P a  and 5.42 × 10 6   P a , respectively, exhibiting a significant gradient difference, which verified the accuracy and rapidity of identifying concrete void boundaries.

1. Introduction

Concrete structures are commonly used in transportation infrastructure, including tunnels, ballastless tracks, and highway engineering, due to their strong performance [1]. However, structural defects, such as cracks, debonding, and voids, can arise from design and construction errors, as well as various environmental factors. Thin-plate-like defects, which have a much greater length than thickness [2], can significantly diminish the load-bearing capacity and pose serious risks to overall structural safety. Consequently, researching accurate detection methods for concrete thin-plate voids is crucial for maintaining the safety of transportation infrastructure throughout its entire life cycle [3].
Traditional methods for detecting voids in concrete have notable drawbacks. The manual tapping technique relies heavily on the operator’s experience, is subjective, and lacks guaranteed accuracy in detection. Ground-penetrating radar (GPR) [4,5] is highly affected by electromagnetic interference from rebar, has a restricted detection depth, and is not sensitive to air, resulting in a low resolution. The ultrasonic method [6] has a limited effective detection range because high-frequency signals quickly weaken in concrete. Infrared thermography [7,8] can only detect surface-level defects, is greatly influenced by variations in the thermal conductivity of concrete, and does not provide an adequate resolution for identifying defects.
Additionally, existing AI-driven detection technologies also have certain limitations in their application. Visual inspection methods can effectively identify surface-level defects like cracks and spalling, but their optical imaging capabilities are unable to penetrate concrete structures, resulting in difficulties in detecting internal voids [9,10]. While integrating ground-penetrating radar with deep learning enhances detection speed, it still faces challenges with low recognition accuracy and high rates of missed detections [11]. Automated ultrasonic testing also encounters issues, as high-frequency signals significantly weaken in uneven concrete, leading to inadequate detection depths, even when using advanced algorithms that combine wavelet and neural network techniques [12].
Vibro-acoustic detection technology is used to locate voids by generating vibrations on the surface of concrete through external stimulation, while simultaneously capturing the structural response signals and comparing them to predetermined values [13]. This technology includes an excitation device and an acoustic acquisition system. When the excitation source is applied to the concrete surface, acoustic sensors can capture real-time vibration signals that contain information about the internal structure [14]. Existing studies have validated the applicability of acoustic characteristic parameters in void identification, based on signal processing techniques, such as Hilbert–Huang Transform [15], Fourier Transform [16], and Wavelet Transform [17]. However, traditional techniques face challenges such as inadequate separation of defect characteristic vibration components and considerable interference from environmental noise, which limits the enhancement of detection accuracy [18].
Conventional vibro-acoustic detection functions in a single-excitation and single-acquisition mode [19], which is insufficient for determining the direction of concrete voids or their boundaries, posing challenges for future repair efforts. To address these limitations, this research introduces a MIC array acquisition device that utilizes a single-excitation and multi-acquisition approach. By analyzing the modal responses of a thin plate captured by MICs positioned at various locations during a single excitation, the directionality is established through the comparison of gradient differences, ultimately enabling the identification of void boundaries.
This study introduces a method for detecting void boundaries using a MIC array and validates it through experiments with circular thin-plate concrete samples. The paper is organized as follows: Section 2 develops a theoretical model for the forced vibration of a circular thin plate and presents a boundary identification algorithm based on the gradient method; Section 3 confirms the validity of the theoretical model through numerical simulations; Section 4 outlines the design and execution of tests on concrete specimens to further assess the practical application of the detection method; Section 5 examines the acoustic data collected; and Section 6 concludes with a summary of the research results and suggests directions for future studies.

2. Theoretical Analysis and Algorithm Principles

In the field of solid mechanics, the forced vibration characteristics of beams and circular thin plates with clamped boundary conditions show notable theoretical parallels [20]. This similarity arises mainly from the isomorphism of their fourth-order governing equations and the corresponding clamped boundary conditions, which dictate that both displacement and rotation are zero, creating fixed nodes. The vibration modes of both structures adhere to orthogonality; when stimulated at their first-order antinode, such as the midpoint of a beam or the center of a plate, the fundamental frequency is predominantly excited, while nodal excitation dampens higher-order modes.
This study utilizes a circular thin plate with fixed boundaries to model voids in concrete structures, based on principles from the plate and shell theory [21]. It is important to note that this simplified model has three idealization limitations: First, the geometric irregularities of real voids (like spherical protrusions or surface variations) are not fully represented, which could result in local prediction inaccuracies; second, the bonding condition at the void–matrix interface (including possible micro-cracks) is not the same as an ideal fixed boundary, which can influence the system’s damping properties and the accuracy of its resonance response; third, the relevance of the thin-plate theory diminishes in voids with higher thickness-to-diameter ratios or in non-uniform materials. Consequently, the findings of this model should be strictly confined to cases involving internal voids in circular thin-plate concrete with fixed boundary conditions.

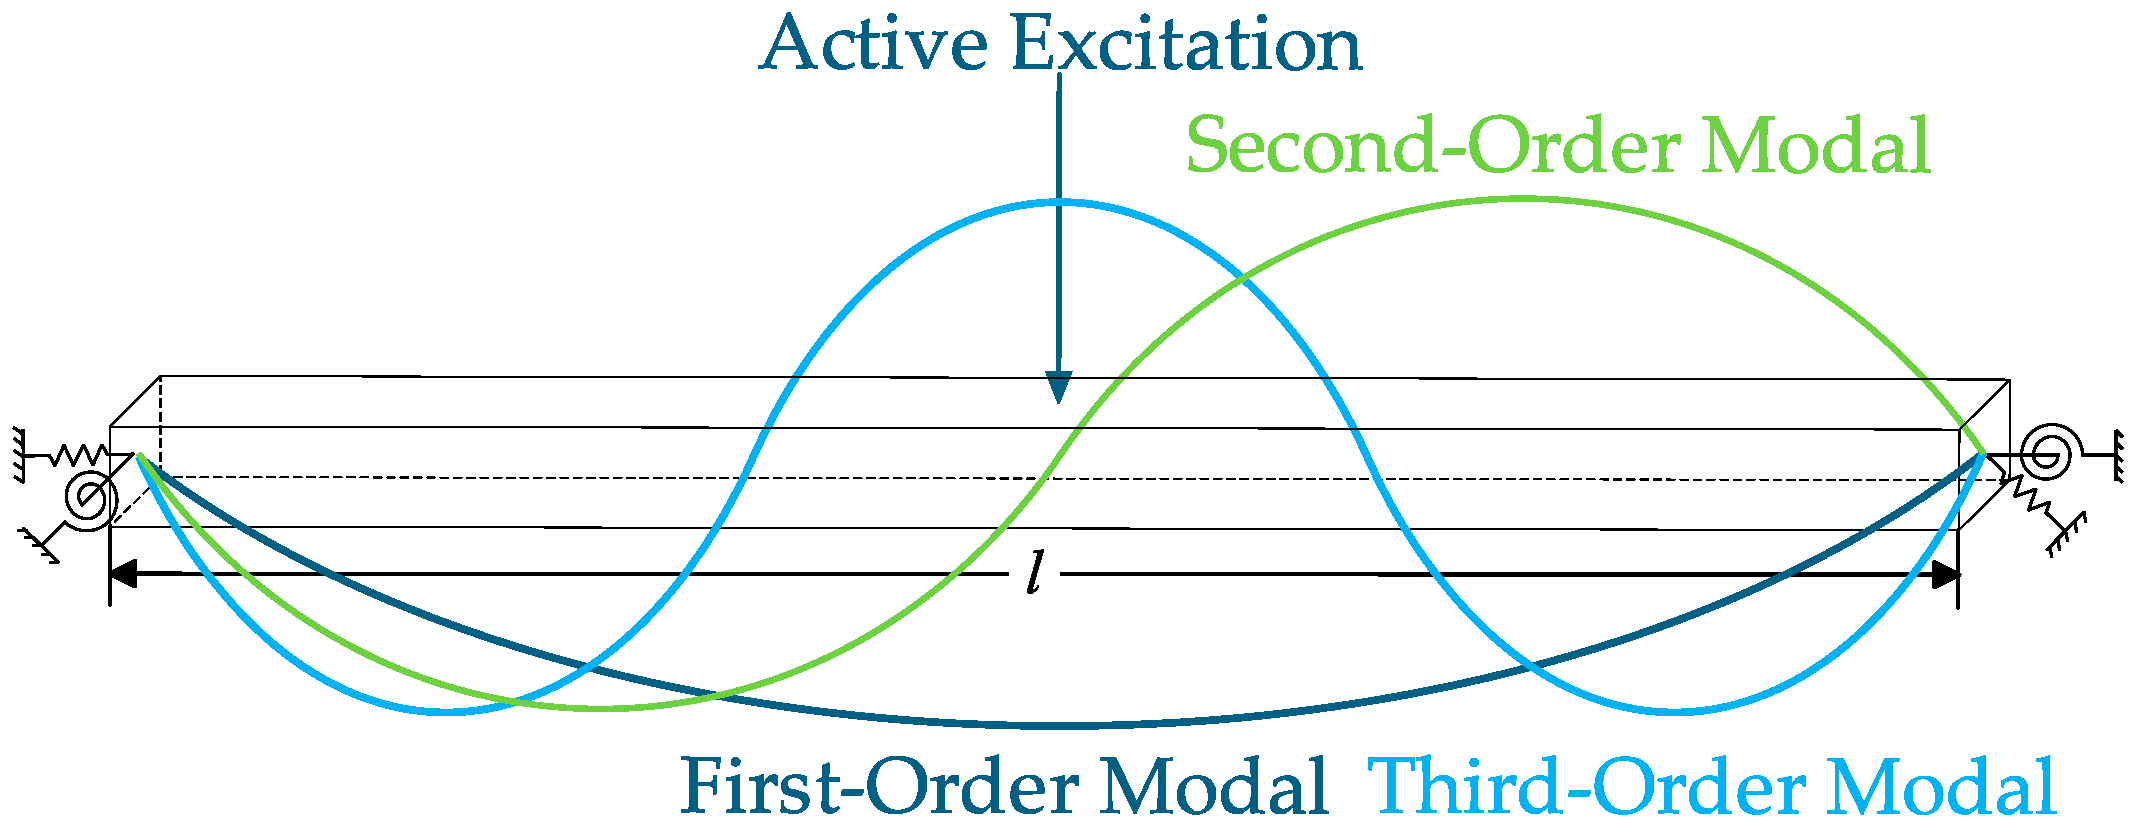
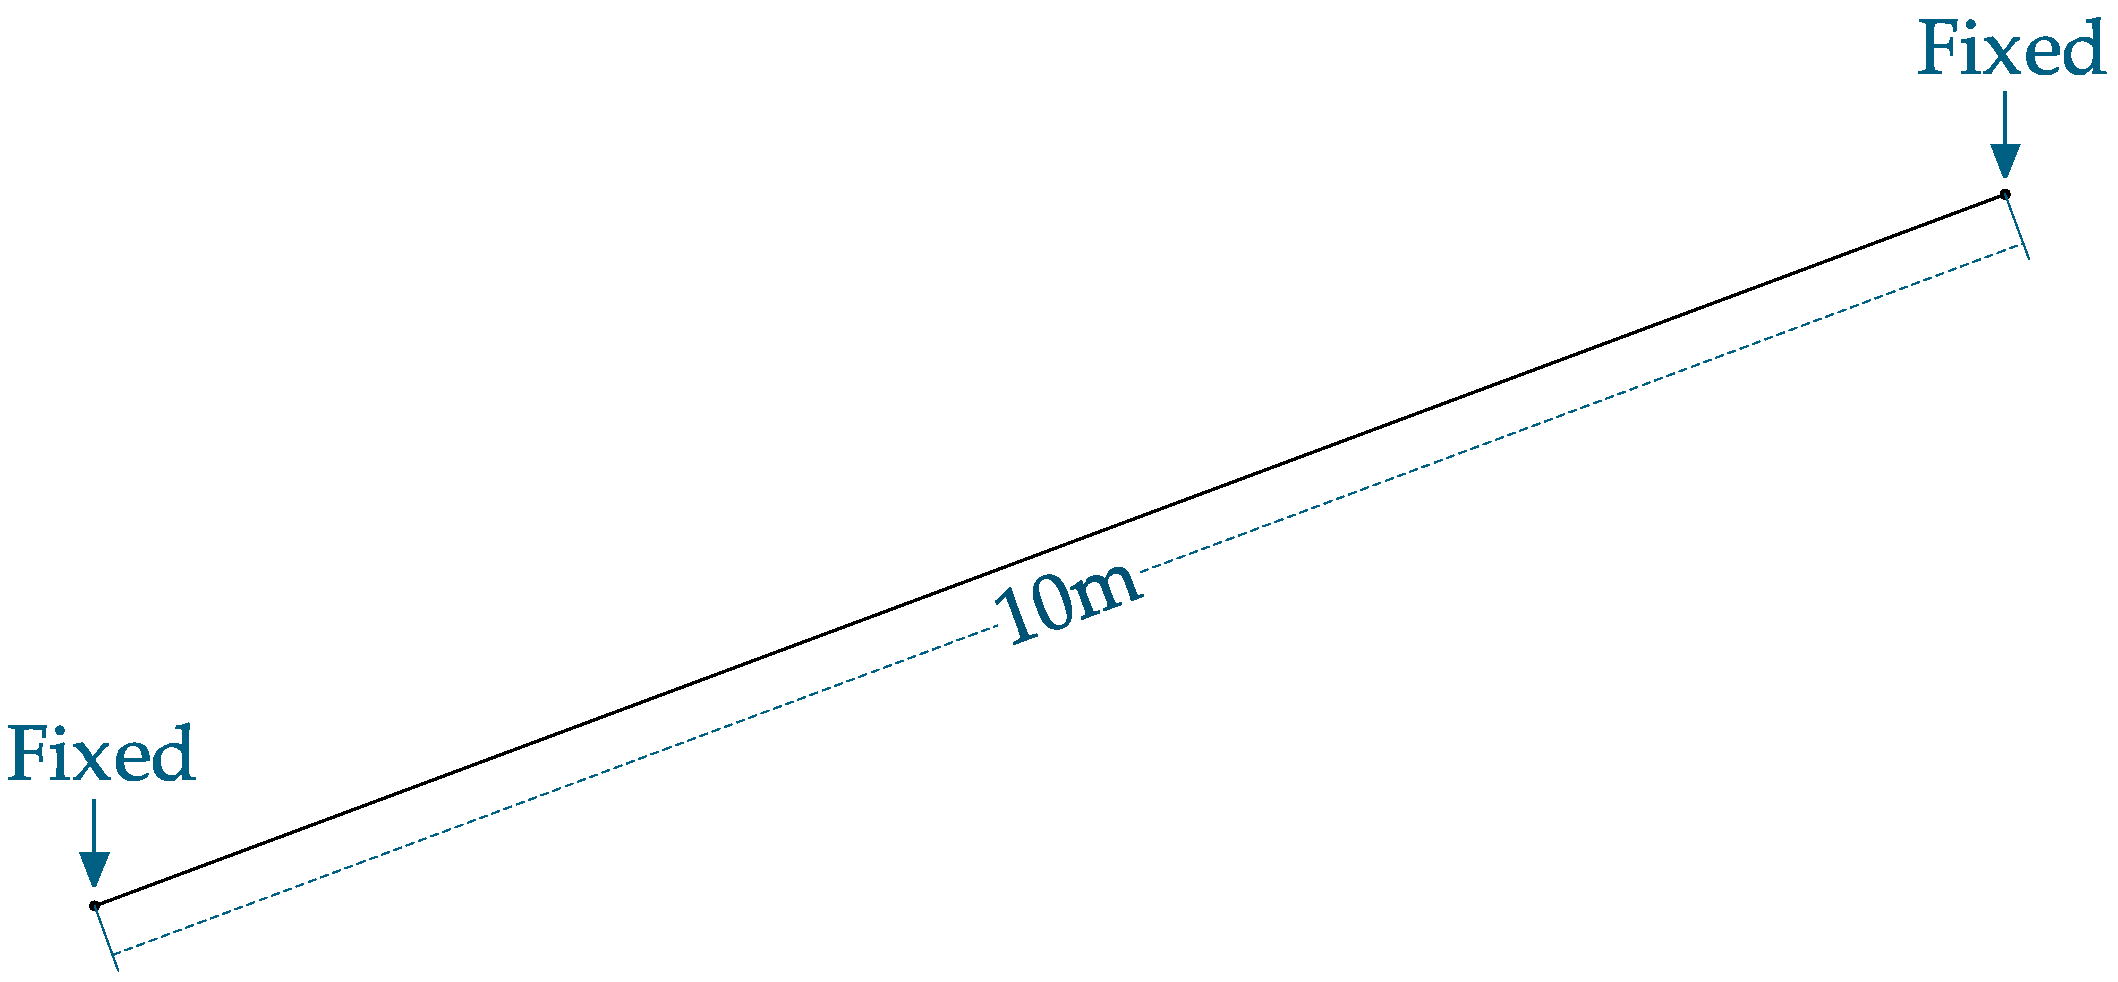
2.1. Forced Vibration of Beams

Considering a beam of length l , with a forced vibration applied at the midpoint ( l / 2 ) and fixed boundary conditions at both ends, where both displacement and rotation are constrained to be zero, as shown in Figure 1. The boundary conditions are represented by springs and rotational springs [22] with stiffness values of k and K, respectively. The equations that describe the boundary conditions are:
W ( 0 ) = 0 , W ( l ) = 0 W ( 0 ) = 0 , W ( l ) = 0
where W is the transverse displacement of the beam.
Due to the nodal effect of higher-order modes (e.g., the zero-amplitude nodal positions present in second-order modes), which can easily lead to measurement signal loss [23], and given that the first-order mode exhibits non-zero response characteristics at any position (no nodal effect), this study selects the first-order mode as the core observation object. According to the Euler–Bernoulli beam theory [24], the first-order natural frequency of a fixed-fixed beam can be expressed as:
ω = β 1 2 2 π l 2 E I ρ A
where β 1 is the first-order modal coefficient for a beam clamped at both ends, its value is approximately 4.73, E is the elastic modulus of the material, I is the moment of inertia of the cross-section, A is the cross-sectional area of the beam, l is the length of the beam, and ρ is the density of the material. The equation reveals that the first-order frequency ω is positively correlated with the bending stiffness E I , and negatively correlated with the mass distribution ρ A and the scale l . β 1 reflects the boundary constraint strength.
When a temporary excitation is introduced at the point of forced vibration, vibration waves travel toward both ends of the beam at a specific wave speed. According to the decoupling properties of the wave equation, wave propagation must adhere to the time delay condition [25]. If we denote the wave speed of the beam material as v , then:
t = l v
As vibration waves travel, their energy gradually diminishes because of damping, and the reduction in amplitude over distance adheres to an exponential pattern [26,27]:
A x = A 0 e β x
where β = c 2 m ω is the attenuation coefficient, c is the damping coefficient, m is the mass per unit length, and A 0 represents the initial amplitude. Physical essence: the decay strength is directly proportional to the damping coefficient, c , and inversely proportional to the system’s inertial mass m and natural frequency ω . The exponential form fundamentally stems from the assumption that viscous damping force is linearly related to velocity [28].

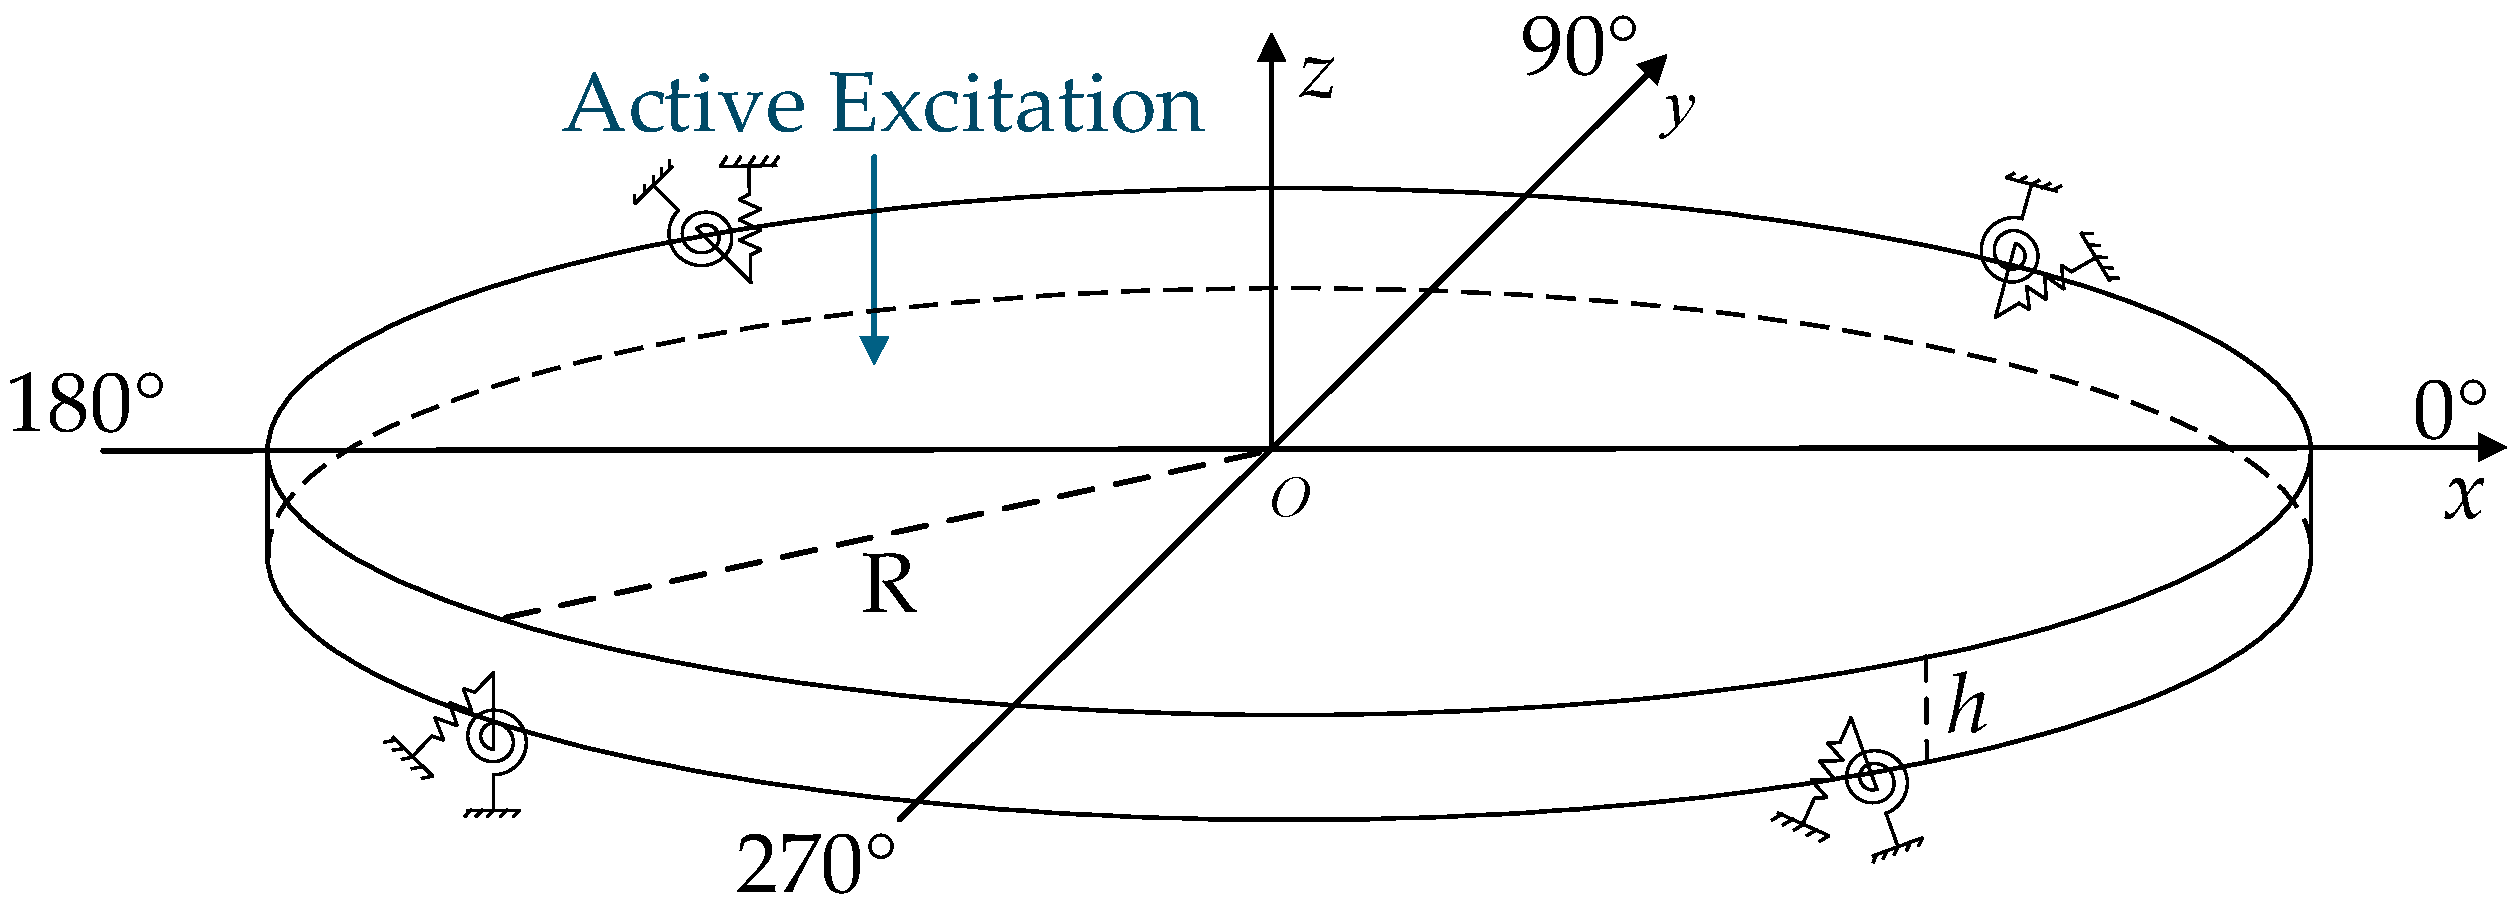
2.2. Natural Vibration of Circular Thin Plates

This study adopts a circular thin-plate model without loss of generality, owing to the considerable differences in the sizes of various concrete voids and the thickness of the cover layer. The differential equation governing free vibration is as follows:
W 4 + m ¯ D 2 W t 2 = 0
where 4 = ( 2 ρ 2 + 1 ρ ρ + 1 ρ 2 2 φ 2 ) 2 is the fourth-order spatial derivative, describing bending stiffness; m ¯ is the mass inertia, related to kinetic energy; and D = E h 3 / [ 12 ( 1 v 2 ) ] is the stiffness of the material, representing its resistance to deformation. W = ω ( r , φ , t ) is the displacement of a point ( r , φ ) on the thin plate at time t , where r denotes the distance from the center of the circular thin plate, and φ denotes the angle relative to a reference direction.
A circular thin-plate model is constructed with a radius of R and a thickness of h . The thin cover layer of the concrete void is secured to the surrounding concrete, leading to clamped boundary conditions (fixed edges). These boundary conditions are represented using springs and rotational springs with stiffness values of k and K, respectively, as shown in Figure 2. The mathematical representations for these boundary conditions are [29]:
W | r = R = 0 W r | r = R = 0
where W | r = R = 0 indicates that the transverse displacement of the circular thin plate is 0 at the boundary, and W r | r = R = 0 indicates that the slope (i.e., rotation angle) of the thin plate is also 0 at the boundary.
In the vibration analysis of thin plates, the first-order modal response is chosen as the focus of this study due to its advantageous physical excitation properties and signal detection benefits. This is primarily because the first-order modal can be easily excited from an energy excitation mechanism standpoint. Additionally, its response signal features a high amplitude and extended duration, with a distinct spectrum peak that stands out from background noise, making data collection and analysis much simpler. To further quantify the characteristics of this first-order modal, the formula for the lowest natural frequency during forced vibration can be derived through analytical modal analysis as follows:
ω 1 = λ m n 2 2 π R 2 D ρ h
where λ m n is the dimensionless eigenvalue determined by the boundary conditions and modal order, R is the radius of the circular thin plate, and ρ is the density of the material.

2.3. Theoretical Analysis

2.3.1. Comparison of Array Technology and Single-Point Technology

The research based on array technology indicates its significant development potential in the field of nondestructive testing [30]. The core of this technology lies in efficiently characterizing the inspected object through multi-channel signal amplitude and spatial correlation analysis. However, traditional single-point technology is limited by insufficient spatial resolution, restricting the precision and efficiency of nondestructive testing [31].
This paper utilizes an eight-element MIC array technology. In contrast to conventional single-point methods, it enhances signal acquisition efficiency by a factor of eight and significantly improves spatial resolution, offering a viable technical approach for accurately identifying the boundaries of voids in concrete.

2.3.2. Acoustic Component Analysis

The MIC array setup is shown in Figure 3. It consists of eight MICs arranged in a circle with a radius of 47 mm, centered around the excitation point, with each MIC placed at 45° intervals. The excitation source is located on the surface of the concrete specimen, and the MIC array is situated 15 mm above that surface.
An 8-element MIC array is utilized to capture acoustic signals from voids in concrete, as shown in Figure 4a. When the excitation device impacts the concrete surface, the MIC array picks up various acoustic data, which can be categorized into five types: The first type is the modal response of the thin plate ( f 1 ); the second type is the mechanical vibrations caused by the impact of the excitation device ( f 2 ); the third type is interference resulting from the action of the excitation device ( f 3 ); the fourth type is interference from the rebound of the excitation device ( f 4 ); and the fifth type is interference from ambient noise ( f 5 ). This research uses the MIC array to examine the relationships and differences in modal responses recorded by MICs positioned at various locations during simultaneous excitation.

2.3.3. Determining the Center Direction Using Gradient

When the circular thin plate is struck at any point, it will cause the plate to vibrate. This study utilizes a MIC array positioned around the point of impact to capture the first-order modal response ( f 1 ) at various locations from a single strike. The vibration amplitude is greatest at the center, meaning that MICs located nearer to the center in the array pick up a larger amount of vibrational energy [32]. In contrast, MICs positioned further away from the center detect less energy from the vibrations. This creates a pronounced gradient, allowing for a clear differentiation between the center and the non-circular edges of the plate.

2.4. Acoustic Signal Processing

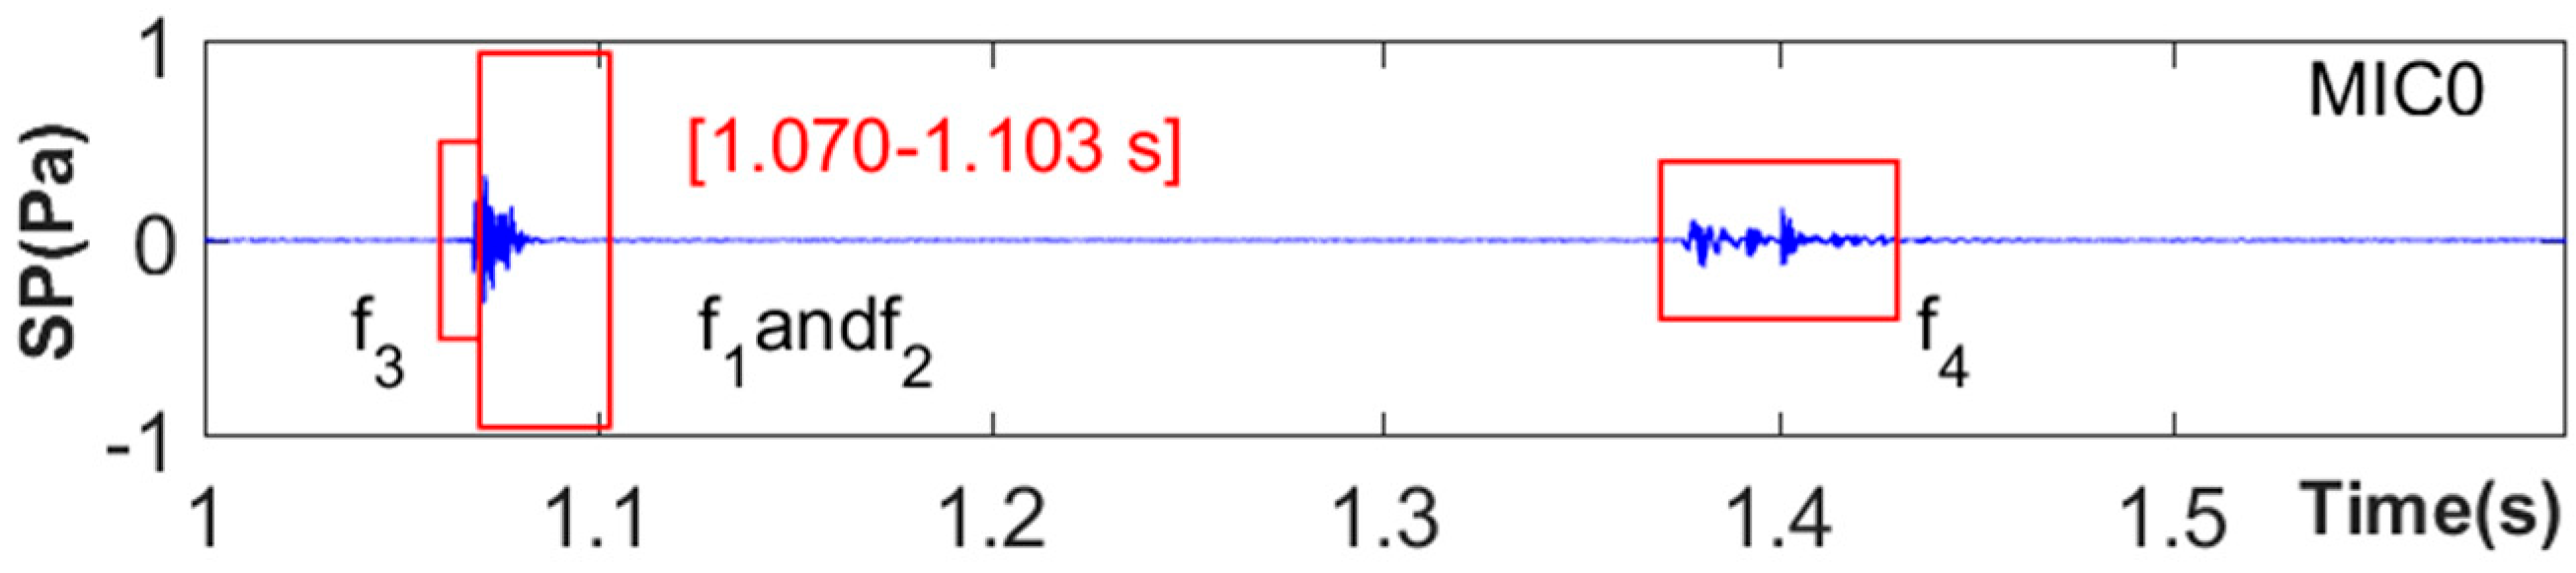
2.4.1. Synchronous Interception of Multi-Channel Acoustic Signals

The acoustic signals collected from the 8-element MIC array are analyzed separately. By identifying the peak value in the time domain, the point at which the excitation source impacts the concrete surface is established, followed by the definition of a time window. The time windows for each of the 8 signals are then compared to find the earliest start time and the latest end time, creating a global time window that encompasses all signals. The flowchart illustrating this process is presented in Figure 5.
For every audio signal, identified by s i n i = 0,1 , , 7 , identify the point with the highest absolute value. If there are several points with the same maximum value, the middle point is selected. The equation is as follows:
m ^ i = m e d i a n a r g m a x n | s i n |
Select the time windows for each signal [33], and the formula for this is:
s t a r t i = max 1 , m ^ i 0.001 f s , e n d i = m i n ( N i , m ^ i + 0.03 f s )
where N i is the total number of samples for signal s i . f s is the sampling frequency of the acoustic signal, m a x ( 1 , · ) ensures that the start point is not less than the first sample point, and m i n ( N i , · ) ensures that the end point does not exceed the total number of samples in the signal.
For an 8-element array, the global time window for time domain segmentation is:
T g l o b a l = [ m i n i s t a r t i 1 f s , m a x i e n d i 1 f s ]
Using the data collected from the measurement point at the center as a reference, the interference caused by the excitation device’s operation ( f 3 ) and the rebound interference that occurs after the striking is finished ( f 4 ) were effectively minimized in the time domain, as shown in Figure 6 and Figure 7.

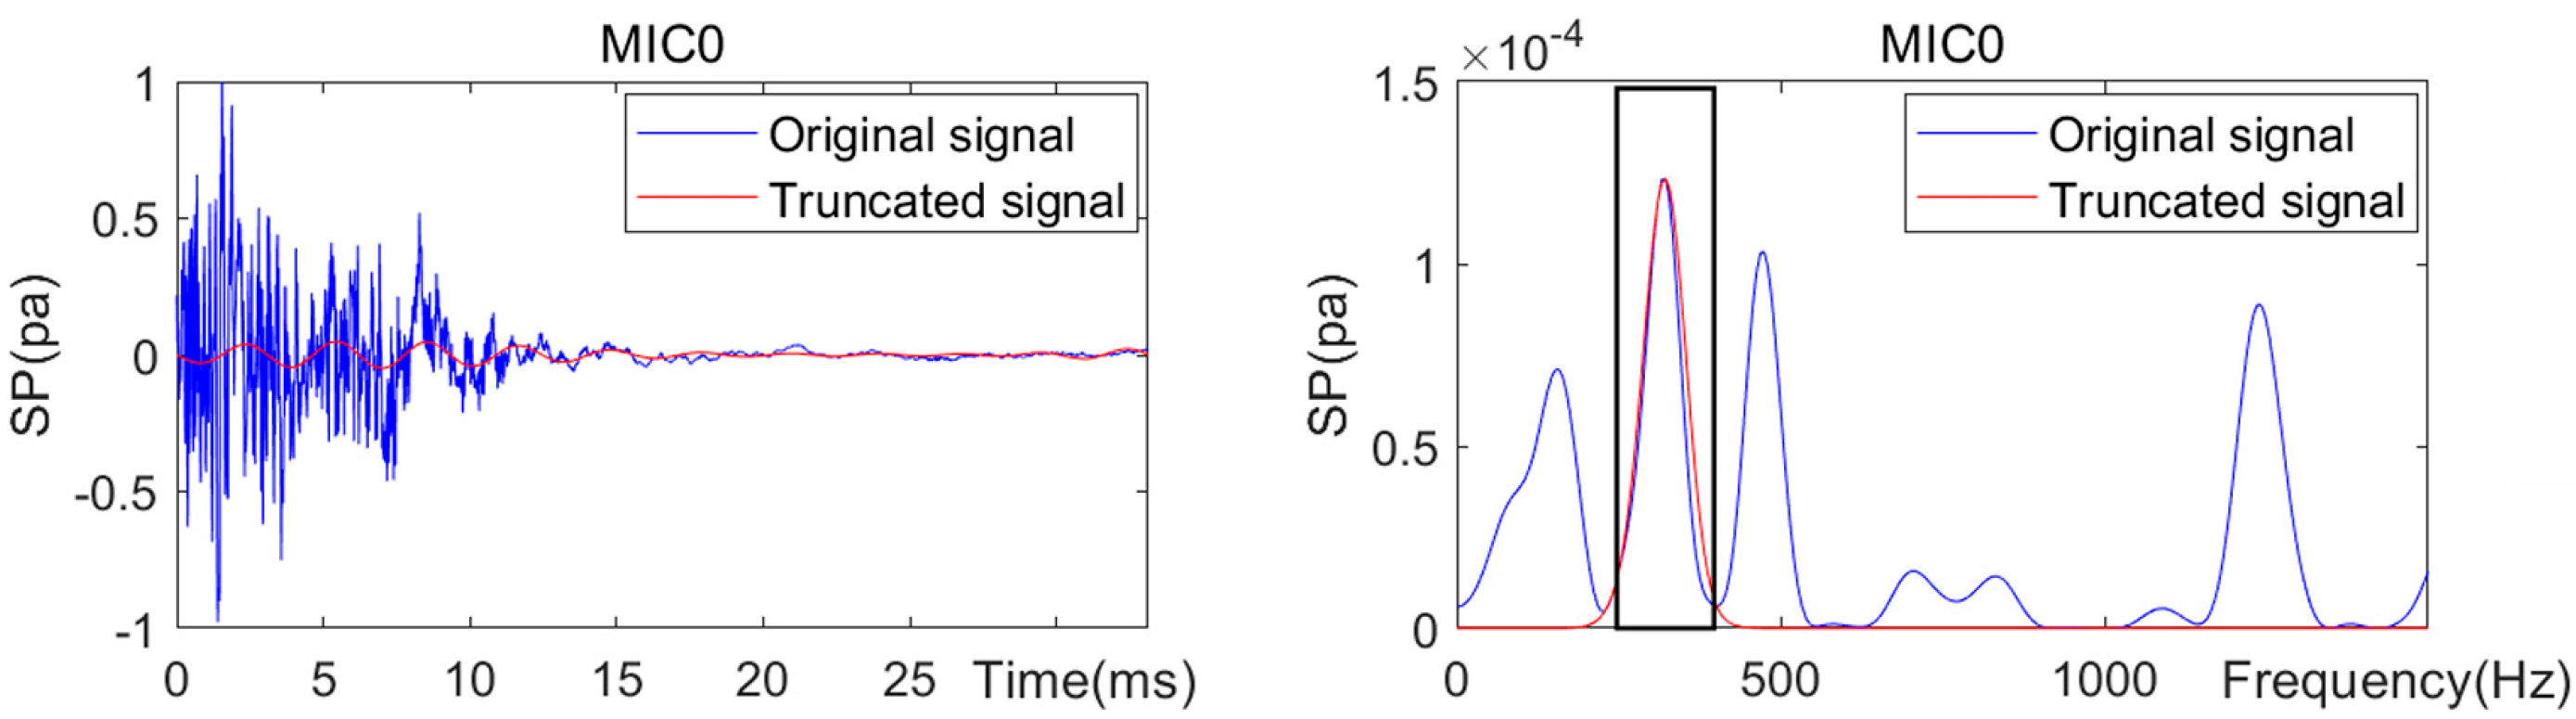
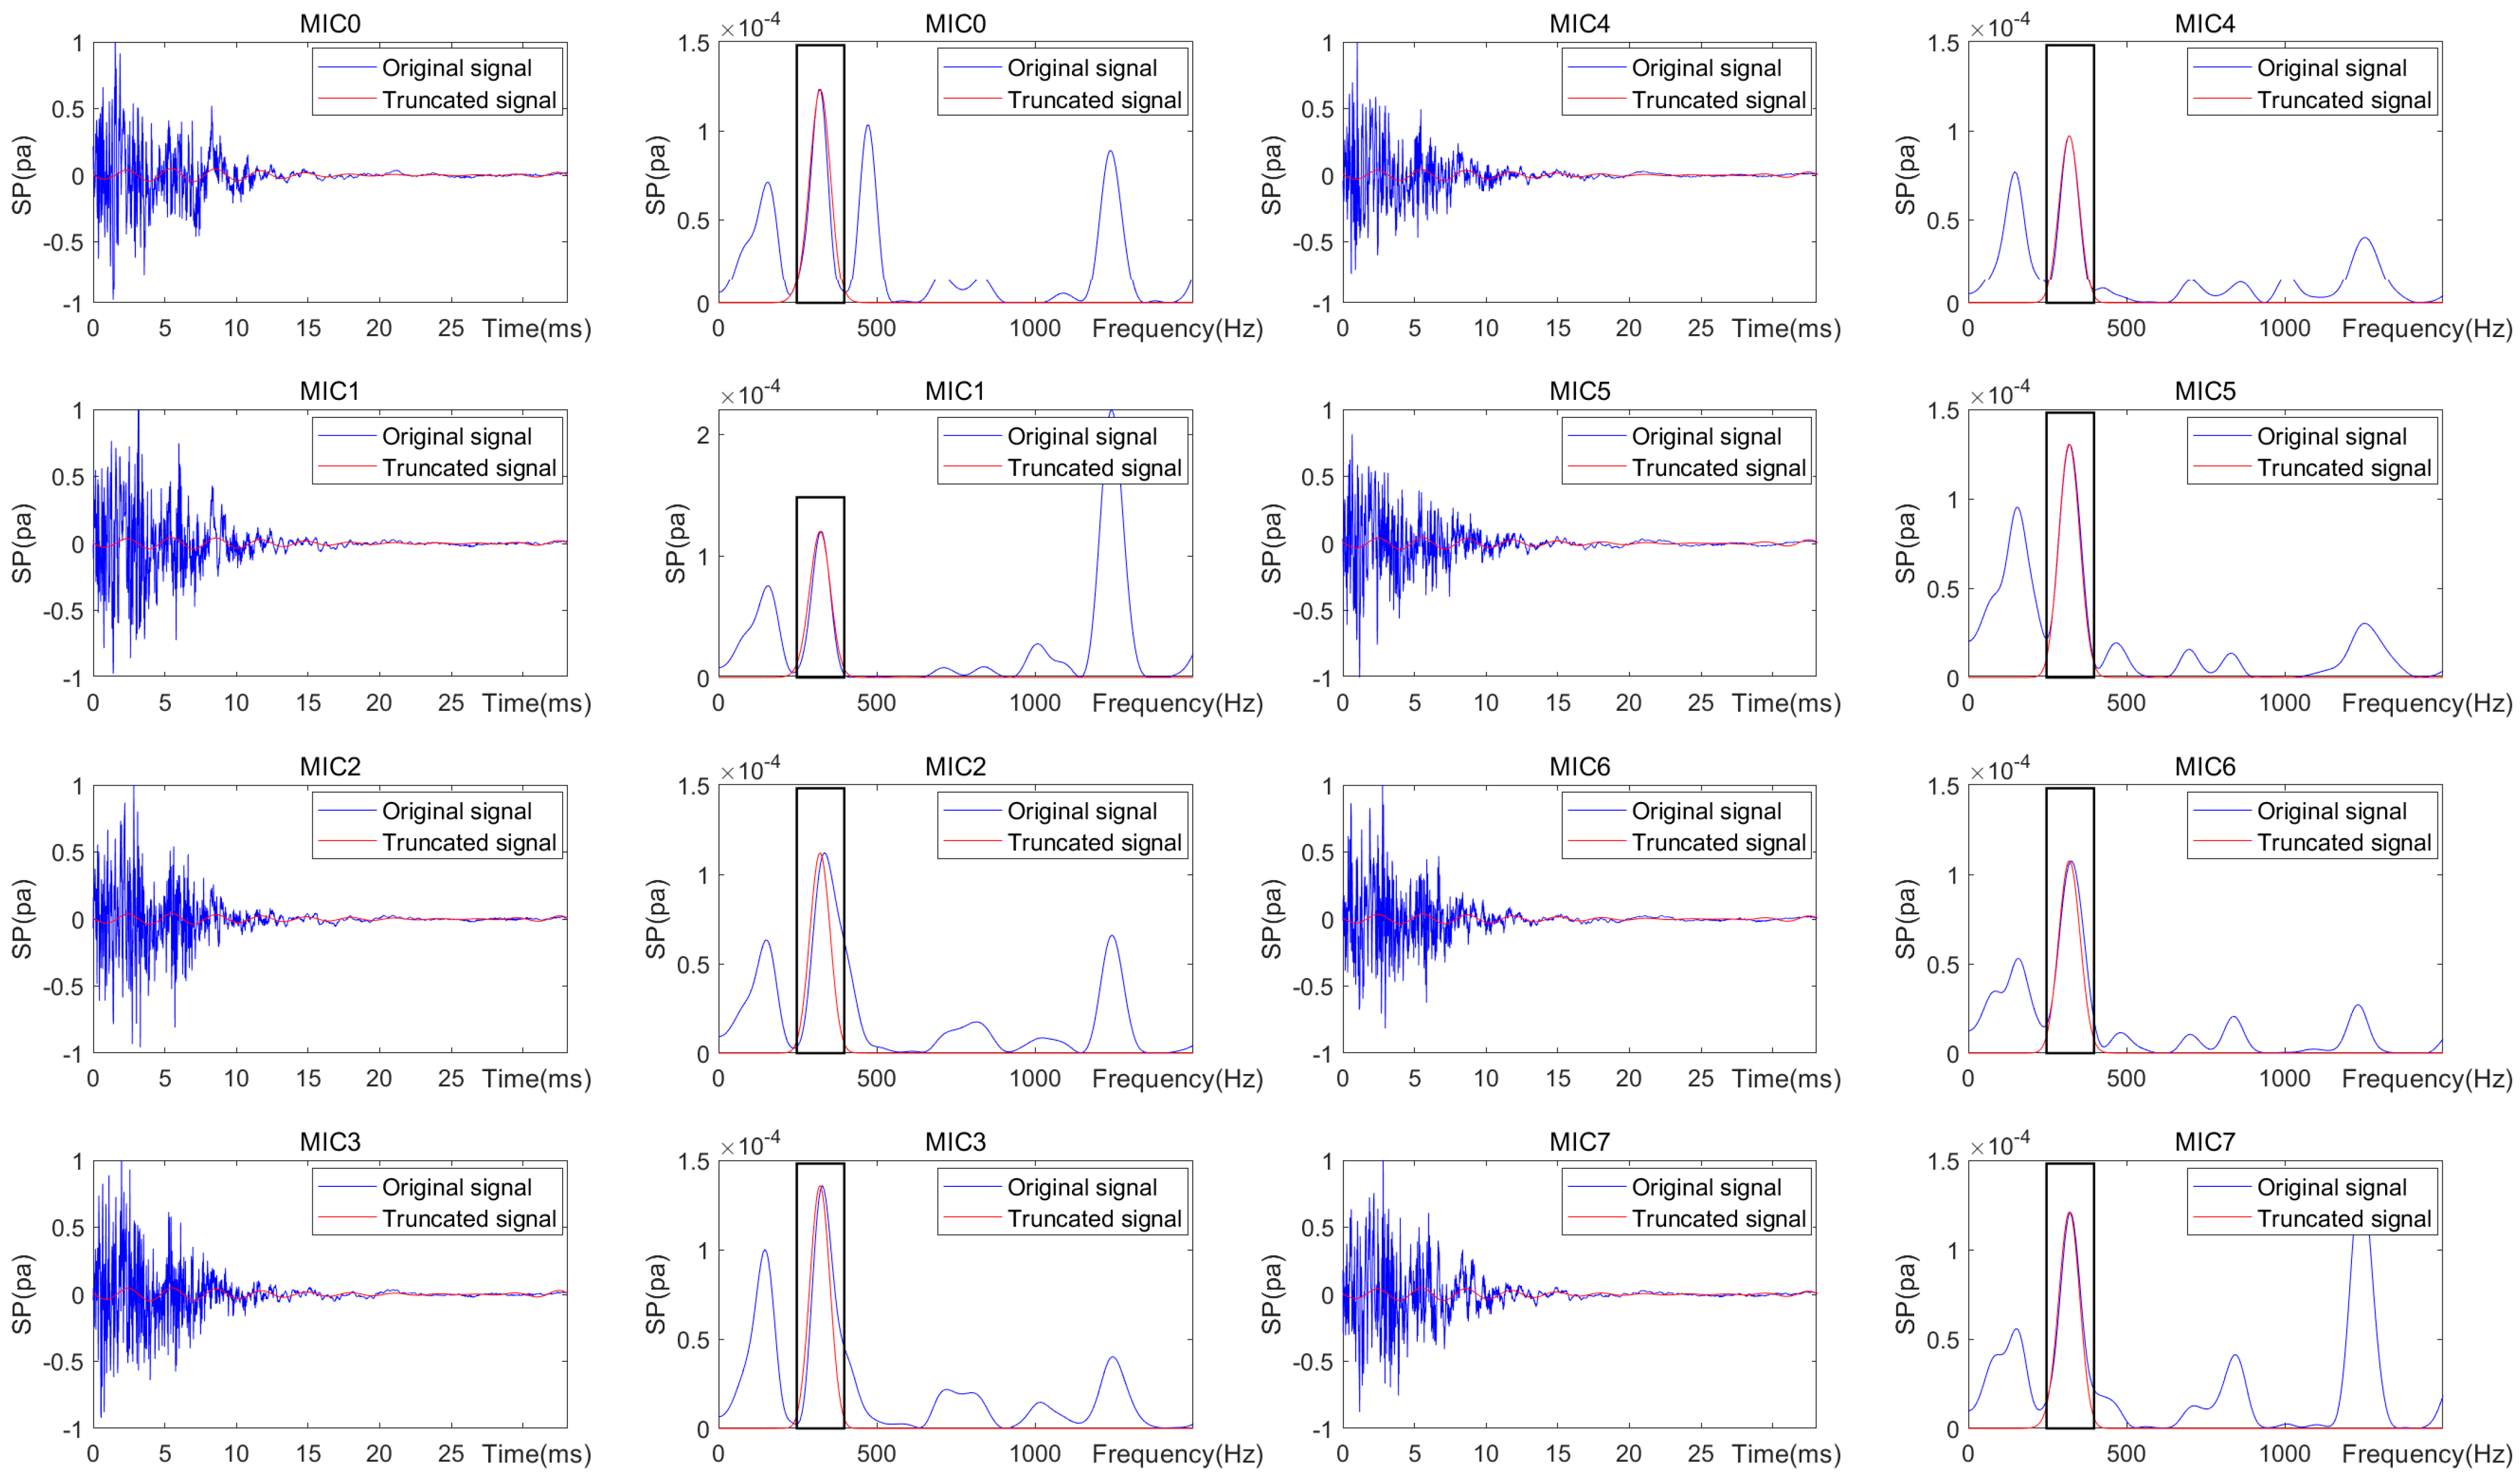
2.4.2. Extraction of First-Order Modal Response Under Mechanical Vibration Interference

This study introduces a band-pass filtering technique aimed at separating mixed interference signals that include modal response ( f 1 ), mechanical vibrations ( f 2 ), environmental noise ( f 5 ), and residual action interference ( f 3 ). Firstly, by power spectrum analysis, the fundamental frequency f 0 of the most energetic first-order mode ω 1 in the signal is determined, and a band-pass window with a bandwidth of 150 H z ( f 0 ± 75 H z ) is constructed centered on it; subsequently, combining rectangular and Gaussian window functions, the frequency-domain energy within the hybrid band-pass filter is weighted and reconstructed to extract the first-order mode ω 1 . This method effectively suppresses out-of-band mechanical vibration f 2 , broadband environmental noise f 5 , and motion interference f 3 by extracting the fundamental frequency-domain energy.
The proposed band-pass filtering method utilizes frequency-domain energy selection as an algorithm to estimate the fundamental frequency by maximizing the weighted energy in complex interference scenarios. Its main focus is on enhancing the local signal-to-noise ratio in the power spectrum and applying frequency-domain adaptive weighting. The search for the fundamental frequency is framed as a constrained optimization problem, which is defined as follows:
f 0 = ( ρ ( f ) ) f f m i n , f m a x a r g m a x    
where ρ ( f ) is the power spectral density; f m i n is the lower limit of the fundamental frequency search; and f m a x is the upper limit of the fundamental frequency search. The constraint f m i n , f m a x on the search interval, which is derived from the physical properties of the system, restricts the potential frequencies. This helps to prevent false positives that may arise from noise-related spurious peaks and enhances computational efficiency.
Additionally, a mathematical formulation for a dynamic bandwidth adaptive filter is introduced as an enhancement and optimization of the original hybrid window technique. This new formula maintains the combined features of the rectangular-Gaussian window while incorporating a mechanism for dynamic parameter adjustment to address non-stationary interference conditions [34]. The expression is defined as follows:
H f = r e c t f f 0 B · e x p f f 0 2 σ 2 + e x p f + f 0 2 σ 2
where B = 150 Hz is the bandwidth (rectangular window range) [35]; σ = B / 3 is the standard deviation of the Gaussian window, which influences the smoothness of the transition band. Furthermore, the dynamic rectangular window modifies the passband range in real-time, responding to changes in the center frequency f 0 ( t ) and bandwidth B to accommodate frequency drift. The Gaussian window, which is regulated by the relationship between its standard deviation and bandwidth B, maintains a transition band smoothness characteristic of a static design σ = B / 3 .
To address the issue of modal energy distortion resulting from band-pass filtering, a frequency-domain algorithm that focuses on energy calibration has been developed. This algorithm guarantees that the energy of the filtered signal within the specified frequency band aligns perfectly with the energy of the original signal in that same band. The peak power P t a r g e t of the original signal within the desired passband is noted, and the gain g k is modified for up to 10 iterations. The relative error ϵ k = P p e a k . k P t a r g e t / P t a r g e t is calculated between the current peak power and the target (i.e., P p e a k . k = P k ( f ) f [ f L , f H ] max   ). If the precision criteria are not achieved, the gain is adjusted using an exponential coefficient of 0.5 to avoid overshoot oscillation and to ensure the conservation of energy in the frequency domain. The flowchart illustrating this process is presented in Figure 8.
Finally, this study introduces a constrained energy compensation approach, which imposes a total energy limit, where E f i l t 1.1 E o r i g . This technique tackles the problems of potential energy overshoot and transient distortion that could occur due to frequency-domain filtering compensation by controlling both the total energy of the signal and its instantaneous peak amplitude. The mathematical formulation of this method is presented as follows:
y f i n a l [ n ] = y f r e q [ n ] · 1.1 E o r i g E f i l t
where E o r i g = | x n | 2 is the total energy of the original signal; E f i l t = | y f r e q [ n ] | 2 is the total energy of the frequency-domain compensated signal. The total energy constraint term 1.1 E o r i g E f i l t ensures that the energy of the compensated signal does not surpass 1.1 times that of the original signal (i.e., E f i l t 1.1 E o r i g ). By applying a square root operation, the energy ratio is transformed into an amplitude scaling factor, which helps avoid excessive noise amplification during frequency-domain compensation. This approach, along with the earlier steps, creates a three-stage processing sequence: “frequency-domain extraction-energy calibration-energy constraint.” This design improves robustness by implementing a closed-loop regulation system.

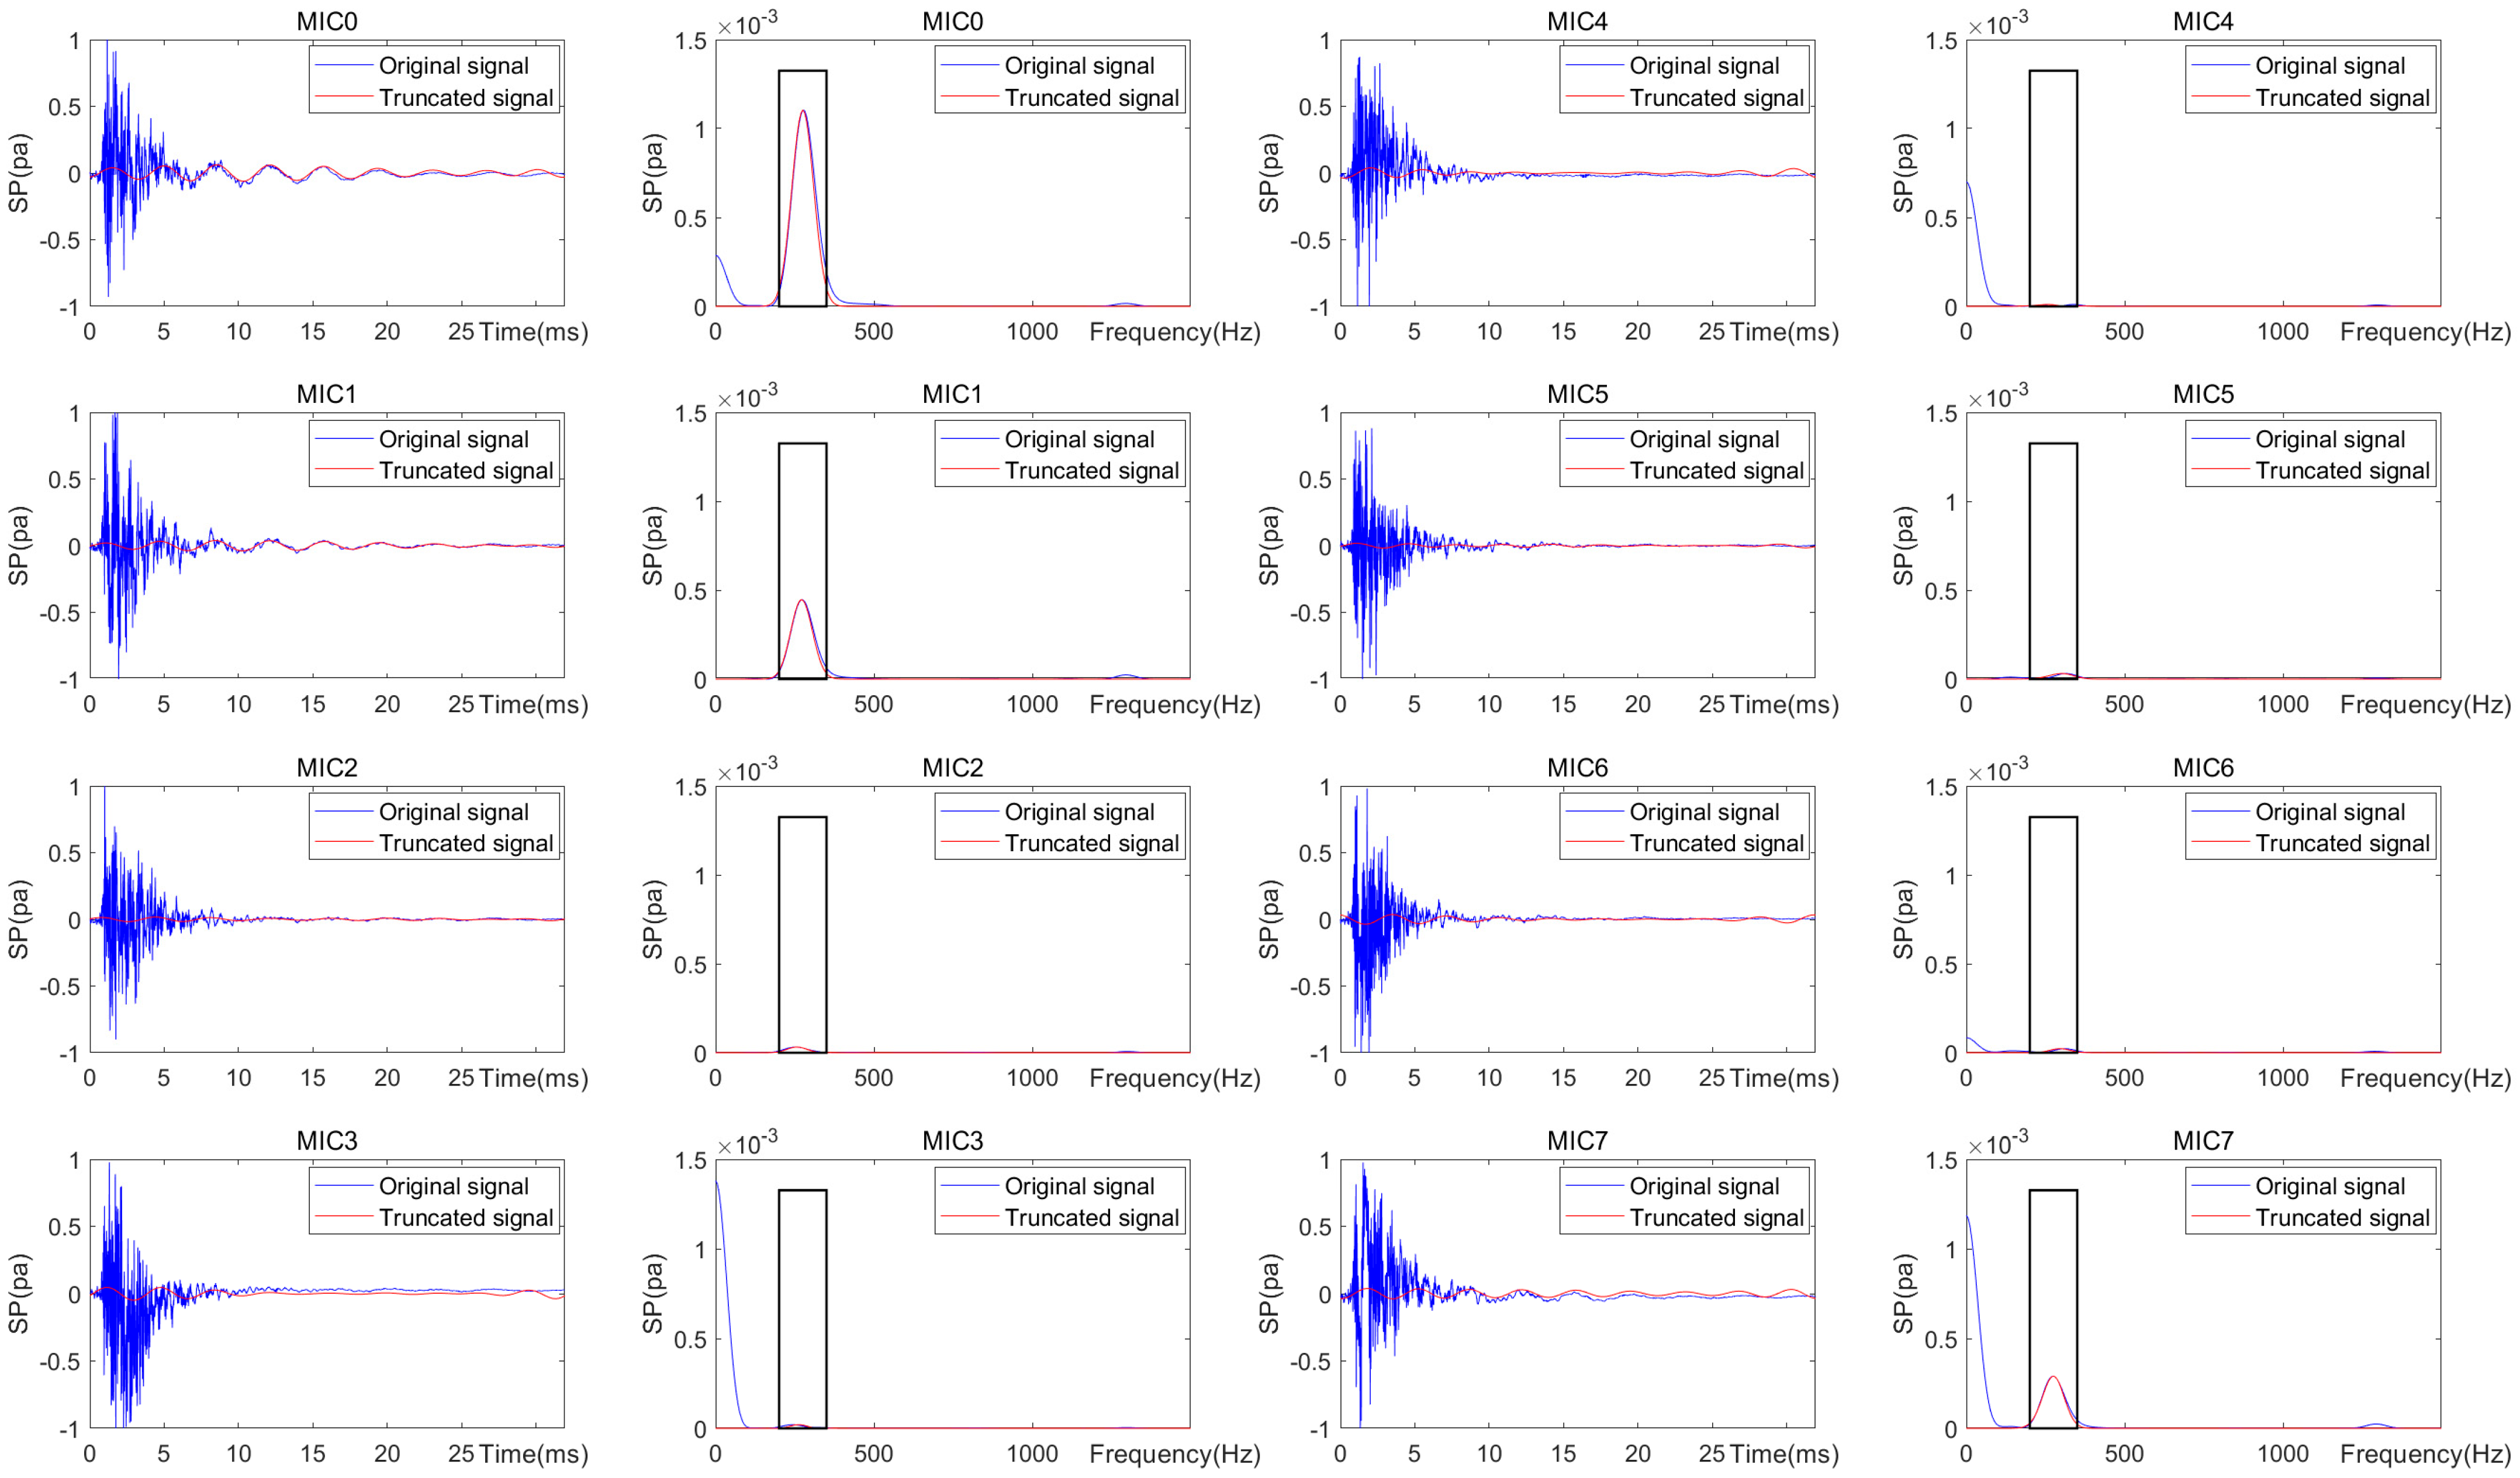
2.4.3. Selection of the Maximal Gradient

In a given excitation location, within a single excitation event, for the acoustic data collected by the MIC array, MIC values closer to the center of the thin plate record a larger maximum frequency-domain value of the modal response; conversely, MIC values farther from the center of the thin plate record a smaller maximum frequency-domain value of the modal response. By calculating the pairwise differences among the eight modal f 1 signals, the direction with the largest gradient corresponds to the center and non-center directions. The formula for calculating the gradient is:
x i j = | x i x j | 0 i < j 7 m a x  
where x i and x j represent the peak amplitudes in the frequency domain of the first-order mode collected by the i -th and j -th MICs, respectively. By calculating the difference between x i and x j , the gradient difference of the first-order modal response between the spatial positions of the two MICs can be obtained. By calculating the gradient differences among all MICs in the array, the first-order modal gradient field distribution across the entire area covered by the MIC array can be constructed.

3. Simulation Analysis

A beam model measuring 10 m in length was created using Comsol 6.3 as the simulation platform. The forced vibration point was positioned at 5 m, and both ends of the beam were secured. Figure 9 illustrates the forced vibrations occurring at 6 m and 9 m following the transient vibration.
It can be noted that at the same vertical position, the amplitude of forced vibrations at 6 m is considerably greater than at 8 m. This confirms the behavior seen in the beam model, where the energy of vibration waves diminishes as they travel further, as shown in Figure 10.
A concrete specimen model measuring 2 m × 2 m × 0.3 m was established, with a cylindrical void 1.5 m in diameter and 0.2 m high embedded within it. The planar centers of both the specimen and the void coincided, and this point was designated as the origin, thereby forming a circular thin plate 0.05 m thick, as shown in Figure 11.
The excitation is substituted with a point load F ( t ) , and its representation is:
F t = D sin ( π t t c ) 2 , 0 t < t c 0 , t > t c
where D is the amplitude of the excitation and t c is the duration of the excitation.
Figure 12 illustrates the setup of the excitation source and MIC array. In the XY-axis configuration, an 8-element MIC array was created with the excitation point at the center, featuring a radius of 47 mm, and the MICs were spaced at 45° intervals. For the YZ-axis, the excitation source was located on the surface of the concrete specimen, and the MIC array was set 15 mm above that surface.
It is evident that the sound pressure recorded by MIC0 for the first-order modal is significantly higher than that recorded by MIC4, resulting in a distinct gradient difference. Additionally, the sound pressure from MIC0 represents the highest value in the array, while MIC4 captures the lowest value. For the three pairs of MICs (MIC1 and MIC7, MIC2 and MIC6, MIC3 and MIC5), the sound pressure levels are similar, and their waveforms overlap (MICs 1, 2, and 3 were shifted 10 Hz to the right for better clarity). There are also noticeable gradient differences among these groups, as shown in Figure 13.

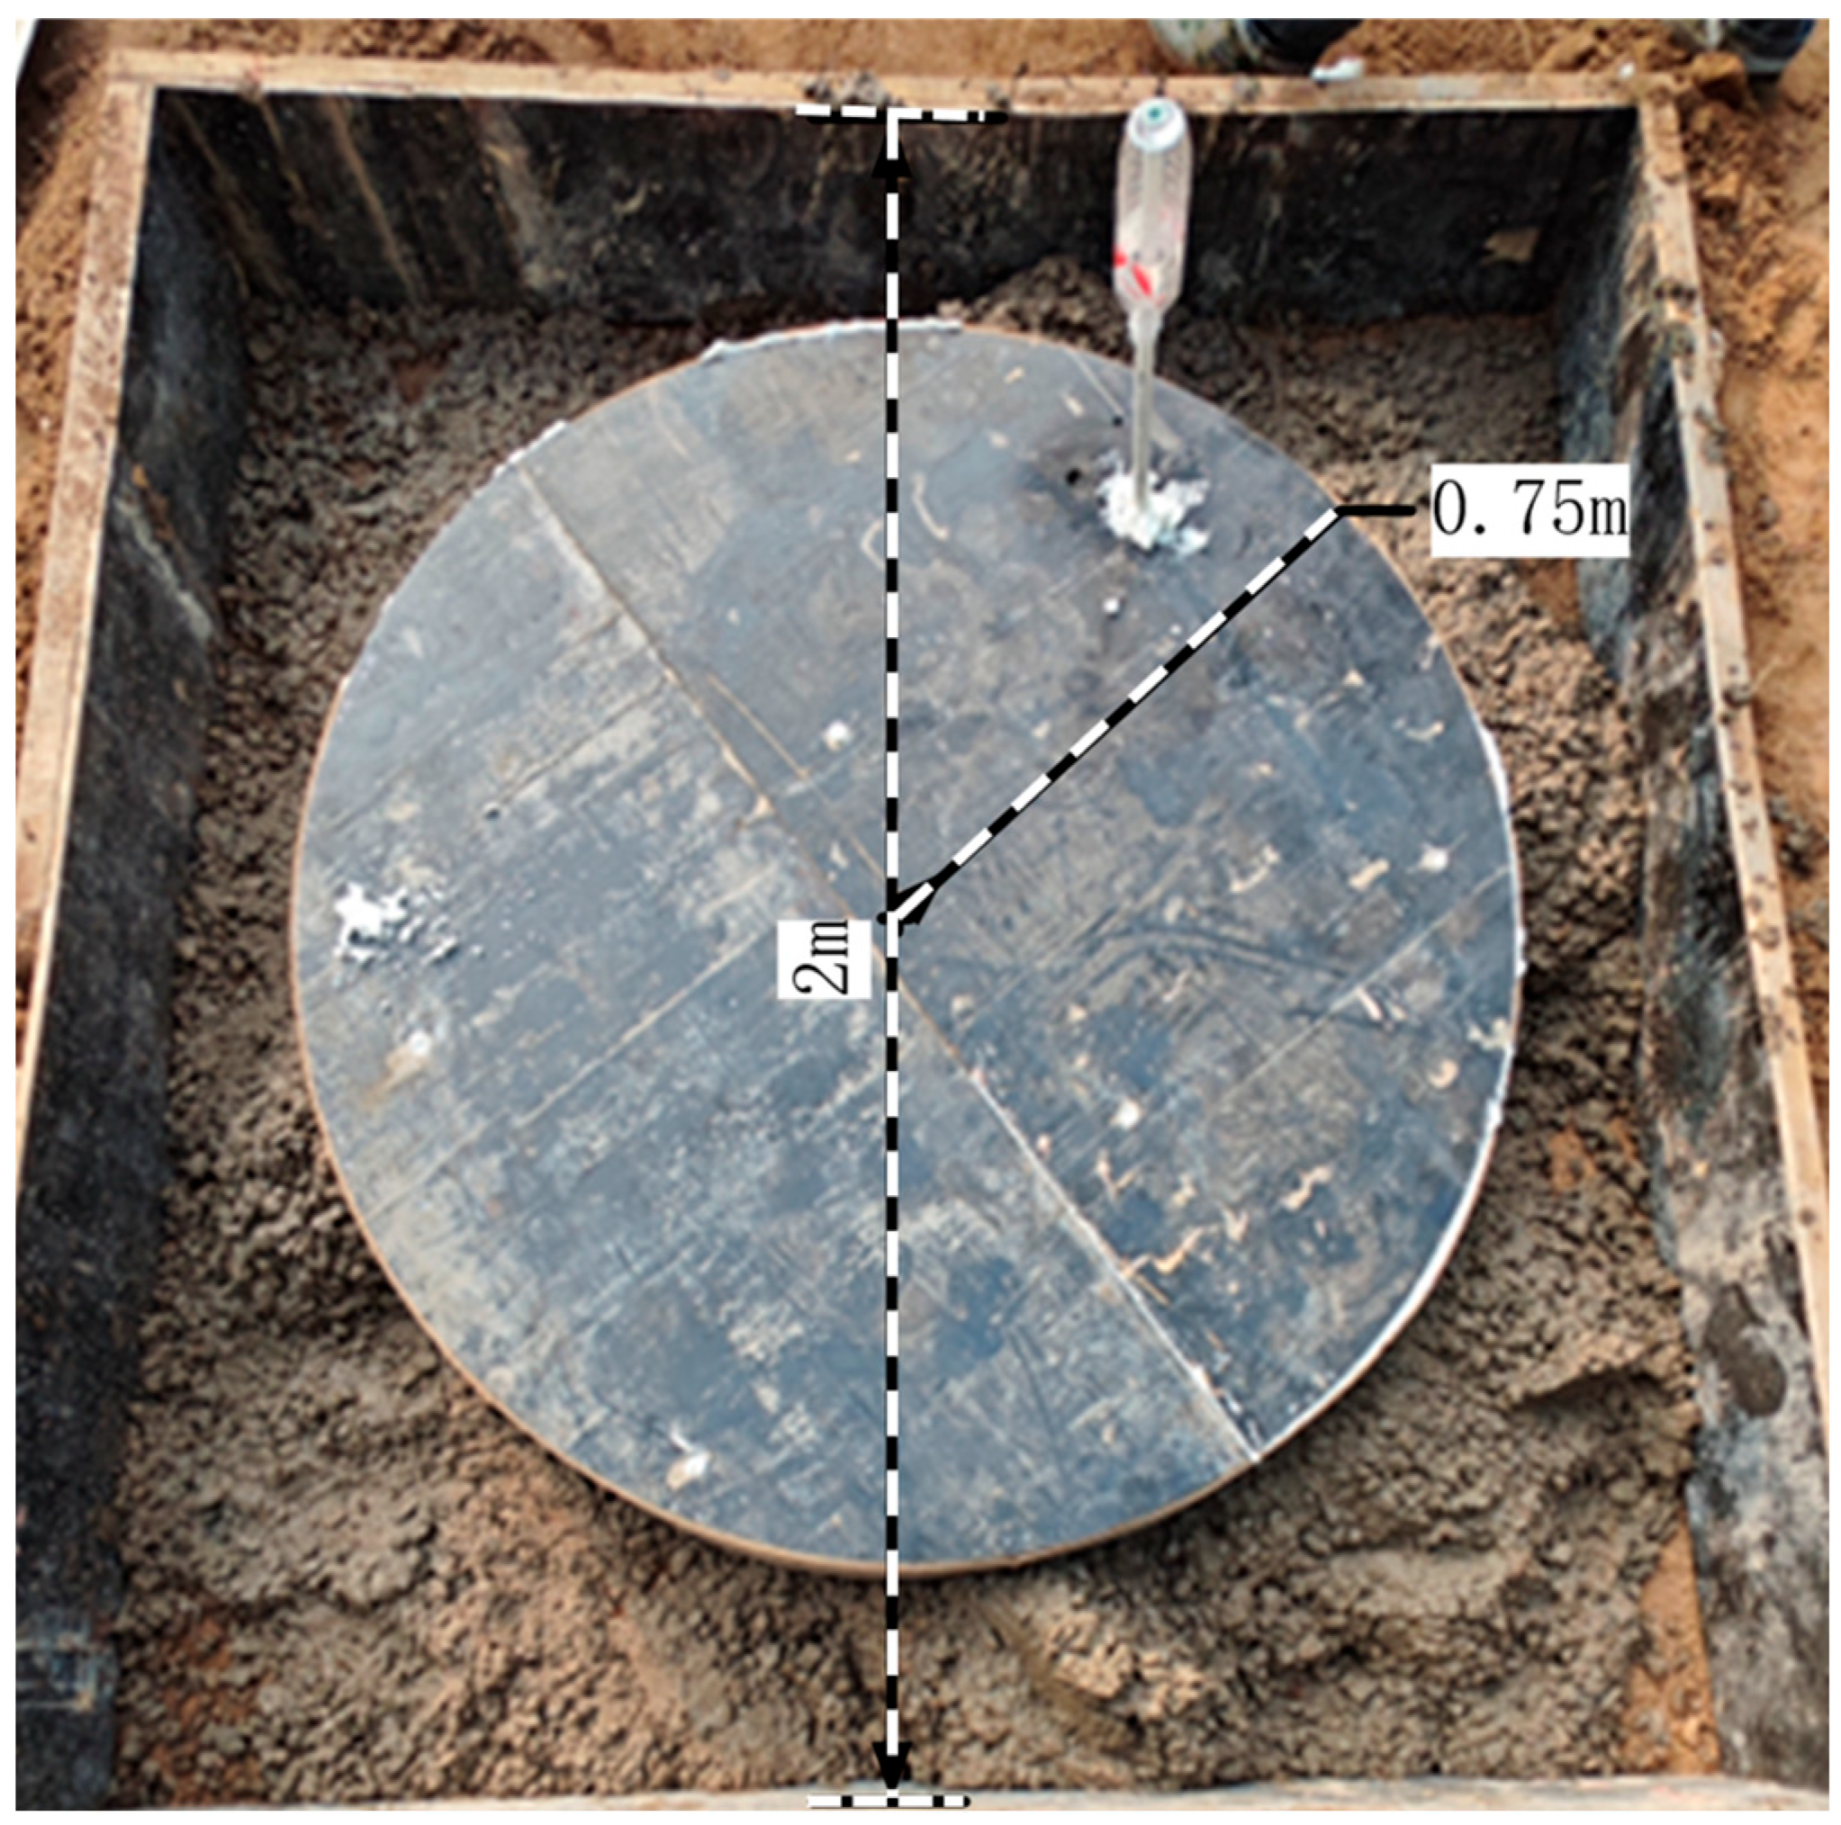
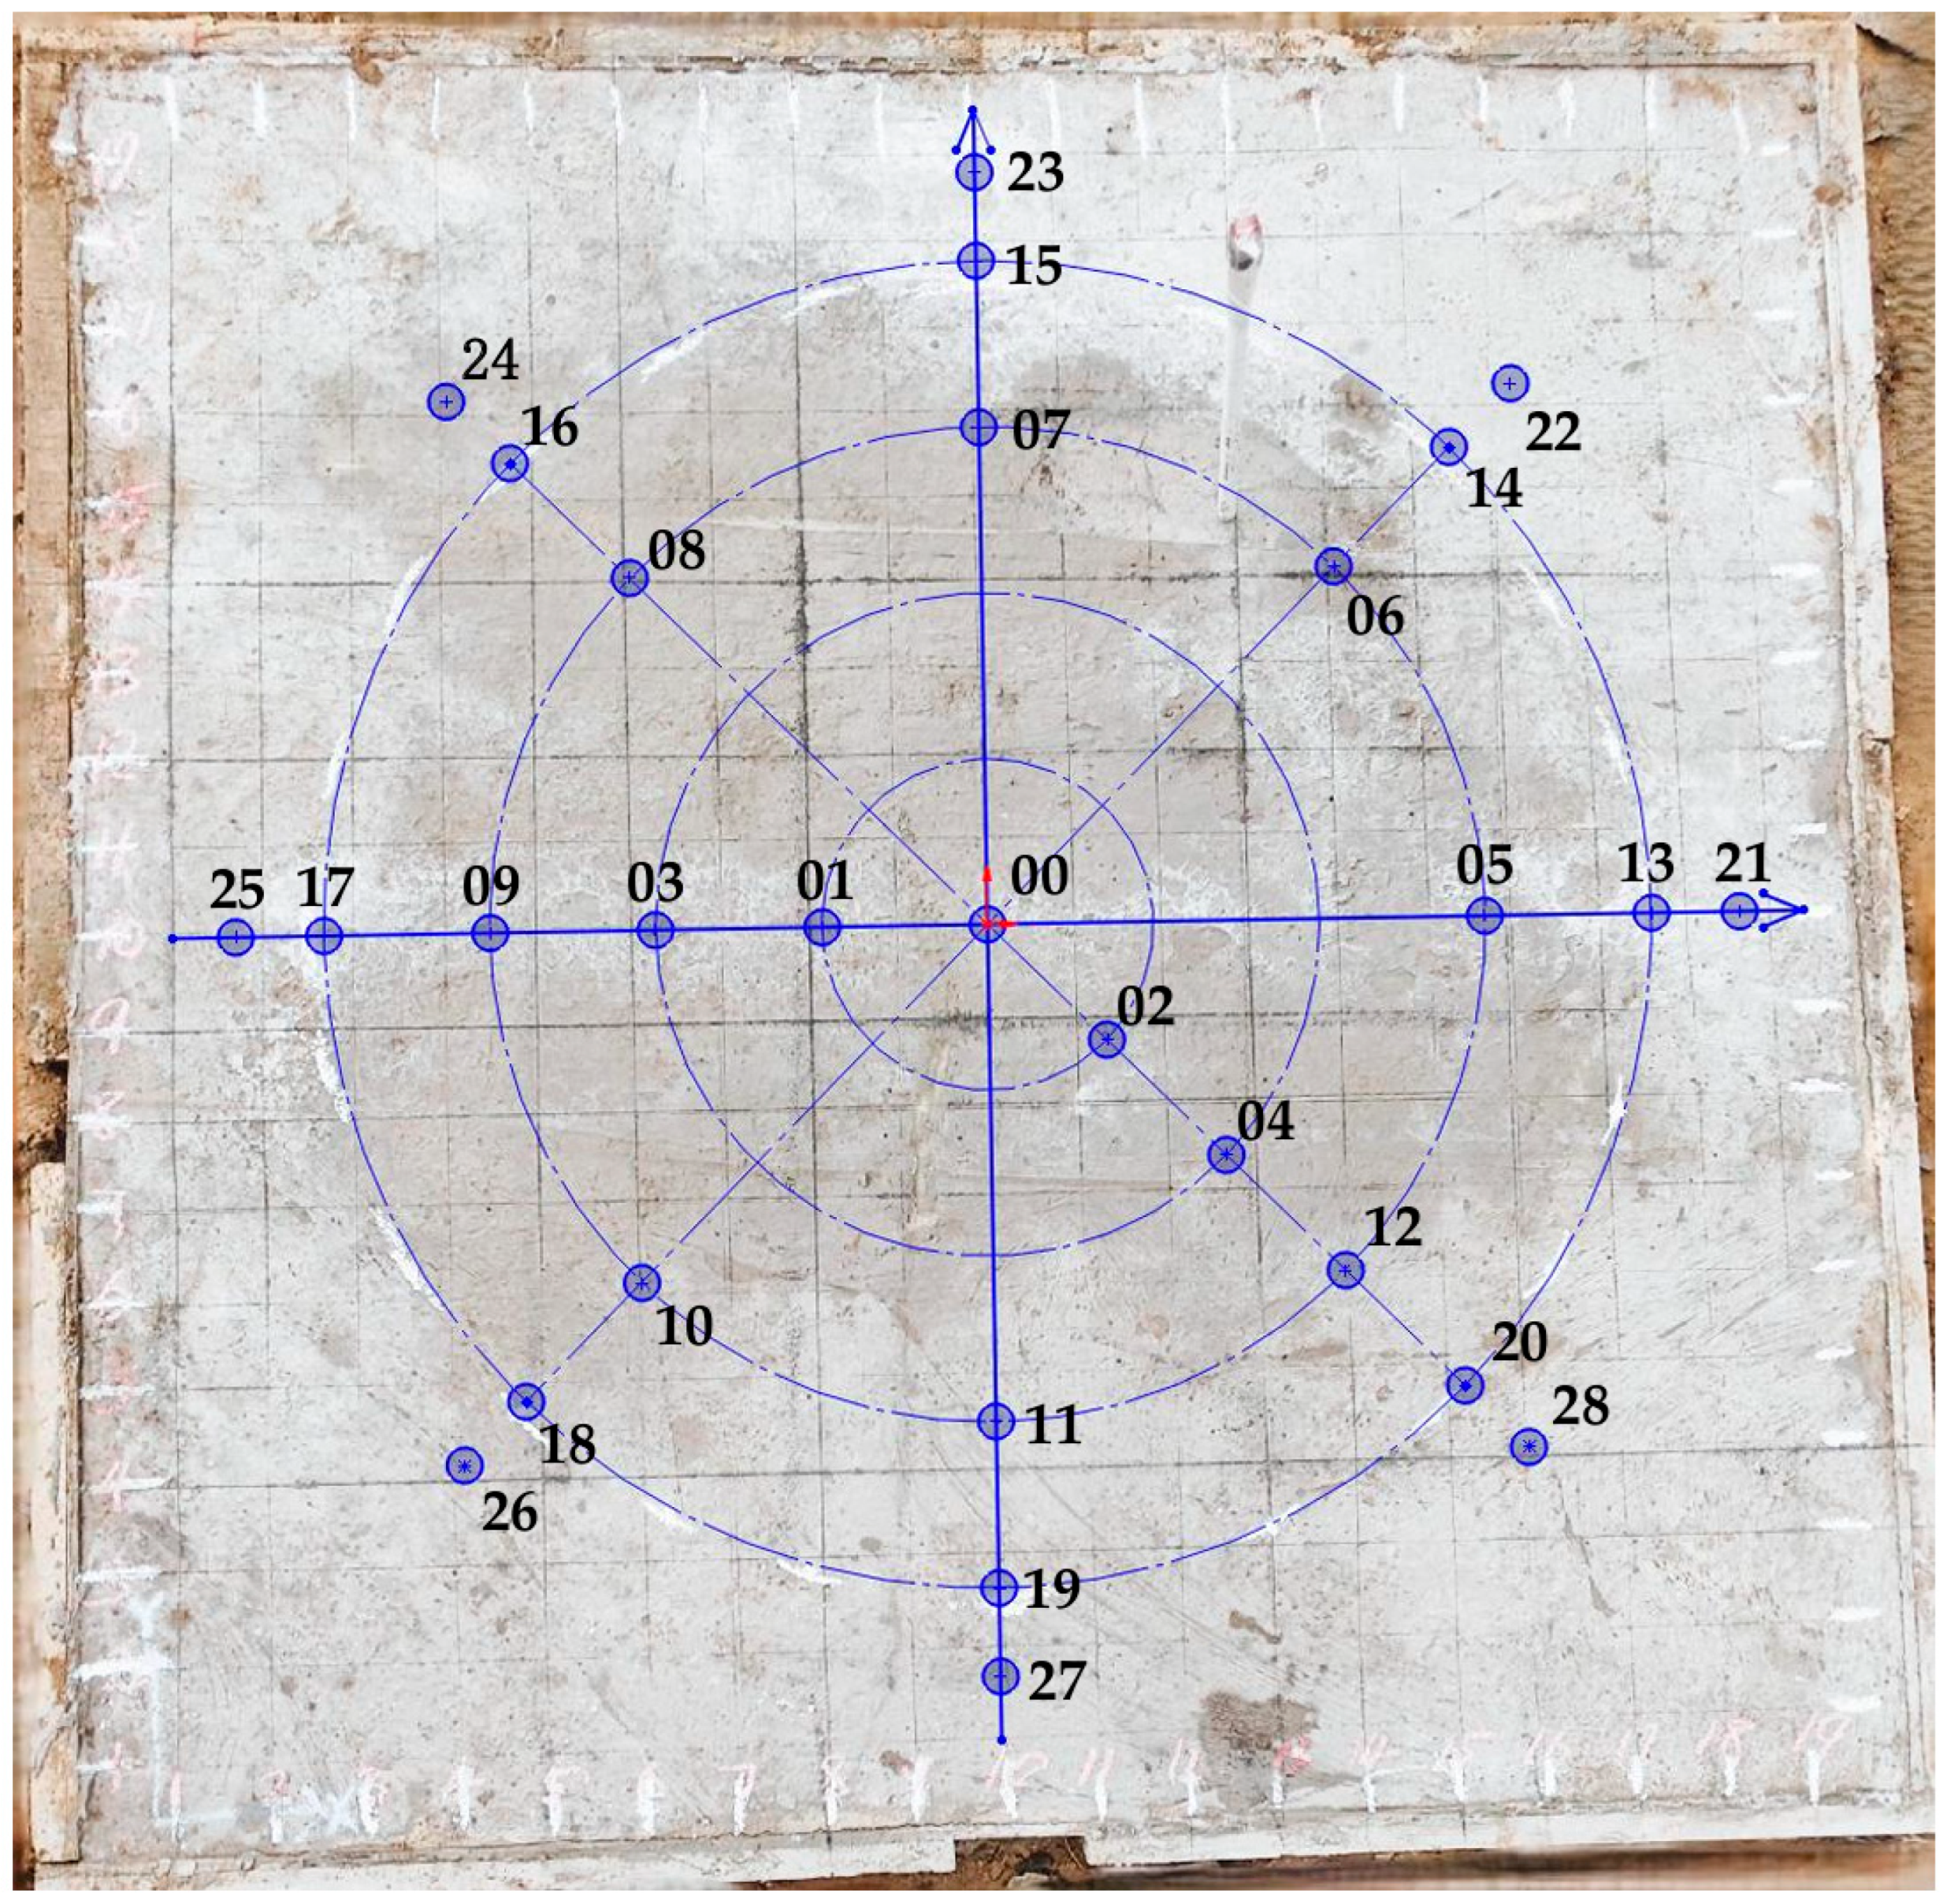
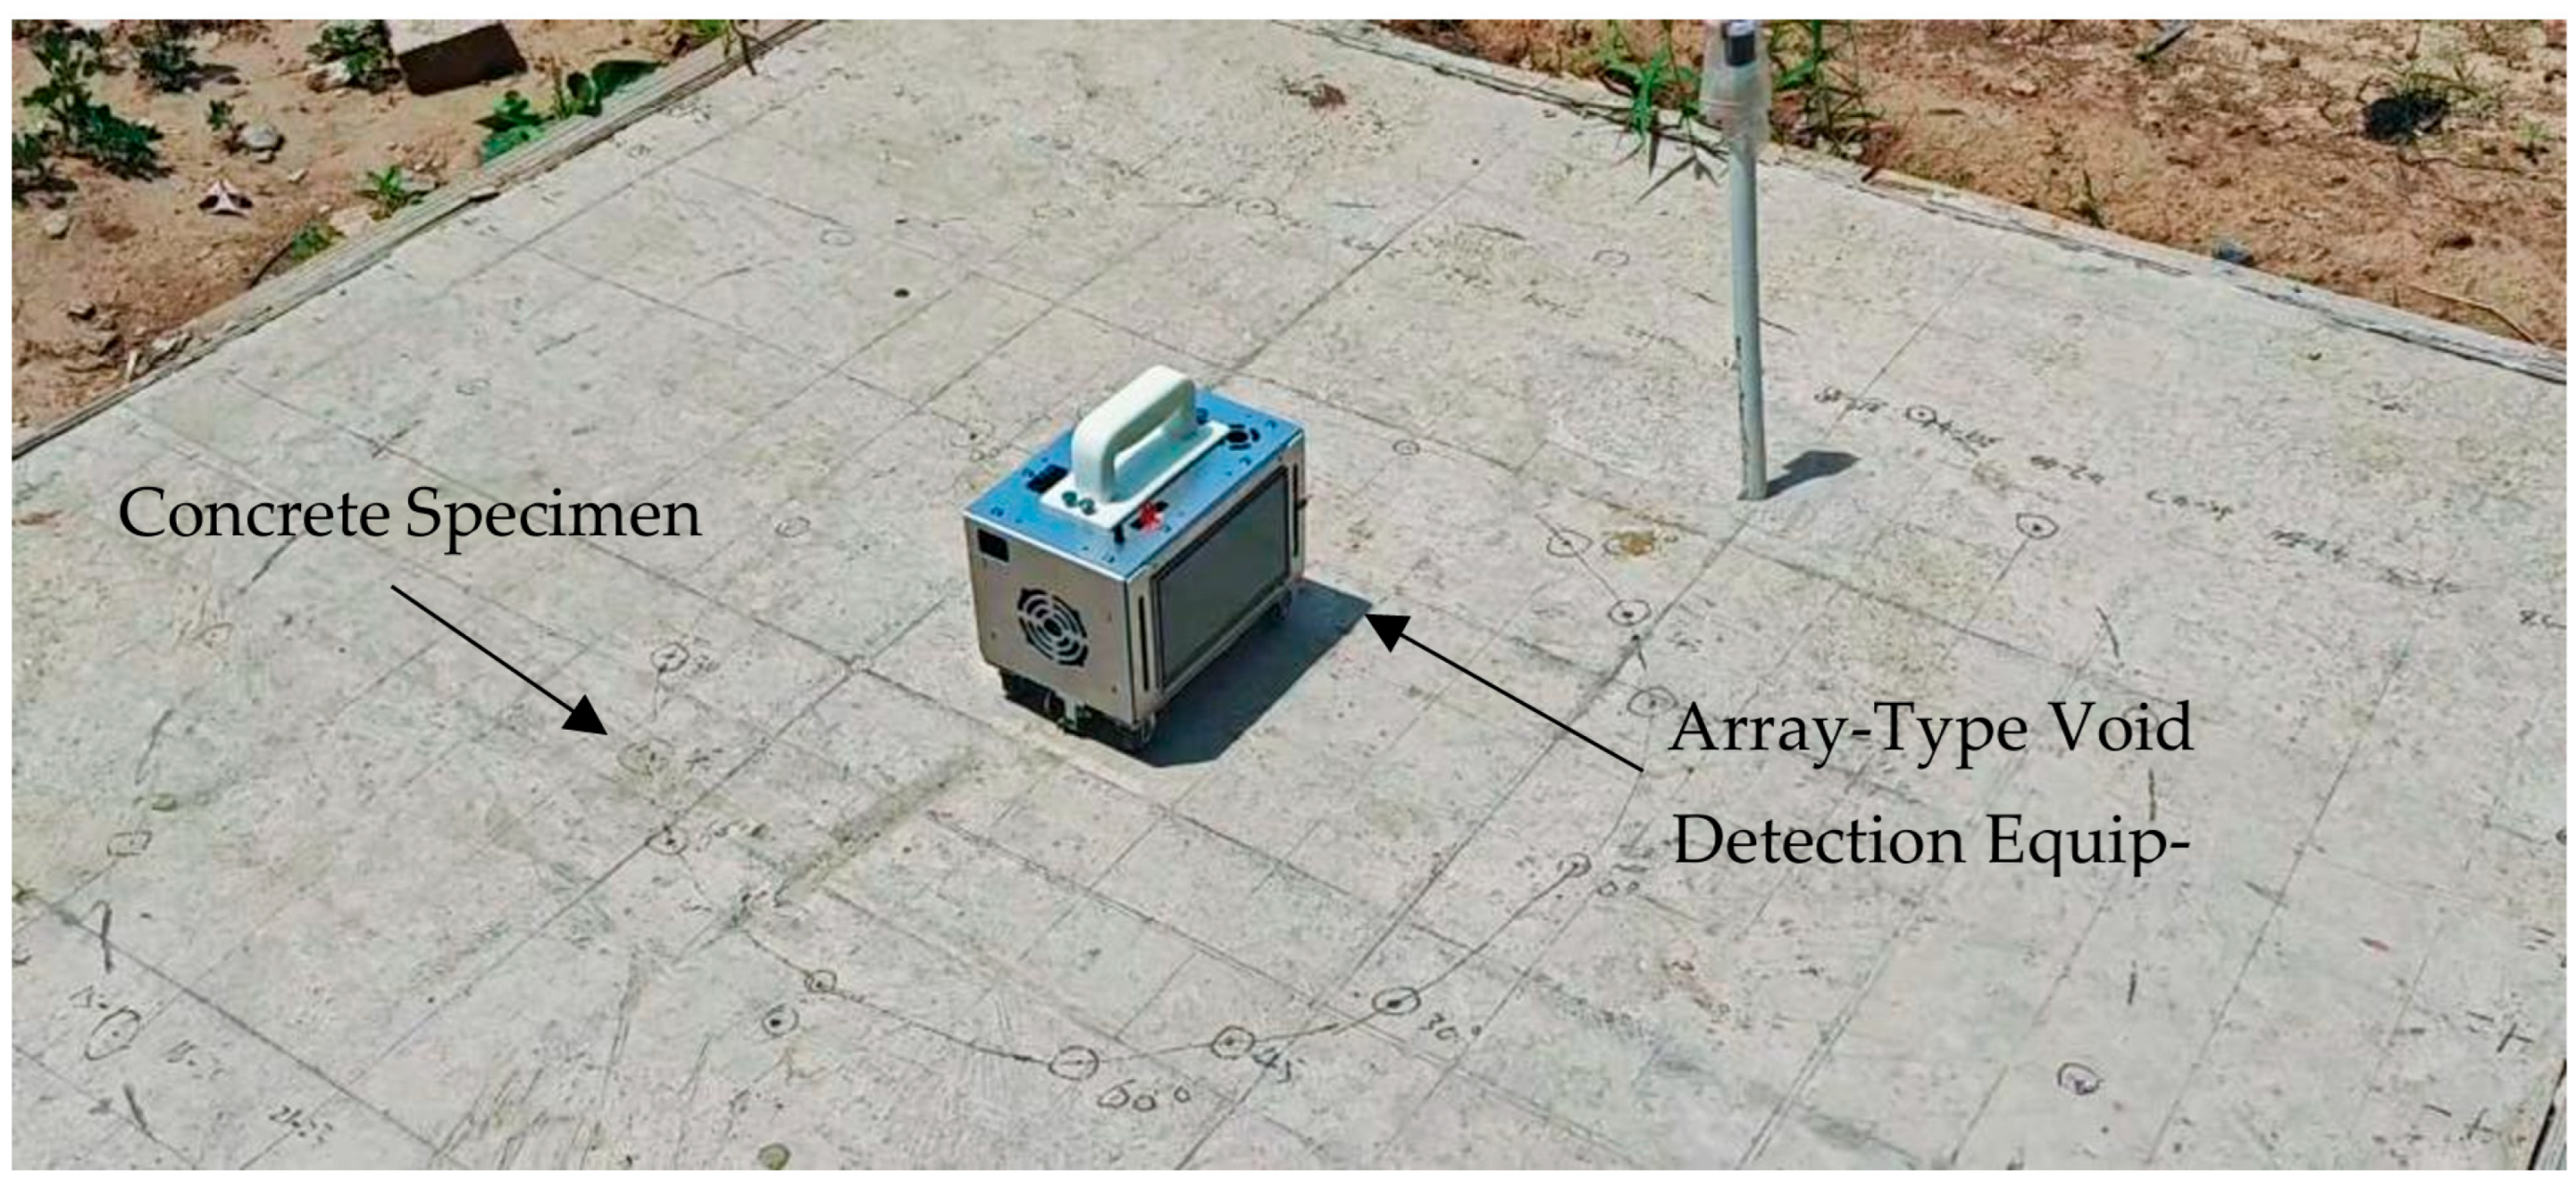
4. Concrete Specimen Experiment

Concrete is an engineered composite material that uses cement as a cementing material, combined with coarse and fine aggregates and water to form a matrix. Through scientific proportioning, mineral admixtures and chemical additives are incorporated, and after processes such as precise measurement, uniform mixing, dense molding, and standard curing, it ultimately hardens to achieve its designed strength.
The concrete specimen cast in this research is a rectangular prism measuring 2 m × 2 m × 0.3 m. Inside, a wooden board with a radius of 0.75 m and a height of 0.2 m was used to simulate a void, thereby constructing a circular thin plate concrete specimen, as shown in Figure 14.
An XY-axis coordinate system was created with the circle’s center as the origin. Measurement points were established every 45° in a counter-clockwise manner. Based on the diameter, these points were designated at one-eighth, two-eighths, three-eighths, the boundary, and the solid section, as shown in Figure 15. Measurement point 00 is located at the center, while points 01 and 02 are positioned at one-eighth of the diameter in the 180° and 315° directions, respectively. Points 03 and 04 are at two-eighths of the diameter in the same directions. Points 05 through 12 are located at three-eighths of the diameter in various directions. Finally, points 13 through 21 are situated at the boundary in different directions, and points 22 through 28 are at the solid section in various orientations.
An electromagnet model JX1253 was used as the excitation source. Eight MICs of model MSM261S4030H0R were employed, with a sampling rate set at 48 kHz. The MIC array was configured with the electromagnet as the center, a radius of 47 mm, and MICs arranged every 45°, positioned 15 mm above the concrete surface. When the concrete specimen surface was tapped, the MIC array collected acoustic signals. During the experiment, MIC0 was oriented toward the center of the circle, meaning MIC4 was oriented toward the boundary, as shown in Figure 16.

5. Data Processing and Analysis

This research thoroughly examines the characteristics of acoustic signal attenuation in thin-plate structures using a spatial gradient analysis approach. Initially, a polar coordinate system was created with the center of the circle as the reference point, and specific measurement points (02, 04, 12, 20, and 28) were chosen along the 315° direction as representative samples. By analyzing the changes in sound pressure gradients along the radial distribution, an acoustic signal attenuation model was developed, which extends from the center of the structure to the edge of the thin plate and into the concrete solid area.
Additionally, a comprehensive multi-angle study was performed: the circular thin plate was segmented into eight directions, starting from the 0° reference point and increasing by 45° increments. In the anisotropic analysis, the emphasis was on investigating the gradient distribution of acoustic parameters at three key measurement locations: one-eighth of the diameter, the edge of the thin plate, and the concrete solid region.

5.1. Data Preprocessing

To effectively capture and extract time domain features from acoustic signals, dynamic extremum tracking and adaptive window width adjustment can facilitate efficient interception. For instance, at measurement point 00, as shown in Figure 17, a 5 s original signal is globally scanned using a noise suppression algorithm. This process intelligently identifies the main burst point of the sound pressure pulse and expands outward to create an elastic time window. The system then automatically modifies the interception boundaries to ensure that the signal’s modal response and mechanical vibration are accurately retained, while minimizing rebound interference, most action interference, and environmental noise. This approach incorporates a multi-measurement point linkage mechanism, enabling precise differentiation of the signal’s modal response and mechanical vibration even in fluctuating noise conditions, thereby achieving high-fidelity restoration of transient features.
Experiments show that the optimized interception window greatly improves the ability to distinguish acoustic features, yielding high-quality time-domain samples for further gradient analysis.
Using the vibration data from the center of the circle as an example, the blue curve in Figure 18 illustrates the original signal, which encompasses modal response, mechanical vibrations, environmental noise, and some residual interference. The red curve represents the outcome after modal separation, isolating only the first-order modal component. A comparison reveals that the wide-band random fluctuations (blue) in the original signal are significantly reduced after processing, resulting in a time-domain waveform that displays clear single-frequency oscillation characteristics (red). In the spectrum, the prominent red peak distinctly emphasizes the fundamental frequency energy, while out-of-band noise is minimized. This preprocessed data are suitable for direct gradient processing analysis.

5.2. Analysis of Central Measurement Point Data

Once the time-domain feature extraction is finished, this study proceeds to apply a frequency-domain energy-weighted modal reconstruction technique. To focus on the fundamental frequency, a band-pass filter bank is created, centering on the target fundamental frequency with a symmetrical passband of ±75 Hz, resulting in a 150 Hz spectral window. The energy in the frequency domain within this window is then analyzed using the Gaussian window standard deviation criterion to reconstruct a clean 1st-order modal response, as shown in Figure 19 (SP (sound pressure) refers to the instantaneous pressure deviation at a point in the medium relative to its static pressure during sound wave propagation).
A comparison of the spectral distributions between the original (blue waveform) and processed (red waveform) signals shows that mechanical vibrations have been successfully reduced, demonstrating the method’s ability to separate modes. Additionally, we observed that the amplitude fluctuation rate of the full-domain MIC array is minimal, and its gradient field distribution shows isotropic properties. This observation is consistent with the symmetry theory, validating the modal responses in the concrete, circular thin-plate medium when excited by a central source, which offers a dependable physical standard for accurate boundary identification, as shown in Table 1.

5.3. Multi-Channel Acoustic Data Analysis of Axial Measurement Points on High-Order Rotationally Symmetric Structures

In this study, a high-order rotationally symmetric circular thin plate was investigated. The 90° and 315° azimuths were selected as acoustic feature extraction reference axes, and a method for analyzing vibration mode coupling mechanisms based on array-type acoustic sensing was established. In the experimental setup, the main channel of the MIC array (MIC0) was oriented toward the geometric center of the thin plate. Simultaneously, multi-channel synchronous acoustic signal acquisition was performed at measurement points along the axial direction. The measurement points were distributed at three-eighths of the diameter, the thin plate boundary, and the dense concrete section. This design aims to analyze the vibration mode coupling mechanism of high-order rotationally symmetric structures by interpreting the sound pressure gradient distribution.

5.3.1. Ninety-Degree Axial Acoustic Data Analysis

Acoustic signals were gathered in the 90° direction at measurement locations 07 (located at three-eighths of the diameter), 15 (situated at the thin-plate boundary), and 23 (found at the dense concrete section). The analysis primarily concentrated on measurement point 15 (at the thin-plate boundary), with its time-domain and frequency-domain representations shown in Figure 20.
Table 2 displays the experimental data. The sound pressure amplitude recorded by MIC0 is 7.80 × 10 4   P a , while MIC4 has a value of 5.42 × 10 6   P a . This combination of MICs shows the greatest gradient in the array, with a difference of two orders of magnitude, suggesting that MIC4 failed to detect the first-order modal response. This is attributed to the fact that MIC0 is located above the circular thin plate, whereas MIC4 is situated above the dense concrete area. The gradient algorithm successfully pinpointed the boundary of the thin plate.

5.3.2. Analysis of 315° Axial Acoustic Data

In the testing of modal vibration characteristics for a circular thin plate, measurement point 20, located at the edge of the plate, was chosen as the point for impact excitation. A MIC array was employed to simultaneously capture the acoustic response of the structure’s modal vibrations resulting from this excitation. In the experimental arrangement, the MIC0 sensor was placed on the surface of the thin plate, while the MIC4 sensor was situated in a nearby dense concrete area, creating a comparative observation array across different media. Signal processing yielded time-domain waveforms and frequency-domain spectral analysis results (illustrated in Figure 21). This dataset thoroughly documented the energy distribution characteristics of the structure across various vibration modes.
Table 3 displays data from each measurement point in the 315° direction. The sound pressure amplitude recorded by each MIC array channel shows notable spatial distribution characteristics. At measurement point 20, located at the boundary of the thin plate, MIC0 registers a sound pressure amplitude of 1.23 × 10 3   P a , which is significantly higher than that of the other channels, creating a peak in sound pressure within the array. In contrast, MIC4 records a sound pressure amplitude of only 1.06 × 10 5     P a , the lowest among the measurements. This gradient in sound pressure distribution aligns with the experimental setup: MIC0 is positioned above the active vibration area of the circular thin plate, while MIC4 is situated above a dense concrete area. This arrangement results in variations in sound wave formation at different positions in the array, leading to a noticeable gradient in sound pressure amplitude. The findings are in agreement with the vibration model of a circular thin plate with fixed boundaries, where the amplitude energy is highest at the center and lowest at the edges.
In the experiment aimed at identifying the boundaries of voids in concrete, a spatial discrimination criterion for assessing structural health was developed by examining the modal response characteristics of each MIC channel. Channels that displayed a distinct first-order modal peak were found to be situated within the thin plate vibration area. In contrast, channels that lacked a characteristic modal response and exhibited low sound-pressure levels were classified as being in the dense concrete region. As a result, the modal response characteristics gathered from the MIC array during the measurement point 20 impact test effectively pinpointed the void boundary. This approach illustrates the practical application of acoustic modal feature analysis technology for detecting defects in composite structures.
The method proposed in this study significantly breaks through the limitations of traditional non-destructive testing technologies in terms of spatial resolution. Its core advantage lies in achieving high-precision spatial diagnosis of internal void boundaries in concrete structures. This technical path provides a highly promising novel solution for the health status detection and evaluation of critical concrete structures, such as bridge piers, tunnel linings, and dam panels, which are in complex or inaccessible service environments. It holds significant engineering application value and promotion prospects.

6. Conclusions

This paper addresses the challenging problem of boundary identification for internal voids in circular thin-plate-like concrete components (such as tunnel linings, bridge pier caps, etc.) commonly found in concrete structures. A vibration theoretical model of a circular thin plate of concrete under fixed boundary conditions was constructed as the analytical basis. Array technology was employed to address the limitations of traditional detection methods in terms of spatial resolution. Through systematic numerical simulations and rigorous physical model experiments, a novel boundary identification method was thoroughly investigated, leading to the following core conclusions:
  • Adaptive Global Synchronous Time Window Construction Technique: A technique is introduced for creating a global synchronous analysis time window that comprehensively encompasses all relevant acoustic signals from every channel. This is accomplished by accurately determining the start time of the tapping excitation through peak detection of transient acoustic response signals gathered by the microphone array, and by integrating the data from the initial and final moments of the response waveforms observed in each channel of the array.
  • Precise Decoupling of Target Modes from Complex Responses: A new effective algorithm for modal separation is created to tackle the intricate forced vibration acoustic signals that arise from tapping concrete plates, which include multiple modes and noise. This algorithm excels at accurately extracting the first-order vibration modal characteristic signal, successfully eliminating non-target modal information even in the presence of significant background noise.
  • Rapid Identification Method for Defect Boundaries: This method seamlessly integrates MIC array acoustic signal collection technology, acoustic vibration analysis, and gradient field analysis to create a specific method for identifying internal void boundaries based on a gradient field. The essence of this method is in using the extracted pure first-order modal acoustic signals to compute and examine the characteristics of the spatial distribution gradient field.
This study prepared circular thin-plate concrete specimens with pre-set internal voids for model experiments. Experimental results indicate that when tapping excitations are applied radially from the center (measurement point 00) to points at 1/8, 1/4, 3/8 of the radius, and boundary measurement points, the theoretical acquisition time for the corresponding measurement point signals is estimated to be between 1.55 and 2 s. However, when accounting for factors such as equipment movement time and environmental transient interference, the actual measurement time required typically significantly exceeds this theoretical range. At the specimen boundary (measurement points 13 to 20), the first-order modal characteristics exhibit significant gradient differences in the frequency domain. A statistical analysis of the data indicates that this gradient-field-based identification algorithm can effectively and clearly identify the boundaries of voids in concrete thin plates. This approach highlights the practical application of acoustic modal feature analysis technology for detecting defects in concrete structures, showcasing significant potential for application and development.

Author Contributions

Methodology, Y.Y.; Software, P.S.; Validation, P.S.; Formal analysis, Z.Q.; Data curation, S.L.; Writing—original draft, Z.Q. and S.L.; Writing—review & editing, Y.Y.; Funding acquisition, Y.Y. All authors have read and agreed to the published version of the manuscript.

Funding

This research was funded by Natural Science Foundation of Hebei Province grant number E2021210099 and Science and Technology Research Project of Higher Education Institutions in Hebei Province grant number CXY2023003.

Data Availability Statement

The data presented in this study are available on request from the corresponding author. The data are not publicly available due to maintaining data security and integrity.

Conflicts of Interest

The authors declare no conflict of interest.

References

  1. Niu, F.; Liu, Y.; Xue, F.; Sun, H.; Liu, T.; He, H.; Kong, X.; Chen, Y.; Liao, H. Ultra-high performance concrete: A review of its material properties and usage in shield tunnel segment. Case Stud. Constr. Mater. 2025, 22, e04194. [Google Scholar] [CrossRef]
  2. Cao, Y.; Wu, A.-X.; Hou, Y.-Q.; Wang, S.-Y. Calculation model of shotcrete support thickness based on elastic thin plate theory. Case Stud. Constr. Mater. 2022, 17, e01232. [Google Scholar] [CrossRef]
  3. Alsuhaibani, E. Nondestructive testing of externally bonded FRP concrete structures: A comprehensive review. Polymers 2025, 17, 1284. [Google Scholar] [CrossRef] [PubMed]
  4. Xu, M.; Huang, Z.; Deng, X.; Liu, H.; Fang, H.; Liu, C.; Zhang, X.; Cui, J. Leakage detection and localization of buried water pipe using ground penetrating radar. Measurement 2025, 254, 117902. [Google Scholar] [CrossRef]
  5. Tosti, F.; Ferrante, C. Using ground penetrating radar methods to investigate reinforced concrete structures. Surv. Geophys. 2020, 41, 485–530. [Google Scholar] [CrossRef]
  6. Wu, C.; Liu, Y.; Shao, S.-A.; Ma, S. Research on ultrasonic tomography of concrete hole defects based on multi-parameter coupling and inversion initial value correction. Ind. Constr. 2023, 53, 184–189. [Google Scholar] [CrossRef]
  7. Ma, Y. Infrared thermal imaging detection and recognition technology for defects in concrete structure. J. Highw. Transp. Res. Dev. 2017, 34, 59–65. [Google Scholar]
  8. Sirca, G.F., Jr.; Adeli, H. Infrared thermography for detecting defects in concrete structures. J. Civ. Eng. Manag. 2018, 24, 508–515. [Google Scholar] [CrossRef]
  9. Cui, B.; Wang, C.; Li, Y.; Li, H.; Li, C. Application of computer vision techniques to damage detection in underwater concrete structures. Alex. Eng. J. 2024, 104, 745–752. [Google Scholar] [CrossRef]
  10. Xiao, Z.; Liu, Z.; Guo, X.; Liu, J. An intelligent non-destructive method to identify the quality of self-compacting concrete based on convolutional neural networks via image recognition. Case Stud. Constr. Mater. 2025, 22, e04442. [Google Scholar] [CrossRef]
  11. Li, Y.; Zhang, W.; Lv, S.; Yu, J.; Ge, D.; Guo, J.; Li, L. YOLOv11-CAFM model in ground penetrating radar image for pavement distress detection and optimization study. Constr. Build. Mater. 2025, 485, 141907. [Google Scholar] [CrossRef]
  12. Bettayeb, F.; Rachedi, T.; Benbartaoui, H. An improved automated ultrasonic NDE system by wavelet and neuron networks. Ultrasonics 2004, 42, 853–858. [Google Scholar] [CrossRef] [PubMed]
  13. Liu, P.-L.; Lee, K.-H.; Wu, T.-T.; Kuo, M.-K. Scan of surface-opening cracks in reinforced concrete using transient elastic waves. NDT E Int. 2001, 34, 219–226. [Google Scholar] [CrossRef]
  14. Mazzeo, B.A.; Patil, A.N.; Guthrie, W.S. Acoustic impact-echo investigation of concrete delaminations using liquid droplet excitation. NDT E Int. 2012, 51, 41–44. [Google Scholar] [CrossRef]
  15. Gao, Z.; Chang, Y.; Ren, F. The micro-shearing mechanism of the rock-concrete interface from acoustic emission using the improved Hilbert-Huang transform. Constr. Build. Mater. 2025, 489, 142301. [Google Scholar] [CrossRef]
  16. Ju, J.; Zhao, W.; Tian, X.; Wang, Z. Research on the identification method based on energy distribution of adaptive WPD for railway tunnel lining void. Nondestruct. Test. Eval. 2024, 39, 2138–2160. [Google Scholar] [CrossRef]
  17. Fan, B.; Zhao, W.; Ju, J.; Tian, X. Research on wavelet packet energy entropy extraction method for acoustic signal of tunnel lining cavity, Measurem. Sci. Technol. 2024, 35, 106133. [Google Scholar] [CrossRef]
  18. Wang, S.; Xu, Q.; Zhang, K.; Liu, Y.; Liu, H. Selection refines diagnosis: Mamba for acoustic weak fault diagnosis combining feature mode decomposition and selection. Adv. Eng. Inform. 2025, 66, 103421. [Google Scholar] [CrossRef]
  19. Chen, H.; Xue, J.; Gan, S.; Wang, J.; Li, Y.; Nie, X. Interfacial debonding detection for steel-concrete composite structures Part II: Scanning Doppler laser-based MASW and microphone combination-based impact-acoustic vibration. Structures 2024, 61, 106124. [Google Scholar] [CrossRef]
  20. Carrera, E. Use of the integration by part to derive beam/plate equilibrium equations from elasticity with ap-plications to beams. Mech. Adv. Mater. Struct. 2025, 32, 2535–2547. [Google Scholar] [CrossRef]
  21. Yang, Y.; Zhao, W. Analysis on identifying thin-plate void parameters in concrete based on vibro-acoustic method. Measurement 2025, 242, 116281. [Google Scholar] [CrossRef]
  22. Cabada, A.; Jebari, R.; López-Somoza, L. Existence results for a fourth order problem with functional perturbed clamped beam boundary conditions. Math. Slovaca 2024, 74, 895–916. [Google Scholar] [CrossRef]
  23. Liu, E.G.; Shao, Y.F.; Dou, B.; Cui, J.F.; Ding, H. High-Order Modal Vibration Control of Timoshenko Beams Based on Nonlinear Energy Sink Cells. J. Vib. Eng. Technol. 2024, 12, 6809–6819. [Google Scholar] [CrossRef]
  24. Gómez-Silva, F.; Zaera, R.; Loya, J.A. Buckling and free vibration modes of a multi-cracked variable stiffness Euler–Bernoulli beam in a Winkler foundation with piecewise constant stiffnesses. Eng. Struct. 2025, 340, 120717. [Google Scholar] [CrossRef]
  25. Régal, X.; Cumunel, G.; Bornert, M.; Quiertant, M. Assessment of 2D digital image correlation for experimental modal analysis of transient response of beams using a continuous wavelet transform method. Appl. Sci. 2023, 13, 4792. [Google Scholar] [CrossRef]
  26. Luna Vera, O.S.; Kim, C.W.; Oshima, Y. Energy dissipation and absorption capacity influence on experimental modal parameters of a PC girder. J. Phys. Conf. Ser. 2017, 842, 012038. [Google Scholar] [CrossRef]
  27. Chen, T.; Yang, X.-M.; Yang, S.-H.; Yao, X.-J.; Zheng, Y.-X. Variational mode extraction-guided automated asynchronous operational modal analysis for bridges. Struct. Control Health Monit. 2025, 32, 1–15. [Google Scholar] [CrossRef]
  28. Liu, Z.; Rao, B.; Zhang, Q. Polynomial stability of the Rao-Nakra beam with a single internal viscous dam-ping. J. Differ. Equ. 2020, 269, 6125–6162. [Google Scholar] [CrossRef]
  29. Li, L.; Chen, L.; Yi, H. Vibration characteristic analysis of a circular thin plate with complex pre-stress distribution. J. Vibroengineering 2018, 20, 2951–2965. [Google Scholar] [CrossRef]
  30. Poozesh, P.; Aizawa, K.; Niezrecki, C.; Baqersad, J.; Inalpolat, M.; Heilmann, G. Structural health monitoring of wind turbine blades using acoustic microphone array. Struct. Health Monit. 2017, 16, 471–485. [Google Scholar] [CrossRef]
  31. Chiariotti, P.; Martarelli, M.; Castellini, P. Acoustic beamforming for noise source localization—Reviews, methodology and applications. Mech. Syst. Signal Process. 2019, 120, 422–448. [Google Scholar] [CrossRef]
  32. Chae, K.-S.; Ih, J.-G. Prediction of vibrational energy distribution in the thin plate at high-frequency bands by using the ray tracing method. J. Sound Vib. 2001, 240, 263–292. [Google Scholar] [CrossRef]
  33. Omologo, M.; Svaizer, P. Use of the crosspower-spectrum phase in acoustic event location. IEEE Trans. Speech Audio Process. 1997, 5, 288–292. [Google Scholar] [CrossRef]
  34. Barros, J.; Diego, R.I. On the use of the Hanning window for harmonic analysis in the standard framework. IEEE Trans. Power Deliv. 2006, 21, 538–539. [Google Scholar] [CrossRef]
  35. Hou, J.; Xu, D.; Jankowski, Ł. Structural modal parameter identification with the Power-Exponential window function. Mech. Syst. Signal Process. 2025, 222, 111771. [Google Scholar] [CrossRef]
Figure 1. Forced vibration model of beam structure.
Buildings 15 02569 g001
Figure 2. Forced vibration model of circular thin plate.
Buildings 15 02569 g002
Figure 3. Schematic diagram of MIC array and excitation source spatial distribution.
Buildings 15 02569 g003
Figure 4. Concrete specimen model: (a) structural schematic; (b) schematic diagram of array-based void data acquisition device.
Buildings 15 02569 g004
Figure 5. Global time window selection process: (a) sub-process for independent time-window determination; (b) main process; (c) sub-process for global time-window signal truncation.
Buildings 15 02569 g005
Figure 6. Time domain graph of the signal captured by the independent time window.
Buildings 15 02569 g006
Figure 7. Time domain graph of the signal truncated by the global time window.
Buildings 15 02569 g007
Figure 8. Flowchart of energy-calibrated frequency-domain algorithm.
Buildings 15 02569 g008
Figure 9. Simulation calculation model of beam structure.
Buildings 15 02569 g009
Figure 10. Simulation results of forced vibration of beam structure.
Buildings 15 02569 g010
Figure 11. Finite element simulation model of concrete specimen.
Buildings 15 02569 g011
Figure 12. Planar coordinate distribution diagram of MIC array and excitation source.
Buildings 15 02569 g012
Figure 13. Modal simulation results of the forced vibration of the circular thin plate.
Buildings 15 02569 g013
Figure 14. Physical diagram of cast concrete standard specimen.
Buildings 15 02569 g014
Figure 15. Schematic diagram of measurement point layout.
Buildings 15 02569 g015
Figure 16. Schematic diagram of on-site equipment test.
Buildings 15 02569 g016
Figure 17. Result diagram of signal time domain interception window principle.
Buildings 15 02569 g017
Figure 18. Modal separation results of acoustic signals at the center measurement point of the thin plate.
Buildings 15 02569 g018
Figure 19. Modal analysis diagram of thin plate at the center measurement point.
Buildings 15 02569 g019
Figure 20. Modal analysis diagram of thin plate at the boundary measurement point (azimuth 90°).
Buildings 15 02569 g020
Figure 21. Modal analysis diagram of thin plate at the boundary measurement point (azimuth 315°).
Buildings 15 02569 g021
Table 1. List of MIC array gradient values at the center measurement point.
MIC0MIC1MIC2MIC3MIC4MIC5MIC6MIC7
SP(point 00) 1.23 × 10 4 1.20 × 10 4 1.12 × 10 4 1.36 × 10 4 0.97 × 10 4 1.30 × 10 4 1.07 × 10 4 1.21 × 10 4
Table 2. List of MIC array gradient values at azimuth 90° measurement point.
MIC0MIC1MIC2MIC3MIC4MIC5MIC6MIC7
SP(point 07) 1.01 × 10 2 3.60 × 10 3 8.01 × 10 4 1.02 × 10 3 5.32 × 10 4 1.07 × 10 3 9.55 × 10 4 3.47 × 10 3
SP(point 15) 7.80 × 10 4 2.12 × 10 4 3.24 × 10 5 1.99 × 10 5 5.42 × 10 6 7.73 × 10 6 7.94 × 10 6 2.06 × 10 4
SP(point 23) 3.93 × 10 6 1.07 × 10 5 7.34 × 10 7 1.38 × 10 6 1.05 × 10 6 1.26 × 10 6 5.52 × 10 7 2.42 × 10 6
Table 3. List of MIC array gradient values at azimuth 315° measurement point.
MIC0MIC1MIC2MIC3MIC4MIC5MIC6MIC7
SP(point 12) 5.04 × 10 3 1.46 × 10 3 4.11 × 10 4 3.03 × 10 4 2.84 × 10 4 3.53 × 10 4 3.40 × 10 4 1.50 × 10 3
SP(point 20) 1.10 × 10 3 4.46 × 10 4 3.20 × 10 5 2.01 × 10 5 1.06 × 10 5 3.13 × 10 5 2.27 × 10 5 2.90 × 10 4
SP(point 28) 9.91 × 10 6 8.81 × 10 6 3.19 × 10 6 1.33 × 10 6 9.46 × 10 7 3.78 × 10 6 3.44 × 10 6 1.49 × 10 6
Disclaimer/Publisher’s Note: The statements, opinions and data contained in all publications are solely those of the individual author(s) and contributor(s) and not of MDPI and/or the editor(s). MDPI and/or the editor(s) disclaim responsibility for any injury to people or property resulting from any ideas, methods, instructions or products referred to in the content.

