
Reverse Logistics Network Optimization for Retired BIPV Panels in Smart City Energy Systems


Abstract
1. Introduction
2. Literature Review
2.1. Research on Reverse Logistics Networks
2.2. Research on Construction Waste Recycling Network
2.3. Research on Government Reward and Punishment Policies
3. Establishment of an Optimization Model for the Recycling Path of Retired PV Panels
3.1. Problem Description
3.2. Model Assumptions
3.3. Model Establishment
3.3.1. Cost Objective Function
3.3.2. Carbon Emission Target Function
4. BIPV Simulation Analysis of Retired PV Module Recycling
4.1. Initial Parameters
4.2. Analysis of Results
4.2.1. Normal Distribution Simulates the Effect of Urban Agglomeration
4.2.2. Random Distribution in the Preset Circle to Simulate the Urban Agglomeration Effect
4.3. Parameter Sensitivity Analysis
4.3.1. There Are No Rewards and Punishments from the Government
4.3.2. The Government Only Punishes the Situation
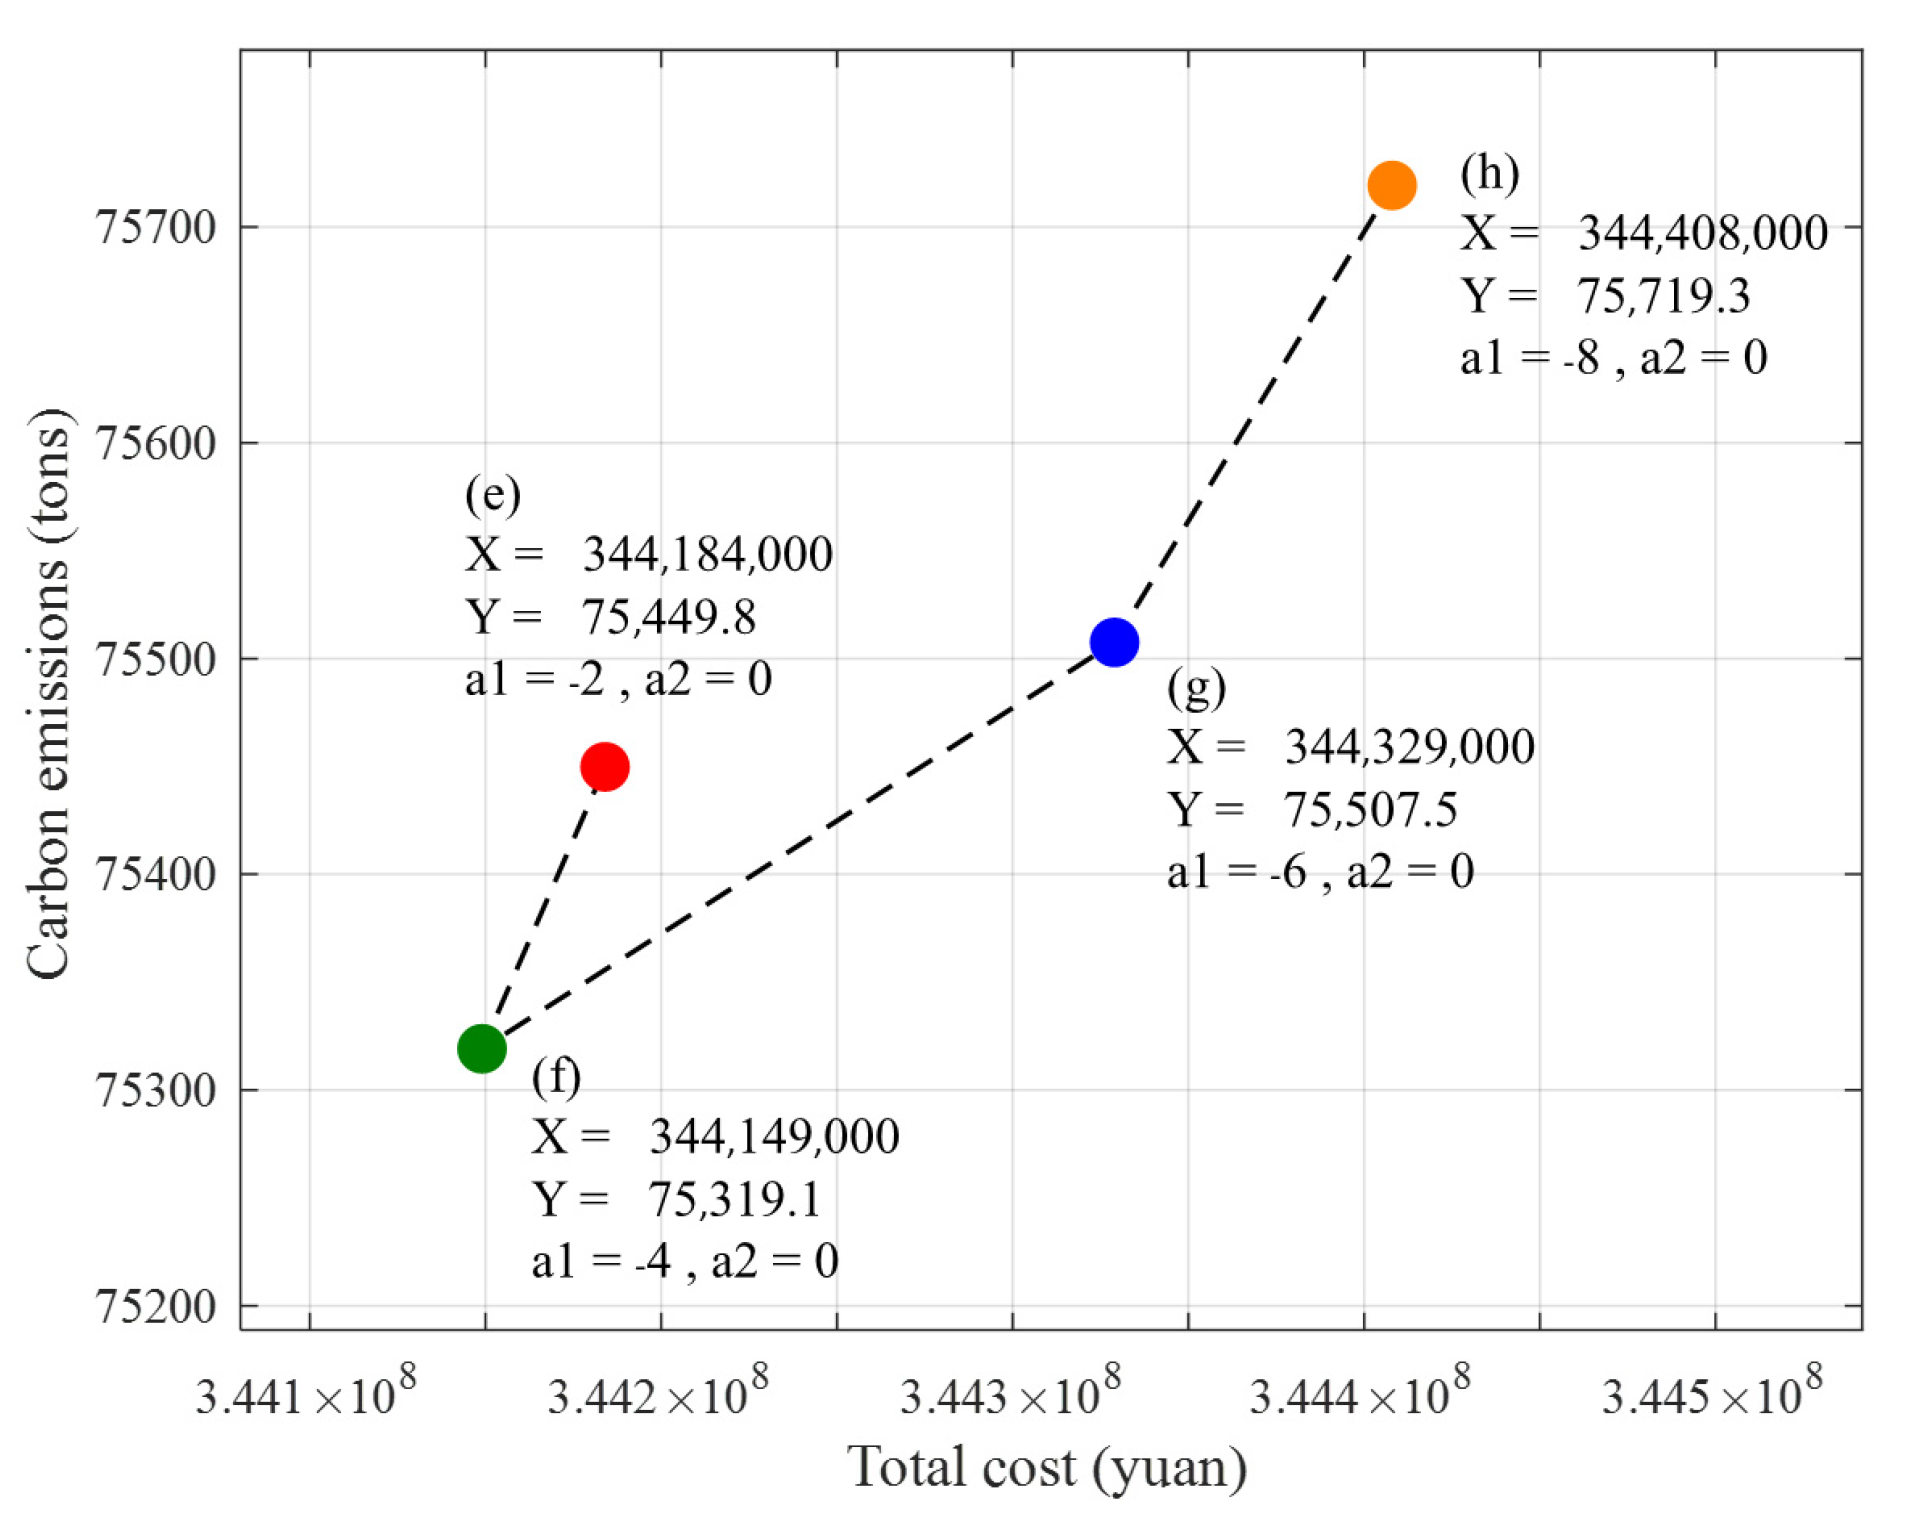
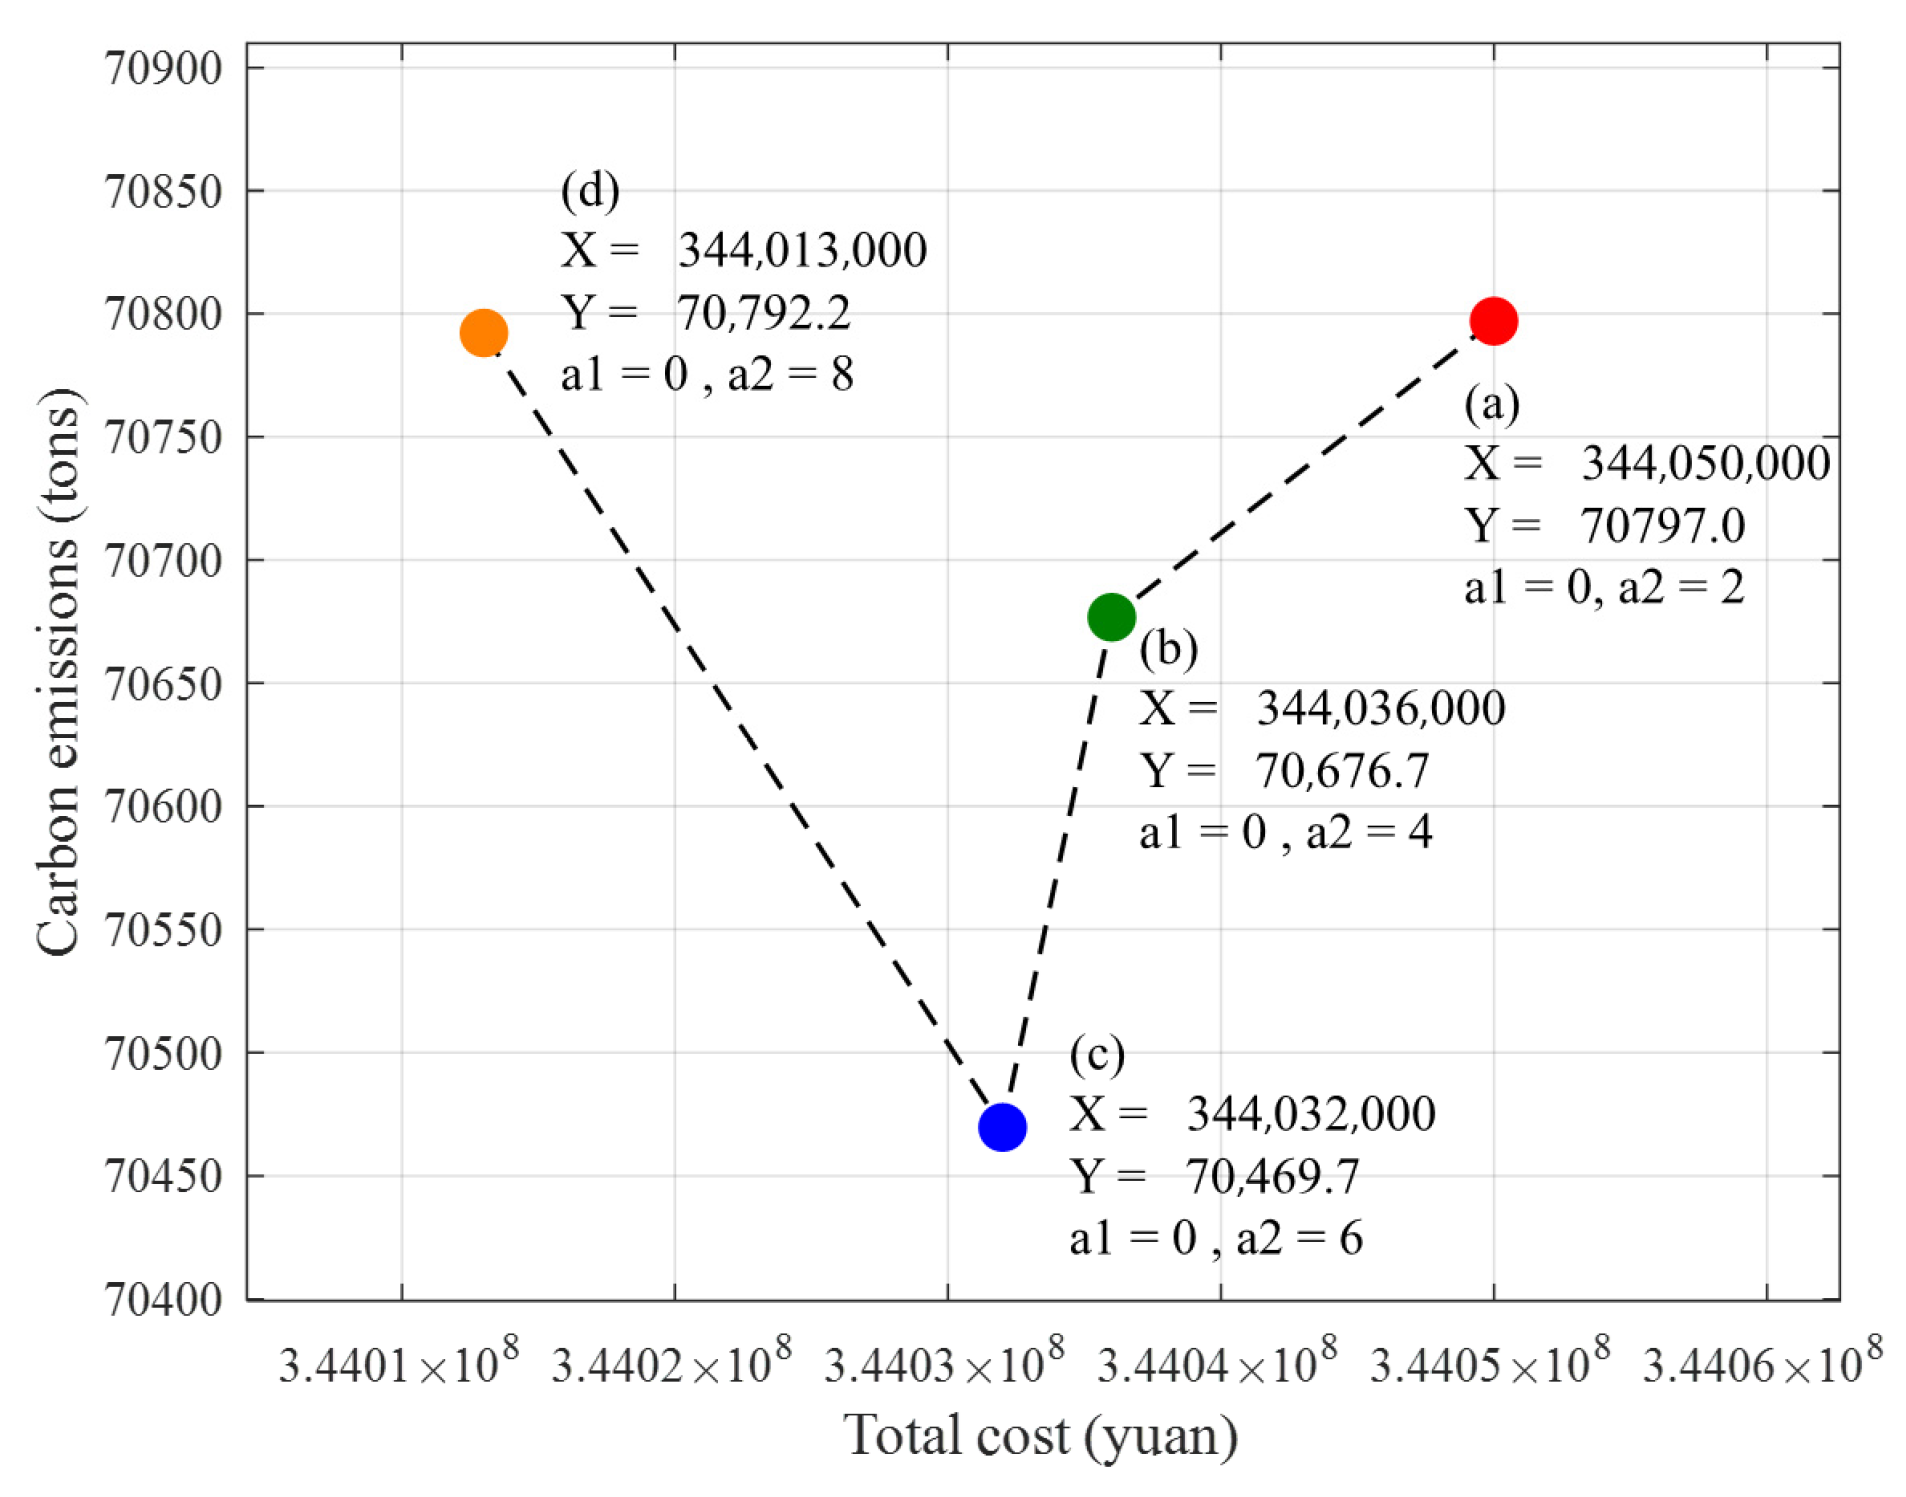
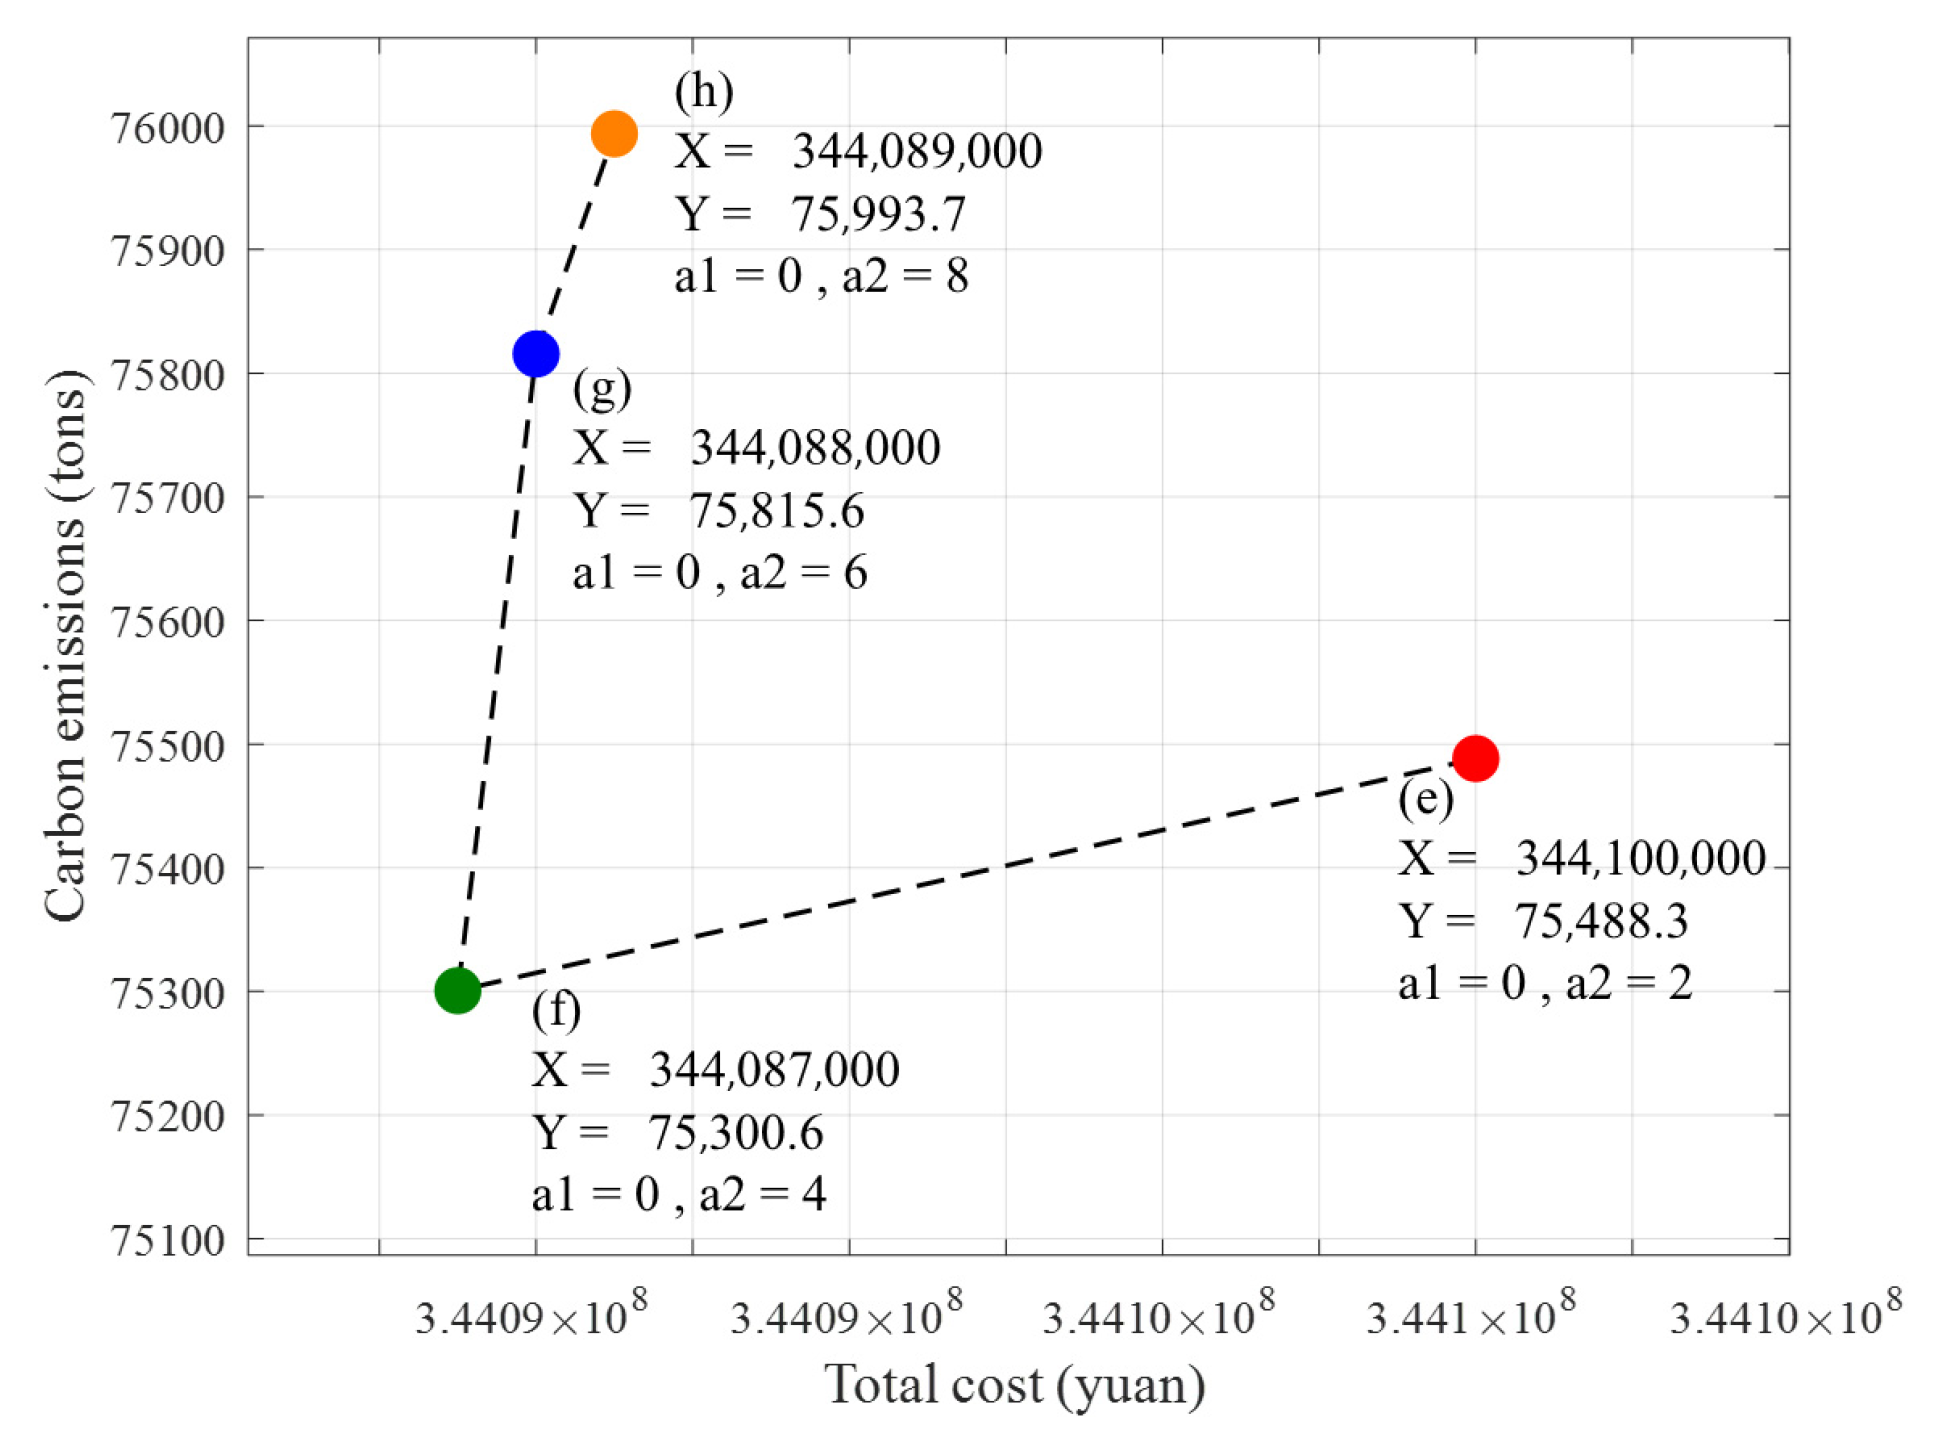
4.3.3. The Government Only Awards the Situation
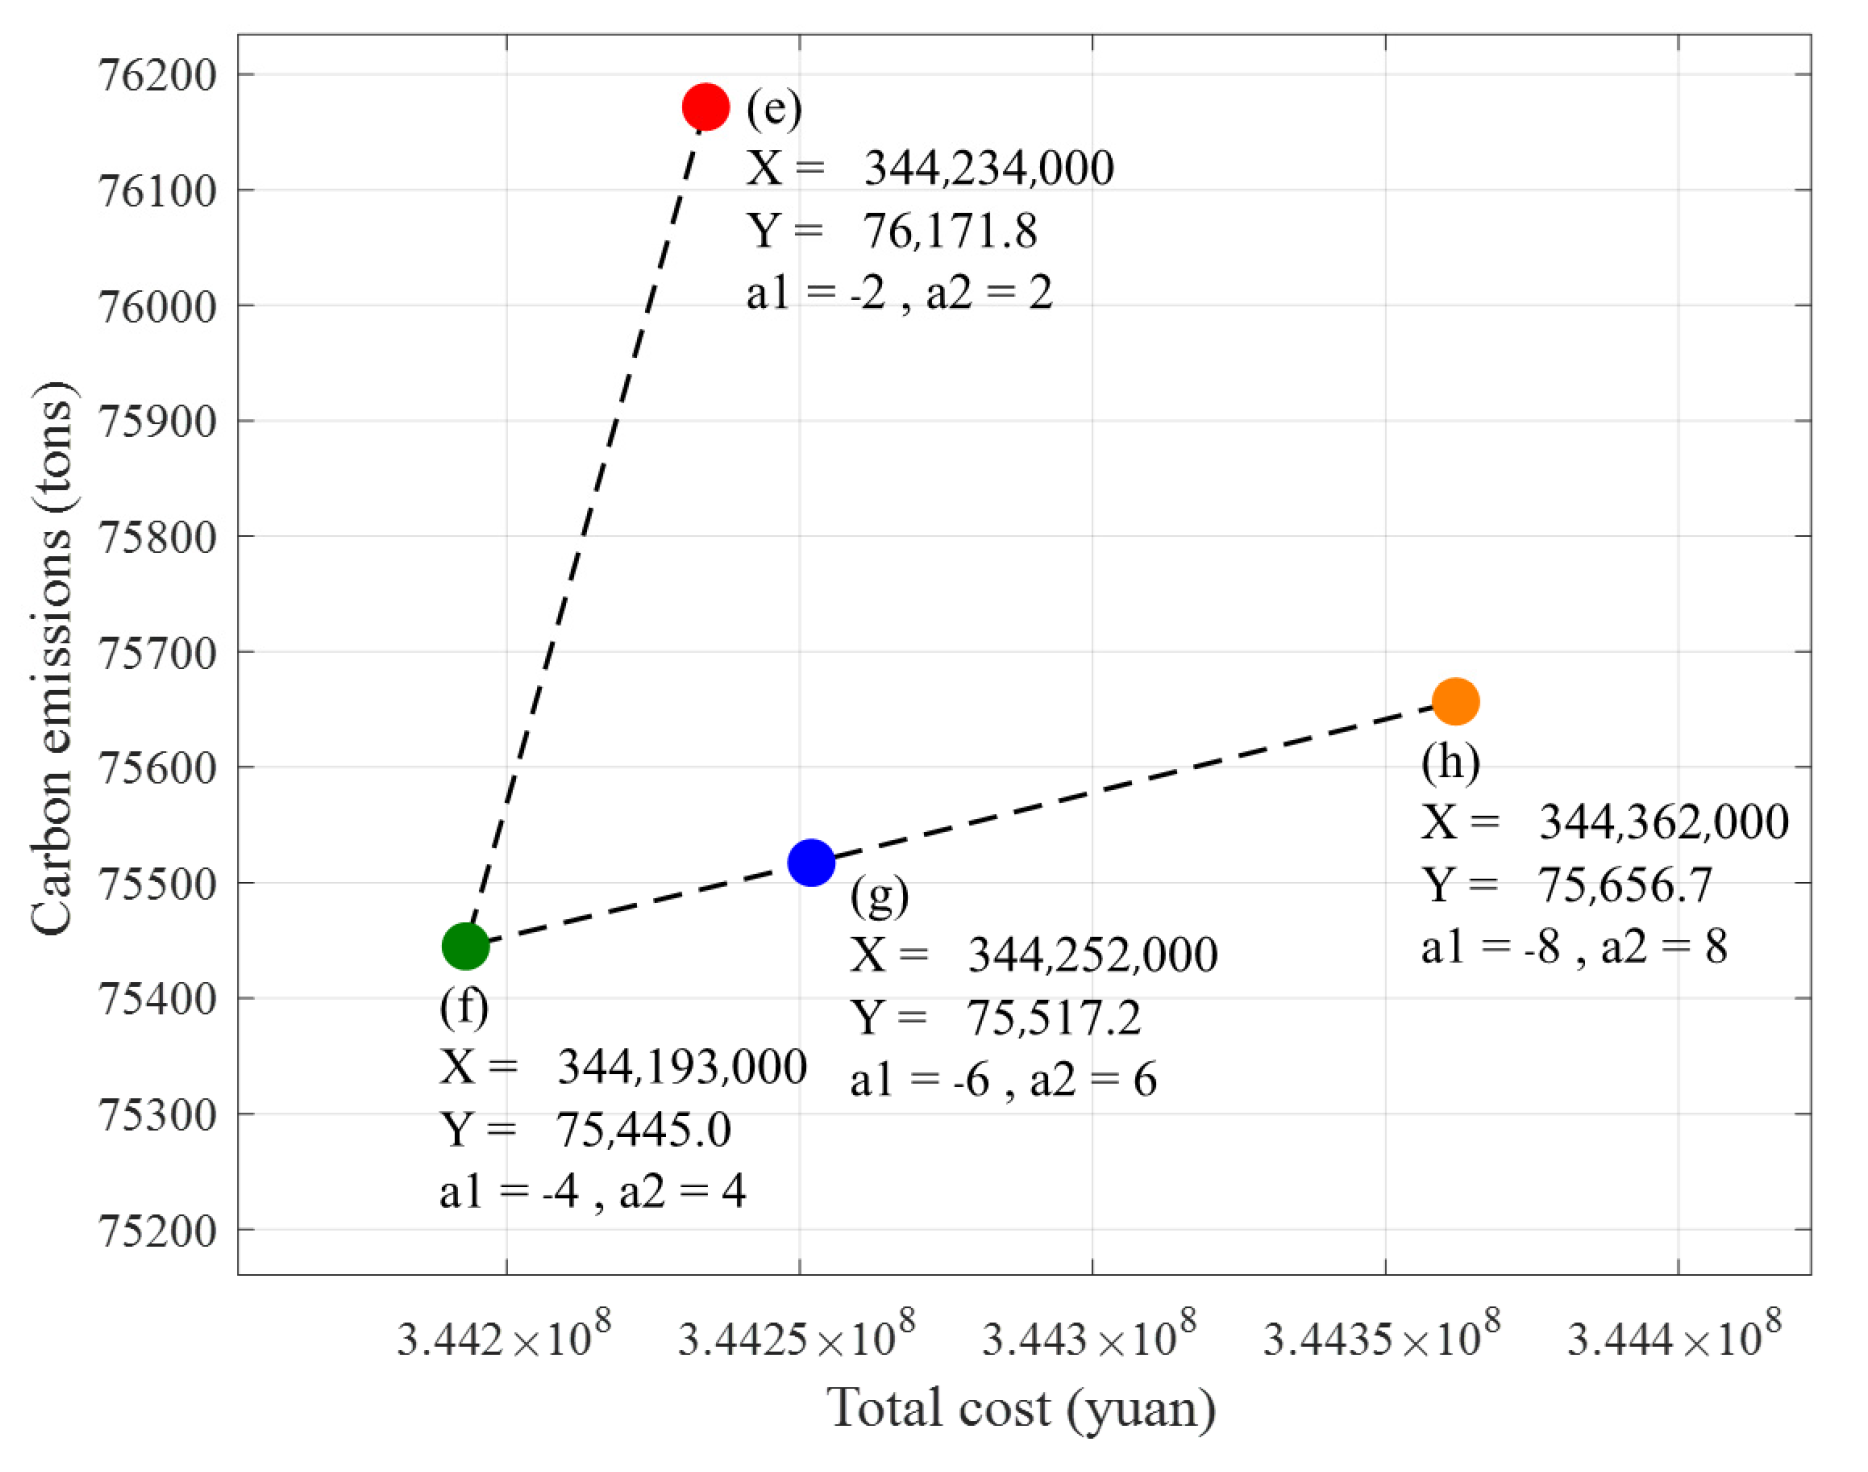
4.3.4. A Combination of Government Rewards and Punishments
5. Conclusions
Author Contributions
Funding
Data Availability Statement
Conflicts of Interest
References
- Zou, C.; Ma, F.; Pan, S.Q.; Zhao, Q.; Fu, G.Y.; Zhang, G.S.; Yang, Y.C.; Yu, H.; Liang, Y.B.; Lin, M.J.; et al. The connotation and path of the world energy transition revolution and green and smart energy system. Pet. Explor. Dev. 2023, 50, 633–647. [Google Scholar] [CrossRef]
- Feng, G.G.; Cui, H.; Chang, S.S.; Huang, K.-L.; Wang, X.-R. Analysis of carbon emissions and influencing factors of near-zero energy buildings. Clim. Change Res. 2022, 18, 205–214. [Google Scholar]
- Wang, Y.; Wang, R.; Tanaka, K.; Ciais, P.; Penuelas, J.; Balkanski, Y.; Sardans, J.; Hauglustaine, D.; Liu, W.; Xing, X.F.; et al. Accelerating the energy transition towards photovoltaic and wind in China. Nature 2023, 619, 761–767. [Google Scholar] [CrossRef] [PubMed]
- Owen, J.R.; Deanna, K.; Lechner, A.M.; Jill, H.; Ruilian, Z.; Lèbre, É. Author Correction: Energy transition minerals and their intersection with land-connected peoples. Nat. Sustain. 2023, 6, 1023–1024. [Google Scholar] [CrossRef]
- Huang, H.; Li, M.Y.; Liu, S.Y.; Yuan, C.G. Release of heavy metal pollutants and environmental risks in the process of photovoltaic cell production and recycling. Chin. J. Ecotoxicol. 2024, 19, 217–225. [Google Scholar]
- Esen, H.; Inalli, M.; Esen, M. Technoeconomic appraisal of a ground source heat pump system for a heating season in eastern Turkey. Energy Convers. Manag. 2006, 47, 1281–1297. [Google Scholar] [CrossRef]
- Rosato, A.; Ciervo, A.; Guarino, F.; Ciampi, G.; Scorpio, M.; Sibilio, S. Dynamic simulation of a solar heating and cooling system including a seasonal storage serving a small italian residential district. Therm. Sci. 2020, 24, 3555–3568. [Google Scholar] [CrossRef]
- Popp, C.; Uhlig, C.; Engelmann, M. Prospective life cycle analysis of a BIPV facade-Life cycle assessment of greenhouse gas emissions using future projections for a case study. Energy Build. 2025, 330, 115336. [Google Scholar] [CrossRef]
- Zhang, T. Interpretation of the Action Plan for Carbon Peaking Before 2030. Ecol. Econ. 2022, 38, 9–12. [Google Scholar]
- Zhong, B.S. Deputy to the National People’s Congress: Vigorously develop the BIPV standard system of photovoltaic building integration system. China Explor. Des. 2025, 3, 35. [Google Scholar]
- Wu, J.X.; Wu, H.S.; Zhao, Y.M.; Zhang, Y.D.; Li, L.J.; Sun, Y. Research on Reverse Logistics Recycling Network Planning for Photovoltaic Scrap Modules. Adv. Environ. Prot. 2022, 12, 892. [Google Scholar] [CrossRef]
- Esen, M.; Yuksel, T. Experimental evaluation of using various renewable energy sources for heating a greenhouse. Energy Build. 2013, 65, 340–351. [Google Scholar] [CrossRef]
- Wang, M.; Hu, Z.F.; Bai, B.; Chen, P.; Wang, G.S.; Zhang, Q.S.; Xue, Y.; Zhang, Y.; Wang, X.B. Research Progress on Dissociation and Resource Utilization of Retired Crystalline Silicon Photovoltaic Modules. J. China Coal Soc. 2024, 49, 4188–4202. [Google Scholar]
- Pan, L.J. Research on Reverse Logistics Network of Waste Electronic Products. China Logist. Procure. 2023, 10, 56–57. [Google Scholar]
- Ma, Y.F.; Liu, C.; Huang, S.Y.; Yang, L.N. Research on Multi-objective Robust Optimization of Medical Waste Recycling Site Selection Considering Operational Risk. Comput. Eng. Appl. 2025, 61, 341–351. [Google Scholar]
- Ci, S.; Zhang, C.J.; Zhou, Y.L.; Li, B.W.; Zhao, G.J. Evaluation of Operational Performance of Large-scale Retired Power Battery Cascade Utilization Energy Storage System Based on Dynamic Reconfigurable Battery Network. Glob. Energy Interconnect. 2024, 7, 136–144. [Google Scholar]
- Cheng, S.; Wang, H.J.; Xu, Q.P.; Ran, T.; Wang, S. Two-stage site selection and capacity determination method for multi-type charging facilities with ultra-high power charging. Power Syst. Prot. Control 2024, 52, 33–44. [Google Scholar]
- Yu, M. Analysis on the Development Trend of Reverse Logistics Supply Chain Technology. Renew. Resour. Circ. Econ. 2024, 17, 25–28. [Google Scholar]
- Wang, X.K.; Ji, J.; Liu, Y.; He, Q. Path Planning of Unmanned Logistics Distribution Vehicle Based on Improved Q Learning Algorithm. J. Syst. Simul. 2024, 36, 1211–1221. [Google Scholar]
- Mallick, P.K.; Salling, K.B.; Pigosso, D.C.A.; McAloone, T.C. Closing the loop: Establishing reverse logistics for a circular economy, a systematic review. J. Environ. Manag. 2023, 328, 117017. [Google Scholar] [CrossRef] [PubMed]
- Zhang, J.; Zhou, K. Differentiation Mechanism and Spatial Optimization of Reverse Logistics Mode of Domestic Waste in Villages and Towns in Agro-pastoral Ecotone. J. Geogr. 2024, 79, 299–320. [Google Scholar]
- Zhang, L.P.; Weng, J.X.; Tang, J. Research on Solid Waste Tax and Reward and Punishment Mechanism for Recycling of Waste Photovoltaic Modules Based on Economic-Environmental-Social Benefits. J. Nanjing Univ. Aeronaut. Astronaut. (Soc. Sci. Ed.) 2024, 26, 22–33. [Google Scholar]
- Yang, Y.X.; Guan, Q.; Yu, Y.N.; Lin, M.M. Optimization Model of Sustainable Reverse Logistics Network under Dual-channel Power Battery Recycling Model. Comput. Integr. Manuf. Syst. 2023, 29, 2461–2473. [Google Scholar]
- Al-Refaie, A.; Kokash, T. Optimization of sustainable reverse logistics network with multi-objectives under uncertainty. J. Remanufacturing 2023, 13, 1–23. [Google Scholar] [CrossRef]
- Hashemi, S.E. A fuzzy multi-objective optimization model for a sustainable reverse logistics network design of municipal waste-collecting considering the reduction of emissions. J. Clean. Prod. 2021, 318, 128577. [Google Scholar] [CrossRef]
- Iakovou, E.; Pistikopoulos, E.N.; Walzberg, J.; Iseri, F.; Iseri, H.; Chrisandina, N.J.; Vedant, S.; Nkoutche, C. Next-generation reverse logistics networks of photovoltaic recycling: Perspectives and challenges. Sol. Energy 2024, 271, 112329. [Google Scholar] [CrossRef]
- Deng, R.; Chang, N.L.; Ouyang, Z.; Chong, C.M. A techno-economic review of silicon photovoltaic module recycling. Renew. Sustain. Energy Rev. 2019, 109, 532–550. [Google Scholar] [CrossRef]
- Ma, L.; Zhang, L. Evolutionary game analysis of construction waste recycling management in China. Resour. Conserv. Recycl. 2020, 161, 104863. [Google Scholar] [CrossRef]
- Pan, X.Y.; Xiu, Q.; Feng, Y.B. Designing recycling networks for construction and demolition waste based on reserve logistics research field. J. Clean. Prod. 2020, 260, 120841. [Google Scholar] [CrossRef]
- Ferronato, N.; Fuentes Sirpa, R.C.; Guisbert Lizarazu, E.G.; Conti, F.; Torretta, V. Construction and demolition waste recycling in developing cities: Management and cost analysis. Environ. Sci. Pollut. Res. 2023, 30, 24377–24397. [Google Scholar] [CrossRef] [PubMed]
- Bao, Z.K. Developing circularity of construction waste for a sustainable built environment in emerging economies: New insights from China. Dev. Built Environ. 2023, 13, 13–15. [Google Scholar] [CrossRef]
- Liu, J.K.; Teng, Y. Evolution game analysis on behavioral strategies of multiple stakeholders in construction waste resource industry chain. Environ. Sci. Pollut. Res. 2023, 30, 19030–19046. [Google Scholar] [CrossRef] [PubMed]
- Zhao, H.X.; Liu, G.S.; Li, Y. Optimal Path Planning for Classified Garbage Collection Based on Random Walk. J. Traffic Transp. Eng. Inf. Technol. 2023, 16, 103–108. [Google Scholar]
- Zhao, Q.; Tian, Q.; Wang, Z.R.; Hei, X.H.; Liu, Y.H. Research on Optimization of Collaborative Transportation Path of Urban Construction Waste. Environ. Eng. 2023, 36, 166–170. [Google Scholar]
- Zhao, L.; Wang, C.; Li, H.B.; Yan, L.; Zheng, C.L. Research on carbon benefits of construction waste management under carbon trading mechanism. J. Eng. Manag. 2025, 39, 28–34. [Google Scholar]
- Li, L.; Tang, S.J.; Ding, N.; Liu, Y.M.; Li, F. Research on the strategy of reduction and comprehensive utilization of construction waste in megacities: A case study of Shenzhen. Environ. Health Eng. 2023, 31, 105–110. [Google Scholar]
- Wang, Y.Y.; Su, M.; Wang, X.D. Altruistic Concern Decision-making in Closed-loop Supply Chain under Government Incentive Mechanism. CMS 2022, 30, 105–116. [Google Scholar]
- Liu, Z.; Lang, L.; Li, L.; Zhao, Y.; Shi, L. Evolutionary game analysis on the recycling strategy of household medical device enterprises under government dynamic rewards and punishments. Math. Biosci. Eng. MBE 2021, 18, 6434–6451. [Google Scholar] [PubMed]
- Lei, C.; Guo, R.; Xu, J. Research on the Supply Chain Coordination Mechanism of Circular Incubators for Fresh E-commerce Terminal Distribution Considering Government Rewards and Punishments. In Proceedings of the International Conference on Logistics, Informatics and Service Sciences, Beijing, China, 25–28 July 2023; Springer Nature: Singapore, 2023; pp. 297–310. [Google Scholar]
- Hu, J.; Wu, J.M.; Wu, J.; Sheng, Y.X.; Shi, Q.F. Research on Competition and Association of Photovoltaic Industry Supply Chain Driven by Innovation: Based on Government Competition Policy. CMS 2022, 30, 256–264. [Google Scholar]
- Zhang, M.; Yang, M.; Gao, Y. Tripartite evolutionary game and simulation analysis of electric bus charging facility sharing under the governmental reward and punishment mechanism. Energy 2024, 307, 132783. [Google Scholar] [CrossRef]
- Zhang, C.; Chen, Y.X. Decision-making and Coordination of Closed-loop Supply Chain of Power Battery Cascade Utilization Considering Scale Effect under Government Subsidy. Oper. Res. Manag. 2021, 30, 72–77+91. [Google Scholar]
- Gao, D.; Guo, W. Evolutionary game and simulation analysis of tripartite subjects in public health emergencies under government reward and punishment mechanisms. Sci. Rep. 2025, 15, 2314. [Google Scholar] [CrossRef] [PubMed]
- Ma, D.Q.; Hu, J.S. Differential Game of Dynamic Closed-loop Supply Chain Considering Altruistic Behavior Preference. J. Syst. Manag. 2020, 29, 974–986. [Google Scholar]
- Wu, R.; Xia, X.Q.; Huang, Z.H. Research on the Influence of Government Reward and Punishment Mechanism on the Classification and Recycling of Waste Products Industry and Its Coordination Mechanism. Ind. Technol. Econ. 2023, 42, 143–152. [Google Scholar]
- Fan, R.; Wang, Y.; Lin, J. Study on Multi-Agent Evolutionary Game of Emergency Management of Public Health Emergencies Based on Dynamic Rewards and Punishments. Int. J. Environ. Res. Public Health 2021, 18, 8278. [Google Scholar] [CrossRef] [PubMed]
- Huang, X.H.; Bao, Y.Z.; Chen, Y.Z.; Cai, B.Q. The Evolutionary Game of Strategic Environmental Governance of Enterprises under the Combination of Reward and Punishment Policy. Chin. J. Environ. Sci. 2023, 43, 3808–3820. [Google Scholar]
- Wang, D.P.; Zhang, K.; Zhou, Y. Differential Game of Closed-loop Supply Chain Considering Dynamic Stochastic Recovery Rate under Government Incentives and Punishments. CMS 2024, 32, 158–170. [Google Scholar]
- Wu, Q.L.; Lin, R.H. Research on the Evolutionary Game of Low-carbon Power Supply Side under Dynamic Reward and Punishment Mechanism. Mod. Electr. Power 2023, 40, 525–536. [Google Scholar]
- Gao, X.J.; Zhang, S.J.; Liu, Y.Q. Research on Optimization of Low-carbon Cold Chain Logistics Path Based on Multi-objective Collaboration. Manuf. Autom. 2025, 47, 127–135. [Google Scholar]
- Orji, R.; Alslaity, A.; Chan, G. Towards understanding the mechanism through which reward and punishment motivate or demotivate behaviours. Behav. Inf. Technol. 2024, 43, 1042–1066. [Google Scholar] [CrossRef]
- Zhou, H.Y.; Gao, H.W. The impact of urban morphology on urban transportation mode: A case study of Tokyo. Case Stud. Transp. Policy 2020, 8, 197–205. [Google Scholar] [CrossRef]
- Czarnecki, B.; Chodorowski, M.P. Urban Environment during Post-War Reconstruction: Architectural Dominants and Nodal Points as Measures of Changes in an Urban Landscape. Land 2021, 10, 1083. [Google Scholar] [CrossRef]
- Cheng, Y.S.; Guo, X.X.; Liu, Q. Quantitative Model of Carbon Emission Reduction Benefit in Taiwan Area Based on Dynamic Carbon Emission Factor. Mod. Electr. Power 2025, 42, 168–175. [Google Scholar]
- Cai, B.F.; Cao, L.B.; Lei, Y.; Wang, C.; Zhang, L.; Zhu, J.H.; Li, M.Y.; Du, M.B.; Lu, C.; Jiang, H.Y.; et al. Carbon dioxide emission pathways under China’s carbon neutrality goal. Chin. Popul. Resour. Environ. 2021, 31, 7–14. [Google Scholar]
- GB/T 51366-2019; Building Carbon Emission Calculation Standard. AQSIQ: Beijing, China, 2019.


| Meaning | |
|---|---|
| dij | The transportation distance from the construction point to the transit station |
| tcij | The cost per unit of transportation from the construction point to the transfer station |
| sij | The volume of transportation from the construction point to the transfer station |
| bij | Carbon emission factor per unit of transportation from the building point to the transfer station |
| DCi | The unit cost of labor that needs to be paid for the dismantling process |
| PTCj | The cost of operating the unit of the transfer station |
| ETk | The amount of carbon emissions per unit generated during the operation of the distribution center |
| Decision Variables | Meaning |
|---|---|
| xj | Whether or not to choose to open a transit station in an alternate location |
| zk | Whether to choose to open a distribution center in an alternative location |
| yab | Whether it is transported between two points of AB (Note: A and B are two nodes in i, j, k, m, and n that are arbitrarily different) |
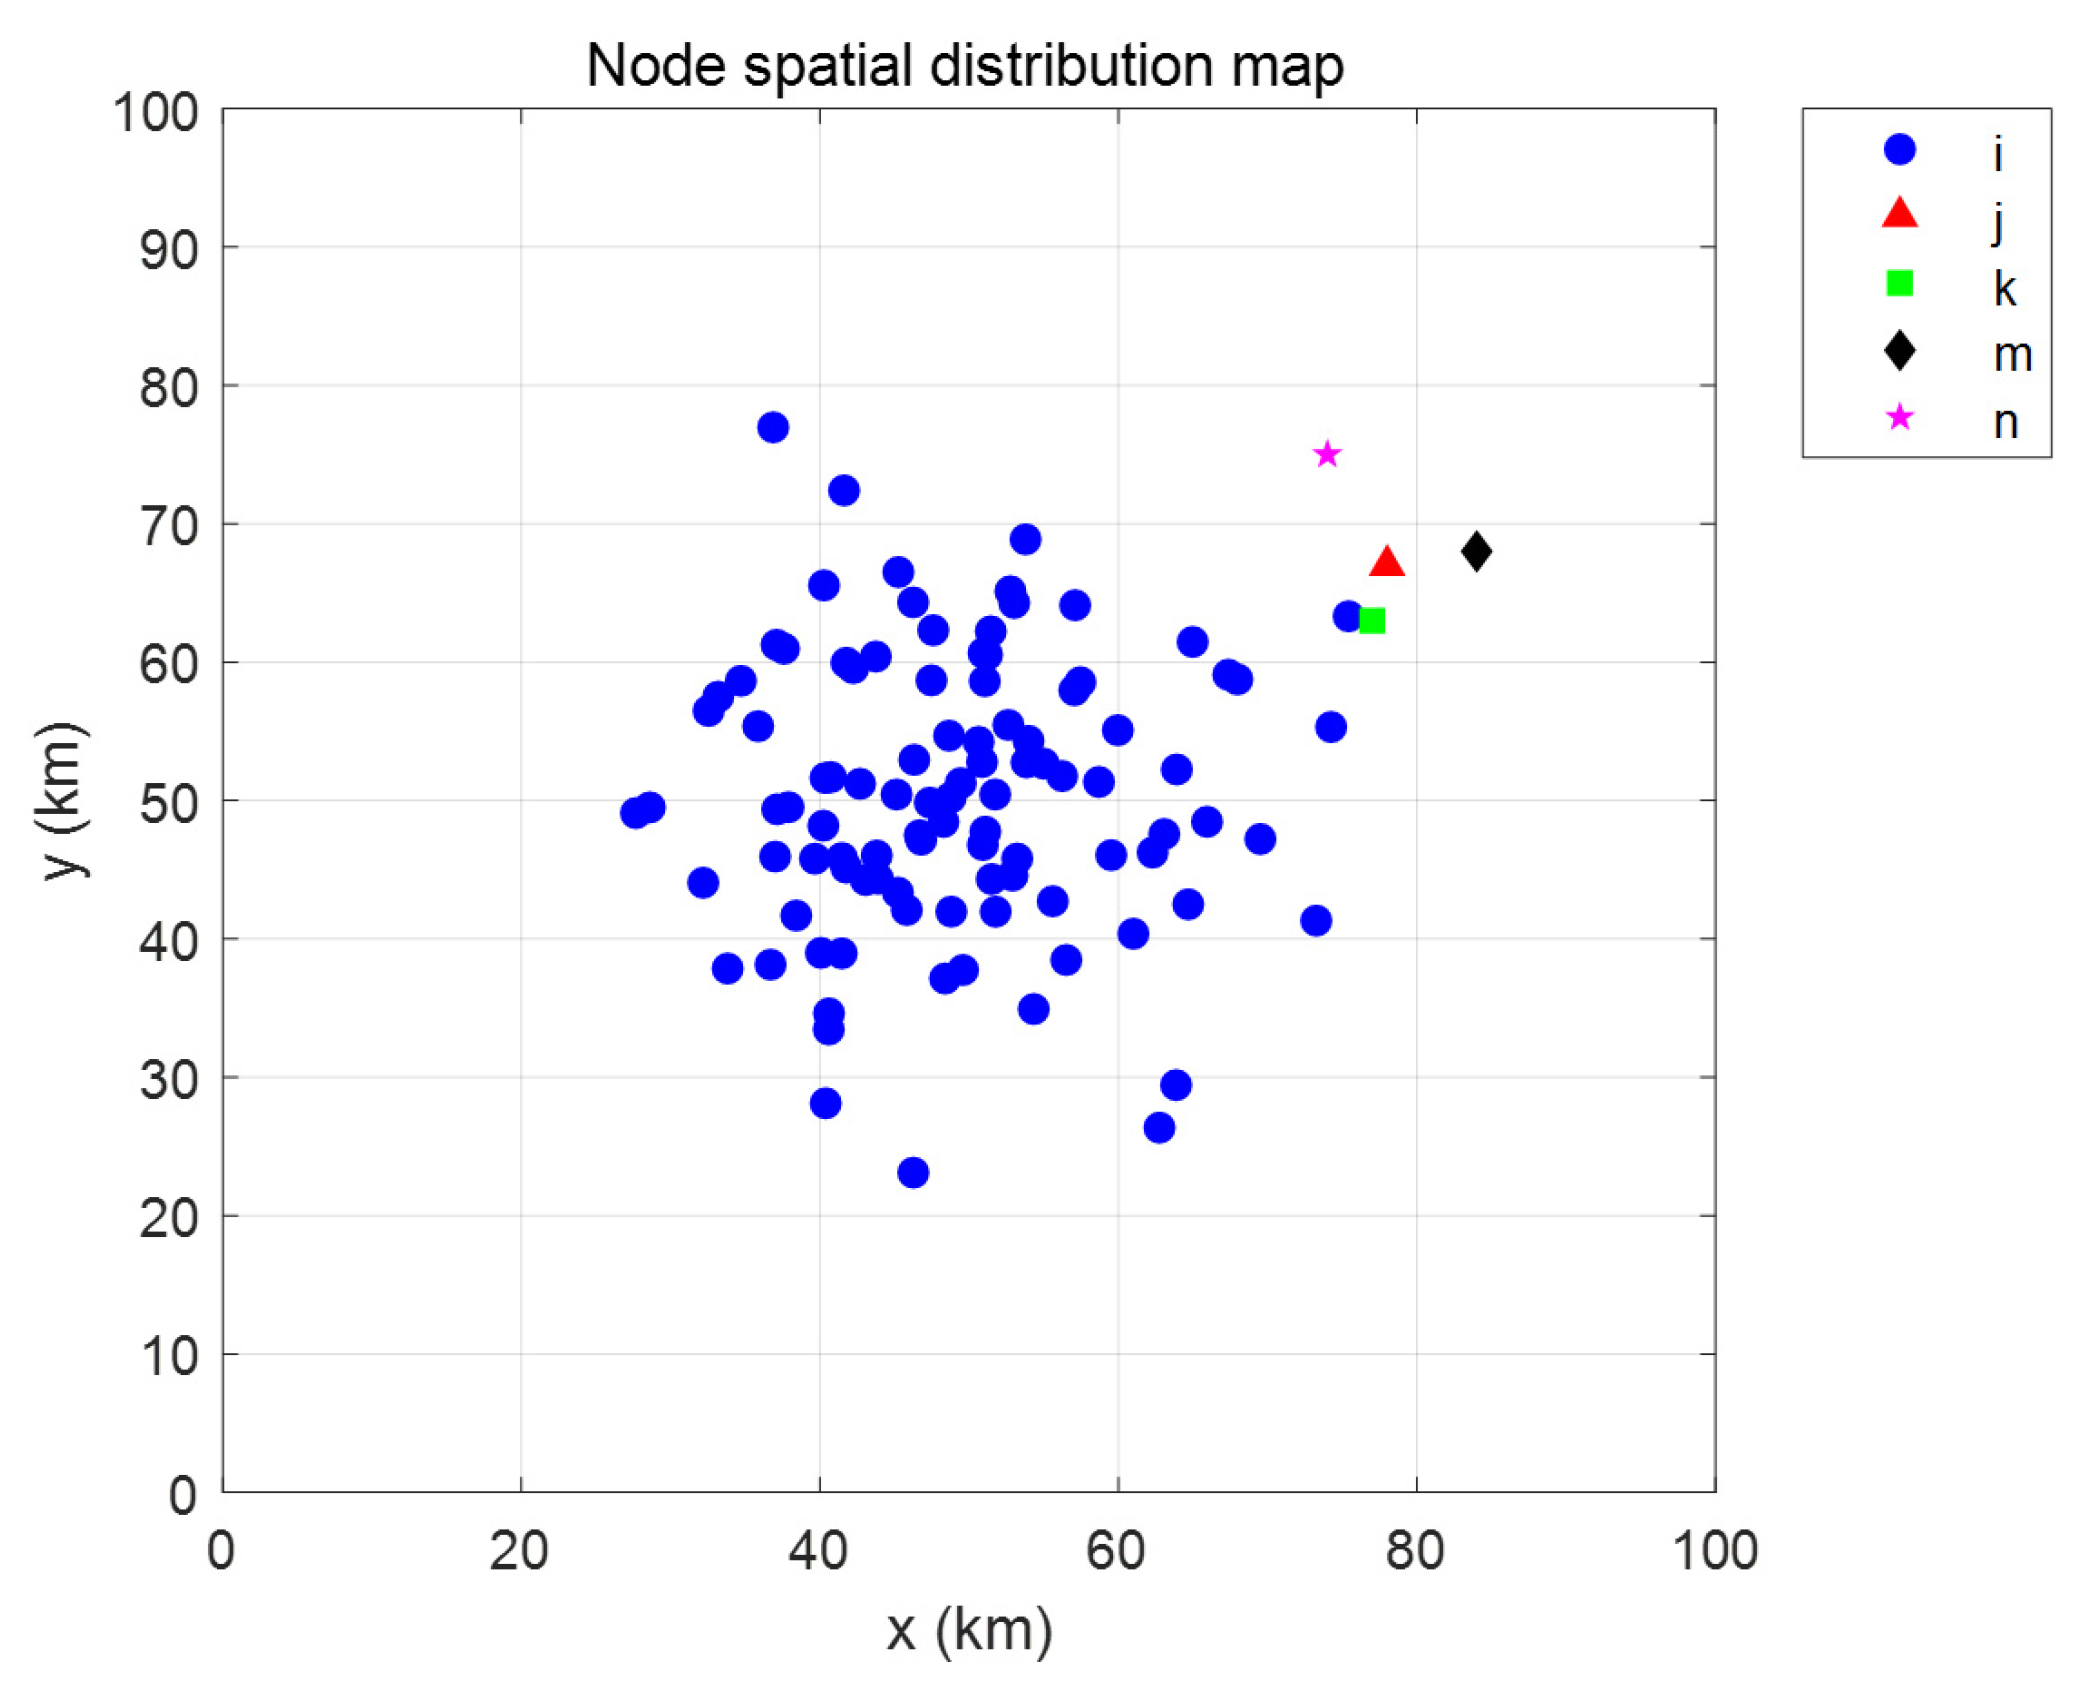
| Serial Number | Abscissa | Ordinate | Recycling/t | Serial Number | Abscissa | Ordinate | Recycling/t |
|---|---|---|---|---|---|---|---|
| 1 | 57 | 62 | 18 | 11 | 63 | 51 | 19 |
| 2 | 63 | 53 | 24 | 12 | 47 | 46 | 22 |
| 3 | 52 | 58 | 22 | 13 | 56 | 38 | 23 |
| 4 | 52 | 49 | 18 | 14 | 44 | 33 | 19 |
| 5 | 35 | 53 | 17 | 15 | 59 | 44 | 21 |
| 6 | 62 | 53 | 22 | 16 | 74 | 31 | 20 |
| 7 | 62 | 59 | 20 | 17 | 36 | 36 | 26 |
| 8 | 37 | 53 | 19 | 18 | 58 | 61 | 16 |
| 9 | 57 | 56 | 22 | 19 | 48 | 65 | 20 |
| 10 | 56 | 54 | 19 | 20 | 39 | 44 | 22 |
| Node | Abscissa | Ordinate | Transit Limit/t | Opening Cost/10,000 yuan | Unit Operating Cost/(10,000 yuan/t) |
|---|---|---|---|---|---|
| Transit Station 1 | 66 | 69 | 3800 | 1180 | 25 |
| Transit Station 2 | 73 | 57 | 4500 | 1500 | 32 |
| Transit Station 3 | 78 | 67 | 2700 | 865 | 48 |
| Transit Station 4 | 56 | 70 | 3200 | 950 | 65 |
| Transit Station 5 | 52 | 84 | 4300 | 135 | 53 |
| Node | Abscissa | Ordinate | Sorting Upper Limit/t | Opening Cost/10,000 yuan | Unit Operating Cost/(10,000 yuan/t) | Carbon Emissions per Unit (kg/t) | Recycling Sorting Rate |
|---|---|---|---|---|---|---|---|
| Distribution center 1 | 69 | 54 | 121,500 | 2850 | 90 | 15 | 0.8 |
| Distribution center 2 | 77 | 63 | 9500 | 2570 | 70 | 12 | 0.75 |
| Distribution center 3 | 58 | 54 | 8700 | 2330 | 54 | 11 | 0.6 |
| Node | Abscissa | Ordinate | Unit Operating Cost/(10,000 yuan/t) | Carbon Emissions per Unit (kg/t) |
|---|---|---|---|---|
| Dismantling center | 79 | 65 | 20 | 3.58 |
| Recycling plant | 74 | 75 | / | / |
| Carbon Emission Sources | Carbon Emission Factor |
|---|---|
| The average emission factor of the national power grid | 0.5703 kg CO2/(kWh) |
| Provincial Grid Average Emission Factor (Chongqing) | 0.1031 kg CO2/(kWh) |
| diesel fuel | 3.096 kg CO2/kg |
| gasoline | 2.925 kg CO2/kg |
| Trucks (unit mass 3 t) | 73.45 kg CO2/shift |
| Crane (lifting mass 10 t) | 100.51 kg CO2/shift |
| Rebar cutting machine (diameter 40 mm) | 18.62 kg CO2/shift |
| Spot welding machine (capacity 50 kv·A) | 59.87 kg CO2/shift |
| Diesel generator set (power 60 kw) | 226.63 kg CO2/shift |
| Experimental Group | a1 | a2 | Cost/RMB | Carbon Emissions/t |
|---|---|---|---|---|
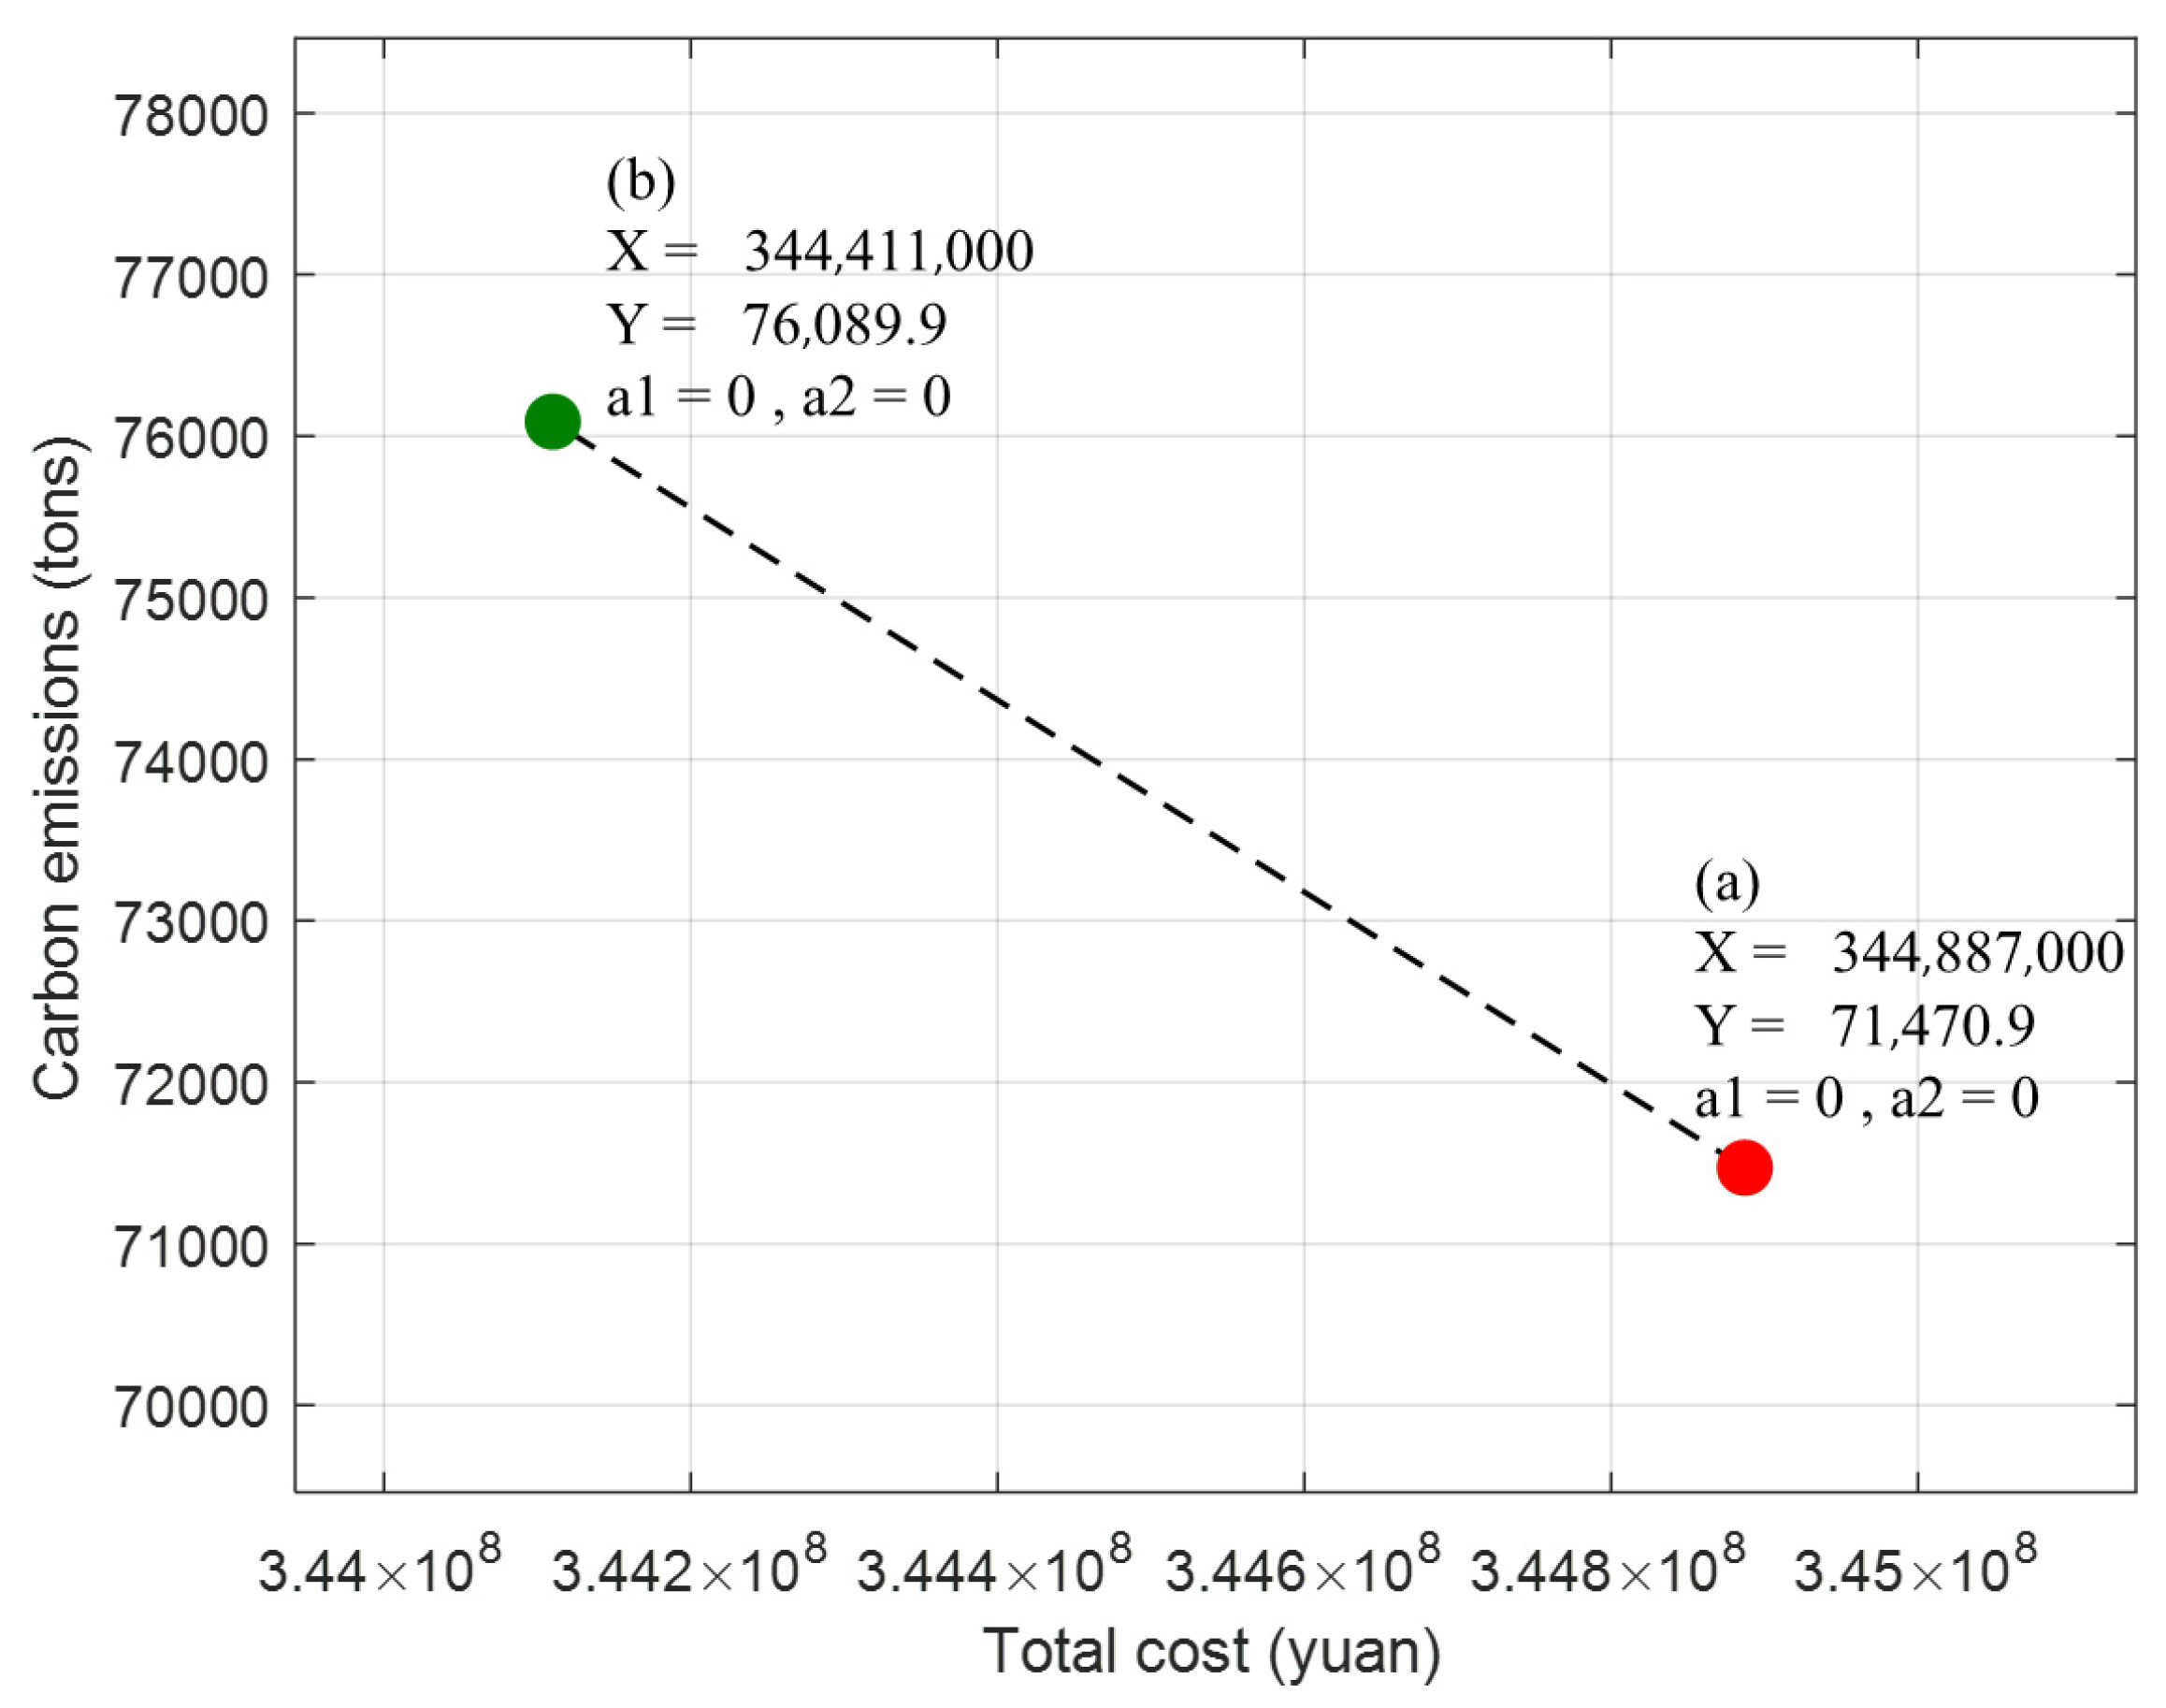
| (a) | 0 | 0 | 344,887,000 | 71,470.9 |
| (b) | 0 | 0 | 344,411,000 | 76,089.9 |
| Experimental Group | a1 | a2 | Cost/RMB | Carbon Emissions/t | Experimental Group | a1 | a2 | Cost/RMB | Carbon Emissions/t |
|---|---|---|---|---|---|---|---|---|---|
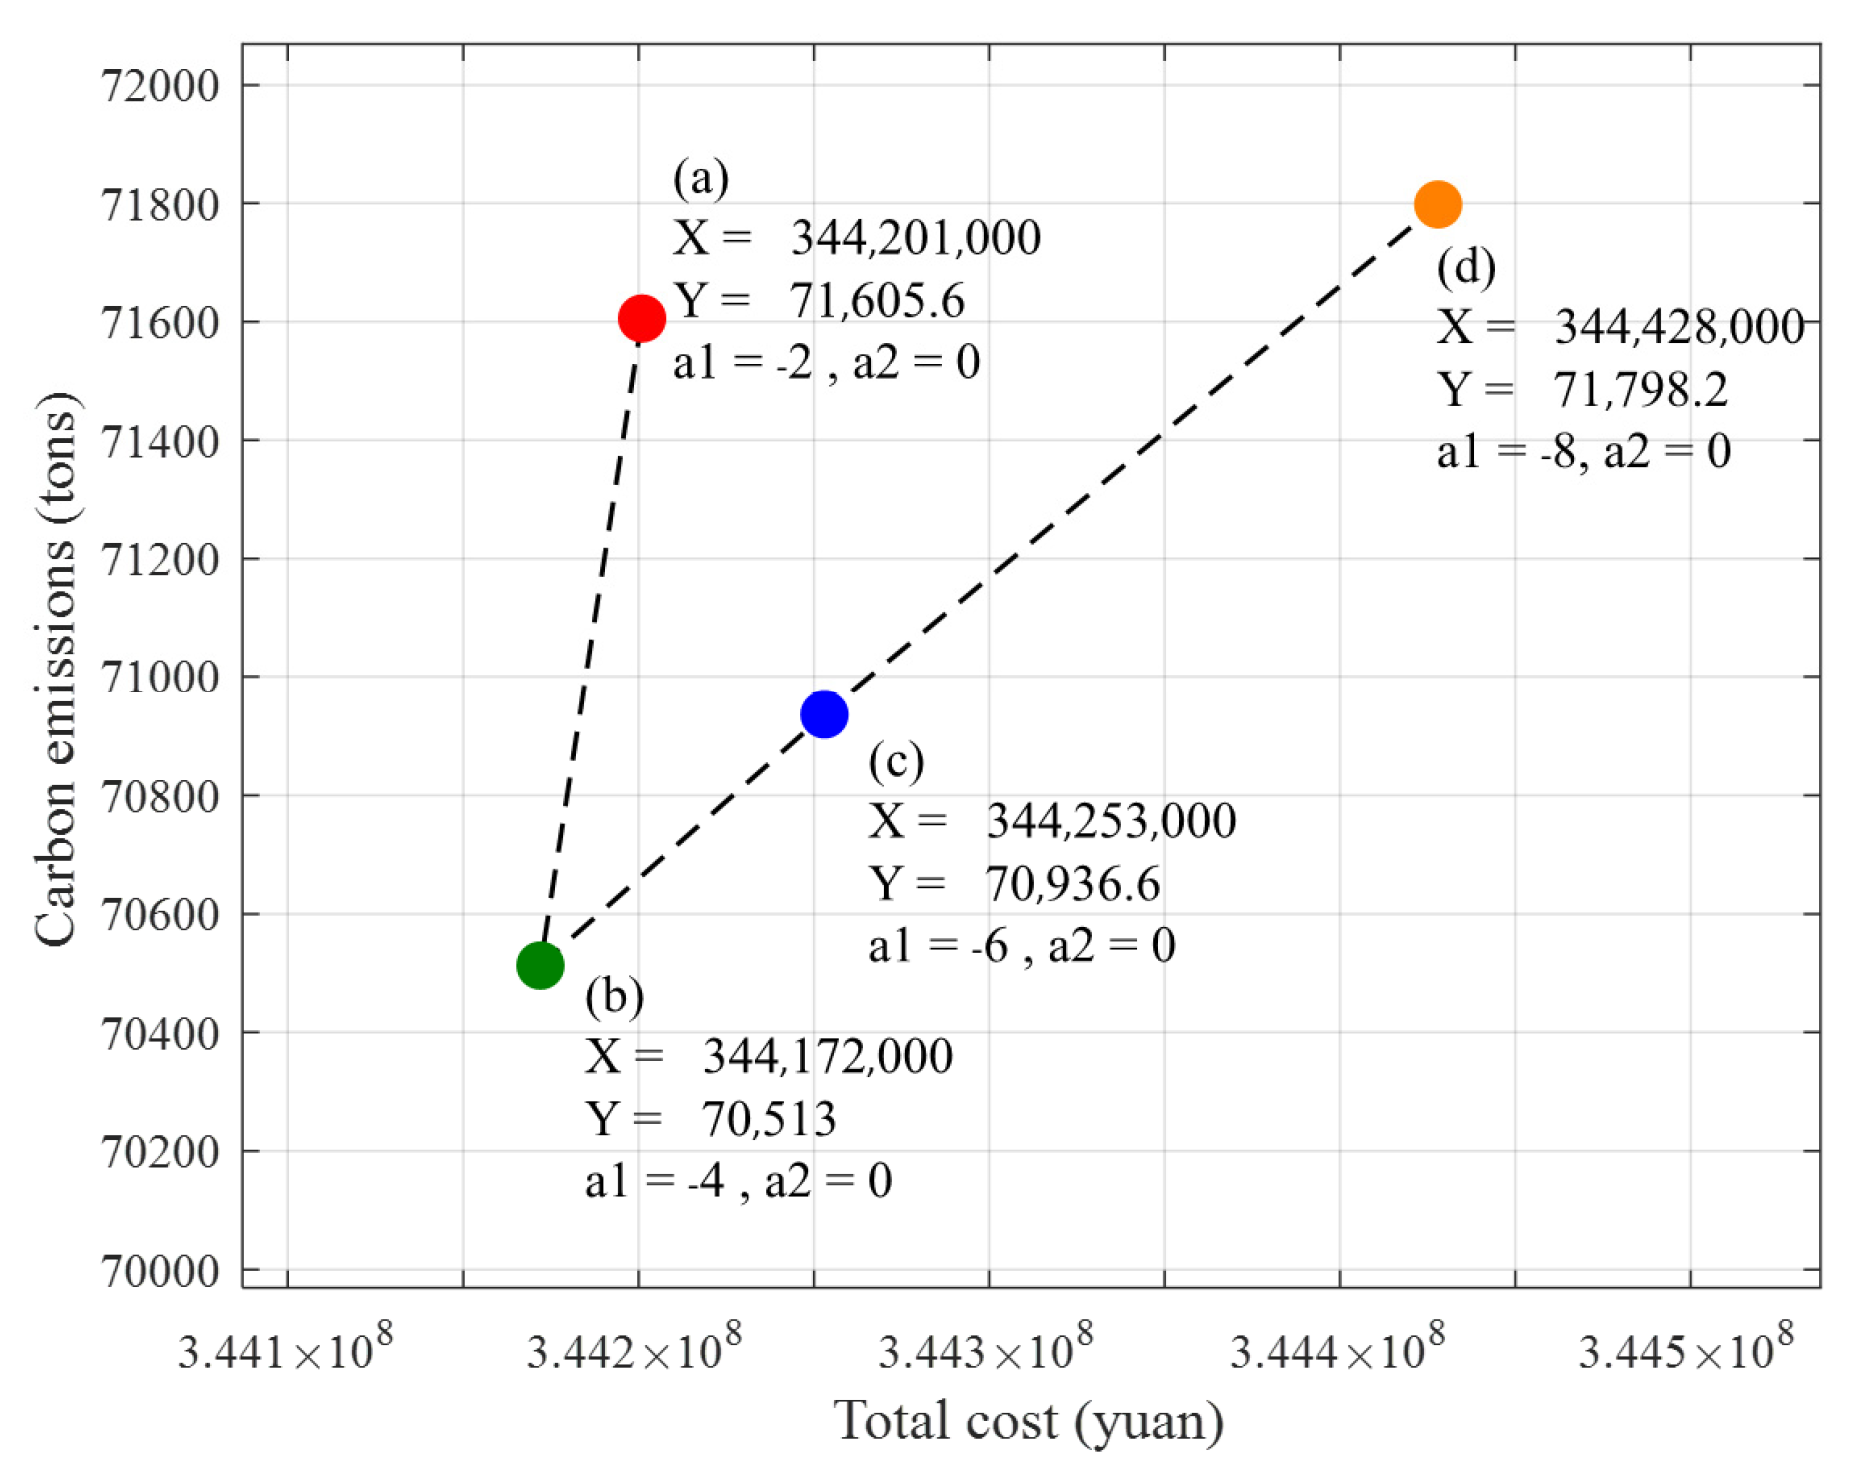
| (a) | −2 | 0 | 344,201,000 | 71,605.6 | (e) | −2 | 0 | 344,184,000 | 75,449.8 |
| (b) | −4 | 0 | 344,172,000 | 70,513.0 | (f) | −4 | 0 | 344,149,000 | 75,319.1 |
| (c) | −6 | 0 | 344,253,000 | 70,936.6 | (g) | −6 | 0 | 344,329,000 | 75,507.5 |
| (d) | −8 | 0 | 344,428,000 | 71,798.2 | (h) | −8 | 0 | 344,408,000 | 75,719.3 |
| Experimental Group | a1 | a2 | Cost/RMB | Carbon Emissions/t | Experimental Group | a1 | a2 | Cost/RMB | Carbon Emissions/t |
|---|---|---|---|---|---|---|---|---|---|
| (a) | 0 | 2 | 344,050,000 | 70,797.0 | (e) | 0 | 2 | 344,100,000 | 75,488.3 |
| (b) | 0 | 4 | 344,036,000 | 70,676.7 | (f) | 0 | 4 | 344,087,000 | 75,300.6 |
| (c) | 0 | 6 | 344,032,000 | 70,469.7 | (g) | 0 | 6 | 344,088,000 | 75,815.6 |
| (d) | 0 | 8 | 344,013,000 | 70,792.2 | (h) | 0 | 8 | 344,089,000 | 75,993.7 |
| Experimental Group | a1 | a2 | Cost/RMB | Carbon Emissions/t | Experimental Group | a1 | a2 | Cost/RMB | Carbon Emissions/t |
|---|---|---|---|---|---|---|---|---|---|
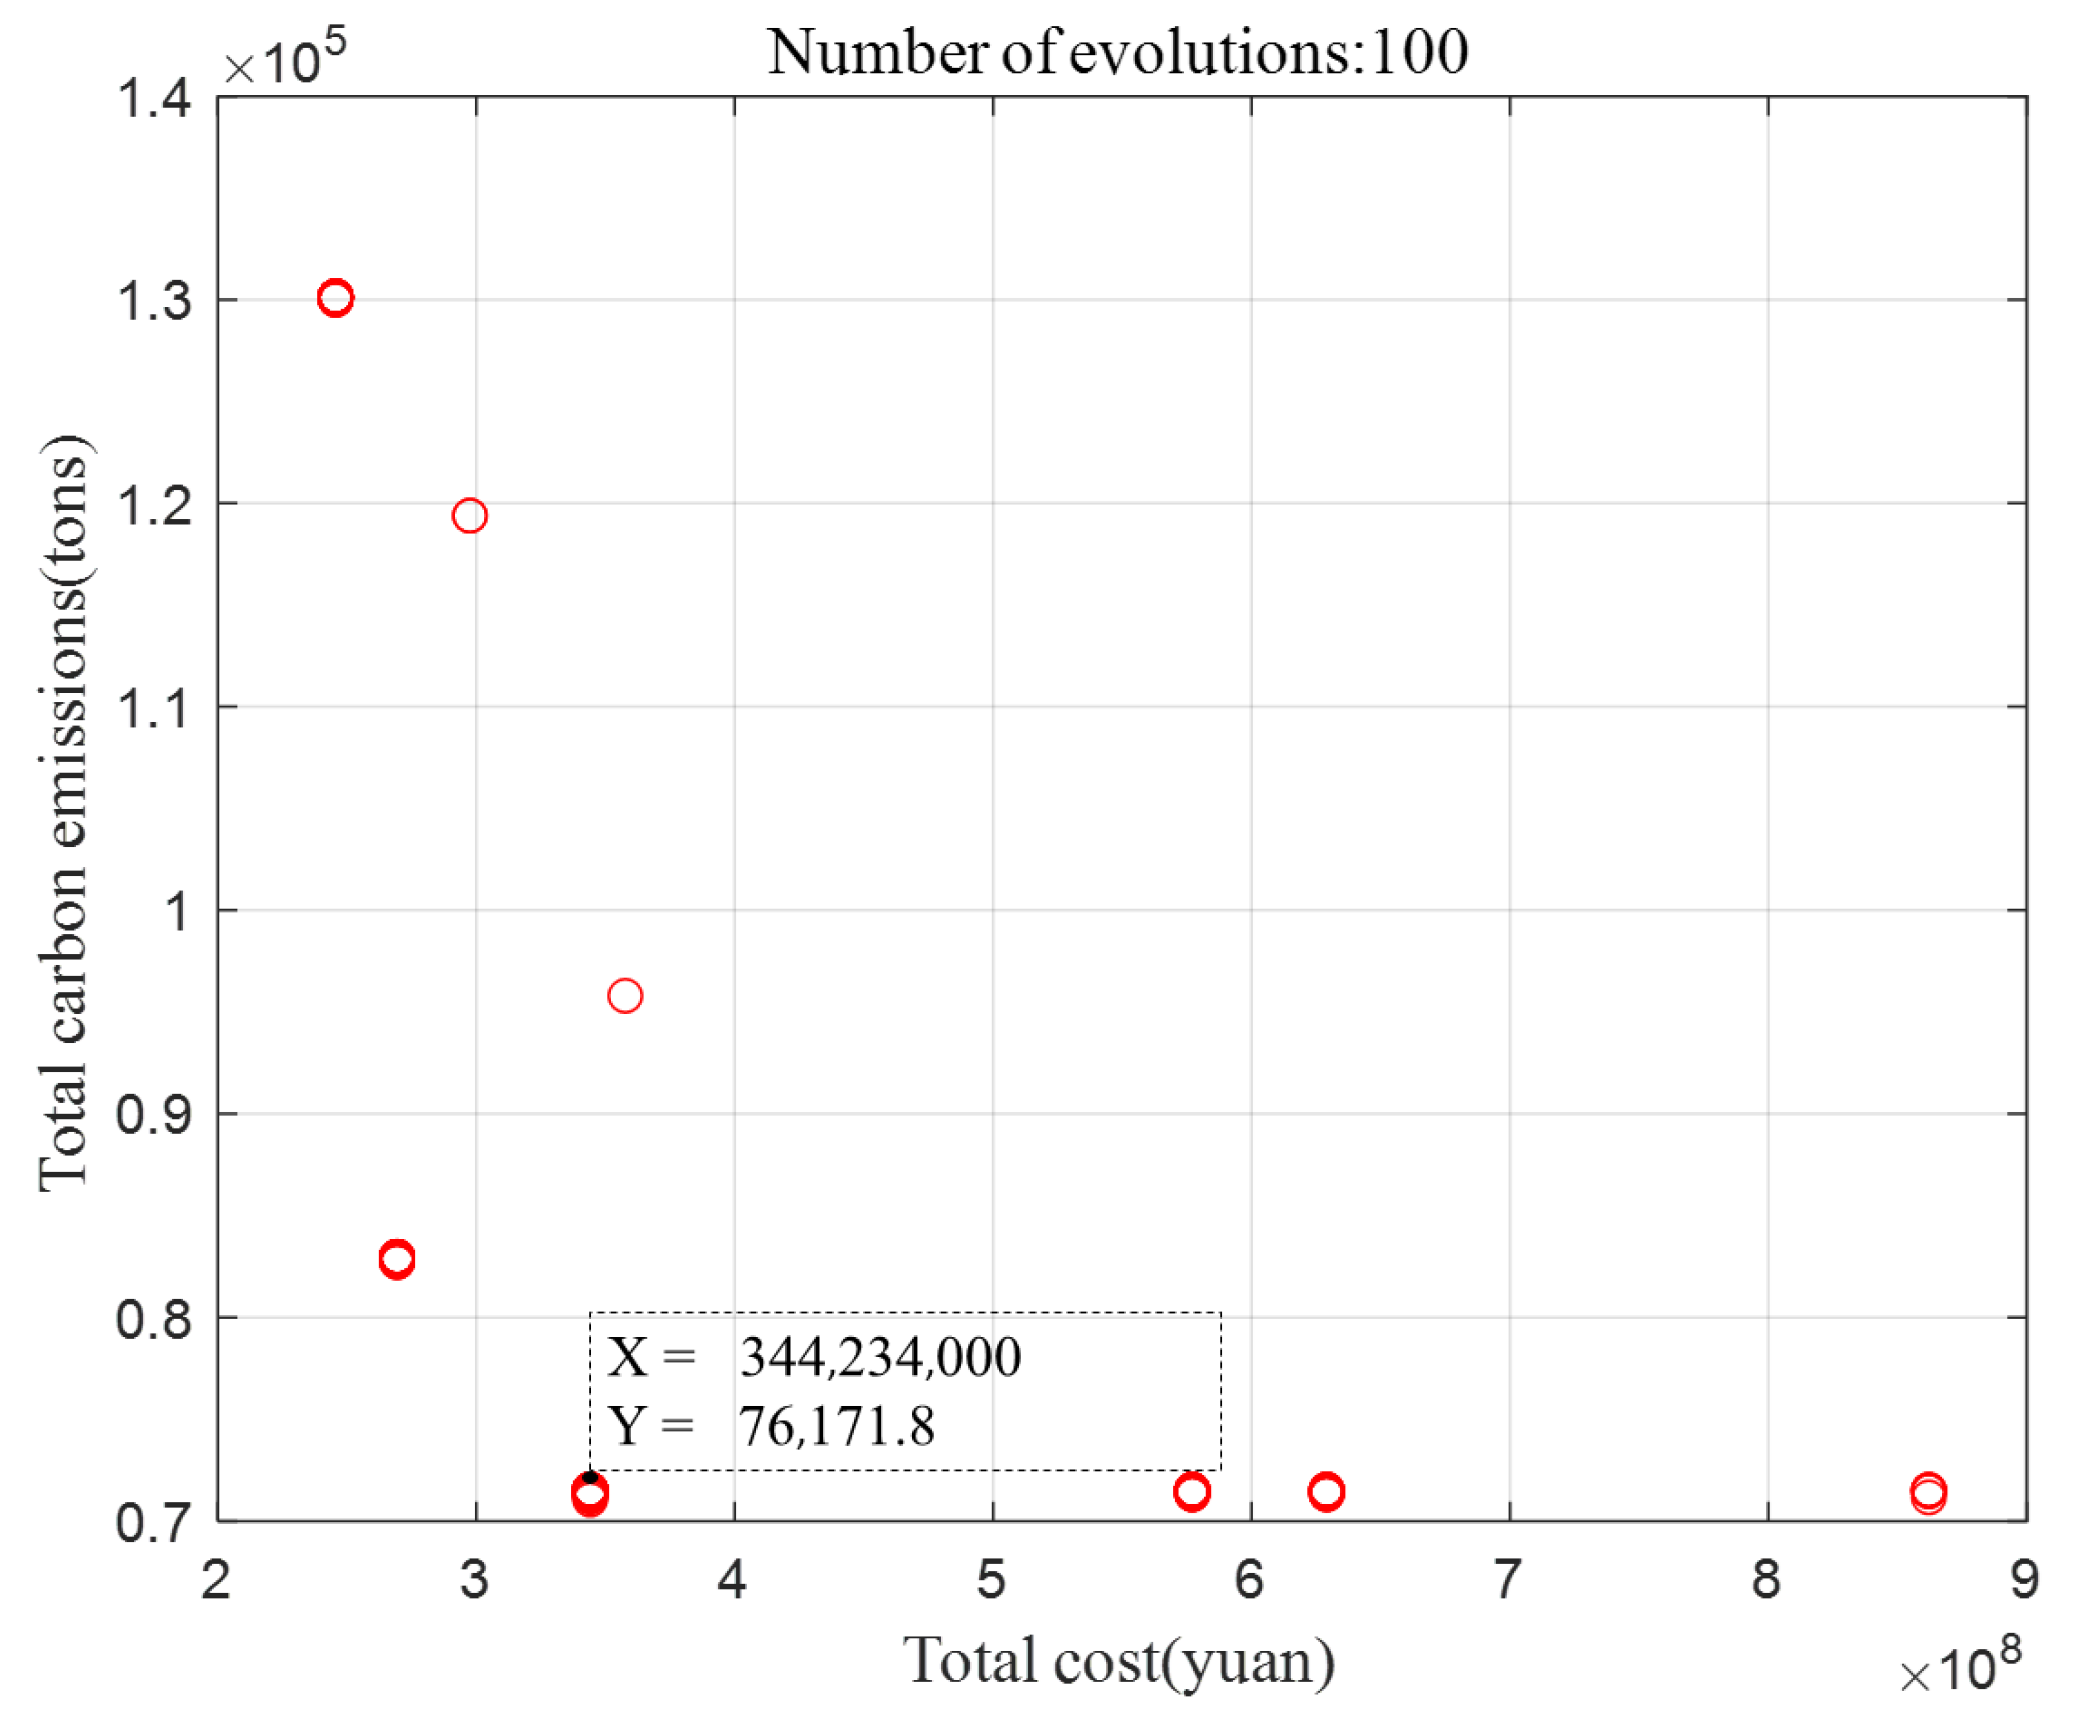
| (a) | −2 | 2 | 344,204,000 | 71,056.9 | (e) | −2 | 2 | 344,234,000 | 76,171.8 |
| (b) | −4 | 4 | 344,182,000 | 70,859.6 | (f) | −4 | 4 | 344,193,000 | 75,445.0 |
| (c) | −6 | 6 | 344,241,000 | 70,951.0 | (g) | −6 | 6 | 344,252,000 | 75,517.2 |
| (d) | −8 | 8 | 344,365,000 | 71,393.9 | (h) | −8 | 8 | 344,362,000 | 75,656.7 |
Disclaimer/Publisher’s Note: The statements, opinions and data contained in all publications are solely those of the individual author(s) and contributor(s) and not of MDPI and/or the editor(s). MDPI and/or the editor(s) disclaim responsibility for any injury to people or property resulting from any ideas, methods, instructions or products referred to in the content. |
© 2025 by the authors. Licensee MDPI, Basel, Switzerland. This article is an open access article distributed under the terms and conditions of the Creative Commons Attribution (CC BY) license (https://creativecommons.org/licenses/by/4.0/).
Share and Cite
Zhou, C.; Li, S. Reverse Logistics Network Optimization for Retired BIPV Panels in Smart City Energy Systems. Buildings 2025, 15, 2549. https://doi.org/10.3390/buildings15142549
Zhou C, Li S. Reverse Logistics Network Optimization for Retired BIPV Panels in Smart City Energy Systems. Buildings. 2025; 15(14):2549. https://doi.org/10.3390/buildings15142549
Chicago/Turabian StyleZhou, Cimeng, and Shilong Li. 2025. "Reverse Logistics Network Optimization for Retired BIPV Panels in Smart City Energy Systems" Buildings 15, no. 14: 2549. https://doi.org/10.3390/buildings15142549
APA StyleZhou, C., & Li, S. (2025). Reverse Logistics Network Optimization for Retired BIPV Panels in Smart City Energy Systems. Buildings, 15(14), 2549. https://doi.org/10.3390/buildings15142549