Article

Multi-Objective Optimization Methods for University Campus Planning and Design—A Case Study of Dalian University of Technology

1
Department of Public and Social Management Research, Party School of the CPC Dalian Municipal Committee, Dalian 116013, China
2
School of Architecture and Fine Art, Dalian University of Technology, Dalian 116024, China
*
Author to whom correspondence should be addressed.
Buildings 2025, 15(14), 2551; https://doi.org/10.3390/buildings15142551
Submission received: 27 May 2025 / Revised: 8 July 2025 / Accepted: 17 July 2025 / Published: 19 July 2025
(This article belongs to the Section Building Energy, Physics, Environment, and Systems)

Abstract

This study focuses on the multi-objective coordination problem in university campus planning and design, proposing an optimized methodology integrating an improved multi-objective decision-making framework. A five-dimensional objective system—comprising energy efficiency, spatial quality, economic cost, ecological benefits, and cultural expression—was established, alongside the identification and standardization of 29 key variables to construct mapping relationships among objective functions. On the algorithmic level, an adapted NSGA-III was implemented on the MATLAB platform (version R2022b), introducing a dynamic reference point mechanism and hybrid constraint-handling strategy to enhance convergence and solution diversity. Taking the northern residential area of the western campus of Dalian University of Technology as a case study, multiple Pareto-optimal solutions were generated. Five representative alternatives were selected and evaluated through the AHP–TOPSIS method to determine the optimal scheme. The results indicated significant improvements in energy, economic, spatial, and ecological dimensions, while also achieving quantifiable control over cultural expression. On this basis, an integrated optimization strategy targeting “form–function–environment–culture” was proposed, offering data-informed support and procedural reference for systematic campus planning. This study demonstrates the effectiveness, adaptability, and practical value of the proposed approach in addressing multi-objective conflicts in university planning.

1. Introduction

Against the backdrop of rapid urbanization and the structural upgrading of higher education, university campuses in China have evolved from single-function educational spaces into multifunctional urban complexes integrating teaching, research, living, communication, and cultural transmission [1]. This transformation has heightened demands for campus planning and design, necessitating not only the fulfillment of fundamental functional layouts [2], but also the achievement of synergistic optimization across multiple dimensions, including space, economy, energy, and culture [3]. Furthermore, campus planning is characterized by protracted timescales, multiple stakeholders, and frequent modifications—features that further aggravate its inherent complexity [4]. In this context, traditional experience-driven planning methodologies increasingly reveal limitations [5]. Sole reliance on experiential knowledge for planning and design lacks both a systematic framework for objective modeling and mechanisms for dynamically identifying and reconciling variable weighting and goal conflicts [6]. Consequently, such approaches struggle to facilitate the generation of holistic optimal solutions, thereby compromising decision-making scientific rigor and implementation efficiency [7].
To address these challenges of multi-objective conflicts and insufficient system modeling, algorithm-driven multi-objective optimization (MOO) methods have been progressively introduced into architecture and urban planning in recent years [8]. This approach establishes an objective function framework, formulates weighting strategies, and implements search mechanisms, enabling its widespread application in physically performance-oriented building optimization tasks [9]—such as energy consumption, daylighting comfort, and thermal regulation [10,11,12]. Established algorithms, including NSGA-II, Particle Swarm Optimization (PSO), and Differential Evolution (DE) [13], have demonstrated significant efficacy at the building physics scale. For instance, Long [14] utilized DE to optimize building envelope configurations, achieving marked improvements in energy efficiency; concurrently, Vukadinović et al. [15] employed NSGA-II for multi-objective fenestration optimization in high-rise buildings, simultaneously balancing thermal comfort and natural ventilation performance.
However, these methods are predominantly oriented toward low-to-medium-dimensional technical objectives and exhibit significant limitations—including difficulties in comprehensive modeling, homogeneous solution distributions, and insufficient adaptability—when applied to complex campus-scale planning tasks characterized by hierarchically integrated goals, heterogeneous variable types, and multi-stakeholder participation [16,17]. For instance, in relevant studies attempting optimization model integration, Pilechiha et al. [18] proposed a performance-driven building massing design approach, yet focused primarily on single-structure ventilation and daylight optimization, lacking spatial systemic perspective; Cubukcuoglu et al. [19] integrated pedestrian flow paths and visual fields into their optimization process, representing progress in behavioral objective modeling but failing to establish a holistic parameterization framework for planning design or support systematic integration in complex scenarios.
To address high-dimensional optimization challenges, Deb et al. [20] proposed NSGA-III (Non-Dominated Sorting Genetic Algorithm III) as an enhanced version of NSGA-II. This method introduces a reference point-based solution maintenance strategy and an improved non-dominated sorting mechanism, significantly enhancing solution diversity and global convergence capabilities—particularly for multi-objective problems with four or more dimensions [21]. Recently, this algorithm has been successfully deployed in complex architectural and urban planning systems [22,23,24]. For instance, Wang et al. [25] applied NSGA-III to optimize university dormitories in cold regions, achieving high-dimensional balance among building orientation, material selection, and indoor temperature control; concurrently, Walimbe et al. [26] employed the model for campus building optimization, integrating metrics spanning spatial utilization efficiency, energy consumption, lighting, heating, and ventilation—further validating NSGA-III’s efficacy and adaptability in high-dimensional objective spaces.
Nevertheless, the systematic application of NSGA-III in university campus planning remains relatively rare. On one hand, there is still a lack of clarity regarding its modeling pathway, particularly in constructing complex objective functions, assigning parameter weights, and handling variable constraints [27]. On the other hand, effectively integrating qualitative and quantitative objectives—while improving the interpretability and operational feasibility of the optimization outcomes—remains a core challenge in this domain [28]. In particular, cultural expression, as a distinctive feature of campus environments, has gained increasing academic attention, yet is often overlooked in existing optimization frameworks. Even when included, cultural indicators are frequently parameterized based on subjective expert judgment, lacking robust and reproducible quantification methods [29]. Due to their inherently subjective nature and the absence of standardized measurement protocols, cultural indicators are difficult to model using conventional physical variable approaches. Several studies have attempted to quantify subjective indicators using methods such as expert scoring [30], the Delphi technique [31], and fuzzy comprehensive evaluation [32]. For instance, Zhao et al. [33] developed a cultural identity scoring model based on user perception surveys and stratified sampling in community design, standardizing the results and incorporating them as coefficients in the objective function. Rossetti et al. [34] extracted architectural features via semantic segmentation and applied discrete choice models to translate user spatial preferences into quantifiable variables, thereby enabling the modeling of subjective perception and spatial typologies. Similarly, Guo et al. [35] employed fuzzy mathematics in heritage conservation research to transform subjective evaluations of building appearance and cultural imagery into computable values, enabling the quantitative analysis of architectural perception. Despite these advances, current approaches remain limited in scope, typically focusing on localized scenarios or semantic-level analysis, and lack a systematic framework capable of comprehensively optimizing multidimensional planning elements.
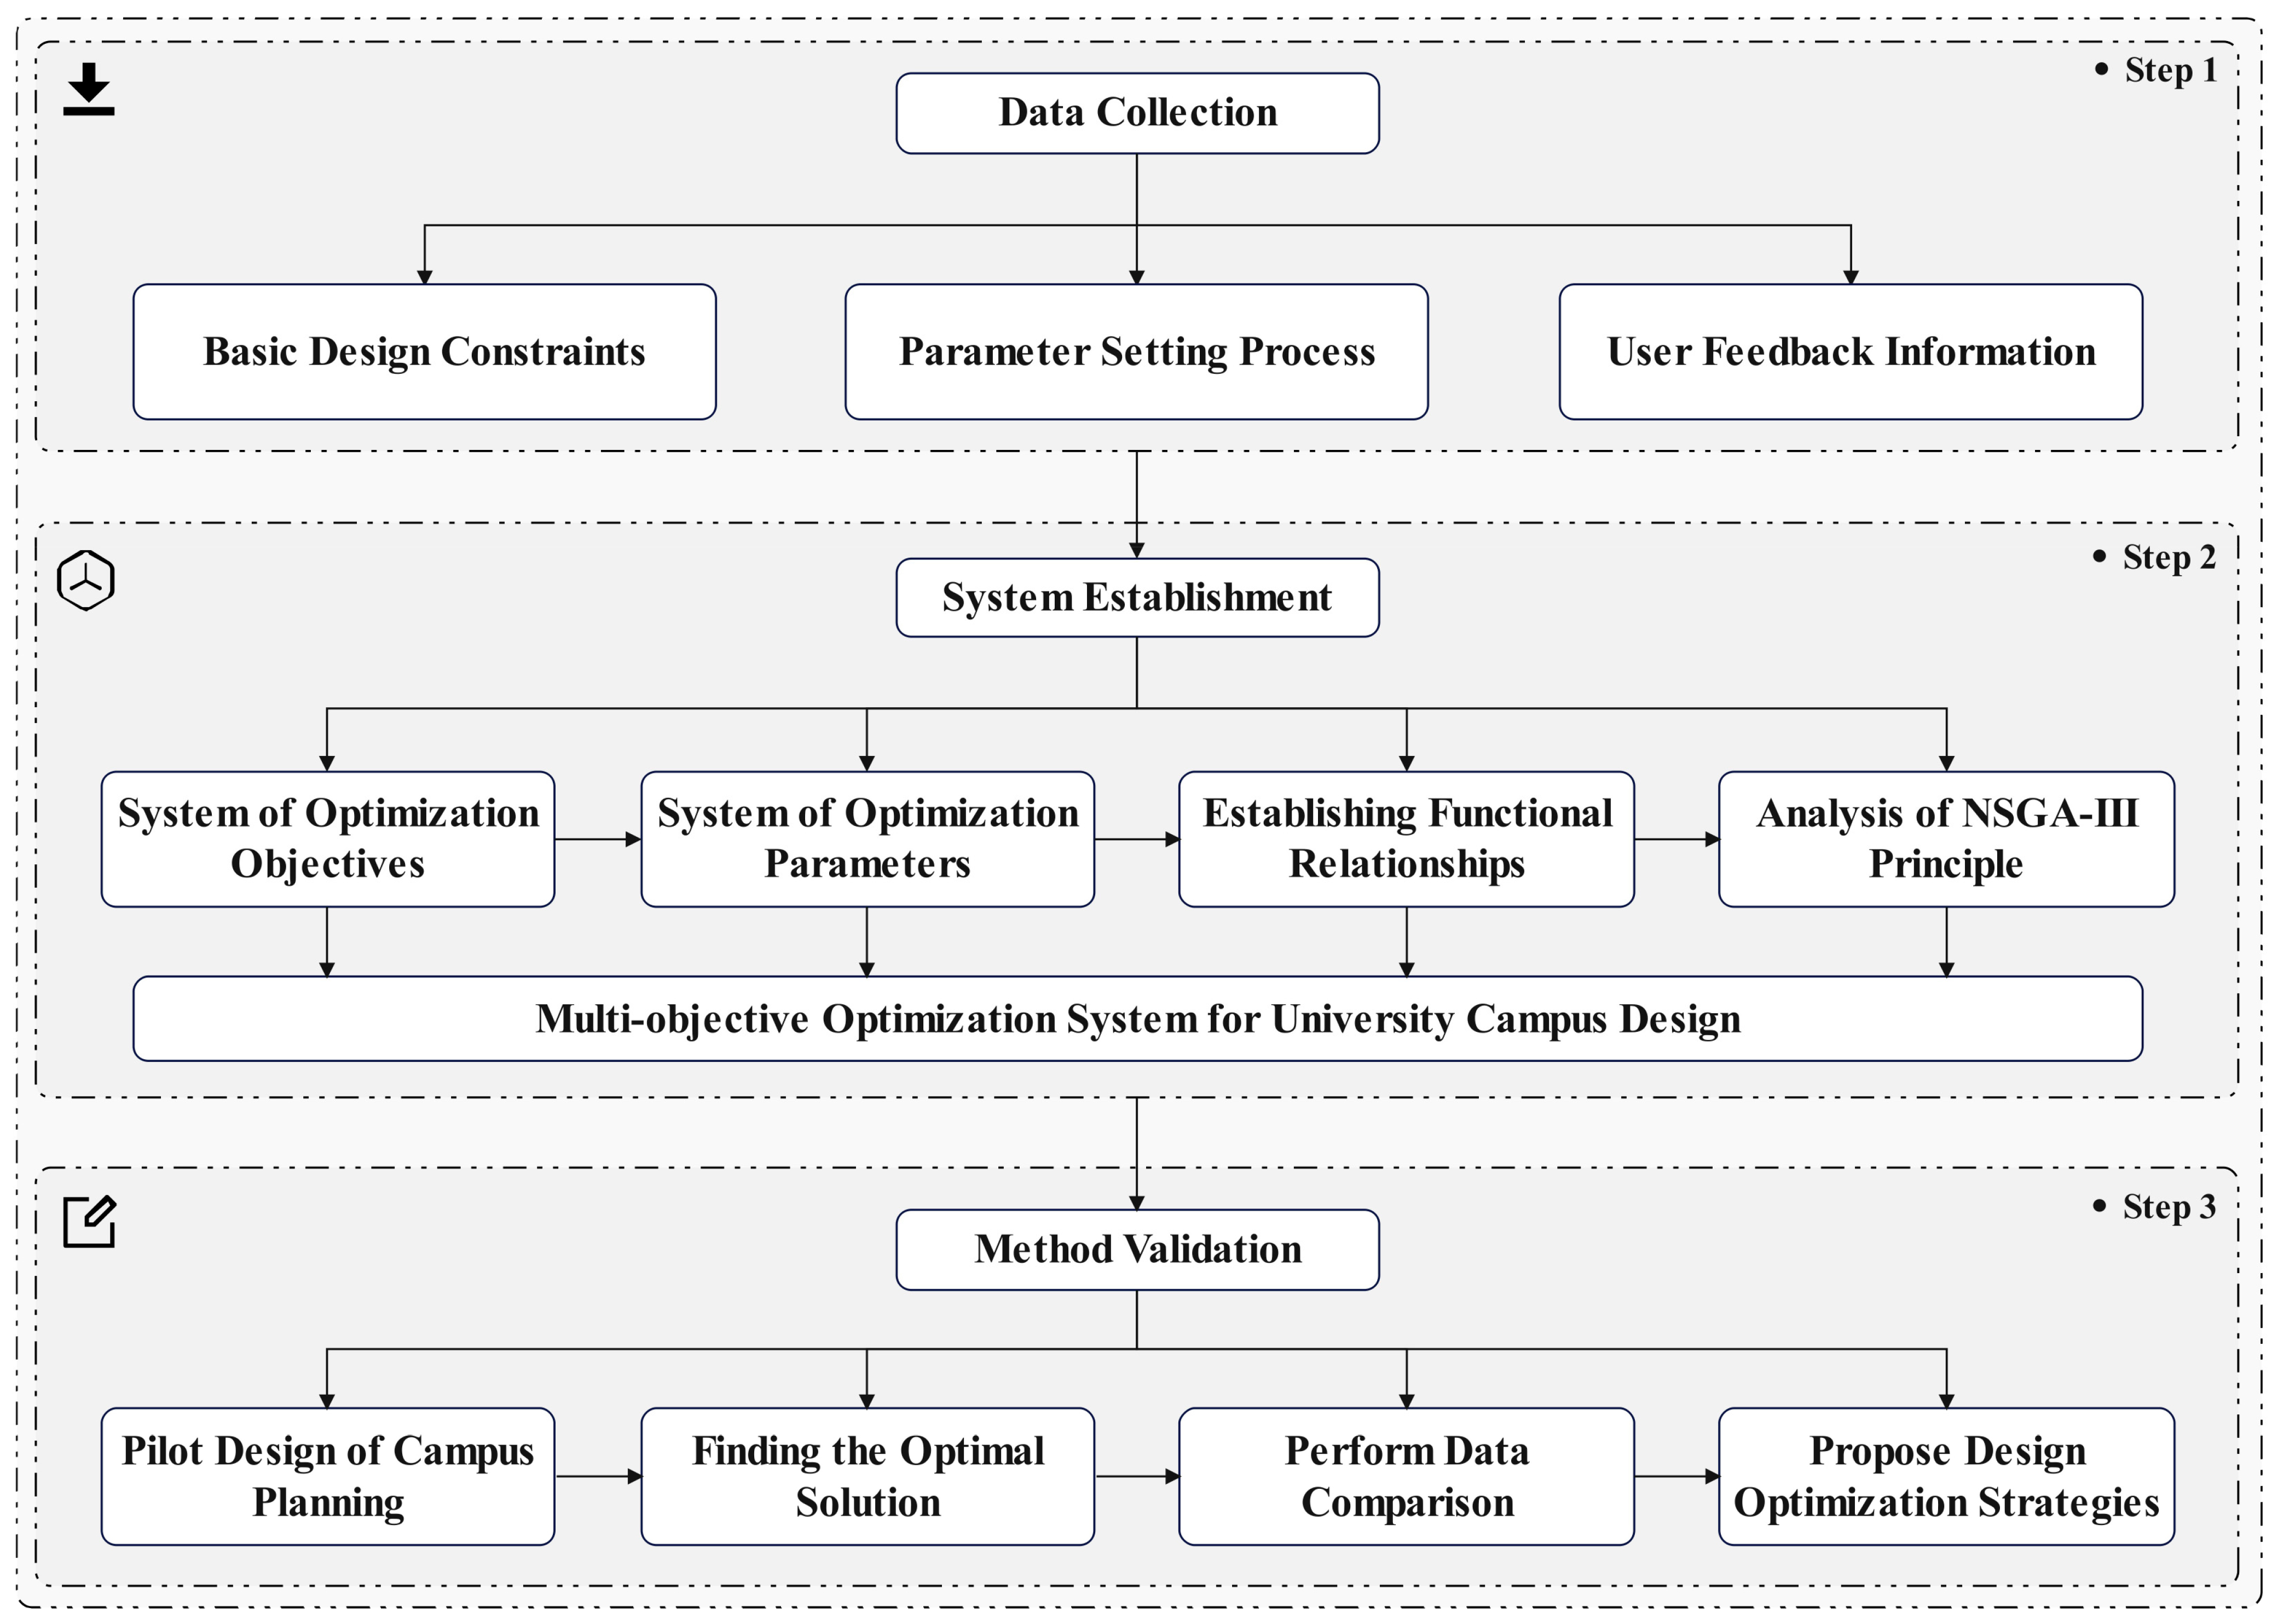
Against this backdrop, this study takes the northern residential area of a university campus in Dalian as a case study to propose a multi-objective optimization framework for campus planning. This framework integrates expert evaluation, multi-parameter mapping, and an improved NSGA-III algorithm. The overall research structure is illustrated in Figure 1. The main contributions of this study include the following: (1) Constructing an optimization framework integrating five objective categories—energy efficiency, spatial quality, economic cost, ecological benefits, and cultural expression—to ensure comprehensiveness and comparability while minimizing dimensional redundancy. (2) Developing an operational parameter-to-objective mapping system through the integration of 29 expert-scored variables with standardized processing. (3) Implementing algorithmic enhancements via dynamic reference points and a hierarchical constraint-handling mechanism to bolster solution diversity and global search capability in high-dimensional optimization, thereby ensuring practical applicability in planning implementation.
The core innovation of this study lies in developing a methodological framework that integrates expert assessment with multi-objective optimization algorithms to address the challenges of conflicting objectives and high variable complexity in university campus planning. By leveraging expert scoring to establish quantitative relationships between parameters and objectives, the approach resolves issues of subjectivity and quantification difficulties. Building upon this foundation, an enhanced NSGA-III algorithm is introduced to improve solution efficiency and diversity in high-dimensional problem-solving. Empirical validation through a case study at a Dalian university demonstrates the method’s feasibility in practical campus planning scenarios. While the case exhibits site-specific constraints, the proposed modeling framework and optimization workflow exhibit strong adaptability and scalability, providing methodological reference and technical scaffolding for campus planning in diverse regional contexts.

2. Materials and Methods

2.1. Project Overview

This study focuses on the design project of the northern student residential area in the western campus of Dalian University of Technology, located in the northwest of the main campus, bounded by Jingtian Street to the east, Boyuan Road to the west, and Lingshui Road to the south (Figure 2). The site currently consists of developable land and green space, with relatively flat topography. The proposed development includes student dormitories, dining facilities, supporting amenities, and cultural activity spaces. The southern boundary adjoins the existing built-up area of the western campus, which features a well-defined morphological style and spatial axis system. Therefore, the new planning must achieve spatial and cultural continuity with the existing campus fabric. The project owner requires the spatial organization to follow a “collegiate system” in order to reflect and extend the cultural identity of Dalian University of Technology. At the same time, there are high expectations regarding cost efficiency, functional rationality, and spatial comfort, along with the need to comply with green building standards, ecological sensitivity, and sustainability goals. These diverse demands create inherent tensions, particularly in balancing the optimization of energy efficiency, spatial quality, economic cost, ecological benefits, and cultural expression. Traditional planning approaches often struggle to address these multi-objective challenges with sufficient rigor or quantifiable support.
To address this, this study introduces the Non-Dominated Sorting Genetic Algorithm III (NSGA-III), combined with expert assessments and subjective perception feedback, to construct a five-dimensional multi-objective optimization model. The aim is to explore a systematic planning approach under complex constraints and provide both theoretical and practical support for campus planning of higher education.

2.2. Data Sources

The data for this study were derived from three primary sources:
(1)
Fundamental design constraints: The project brief, provided by the project owner, defines key technical and economic parameters, including site area, gross floor area, floor area ratio (FAR), and green space ratio. It also outlines comprehensive design principles such as energy conservation, environmental performance, investment control, and spatial quality. These constraints defined the boundaries and initial basis for setting optimization variables and constructing objective functions.
(2)
Parameter configuration: During the preliminary design phase, key variables such as window-to-wall ratio, shape coefficient, building height, and orientation were identified based on building physics, environmental conditions, and project positioning. Value ranges for these variables were determined by integrating regulatory standards, construction limitations, and functional adaptability, with parameters being provided by the design team.
(3)
User and expert questionnaire data: To enhance the subjective adaptability and cultural expression of the planning optimization process, two rounds of questionnaire surveys were conducted. The first round collected 102 valid responses from faculty and students, focusing on subjective evaluations of the design schemes in terms of spatial experience, cultural perception, and environmental comfort. These results were used to inform the evaluation of model input parameters. The second round targeted seven experts with professional backgrounds in campus planning and green building design. Using the AHP–TOPSIS method, experts assessed the relative importance of the optimization objectives and contributed to the selection of the optimal plan. The two questionnaires were structurally independent and purpose-specific, serving as a bridge between subjective feedback and model computation. Detailed analytical methods are described in Section 2.3.2 and Section 2.3.4.

2.3. Research Methods

2.3.1. Construction of the Objective Framework

To comprehensively address the diverse demands in this campus planning, this study adopts a complex systems perspective to construct a multi-objective optimization framework encompassing five core dimensions: energy efficiency, spatial quality, economic cost, ecological benefits, and cultural expression. This framework aims to balance building performance, functional suitability, resource input, environmental compatibility, and cultural continuity, providing a clear basis for model evaluation.
Specifically, the first three dimensions—energy efficiency, spatial quality, and economic cost—are based on the “energy–comfort–cost–environment” optimization logic proposed by Chantrelle et al. [36] and are characterized by clear physical attributes and computable indicators. To enhance the cultural perception and ecological resilience of campus spaces, two additional dimensions—ecological benefits and cultural expression—are incorporated into the model. Among them, cultural expression emphasizes the continuity of architectural language, the integration of historical spatial axes, and the use of locally contextualized materials. This dimension draws on the theoretical framework of campus cultural space proposed by Zeng Zhongzhong et al. [37] and serves as a quantifiable indicator of cultural identity. In summary, the five-dimensional objective system balances quantitative and qualitative elements while maintaining operational feasibility, thereby laying a logical and evaluative foundation for the subsequent selection of variables and determination of weights in the model.

2.3.2. Variable Selection and Coefficient Determination for Objective Functions

Based on the established multi-objective framework, this study selected 29 key planning parameters by referencing Hajrasouliha’s classification of seven campus design elements [38], along with practical experience from university campus planning [39] and insights from the green building design literature [40], as detailed in Table 1. These parameters cover a wide range of physical and experiential attributes, including building orientation, window-to-wall ratio, functional mix, path connectivity, green coverage ratio, material adaptability, and expression of cultural symbols, aiming to integrate physical performance with users’ perceptual experience.
To ensure that each objective function incorporates only the most relevant variables and to reasonably assign coefficient weights within each function, a first-round expert questionnaire was conducted. Using a five-point Likert scale, the survey invited 120 participants—including university faculty and students from the fields of architecture, urban planning, cultural heritage, and environmental design—and collected 102 valid responses. Respondents were asked to evaluate the importance of each variable with respect to the five optimization dimensions.
The collected data were processed through the following steps for use in objective function construction:
Reliability Analysis: For each of the five dimensions, Cronbach’s α coefficient tests were conducted on the data. The results showed strong internal consistency across all dimensions (α > 0.75). In particular, the “cultural expression” dimension achieved an α value of 0.999, indicating high consistency in expert ratings.
Variable Filtering: The mean score of each variable was calculated within each dimension. Variables with a mean score exceeding the dimension’s overall average were retained as input variables in the corresponding objective function.
Coefficient Assignment: The retained variables’ average scores were standardized using Z-score normalization to reflect their relative importance and weight in the optimization model. This method preserves the variation and directional tendency of the expert scores, allowing the functions to represent both positive and negative effects during optimization.
This approach not only enhances the computability of qualitative variables (e.g., cultural symbols) but also mitigates subjectivity through consensus-based weighting. All scoring procedures and data-processing details are provided in Supplementary Materials.

2.3.3. NSGA-III Algorithm Modeling and Solution

Based on the results of the expert survey, this study adopted the Non-Dominated Sorting Genetic Algorithm III (NSGA-III) to generate candidate solutions for the multi-objective planning problem of the university campus. NSGA-III is widely applied in complex system optimization tasks due to its ability to handle high-dimensional objective spaces [41].
The optimization framework includes five objective functions: energy efficiency (Fee), spatial quality (Fsq), economic costs (Fec), ecological benefits (Feb), and cultural expression (Fce). Each objective function is composed of variables whose average scores in the corresponding dimension are significantly higher than the mean. The coefficients of these variables are derived from the standardized (Z-score) results of the expert ratings, representing the relative importance of each parameter within its respective objective. Since Z-score normalization retains the directional characteristics of the original ratings, the sign (positive or negative) of each coefficient directly reflects expert perceptions and requires no further manual weighting. For instance, “building orientation (DP1)” received predominantly positive evaluations for its role in enhancing energy efficiency, resulting in a positive standardized score. Conversely, “window-to-wall ratio (DP3)” was perceived as potentially increasing cooling loads during summer, leading to lower ratings and a negative standardized coefficient. This approach ensures that the objective functions remain both data-driven and interpretable, capturing expert consensus and directional trends.
The structure of each objective function and corresponding variable coefficient is presented in Table 2. The NSGA-III was implemented using a standard evolutionary procedure, including population initialization, non-dominated sorting, reference point guidance, crossover, and mutation operations. In each run, the algorithm searches for optimal solutions across the five-dimensional objective space, ultimately generating an approximate Pareto-optimal front. This solution set provides a well-balanced basis for subsequent scheme comparison and multi-criteria evaluation.
The core principles of the algorithm include the following:
(1) Reference point mechanism: NSGA-III introduces reference points to maintain population diversity and efficiently search the high-dimensional objective space. The number of reference points is calculated using combinatorial formulas (Equation (1)):
H = M + p 1 p
where M is the number of objective functions and p is the uniform division count per objective dimension. Reference points guide population distribution to ensure solution set coverage across the entire objective space.
(2) Adaptive normalization: By calculating the ideal point of the design goal to translate the target value and eliminate dimensional differences. The ideal point represents the minimum value of each target in the current population. The calculation formula of the ideal point is shown as Equation (2):
z i m i n = min x S t f i x        i = 1,2 , , M
Here, S t represents all the possibilities of the current optimization parameters, f i x is the objective function of the planning project, and z i m i n is the minimum value of the i th objective function in the current population S t , that is, the theoretical lower limit of the current optimal solution, that is, the optimal target value.
After determining the ideal point, the calculation of the extreme point of A needs to be carried out. The extreme point is the individual that minimizes the ASF value and is used to construct the intercept of the hyperplane. The calculation formula is shown in Equation (3):
A S F x , w = max 1 i M f i x w i + ϵ
Here, f i x is the target value after the optimization parameter changes, that is, f i x = f i x z i m i n , and the target value is normalized relative to the ideal point; w i is the weight vector used to search for extreme points, guiding the search direction. ϵ is the minimum constant, preventing the denominator from being zero, and is usually taken as 10−6.
After obtaining the extreme points of the objective function, intercept normalization processing is required. The calculation formula is shown in Equation (4):
f i x = f i x a i z i m i n
Here, a i is the intercept of the hyperplane composed of extreme points on the i   th target axis. The normalized target vector f i x calculated in this way can scale the optimization target value within the range 0,1 to eliminate the dimensional difference.
(3) Correlation operation: By calculating the vertical distance from each individual (alternative plan) to the optimal target value, the correlation between the individual and the reference point is determined to select a better planning scheme. The calculation method of the vertical distance is shown as Equation (5):
d x , z j = f ( x ) z j z j 2 z j f ( x )
Here, f ( x ) is the normalized value of a certain optimization objective, and z j is the coordinate of the j th reference point.
Associate the reference point corresponding to the reference line with the shortest distance with this individual, that is, assign a reference point to this individual. According to the minimum value of the vertical distance, determine the reference point association of each population individual.
(4) Niche retention mechanism: The algorithm will give priority to selecting the optimization scheme close to this reference point as the final optimization scheme. The principle is shown as Equation (6):
ρ j = x F l I ( π ( x ) = z j )
Here, F l is the set of alternative schemes, z j is the ideal optimization scheme, and π ( x ) is the reference point for individual association. Through the calculation of the indicator function, ρ j is the number of individuals associated with the reference point z j in the current critical layer F l .
The final alternative optimization schemes are composed of the individuals selected by ρ j in the non-dominated layers F 1 , F 2 ,   F l , forming the optimal scheme solution set for scheme decision-making.

2.3.4. AHP-TOPSIS Decision-Making

To evaluate the Pareto non-dominated solution sets, an AHP-TOPSIS-coupled model was applied. AHP determined objective weights through judgment matrices scored by seven domain experts (Equation (7)) [42]:
w i = j = 1 n a i j n k = 1 n j = 1 n a k j n
Here, a i j represents the degree of importance of optimization objective i relative to optimization objective j; w i is the weight of the i-th element.
The weight values determined by AHP are then used for TOPSIS (approximate ideal solution) to make the final decision. In TOPSIS, the data is first adjusted to the interval [0, 1] through normalization processing. The Euclidean distance from each scheme to the positive ideal solution and the negative ideal solution is calculated. The calculation formula is shown in Equation (8):
D i + / = j = 1 n v i j Z j + / 2
Here, D i + represents the distance from Scheme i   to the positive ideal solution; the smaller it is, the closer it is to the optimal solution. D i represents the distance from Scheme i   to the negative ideal solution; the larger it is, the farther it is from the worst solution.
The optimal scheme is determined by calculating the comprehensive score Ci, and the formula is shown in Equation (9):
C i = D i D i + + D i
This method balances the efficiency and accuracy of multi-objective optimization and selects the optimal design scheme by combining the results of AHP and TOPSIS.

3. Results

3.1. Optimized Schemes

3.1.1. Optimization Model and Solution Configuration

Based on the previously constructed five-dimensional multi-objective optimization model, this study employed the NSGA-III algorithm on the MATLAB platform to perform scheme optimization (Figure 3).
To ensure the robustness and representativeness of the optimization results, the algorithm was configured with 600 generations and a population size of 100. Parameter settings followed the NSGA-III configuration guidelines proposed by Zhu et al. [43,44], with a crossover probability of 0.9, mutation distribution index of 0.1, and mutation step size of 0.02. These values were selected to balance exploration and convergence, avoiding getting trapped in local optima and premature stagnation while preserving solution diversity. Experimental runs demonstrated that convergence stabilized around the 35th generation, with consistently high-quality Pareto front solutions.
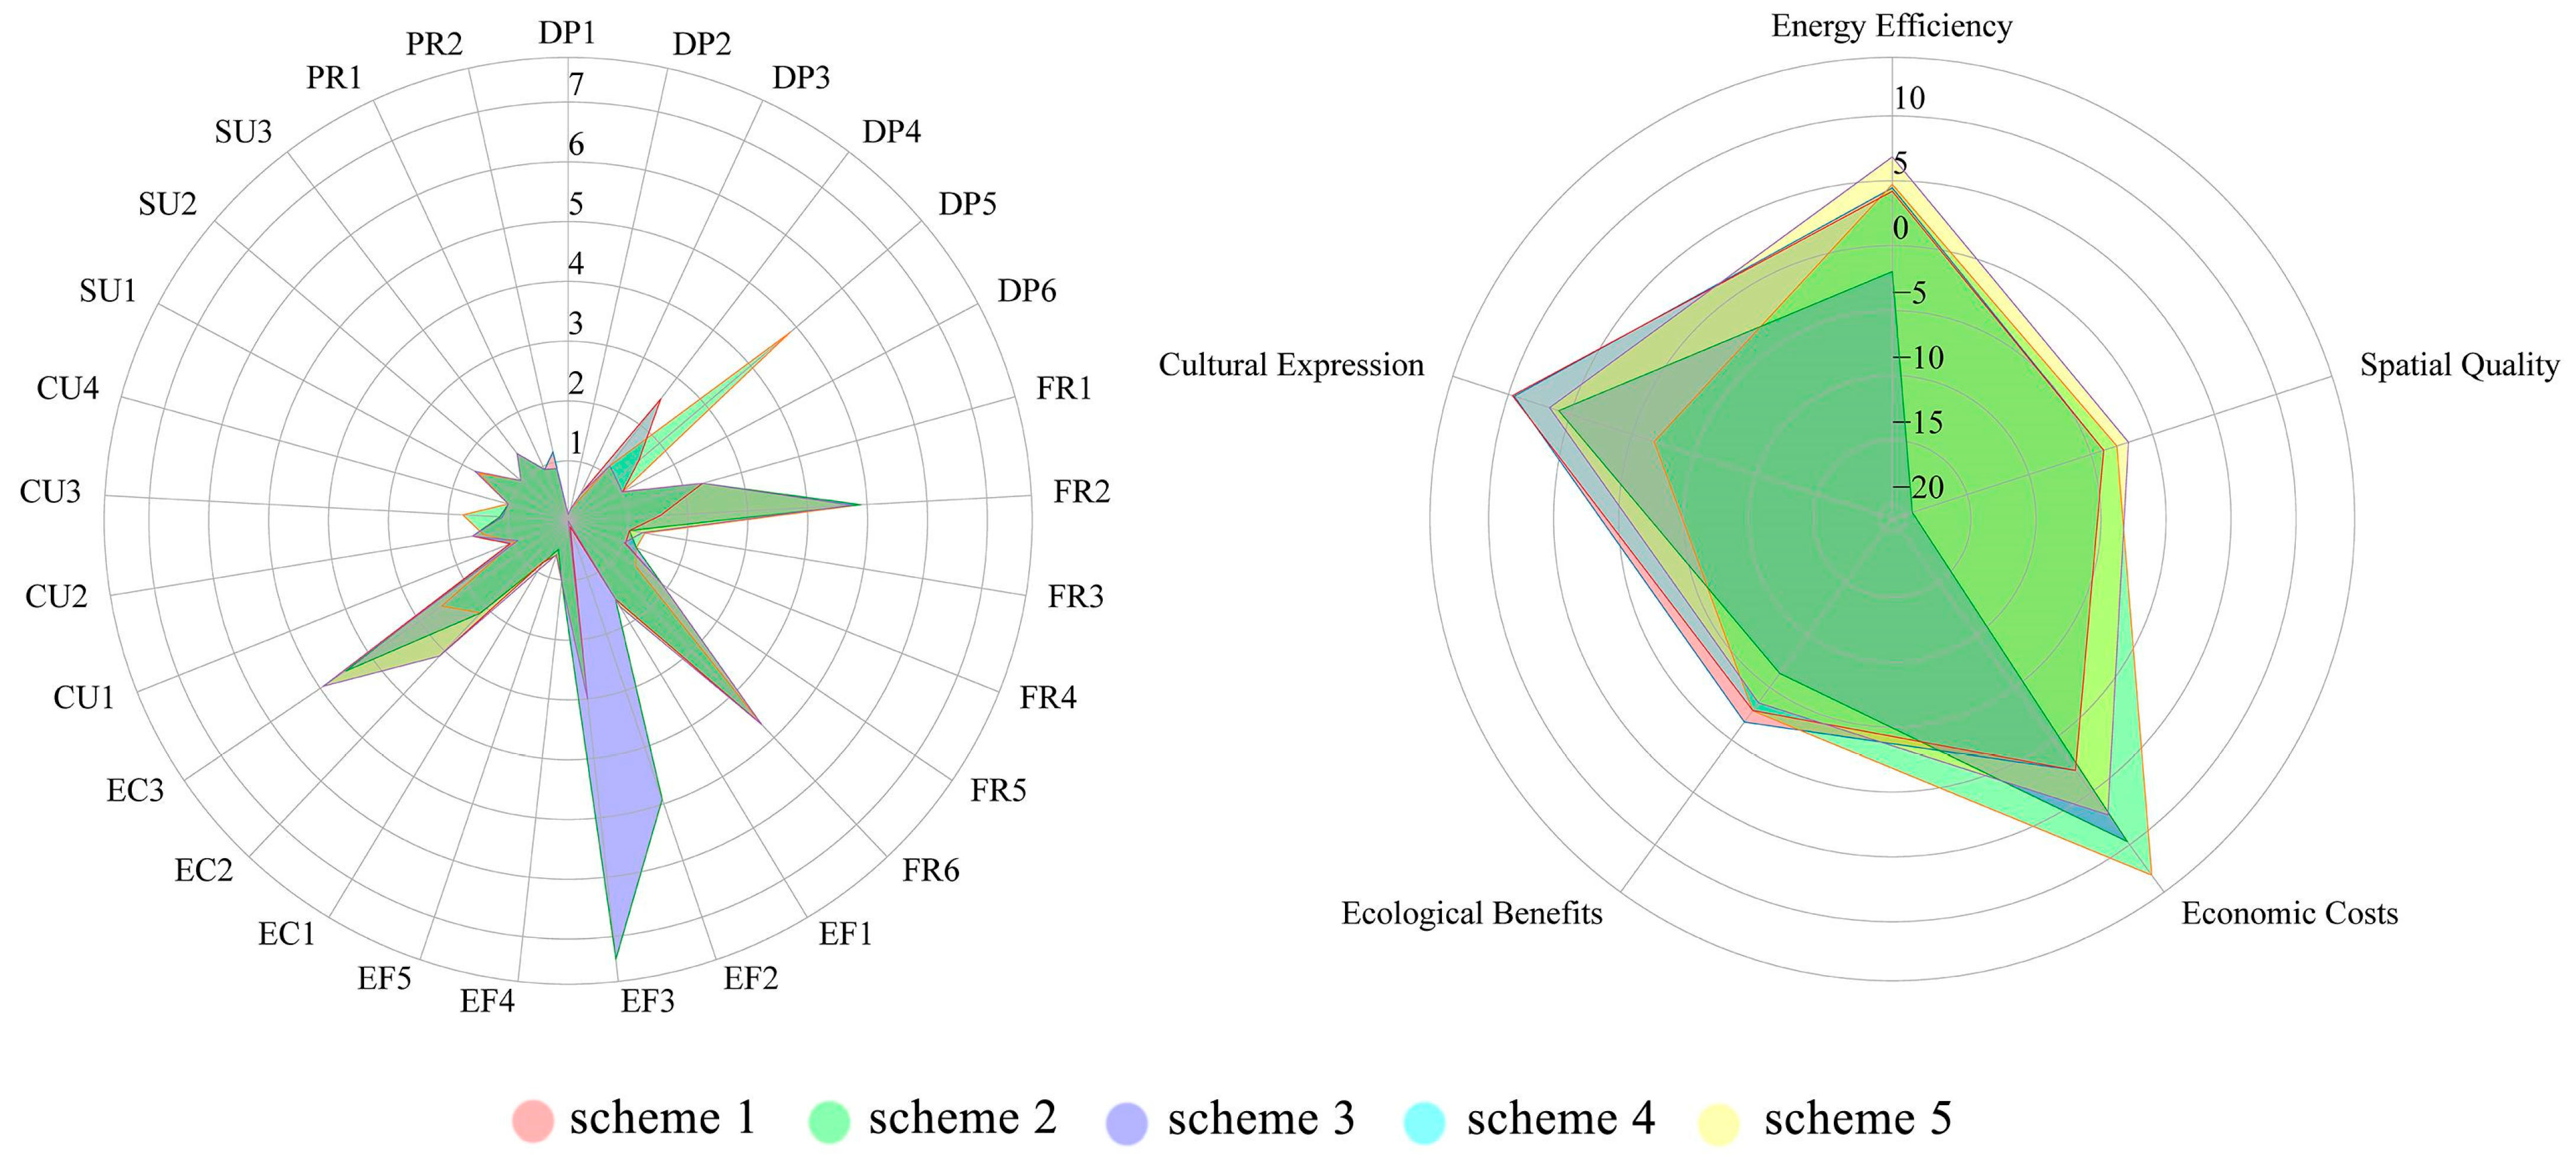
A total of 6000 feasible solutions were generated, among which 100 were identified as Pareto-optimal solutions on the non-dominated front (Rank = 1). To support subsequent visualization and multi-criteria decision-making, five representative optimizing solutions (Schemes 1 to 5) were selected as alternatives based on their distribution breadth, trade-off characteristics, and typicality.
Figure 4 illustrates the radar chart of performance differences across the five objective dimensions. Scheme 3 demonstrates notable advantages in spatial quality and ecological benefits, while Scheme 2 shows a relatively balanced performance in cultural expression. In contrast, Schemes 1 and 4 reflect typical compromise-type configurations, indicating potential for balanced multi-objective performance.
A more detailed comparison reveals notable disparities in the performance of the five alternative schemes across the five objective dimensions (as shown in Table 3). For instance, Scheme 3 demonstrates superior performance in spatial quality (19.433) and ecological benefit (6.322), but underperforms in economic cost (−9.698) and cultural expression (−5.920). In contrast, Scheme 2 achieves relatively favorable outcomes in cultural expression (1.792) and ecological benefit (2.770), while exhibiting the weakest performance in energy efficiency (−4.727) and economic cost (−12.894). Schemes 1 and 4 maintain a more balanced profile across economic cost, spatial quality, and ecological benefit, yet both show a significant deficiency in cultural expression (−9.521 and −9.673, respectively), indicating that subjective indicators related to cultural aspects are difficult to optimize within standard computational routines. Scheme 5 fails to demonstrate a clear advantage in any of the five dimensions, reflecting an overall lack of optimization effectiveness. Additionally, each alternative exhibits distinct strengths. For example, comparing Schemes 1 and 2 in terms of energy efficiency, their objective values are −4.452 and −4.727, respectively. According to the principle that a lower value indicates better optimization for this metric, Scheme 2 is superior in energy efficiency. However, in terms of cultural expression, Scheme 1 (−9.521) significantly outperforms Scheme 2 (1.792). This trade-off illustrates that these schemes are non-dominated in the Pareto sense and thus cannot be directly ranked without further decision analysis.
This analysis revealed the differences in multi-objective trade-off paths among the alternative solutions and validated the distribution characteristics of the non-dominated solution set generated by NSGA-III, thereby providing intuitive support for subsequent multi-criteria decision-making (AHP–TOPSIS).

3.1.2. Optimal Solution Selection

To further identify the optimal solution among the five representative alternatives, this study employed a combined AHP–TOPSIS evaluation method. First, the analytic hierarchy process (AHP) was used to determine the relative weights of the five optimization objectives, as summarized in Table 4. A group of seven experts with backgrounds in campus planning and green building design conducted pairwise comparisons of the five dimensions, based on which a judgment matrix was constructed. The consistency ratio (CR) of the matrix was calculated as 0.009, meeting the accepted threshold of CR < 0.1, thereby confirming the logical consistency and validity of the derived weights.
Subsequently, the AHP-derived weights were integrated into the TOPSIS model to construct the decision matrix for the five alternatives. To ensure all indicators conformed to a “the larger, the better” logic, inverse transformation was applied to criteria such as energy efficiency and economic cost, where smaller values were preferable. The decision matrix was normalized using the vector normalization method. Euclidean distances to the positive ideal scheme (denoted as D+) and the negative ideal scheme (D) were then calculated for each alternative. The relative closeness index (C) was subsequently computed to rank the alternatives. The evaluation results are presented in Table 5.
Among the alternatives, Scheme 3 achieved the highest relative closeness score (C = 0.691), indicating its superior overall performance under multi-objective trade-off conditions. It had the shortest distance to the positive ideal solution and the farthest distance from the negative ideal scheme (D = 10.825), reflecting strong global optimization capability. According to previous studies, a C value above 0.6 is typically considered a threshold indicating significant advantage [45]. Therefore, Scheme 3 was preliminarily identified as the most promising scheme among the candidates.

3.1.3. Optimization Result Analysis

To verify the effectiveness of the multi-objective optimization model, this study compares the original design scheme with the optimal Scheme 3 generated by NSGA-III. The analysis focuses on differences with the original design scheme across five objective dimensions and 29 core parameters (Table 6 and Table 7, Figure 5).
In terms of the 29 parameters (Table 6), the majority of variable coefficients underwent notable adjustments, reflecting a redistribution of importance among factors under multi-objective trade-offs. For example, DP1 (building orientation) decreased from 1.500 to 0.102, indicating a substantial decline in its influence within the current optimization model. Conversely, FR5 (gray space penetration rate) increased from 1.300 to 1.899, highlighting the elevated importance of the spatial quality dimension. Within the cultural expression dimension, parameters such as CU1 (inheritance of axis system) and PR1 (code compliance) exhibited minimal change, suggesting that their relative weights were not significantly enhanced in this iteration and may serve as focal points for future refinement.
At the objective level (Table 7, 
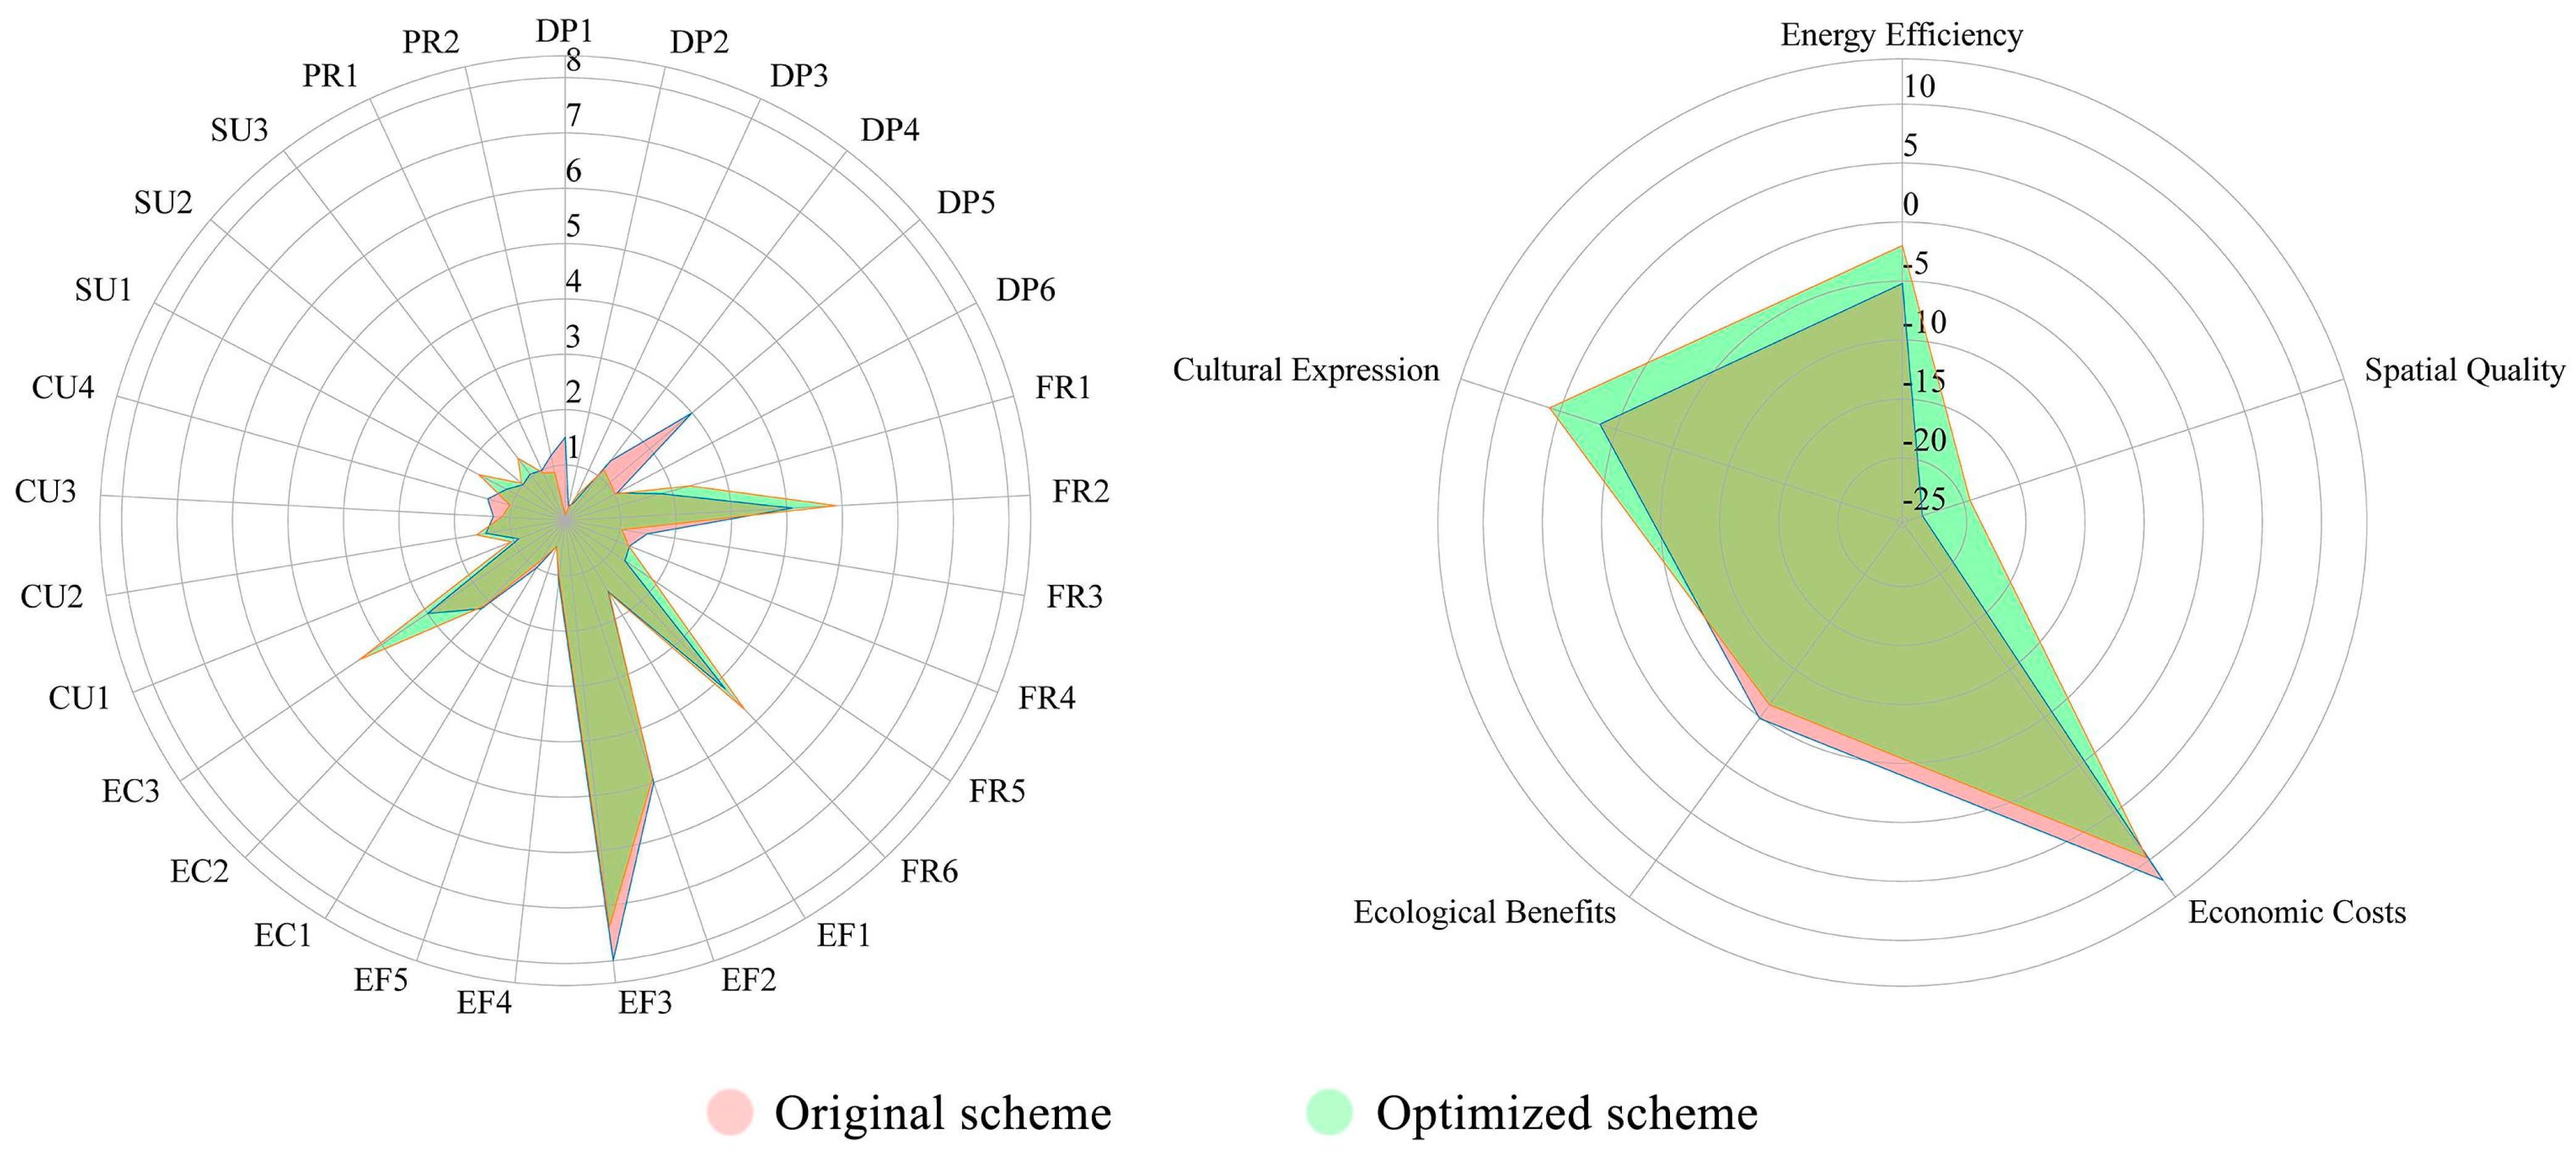
Figure 5), all five dimensions experienced notable shifts following optimization, underscoring the potential of the multi-objective algorithm to improve the overall performance of the planning scheme. The score for energy efficiency decreased from 5.209 to 1.993, representing a 61.7% reduction and indicating effective relief of energy consumption pressure. Economic cost improved from −12.057 to −9.698, a 19.6% gain, reflecting enhanced cost control. Ecological benefit rose from 4.891 to 6.322, marking an increase of approximately 29.3% and indicating strengthened environmental performance. Although spatial quality declined slightly from 23.662 to 19.433, it remained at a relatively high level, suggesting overall stability in spatial experience. In contrast, the cultural expression score markedly declined from −1.448 to −5.920, revealing the persistent challenges in addressing subjective, perception-based dimensions within the optimization process.
These contrasts are further illustrated in the radar chart (Figure 5), which provides a visual comparison of the original and optimized schemes across all five dimensions. As shown, Scheme 3 demonstrates clear advantages in energy efficiency, ecological benefit, spatial quality, and economic cost, while its performance in cultural expression remains comparatively weak. This pattern aligns with the TOPSIS evaluation results: although Scheme 3 achieved the highest overall ranking, it did not constitute a fully balanced “ideal scheme”, indicating the need for further adjustment in conjunction with site-specific conditions and design strategies.

3.2. Optimization Strategies

Based on the results discussed above, this study proposes a set of multidimensional coordination strategies for university campus planning, guided by the five target dimensions. Unlike traditional design recommendations that are primarily oriented around variable assignments, this study introduces a three-tiered logic framework of “objective orientation–parameter structure–design strategy” derived from trends in parameter coefficient shifts.
In terms of energy efficiency: The energy efficiency score significantly decreased, indicating that passive energy-saving mechanisms were effectively activated. The weights of key parameters such as DP1 (building orientation) and EF1 (sunshine compliance rate) declined, suggesting a reduced dependence on building orientation and natural lighting. It is recommended to optimize the layout of building clusters using solar path simulations and to introduce dynamic shading devices and intelligent lighting control systems.
In terms of spatial quality: Although the spatial quality score slightly decreased, it remained at a relatively high level. The increased weight of FR5 (gray space penetration rate) highlights the importance of shared interfaces and connectivity. It is advised to integrate corridor systems, shared courtyards, and multifunctional nodes to enhance accessibility and vitality while fostering a more community-oriented campus atmosphere.
In terms of economic cost: The economic cost dimension showed clear improvement. The weights of EC2 (material cycle index) and EC3 (smart system payback period budget) increased, suggesting that cost control can be achieved through optimized construction systems. It is recommended to adopt prefabricated structures, lightweight green materials, and renewable building systems, while establishing life-cycle cost models to support decision-making and control long-term investment.
In terms of ecological benefits: The ecological score increased by over 29%, reflecting significantly improved green performance. Parameters such as EF3 (biodiversity index) and EF4 (percentage of permeable ground) gained higher coefficients. Strategies should include enhancing green infrastructure, increasing rooftop greening and permeable pavement, and introducing rain gardens integrated into the campus water cycle system.
In terms of cultural expression: The score for cultural expression declined, and the coefficients of CU-related variables generally weakened. This indicates that subjective objectives tend to be marginalized during quantitative optimization processes. A more flexible cultural expression framework is therefore necessary. Suggested measures include identifying campus cultural landmarks and developing a historical memory map; embedding cultural scene nodes into functional circulation systems; and reinforcing axial systems and symbolic architectural elements to enhance cultural continuity and user belonging.
In summary, the optimization strategies proposed here reflect design directions emerging from the restructuring of parameter weights and demonstrate a systematic transformation from computational modeling to spatial articulation. The proposed methodology is applicable to other multi-objective complex contexts, such as university campuses and urban communities, and has significant potential for broader application.

4. Discussion

This study addressed the spatial planning optimization of an expanded residential district on a university campus by constructing a five-dimensional multi-objective optimization framework. The framework integrated energy efficiency, spatial quality, economic cost, ecological performance, and cultural expression. By applying the NSGA-III algorithm and AHP–TOPSIS method, this research completed a comprehensive workflow encompassing model development, parameter assignment, and optimal solution selection. The findings demonstrate that the proposed approach can effectively achieve coordination among multiple objectives under complex design constraints, indicating its strong practical applicability.
Compared with the four-objective optimization model proposed by Chantrelle et al.—which focused on energy consumption, comfort, cost, and environmental impact [36]—this study introduced “cultural expression” as a fifth dimension. The inclusion aimed to incorporate cultural factors into the optimization framework, thereby responding to the contemporary planning paradigm that emphasizes both sustainability and humanistic values. While previous research such as that by Hajrasouliha et al. [38] quantified the cognitive campus environment through space syntax and behavioral analysis, this study proposed quantifiable indicators of cultural identity from both the designer’s and user’s perspectives. Although the use of behavioral data remains limited, this work marks a meaningful step toward improving the expression of cultural factors within quantitative models.
On the algorithmic front, NSGA-III has been widely recognized for its robust performance in solving high-dimensional multi-objective problems [41]. This study adopted adaptive reference points and calibrated mutation parameters, resulting in a well-distributed Pareto-optimal solution set that effectively resolved conflicts among competing objectives. In comparison with traditional algorithms such as NSGA-II or MOPSO, NSGA-III exhibited more stable optimization performance for subjective dimensions like spatial quality and cultural expression. This confirms its suitability for addressing design problems that require the integration of both qualitative and quantitative variables [45]. Nonetheless, the current study has not incorporated multi-round convergence testing or hyperparameter self-adaptation. Algorithm stability and generalizability could be further enhanced in future research.
In terms of parameter construction and weight assignment, this research employed a two-round survey approach: the first to extract key variables and assign coefficients for each objective function, and the second to rank the alternatives through multi-criteria decision-making. This process balanced expert knowledge and user perception, offering strong operational feasibility. Compared with studies relying solely on designer judgment or user surveys, this research established a more systematic mechanism for translating expert knowledge into model parameters. However, the diversity of the expert sample and the explanatory power of variables still posed certain limitations. Future studies could incorporate behavioral tracking data or in situ perception surveys to further enhance model objectivity and adaptability.
From a spatial scale perspective, this study focused on the campus residential zone and incorporated morphological, functional, environmental, and cultural parameters into the optimization process. This allowed for strong local controllability as well as systemic coherence. In contrast to previous studies that concentrated on optimizing individual buildings [18,46], the current research developed a more integrated objective system at the building-complex scale and aligned optimization results with actual planning tasks, thus enhancing the practical value of the model.

5. Conclusions

This study addressed the multi-objective optimization of spatial planning for university campus residential areas by developing a five-dimensional optimization framework encompassing energy efficiency, spatial quality, economic cost, ecological performance, and cultural expression. The framework was applied to the western campus of Dalian University of Technology. This research has achieved the following main results:
(1)
A “five-dimensional integrated” planning objective system was proposed, in which cultural expression was incorporated into multi-objective modeling. An input structure composed of 29 design parameters was established, expanding the application scope of multi-objective optimization methods at the campus scale.
(2)
The NSGA-III algorithm was improved by introducing dynamic reference points and a hybrid constraint-handling strategy, which effectively enhanced the diversity and convergence efficiency of the solution set and increased the adaptability of the model to complex design scenarios.
(3)
A logical linkage between “parameter variation” and “optimization strategy” was identified, providing a systematic pathway from parameter modeling to practical guidance for campus spatial optimization.
Despite these contributions, several limitations remain: (1) Some parameter coefficients were incorporated into the model based on expert ratings and subsequent standardization. While feasible for the case study, these coefficients may require further validation to ensure generalizability and objectivity across different regions and campus types. (2) The current optimization results primarily reflect adjustments at the parameter level, lacking a direct mapping mechanism to specific spatial prototypes. (3) The modeling of cultural expression remains reliant on subjective indicators; future work may consider integrating behavioral perception data and semantic recognition techniques to enhance the clarity and interpretability of its quantitative representation.
Future research will aim to expand the applicability of the proposed method and explore its promotion across various regional campus contexts. While the current framework demonstrates a certain degree of adaptability, practical implementation in different urban and institutional settings still requires localization based on climate conditions, functional positioning, and cultural context. Ultimately, the goal is to establish a more flexible, precise, and operable optimization system for campus planning.

Supplementary Materials

The following supporting information can be downloaded at: https://www.mdpi.com/article/10.3390/buildings15142551/s1. Questionnaire scoring and coefficient calculation.

Author Contributions

Conceptualization, L.Q.; Methodology, L.Q. and J.D.; Formal analysis, L.Q. and C.C.; Writing—original draft, L.Q. and C.C.; Writing—review & editing, J.D.; Supervision, J.D. All authors have read and agreed to the published version of the manuscript.

Funding

This research was funded by the Fundamental Research Funds for the Central Universities of China (Grant No. DUT19RC (3) 044).

Data Availability Statement

The original contributions presented in the study are included in the article, further inquiries can be directed to the corresponding author.

Conflicts of Interest

The authors declare no conflict of interest.

References

  1. Dalton, L.C.; Hajrasouliha, A.H.; Riggs, W.W. State of the art in planning for college and university campuses: Site planning and beyond. J. Am. Plan. Assoc. 2018, 84, 145–161. [Google Scholar] [CrossRef]
  2. Gao, H.; Feng, G.; Zhang, J.; Zhang, X. Conceptual connotation, mechanism framework, and planning practice path of resilient university campus. Zaihaixue (Disaster Sci.) 2024, 39, 116–124. [Google Scholar]
  3. Mansor, S.; Ahmad, R.; Abdullah, J.; Gai, A.M. Campus planning and design across Southeast Asia: A scoping literature review from 2002–2022. Environ. Behav. Proc. J. 2023, 8, 69–78. [Google Scholar] [CrossRef]
  4. Victorino, G.; Bandeira, R.; Painho, M.; Henriques, R.; Coelho, P.S. Rethinking the campus experience in a post-COVID world: A multi-stakeholder design thinking experiment. Sustainability 2022, 14, 7655. [Google Scholar] [CrossRef]
  5. Pan, C.; Feng, X.; Wang, L.; Wu, M.; Wang, M. The utilization and accessibility of campus open space: A case study of the west campus of CAU. J. Asian Archit. Build. Eng. 2025, 24, 2966–2981. [Google Scholar] [CrossRef]
  6. Salingaros, N.A. Planning, complexity, and welcoming spaces: The case of campus design. In Handbook on Planning and Complexity; Edward Elgar Publishing: Cheltenham, UK, 2020; pp. 353–370. [Google Scholar]
  7. White, I. Rigour and rigour mortis? Planning, calculative rationality, and forces of stability and change. Urban Stud. 2019, 57, 2885–2900. [Google Scholar] [CrossRef]
  8. Brown, N.C. Multi-Objective Optimization for the Conceptual Design of Structures. Ph.D. Thesis, Massachusetts Institute of Technology, Cambridge, MA, USA, 2016. Available online: http://dspace.mit.edu/handle/1721.1/7582 (accessed on 16 July 2025).
  9. Lin, B.; Chen, H.; Yu, Q.; Zhou, X.; Lv, S.; He, Q.; Li, Z. MOOSAS–A systematic solution for multiple objective building performance optimization in the early design stage. Build. Environ. 2021, 200, 107929. [Google Scholar] [CrossRef]
  10. Carreras, J.; Boer, D.; Cabeza, L.F.; Jiménez, L.; Guillén-Gosálbez, G. Eco-costs evaluation for the optimal design of buildings with lower environmental impact. Energy Build. 2016, 119, 189–199. [Google Scholar] [CrossRef]
  11. Vesikar, Y.; Deb, K.; Blank, J. Reference point based NSGA-III for preferred solutions. In Proceedings of the 2018 IEEE Symposium Series on Computational Intelligence (SSCI), Bangalore, India, 18–21 November 2018; IEEE: Piscataway, NJ, USA, 2018; pp. 1587–1594. [Google Scholar] [CrossRef]
  12. Zemero, B.R.; Tostes, M.E.L.; Bezerra, U.H.; Rüther, R. Methodology for preliminary design of buildings using multi-objective optimization based on performance simulation. J. Sol. Energy Eng. 2019, 141, 040801. [Google Scholar] [CrossRef] [PubMed]
  13. Khalil, R.; El-Kordy, A.; Sobh, H. A review for using swarm intelligence in architectural engineering. Int. J. Archit. Comput. 2022, 20, 254–276. [Google Scholar] [CrossRef]
  14. Long, L.D. An AI-driven model for predicting and optimizing energy-efficient building envelopes. Alex. Eng. J. 2023, 79, 480–501. [Google Scholar] [CrossRef]
  15. Vukadinović, A.; Radosavljević, J.; Đorđević, A.; Protić, M.; Petrović, N. Multi-objective optimization of energy performance for a detached residential building with a sunspace using the NSGA-II genetic algorithm. Sol. Energy 2021, 224, 1426–1444. [Google Scholar] [CrossRef]
  16. Zhang, R.; Xu, X.; Liu, K.; Kong, L.; Wang, X.; Zhao, L.; Abuduwayiti, A. Does architectural design require single-objective or multi-objective optimisation? A critical choice with a comparative study between model-based algorithms and genetic algorithms. Front. Archit. Res. 2024, 13, 1079–1094. [Google Scholar] [CrossRef]
  17. Harshalatha; Patil, S.; Kini, P.G. A review on simulation-based multi-objective optimization of space layout design parameters on building energy performance. J. Build. Pathol. Rehabil. 2024, 9, 69. [Google Scholar] [CrossRef]
  18. Pilechiha, P.; Mahdavinejad, M.; Rahimian, F.P.; Hafezi, M.; Hammad, A.W.A. Multi-objective optimisation framework for designing office windows: Quality of view, daylight and energy efficiency. Appl. Energy 2020, 261, 114356. [Google Scholar] [CrossRef]
  19. Cubukcuoglu, C.; Chapikonstantinou, I.; Ekici, B.; Sariyildiz, S.; Tasgetiren, M.F. Multi-objective optimization through differential evolution for restaurant design. In Proceedings of the 2016 IEEE Congress on Evolutionary Computation (CEC), Vancouver, BC, Canada, 24–29 July 2016; pp. 2288–2295. [Google Scholar] [CrossRef]
  20. Deb, K.; Jain, H. An evolutionary many-objective optimization algorithm using reference-point-based nondominated sorting approach, Part I: Solving problems with box constraints. IEEE Trans. Evol. Comput. 2014, 18, 577–601. [Google Scholar] [CrossRef]
  21. Adekoya, O.; Aneiba, A. An adapted nondominated sorting genetic algorithm III (NSGA-III) with repair-based operator for solving controller placement problem in software-defined wide area networks. IEEE Open J. Commun. Soc. 2022, 3, 888–901. [Google Scholar] [CrossRef]
  22. Shi, X.; Tian, Z.; Chen, W.; Si, B.; Jin, X. A review on building energy efficient design optimization from the perspective of architects. Renew. Sustain. Energy Rev. 2016, 65, 872–884. [Google Scholar] [CrossRef]
  23. Showkatbakhsh, M.; Makki, M. Multi-objective optimisation of urban form: A framework for selecting the optimal solution. Buildings 2022, 12, 1473. [Google Scholar] [CrossRef]
  24. Agrawal, S.; Jadon, S.S. Optimizing urban walkability with NSGA-III for sustainable city planning and construction. Asian J. Civ. Eng. 2024, 25, 6189–6201. [Google Scholar] [CrossRef]
  25. Wang, A.; Yu, S.; Shi, C.; An, Y. Optimization of university dormitory renovation in severe cold regions under the impact of climate change. Results Eng. 2025, 26, 105384. [Google Scholar] [CrossRef]
  26. Walimbe, S.; Nandineni, R.D.; Rege, S. Multi-objective optimization of school environments to foster nature connectedness using NSGA-III in school design. Asian J. Civ. Eng. 2025, 26, 515–530. [Google Scholar] [CrossRef]
  27. Li, H.; Deb, K.; Zhang, Q.; Suganthan, P.; Chen, L. Comparison between MOEA/D and NSGA-III on a set of novel many and multi-objective benchmark problems with challenging difficulties. Swarm Evol. Comput. 2019, 46, 104–117. [Google Scholar] [CrossRef]
  28. Panwar, A.; Tripathi, K.K.; Jha, K.N. A qualitative framework for selection of optimization algorithm for multi-objective trade-off problem in construction projects. Eng. Constr. Archit. Manag. 2019, 26, 1924–1945. [Google Scholar] [CrossRef]
  29. Guo, W.; Ding, Y.; Yang, G.; Liu, X. Research on the indicators of sustainable campus renewal and reconstruction in pursuit of continuous historical and regional context. Buildings 2022, 12, 1508. [Google Scholar] [CrossRef]
  30. Wang, Q.; Xu, X.; Ding, X.; Chen, T.; Deng, R.; Li, J.; Jiang, J. Multi-objective optimization and evaluation approach of prefabricated component combination solutions using NSGA-II and simulated annealing optimized projection pursuit method. Sci. Rep. 2024, 14, 16688. [Google Scholar] [CrossRef] [PubMed]
  31. Mohammed, R.T.; Yaakob, R.; Sharef, N.M.; Abdullah, R. Unifying the evaluation criteria of many objectives optimization using fuzzy Delphi method. Baghdad Sci. J. 2021, 18 (Suppl. S4), 1423. [Google Scholar] [CrossRef]
  32. Dash, B.; Macedo, V.D.J.; Mohanachandran, D.K.; Pokkuluri, K.S.; Rathinakumar, V.; Sethi, K.C. Optimizing time and cost in construction under uncertainty: A fuzzy-driven NSGA-III optimization approach. Asian J. Civ. Eng. 2025, 26, 3099–3114. [Google Scholar] [CrossRef]
  33. Zhao, Q.; Zhang, L.; Hou, J. Developing a cultural sustainability assessment framework for environmental facilities in urban communities. npj Herit. Sci. 2025, 13, 107. [Google Scholar] [CrossRef]
  34. Rossetti, T.; Lobel, H.; Rocco, V.; Hurtubia, R. Explaining subjective perceptions of public spaces as a function of the built environment: A massive data approach. Landsc. Urban Plan. 2019, 181, 169–178. [Google Scholar] [CrossRef]
  35. Guo, S.; Zheng, X.; Heath, T. Research on the design of community museums based on the fuzzy comprehensive evaluation method. Sustainability 2022, 14, 10802. [Google Scholar] [CrossRef]
  36. Chantrelle, F.P.; Lahmidi, H.; Keilholz, W.; El Mankibi, M.; Michel, P. Development of a multicriteria tool for optimizing the renovation of buildings. Appl. Energy 2011, 88, 1386–1394. [Google Scholar] [CrossRef]
  37. Zeng, Z.Z.; Liu, M.Z.; Han, X.R.; Han, B. Spatial layout and cultural continuity in campus planning: A case study of Beijing Jiaotong University. J. Beijing Jiaotong Univ. (Soc. Sci. Ed.) 2025, 24, 142–150. (In Chinese) [Google Scholar]
  38. Hajrasouliha, A.H.; Ewing, R. Campus does matter: The relationship of student retention and degree attainment to campus design. Plan. High. Educ. 2016, 44, 30–45. [Google Scholar]
  39. Wang, Y.X.; Li, M.H.; Wang, M.L.; Chen, F. Spatial design strategies for promoting interdisciplinary integration: A case of grid-type university campus. Urban Environ. Des. 2024, 336–341. (In Chinese) [Google Scholar] [CrossRef]
  40. Gao, Y.; Su, Y.; He, J.Q. A visual analysis of research hotspots and trends in green building design using CiteSpace. Ind. Constr. 2023, 53, 131–134. (In Chinese) [Google Scholar]
  41. Jain, H.; Deb, K. An evolutionary many-objective optimization algorithm using reference-point based nondominated sorting approach, Part II: Handling constraints and extending to an adaptive approach. IEEE Trans. Evol. Comput. 2014, 18, 602–622. [Google Scholar] [CrossRef]
  42. Vaidya, O.S.; Kumar, S. Analytic hierarchy process: An overview of applications. Eur. J. Oper. Res. 2006, 169, 1–29. [Google Scholar] [CrossRef]
  43. Zhu, Y.; Liang, J.; Chen, J.; Ming, Z. An improved NSGA-III algorithm for feature selection used in intrusion detection. Knowl. Based Syst. 2017, 116, 74–85. [Google Scholar] [CrossRef]
  44. Hazbei, M.; Rafati, N.; Kharma, N.; Eicker, U. Optimizing architectural multi-dimensional forms: A hybrid approach integrating approximate evolutionary search, clustering and local optimization. Energy Build. 2024, 318, 114460. [Google Scholar] [CrossRef]
  45. Behzadian, M.; Otaghsara, S.K.; Yazdani, M.; Kazemzadeh, R.B. A state-of-the-art survey of TOPSIS applications. Expert Syst. Appl. 2012, 39, 13051–13069. [Google Scholar] [CrossRef]
  46. Razmi, A.; Rahbar, M.; Bemanian, M. PCA-ANN integrated NSGA-III framework for dormitory building design optimization: Energy efficiency, daylight, and thermal comfort. Appl. Energy 2022, 305, 117828. [Google Scholar] [CrossRef]
Figure 1. Research framework.
Buildings 15 02551 g001
Figure 2. Design rendering of the northern student living area of the western campus of Dalian University of Technology.
Buildings 15 02551 g002
Figure 3. Comparison of parameter values.
Buildings 15 02551 g003
Figure 4. Performance comparison of alternative solutions across five objectives.
Buildings 15 02551 g004
Figure 5. Comparative performance of Scheme 3 and the original scheme across five objective dimensions.
Buildings 15 02551 g005
Table 1. Parameter quantification for multi-objective optimization of higher education group building designs.
Variable TypeParameter NameNumberDetailed DescriptionUnitRangeData Source
Morphological parametersBuilding orientationDP1Geographical adaptation of the azimuth of the main light surface——0–3Project design
Physical coefficientDP2Ratio of building exterior area to volume——0.2–0.33Project design
Window-to-wall ratioDP3Ratio of external window area to wall area——0.3–0.5Project design
Ratio of atrium areaDP4Ratio of atrium projected area to total building areaβ1–3Project design
Layout complexityDP5Functional unit relevance indexcent1–5Questionnaire
Plot ratioDP6Ratio of total floor area to site area——0.8–2.5Project design
Functional requirementsFlexible per capita spaceFR1Dynamically adjusted amount of teaching spacem2/person0.9–2.4Project design
Functional zoning rationalityFR2Synergistic efficiency of teaching/research/living areacent1–5Questionnaire
Intelligent equipment utilization rateFR3Intelligent system operation efficiency ratioβ1–1.5Expert estimates
Accessibility coverageFR4Percentage of barrier-free facilities in compliance with codesβ1–1.25Project design
Gray space penetration rateFR5Percentage of buildings with gray spaceβ1–2Project design
Comfort assessmentFR6Combined score after questionnaire——1–5Questionnaire
Environmental factorsSunshine compliance rateEF1Percentage of functional units with full-window daylight ≥ 3 h on the winter solsticeL/H1.2–1.8Simulation analysis
Ventilation efficiency factorEF2Combined index of natural ventilation and mechanical ventilation——0–5Simulation analysis
Biodiversity indexEF3Combined value of native species and vertical greeningspecies/m23–8Project design
Percentage of permeable groundEF4Percentage of permeable surface area within the building siteβ1–1.8Project design
Sound environment quality indexEF5Ratio of the actual sound level of the project to the national standard limit value——0.5–1.0Simulation analysis
Economic factorsFull life cycle costEC1Combined initial cost and 30-year energy savings benefitmillion yuan/m20.8–1.5Expert estimates
Material cycle indexEC2Percentage of design phase for sustainable building materialsβ1–4Project design
Smart system payback period budgetEC3Ratio of initial investment cost to average annual net benefit/2year2.5–5Expert estimates
Cultural factorsInheritance of axis system CU1Inheritance of the campus’ original axis systemβ0.9–1.1Project design
Inheritance of cultural symbolsCU2Inheritance of the campus’ original cultural symbolsβ1–1.66Project design
Regional relevance of materialsCU3Degree of correlation between material system and regional cultural lineageβ1–2Project design
Expressiveness of academy culture CU4Culture required in this planning and design assignmentβ1–1.55Project design
SustainabilityNumber of sustainable designSU1Total number of sustainable design elements implemented per 10,000 square meters of buildingsβ1–1.78Project design
Rainwater reuse rateSU2Percentage of rainwater recyclingβ1–1.75Project design
Waste disposal rateSU3Percentage of total amount of waste disposed of in a sound manner per unit of floor areaβ1–1.44Expert estimates
Regulations and policiesCode compliancePR1Satisfaction rate of design solutions to the provisions of current national and local mandatory building codes——0.92–1Normative analysis
Policy orientationPR2Response rate of the school–city integration and the four sections and one environmental protection technologyβ0.8–1.2Policy analysis
β is the ratio of the actual value of the optimized parameter to the lower limit of the value range.
Table 2. Five-dimensional objective function relationship.
Optimization GoalsFunctional Relationship
Energy efficiency F e e = 0.914 D P 1 + 1.044 D P 3 1.473 D P 4 0.634 D P 6 + 0.904 F R 3 + 0.765 E F 1 1.613 E F 2 + 0.625 E F 5 + 1.044 E C 3 0.774 C U 1 + 0.904 C U 3 0.774 C U 4 + 0.765 S U 1 0.774 S U 2 + 0.904 P R 2
Spatial quality F s q = 0.042 D P 1 + 0.444 D P 3 0.226 D P 4 + 0.243 D P 6 + 0.042 F R 1 + 0.511 F R 2 + 0.042 F R 3 + 0.511 F R 4 + 0.042 F R 5 + 0.511 F R 6 + 0.444 E F 1 3.976 E F 3 0.226 E F 4 + 0.444 E C 3 0.226 C U 2 + 0.444 S U 1 + 0.042 S U 2 + 0.444 S U 3 + 0.444 P R 1
Economic costs F e c = 0.869 D P 1 0.297 D P 3 0.869 D P 4 + 1.035 D P 5 0.869 D P 6 + 2.368 F R 1 + 1.035 F R 2 0.678 F R 4 + 1.416 E F 1 + 0.083 E F 2 + 0.464 E F 3 0.869 E C 1 0.678 E C 3 0.869 C U 1 + 0.083 C U 3 0.488 P R 1
Ecological benefits F e b = 0.020 D P 1 0.324 D P 3 0.324 D P 4 + 0.020 D P 5 0.324 D P 6 0.324 F R 2 + 0.668 F R 3 0.324 F R 4 0.324 E F 1 0.324 E F 2 + 0.324 E F 3 0.3240 E C 3 + 0.020 C U 3 + 0.020 S U 1 0.324 S U 2 + 0.020 P R 1 + 3.808 P R 2
Cultural expression F c e = ( 0.647 D P 2 + 0.585 D P 3 + 0.831 D P 4 0.770 D P 5 0.647 F R 2 0.523 E F 1 0.647 E F 4 1.016 E F 5 + 1.94 E C 3 + 0.585 C U 1 + 2.063 C U 2 0.523 C U 3 0.893 C U 4 0.647 S U 2 + 0.831 P R 1 0.523 P R 2 )
Table 3. Performance values of five alternative schemes across the five objectives.
SchemeEnergy Efficiency Spatial Quality Economic Cost Ecological Benefit Cultural Expression
Scheme 1−4.4523.960−2.9161.693−9.521
Scheme 2−4.7272.894−12.8942.7701.792
Scheme 31.99319.433−9.6986.322−5.920
Scheme 4−4.1903.960−2.9162.793−9.673
Scheme 5−6.8411.953−7.1453.528−6.665
Table 4. Optimization objectives AHP weighting results table.
Optimization ObjectiveFeature VectorWeight ValueMaximum EigenvalueCI ValueCR Value
Energyefficiency goals0.5520.115.0390.0100.009
Spatialquality goals1.6320.33
Economic cost goals1.2100.24
Ecologicalbenefit goals0.5520.11
Culturalexpression goals1.0520.21
Table 5. TOPSIS evaluation calculation results of optimized alternative schemes.
SchemePositive Ideal Distances (D+)Negative Ideal Distances (D)Elative Closeness Index(C)Ranking
Scheme 110.6215.0850.3244
Scheme 210.9785.340.3272
Scheme 34.85110.8250.6911
Scheme 410.5925.1120.3263
Scheme 511.3843.1940.2195
Table 6. Comparison of parameters between the original scheme and the optimized scheme (Scheme 3).
ParametersDP1DP2DP3DP4DP5DP6FR1FR2FR3FR4
Original scheme1.5000.2700.3401.3503.0001.0601.8004.1001.5001.250
Scheme 30.1020.2030.4751.1511.0601.0212.3304.9021.0381.226
ParametersFR5FR6EF1EF2EF3EF4EF5EC1EC2EC3
Original scheme1.3004.2001.5005.0008.0001.1000.5001.0002.2003.000
Scheme 31.8994.6991.5334.9207.3781.0200.5100.8362.1314.485
ParametersCU1CU2CU3CU4SU1SU2SU3PR1PR2
Original scheme0.9001.4501.3001.4501.2001.0001.0501.0001.200
Scheme 31.0461.6211.1421.0361.7611.0351.4080.9440.889
Table 7. Comparison of target values between the original scheme and the optimized scheme (Scheme 3).
DimensionEnergy EfficiencySpatial QualityEconomic CostsEcological BenefitsCultural Expression
Original scheme5.20923.662−12.0574.891−1.448
Scheme 31.99319.433−9.6986.322−5.920
Disclaimer/Publisher’s Note: The statements, opinions and data contained in all publications are solely those of the individual author(s) and contributor(s) and not of MDPI and/or the editor(s). MDPI and/or the editor(s) disclaim responsibility for any injury to people or property resulting from any ideas, methods, instructions or products referred to in the content.

