Article

Disaster Risk Reduction Audits and BIM for Resilient Highway Infrastructure: A Proactive Assessment Framework

1
Geodesy Laboratory, Civil & Architectural and Environmental System Engineering, Sungkyunkwan University (SKKU), Suwon 16419, Gyeonggi, Republic of Korea
2
School of Geography, Faculty of Environment, University of Leeds, Woodhouse Lane, Leeds, LS2 9JT, UK
3
Disaster & Risk Management Laboratory, Interdisciplinary Program in Crisis&Disaster and Risk Management Sungkyunkwan University (SKKU), Suwon 16419, Gyeonggi, Republic of Korea
*
Author to whom correspondence should be addressed.
Buildings 2025, 15(14), 2545; https://doi.org/10.3390/buildings15142545
Submission received: 5 July 2025 / Revised: 17 July 2025 / Accepted: 18 July 2025 / Published: 19 July 2025
(This article belongs to the Section Construction Management, and Computers & Digitization)

Abstract

Highway infrastructure faces growing exposure to natural hazards, necessitating more proactive and data-driven risk mitigation strategies. This study explores the integration of Disaster Risk Reduction Audits (DRRAs) into the lifecycle of highway infrastructure projects as a structured method for enhancing disaster resilience and operational safety. Using case analyses and scenario-based labor estimation models across design and construction phases, this research quantifies the resource requirements and effectiveness of DRRA application. The results show a statistically significant reduction in disaster occurrence rates in projects where a DRRA was implemented, despite slightly higher labor inputs. These findings highlight the value of adopting phased DRRA implementation as a national standard, with flexibility across different project types and scales. This study concludes that institutionalizing DRRAs, particularly when supported by digital platforms and decision-support tools, can serve as a critical component in transforming traditional infrastructure management into a more resilient and adaptive system.

1. Introduction

1.1. Background and Problem Statement

In South Korea, the surveying industry plays a critical role in building national geospatial infrastructure and supporting the lifecycle management of public and private assets. Despite the inherently high-risk nature of its field operations—such as working at heights, near traffic corridors, and in confined underground environments—there is still no standardized system for budgeting and managing safety-related costs tailored to the unique characteristics of the Korean surveying sector. While several studies have quantitatively analyzed accident risk reduction costs in the Korean construction industry, highlighting the need for structured safety investment frameworks, comparable research in the surveying domain remains largely absent.
Highway infrastructure plays a vital role in supporting national economies and enabling connectivity across regions, yet it remains acutely vulnerable to a range of natural and anthropogenic hazards. Global analyses indicate that over 27% of road and rail assets are exposed to at least one natural hazard, with flooding alone responsible for an estimated annual damage of up to USD 22 billion worldwide—representing as much as 1% of GDP in some countries [1]. Despite these well-documented risks, existing safety and resilience assessment frameworks often fail to proactively address the full spectrum of threats during early infrastructure planning. In particular, conventional approaches lack the capacity to account for the cumulative and interconnected effects of climate-related hazards such as floods, landslides, and heatwaves, largely due to their reactive nature and fragmented implementation [1,2]. The linear structure, geographic spread, and functional interdependency of highway systems further magnify systemic vulnerabilities, yet current assessment tools inadequately reflect these complexities. These limitations highlight the urgent need for integrated, forward-looking mechanisms—such as Disaster Risk Reduction Audits (DRRAs)—that can more comprehensively evaluate risks and support early-stage mitigation strategies tailored to modern infrastructure challenges.
Multi-hazard scenarios, where events like earthquakes and floods occur independently or sequentially, further complicate risk profiles and can lead to cascading failures and significant societal and economic losses [1,3,4,5]. Advanced risk assessment frameworks now integrate probabilistic modeling, network science, and artificial intelligence to evaluate vulnerability, predict failure probabilities, and optimize mitigation strategies, considering both direct physical impacts and broader operational and socio-economic consequences [1,3,6,7,8]. There is a growing consensus that proactive investment in resilience—such as targeted flood protection and retrofitting—yields favorable cost–benefit ratios and is essential for disaster risk reduction [1,2]. Additionally, mapping and quantifying vulnerability at both the component (e.g., bridges) and network levels are critical for prioritizing interventions and ensuring rapid recovery after extreme events [4,5,6,7]. The integration of social vulnerability and accessibility considerations into risk management systems further enhances the ability to protect populations and maintain essential services during disasters [8,9]. Overall, comprehensive, data-driven approaches are increasingly recognized as vital for safeguarding highway infrastructure and supporting global transport resilience in the face of escalating hazards [1,2,3,6,8].

1.2. Limitations of Existing Safety Assessment Frameworks

Despite growing awareness of the risks involved, current safety assessment mechanisms such as Traffic Facility Safety Diagnosis (TFSD), Road Safety Audits (RSAs), and Disaster Impact Assessments (DIAs) are still largely reactive and applied in a fragmented manner. These evaluations are often carried out during the later stages of infrastructure development or even after projects are operational, which significantly reduces their ability to identify vulnerabilities across the system during the crucial stages of planning and design. In addition, there is a lack of consistency in how these tools are implemented, with few unified standards or coordinated guidelines across agencies. While previous studies have acknowledged the usefulness of RSAs and DIAs in identifying specific risks at the project level, these tools generally fail to influence broader strategic decisions or to incorporate long-term resilience considerations [10,11,12,13]. These limitations highlight the need for a more forward-looking and integrated approach. Disaster Risk Reduction Audits (DRRAs) aim to fill this gap by embedding risk assessments into early decision processes and addressing the shortcomings of existing evaluation methods.

1.3. The Role and Potential of Disaster Risk Reduction Audits (DRRAs)

To overcome the limitations of existing safety assessment methods, this study introduces Disaster Risk Reduction Audits (DRRA) as a proactive and early-stage approach to highway infrastructure management. Unlike traditional mechanisms that focus narrowly on road safety and are often implemented after key design decisions have been made, DRRAs are intended to be applied during the planning and preliminary design phases. This allows for the systematic evaluation of infrastructure projects in terms of not only conventional safety features but also disaster resilience, environmental sensitivity, and long-term functionality. DRRAs are positioned to complement and expand upon existing tools by integrating broader risk considerations from the outset. The framework is informed by international best practices in safety auditing, resilience analysis, and infrastructure performance management, offering a more comprehensive basis for sustainable and risk-informed infrastructure development.
Conventional safety evaluation frameworks predominantly emphasize immediate road safety outcomes and post-disaster response measures, often neglecting the broader spectrum of disaster risk, climate adaptation strategies, and long-term infrastructure resilience [14,15,16]. Existing risk assessments tend to adopt a reactive posture, addressing hazards only after they have manifested, rather than integrating preventive strategies during the planning and design stages [15,17,18].
The integration of Disaster Risk Reduction Audits (DRRAs) offers a more comprehensive and forward-looking framework for risk management by addressing not only safety performance indicators but also the broader range of disaster-related factors, including floods, earthquakes, environmental vulnerabilities, and the structural soundness of critical infrastructure [14,17,18,19]. Unlike existing tools that are often reactive and limited in scope, DRRAs function as a unified mechanism that systematically incorporates multiple hazard dimensions and infrastructure performance criteria from the earliest project stages. This lifecycle-based approach enables timely interventions that can reduce the probability and severity of disaster impacts, optimize long-term maintenance strategies, and minimize public sector expenditures [14,15,16]. In addition to filling the operational gaps left by tools such as RSA and DIA, DRRAs enhance coherence across existing frameworks by promoting a standardized, data-informed evaluation process that supports both planning and budgeting functions. By delivering integrated risk profiles and resilience indicators, DRRAs strengthen evidence-based decision making and serve as a platform for harmonizing traditionally siloed assessments [14,17,20].

1.4. Alignment with Global Resilience Frameworks

The effective implementation of Disaster Risk Reduction Audits (DRRAs) requires a strategic alignment with existing national and international disaster risk reduction frameworks. This includes integrating DRRAs within the scope of broader policies such as the UN Sendai Framework and national-level asset management standards to ensure institutional coherence and scalability [14,16,20]. The adoption of international best practices can further enhance DRRA effectiveness; this involves utilizing advanced technologies such as digital twin systems, AI-based risk modeling, and multi-criteria assessment tools to conduct comprehensive and forward-looking evaluations [19,21,22]. In parallel, capacity building remains essential. Establishing dedicated training programs for implementing agencies and fostering cross-sectoral collaboration are critical steps toward embedding DRRA methodology into routine infrastructure planning and governance processes [14,15,16].
This institutional and technical foundation also positions DRRA as a viable component of broader resilience planning efforts.
As [23] emphasizes, infrastructure resilience is multifaceted, encompassing physical robustness, recovery capacity, and adaptability to cascading failures. Integrating DRRA into such a comprehensive resilience framework allows for early-stage diagnostics to inform broader system-level assessments—particularly when combined with real-time data and predictive analytics.
Furthermore, ref. [24] provides empirical evidence that resilience planning in critical infrastructure often suffers from gaps in actionable, evidence-based mechanisms. DRRAs can serve as a concrete operational tool to bridge this gap by translating risk awareness into measurable interventions. When embedded within the institutional context of national infrastructure policy, DRRAs have the potential to serve as a replicable platform for resilience mainstreaming.
Ref. [25] introduces the concept of “society-based design,” wherein infrastructure resilience is evaluated not only by its technical performance but also by its contribution to long-term societal well-being. The inclusion of DRRAs within this paradigm supports a more holistic understanding of infrastructure value—one that recognizes disaster risk reduction as integral to community safety, equity, and continuity.
Finally, ref. [26] argues for the development of operational models that can quantify resilience in infrastructure networks. DRRAs provide an actionable layer to such models by embedding field-level diagnosis, risk weighting, and scenario-based intervention planning into infrastructure workflows. Their phased implementation aligns with the logic of progressive risk containment, as recommended in resilience operations modeling.
Integrating Disaster Risk Reduction Audits into highway infrastructure management offers a forward-looking, cost-effective strategy to enhance resilience, reduce disaster risks, and ensure long-term serviceability. DRRAs represent a significant step toward mainstreaming resilience in infrastructure policy and practice.

2. Methods

2.1. Review of Existing Safety Assessment Systems for Highway Infrastructure

Highway infrastructure safety evaluation has traditionally centered on traffic performance, structural integrity, and post-event emergency response. These approaches, while valuable, are largely reactive in nature and tend to overlook broader disaster risks and climate-related vulnerabilities. For instance, crash risk factor analysis methods typically assess infrastructure elements such as alignment, surface condition, and junctions based on crash frequency and severity, often using meta-analyses and stakeholder consultations to prioritize interventions [27,28,29]. Similarly, empirical Bayesian and predictive models are employed to identify high-risk segments and latent hazards, particularly in areas with limited crash data, but these methods are not commonly aligned with long-term resilience or climate adaptation goals [28,30,31].
Recent advancements have led to the development of more integrated and forward-looking evaluation frameworks. Comprehensive safety indices now incorporate both quantitative crash data and qualitative planning variables, employing techniques such as analytic network processes and set pair analysis to support more holistic assessments [28,29]. In addition, system-based modeling approaches—including fault tree analysis and driver–vehicle–road interaction frameworks—enable early detection of design weaknesses and crash-prone areas, thereby enhancing proactive planning and design [32]. Emerging resilience-oriented methodologies further extend traditional safety evaluations by assessing the vulnerability, recovery capacity, and potential losses of infrastructure under multiple hazards such as earthquakes, floods, and hurricanes, with a particular focus on critical components like bridges [33].
A comparative analysis indicates that while both traditional and modern approaches utilize crash and performance data and assess structural integrity, only recent methods incorporate proactive risk identification, resilience considerations, and climate/disaster integration in a meaningful way. As such, there is a growing consensus that existing models, though effective for managing immediate hazards, must evolve toward comprehensive frameworks that support long-term infrastructure sustainability in the face of escalating climate and disaster risks.

2.2. Conceptual Framework for Disaster Risk Reduction Audits (DRRAs)

The Disaster Risk Reduction Audit (DRRA) framework marks a paradigm shift from conventional, event-driven safety evaluations toward a proactive, lifecycle-oriented approach to infrastructure risk management. Rather than focusing solely on post-disaster recovery, DRRAs emphasize the early identification of disaster-inducing factors and environmental vulnerabilities, integrating climate adaptation measures into all phases of infrastructure planning and operation [34,35,36].
A key feature of the DRRA approach is its lifecycle integration, wherein risks are assessed continuously from the design stage through to operational management, enabling more comprehensive and preventive strategies [21,34,35]. This is complemented by a systematic resilience evaluation framework that encompasses performance monitoring, emergency preparedness, and post-event damage assessments across all disaster phases—before, during, and after an event [34,35,36].
Compared to traditional safety evaluation models, which are often reactive and limited to event-specific risks, DRRAs provide a more holistic and sustainable basis for decision-making. Traditional frameworks tend to exclude climate-related hazards and focus on short-term performance, whereas DRRAs embed long-term resilience and adaptive capacity into infrastructure systems [34,35,36].
Recent technological and methodological advancements further enhance the applicability of DRRAs. The integration of digital twin technologies allows for real-time, data-informed monitoring and simulation of infrastructure performance under stress conditions, supporting proactive risk mitigation and lifecycle management [21]. Moreover, resilience metrics—quantifying the service gap between infrastructure capacity and community demand during disasters—offer evidence-based criteria for prioritizing interventions [37,38]. Additionally, emerging DRRA-based models incorporate environmental and social sustainability considerations into disaster recovery and adaptation strategies, reinforcing the long-term value of this approach [24,36].
In summary, the DRRA framework offers a forward-looking, structured methodology for embedding resilience into infrastructure development. Through early risk detection, continuous multi-hazard assessment, and alignment with climate adaptation strategies, DRRAs serve as a critical tool for advancing sustainable and disaster-resilient infrastructure systems.

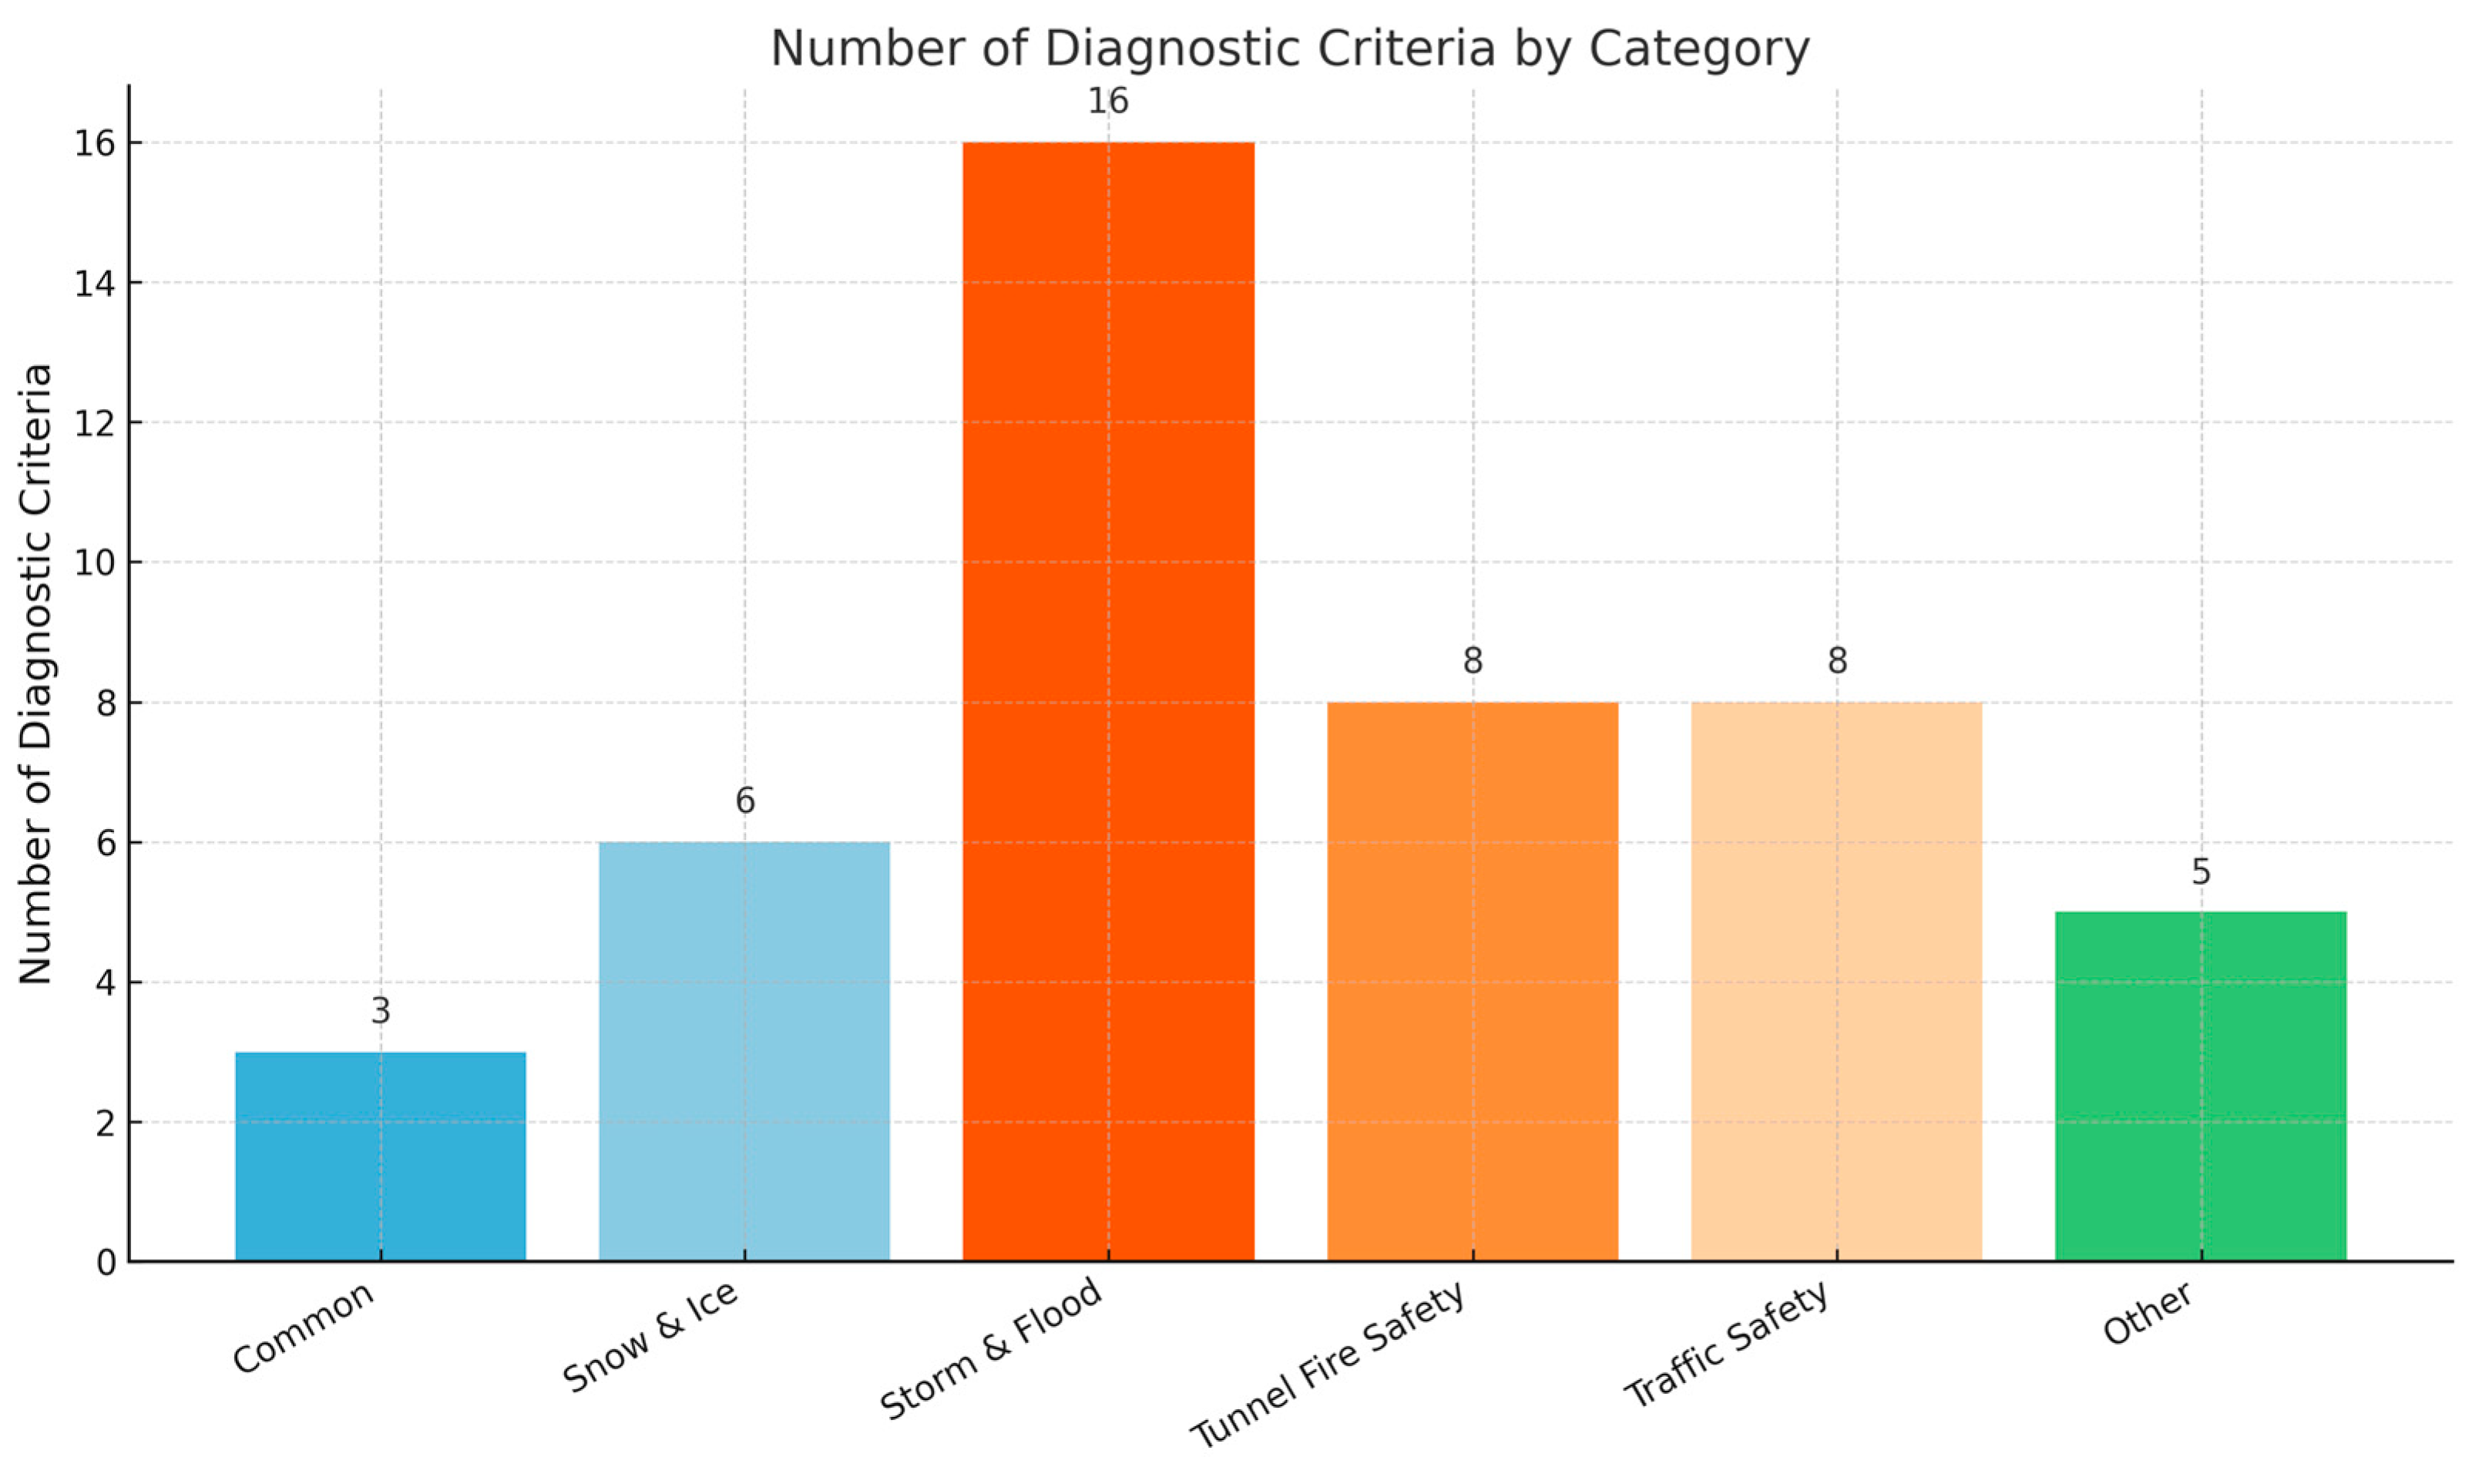
2.3. Diagnostic Criteria Table for DRRAs in Highway Infrastructure

The practical implementation of Disaster Risk Reduction Audits (DRRAs) in highway infrastructure requires a structured set of diagnostic criteria capable of evaluating disaster vulnerability, structural integrity, and environmental risks across all project phases. This section presents a diagnostic criteria table that systematically organizes key DRRA components, along with corresponding evaluation objectives, applicable project stages, measurable indicators, and recommended data sources. The criteria were developed through expert consultation and literature review, ensuring both empirical validity and contextual relevance. Designed to support early risk detection and resilience-based planning, the table serves as a foundational tool for standardizing DRRA practices and enhancing their applicability in real-world infrastructure management.
To operationalize Disaster Risk Reduction Audits (DRRAs) in highway infrastructure, a structured diagnostic framework is essential for evaluating disaster vulnerability, infrastructure safety, and emergency responsiveness. This study presents a standardized diagnostic table that covers multiple hazard domains, each comprising targeted criteria, measurable indicators, and applicable project phases. The key domains are summarized as follows [23,39,40,41]:
  • Disaster Management includes criteria such as emergency vehicle access, regional hazard vulnerability, and the presence of emergency turnaround facilities, which are critical for effective disaster response and risk reduction.
  • Snow and Ice focuses on anti-icing systems (e.g., brine spray, heated pavement), snow removal infrastructure, and safety measures for snow-prone bridge zones and access routes to de-icing material storage.
  • Storm and Flood assesses flood-prone segments, drainage capacity (e.g., culverts, pump stations), slope stability, and runoff control measures, particularly around tunnel portals and subgrades.
  • Earthquake Preparedness evaluates seismic design standards, structural resilience, and the integration of early warning and information systems.
  • Fog and Low Visibility covers visibility enhancement technologies and safety facilities designed for operation in fog-prone or low-visibility areas.
  • Tunnel Fire Safety includes fire suppression systems, emergency access and response times, structural fire resistance, and evacuation support for vulnerable users.
  • Traffic Safety and Infrastructure Integrity addresses the design of emergency exits, spatial clearance between critical infrastructure elements, rollover protection, and fire or impact resistance of bridges.
Figure 1 illustrates the distribution of diagnostic criteria across five major safety categories and one miscellaneous group, highlighting the relative emphasis placed on each domain. Notably, the Storm and Flood and Tunnel Fire Safety categories encompass the highest number of criteria, reflecting the complex and multifaceted nature of risk management in these areas. In contrast, general safety features such as emergency access and control facilities are addressed under the Common and Other categories with fewer, but essential, criteria.
Collectively, these diagnostic criteria aim to identify vulnerabilities across all phases of infrastructure use and ensure readiness against multi-hazard scenarios. Table 1 presents the proposed standard diagnostic table for highway-related DRRAs, offering a foundation for systematized evaluation and risk-informed decision-making in infrastructure planning and management.
The diagnostic criteria presented in Table 1 were derived through a combination of internationally recognized best practices [23,39,40,41] and expert consultation. The expert panel included Dr. Seung-Jun Lee and Dr. Hong-Sik Yun (Professor) from the Geodesy Laboratory, Department of Civil, Architectural, and Environmental System Engineering at Sungkyunkwan University (SKKU), as well as Sang-Hoon Lee, a Ph.D. candidate from the Disaster and Risk Management Laboratory at SKKU. Their expertise in geospatial engineering and disaster risk assessment, along with practical field experience, played a critical role in refining the scope, structure, and applicability of the proposed framework.

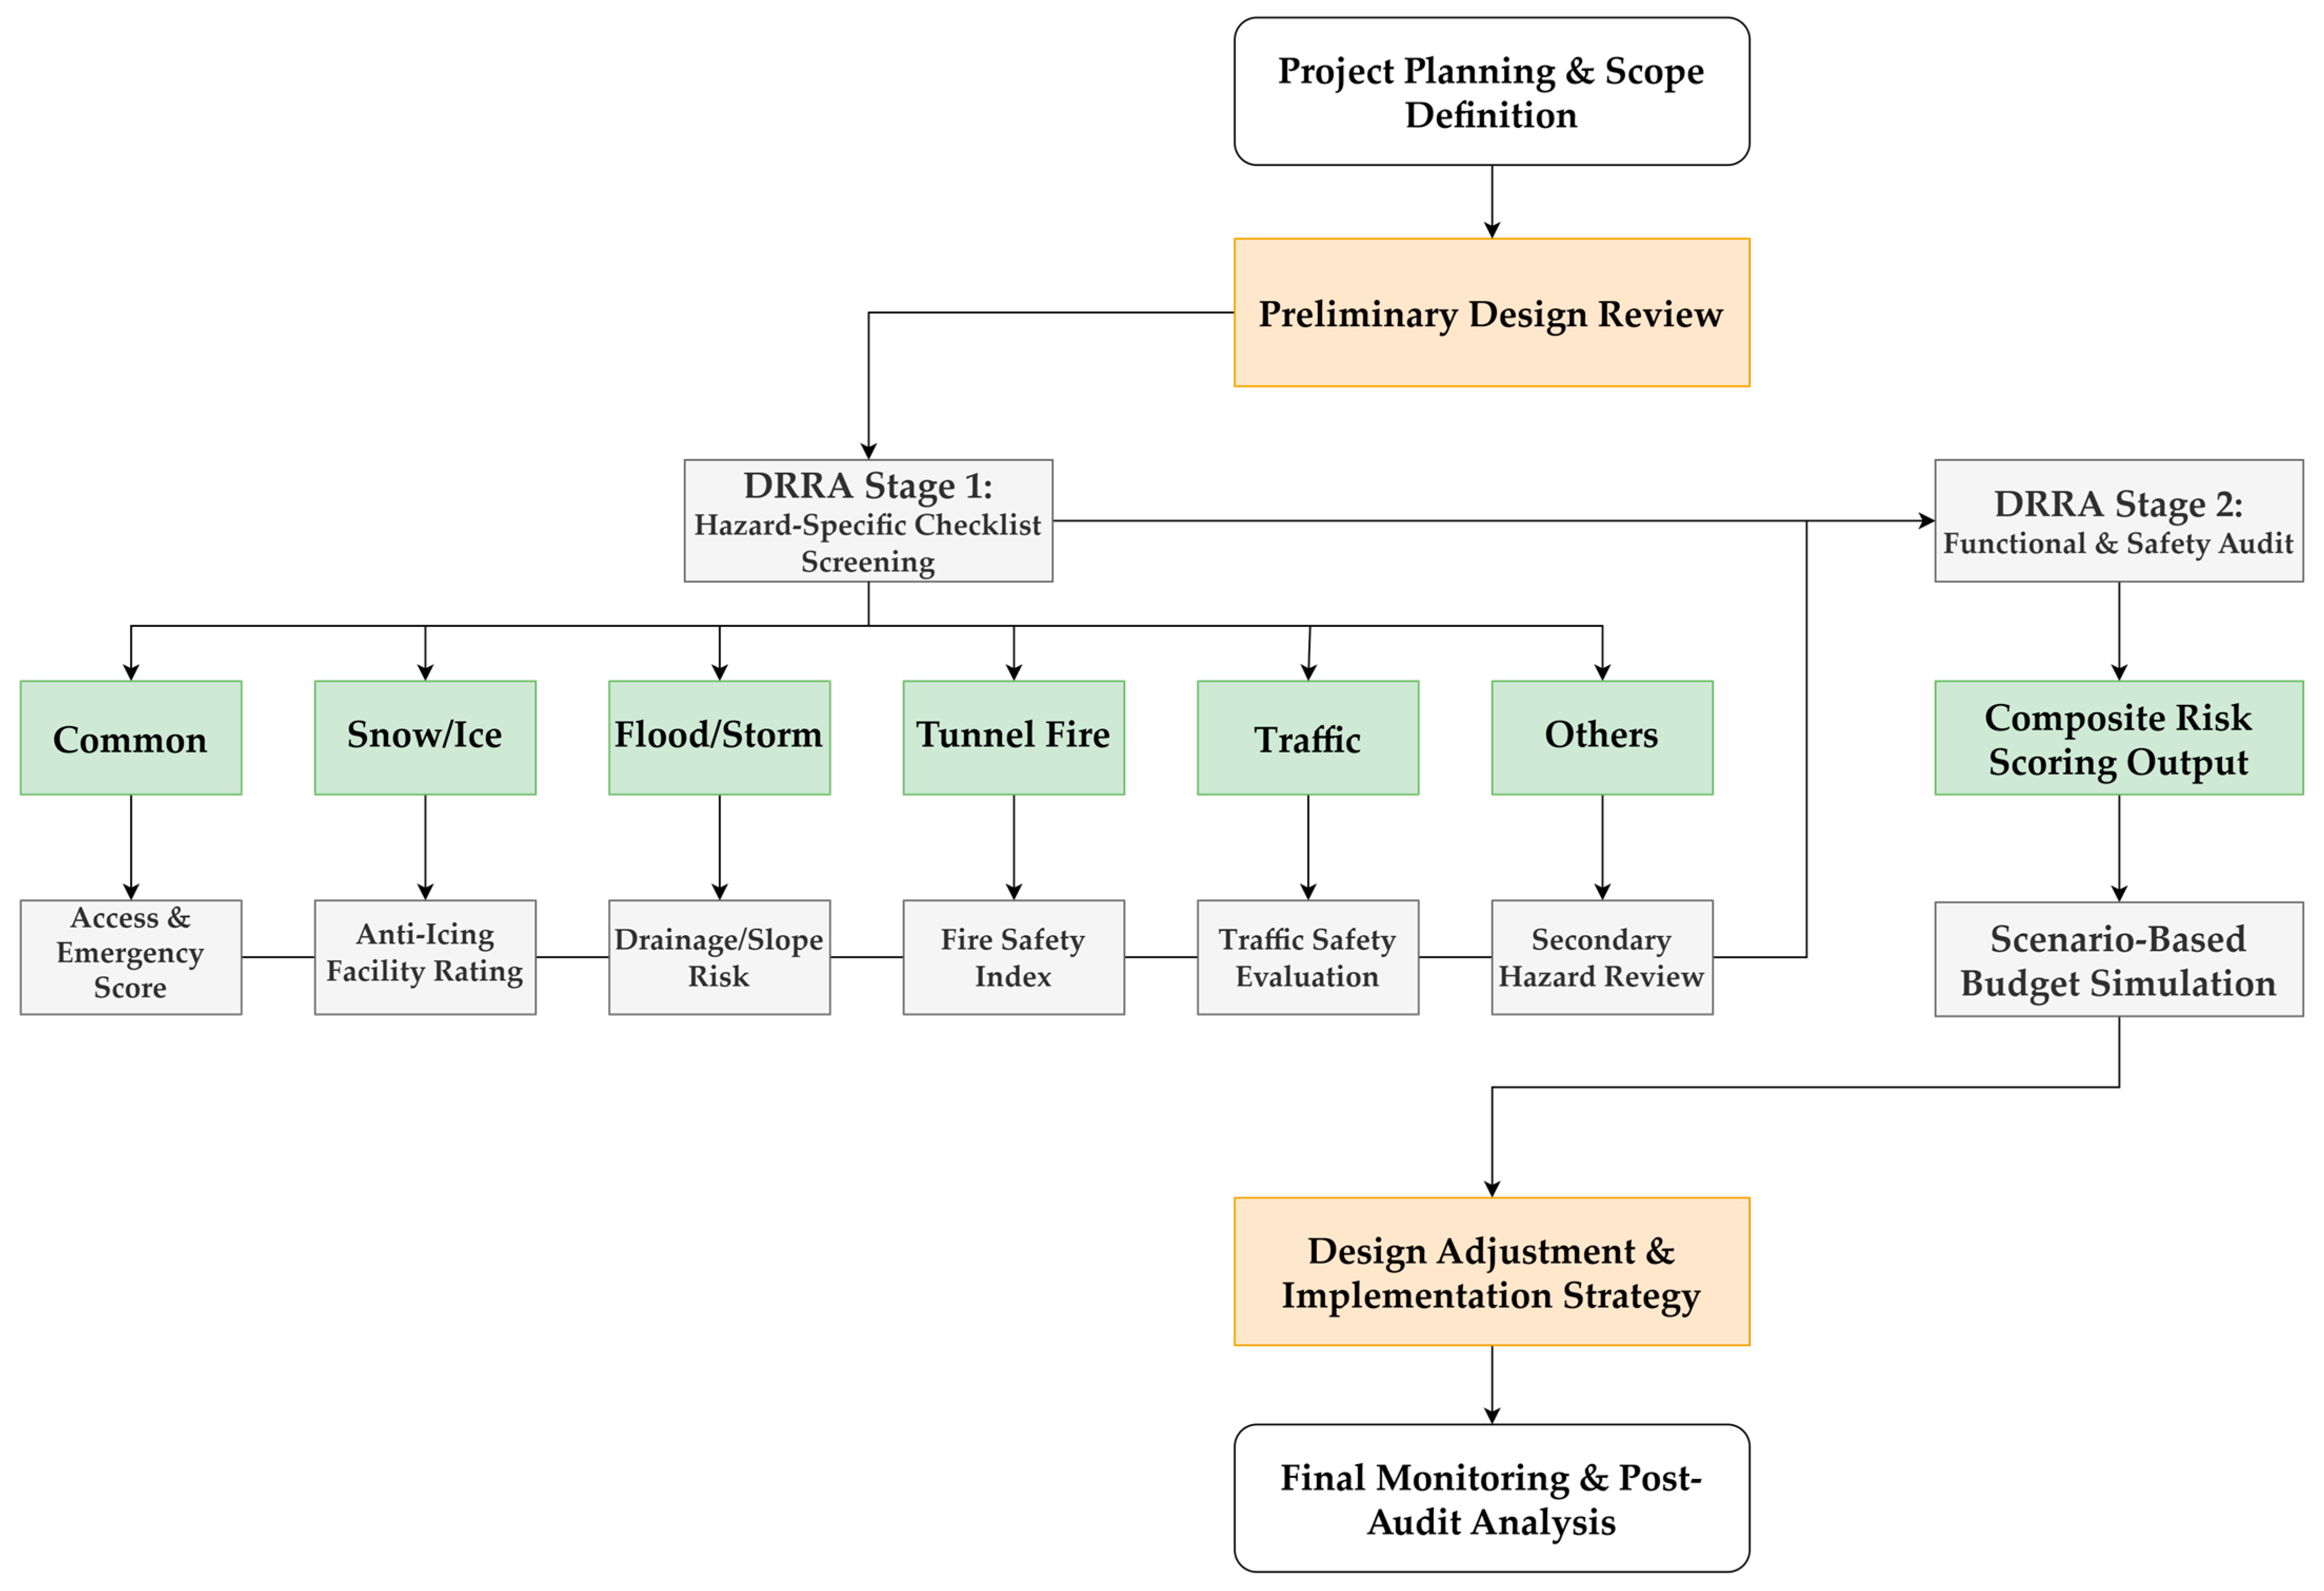
2.4. Flowchart of the Disaster Risk Reduction Audit (DRRA) Process

The Disaster Risk Reduction Audit (DRRA) process is designed as a structured, multi-phase framework that integrates hazard diagnosis, functional assessment, and strategic planning across the entire lifecycle of highway infrastructure projects. To facilitate consistent implementation and decision-making, a standardized process flow has been developed, as illustrated in Figure 2. This flowchart delineates the logical progression of DRRA activities, from the planning stage to post-audit monitoring.
The process begins with project planning and scope definition, where the applicability of the DRRA is determined based on route characteristics, environmental exposure, and expected risk factors. This is followed by a preliminary design review, during which initial project documentation and design elements are screened to identify potential vulnerabilities that may require further audit attention.
At the core of the process is DRRA Stage 1: Hazard-Specific Checklist Screening, which applies a categorized set of diagnostic criteria tailored to six major risk domains:
  • Common (general emergency access and management),
  • Snow/Ice,
  • Flood/Storm, Tunnel Fire,
  • Traffic,
  • Others (e.g., bridge fire, slope failure, falling objects).
Each category feeds into a corresponding diagnostic output—such as an access and emergency score, anti-icing facility rating, or drainage/slope risk—that reflects the adequacy or vulnerability level of infrastructure elements within that risk domain.
These outputs are consolidated into DRRA Stage 2: Functional and Safety Audit, which provides a broader evaluation of infrastructure resilience, operational integrity, and safety system effectiveness. The integration of multiple hazard assessments into a composite risk scoring output enables a holistic understanding of cumulative risks at both the segment and network levels.
The audit results are then used as inputs for a scenario-based budget simulation, which applies correction factors based on road length, number of lanes, disaster type, and audit phase. This simulation supports the formulation of a cost-effective and prioritized design adjustment and implementation strategy, ensuring that high-risk areas receive timely and proportionate mitigation interventions.
Finally, the process concludes with a final monitoring and post-audit analysis stage. Here, disaster occurrence rates and facility performance are tracked over time to evaluate the real-world effectiveness of DRRA interventions. Lessons learned are used to refine future audits, inform policy development, and strengthen institutional practices.
Overall, the flowchart serves not only as a procedural guide for DRRA execution but also as a framework for integrating disaster resilience into infrastructure governance. Its modular structure allows for adaptation across different project scales and administrative contexts, while maintaining technical rigor and audit accountability.

3. Results

3.1. Diagnostic Coverage and Site-Specific Audit Frequency of Disaster Risk Reduction Audits (DRRAs)

To evaluate the practical scope and frequency of Disaster Risk Reduction Audits (DRRAs) across national highway infrastructure, a detailed review was conducted of project sections where DRRAs were implemented between 2016 and 2020. The audits were carried out during either the design phase or construction phase, depending on project progress and risk exposure.
The diagnostic coverage was measured in terms of both the number of audited segments and their total lengths (in kilometers), categorized by year and implementation phase. As shown in Table 1, a total of 23 highway segments covering approximately 703.7 km underwent a DRRA during the five-year period. Among these, 6 segments (217.4 km) were audited during the design phase, while 17 segments (486.3 km) were audited during construction.
The number and scale of DRRA applications varied annually, reflecting the expansion of institutional adoption and the increasing demand for proactive risk management in large-scale highway projects.
In addition to total section lengths, the number of individual audit cases provides further insight into the operational workload and field-level application of DRRAs over time. Table 2 summarizes the total number of diagnostic audits conducted annually from 2016 to 2020, disaggregated by project phase (design vs. construction). The table also highlights representative expressway sections for each year, illustrating the practical implementation of DRRA across diverse highway environments and construction conditions.
Table 3 presents the annual distribution of Disaster Risk Reduction Audit (DRRA) cases from 2016 to 2020, categorized by project phase—design and construction. The data highlight a growing emphasis on DRRA integration within infrastructure development workflows, with most audits concentrated during the construction phase. Notably, 2017 and 2019 saw increased activity in design-phase audits, reflecting an institutional push toward proactive risk identification at earlier project stages. The representative expressway sections listed further illustrate the geographical and structural diversity of DRRA applications across the five-year period.

3.2. Disaster Risk Reduction Facilities Implemented Through DRRAs: Outcomes and Best Practices by Hazard Type

Based on field diagnoses conducted through the DRRA process, various hazard-specific risk reduction and mitigation facilities were newly proposed and reflected in the design and construction stages of national expressway projects. The following summarizes the key implementation outcomes by hazard type. In addition to the hazard-specific measures described above, a wide range of supplementary disaster risk reduction facilities were also implemented. These include 9 bridge inspection access structures, 16 overhead clearance control systems, 162 slope inspection walkways, and 13 early-warning sensors installed on steep slopes. Other additions consist of 8 rockfall protection systems, 6 safety upgrades for auxiliary roads, and 135 miscellaneous safety enhancements—amounting to a total of 349 newly adopted mitigation facilities.

3.2.1. Risk Reduction and Planning Measures

In regions characterized by extended tunnel sequences and prolonged downhill gradients—often exceeding 60% tunnel composition or featuring consecutive long-span bridges (e.g., 8 km and 6.5 km)—the DRRA (Disaster Risk Reduction Audit) process identified heightened risks related to driver fatigue and speeding. These conditions were particularly evident on continuous downhill segments extending approximately 18 km, where the lack of visual or physical variation on the road contributed to reduced driver vigilance. Based on these assessments, the DRRA recommended that supplementary safety features be incorporated into the road design to mitigate speed-related hazards and improve driver concentration in monotonous driving environments.
In response to these recommendations, average speed enforcement systems were implemented across the affected segments, along with aesthetic tunnel lighting designed to enhance visual engagement and orientation within long tunnel passages. These measures aimed not only to enforce compliance with speed regulations but also to alleviate cognitive fatigue and improve overall tunnel navigation safety.
Additionally, DRRA evaluations in mountainous terrains—where closely spaced tunnels are interspersed with short, exposed embankment or bridge sections—highlighted the compounded visibility and traction hazards during inclement weather. Particular attention was drawn to the “black-hole” and “white-hole” phenomena occurring at tunnel portals, where abrupt changes in lighting conditions could impair driver perception. To address these risks, the audit recommended the deployment of adaptive infrastructure such as de-icing fluid spray systems and embedded road heating elements. These were especially critical for preventing skidding and ensuring road usability during heavy snowfall or rapid freeze–thaw cycles.
As a direct outcome of DRRA implementation, a total of 301 disaster-Risk Reduction facilities were installed across audited highway segments. These included the following:
  • One average speed enforcement zone;
  • One aesthetic tunnel lighting design;
  • Thirteen variable message signs (VMS);
  • Two CCTV monitoring units;
  • Forty-two LED lighting devices for tunnel and open segment illumination;
  • Six pavement text markings for enhanced surface communication;
  • One hundred ninety-three median delineators to improve lane boundary visibility;
  • Forty-three additional auxiliary safety devices tailored to local terrain and operational needs.
These upgrades not only addressed existing infrastructure deficiencies but also contributed to a measurable improvement in overall road safety performance, demonstrating the practical effectiveness of the DRRA as a proactive, data-informed disaster risk reduction tool.

3.2.2. Storm and Snow Disaster Measures

To address poor drainage in depressed road sections, the Disaster Risk Reduction Audit (DRRA) revealed inconsistencies between surface and subsurface drainage standards—specifically, the absence of clear surface drainage guidelines in contrast to the prescriptive requirements for underground systems. In light of these findings, DRRA recommendations prompted the design offices to revise the drainage criteria for low-elevation sections, ensuring better water runoff control during heavy rainfall events and preventing waterlogging hazards.
Furthermore, the adequacy of snow removal infrastructure was thoroughly assessed, particularly in proximity to highway entry points, where delays in de-icing operations could significantly disrupt early-stage traffic flow. The audit highlighted gaps in the distribution of snow response facilities between the Seoul and Miryang maintenance divisions, including brine storage, snowplow standby capacity, and road heating provisions. As a result, a redistribution and optimization plan was implemented to balance resources more effectively and to eliminate potential gaps in service coverage between the two regions.
Following these DRRA-guided interventions, 128 new storm and snow resilience facilities were installed. These included
  • Five snow storage buildings for long-term operational capacity;
  • Seven brine production plants to maintain de-icing fluid supply;
  • Four operator standby zones enabling rapid mobilization during snow events;
  • Ninety-four automated brine sprayers for preemptive anti-icing treatment across vulnerable segments;
  • Drainage system improvements at five low-point road locations.
These enhancements significantly reinforced the highway network’s ability to manage extreme weather conditions and maintained operational continuity during winter and monsoon seasons, underscoring the DRRA’s value in guiding climate-resilient infrastructure improvements.

3.2.3. Tunnel Safety and Emergency Access

To address safety challenges specific to long tunnels, the Disaster Risk Reduction Audit (DRRA) identified significant operational limitations in emergency response coordination—particularly, the inability to efficiently locate nearby disaster response facilities using real-time CCTV monitoring. This issue stemmed from the absence of spatial linkage between tunnel-mounted CCTV cameras and the surrounding safety infrastructure. In response, the DRRA recommended the assignment of unique identification numbers to all CCTV units and the development of spatially referenced facility layout diagrams. These measures aimed to enhance situational awareness during emergencies and facilitate faster, more accurate response efforts by enabling operators to identify the exact location and type of nearby emergency equipment.
Additionally, the DRRA found that critical infrastructure such as emergency U-turn facilities was missing in ultra-long tunnel segments. A notable example was the 3450 m-long Yeonginsan Tunnel, which initially lacked emergency access and turnaround capabilities. Based on DRRA recommendations, emergency U-turns and simplified ingress/egress ramps were installed at key points, enabling faster intervention by first responders and safer evacuation routes for drivers in the event of tunnel fires or major accidents.
As a result of these targeted improvements, a total of 115 tunnel-related emergency safety facilities were newly implemented. These included the following:
  • Seventeen emergency U-turns and simplified access ramps for rapid response;
  • Four mobile smoke extractors to address fire-related ventilation needs;
  • Three tunnel blocking systems for immediate traffic containment;
  • Seventeen automatic U-turn gate systems for controlled diversion of vehicles;
  • Three tunnel evacuation lighting systems for improved visibility in smoke-filled or dark environments;
  • Seventy-one miscellaneous emergency devices, such as communication units and fire extinguishing modules.
These comprehensive upgrades significantly improved the preparedness and resilience of tunnel infrastructure in high-risk environments, demonstrating the DRRA’s critical role in guiding targeted investments in tunnel disaster management systems.

3.2.4. Structural and Slope Stabilization

In sections where expressways intersect with high-speed rail infrastructure—particularly where the vertical clearance is less than 9 m—DRRA assessments identified operational challenges related to the inspection and maintenance of bridge structures located above active rail lines. These constraints posed risks for both roadway and rail safety, as limited access impeded routine checks and emergency repairs. In response, the DRRA recommended the integration of dedicated maintenance access facilities. Through coordination with the Korea Rail Network Authority, these recommendations were accepted, and future expressway bridge designs were amended to include specialized structural provisions for safe and efficient maintenance activities above railway corridors.
In addition, for areas with high-risk slopes prone to rockfall or soil displacement, the DRRA proposed the installation of wildlife-inspired early warning systems, commonly referred to as “Owl” sensors. These devices mimic the alert behavior of nocturnal animals by using motion detectors to monitor abnormal slope activity. Upon detecting a disturbance, the sensor transmits a signal via relay systems to centralized servers, which in turn notify relevant control centers for immediate intervention. This system significantly improves the speed and accuracy of disaster response in slope failure scenarios, particularly under extreme weather conditions.
As a result of these recommendations, a total of 115 additional structural and safety features were implemented to mitigate risks in vulnerable zones. These included
  • Bridge inspection access systems over railway corridors;
  • Owl-type early warning sensors for high-risk slopes;
  • Rockfall protection structures;
  • Reinforced slope pathways and safety signage;
  • Miscellaneous safety and structural enhancements.
These upgrades reflect the DRRA’s proactive approach to hazard anticipation and infrastructure resilience, emphasizing the importance of customized countermeasures based on local terrain and facility constraints.

3.3. Scenario-Based Estimation of Labor Requirements for DRRA Implementation

To ensure a comprehensive understanding of labor distribution across different phases of Disaster Risk Reduction Audit (DRRA) implementation, scenario-based calculations were developed using weighted coefficients that reflect hazard relevance, diagnostic complexity, and audit phase specificity. The scenarios simulate expectations (person/km) based on the standard audit checklist and correlation-adjusted factors between the DRRA and the legally mandated Road Safety Audit (RSA).
To enhance the methodological transparency of labor input estimation for Disaster Risk Reduction Audits (DRRAs), the personnel coefficients presented in Table 4 were derived through a structured multi-criteria evaluation process. This process integrated quantitative weighting based on diagnostic scope, technical complexity, and audit-phase specificity. The derivation methodology is outlined as follows.
  • Classification of Hazard Domains: DRRA target elements were categorized into six major domains: General Facilities, Storm and Flood, Snow and Ice, Tunnel Safety, Traffic Safety, and Audit Documentation. Each domain reflects a distinct set of disaster scenarios and corresponding infrastructure vulnerabilities.
  • Phase-Based Operational Differentiation: The audit process was bifurcated into the design phase and construction phase 1. The design phase emphasizes document-based risk evaluation (e.g., blueprints, hydraulic calculations), whereas the construction phase focuses on empirical inspections, on-site validation, and functionality testing. Accordingly, coefficient values were modulated to reflect the relative labor intensity between desk-based assessments and field activities.
  • Functional Weighting of Diagnostic Load: Baseline coefficients were assigned to each domain based on historical data from pilot projects, regulatory precedents (e.g., Road Safety Audit standards), and expert judgment. High-risk domains such as stormwater management and snow-related hazards were allocated higher weights due to the increased frequency of on-site verification tasks, structural interdependencies, and seasonal variability.
  • Redundancy Control and Cross-Domain Calibration: To mitigate overestimation, inter-domain linkages were analyzed to adjust for overlapping inspection elements. This cross-calibration ensured that labor inputs reflect the net marginal workload attributable to each domain, not duplicated efforts.
  • Expert-Informed Refinement: The final coefficients were validated through consultations with a technical panel comprising domain experts in geotechnical engineering, tunnel fire safety, and infrastructure maintenance planning. These experts reviewed the proposed audit scenarios and adjusted coefficients to reflect realistic implementation timelines and resource constraints.
Table 4 outlines the coefficient framework for labor input estimation (in person·days/km) across major DRRA diagnostic categories during the Design Phase. For example, the storm and flood domain received a coefficient of 1.51, reflecting the need for advanced hydrological risk modeling and drainage infrastructure assessment. In contrast, the common facilities category, which primarily involves emergency access and turnaround evaluations, was assigned a moderate value of 0.62. The Audit Report Preparation category recorded the highest value at 2.17, due to its comprehensive documentation, integration of diagnostic findings, and regulatory compliance requirements. This weighting system serves as a replicable and scalable mechanism for labor forecasting and enables cost–benefit analysis in future DRRA applications.
The weighting coefficients presented in Table 5 and Table 6 were derived to reflect the relative workload intensity across hazard categories and audit phases in Disaster Risk Reduction Audits (DRRAs). To ensure methodological rigor, a structured relevance-based assessment was conducted, assigning importance levels—high, medium, and low—based on the degree of technical knowledge and field experience required for each diagnostic item. High importance was assigned a weight of 1.0, corresponding to items necessitating highly specialized expertise and advanced engineering judgment; medium was weighted at 0.7, reflecting tasks requiring moderate expertise; and low importance was weighted at 0.5, generally associated with standard procedural knowledge and field familiarity.
In addition, to account for differences in audit timing and task characteristics, a compensatory adjustment was applied to the design phase. As this phase primarily involves document and drawing review rather than on-site verification, a correction factor of 0.5 was multiplied to the base weights for the design phase across all categories. This calibrated framework ensures that both diagnostic complexity and phase-specific task intensity are adequately captured in labor and resource planning for DRRA implementation. The final weightings are summarized in Table 5 and Table 6.
The base values for each major disaster category—Common Access/Emergency Facilities, Flood, Snow/Ice, Tunnel Fire Safety, and Traffic Infrastructure—were adjusted according to importance (high = 1.0, medium = 0.7, low = 0.5) and then recalibrated by audit phase:
  • The design phase was further adjusted with a factor of 0.5 due to reliance on drawings.
  • Construction phase 1 reflects intensive on-site hazard identification and mitigation planning.
  • Construction phase 2 was calculated with a 0.8 factor of Phase 1 to represent follow-up audits (reduced scope and verification tasks only).
Table 6 provides a detailed summary of the labor requirements (in person/km) for Disaster Risk Reduction Audits (DRRAs) by hazard category and project phase—design, construction phase 1, and construction phase 2. The estimates incorporate both the relative importance of each hazard and the associated diagnostic workload. These figures serve as the final scenario-based outcome for DRRA labor planning across different implementation stages.

3.4. Evaluating the Impact of DRRAs: Scenario-Based Evidence of Risk Reduction and Infrastructure Enhancement

To verify the effectiveness of Disaster Risk Reduction Audits (DRRAs), a comparative analysis was conducted using real-world disaster occurrence data from 2017 to 2019, across both DRRA-implemented and non-implemented highway segments.

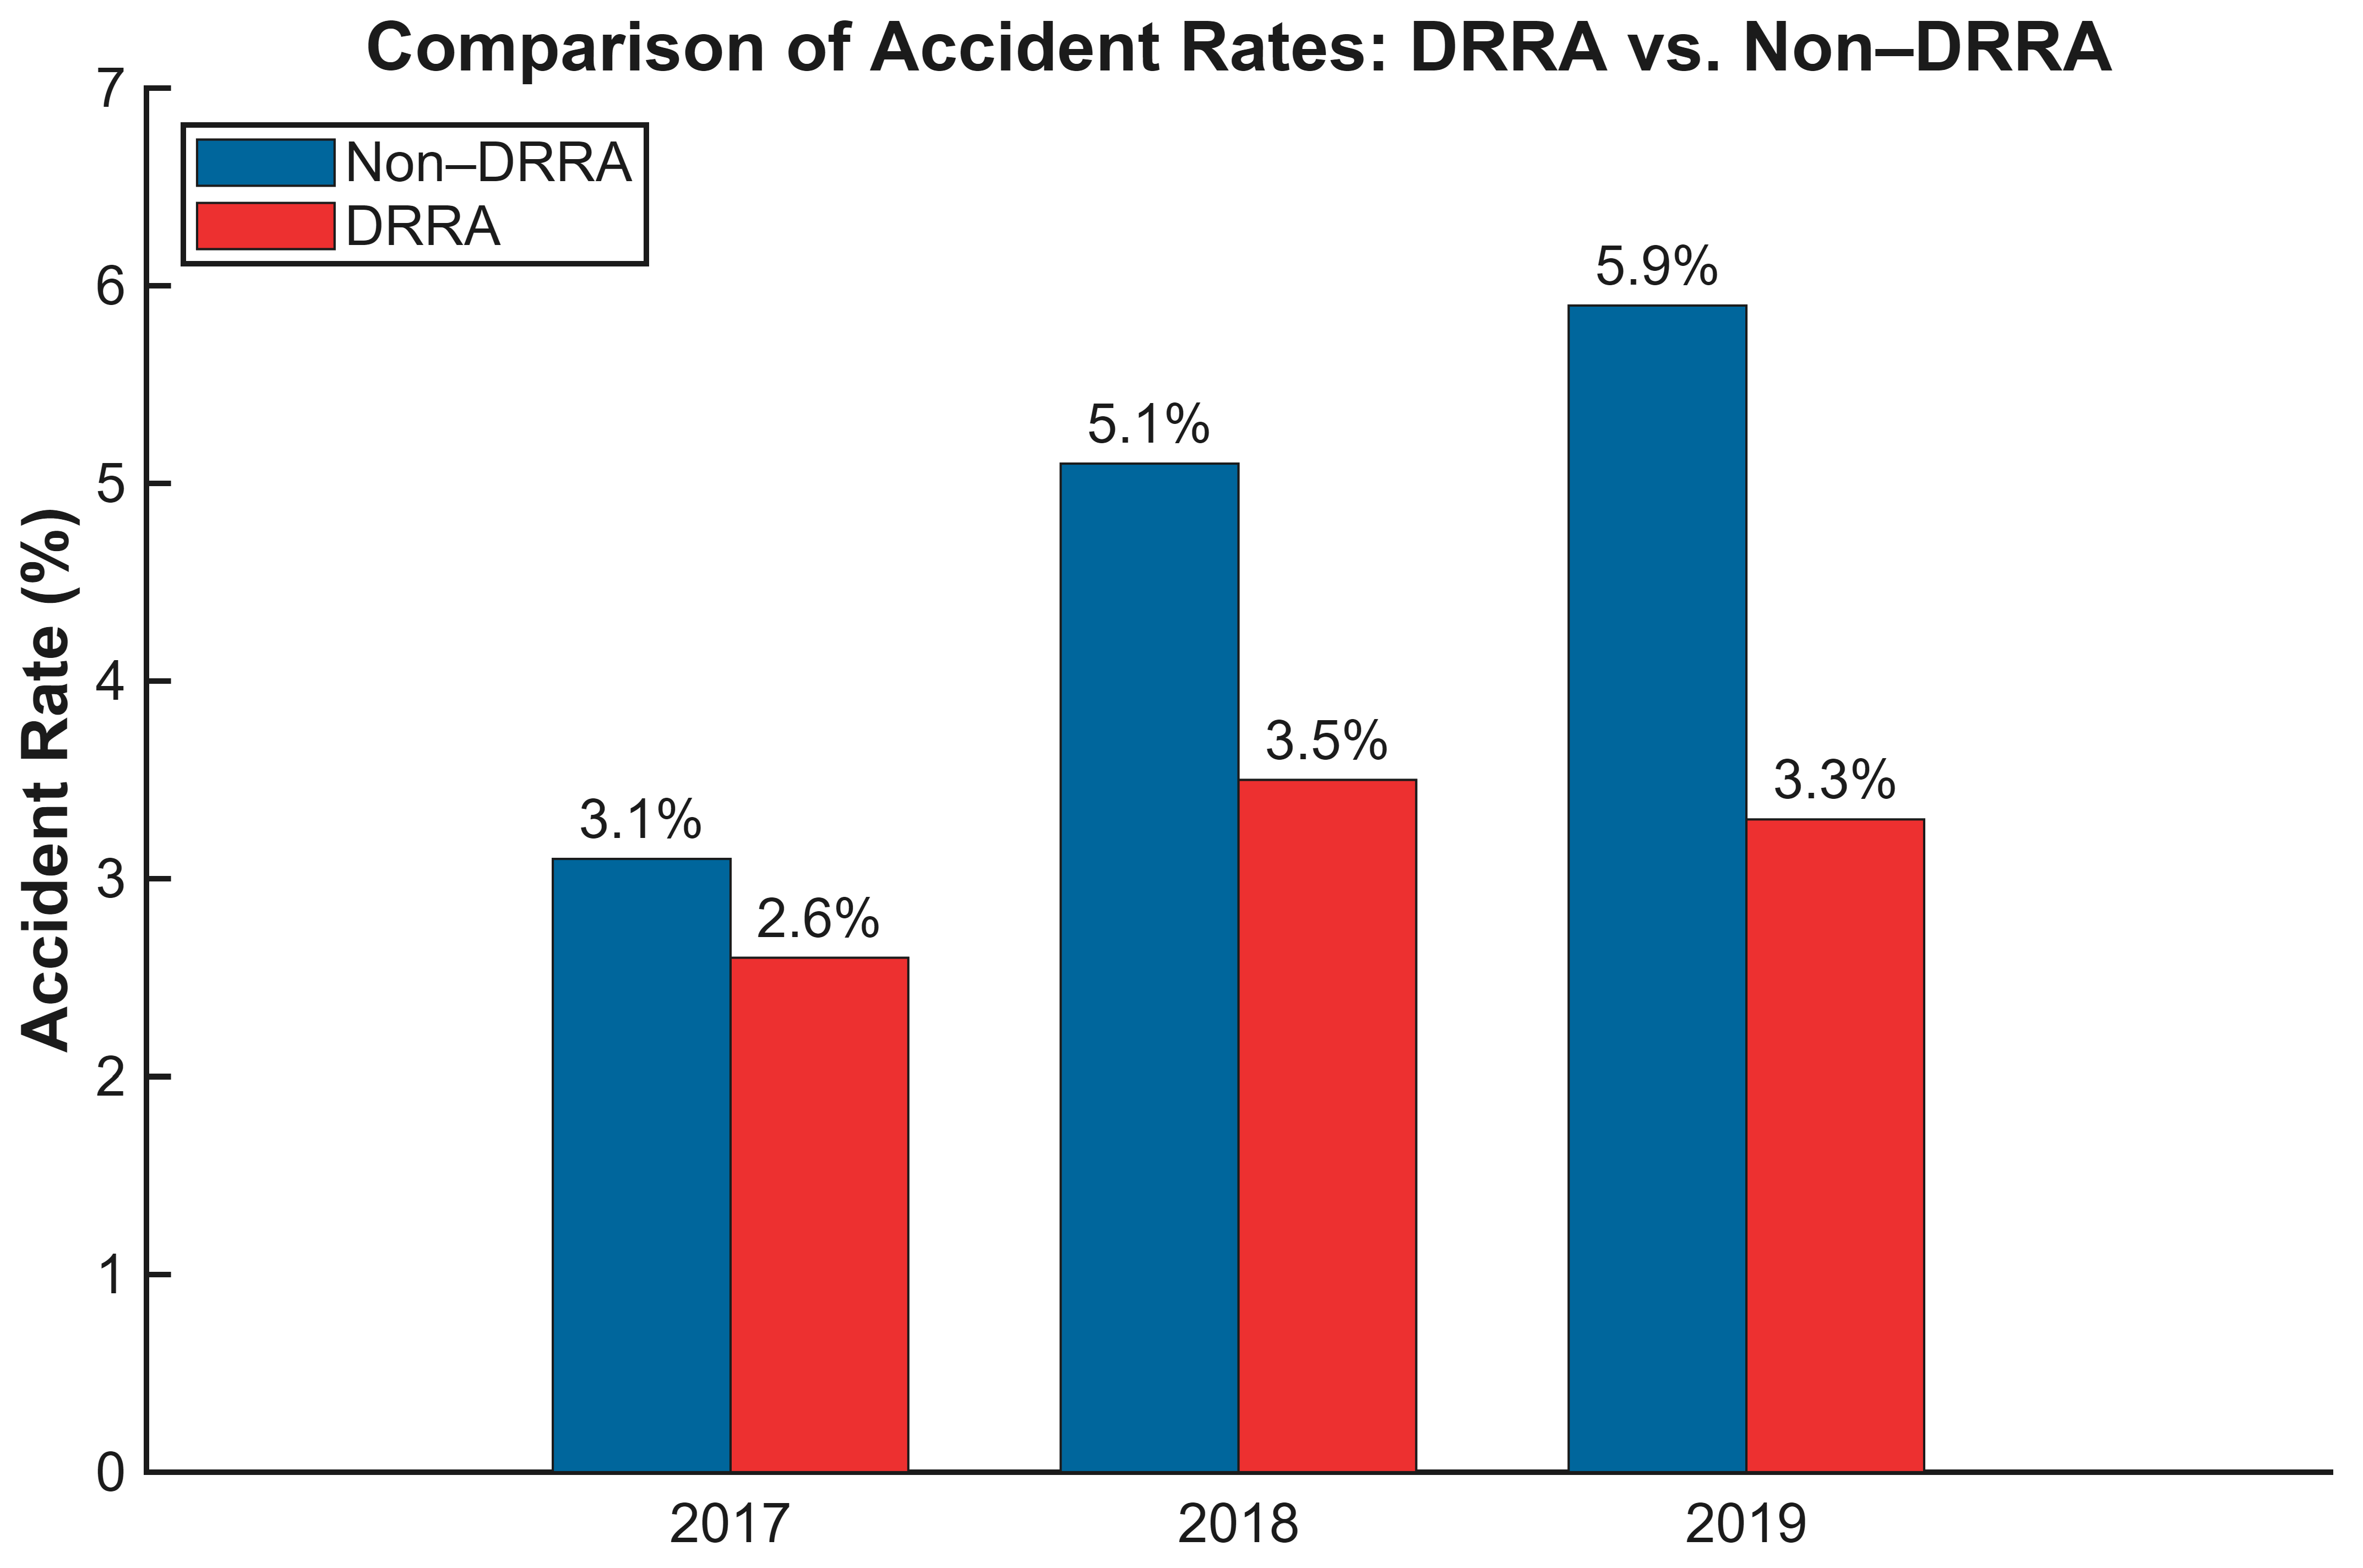
3.4.1. Reduction in Overall Disaster Frequency

Analysis of nationwide highway data from 2017 to 2019 in South Korea reveals that DRRA-applied segments consistently exhibited lower disaster occurrence rates compared to non-DRRA segments. While non-DRRA sections showed a rising trend in disaster incidents per kilometer (3.1% in 2017, 5.1% in 2018, and 5.9% in 2019), DRRA-implemented sections maintained relatively stable and lower rates (2.6%, 3.5%, and 3.3%, respectively). These findings suggest the potential of DRRA as an effective mechanism for mitigating disaster risks across large-scale infrastructure networks. Figure 3 illustrates the annual accident rates of projects with and without Disaster Risk Reduction Audits (DRRAs) from 2017 to 2019.
  • 2017: 3.1% (non-DRRA) vs. 2.6% (DRRA);
  • 2018: 5.1% (non-DRRA) vs. 3.5% (DRRA);
  • 2019: 5.9% (non-DRRA) vs. 3.3% (DRRA).
To estimate the economic benefits of Disaster Risk Reduction Audits (DRRAs), a monetary analysis was conducted using internationally recognized cost benchmarks. Accident rate reductions observed between 2017 and 2019 ranged from 16.1% to 44.1%, with the most significant reduction occurring in 2019—from 5.9% (non-DRRA) to 3.3% (DRRA), reflecting a 44.1% improvement. According to the U.S. National Highway Traffic Safety Administration [42], the average social cost per traffic accident is approximately USD 1.6 million. Applying this metric, a 44.1% reduction in 100 accidents would result in an estimated cost savings of USD 70.6 million. Furthermore, OECD reports indicate that road traffic accidents account for 1.3% of Korea’s GDP. Based on an estimated GDP of USD 1.4 trillion in 2023, this corresponds to USD 18.2 billion in annual socio-economic losses [43,44]. A conservative reduction of 30–40% in accident-related damages through DRRA implementation could therefore yield annual savings of USD 5.5–7.3 billion. These findings are consistent with international evidence such as Australia’s Black Spot Program, which reported a benefit–cost ratio (BCR) of 10 to 18 [45,46], and the European Commission’s road safety initiatives that deliver approximately EUR 50 billion (USD 55 billion) in annual savings [46], equivalent to 0.5% of European GDP. Collectively, these insights suggest that DRRAs have the potential to generate substantial and quantifiable economic returns when applied at scale.
Table 7 summarizes the estimated economic benefits of implementing Disaster Risk Reduction Audits (DRRAs), based on accident reduction effects, national-level loss indicators, and international policy benchmarks.

3.4.2. Case Studies: High-Impact Examples

The effectiveness of Disaster Risk Reduction Audits (DRRAs) was further validated through several real-world expressway case studies. On the Gyeongbu Expressway (Eonyang –Yeongcheon section), the application of DRRA in late 2018 led to an approximately 75% reduction in disaster occurrences. In a same-route comparison between the Cheongwon –Sangju (non-DRRA) and Sangju –Yeongdeok (DRRA-applied) sections, the DRRA segment recorded ten times fewer disasters. A cross-route analysis comparing the Seoul–Yangyang Expressway with the Jungbu Expressway, despite similar traffic volumes, revealed that the DRRA segment had 2.9 times fewer incidents. These findings indicate that the implementation of DRRA substantially reduces the risk of major disasters, regardless of traffic intensity or structural characteristics.
The results presented in Table 8 clearly demonstrate a substantial difference in disaster frequency depending on DRRA implementation. Despite being part of the same expressway route, the DRRA-applied section (Sangju –Yeongdeok) recorded only two incidents over the three-year period, whereas the non-DRRA segment (Cheongwon –Sangju) experienced 21 incidents. This tenfold disparity underscores the effectiveness of DRRA in mitigating disaster risks, even under comparable geographic alignment and traffic characteristics. The findings reinforce the role of DRRA as a decisive factor in enhancing resilience and operational safety on national highway networks.
Table 9 presents a comparative analysis of disaster occurrences on two expressways—Seoul–Yangyang and Jungbu—that maintained similar average daily traffic volumes (AADTs) over the 2017–2019 period. Despite these comparable traffic conditions, the results show a consistent disparity in accident frequency, with the DRRA-implemented Seoul–Yangyang Expressway reporting significantly fewer incidents each year. For example, in 2019, both routes recorded the same AADT of 41,000 vehicles/day; however, the Seoul–Yangyang segment had 7 incidents compared to 19 on the non-DRRA Jungbu Expressway. This stark contrast highlights the tangible impact of DRRA in reducing disaster risk, even when controlling for traffic exposure, and further supports the strategic value of institutionalizing DRRA within national infrastructure safety protocols.

4. Discussion

The implementation of Disaster Risk Reduction Audits (DRRAs) at different stages of highway development—design, initial construction (construction phase 1), and follow-up construction (construction phase 2)—demonstrates both technical feasibility and practical effectiveness in enhancing disaster resilience. As outlined in Section 3.3, scenario-based estimation reveals that an average of 6.7 person per kilometer is required when a DRRA is systematically applied across all three stages. Although this represents a measurable investment in technical labor and audit resources, the resulting safety outcomes strongly justify the effort.
Using the standardized audit checklist introduced in Section 2.3, DRRAs were applied to a cumulative 703.7 km of expressway construction. Comparative analysis with non-DRRA segments, as detailed in Section 3.4, shows a tangible decrease in disaster occurrences across all years of observation. Notably, DRRA-implemented sections consistently reported lower incident rates per kilometer, even under similar environmental, geographic, and traffic conditions.
These findings affirm that the DRRA functions not merely as a procedural safeguard but as a preventive engineering strategy that directly contributes to risk mitigation in expressway infrastructure. Particularly in large-scale national projects where the cost of a single catastrophic event can be substantial, the integration of DRRAs into routine project workflows offers a scalable and data-driven solution to improving long-term operational safety.
Recent literature highlights a growing emphasis on resilience as a central criterion in sustainable infrastructure design and disaster preparedness. According to [47], resilient cities require multi-criteria decision-making systems that can handle uncertainty and stakeholder hesitancy through integrated prioritization and efficiency modeling. Their findings underscore the value of structured audit-based frameworks, such as DRRAs, that incorporate cross-sectoral risk dimensions and facilitate transparent evaluation under complex urban conditions. The alignment of DRRAs with such decision-support approaches could improve the prioritization of high-risk segments within transportation infrastructure systems.
Collectively, these studies suggest that the DRRA is well-positioned to serve not only as a standalone audit tool but as a strategic enabler of integrated resilience frameworks. Future research should explore hybrid models that fuse DRRA procedures with systems engineering, AI-based risk modeling, and social resilience indicators to advance infrastructure planning under compound risk scenarios.
The empirical effectiveness of the DRRA in reducing disaster rates substantiates the case for its formal integration into national highway policy frameworks. Despite its resource requirements, the standardized and modular nature of the audit process ensures scalability and adaptability across infrastructure programs of varying complexity.

5. Conclusions

This study proposed a proactive safety assessment model by integrating Disaster Risk Reduction Audits (DRRAs) into highway infrastructure management. Scenario-based estimations, diagnostic simulations, and field-validated case studies demonstrated that DRRAs significantly reduce disaster occurrence rates while enhancing infrastructure resilience and long-term serviceability.
Rather than functioning as a procedural formality, the DRRA constitutes an engineering-driven innovation that redefines conventional safety assurance frameworks. By embedding structured diagnostics, data-driven risk modeling, and lifecycle-oriented management from the earliest planning stages, the DRRA enables intelligent, preventive interventions across national highway networks.
Importantly, the DRRA offers scalability and adaptability while supporting integration with advanced digital technologies such as digital twin (DT) systems, Building Information Modeling (BIM), and real-time sensor-based monitoring. In particular, BIM contributes to DRRAs by enabling object-level data modeling, 3D spatial visualization, and risk scenario simulation throughout the infrastructure lifecycle. During the design and planning phase, BIM facilitates the early identification of hazard-prone elements through clash detection and spatial risk mapping. In the construction phase, it supports the integration of safety protocols into digital models, allowing for scenario-based simulations of accidents, material failures, or environmental stress. During operation and maintenance, BIM enables risk tracking and predictive maintenance by linking model elements to live data from sensors or inspection records. This synergy between DRRAs and BIM enhances structural and spatial coherence, supports proactive decision-making, and enables seamless risk prediction and mitigation from design through operation.
Given the growing threats posed by climate change and the increasing interdependence of infrastructure systems, institutionalizing DRRAs within highway development policy is both urgent and strategically essential. Furthermore, the proposed framework should be expanded beyond highways to other critical infrastructure sectors—including railways, airports, ports, and dams—where it can serve as a cornerstone for next-generation, resilience-oriented asset management. When combined with BIM-based integrated planning, DRRAs have the potential to fundamentally elevate national infrastructure safety and disaster preparedness.

Author Contributions

Conceptualization, S.-J.L., S.-H.L., H.-S.Y., J.-S.K. and H.-D.B.; methodology, S.-J.L. and S.-H.L.; software, S.-J.L. and S.-H.L.; validation, S.-J.L., S.-H.L. and H.-S.Y.; formal analysis, S.-J.L., S.-H.L., J.-S.K. and H.-D.B.; investigation, S.-J.L. and S.-H.L.; resources, S.-J.L. and S.-H.L.; data curation, S.-J.L. and S.-H.L.; writing—original draft preparation, S.-J.L., S.-H.L., J.-S.K. and H.-D.B.; writing—review and editing, H.-S.Y., J.-S.K. and H.-D.B.; visualization, S.-J.L. and S.-H.L.; supervision, H.-S.Y.; project administration, H.-S.Y.; funding acquisition, H.-S.Y., J.-S.K. and H.-D.B. All authors have read and agreed to the published version of the manuscript.

Funding

This work was supported by a National Research Foundation of Korea (NRF) grant funded by the Korea government (MSIT) (RS-2021-NR059478).

Institutional Review Board Statement

Not applicable.

Informed Consent Statement

Not applicable.

Data Availability Statement

The original contributions presented in the study are included in the article; further inquiries can be directed to the corresponding authors.

Conflicts of Interest

The authors declare no conflicts of interest.

References

  1. Koks, E.E.; Rozenberg, J.; Zorn, C.; Tariverdi, M.; Vousdoukas, M.; Fraser, S.A.; Hall, J.W.; Hallegatte, S. A Global Multi-Hazard Risk Analysis of Road and Railway Infrastructure Assets. Nat. Commun. 2019, 10, 2677. [Google Scholar] [CrossRef] [PubMed]
  2. Hassan, S.A.; Amlan, H.A.A.; Alias, N.E.; Ab-Kadir, M.A.A.; Abdul Sukor, N.S. Vulnerability of Road Transportation Networks under Natural Hazards: A Bibliometric Analysis and Review. Int. J. Disaster Risk Reduct. 2022, 83, 103393. [Google Scholar] [CrossRef]
  3. Karatzetzou, A.; Stefanidis, S.; Stefanidou, S.; Tsinidis, G.; Pitilakis, D. Unified Hazard Models for Risk Assessment of Transportation Networks in a Multi-Hazard Environment. Int. J. Disaster Risk Reduct. 2022, 75, 102960. [Google Scholar] [CrossRef]
  4. Fioklou, A.; Alipour, A. Probability of Failure Estimation for Highway Bridges under Combined Effects of Uncorrelated Multiple Hazards. Resil. Cities Struct. 2022, 1, 79–93. [Google Scholar] [CrossRef]
  5. Decò, A.; Frangopol, D.M. Risk Assessment of Highway Bridges under Multiple Hazards. J. Risk Res. 2011, 14, 1057–1089. [Google Scholar] [CrossRef]
  6. Zhao, B.; Zheng, W.; Li, S.; Cifci, M.A.; Arslan, E.; Khalighi, N.; Moayedi, H. Assessing and Measuring the Vulnerability of Highway Construction Projects with BIM Using Artificial Intelligence Optimization Algorithms. Environ. Dev. Sustain. 2025, 1–35. [Google Scholar] [CrossRef]
  7. Santos, L.B.L.; Soares, G.G.; Garg, T.; Jorge, A.A.S.; Londe, L.R.; Reani, R.T.; Bacelar, R.B.; Oliveira, C.E.S.; Freitas, V.L.S.; Sokolov, I.M. Vulnerability Analysis in Complex Networks under a Flood Risk Reduction Point of View. Front. Phys. 2023, 11, 1064122. [Google Scholar] [CrossRef]
  8. Chamorro, A.; Echaveguren, T.; Allen, E.; Contreras, M.; Cartes, P.; Contreras, M.; Jimenez, G.; Pattillo, C.; De Solminihac, H.; Vargas, J.; et al. Risk Management System for Road Networks Exposed to Natural Hazards. In Proceedings of the Lifelines 2022, American Society of Civil Engineers, Virtual, 31 January–11 February 2022; pp. 166–177. [Google Scholar] [CrossRef]
  9. Huang, X.; Wang, X.; Pei, J.; Xu, M.; Huang, X.; Luo, Y. Risk Assessment of the Areas along the Highway Due to Hazardous Material Transportation Accidents. Nat. Hazards 2018, 93, 1181–1202. [Google Scholar] [CrossRef]
  10. Chaudhary, S.K. Road Safety Audit and Safety Impact Assessment. Indian Highways 2014, 42, 73–82. Available online: https://trid.trb.org/View/1286976 (accessed on 1 July 2025).
  11. Gerlach, J. Road Infrastructure Safety Management as Part of the Decade of Action for Road Safety—Preconditions, Instruments and Examples from Europe. In Proceedings of the European Transport Conference 2012, Glasgow, UK, 8–10 October 2012; Association for European Transport (AET): London, UK, 2012. Available online: https://aetransport.org/public/downloads/m4rh0/5277-5218a23eb2c7c.pdf (accessed on 1 July 2025).
  12. Wegman, F.C.M.; Roszbach, R.; Mulder, J.A.G.; Schoon, C.C.; Poppe, F. Road Safety Impact Assessment: RIA. A Proposal for Tools and Procedures for a RIA. A Study Commissioned by the European Commission DG VII; Institute for Road Safety Research (SWOV): Leidschendam, The Netherlands, 1994; p. 37. Available online: https://library.wur.nl/WebQuery/titel/576578 (accessed on 1 July 2025).
  13. Van Rensburg, J.F.; Van As, S.C. Issues with Traffic Impact Assessments. In Proceedings of the SATC 2004, Pretoria, South Africa, 12–15 July 2004. [Google Scholar]
  14. Caldera, S.; Mostafa, S.; Desha, C.; Mohamed, S. Integrating Disaster Management Planning into Road Infrastructure Asset Management. Infrastruct. Asset Manag. 2021, 8, 219–233. [Google Scholar] [CrossRef]
  15. Chen, C.; Lin, L.-K. The Risk Assessment Management of Disaster Risk Reduction on Roads. In Proceedings of the 8th International Exchange and Innovation Conference on Engineering & Sciences (IEICES), Fukuoka, Japan, 20–21 October 2022; pp. 438–443. [Google Scholar] [CrossRef]
  16. Huang, C.; Chang, K.; Liu, C.; Chang, T.; Lin, Y. Network Reliability Analysis on Casualty Rescue for Natural Disaster Evaluation. Ann. Oper. Res. 2025, 348, 399–419. [Google Scholar] [CrossRef]
  17. Ding, Y.; Wang, P.; Liu, X.; Zhang, X.; Hong, L.; Cao, Z. Risk Assessment of Highway Structures in Natural Disaster for the Property Insurance. Nat. Hazards 2020, 104, 2663–2685. [Google Scholar] [CrossRef]
  18. Ou-Yang, B.; Chu, C.-C.; Da, Y.-B.; Liu, X.-F.; Zhang, H.-Y. Highway Flood Disaster Risk Evaluation and Management in China. Nat. Hazards 2015, 75, 381–397. [Google Scholar] [CrossRef]
  19. Ansari, A.; Rao, K.S.; Jain, A.K.; Ansari, A. Formulation of Multi-Hazard Damage Prediction (MhDP) Model for Tunnelling Projects in Earthquake and Landslide-Prone Regions: A Novel Approach with Artificial Neural Networking (ANN). J. Earth Syst. Sci. 2023, 132, 164. [Google Scholar] [CrossRef]
  20. Liu, X.; Zhang, X.; Ren, R.; Mahmoud, H.N. Assessment of China’s 20 Years of Infrastructure and Policy Development for Flood Disaster Management. Int. J. Disaster Risk Reduct. 2025, 117, 105211. [Google Scholar] [CrossRef]
  21. Yu, D.; He, Z. Digital Twin-Driven Intelligence Disaster Risk Reduction and Mitigation for Infrastructure: Advances, Challenges, and Opportunities. Nat. Hazards 2022, 112, 1–36. [Google Scholar] [CrossRef] [PubMed]
  22. Elvas, L.B.; Mataloto, B.M.; Martins, A.L.; Ferreira, J.C. Disaster Management in Smart Cities. Smart Cities 2021, 4, 819–839. [Google Scholar] [CrossRef]
  23. Liu, W.; Shan, M.; Zhang, S.; Zhao, X.; Zhai, Z. Resilience in Infrastructure Systems: A Comprehensive Review. Buildings 2022, 12, 759. [Google Scholar] [CrossRef]
  24. Rathnayaka, B.; Siriwardana, C.; Robert, D.; Amaratunga, D.; Setunge, S. Improving the Resilience of Critical Infrastructures: Evidence-Based Insights from a Systematic Literature Review. Int. J. Disaster Risk Reduct. 2022, 78, 103123. [Google Scholar] [CrossRef]
  25. Gardoni, P.; Murphy, C. Society-Based Design: Promoting Societal Well-Being by Designing Sustainable and Resilient Infrastructure. Sustain. Resil. Infrastruct. 2020, 5, 4–19. [Google Scholar] [CrossRef]
  26. Alderson, D.L.; Brown, G.G.; Carlyle, W.M. Operational Models of Infrastructure Resilience. Risk Anal. 2015, 35, 562–586. [Google Scholar] [CrossRef] [PubMed]
  27. Papadimitriou, E.; Filtness, A.; Theofilatos, A.; Ziakopoulos, A.; Quigley, C.; Yannis, G. Review and Ranking of Crash Risk Factors Related to the Road Infrastructure. Accid. Anal. Prev. 2019, 125, 85–97. [Google Scholar] [CrossRef] [PubMed]
  28. Cafiso, S.; La Cava, G.; Montella, A. Safety Index for Evaluation of Two-Lane Rural Highways. Transp. Res. Rec. 2007, 2019, 136–145. [Google Scholar] [CrossRef]
  29. Yang, Y.; Easa, S.M.; Lin, Z.; Zheng, X. Evaluating Highway Traffic Safety: An Integrated Approach. J. Adv. Transp. 2018, 2018, 4598985. [Google Scholar] [CrossRef]
  30. Pernetti, M.; Antoniazzi, A.; Ketabdari, M.; Crispino, M.; Toraldo, E. Determining the Safety Level of State Roads: An Italian Case Study. Appl. Sci. 2024, 14, 6663. [Google Scholar] [CrossRef]
  31. Al-Masaeid, H.R.; Sinha, K.C.; Kuczek, T. Evaluation of Safety Impact of Highway Projects. Transp. Res. Rec. 1993, 1401, 9–16. [Google Scholar]
  32. Chen, Y.; Wang, K.; Xu, C.; Shi, Q.; He, J.; Li, P.; Shi, T. Evaluation of the Safety Performance of Highway Alignments Based on Fault Tree Analysis and Safety Boundaries. Traffic Inj. Prev. 2018, 19, 409–416. [Google Scholar] [CrossRef] [PubMed]
  33. Li, Y.; Dong, Y.; Frangopol, D.M.; Gautam, D. Long-Term Resilience and Loss Assessment of Highway Bridges under Multiple Natural Hazards. Struct. Infrastruct. Eng. 2020, 16, 626–641. [Google Scholar] [CrossRef]
  34. Sathurshan, M.; Saja, A.; Thamboo, J.; Haraguchi, M.; Navaratnam, S. Resilience of Critical Infrastructure Systems: A Systematic Literature Review of Measurement Frameworks. Infrastructures 2022, 7, 67. [Google Scholar] [CrossRef]
  35. Capacci, L.; Biondini, F.; Frangopol, D.M. Resilience of Aging Structures and Infrastructure Systems with Emphasis on Seismic Resilience of Bridges and Road Networks: Review. Resil. Cities Struct. 2022, 1, 23–41. [Google Scholar] [CrossRef]
  36. Irankunda, G.; Zhang, W.; Fernand, M.; Zhang, J. Assessing the Resilience of Critical Infrastructure Facilities toward a Holistic and Theoretical Approach: A Multi-Scenario Evidence and Case Study. Sustainability 2024, 16, 8735. [Google Scholar] [CrossRef]
  37. Didier, M.; Broccardo, M.; Esposito, S.; Stojadinovic, B. A Compositional Demand/Supply Framework to Quantify the Resilience of Civil Infrastructure Systems (Re-CoDeS). Sustain. Resil. Infrastruct. 2018, 3, 86–102. [Google Scholar] [CrossRef]
  38. Blagojević, N.; Hefti, F.; Henken, J.; Didier, M.; Stojadinović, B. Quantifying Disaster Resilience of a Community with Interdependent Civil Infrastructure Systems. Struct. Infrastruct. Eng. 2023, 19, 1696–1710. [Google Scholar] [CrossRef]
  39. Austroads. Guide to Road Safety Part 2: Safe Roads; Austroads: Sydney, Australia, 2024; ISBN 978-1-922994-30-1. Available online: https://austroads.gov.au/publications/road-safety/agrs02 (accessed on 1 July 2025).
  40. Transfund New Zealand. Road Safety Audit Policy and Procedures (Transfund General Circular No. 04/05); Transfund New Zealand: Wellington, New Zealand, 2004. Available online: https://nzta.govt.nz/assets/resources/general-circulars/docs/04-05.pdf (accessed on 1 July 2025).
  41. Federal Highway Administration (FHWA). FHWA Road Safety Audit Guidelines; U.S. Department of Transportation: Washington, DC, USA, 2006. Available online: https://highways.dot.gov/safety/data-analysis-tools/rsa/fhwa-road-safety-audit-guidelines (accessed on 1 July 2025).
  42. Blincoe, L.J.; Miller, T.R.; Zaloshnja, E.; Lawrence, B. The Economic and Societal Impact of Motor Vehicle Crashes, 2010 (Revised); Report No. DOT HS 812 013; National Highway Traffic Safety Administration, U.S. Department of Transportation: Washington, DC, USA, 2015. Available online: https://crashstats.nhtsa.dot.gov/Api/Public/ViewPublication/812013 (accessed on 1 July 2025).
  43. Heo, B.-Y.; Heo, W.-H. Economic Analysis of Disaster Management Investment Effectiveness in Korea. Sustainability 2019, 11, 3011. [Google Scholar] [CrossRef]
  44. Wang, W.; Choi, C.; Kim, D.; Yoo, Y.; Seo, Y.-S.; Kim, H.S. Economic Analysis and Evaluation of Disaster Risk Reduction Projects in Consideration of Indirect Benefits. J. Korean Soc. Hazard Mitig. 2019, 19, 63–73. [Google Scholar] [CrossRef]
  45. Mechler, R. Reviewing Estimates of the Economic Efficiency of Disaster Risk Management: Opportunities and Limitations of Using Risk-Based Cost–Benefit Analysis. Nat Hazards 2016, 81, 2121–2147. [Google Scholar] [CrossRef]
  46. World Bank. Investment in Disaster Risk Management in Europe Makes Economic Sense; World Bank: Washington, DC, USA, 2021; Available online: https://openknowledge.worldbank.org/entities/publication/d400969b-4ea5-53fd-8393-bee57a18b69c (accessed on 1 July 2025).
  47. Wu, P.; Liu, J.; Zhou, L.; Chen, H. An Integrated Group Decision-Making Method with Hesitant Qualitative Information Based on DEA Cross-Efficiency and Priority Aggregation for Evaluating Factors Affecting a Resilient City. Group Decis. Negot. 2022, 31, 293–316. [Google Scholar] [CrossRef]
Figure 1. Number of diagnostic criteria classified by category. The figure summarizes the total count of assessment items across six groups: Common, Snow and Ice, Storm and Flood, Tunnel Fire Safety, Traffic Safety, and Other. The Storm and Flood category contains the largest number of criteria, reflecting its diverse and complex risk factors.
Buildings 15 02545 g001
Figure 2. Flowchart of the proposed Disaster Risk Reduction Audit (DRRA) framework for resilient highway infrastructure. The process consists of sequential stages, beginning with project planning and preliminary design review, followed by DRRA Stage 1 (hazard-specific checklist screening) across six major risk domains: Common, Snow/Ice, Flood/Storm, Tunnel Fire, Traffic, and Others. Each domain yields diagnostic outputs used in DRRA Stage 2, where functional and safety audits produce composite risk scores and scenario-based budget simulations. Color-coded boxes indicate process categories: white (general process), green (hazard domains), gray (diagnostic outputs), and orange (design feedback and decision-making). Arrows denote directional flow and logical dependencies.
Buildings 15 02545 g002
Figure 3. Comparison of accident rates between DRRA and non–DRRA projects from 2017 to 2019.
Buildings 15 02545 g003
Table 1. Summary of diagnostic criteria for Disaster Risk Reduction Audit in highway infrastructure.
CategoryDiagnostic Criteria
Common- Adequacy of facilities for emergency vehicle access and turnaround
- Access control facilities for tunnels and underpasses
- Staging areas for emergency response vehicles
Snow and Ice- Identification of freezing and snow-prone sections and appropriateness of safety facilities
- Suitability of brine spray systems (location, scale, function)
- Road facility design considering bridge maintenance and snow removal in shaded areas
- Accessibility and adequacy of snowplow routes and de-icing storage
- Adequacy of emergency turnaround facilities for snow-induced congestion and isolation
- Need for additional anti-icing pavement and brine spray systems in high-risk zones
Storm and Flood- Adequacy of debris flow mitigation facilities
- Effectiveness of slope monitoring and warning systems
- Availability and design of slope inspection walkways and stairs
- Need for slope debris removal workspaces
- Appropriateness of anchorage water pressure plate treatment
- Overflow barriers near irregular upper slope surfaces
- Appropriateness of rockfall protection (location, method, design)
- Suitability of slope protection methods considering maintenance
- Countermeasures for subsurface drainage in depressed areas
- Response to surface water films during heavy rainfall
- Adequacy of underpass flood warning and information systems
- Drainage design in vertical/horizontal transition zones on bridges
- Anti-skid facilities at tunnel entrances and exits
- Drainage installation at tunnel ends in valley areas
- Drainage systems on retaining wall tops and sides
- Wind protection measures in high-wind areas (e.g., windbreak walls)
Tunnel Fire Safety- Appropriateness of tunnel fire protection systems (fire suppression, alarms, evacuation, emergency power)
- Fire resistance of underpasses and tunnels
- Deployment of emergency equipment inside/outside tunnels and underpasses, with consideration for vulnerable users
- Accessibility for firefighting and emergency vehicles
- Adequacy of tunnel disaster response inventory
- Necessity of joint emergency drills with related agencies
- Implementation of emergency access block systems in soundproof tunnels
- Appropriateness of installation standards for tunnel-grade-specific safety systems
Traffic Safety- Adequacy of traffic safety facilities (location, size, function)
- Safety measures for close-proximity areas (underpasses to ICs or junctions)
- Shoulder width suitability for emergency access and inspections
- Facilities to prevent vehicle rollover (e.g., barriers)
- Marking and signage to prevent wrong-way driving at U-turn zones near toll gates
- Countermeasures against large vehicle collisions on bridges
- Guardrail adequacy at high-speed exit ramps
- Glare reduction measures at tight curves
Other- Suitability of automated gate systems for emergency entry/exit points
- Automation of U-turn controls at ICs and junctions
- Debris fall protection on urban bridges
- Appropriateness of bridge evacuation spaces to prevent secondary accidents
- Fire Risk Reduction measures under urban bridges
Table 2. Annual number of DRRA cases and representative audited expressway sections (2016–2020).
CategoryTotal20162017201820192020
Total23 sections4 sections6 sections2 sections5 sections6 sections
(703.7 km)(216.5 km)(204.8 km)(74.3 km)(148.2 km)(59.9 km)
Design Phase6 sections2 sections1 section3 sections
(217.4 km)(105.4 km)(19.3 km)(92.7 km)
Construction Phase17 sections4 sections4 sections1 section2 sections6 sections
(486.3 km)(216.5 km)(99.4 km)(55.0 km)(55.5 km)(59.9 km)
Table 3. Annual breakdown of DRRA-audited expressway segments and total inspected highway length by project phase (2016–2020).
CategoryTotalDesign PhaseConstruction Phase
Total Audits393 cases86 cases307 cases
201666 cases-66 cases
2017127 cases31 cases96 cases
201828 cases16 cases12 cases
201973 cases39 cases34 cases
202099 cases-99 cases
Table 4. Estimated labor input coefficients (person·days/km) for each DRRA diagnostic category during the design phase, reflecting hazard-specific workload intensity and assessment complexity.
CategoryDesign PhaseConstruction Phase 1
Common Facilities0.620.22
Storm and Flood1.510.75
Snow and Ice1.430.71
Tunnel Safety0.970.42
Traffic Safety0.650.39
Audit Report Preparation2.171.16
Total7.353.65
Table 5. Weighting factors by hazard type and DRRA project phase.
No.CategoryDesign PhaseConstruction Phase 1 and 2
1GeneralLow (0.5)Medium (0.7)
2FloodHigh (1.0)High (1.0)
3Snow/IceHigh (1.0)High (1.0)
4TunnelMedium (0.7)Medium (0.7)
5Traffic SafetyLow (0.5)Low (0.5)
6Audit Report PreparationLow (0.5)Low (0.5)
Table 6. Estimated DRRA labor input (person/km) by hazard type and project phase.
Hazard CategoryDesign PhaseConstruction Phase 1Construction Phase 2
Common Facilities0.62 × 0.5 × 0.5 = 0.160.22 × 0.7 = 0.150.15 × 0.8 = 0.12
Flood (Stormwater, Drainage)1.51 × 0.5 × 0.5 = 0.380.75 × 1.0 = 0.750.75 × 0.8 = 0.6
Snow/Ice (De-Icing, Slope)1.43 × 0.5 × 0.5 = 0.360.71 × 1.0 = 0.710.71 × 0.8 = 0.57
Tunnel (Fire Safety, Visibility)0.97 × 0.5 × 0.5 = 0.240.42 × 0.7 = 0.290.29 × 0.8 = 0.23
Traffic Infrastructure0.65 × 0.5 × 0.5 = 0.160.39 × 0.5 = 0.20.20 × 0.8 = 0.16
Audit Report Preparation2.17 × 0.5 × 0.5 = 0.541.16 × 0.5 = 0.580.58 × 0.8 = 0.46
Total1.842.682.14
Table 7. Summary of economic benefits associated with DRRA implementation, including accident-related savings, macroeconomic loss reduction, and international benefit–cost comparisons.
CategorySupporting DataEstimated Economic Benefit
Accident Rate ReductionUSD 1.6 million per accident (NHTSA, FHWA, SafeHome Alabama, AP News)44.1% reduction over 100 cases → approx. USD 70 million saved
National-Level Loss (Korea)1.3% of GDP (USD 1.4 trillion, OECD 2023)USD 18.2 billion annual loss USD 5.5–7.3 billion savings
Policy Cost–Benefit RatioBCR of 10 –18 (Australia’s Black Spot Program)USD 10–18 return per USD 1 invested
Table 8. Comparison of disaster occurrences on DRRA and non-DRRA segments along the same expressway route.
SectionTotal201720182019Remarks
Cheongwon–Sangju21 cases6 cases6 cases7 casesDRRA not implemented
Sangju–Yeongdeok2 cases2 casesDRRA implemented
Table 9. Comparison of disaster occurrences by DRRA implementation status on expressways with similar traffic volumes.
Year (AADT)Seoul–Yangyang Expressway (DRRA Implemented in 2016)Jungbu Expressway (DRRA Not Implemented)
20174 cases (36,000 vehicles/day)11 cases (38,000 vehicles/day)
20184 cases (37,000 vehicles/day)13 cases (39,000 vehicles/day)
20197 cases (41,000 vehicles/day)19 cases (41,000 vehicles/day)
Disclaimer/Publisher’s Note: The statements, opinions and data contained in all publications are solely those of the individual author(s) and contributor(s) and not of MDPI and/or the editor(s). MDPI and/or the editor(s) disclaim responsibility for any injury to people or property resulting from any ideas, methods, instructions or products referred to in the content.

