Article

Durability and Microstructure Analysis of Loess-Based Composite Coal Gangue Porous Vegetation Concrete

1
School of Civil Engineering and Water Resources, Qinghai University, Xining 810016, China
2
School of Civil Engineering, Lanzhou University of Technology, Lanzhou 730050, China
3
School of Civil Engineering, Lanzhou Institute of Technology, Lanzhou 730050, China
*
Authors to whom correspondence should be addressed.
Buildings 2025, 15(14), 2531; https://doi.org/10.3390/buildings15142531
Submission received: 12 June 2025 / Revised: 8 July 2025 / Accepted: 15 July 2025 / Published: 18 July 2025
(This article belongs to the Special Issue Soil–Structure Interactions for Civil Infrastructure)

Abstract

In order to improve the durability of loess-based composite coal gangue porous planting concrete (LCPC), the effects of fly ash and slag powder content on the durability and microstructure of LCPC were studied. In this paper, fly ash and slag powder were mixed into LCPC, and freeze-thaw cycle and dry-wet cycle tests were carried out. The compressive strength, dynamic elastic modulus, and mass change were used as evaluation indices to determine the optimal mix ratio for LCPC durability. Scanning electron microscopy (SEM) was performed, and the experimental design was carried out with the water–cement ratio, fly ash, and slag powder content as variables. The microstructure characteristics of LCPC were analyzed. The results show that the maximum number of freeze-thaw cycles can reach 35 times and the maximum number of dry-wet cycles can reach 50 when 5% fly ash and 20% slag powder are used. With an increase in the water-cement ratio, the skeleton of the loess gradually became complete, and its structure became more compact. In the micro-morphology diagram, the mixed fly ash and slag powder particles are not obvious, but with an increase in dosage, the size of the cracks and pores gradually decreases. The incorporation of fly ash and slag powder can play a positive role in the durability of LCPC and improvement of its microstructure. The results of this study are crucial for improving the application performance of ecological restoration, soil improvement, and long-term stability of structures, and can provide a scientific basis for the sustainable development of environmentally friendly building materials.

1. Introduction

Due to its unique geological structure and climatic conditions, the Loess Plateau in Northwest China is fragile and vulnerable to wind and water erosion [1,2], causing serious soil degradation problems that pose great challenges to ecological environment management and engineering construction. As an important economic resource zone in China, the northwest region has been increasing the amount of solid waste against the background of accelerating industrialization, and resource treatment is particularly important [3].
As a new type of building material, porous vegetation concrete has been widely studied for its excellent water permeability and ecological adaptability [4,5,6]. Porous vegetation concrete is a new type of green building material [7,8] that combines the structural characteristics of traditional concrete with ecological plant function. Traditional porous vegetation concrete mainly uses cement as the cementing material, which not only leads to high costs, but also produces a lot of carbon dioxide in the cement production process, which is contrary to the “carbon peaking and carbon neutrality” goals. The main component of cement is calcium hydroxide ( C a O H 2 ), which releases a large amount of alkaline substances during the hydration process, resulting in a high alkaline environment. Plant roots may be inhibited if they are exposed to this highly alkaline environment for a long time, resulting in root growth retardation and even root [9,10,11], which adversely affect the growth of plants. Therefore, based on the actual situation in northwest China, a new type of porous vegetation concrete material was developed using local materials, Yellow River Basin loess as the cementing material, and solid waste coal gangue as the coarse aggregate. The new material will be applied to the ecological protection of the shallow loess slope, on the one hand to play the role of slope engineering protection, on the other hand to improve the utilization rate of solid waste, in order to achieve the goal of ecological restoration. Since the adhesive strength of loess is relatively low, it is necessary to further improve the performance of porous vegetation concrete for better application in ecological slope restoration. Several researchers have conducted in-depth research on the solidification technology of loess and have adopted cement as the binder to solidify loess. However, the use of cement releases many substances, such as carbon dioxide and dust, which are contrary to the strategy of sustainable development [12]. Yang et al. [13] used fly ash as a curing agent and found that showed a good effect during the curing process, while significantly improving the compressive strength and dry shrinkage resistance of soil. Singhi et al. [14] combined fly ash and slag powder to solidify the subgrade soil and studied the physical and mechanical properties and durability. In addition, the method of combining different alkali activators and slag powder for curing soil was discussed [15,16], and it was found that this method had a superior effect compared with traditional cement curing and would not lead to expansion failure [17]. The performance and stability [18,19] of collapsible loess can be effectively improved by treating it with lime. Another common loess reinforcement method is microbial reinforcement, with the most representative type being microbially induced calcite precipitation (MICIP) [20,21], which can effectively improve the physical and mechanical properties of loess [22,23,24]. There have also been relevant research results on the analysis of microstructure after microbiological solidification [25,26].
Based on the above research, fly ash and slag powder, as industrial by-products, have excellent activity and stability and can effectively improve the mechanical properties and durability of concrete [27]. This research will use fly ash and slag powder to analyze the durability and microstructure of LCPC in order to determine the appropriate mix ratio, promote the application of solid waste, and achieve harmonious development of the regional economy and ecological environment.

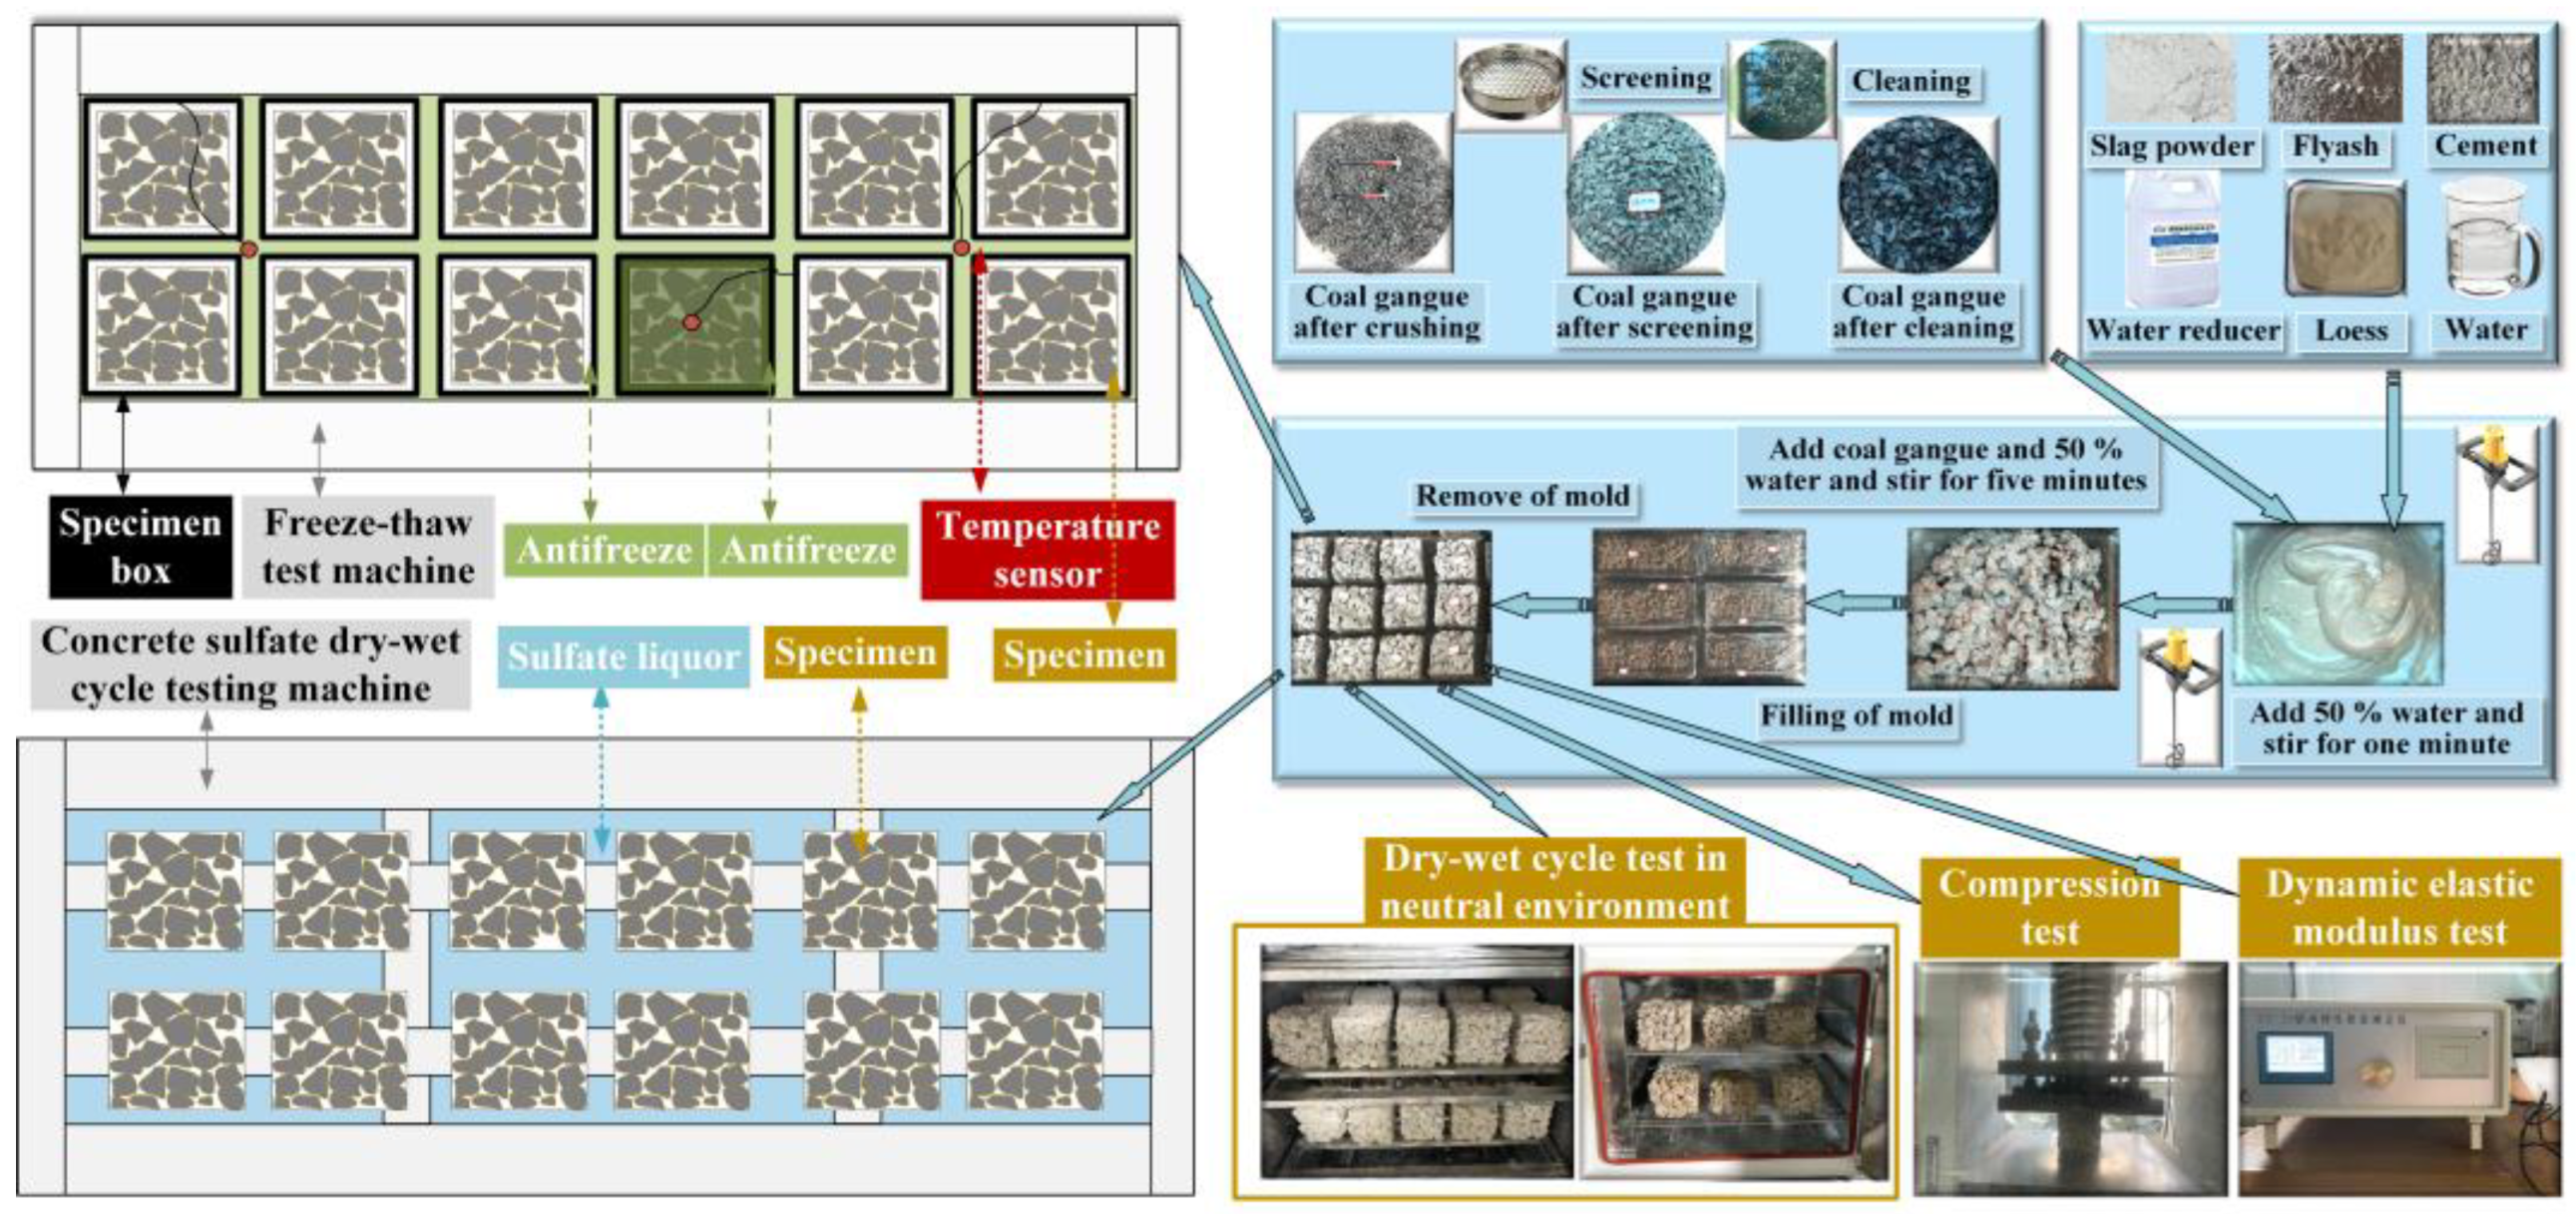
2. Experimental Materials and Methods

2.1. Raw Materials

Test materials included coal gangue, loess, cement, water-reducing agent, fly ash, slag powder, and mixing water. The cement used was P.O42.5 ordinary Portland cement of the Qilian Mountain brand, and its chemical composition is shown in Table 1. The coal gangue was obtained from a coal mine in Baiyin City, Gansu Province, and the particle size was 15~25 mm after artificial crushing and sieving. Class F quasi-I grade fly ash and quasi-S95 grade slag powder were used, which were produced by a company in Gansu Province, China. The chemical compositions of the fly ash and slag powder are listed in Table 2 and Table 3, respectively. The loess was local common plain loess from Lanzhou City, China, and its chemical composition is listed in Table 4. The superplasticizer was a polycarboxylic acid superplasticizer, and the mixing water was tap water from Lanzhou City. A schematic of the test process is shown in Figure 1.

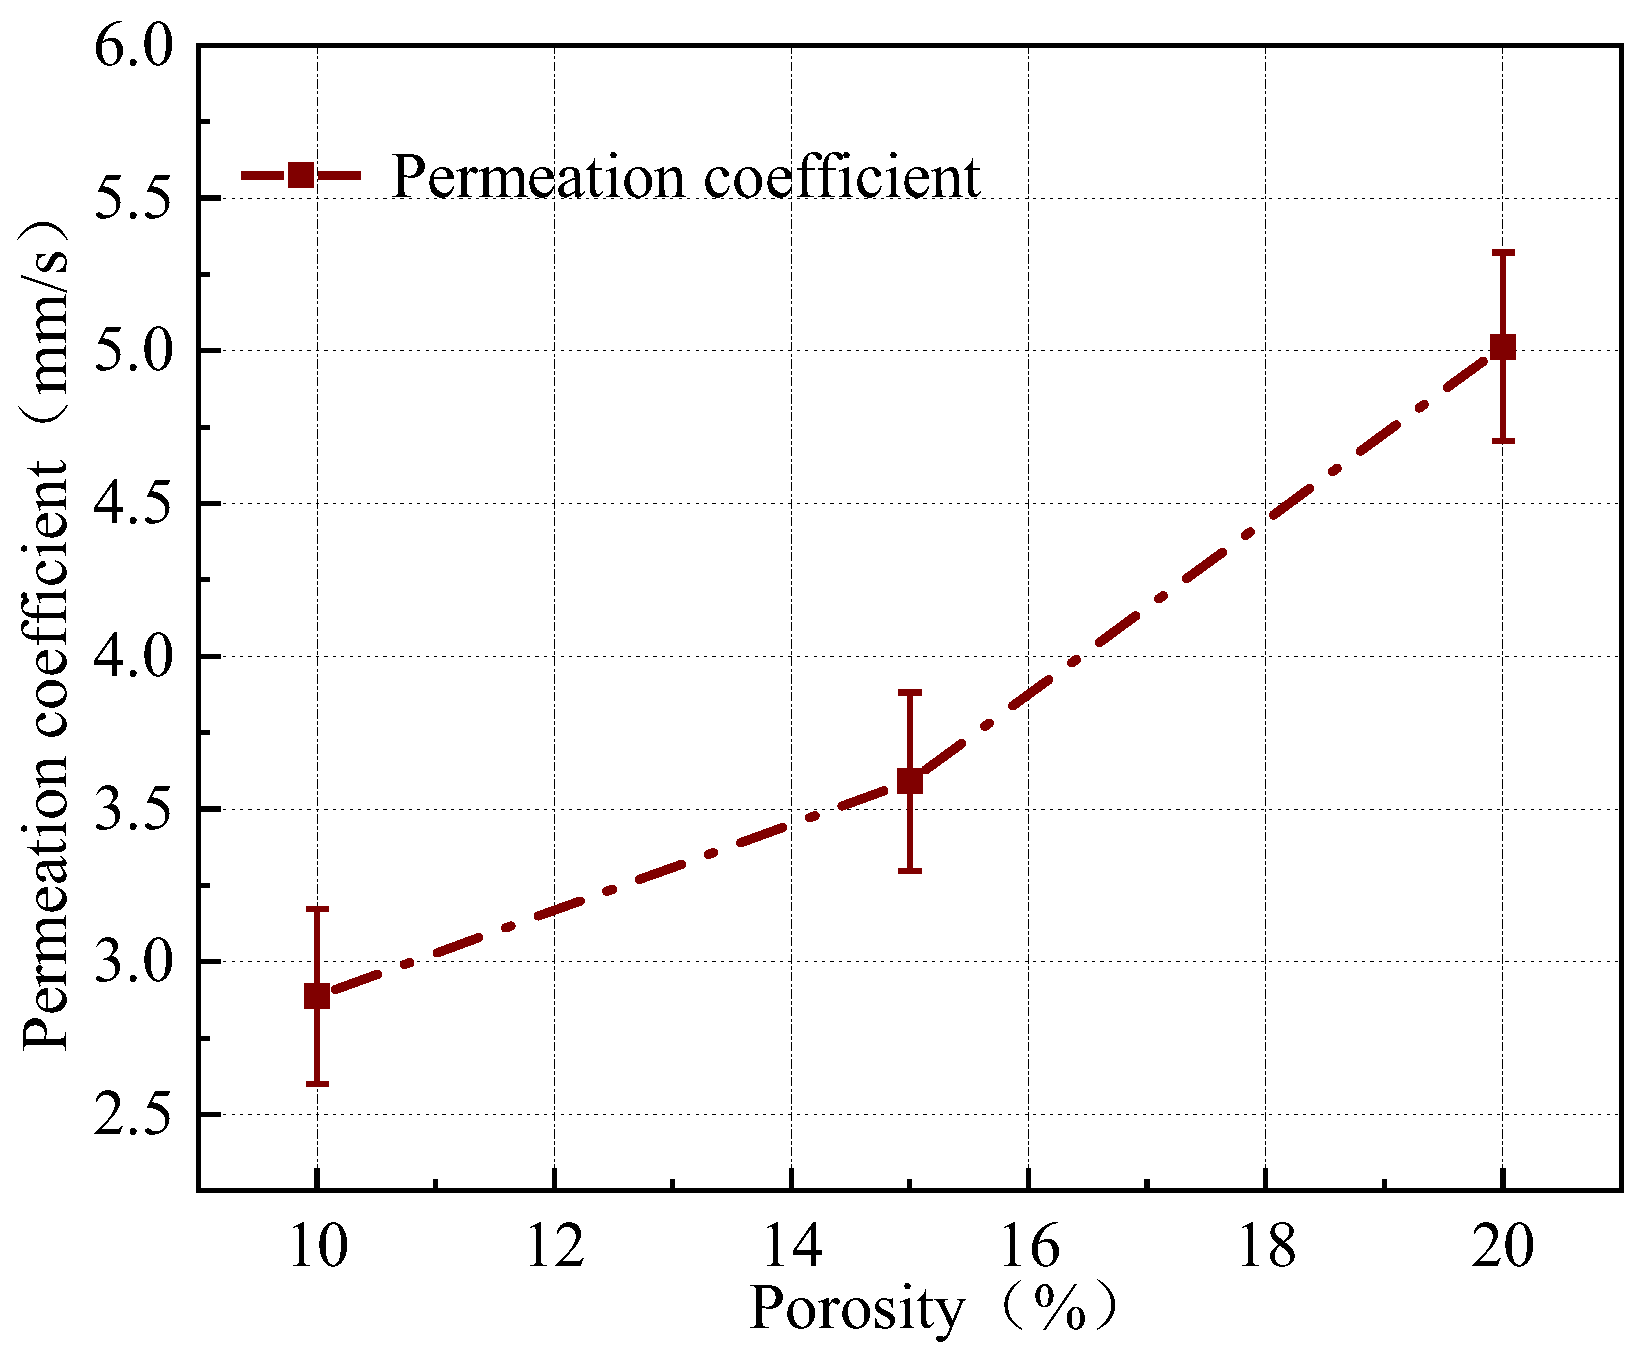
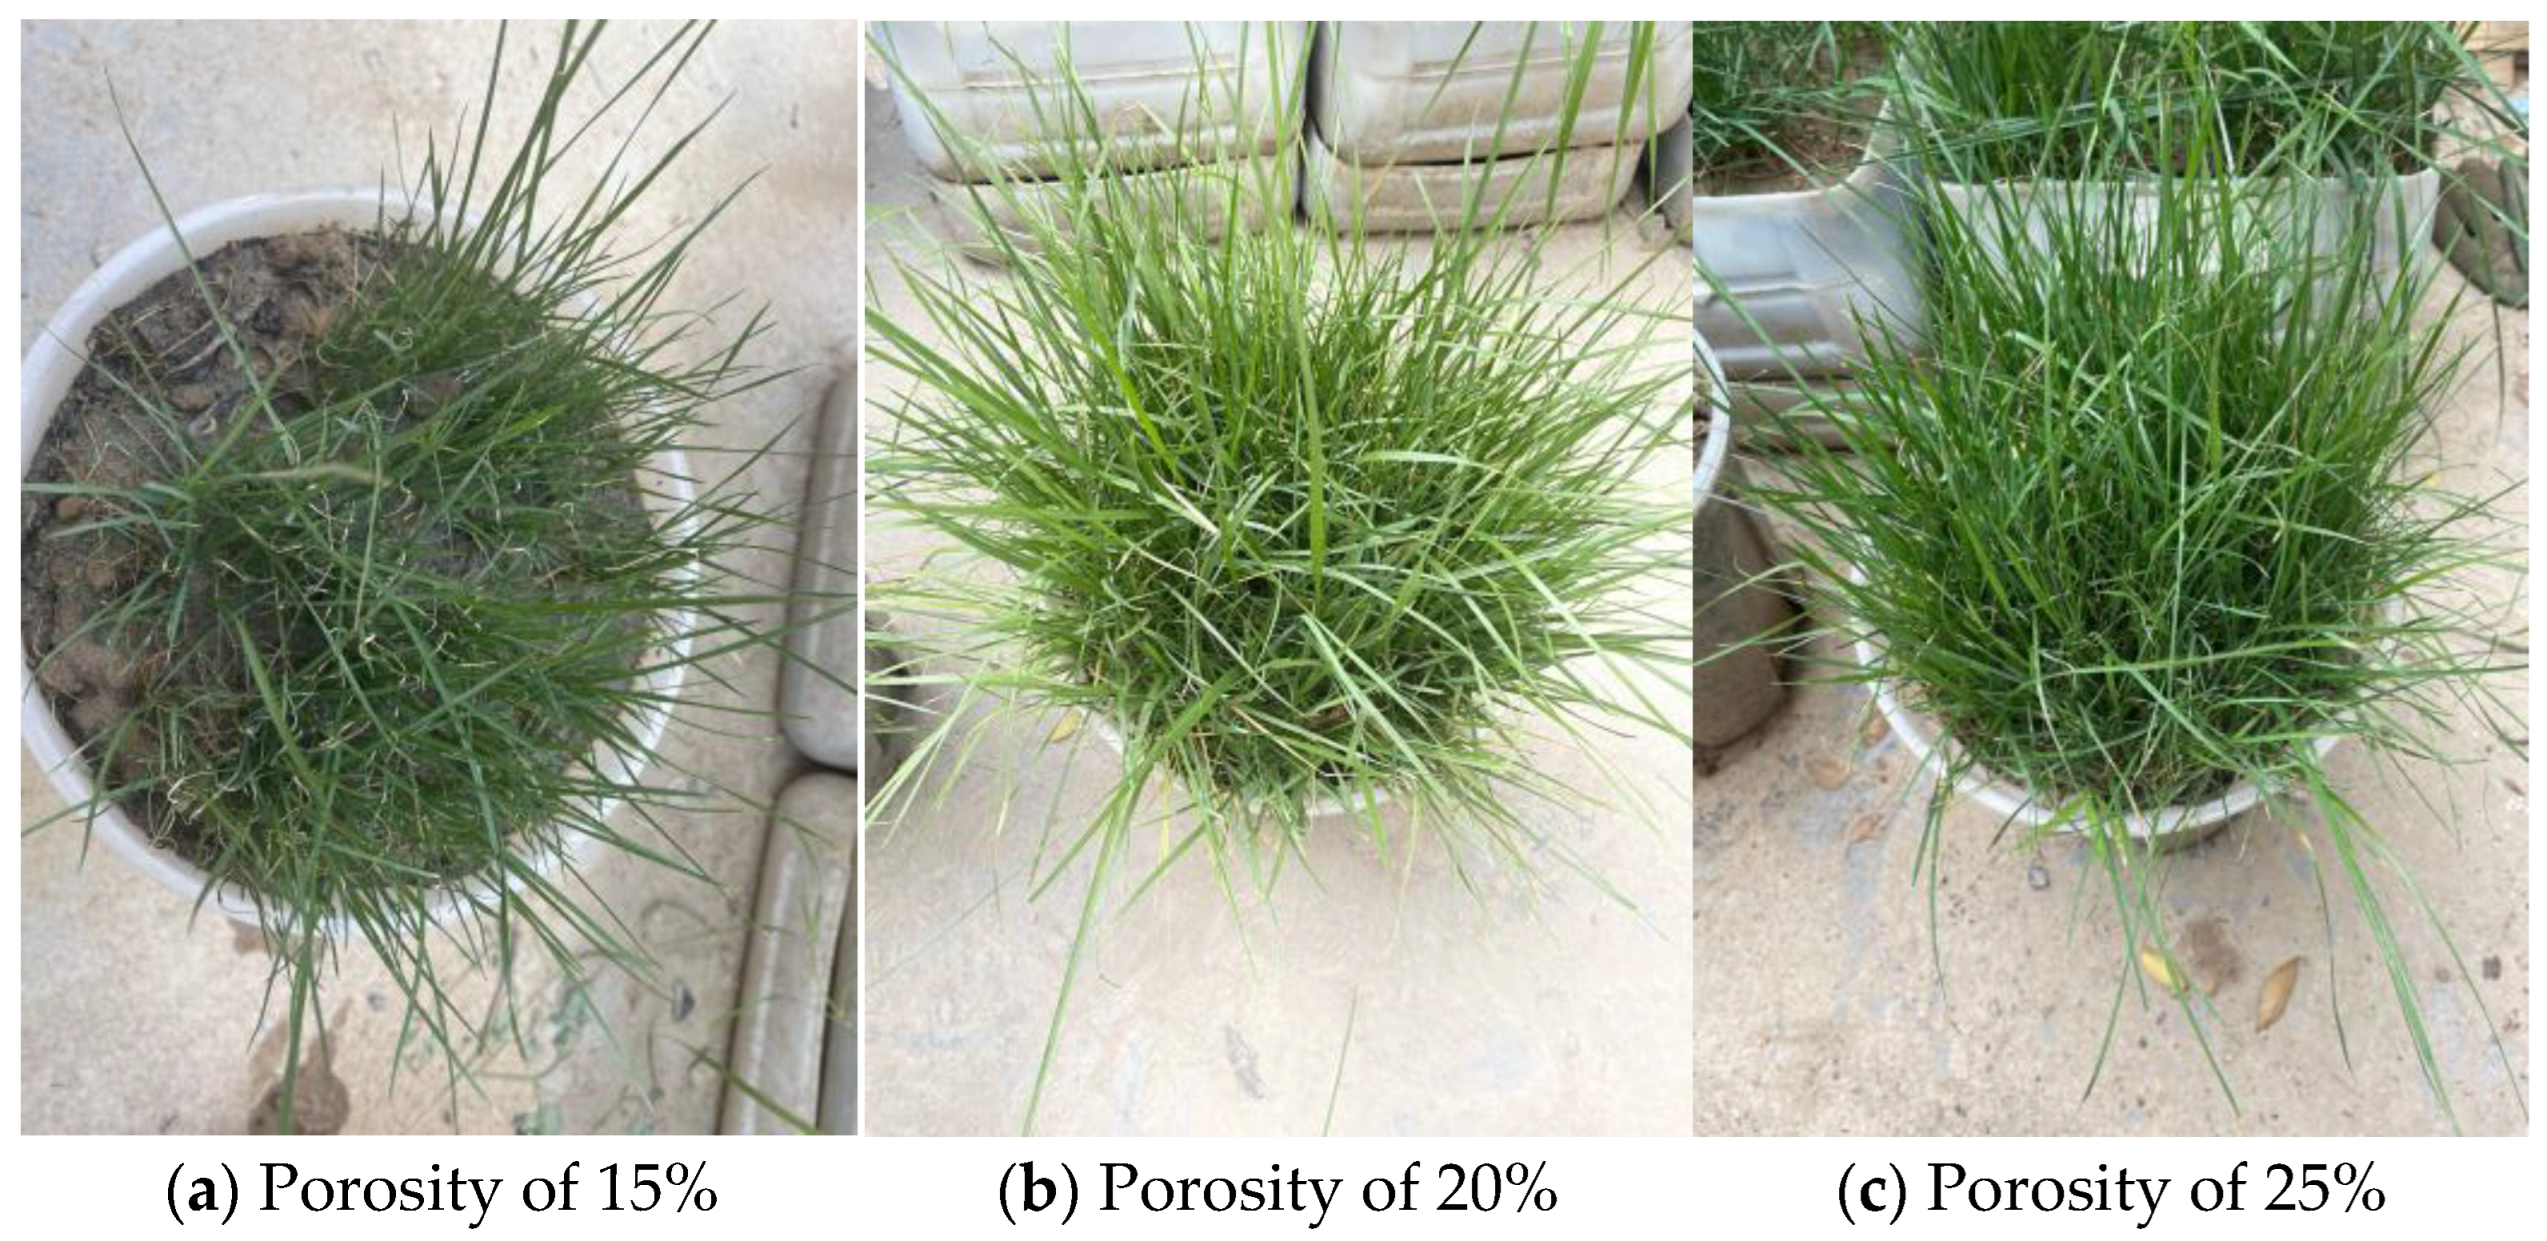
2.2. Permeability Coefficient and Planting Test

The permeability coefficient is an important index for determining the performance of porous plant-growing concrete and is a key factor for evaluating the permeability of porous plant-growing concrete. The permeability coefficient is generally measured using two methods: the constant head method and the variable head method. In this paper, a simple permeability coefficient test device was developed according to the actual situation, as shown in Figure 2. The device is composed of a transparent cube water storage device, a permeable sieve, and a water storage barrel. The formula for calculating the permeability coefficient is as follows (1):
K = L H × Q A t
L: the thickness of the specimen (mm); A: the upper surface area of the specimen (mm2); H: the water level difference between the water surface and the upper surface of the specimen (mm); Q: water (mL) flowing through the specimen in t seconds.
In order to analyze the effect of different porosities on the permeability coefficient of LCPC, we set up three groups of different porosity test groups, as shown in Table 5. In order to ensure that the developed LCPC can support plant growth and achieve the desired environmental effects in practical applications, verify whether the material can effectively support plant growth, maintain ecological balance, improve the environment, and maintain its performance in long-term use, and provide a basis for subsequent material optimization and design, we conducted a plant growth test. The specific water permeability and plant growth test groups are listed in Table 5.

2.3. Freezing−Thawing Cycle Test

In a preliminary study, the target porosity of LCPC was determined as 25%, the water−cement ratio as 0.42, cement content as 15%, water reducer content as 2.0%, fly ash content as 5–15%, and slag powder content as 10–20%. The influence of fly ash and slag powder on the durability and microstructure of LCPC was analyzed. The test groups of durability performance are shown in Table 6.
According to the specifications, a rapid freezing-thawing cycle test was conducted (GB/T 50082-2009) [28]. The sample size was a rectangular test block of 100 mm × 100 mm × 100 mm, and three parallel samples were set for each group of test blocks. Before the test, the initial mass of each test block was weighed, and the initial value of the transverse fundamental frequency was measured. The test block for 28d was soaked in clean water at (20 ± 2) °C until the test block reached the state of water saturation. The test block was put into the specimen box, and a freezing-thawing cycle test was carried out using the dry freezing method (considering the actual situation in northwest China). After every 5 cycles (LCPC uses loess as the cementation material, and the performance of the test block changes obviously with the increase of the number of cycles), the test block was removed from the specimen box, and the surface scum was wiped. The compressive strength, mass and dynamic elastic modulus of the test block were tested.
The formula for calculating the mass loss rate is as follows:
Δ W n i = W 0 i W n i W 0 i × 100
Δ W n Mass loss rate of the first concrete specimen after N freezing-thawing cycles (%);
W 0 i Mass of the first concrete specimen before freezing-thawing cycles (g);
W n i Mass of the first concrete specimen after N freezing-thawing cycles (g).
The relative dynamic elastic modulus is calculated as follows:
P i = f n i 2 f 0 i 2 × 100
P i the relative dynamic elastic modulus of the first concrete specimen after N freezing-thawing cycles, accurate to 0.1;
f n i transverse fundamental frequency of the first concrete specimen after N freezing-thawing cycles;
f 0 i initial value of transverse fundamental frequency of the first concrete specimen before freezing-thawing cycles.

2.4. Wetting-Drying Cycle Test

According to the specifications, a rapid wetting-drying cycle test was conducted (GB/T 50082-2009) [28]. Rectangular test blocks with dimensions of 100 mm × 100 mm × 100 mm were prepared, with three parallel specimens in each set of test blocks. The samples cured for 26 days were removed from the curing box and dried in a drying box at (80 ± 5) °C for 48 h. After drying, the sample was removed and cooled to room temperature, and the it was added to the dry and wet cycling box containing 5% sulfate solution for testing. After every five cycles, the mass and compressive strength of the sample were tested. Since the main component of LCPC is loess, there is a certain gap in performance compared with porous vegetation concrete that uses cement as the cementing material. In order to facilitate timely observation of the change in the sample, the mass and compressive strength of the sample were tested after every five wetting-drying cycles.
The erosion coefficient of compressive strength was calculated using the following formula:
K f = f c n f c o × 100
f c n The measured value of compressive strength (MPa) of a group of concrete specimens corroded by sulfate after N wetting-drying cycles;
f c 0 Compared with the group of standard curing at the same age of the sulfate corroded specimens, the compressive strength of the concrete specimens was measured (MPa).

2.5. Scanning Electron Microscope Test

An SEM is a high-resolution microscope that uses a beam of electrons rather than photons to illuminate the surface of a sample and produce a detailed image of the surface [29]. SEM has high magnification and surface resolution and is suitable for the observation and analysis of the microstructure of materials, biological tissues, and other samples. Densification inside the gelled material, different forms of hydration products, types of admixtures, and bonding conditions at the interface of aggregates can be observed using scanning electron microscopy.
LCPC test blocks with different water–cement ratios, fly ash contents, and slag powder contents were prepared. A 1 cm3 sample was cut from the center of the test block and pasted on the edge for gold spraying treatment. After treatment, the samples were placed under a scanning electron microscope for observation. The experimental groups are shown in Table 7.

3. Results and Discussion

3.1. Analysis of Permeability Coefficient and Planting Test Results

The permeability coefficient of the LCPC under different porosities is shown in Figure 2. As shown in Figure 2, with an increase in porosity, the permeability coefficient increases gradually. An increase in porosity means that the pore structure inside the concrete is denser, which increases the flow path of water molecules and improves permeability. At the same time, the increase in porosity means that the connectivity inside the pores is also enhanced, and the water molecules flow more easily in the pores. Therefore, there is a good correlation between the permeability coefficient and the porosity. As shown in Figure 2, the permeability coefficient of porous concrete is greater than 2.8. It meets the requirement that the permeability coefficient is greater than 0.5 mm/s in the specification ‘Technical specification for application of recycled aggregate concrete’ [30].
Figure 3 shows the effect of the LCPC planting test at different porosities after 48 days. Figure 3 shows the planting status with porosities of 15% (Figure 3a), 20% (Figure 3b), and 25% (Figure 3c). According to the results shown in Figure 3, it can be seen that these three porosities can provide a growing environment for plants. However, the growth status of the plants in Figure 3a was significantly inferior to that of the other two groups; the plants in Figure 3c grew better and denser. These results suggest that the developed LCPC porous vegetation concrete can effectively support plant growth and has certain ecological applicability. When the porosity is 25%, it can provide sufficient growth space for plants.

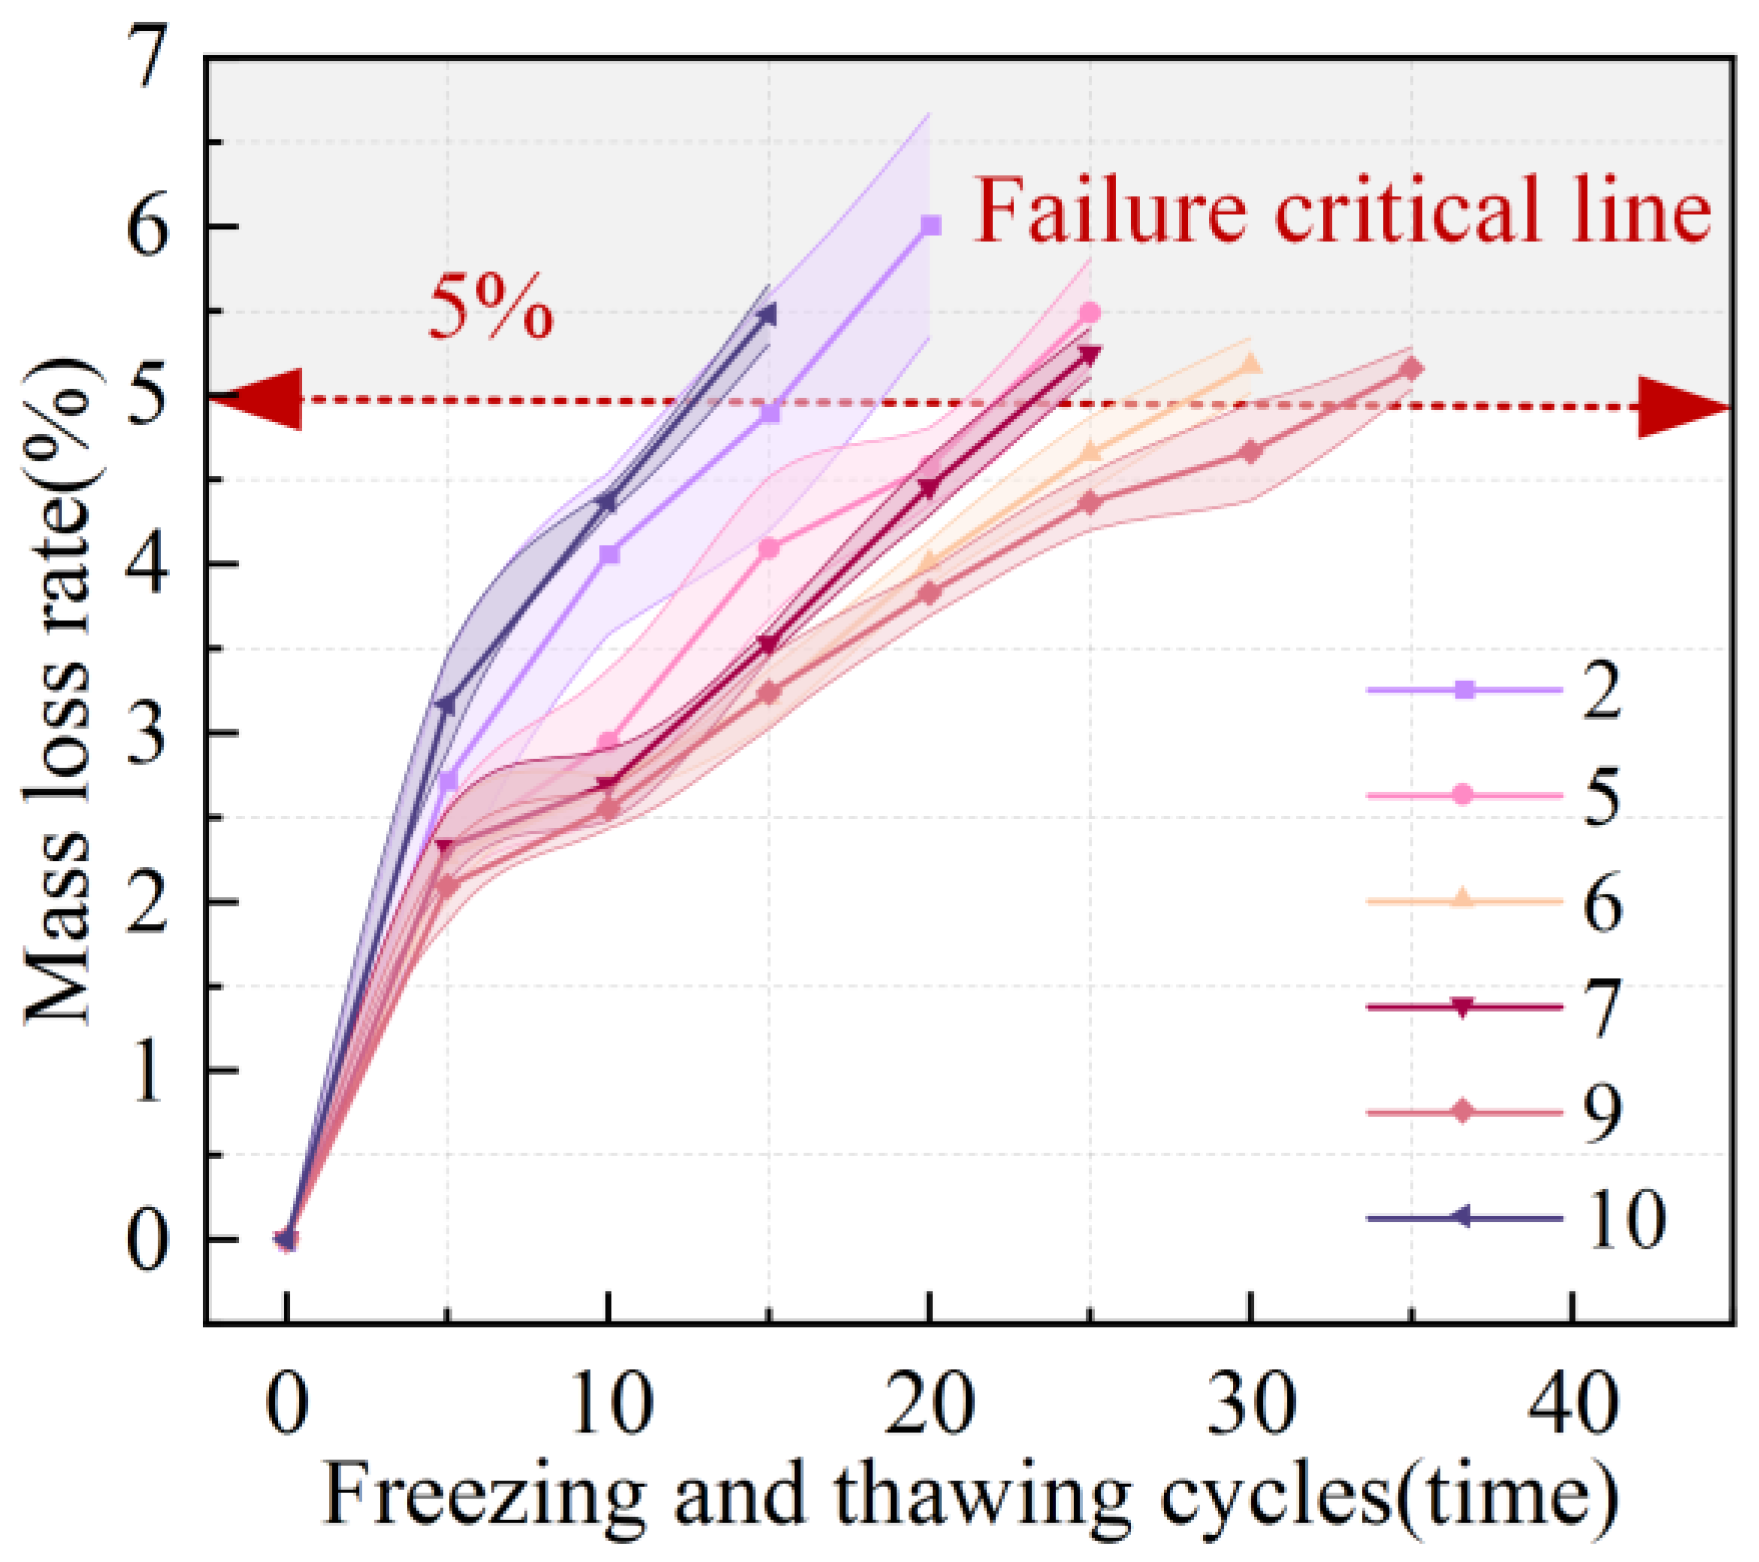
3.2. Analysis of Freezing-Thawing Cycle Test Results

3.2.1. Mass Loss

The LCPC mass change curve under the action of freezing and thawing cycles is shown in Figure 4. When the number of freeze−thaw cycles was between 15 and 40, the mass loss rate of each group reached 5%. (Since loess was used as the gelling material, and solid waste was used as the coarse aggregate. This material aims to improve the utilization rate of solid waste and develop an eco-friendly material by using loess in the Yellow River Basin of China as the research object.) The material strength, frost resistance, and other properties are not too high requirements. Ten experimental groups were set up to conduct preliminary screening of the test results, and six representative groups were selected for analysis. As shown in Figure 4, when the contents of fly ash and slag powder were 0%, the mass loss rate of LCPC was the largest and reached the critical damage value after 15 freeze–thaw cycles. When the fly ash and slag powder contents were 15% and 20%, the LCPC exhibited the best frost resistance, reaching the critical damage value after 35 freeze-thaw cycles, and the frost resistance was improved by 133.33%. The results show that the addition of fly ash and slag powder significantly improved the frost resistance of LCPC, and with an increase in the fly ash and slag powder contents, the frost resistance of LCPC continuously improved. Fly ash and slag powder play a positive role in improving the cohesiveness and compactness of LCPC cementing material, resulting in a decrease in the quality loss rate after freeze-thaw cycles compared with that without adding admixtures.

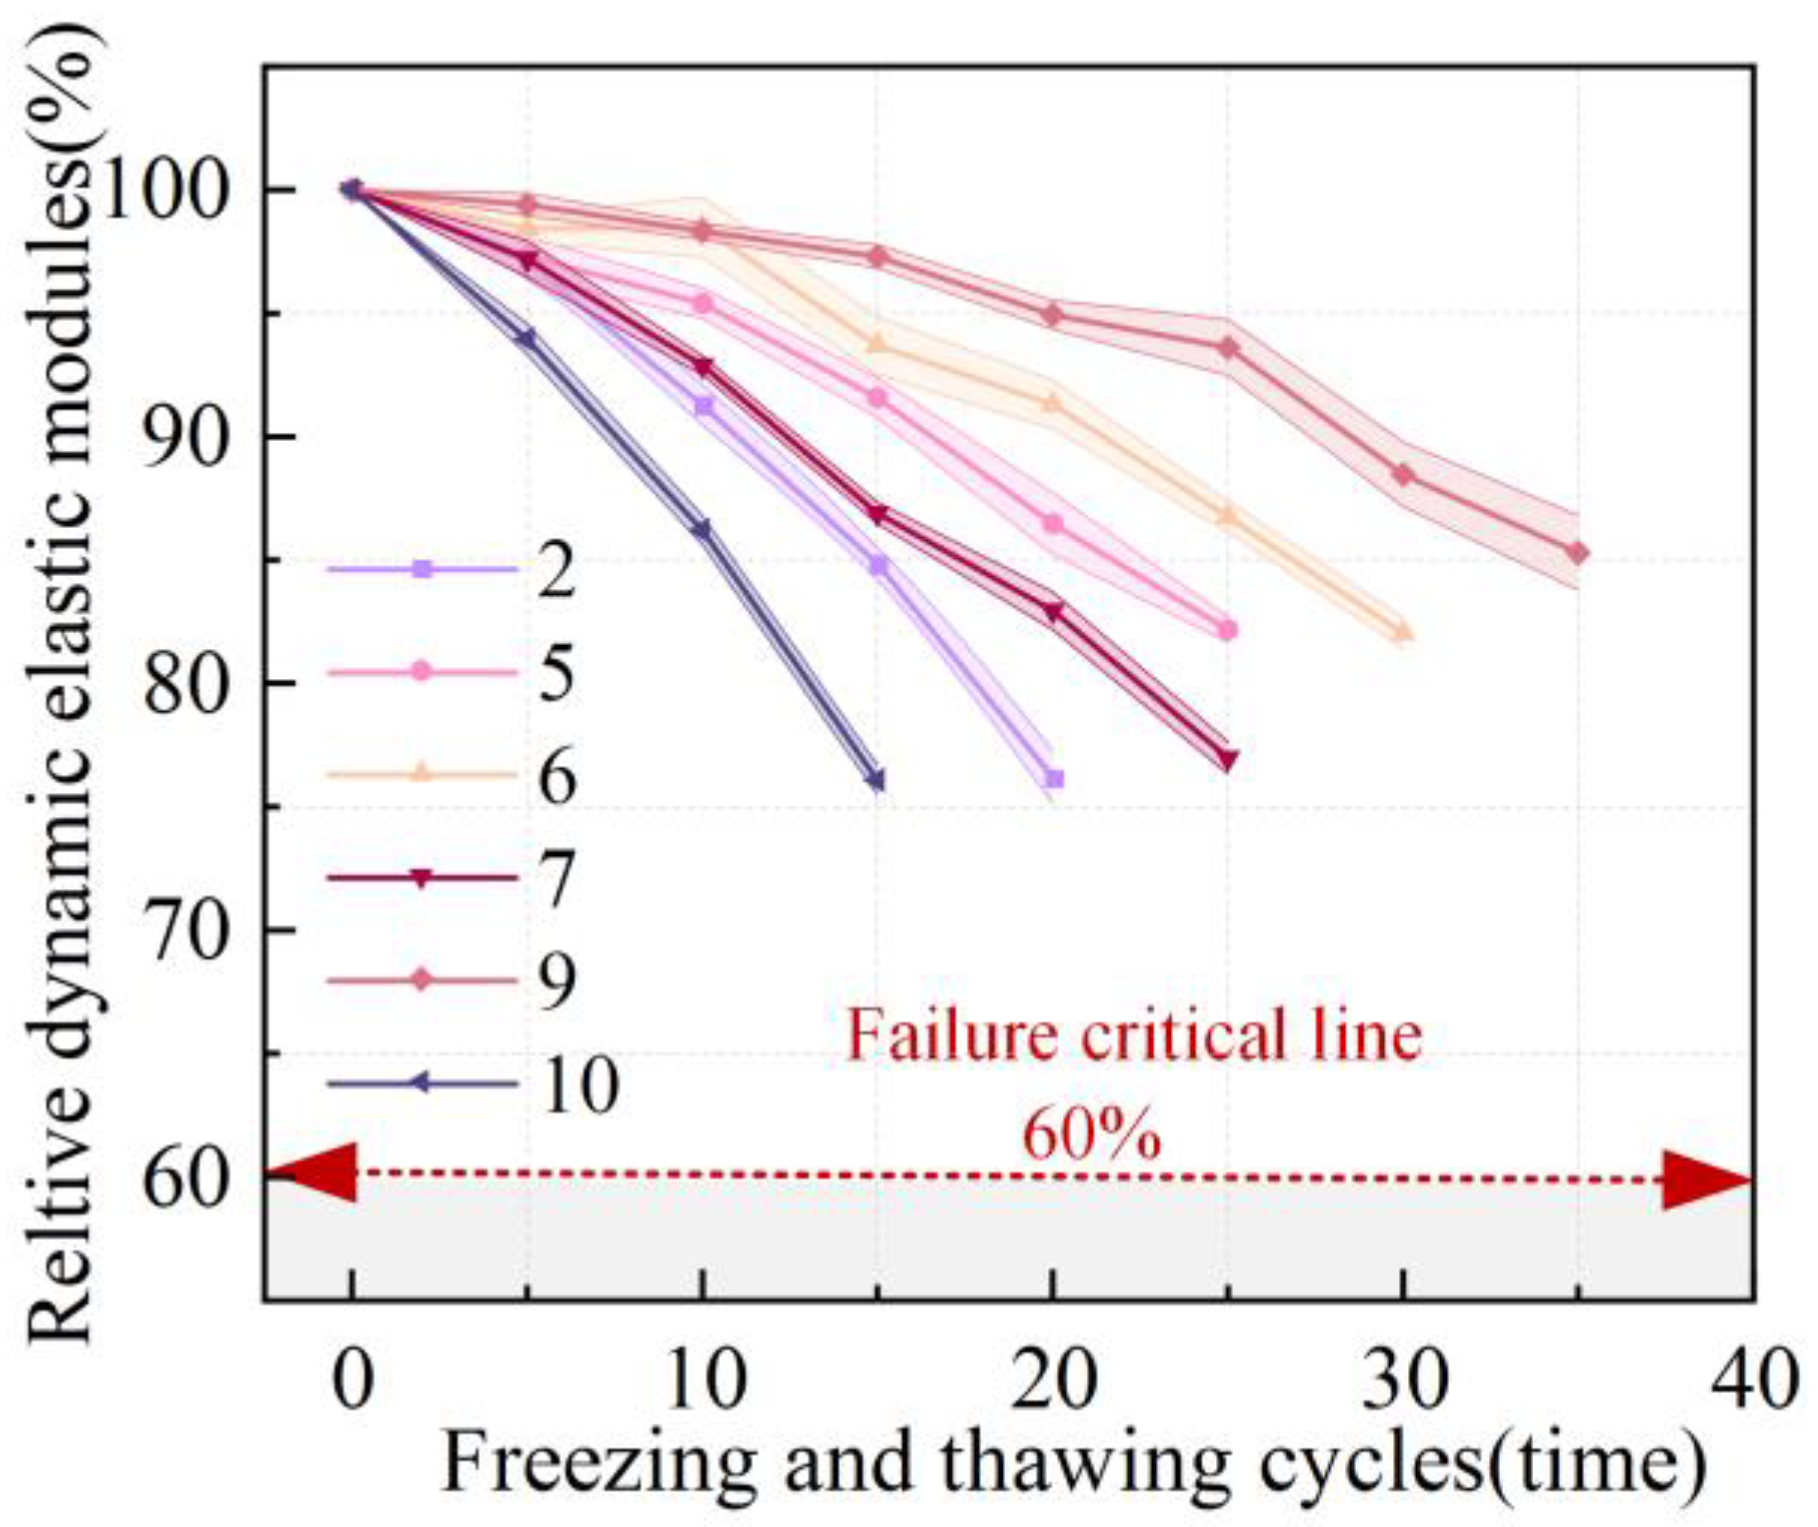
3.2.2. Relative Dynamic Elastic Modulus

The relative dynamic modulus change curve for the LCPC is shown in Figure 5. When the mass loss rate reached the critical value, the relative dynamic elastic modulus of each group remained greater than 60% and did not reach the critical failure state. The relative dynamic elastic modulus of group 10 had the largest decline rate, and the relative dynamic elastic modulus was 73.55% at the 15th freeze-thaw cycle. When 15% fly ash and 20% slag powder were added, the relative dynamic modulus decreased at the lowest rate, and the frost resistance was the best. The results showed that the addition of fly ash and slag powder significantly improved the frost resistance of LCPC, and with the increase in fly ash and slag powder content, the frost resistance of LCPC constantly improved. This is because the incorporation of fly ash and slag powder reacts with cement to produce more detailed hydration products, which improves the microstructure of the LCPC. At the same time, fly ash and slag powder have good crack resistance, which can improve the toughness and ductility of LCPC and reduce the formation and expansion of microcracks caused by temperature changes.

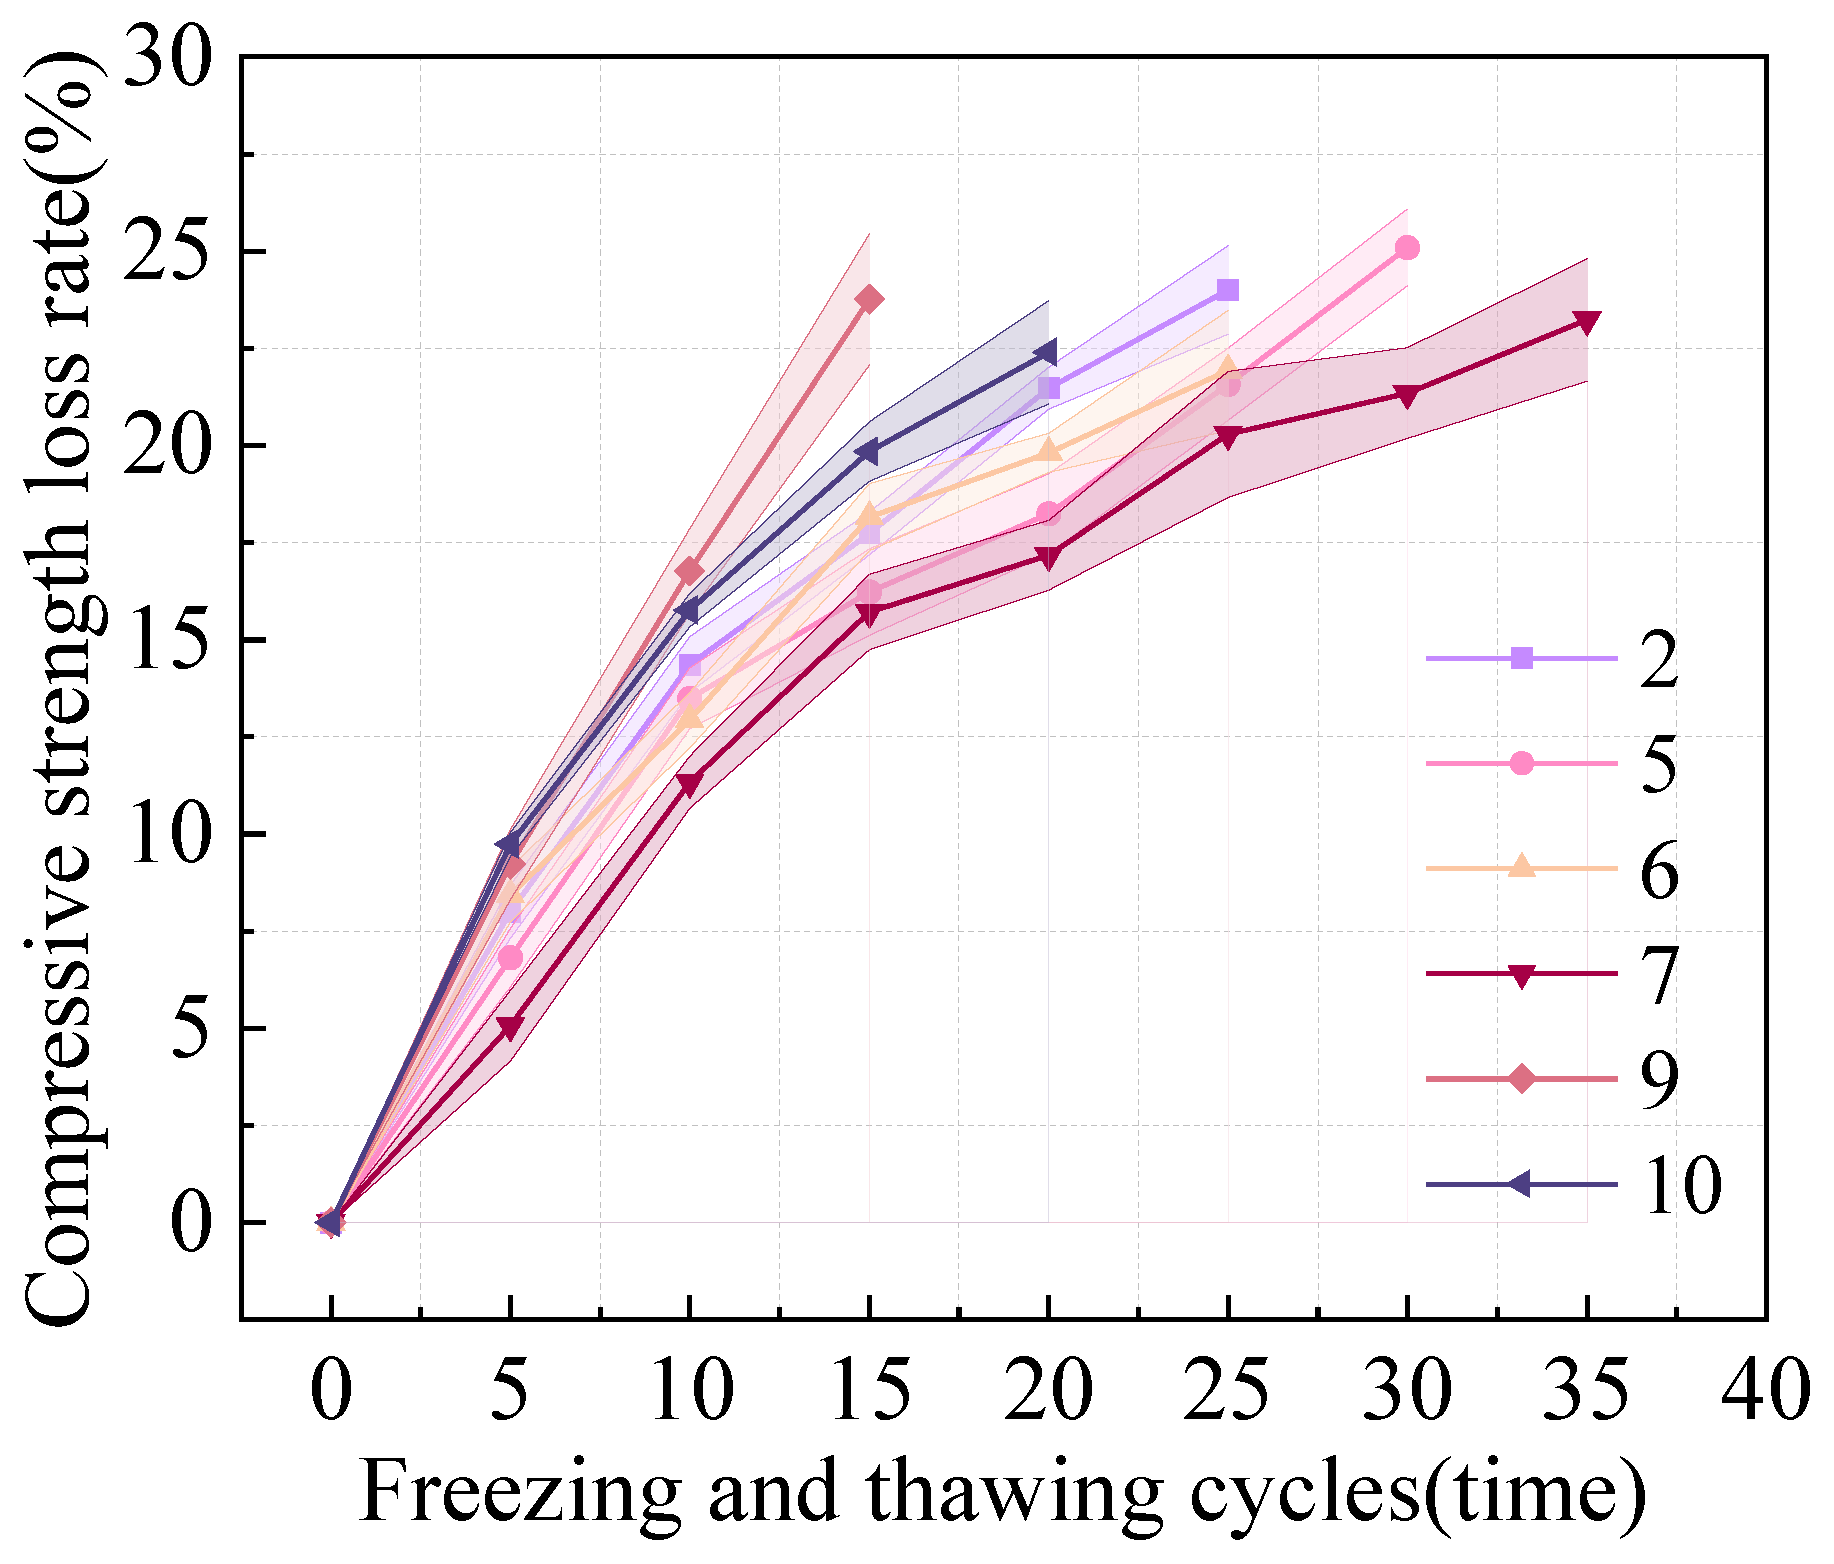
3.2.3. Compressive Strength Loss Rate

According to the “Standard for test methods of concrete physical and mechanical properties” [31], non-standard cubic specimens with a specimen size of 100 mm × 100 mm × 100 mm were used for testing (loading rate of 0.3–0.5 Mpa/s). According to the requirements of the specification, the compressive strength of the specimens with dimensions of 100 mm × 100 mm × 100 mm needs to be multiplied by a size reduction factor of 0.95. Three parallel specimens were selected for each group, and the arithmetic mean of their compressive strength was used as the compressive strength of the specimens. The relationship between the compressive strength loss rate and the freeze−thaw cycle is shown in Figure 6. As shown in Figure 6, with an increasing number of freeze−thaw cycles, the compressive strength loss rate of the LCPC also increases. When the contents of fly ash and slag powder are 0%, after the 15th freeze−thaw cycle, the compressive strength loss rate of LCPC is 23.22%. The compressive strength loss rate of the remaining groups mixed with fly ash and slag powder was all lower than 23.22%, and the LCPC mixed with 15% fly ash and 20% slag powder had the best frost resistance, with a compressive strength loss rate of 24.68% after 35 freezing-thawing cycles. Thus, fly ash and slag powder play a positive role in improving the compressive strength of LCPC. Comprehensive analysis showed that Group 9 performed best when the content of fly ash was 15% and slag powder content was 20% during the freeze−thaw cycle.

3.3. Analysis of Wetting-Drying Cycle Test Results
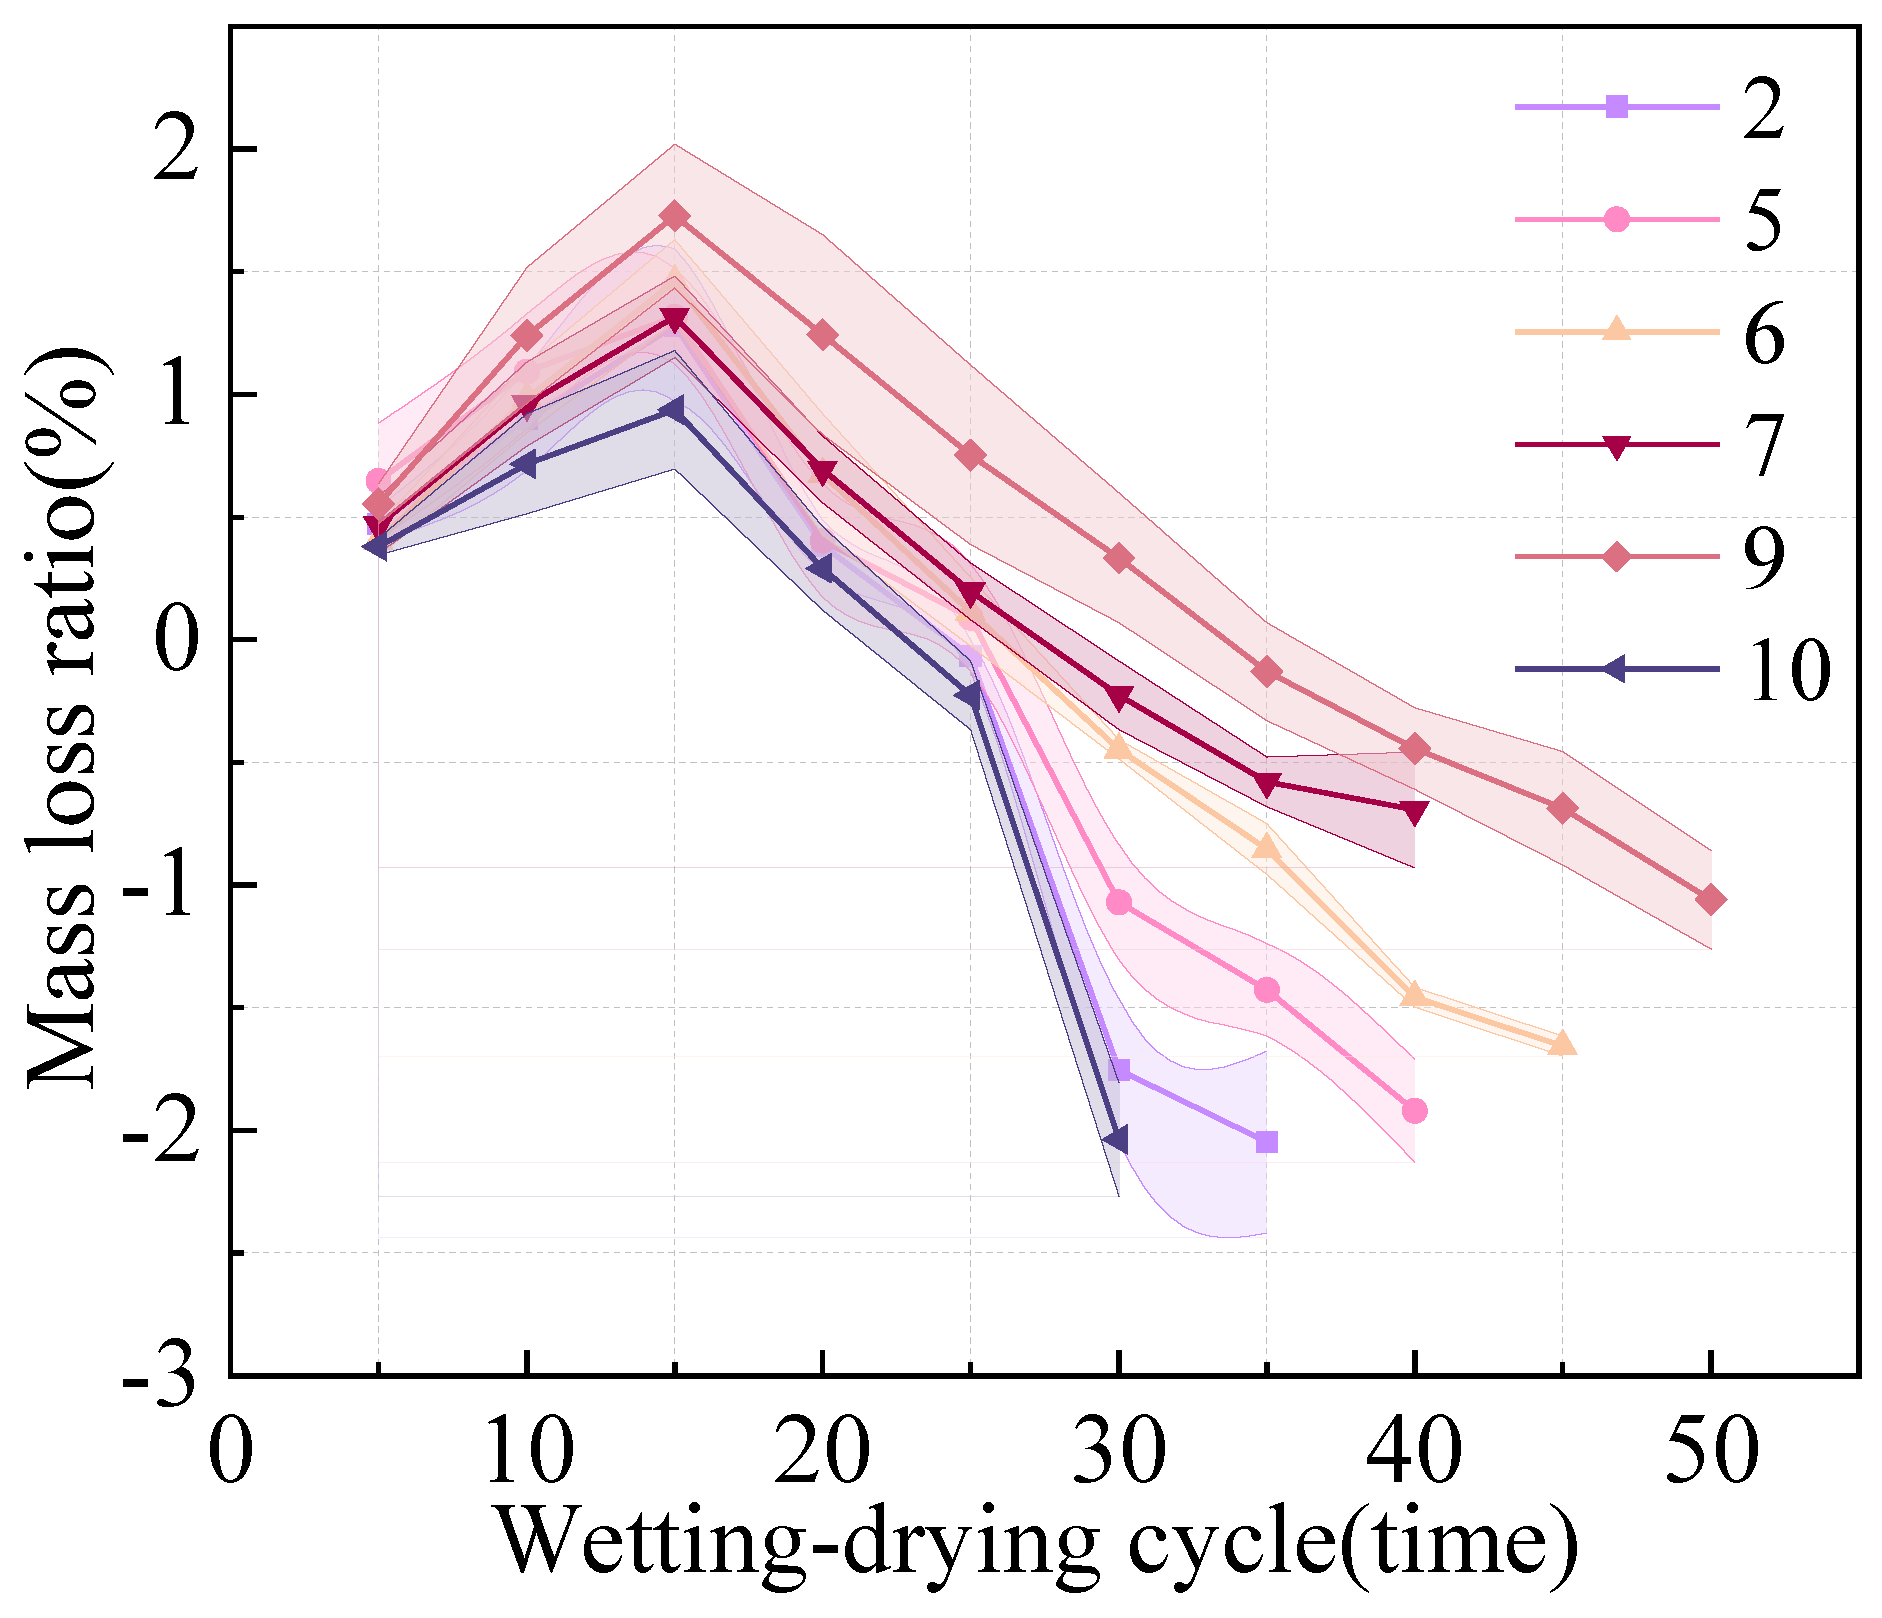
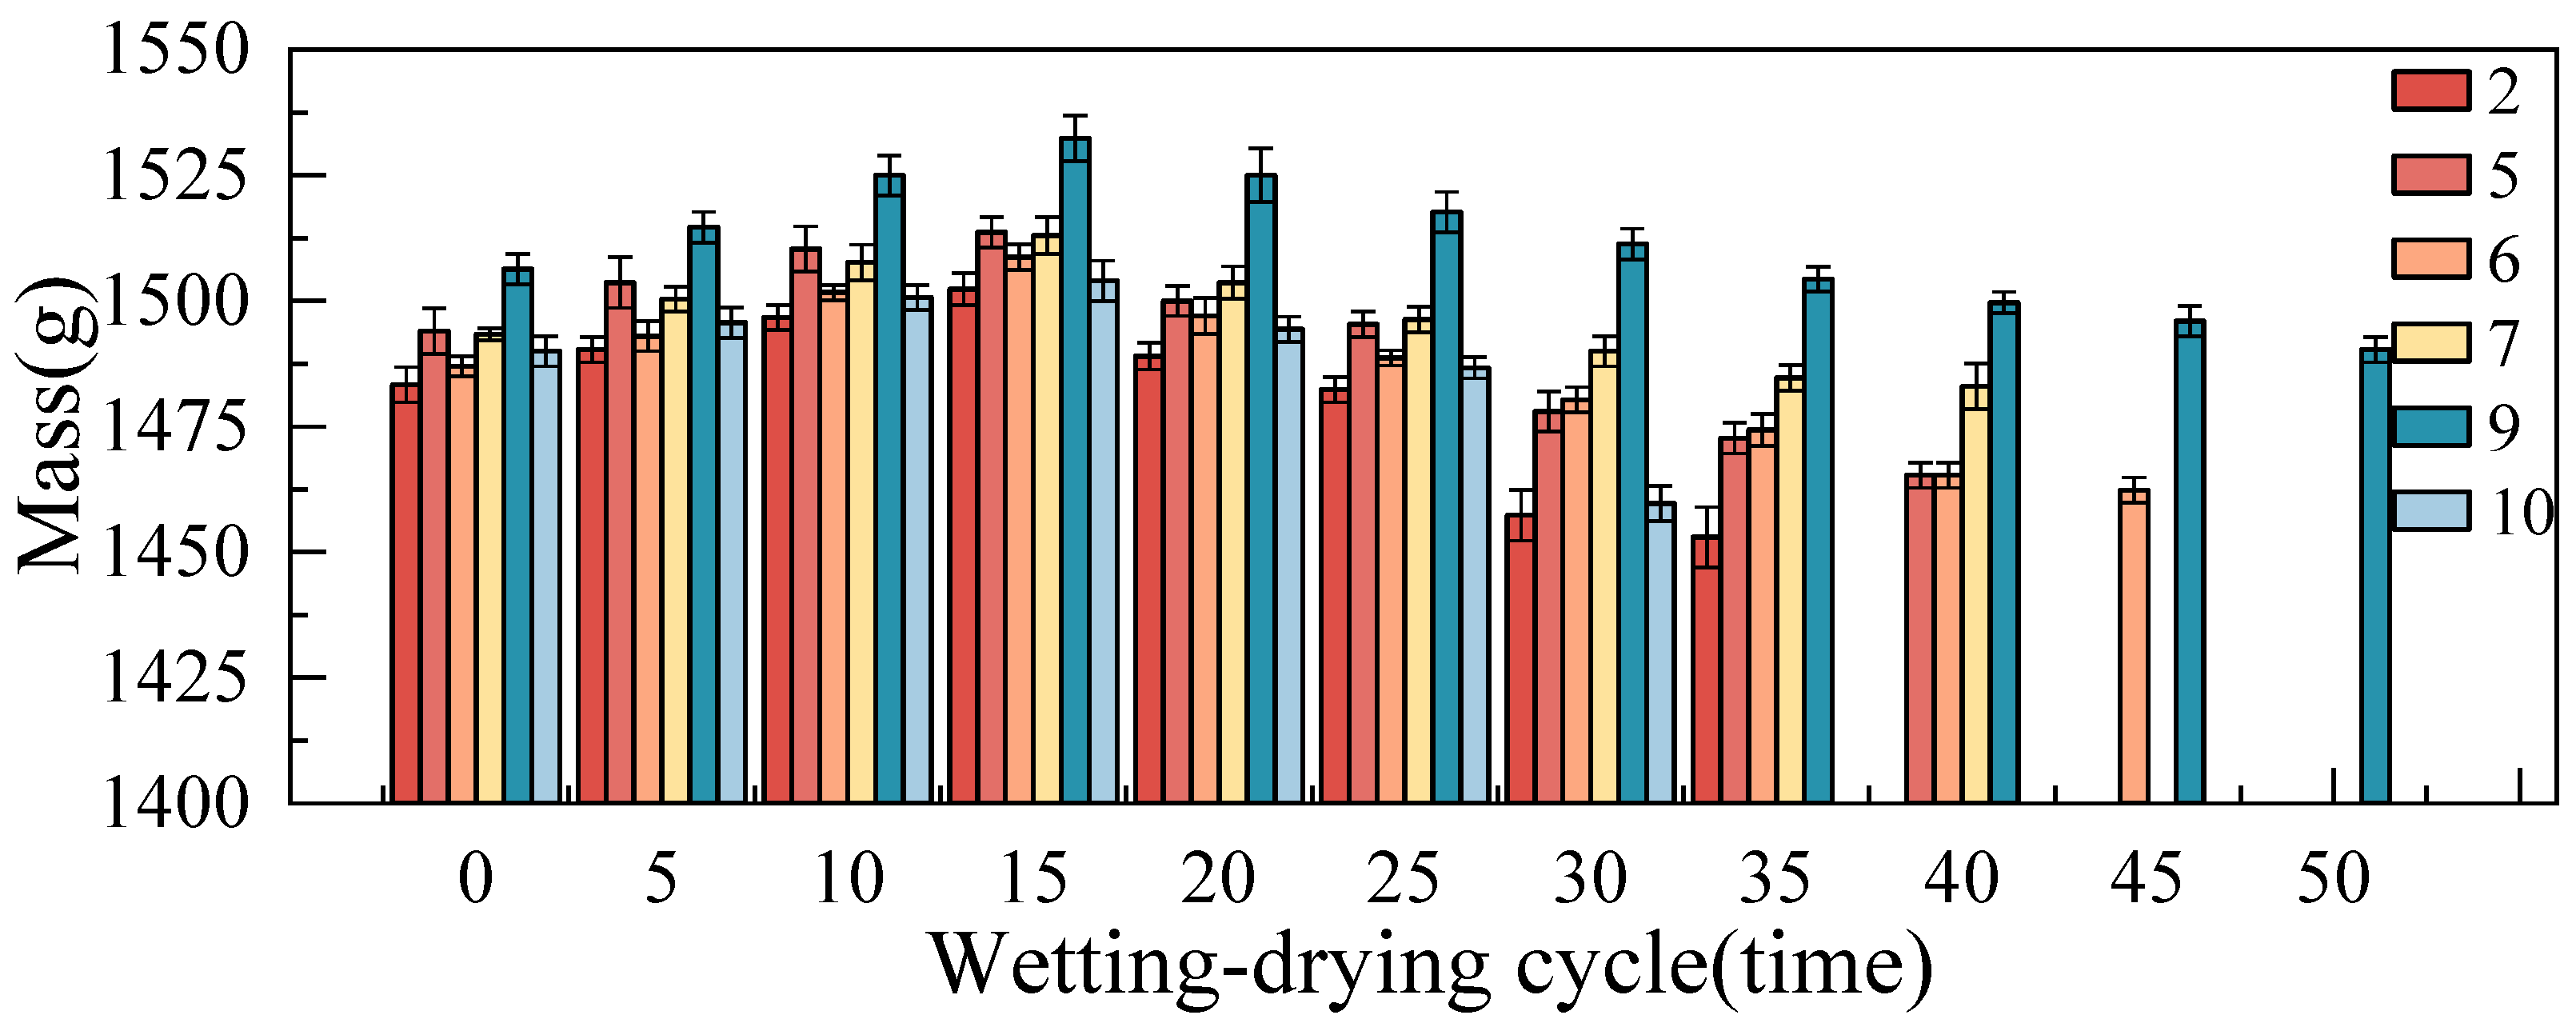
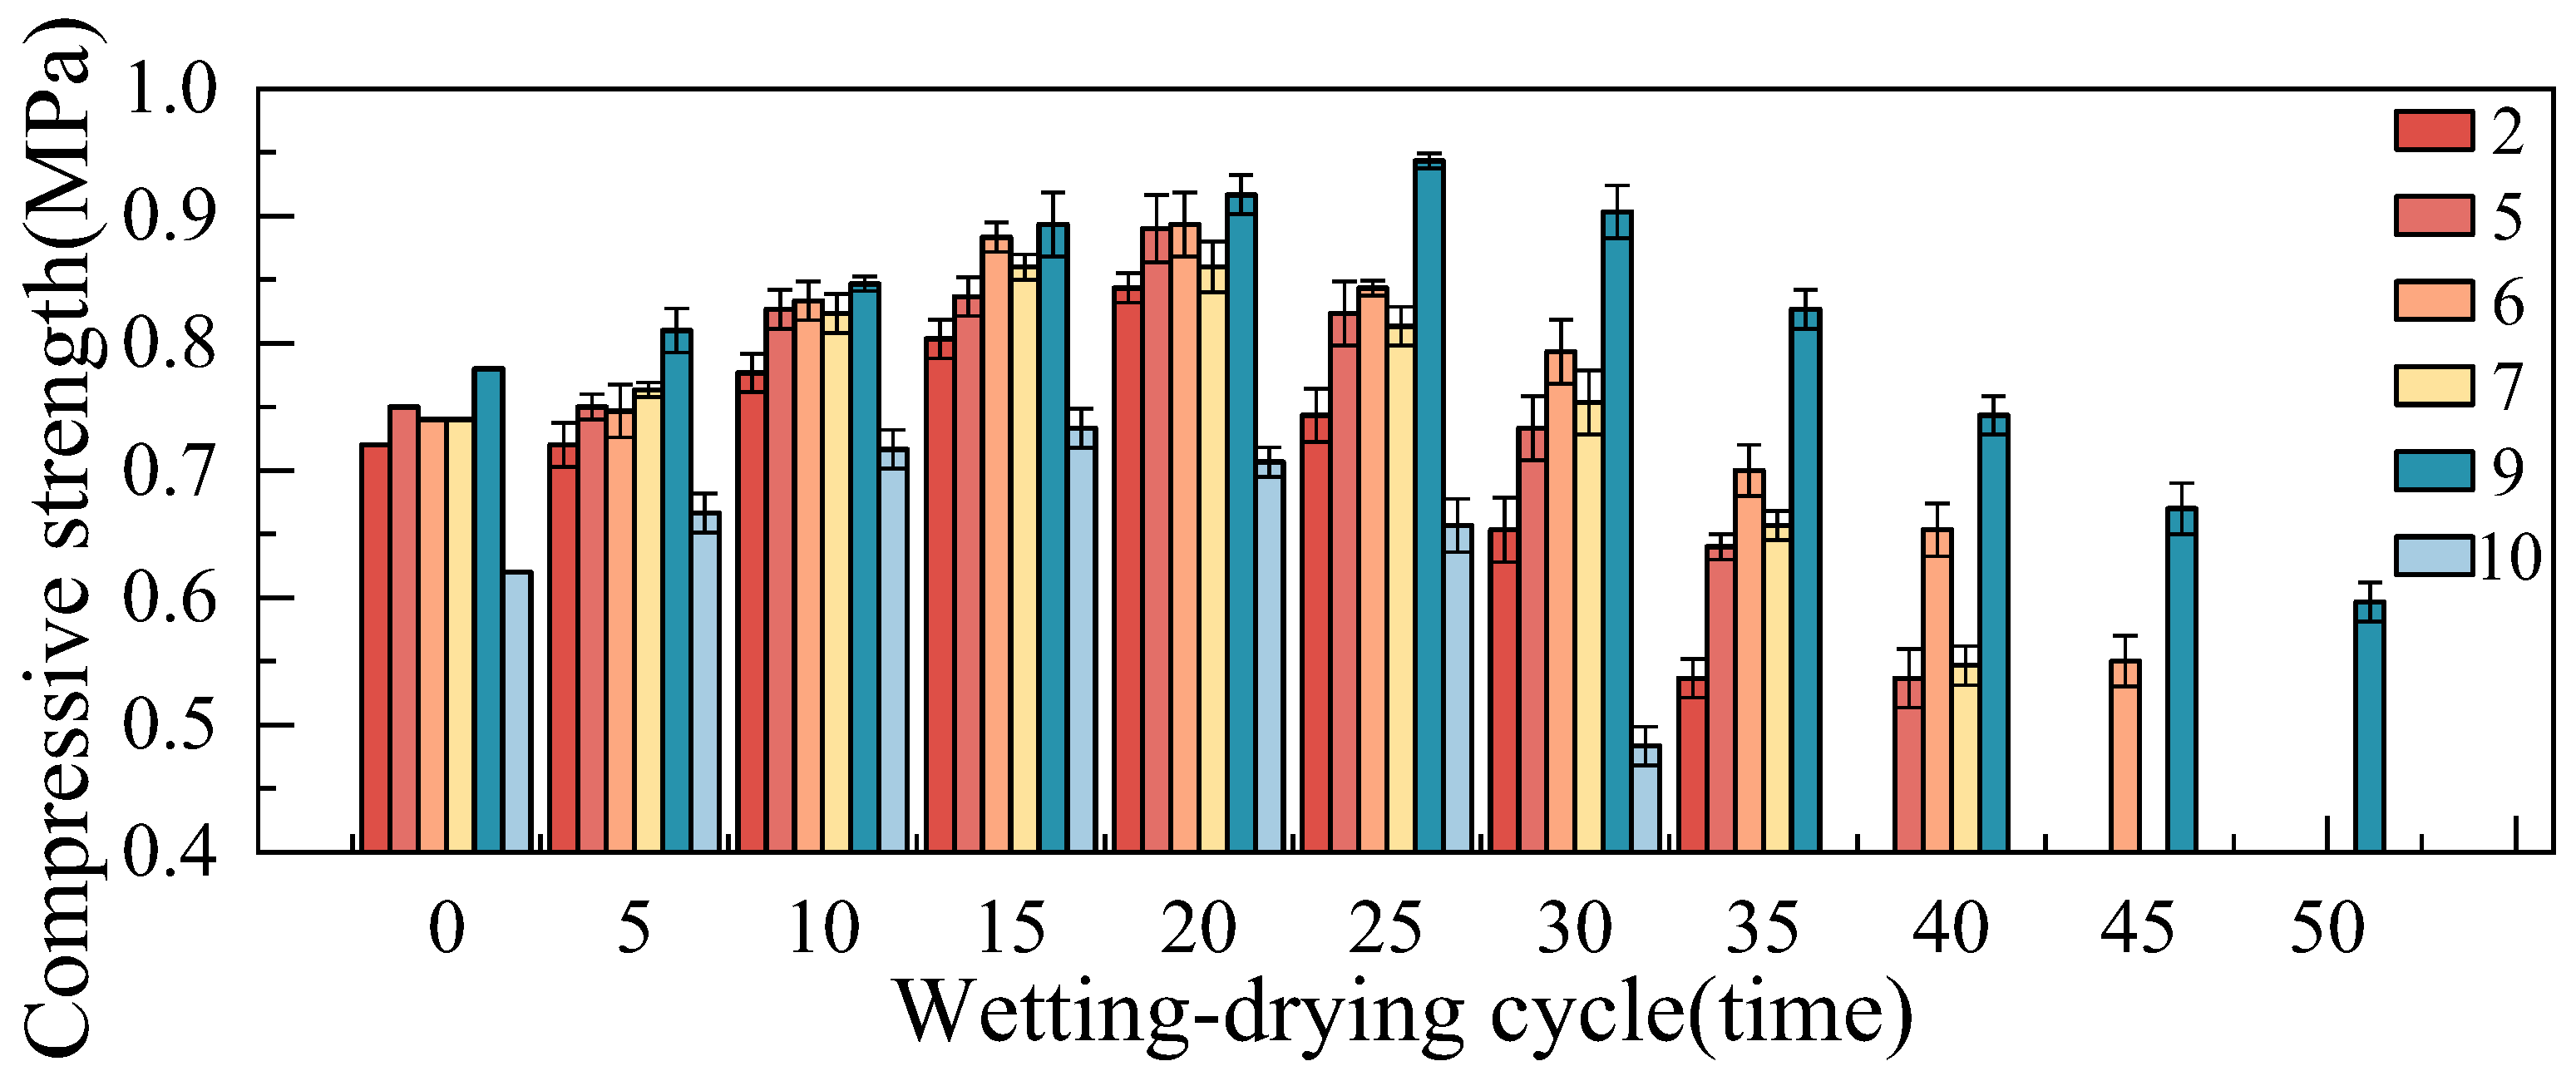
3.3.1. Mass Loss

The relative mass change curve of the LCPC under different wetting-drying cycles is shown in Figure 7, and the mass change curve is shown in Figure 8. As shown in Figure 8, the mass of the LCPC increased first and then decreased with an increase in the number of cycles. The relative mass of the LCPC exhibited a trend of first increasing and then decreasing during the wetting-drying cycle in the sulfate environment. When the test block was directly soaked in the sulfate solution, the water gradually migrated to the interior of the LCPC, and a small amount of residual water remained during drying, resulting in an increase in mass. At the same time, the sulfate group migrates to the LCPC with water, and some of it reacts chemically with other substances to form expansive substances such as ettringite and gypsum, which fill the pores of the LCPC. On one hand, the LCPC becomes denser; on the other hand, these expansions improve the mass of the LCPC to a certain extent, resulting in an increase in the mass in the previous several cycles. With an increase in the number of cycles, these expansions continue to generate, erode, and fill the LCPC, resulting in cracks in the LCPC and then the loss of coarse aggregates and cementing materials. The mass of the LCPC decreased.
Group 2 was mixed with 5% fly ash and 15% slag powder, and Group 10 was not mixed with any additives. The mass loss rate of Group 2 was lower than that of Group 10 because the added fly ash and slag powder promoted the strength improvement of the LCPC gelling material, which led to a lower mass loss rate. Compared with Group 5 and Group 7, the mass loss rate of Group 7 is lower than that of Group 5, Group 7 is mixed with 15% fly ash and 10% slag powder, Group 5 is mixed with 10% fly ash and 15% slag powder, and Group 5 is mixed with slag powder more than Group 7. The slag powder causes a volcanic ash reaction to form gelling, which improves the compactness of the LCPC and reduces the amount of coarse aggregate spalling. The mass loss rate is reduced, but the hydration reaction speed of slag powder is lower than that of cement, and the activity of slag powder is lower than that of cement, resulting in low overall activity and weak cohesiveness between coarse aggregates. However, the quality decreases, and the quality loss rate increases. As the number of wetting-drying cycles increased, the mass of most groups showed a declining trend after 20 wetting-drying cycles because LCPC used loess as the cementing material and cement as a small amount of additive. Due to the special properties of loess, such as easy disintegration, the gelling strength of the test blocks weakened during the wetting-drying process, and the mass of the LCPC was reduced. Overall, Group 9 performed the best.

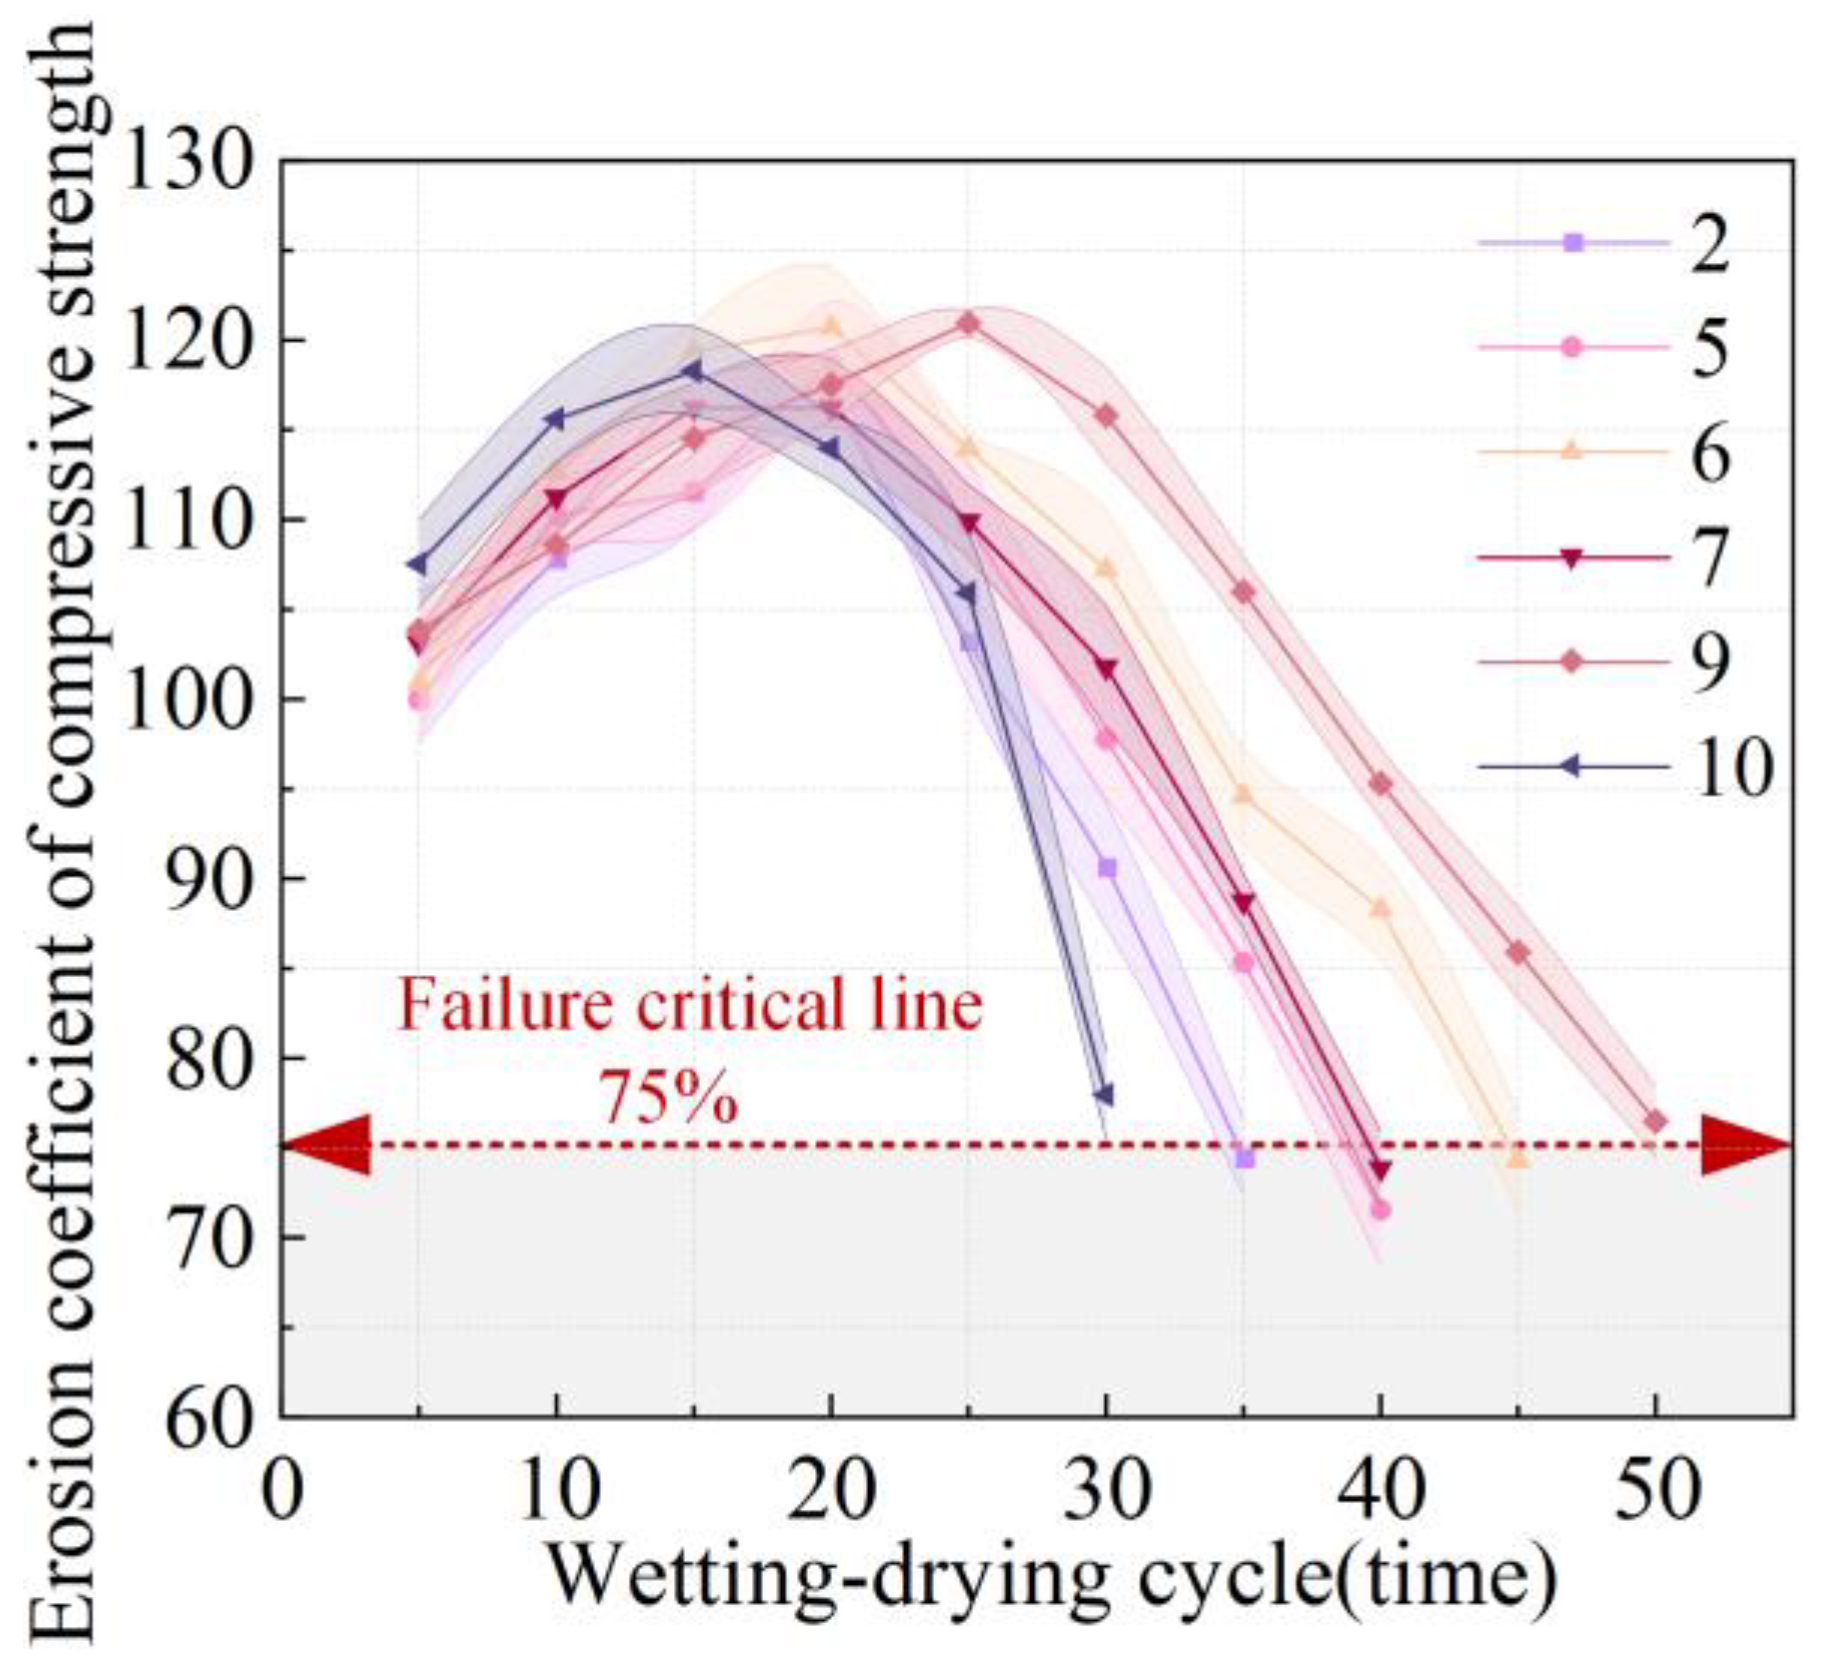
3.3.2. Erosion Coefficient of Compressive Strength

The change in the erosion coefficient of compressive strength with the number of wetting-drying cycles is shown in Figure 9, and the change in compressive strength with the number of wetting-drying cycles is shown in Figure 10.
The analysis of Figure 9 and Figure 10 shows that the compressive strength of each group first increased and then decreased with the number of cycles. Because LCPC contacts sulfate solution in the initial cycle stage, the cement in LCPC continues to undergo hydration reaction, and the compressive strength increases, while the presence of sulfate reacts with other components in LCPC. New products were formed to fill the pores of the LCPC, resulting in an increase in the compressive strength. With an increase in the number of wetting-drying cycles of sulfate, the presence of sulfate will cause chemical reactions in LCPC, destroy the internal microstructure of LCPC, change the pore structure of LCPC, and thus affect its mechanical properties. At the same time, the loess composed of LCPC slowly collapses under the attack of sulfate, which also leads to a reduction in compressive strength.
Comparing Groups 2 and 10, it was found that the compressive strength of Group 2 was significantly higher than that of Group 10. Group 2 was mixed with 5% fly ash and 15% slag powder. Active oxidizing substances, such as silicic acid and aluminic acid in fly ash, can combine with calcium hydrolyzed in water to form a gelling body that fills micropores in LCPC and increases the compactness of LCPC. At the same time, calcium compounds contained in fly ash and slag powder release calcium ions when in contact with the sulfate solution, forming a hard calcium sulfate precipitate with sulfate. This precipitate can help slow down the process of sulfate erosion and protect the strength of the LCPC. Therefore, incorporating fly ash and slag powder can effectively improve the compressive strength of LCPC. Group 9 erosion coefficient of compressive strength reduction rate is the slowest, the best performance; Group 10 erosion coefficient of compressive strength reduction rate is the fastest, the worst performance. With an increase in the number of wetting-drying cycles, the compressive strength of most groups showed a decreasing trend after 20 wetting-drying cycles, which was because the LCPC used loess as the cementing material and cement as a small additive. Due to the special properties of loess, such as easy disintegration, the cementing strength of the test blocks was weakened, and the compressive strength decreased during the wetting–drying cycle.

3.4. Microscopic Mechanism Analysis of LCPC

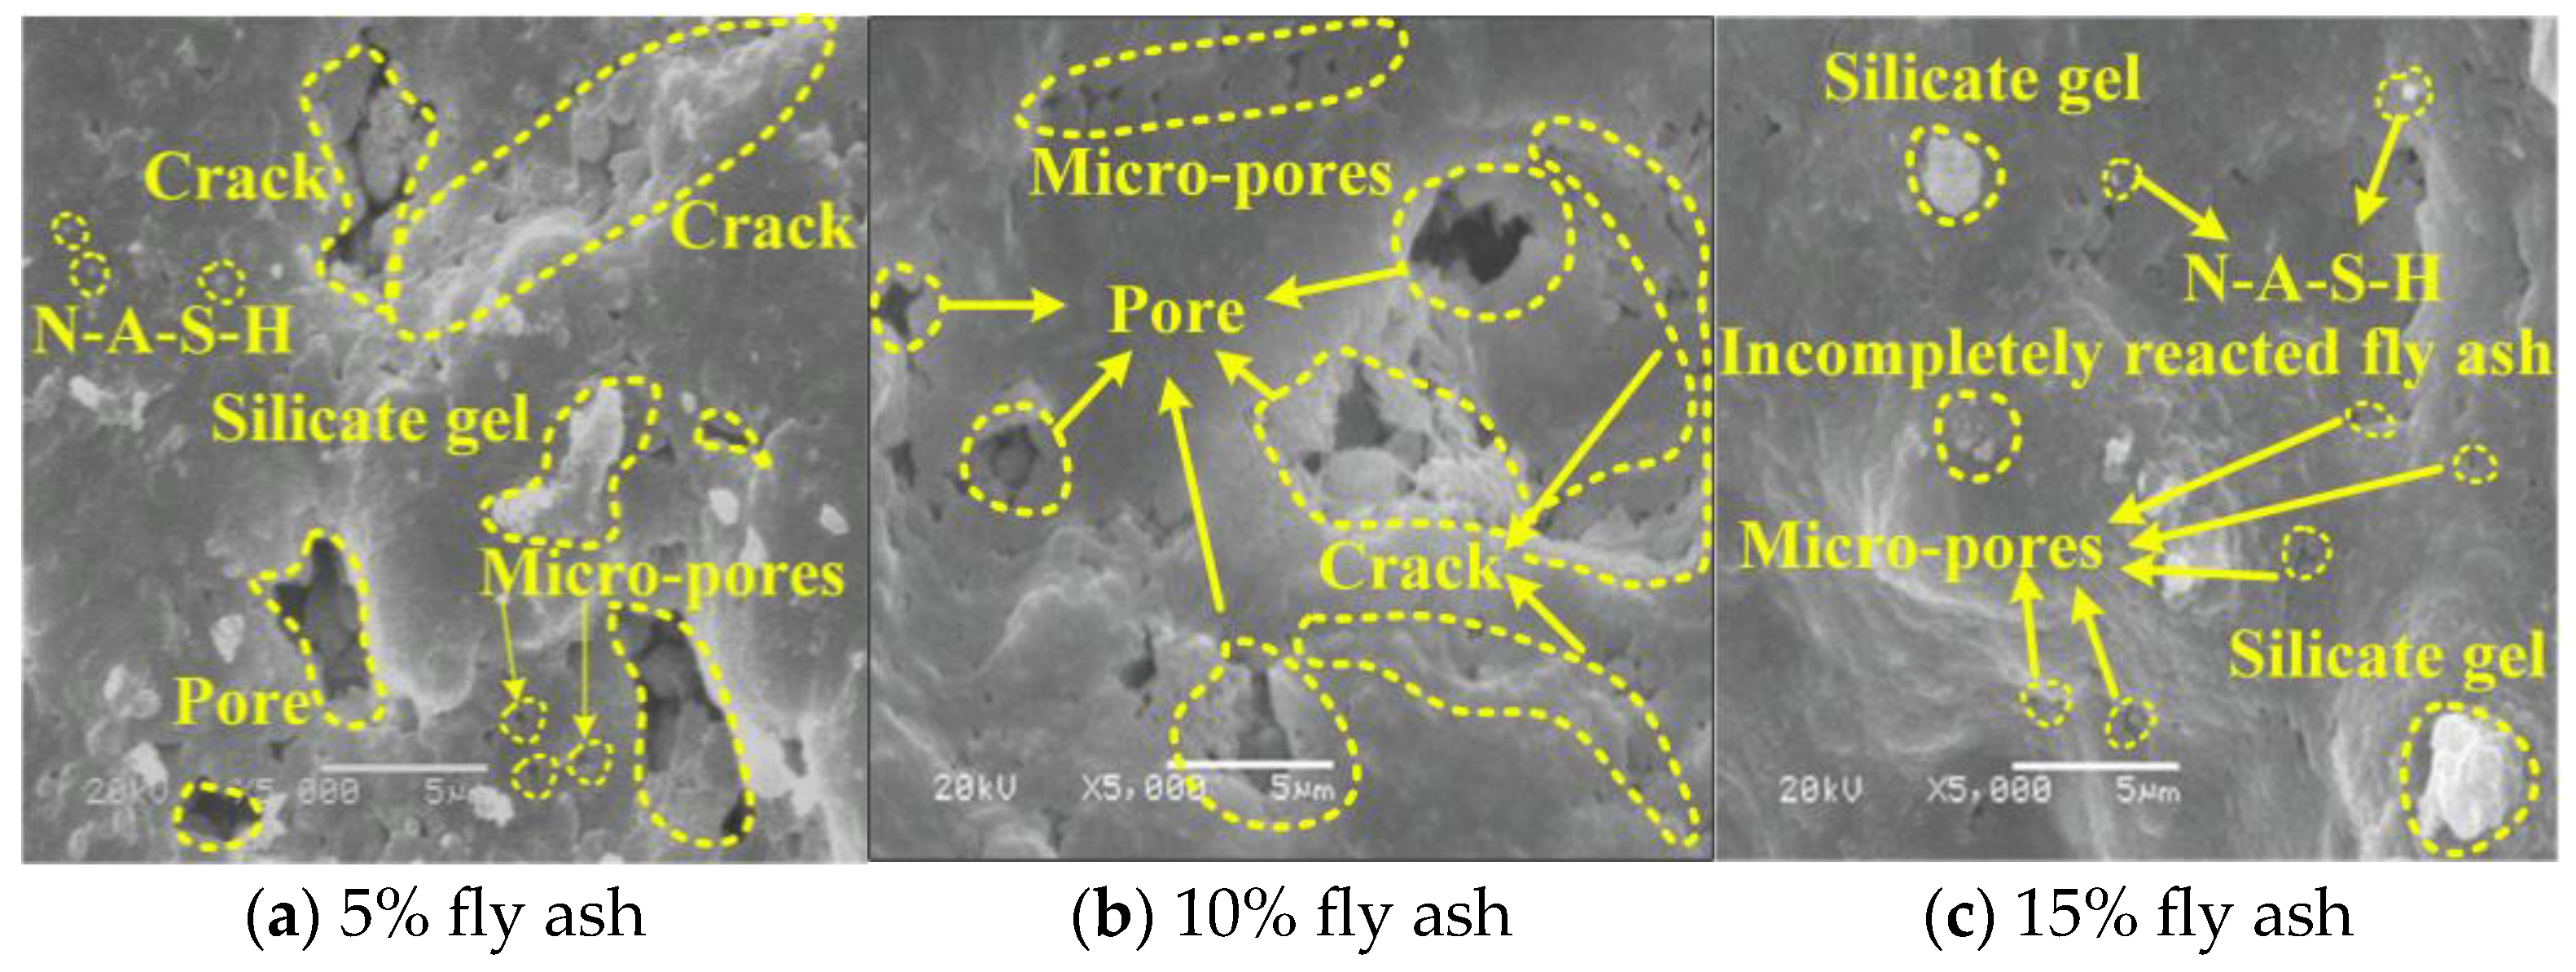
3.4.1. Analysis of Effect of Fly Ash on LCPC Microstructure

The microtopography of the LCPC with different fly ash contents is shown in Figure 11. The morphology diagram of LCPC with fly ash added in this observation shows that after a curing period of 90 d, as shown in Figure 11, a large number of hydrated silicate cementates are formed in LCPC, and the incorporation of fly ash results in volcanic ash reaction, forming a dense hydrated product structure. With the continuous increase in fly ash content, the generated cementates continued to increase, and the number of pores gradually decreased. As shown in Figure 11c, except for one obvious pore, the other pores became smaller in shape and quantity. The contribution of fly ash to the strength of LCPC is mainly in two aspects: the “morphological effect” and the other is the “micro-aggregate effect” [32], which can make LCPC denser. Therefore, with an increase in the fly ash content, the compactness and strength of the LCPC improved.

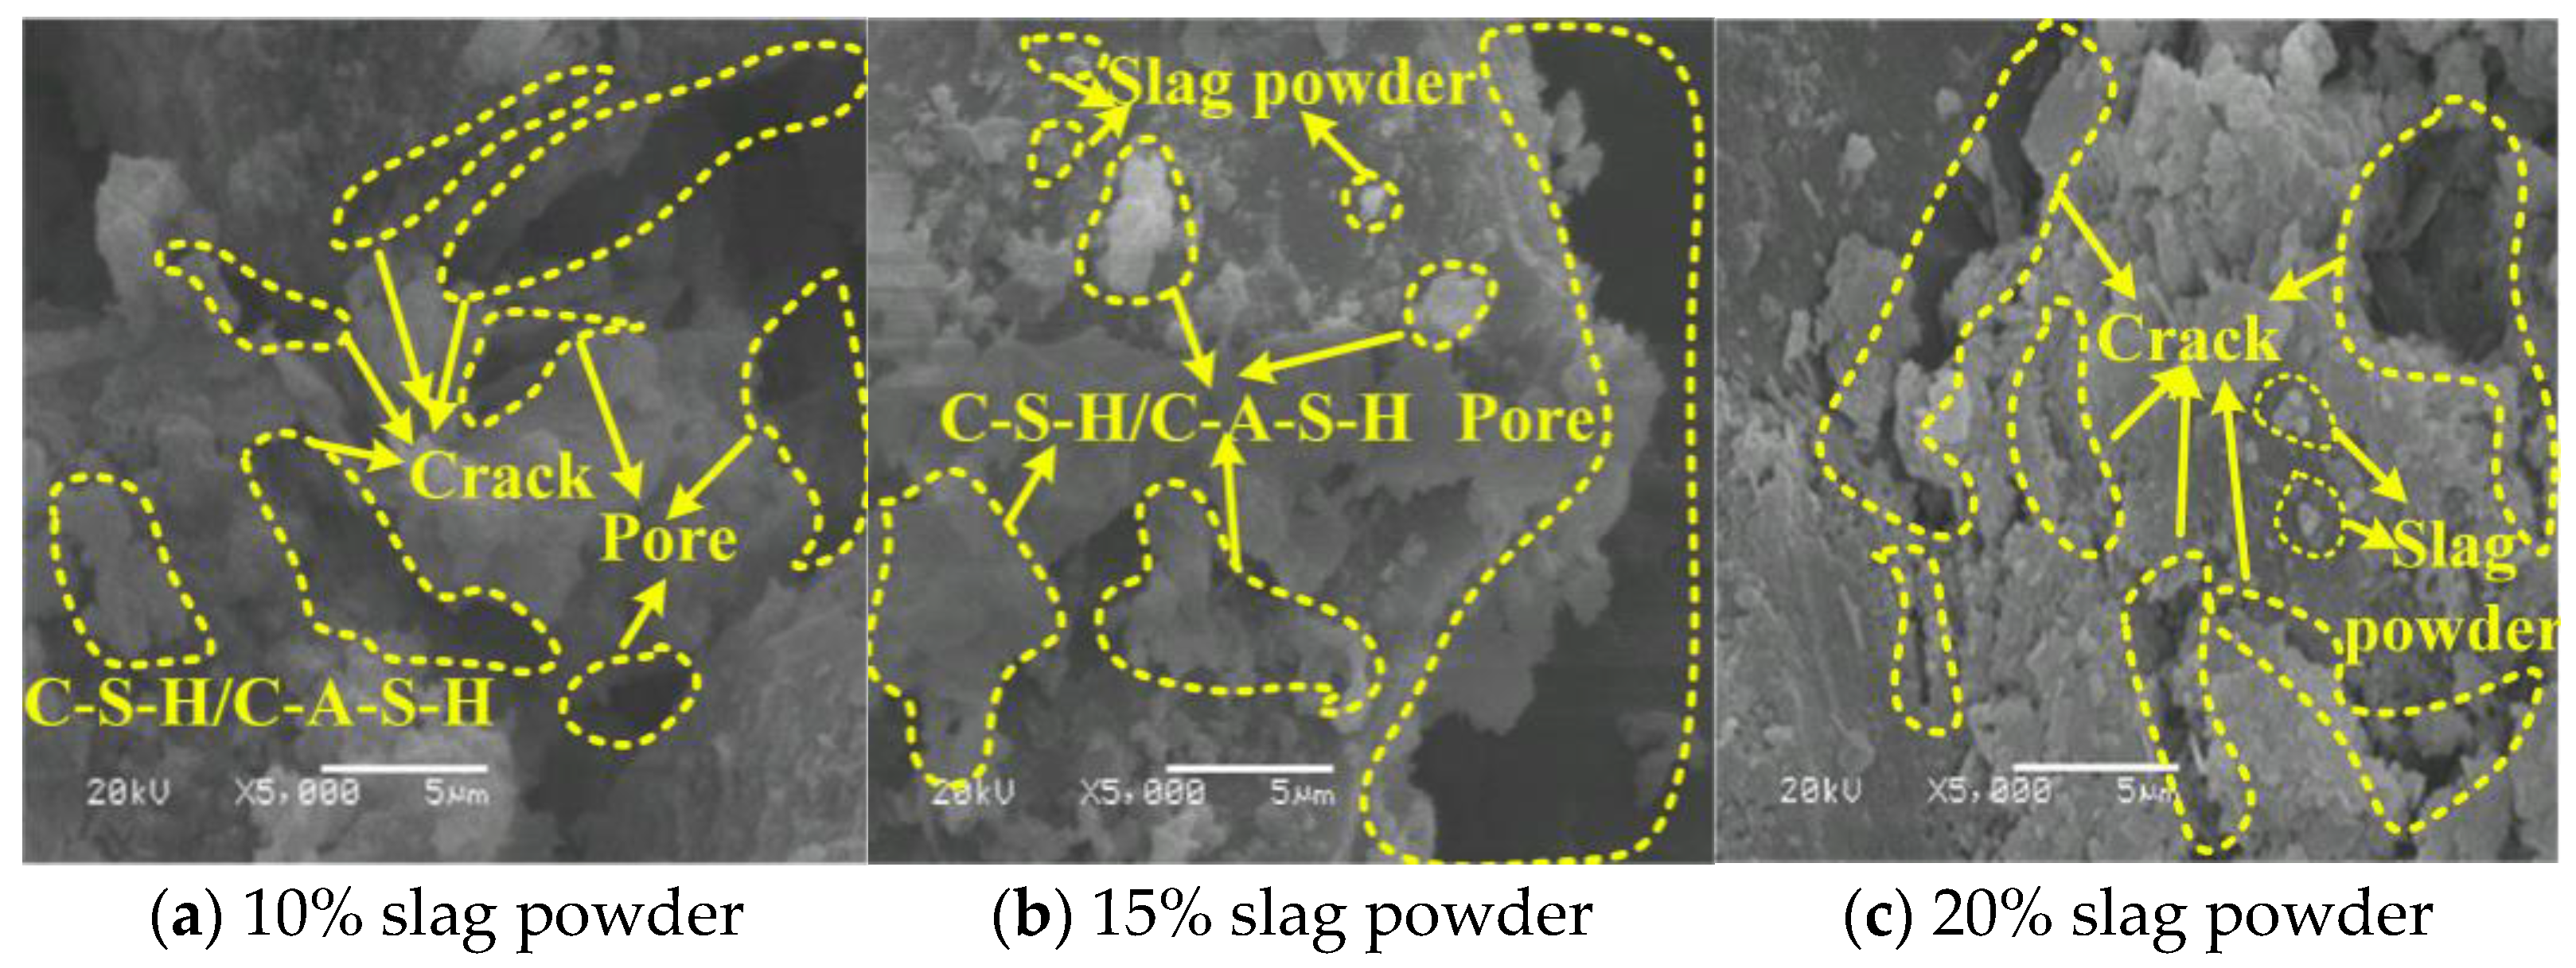
3.4.2. Analysis of the Influence of Slag Powder on LCPC Microstructure

The scanning image of the LCPC with slag powder is shown in Figure 12. As shown in Figure 12, the morphology of LCPC after the inclusion of slag powder presents a scaly shape with a particle size of about 1 µm, which has a good filling effect on LCPC. As shown in Figure 12a, when the slag powder content was 10%, granular and fragmentary structures with a size of about 5 µm appeared inside. There was little cement between these small aggregates, resulting in large gaps between them. The continuous development of pores directly affects the strength of the LCPC. The connection between aggregates is mainly between line and plane, and point to point, which makes the soil skeleton loose and affects the strength.
The content of the slag powder in Figure 12b is 15%. Compared with Figure 12a, the structure is dense, there is an outcrop, the amount of scaly aggregates is reduced, there are only a few micropores and micro-cracks in the soil, the distribution of soil particles is more uniform, the contact forms between soil particles are more frequent, the soil is dominated by a single sheet stacked structure, and the soil skeleton is relatively complete. Generally, the density of the structure is improved, and the integrity is high.
Figure 12c, when the content of slag powder was 20%, it was observed that compared with the scanning electron microscope image of 10% and 15% slag powder when the content of 20% slag powder was added, the overall structure was the highest dense, with a few scaly units and a good degree of cementation, only a few micro-pores, dense structure, strong microstructural integrity of LCPC and complete skeleton structure of soil. The strength of the LCPC was effectively improved.

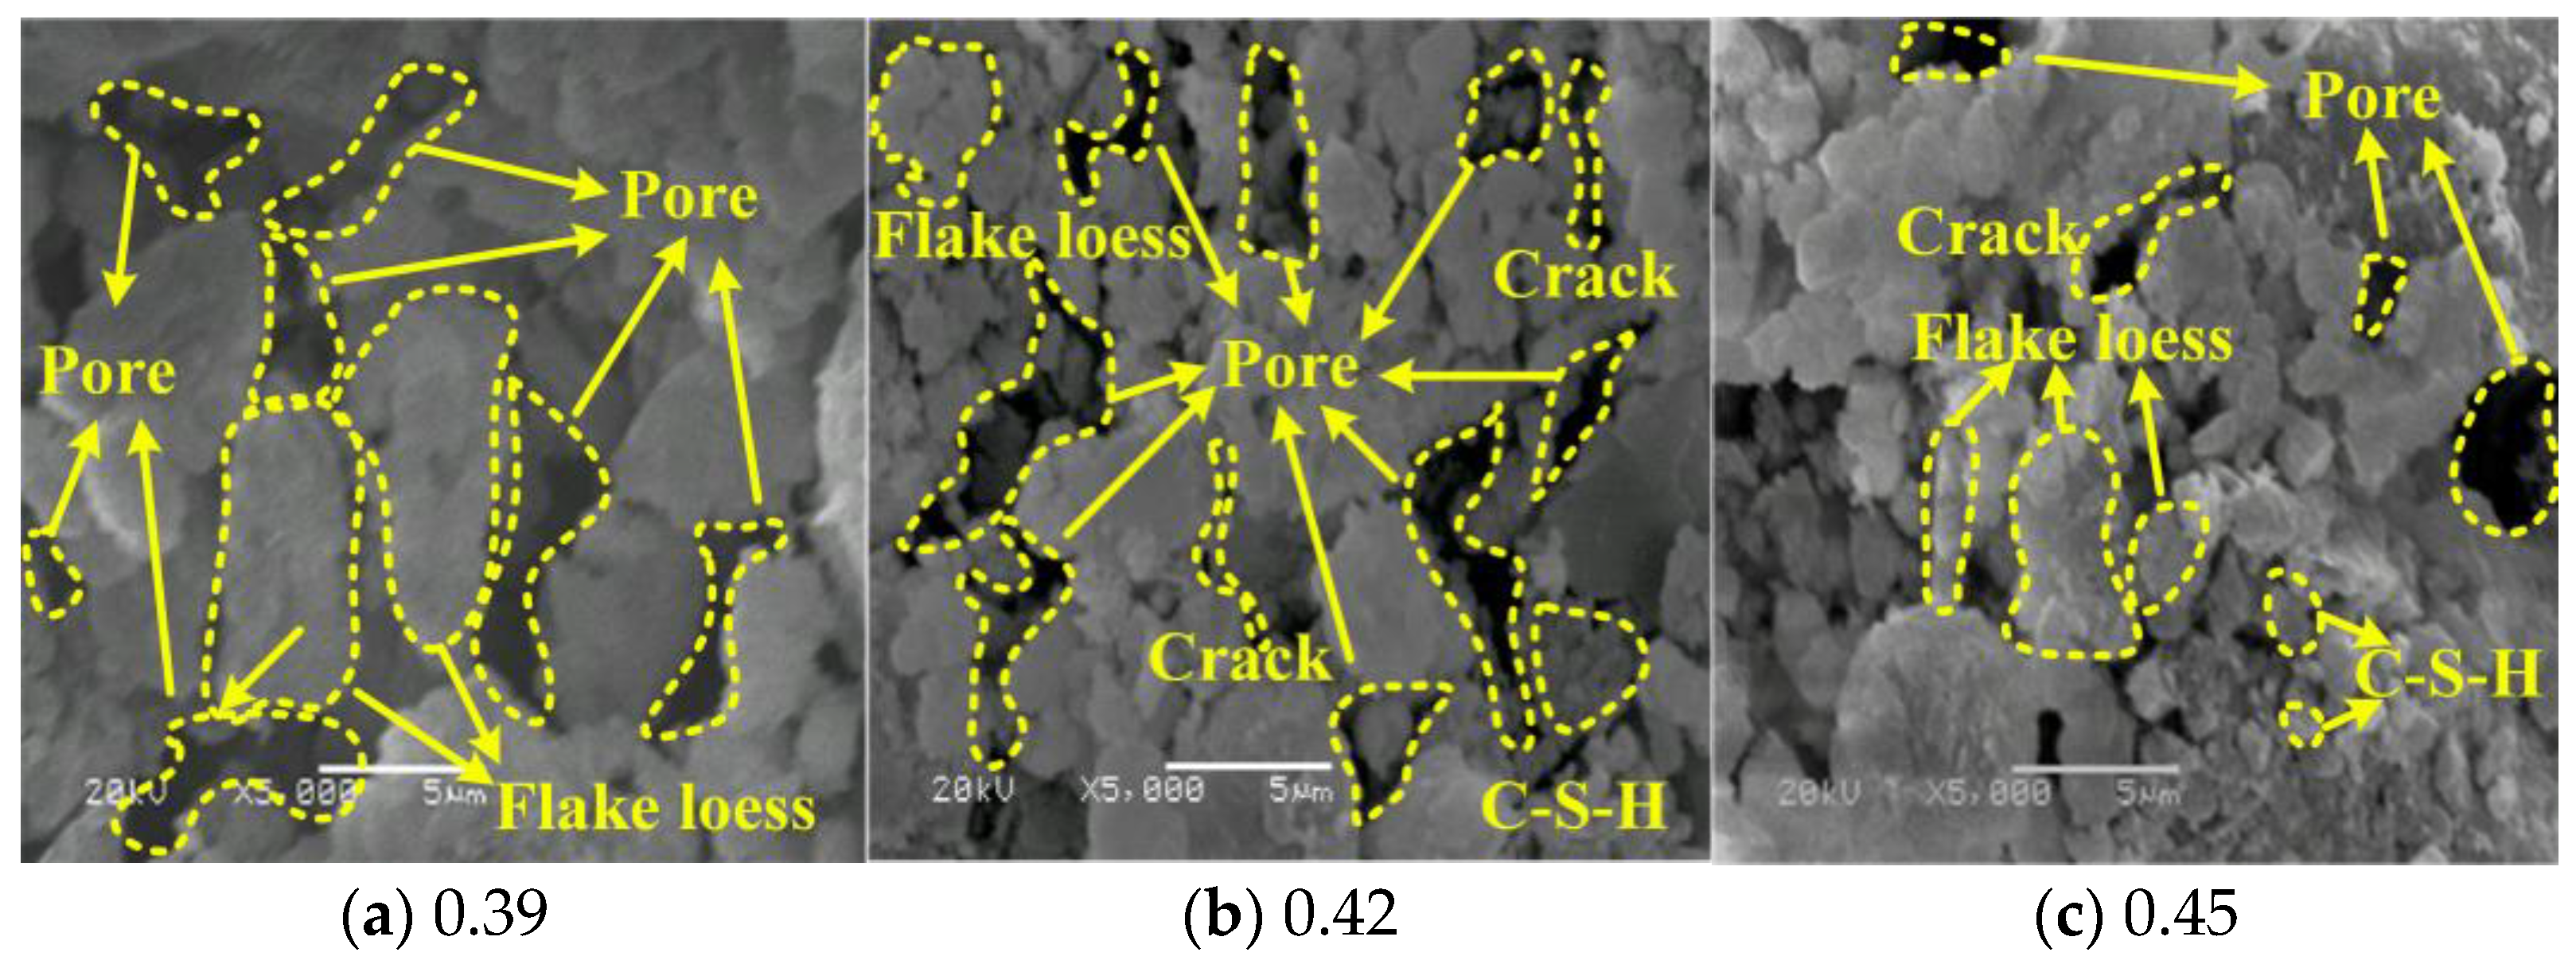
3.4.3. Effect of Water-Cement Ratio on Microstructure of LCPC

The scanning electron images of LCPC with different water-cement ratios are shown in Figure 13. As shown in Figure 13, the overall structure is relatively loose, the number of pores is large, the loess structure has an overhead phenomenon, and the contact between particles is mainly point-to-point and point-to-plane. As shown in Figure 13a, the pore size is large, the largest crack is up to 10 µm, the loess aggregates are stacked like scales, and the loess skeleton structure is weak, except for the loess mineral components for cementation. A portion of the cement was added to the LCPC, which could continue the hydration reaction to produce a gelling material. The water-cement ratio was set at 0.39. The amount of water added was insufficient to support the entire process of cement hydration reaction, and the amount of gelling material was less due to insufficient hydration reaction. Compared with Figure 13a, the structure of Figure 13b is denser, the density is higher, the hydration reaction of cement is more complete than that of the water-cement ratio of 0.39, and the hydration reaction produces more gelling substances. In terms of pores, there were small pores, the pore size was relatively reduced, and the presence of small particle sizes could effectively fill the pores. The largest crack was about 5 µm, and the crack size was reduced. With an increase in the amount of small coagulated material, the total pore area decreased. Figure 13c shows that most of the pores are intergranular pores of soil, the cement hydration reaction process is complete, the loess skeleton structure is relatively complete, there is a phenomenon of agglomeration among soil particles, and the cementation increases, effectively filling the LCPC pores. The connection between soil particles increases in the form of face-to-surface contact, and the maximum pore size is less than 5 µm, which significantly reduces the pore size. The compactness and cohesiveness between soils were enhanced, and the strength of the LCPC was improved.

4. Conclusions

The durability and microstructure of the LCPC were analyzed. The durability was determined by analyzing the mass, compressive strength, and relative dynamic elastic modulus of the LCPC. At the same time, the influence of different admixtures and water-cement ratios on the microstructure of the LCPC was analyzed. The main conclusions are as follows:
The maximum number of freeze-thaw cycles after the incorporation of 15% fly ash and 20% slag powder was 35. The freeze-thaw cycle without any additive was the worst, and the maximum could only reach 15 times. The incorporation of fly ash and slag powder positively affected on the freeze-thaw cycle performance of the LCPC. The relative dynamic elastic modulus of each test group met the requirements within the number of freeze-thaw cycles.
Fly ash and slag powder positively in influenced the dry-wet cycle resistance of LCPC. During the dry-wet cycle test, the compressive strength of the LCPC first increased and then decreased. The maximum number of cycles for the test group with 5% fly ash and 15% slag powder and the test group without any admixture was 30 times. The corrosion resistance coefficient of compressive strength was greater than 75% when 15% fly ash and 20% slag powder were mixed in 50 dry-wet cycles.
With an increase in the fly ash content, the shape and number of structural pores in the SEM morphology decreased. After incorporating the slag powder, the loess-based cement paste presented a scaly shape. With an increase in the amount of slag powder, the number of scaly aggregates decreased, the overall compactness of the structure was good, the soil particles were evenly distributed, and the soil skeleton structure gradually tended to be complete.
When the water-cement ratio was 0.39, the hydration reaction was insufficient, the cementing material was less, and the pores and cracks were large, with a maximum crack of 10 µm. The LCPC structure was relatively loose, the number of pores was large, and the loess skeleton was overhead. When the water-cement ratio is 0.42, the cementitious material increases, the porosity decreases, and the maximum crack is about 5 µm. When the water-cement ratio was 0.45, the pores were mostly soil particle gaps, the loess skeleton was complete, the surface-to-surface contact between soil particles increased, and the maximum pore was less than 5 µm.

Author Contributions

Conceptualization, M.Q.; methodology, M.Q. and S.Y.; Validation, S.Y. and W.Z.; Investigation, X.L.; Data curation, X.L. and J.L.; resources, S.Y.; writing—original draft, X.L. and M.Q.; writing—review & editing, S.Y., W.Z. and J.L. All authors have read and agreed to the published version of the manuscript.

Funding

This research was funded by the Basic Research Program of Qinghai Province (Grant No. 2024-ZJ-702) and the Gansu Province Science and Technology Plan Project (Grant No. 24JRRA292).

Data Availability Statement

Some or all data, models, or code that support the findings of this study are available from the corresponding author upon reasonable request.

Conflicts of Interest

The authors declare that they have no known competing financial interests or personal relationships that could have appeared to influence the work reported in this paper.

References

  1. Hu, S.; Qiu, H.; Wang, N.; Cui, Y.; Wang, J.; Wang, X.; Ma, S.; Yang, D.; Cao, M. The influence of loess cave development upon landslides and geomorphologic evolution: A case study from the northwest Loess Plateau, China. Geomorphology 2020, 359, 107167. [Google Scholar] [CrossRef]
  2. Yuan, K.; Ni, W.; Lü, X.; Zhu, M.; Wang, H.; Nie, Y. Mechanical properties and microstructure evolution of Malan loess. Quat. Int. 2022, 637, 74–84. [Google Scholar] [CrossRef]
  3. Boukhari, M.E.; Merroun, O.; Maalouf, C.; Bogard, F.; Kissi, B. Exploring the impact of partial sand replacement with olive waste on mechanical and thermal properties of sustainable concrete. Clean. Mater. 2023, 9, 100202. [Google Scholar] [CrossRef]
  4. Lian, C.; Zhuge, Y.; Beecham, S. The relationship between porosity and strength for porous concrete. Constr. Build. Mater. 2011, 25, 4294–4298. [Google Scholar] [CrossRef]
  5. Yan, X.; Gong, C.; Wang, S.; Lu, L. Effect of aggregate coating thickness on pore structure features and properties of porous ecological concrete. Mag. Concr. Res. 2019, 65, 962–969. [Google Scholar] [CrossRef]
  6. Kim, H.H.; Park, C.G. Performance evaluation and field application of porous vegetation concrete made with by-product materials for ecological restoration projects. Sustainability 2016, 8, 294. [Google Scholar] [CrossRef]
  7. Zheng, C.; Zhang, Z.; Huang, Z.; Wang, D.; Zhang, W.; Zhou, Z.; Zhu, Y.; Wang, D.; Wang, H.; Jiang, Z. Review of porous vegetation eco-concrete (PVEC) technology: From engineering requirements to material design. Compos. Part B Eng. 2024, 279, 111442. [Google Scholar] [CrossRef]
  8. Barneyback, R.S., Jr.; Diamond, S. Expression and analysis of pore fluids from hardened cement pastes and mortar. Cem. Concr. Res. 1981, 11, 279–285. [Google Scholar] [CrossRef]
  9. Taylor, H.F.; Mohan, K.; Moir, G.K. Analytical study of pure and extended Portland cement pastes: II, fly ash- and slag-cement pastes. J. Am. Ceram. Soc. 1985, 68, 685–690. [Google Scholar] [CrossRef]
  10. Zuo, J.; Zhan, J.; Dong, B.; Luo, C.; Liu, Q.; Chen, D. Preparation of metal hydroxide microcapsules and the effect on pH value of concrete. Constr. Build. Mater. 2017, 155, 323–331. [Google Scholar] [CrossRef]
  11. Cai, X.; Li, F.; Guo, X.; Li, R.; Zhang, Y.; Liu, Q.; Jiang, M. Research Progress of Eco-Friendly Portland Cement Porous Concrete: A Review. J. Renew. Mater. 2023, 11, 103–130. [Google Scholar] [CrossRef]
  12. Tang, W.; Mohseni, E.; Wang, Z. Development of vegetation concrete technology for slope protection and greening. Constr. Build. Mater. 2018, 179, 605–613. [Google Scholar] [CrossRef]
  13. Yang, Z.; He, M.; Wu, Y. Mechanical properties and road performance of slag-fly ash geopolymer stabilized sludge. Bull. Chin. Ceram. Soc. 2022, 41, 693–703. [Google Scholar] [CrossRef]
  14. Singhi, B.; Laskar, A.I.; Ahmed, M.A. Investigation on soil–geopolymer with slag, fly ash and their blending. Arab. J. Sci. Eng. 2016, 41, 393–400. [Google Scholar] [CrossRef]
  15. Al Bakri, A.M.; Kamarudin, H.; Bnhussain, M.; Rafiza, A.; Zarina, Y. Effect of Na2SiO3/NaOH Ratios and NaOH Molarities on Compressive Strength of Fly-Ash-Based Geopolymer. ACI Mater. J. 2012, 109, 503–508. [Google Scholar]
  16. Laskar, A.I.; Bhattacharjee, R. Rheology of Fly-Ash-Based Geopolymer Concrete. ACI Mater. J. 2011, 108, 536–542. [Google Scholar] [CrossRef]
  17. Hossein Rafiean, A.; Najafi Kani, E.; Haddad, A. Mechanical and durability properties of poorly graded sandy soil stabilized with activated slag. J. Mater. Civ. Eng. 2020, 32, 04019324. [Google Scholar] [CrossRef]
  18. Wu, W.; Liang, S.; Zhang, F.; Yan, X.; Zhou, J. Feasibility analysis of loess slope improved by lime pile. Landslide Sci. A Safer Geoenviron. 2014, 2, 129–133. [Google Scholar] [CrossRef]
  19. Pei, X.; Zhang, F.; Wu, W.; Liang, S. Physicochemical and index properties of loess stabilized with lime and fly ash piles. Appl. Clay Sci. 2015, 114, 77–84. [Google Scholar] [CrossRef]
  20. Ivanov, V.; Chu, J. Applications of microorganisms to geotechnical engineering for bioclogging and biocementation of soil in situ. Rev. Environ. Sci. Bio/Technol. 2008, 7, 139–153. [Google Scholar] [CrossRef]
  21. Dejong, J.T.; Fritzges, M.B.; Nuesselein, K. Microbially induced cementation to control sand response to undrained shear. J. Geotech. Geoenviron. Eng. 2006, 132, 1381–1392. [Google Scholar] [CrossRef]
  22. Liu, Y.; Zhang, W.; Liang, X.; Xu, L.; Tang, X.Y. Determination on representative element volume of Nanjing silty-fine sand for its spatial pore structure. Rock Soil Mech. 2019, 40, 2723–2729. [Google Scholar] [CrossRef]
  23. Wang, Z.; Zhang, N.; Ding, J.; Lu, C.; Jin, Y. Experimental study on wind erosion resistance and strength of sands treated with microbial-induced calcium carbonate precipitation. Adv. Mater. Sci. Eng. 2018, 1, 3463298. [Google Scholar] [CrossRef]
  24. Phillips, A.J.; Cunningham, A.B.; Gerlach, R.; Hiebert, R.; Hwang, C.; Lomans, B.P.; Westrich, J.; Mantilla, C.; Kirksey, J.; Esposito, R.; et al. Fracture sealing with microbially-induced calcium carbonate precipitation: A field study. Environ. Sci. Technol. 2016, 50, 4111–4117. [Google Scholar] [CrossRef] [PubMed]
  25. Chen, Y.; Tan, L.; Xiao, N.; Liu, K.; Jia, P.; Zhang, W. The hydro-mechanical characteristics and micro-structure of loess enhanced by microbially induced carbonate precipitation. Geomech. Energy Environ. 2023, 34, 100469. [Google Scholar] [CrossRef]
  26. Zhang, M.; Feng, C.; He, X.; Xu, P. Analysis of the microstructure of microbial solidified sand and engineering residue based on CT scanning. Biogeotechnics 2024, 2, 100054. [Google Scholar] [CrossRef]
  27. Wang, S.; Li, V.C. Engineered Cementitious Composites with High-Volume Fly Ash. ACI Mater. J. 2007, 104, 233–241. [Google Scholar] [CrossRef] [PubMed]
  28. GB/T 50082-2009; Standard for Test Methods of Long-Term Performance and Durability of Ordinary Concrete. Architecture Publishing & Media Co., Ltd.: Beijing, China, 2009.
  29. Guo, S.; Li, Z.; Fa, W. Scientific management and standardized operation of field emission scanning electron microscopy. Phys. Test. Chem. Anal. (Part A Phys. Test.) 2024, 60, 20–23+28. [Google Scholar] [CrossRef]
  30. CJJ/T 253-2016; Technical Specification for Application of Pervious Recycled Aggregate Concrete. Architecture Publishing & Media Co., Ltd.: Beijing, China, 2016.
  31. GB/T 50081-2019; Standard for Test Methods of Concrete Physical and Mechanical Properties. Architecture Publishing & Media Co., Ltd.: Beijing, China, 2019.
  32. Wang, Y.; Jin, Z.; Liu, S.; Yang, L.; Luo, S. Physical filling effect of aggregate micro fines in cement concrete. Constr. Build. Mater. 2013, 41, 812–814. [Google Scholar] [CrossRef]
Figure 1. Schematic diagram of the test process.
Buildings 15 02531 g001
Figure 2. The change of the permeability coefficient of LCPC under different porosities.
Buildings 15 02531 g002
Figure 3. Planting effect of LCPC under different porosity.
Buildings 15 02531 g003
Figure 4. Mass loss rate change curve.
Buildings 15 02531 g004
Figure 5. Relative dynamic elastic modulus change curve.
Buildings 15 02531 g005
Figure 6. Change curve of compressive strength loss rate.
Buildings 15 02531 g006
Figure 7. Relative mass change curve.
Buildings 15 02531 g007
Figure 8. Mass change curve.
Buildings 15 02531 g008
Figure 9. Change curve of erosion coefficient of compressive strength.
Buildings 15 02531 g009
Figure 10. Curve of compressive strength change.
Buildings 15 02531 g010
Figure 11. Morphology of LCPC with fly ash.
Buildings 15 02531 g011
Figure 12. Morphology of LCPC with slag powder.
Buildings 15 02531 g012
Figure 13. Morphology of LCPC under different water-cement ratios.
Buildings 15 02531 g013
Table 1. Chemical composition of cement.
CompoundSiO2Al2O3Fe2O3CaOMgOK2ONa2OOthers
Content/%26.16.34.058.22.10.80.12.4
Table 2. Chemical composition of fly ash.
CompoundNa2OMgOAl2O3SiO2SO3K2OCaOFe2O3Others
Content/%0.600.2028.1059.500.380.601.405.204.02
Table 3. Chemical composition of slag powder.
CompoundNa2OMgOAl2O3SiO2SO3K2OCaOFe2O3Others
Content/%6.2117.6034.20.5134.001.116.37
Table 4. Chemical composition of loess.
CompoundSiO2Fe2O3Al2O3CaOMgOK2Oelse
Content/%58.334.1411.877.331.2317.10
Table 5. Water permeability coefficient and planting test group.
GroupsTarget
Porosity
Coal GangueWaterLoessFly AshSlag PowderCementWater Reducer
115%24%18%28.3%4.2%5.70%4.22%0.58%
220%22%17%26.4%3.9%5.26%3.9%0.54%
325%21%16%25.0%3.75%5.00%3.75%0.5%
Table 6. Durability test groups.
GroupsTarget
Porosity
Coal GangueWaterLoessFly AshSlag PowderCementWater Reducer
125%21%16%28.8%1.44%2.88%4.31%0.57%
225%21%16%27.7%1.37%4.15%4.15%0.54%
325%21%16%26.7%1.33%5.34%4.00%0.54%
425%21%16%27.7%2.78%2.78%4.17%0.56%
525%21%16%26.7%2.67%4.00%4.00%0.53%
625%21%16%25.8%2.60%5.18%3.89%0.53%
725%21%16%26.7%4.00%2.68%4.00%0.53%
825%21%16%25.8%3.89%3.89%3.89%0.53%
925%21%16%25.0%3.75%5.00%3.75%0.5%
1025%21%16%32.2%0%0%5.1%0.70%
Table 7. Test groups under scanning electron microscope.
GroupsTarget
Porosity
Water-
Cement Ratio
CementWater
Reducer
Fly
Ash
Slag
Powder
125%0.3915%2.0%0%0%
225%0.4215%2.0%0%0%
325%0.4515%2.0%0%0%
425%0.4215%2.0%5%0%
525%0.4215%2.0%10%0%
625%0.4215%2.0%15%0%
725%0.4215%2.0%0%10%
825%0.4215%2.0%0%15%
925%0.4215%2.0%0%20%
Disclaimer/Publisher’s Note: The statements, opinions and data contained in all publications are solely those of the individual author(s) and contributor(s) and not of MDPI and/or the editor(s). MDPI and/or the editor(s) disclaim responsibility for any injury to people or property resulting from any ideas, methods, instructions or products referred to in the content.

