Article

Cable Force Optimization in Cable-Stayed Bridges Using Gaussian Process Regression and an Enhanced Whale Optimization Algorithm

1
Guangxi Communications Investment Group Corporation Ltd., Nanning 530022, China
2
School of Civil Engineering and Architecture, Guangxi University, Nanning 530004, China
3
Sinoma Wind Power Blade (FuNing) Co., Ltd., Funing 224400, China
4
Department of Construction Management, Chongqing University, Chongqing 400045, China
5
College of Civil and Transportation Engineering, North China University of Water Resources and Electric Power, Zhengzhou 450045, China
*
Author to whom correspondence should be addressed.
Buildings 2025, 15(14), 2503; https://doi.org/10.3390/buildings15142503
Submission received: 21 May 2025 / Revised: 30 June 2025 / Accepted: 15 July 2025 / Published: 16 July 2025
(This article belongs to the Special Issue Experimental and Theoretical Studies on Steel and Concrete Structures)

Abstract

Optimizing cable forces in cable-stayed bridges is challenging due to structural nonlinearity and the limitations of traditional methods, which often focus on isolated performance indicators. This study proposes an integrated framework combining Gaussian process regression (GPR) with an enhanced whale optimization algorithm improved by the Salp Swarm Algorithm (EWOSSA). GPR is first used to model the nonlinear relationship between cable forces and structural responses. The EWOSSA then efficiently optimizes the GPR-based model to identify optimal cable forces. A case study on a cable-stayed bridge with a 2 × 145 m main spans demonstrates the effectiveness of the proposed approach. Compared with conventional methods such as the internal-force equilibrium and zero-displacement methods, the EWOSSA-GPR framework achieves superior performance across multiple structural metrics. It ensures a more uniform cable force distribution, reduces girder displacements, and improves bending moment profiles, offering a comprehensive solution for optimal structural performance in cable-stayed bridges.

1. Introduction

Cable-stayed bridges represent a preferred structural solution for long-span applications due to their exceptional spanning capacity, structural adaptability, and aesthetic qualities, which meet modern transportation demands [1] better than traditional girder bridges [2,3]. In the structural design process, two interdependent parameters govern as-built performance: the cable-stayed system configuration and the optimization of cable forces. For example, research by Zhang et al. [4] provides vital insights into the flexural performance of composite beams under cyclic loading, and Yang et al. [5] conducted in-depth experimental and numerical studies on the complex mechanics of arch-beam joints in arch bridges. When geometric configuration and load distribution are predetermined through preliminary design, cable forces emerge as the key adjustable parameter controlling both the global geometry and internal-force equilibrium of the bridge superstructure [6]. Therefore, determining optimal cable forces becomes critical for achieving structural efficiency and serviceability [7].
The optimization of cable forces in cable-stayed bridges typically involves two essential steps: first, establishing a quantitative relationship between cable force variations and the resulting structural responses, and second, applying constrained optimization algorithms to determine optimal values. This integrated approach enables engineers to meet multiple design objectives, such as minimizing stress and deformation, while ensuring constructability and structural safety.
Researchers have developed various theoretical models to establish correlations between cable forces and structural behavior, based on either global structural response or specific component behavior [8,9]. These models create functional mappings linking cable forces with performance indicators, including relationships between cable forces and structural displacement, bending moments, support reactions, and bending strain energy. For example, Wang et al. [10] proposed the zero-displacement method, which relates cable forces to the vertical displacements at the cable–girder connection points. By expressing these displacements as functions of the cable forces, the method identifies the optimal forces that minimize vertical displacement under the bridge’s self-weight. Similarly, Chen et al. [11] introduced the moment equilibrium method, relating cable forces to the main girder bending moment, allowing calculation of initial prestressing forces to ensure moment equilibrium under dead load. In another approach, Song et al. [12] developed a method linking cable forces to structural bending strain energy, determining optimal values by minimizing strain energy while constraining tower displacements.
Despite significant progress in developing these mapping relationships [13,14,15], several limitations persist due to the inherent complexities of cable-stayed bridge mechanics. The commonly used influence matrix method assumes a simplified linear relationship between cable forces and structural responses, thereby neglecting nonlinear structural behavior [16]. While widely applied, the zero-displacement method and rigid continuous girder method often overlook forces acting on towers and require multiple iterations, reducing computational efficiency [17]. The moment equilibrium method effectively eliminates the bending moment caused by self-weight, but inadequately addresses load redistribution on bridge towers. Although researchers have attempted to refine existing approaches [18,19,20], deriving precise analytical expressions remains challenging due to structural complexity. These expressions tend to be overly complicated, hampering both the speed and effectiveness of the optimization process, creating a need for alternative approaches.
Machine learning [21] offers a promising solution by enabling the establishment of input–output mappings from limited data without requiring detailed structural modeling or extensive domain-specific knowledge. Machine learning models generate simpler, computationally efficient expressions, aiding both in the creation of mapping relationships and the performance of optimization. Artificial intelligence (AI) and deep learning (DL) are increasingly applied to complex engineering problems characterized by high-dimensional parameter spaces and strong nonlinearities, such as optimizing cable force distributions in structural systems. For instance, Zhao et al. [22] developed a sophisticated surrogate model combining supervised kernel principal component analysis with polynomial chaos and Kriging to effectively handle high-dimensional optimization challenges, demonstrating the ongoing drive to improve the accuracy and efficiency of such methods in complex engineering domains. Cross-disciplinary adaptations include using Generative Adversarial Networks (GANs) for structural geometry reconstruction [23], applying medical signal-processing techniques to extract functional relationships from noisy, high-dimensional data [24], and leveraging spatio-temporal pattern analysis from epidemiology to model force distributions under varying loads [25]. Similarly, hybrid intrusion-detection models demonstrate the power of combining complementary algorithms [26].
Regarding optimization methods, gradient-based approaches were initially used for convex optimization but often yielded unsatisfactory results for non-convex problems. With the advancement of optimization theory, metaheuristic algorithms [27] such as Particle Swarm Optimization (PSO) [28], the Grey Wolf Optimizer (GWO) [29], as well as the further improved algorithms [30,31,32] have demonstrated significant advantages, including a broader search scope, robust optimization capabilities, and enhanced results compared to gradient-based methods. Consequently, these approaches have been gradually adopted in cable-stayed bridge cable force optimization. Chen et al. [33] employed PSO to optimize main girder and bridge tower displacements to determine optimal cable forces. Jiang and Zhu [34] improved the traditional PSO algorithm and applied it to optimize bending strain energy, achieving better results. Sung et al. [35] combined PSO and Simulated Annealing to improve genetic algorithms (GAs), verifying their effectiveness in asymmetric double-span cable-stayed bridge construction. Hassan [36] and Hassan et al. [37] combined B-spline techniques, finite element analysis, and GAs to optimize cable forces and extend optimization to girder section sizing, significantly improving stress conditions compared to traditional gradient methods.
This paper proposes an optimization method for cable-stayed bridge cable forces, integrating Gaussian process regression (GPR) with an enhanced whale optimization algorithm (EWOSSA). The proposed approach constructs a nonlinear mathematical model linking cable forces to the structural state using Gaussian process regression and then applies the enhanced whale optimization algorithm to obtain the optimal solutions.
Specifically, this EWOSSA-GPR framework is designed to overcome the key limitations of traditional methods. Unlike conventional methods that assume linearity or require intensive iterations, our GPR-based approach accurately models the nonlinear relationship between cable forces and structural responses without needing an explicit analytical function. This surrogate model is then efficiently optimized by the EWOSSA, which is engineered for robust global search, thereby avoiding the high computational cost associated with direct finite element analysis within an optimization loop.
The primary contribution of this work is the development of an integrated framework that achieves a more balanced and comprehensive structural optimization. Unlike methods that target isolated performance indicators, the EWOSSA-GPR approach provides a holistic solution that concurrently improves cable force distribution, reduces girder displacements, and optimizes bending moment profiles, demonstrating superior overall performance. This machine learning approach offers a promising framework for optimizing similar engineering projects in the future.

2. Proposed Method: GPR-Based Modeling and EWOSSA Optimization

2.1. Gaussian Process Regression (GPR)

Gaussian process regression (GPR) [38,39,40] is a non-parametric, probabilistic modeling technique that excels in capturing complex, nonlinear relationships without requiring an explicit functional form. In the context of cable-stayed bridges, GPR is particularly suitable for modeling the intricate relationship between cable forces and structural response parameters. A Gaussian process is defined as a collection of random variables, any finite number of which follow a joint Gaussian distribution. Its general form can be expressed as
y = f ( x )
where x∈Rn×m denotes the n × m matrix of cable forces, and y∈R1 represents the corresponding n-dimensional vector of structural response parameters.
GPR does not attempt to explicitly define the functional form f(⋅). Instead, it models the functional relationship implicitly through learning and inference based on the Gaussian process.
The prior distribution of the structural response y is given by
y N ( m ( x ) , k ( x , x ) )
To predict the structural response y* corresponding to a new set of cable forces x*, the joint Gaussian prior is utilized over both the observed data and the prediction targets:
y y 0 , k ( x , x ) k ( x , x * ) k ( x , x * ) k ( x * , x * )
where k(x,x) denotes the covariance matrix of the existing input data, capturing the strength of correlation among cable force samples. k(x,x*) = k(x,x*)T signifies the covariance matrix between the existing cable forces input x and the cable forces input to be predicted x*. k(x,x*) represents the self-covariance, or variance, of the new input x*.
Given the training samples (x,y) and a new input x*, the posterior distribution for the predicted response y* is obtained as
y * N ( m ( y * ) , k ( y * , y * ) )
m ( y * ) = k ( x * , x ) k ( x , x ) 1 y
k ( y * , y * ) = k ( x * , x * ) k ( x * , x ) k ( x , x ) 1 k ( x * , x ) T
where m(y*) represents the predictive mean and k(y*,y*) the predictive variance.
The accuracy of GPR depends heavily on the choice of covariance function and the values of its associated hyperparameters. These hyperparameters are typically estimated by maximizing the marginal likelihood of the training data.
Assuming a set of hyperparameters θ = {θ1, θ2, …, θn}, the Bayesian formulation yields
p ( y | x ) = p ( y | x , θ i ) p ( θ i )
p ( θ | x , θ ) = p ( y | x , θ ) p ( θ ) p ( y | x )
where p(y|x, θ) refers to the marginal likelihood function, and taking its logarithm gives the log-likelihood function:
log ( p ( y | x , θ ) ) = 1 2 y T ( k ( x , x ) ) 1 y 1 2 log k ( x , x ) n 2 log ( 2 π )
To ensure that predictions align closely with the observed data, it is essential to maximize the log-likelihood function. Traditional approaches often rely on gradient-based methods for this purpose. However, these methods require the objective function to be smooth and unimodal, and their performance can be highly sensitive to the initial values. In the presence of multiple local optima, gradient methods may converge to suboptimal solutions, resulting in decreased prediction accuracy.
To address these limitations, alternative optimization strategies are necessary—this motivates the integration of EWOSSA, discussed in the next section.

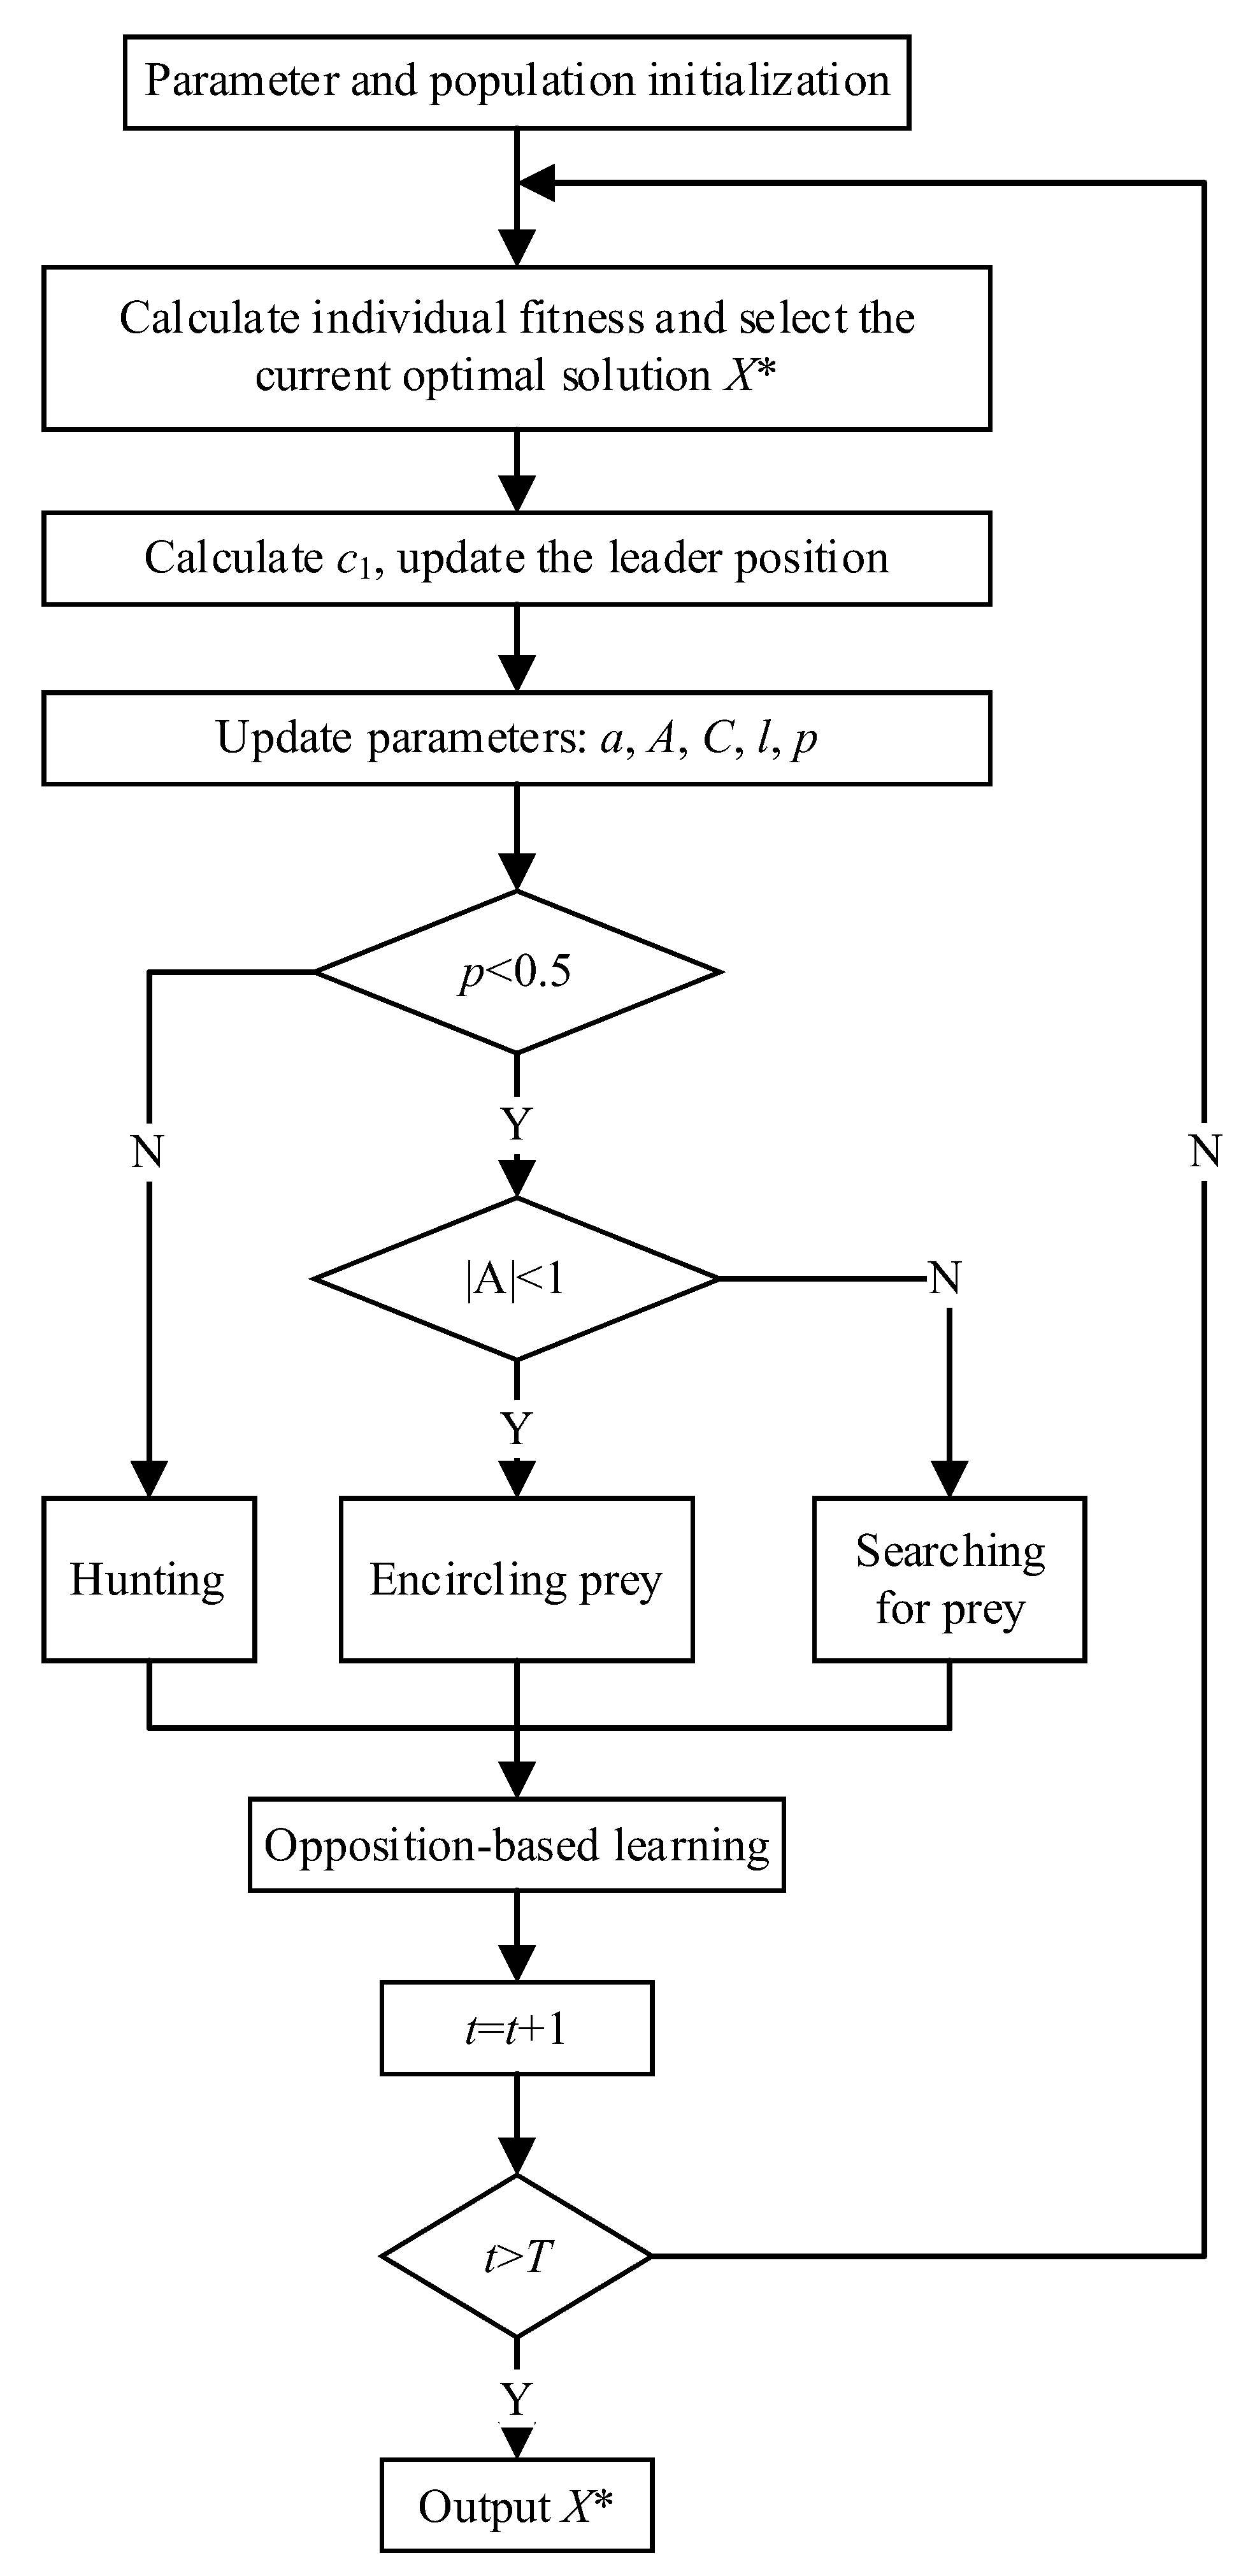
2.2. Enhanced Whale Optimization Algorithm with Salp Swarm Algorithm (EWOSSA)

The whale optimization algorithm (WOA) [41] is a nature-inspired metaheuristic that simulates the predation behavior of humpback whales. By modeling behaviors such as spiral hunting and dynamic encircling, the WOA provides a simple yet powerful search mechanism with few parameters and strong global search capabilities. However, the WOA tends to suffer from local convergence and slow optimization speed in complex, high-dimensional problems.
To address these limitations, an enhanced whale optimization algorithm integrated with the Salp Swarm Algorithm (EWOSSA) is proposed. This hybrid method combines the global search advantages of the SSA [42] with the WOA’s exploitation capability, and further incorporates the Lens Opposition-based Learning (LOBL) strategy [43,44] to enhance population diversity and convergence robustness.
The specific optimization process unfolds as follows.

2.2.1. Encircling Prey Mechanism

Given the unknown optimal location within the search space, it is assumed that the current local optimal location represents the target prey location. In this scenario, the other whales within the group attempt to encircle the prey, leading to updates in the whale group positions as follows:
D = C X * ( t ) X
X ( t + 1 ) = X * ( t ) A D
where t is the current iteration number, X* is the best solution found so far, X represents the position of the current solution, and indicates the norm. A and C are coefficients, defined as
A = 2 a r a
C = 2 r
where a is a convergence factor that linearly decreases from 2 to 0, and r is a random number in the range [0, 1].

2.2.2. Bubble-Net Attacking Mechanism

The hunting strategy of humpback whales features a distinctive bubble-net technique that provides a valuable optimization model. During this process, whales encircle their prey using a spiral swimming pattern that can be mathematically represented by a logarithmic spiral equation:
X ( t + 1 ) = D e b l cos ( 2 π l ) + X * ( t )
where D′ = |X*(t) − X(t)| denotes the distance between the optimal solution (X*) and the current position (X) at iteration t. The parameter b controls the shape of the logarithmic spiral, while l is a random value in the range [−1, 1].
This spiral movement pattern effectively simulates the search behavior in our optimization framework. As whales navigate toward their prey, they continuously update their positions, balancing between a direct approach and a spiral movement. The algorithm implements this behavior through the following position update mechanism:
X ( t + 1 ) = X * ( t ) A D p < 0.5 D e b l cos ( 2 π l ) + X * ( t ) p 0.5
where p represents a random probability value between 0 and 1, determining whether the algorithm pursues the direct approach or spiral update strategy at each iteration.

2.2.3. Global Exploration Strategy

To further enhance the global search capabilities of the WOA, a mechanism based on the control vector A is introduced during the exploration phase. When the absolute value of A exceeds 1, the algorithm shifts from local exploitation to global exploration. In this scenario, instead of moving toward the current best solution, each whale updates its position based on a randomly selected individual from the population. This strategy diversifies the search behavior and helps avoid premature convergence, especially in high-dimensional optimization problems with complex constraints.
The position update during global exploration is governed by the following equations:
D = | C X r a n d ( t ) X ( t ) |
X ( t + 1 ) = X r a n d ( t ) A D
where D’ denotes the distance between the current individual and a randomly chosen individual, and Xrand(t) is the position of that randomly selected individual at iteration t.

2.2.4. Population Diversity Enhancements

In the basic WOA framework, randomly generated solutions tend to converge toward local optima during iteration, potentially trapping the entire population in suboptimal regions. Three enhancement strategies address this limitation: (1) updating the leader position using Salp Swarm Algorithm (SSA) formulations before each iteration, (2) implementing a nonlinear control parameter c1 during position adjustment, and (3) applying the Lens Opposition-based Learning (LOBL) strategy after each iteration to evaluate opposite positions relative to the current best solution.
These enhancements operate in three phases:
Encircling phase:
X ( t + 1 ) = c 1 X * ( t ) A D
Hunting phase:
X ( t + 1 ) = D e b l cos ( 2 π l ) + c 1 X * ( t )
Opposition-based learning phase:
X i * = l b i + u b i 2 + l b i + u b i 2 k x k
Figure 1 illustrates the complete EWOSSA procedure.

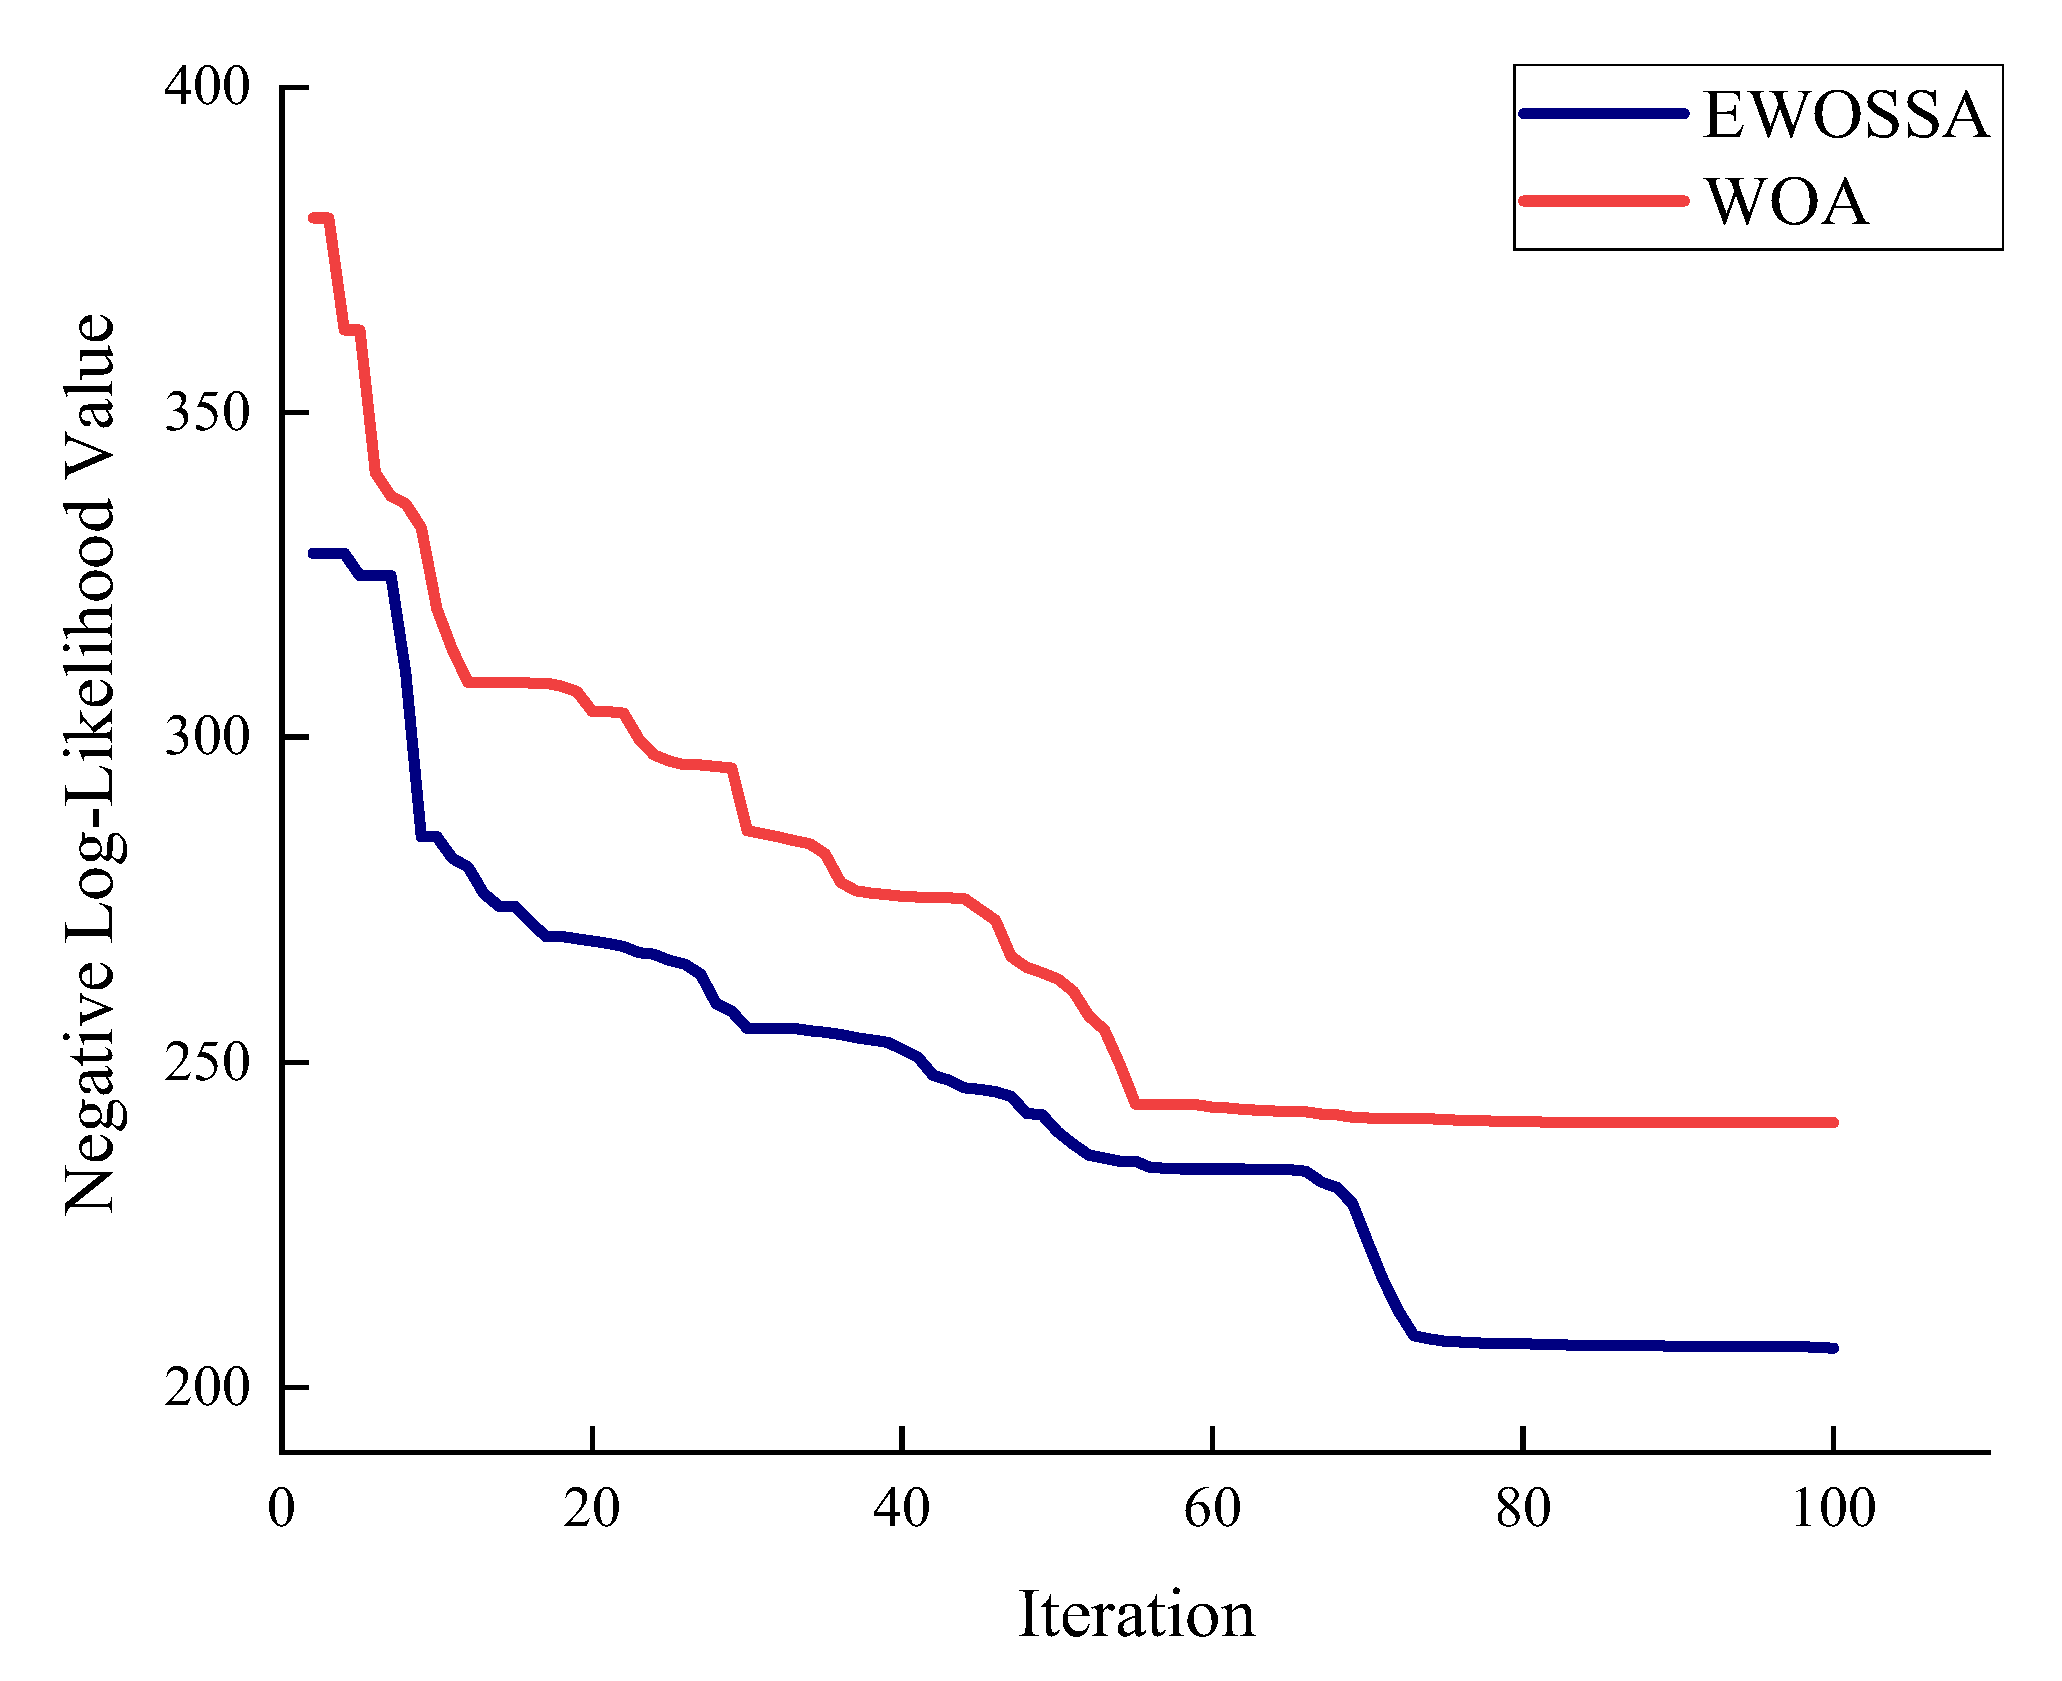
2.2.5. Validation of the Enhanced Algorithm

To evaluate the performance improvements of the proposed EWOSSA, benchmark tests were conducted using two standard functions [45] characterized by multiple local extrema across expansive search spaces:
m i n f 1 ( x i ) = i = 1 n [ x i 2 10 cos ( 2 π x i ) + 10 ] x i [ 5.12 , 5.12 ]
m i n f 2 ( x i ) = i = 1 n x i sin | x i | x i [ 500 , 500 ]
As seen in Figure 2, these test functions feature multiple extrema, and their high dimensionality and wide parameter ranges demand optimization algorithms with strong capabilities in search range coverage, convergence speed, and ability to escape local optima. For both functions, the dimensionality of independent variables is set as n = 10. The global minimum value of function f1 is 0, while the global minimum of function f2 is −418.9829 × n = −4189.829.
The performances of three algorithms are compared: the standard whale optimization algorithm (WOA), the standard Salp Swarm Algorithm (SSA), and the proposed EWOSSA. Figure 3 presents the iteration convergence curves, while Table 1 displays the final optimization results.
The results demonstrate that the EWOSSA outperforms both the WOA and the SSA across all optimization stages:
  • In the early stage, the EWOSSA benefits from the SSA leader position updating mechanism, providing the population with superior guidance and a more accurate optimization direction. This results in a better initial convergence path and faster optimization progress.
  • During the middle optimization period, the nonlinear parameter c1 from the SSA transforms the position updating process from linear to nonlinear, effectively expanding the search range and improving exploration.
  • In the later optimization stages, the Lens Opposition-based Learning strategy helps the current optimal solution escape local optima, allowing continued progress toward the global optimum.
For function f1, both the WOA and EWOSSA achieved the theoretical minimum value of 0, while the SSA converged to a suboptimal solution. For the more complex function f2, the EWOSSA achieved a value of −4187.55, significantly closer to the theoretical minimum (−4189.829) than either the WOA (−3510.35) or the SSA (−2867.13).
These benchmark results confirm that the EWOSSA effectively integrates the strengths of both parent algorithms while addressing their limitations through the addition of the Lens Opposition-based Learning strategy.

3. Optimizing Cable Forces Using EWOSSA-GPR

While focusing on specific performance metrics like maximum displacement or stress can improve localized structural conditions, this approach often fails to adequately control the overall stress distribution across the bridge. Bending strain energy provides a more comprehensive measure as it incorporates the stiffness properties of both the main girder and tower, effectively representing the internal forces and displacements throughout the entire structure. This paper, therefore, adopts bending strain energy as the primary optimization criterion for cable forces in cable-stayed bridges.

3.1. Mathematical Framework and Constraints

The optimization process occurs in two phases. First, a Gaussian process regression (GPR) model is established that correlates cable forces to the bending strain energy of the girder. The hyperparameters of the covariance function are determined by minimizing the negative log-likelihood function:
F i n d θ min ( l o g ( p ( y | x , θ ) ) )
After establishing these hyperparameters, the EWOSSA is employed to optimize the GPR model. This enables us to identify the cable force configuration that minimizes bending strain energy. The optimization model is formulated as
F i n d X = ( x 1 , x 2 , , x i ) T min U = f ( x ) s . t . i = 1 j x i + 1 x i x i + 1 2 Δ x min x i x max
where X represents the input of cable forces to be optimized; U = f(x) is an expression of the GPR model that relates cable forces to bending strain energy. Δ indicates the evaluation threshold of cable force uniformity; xmin and xmax indicate the lower and upper limits of cable forces.

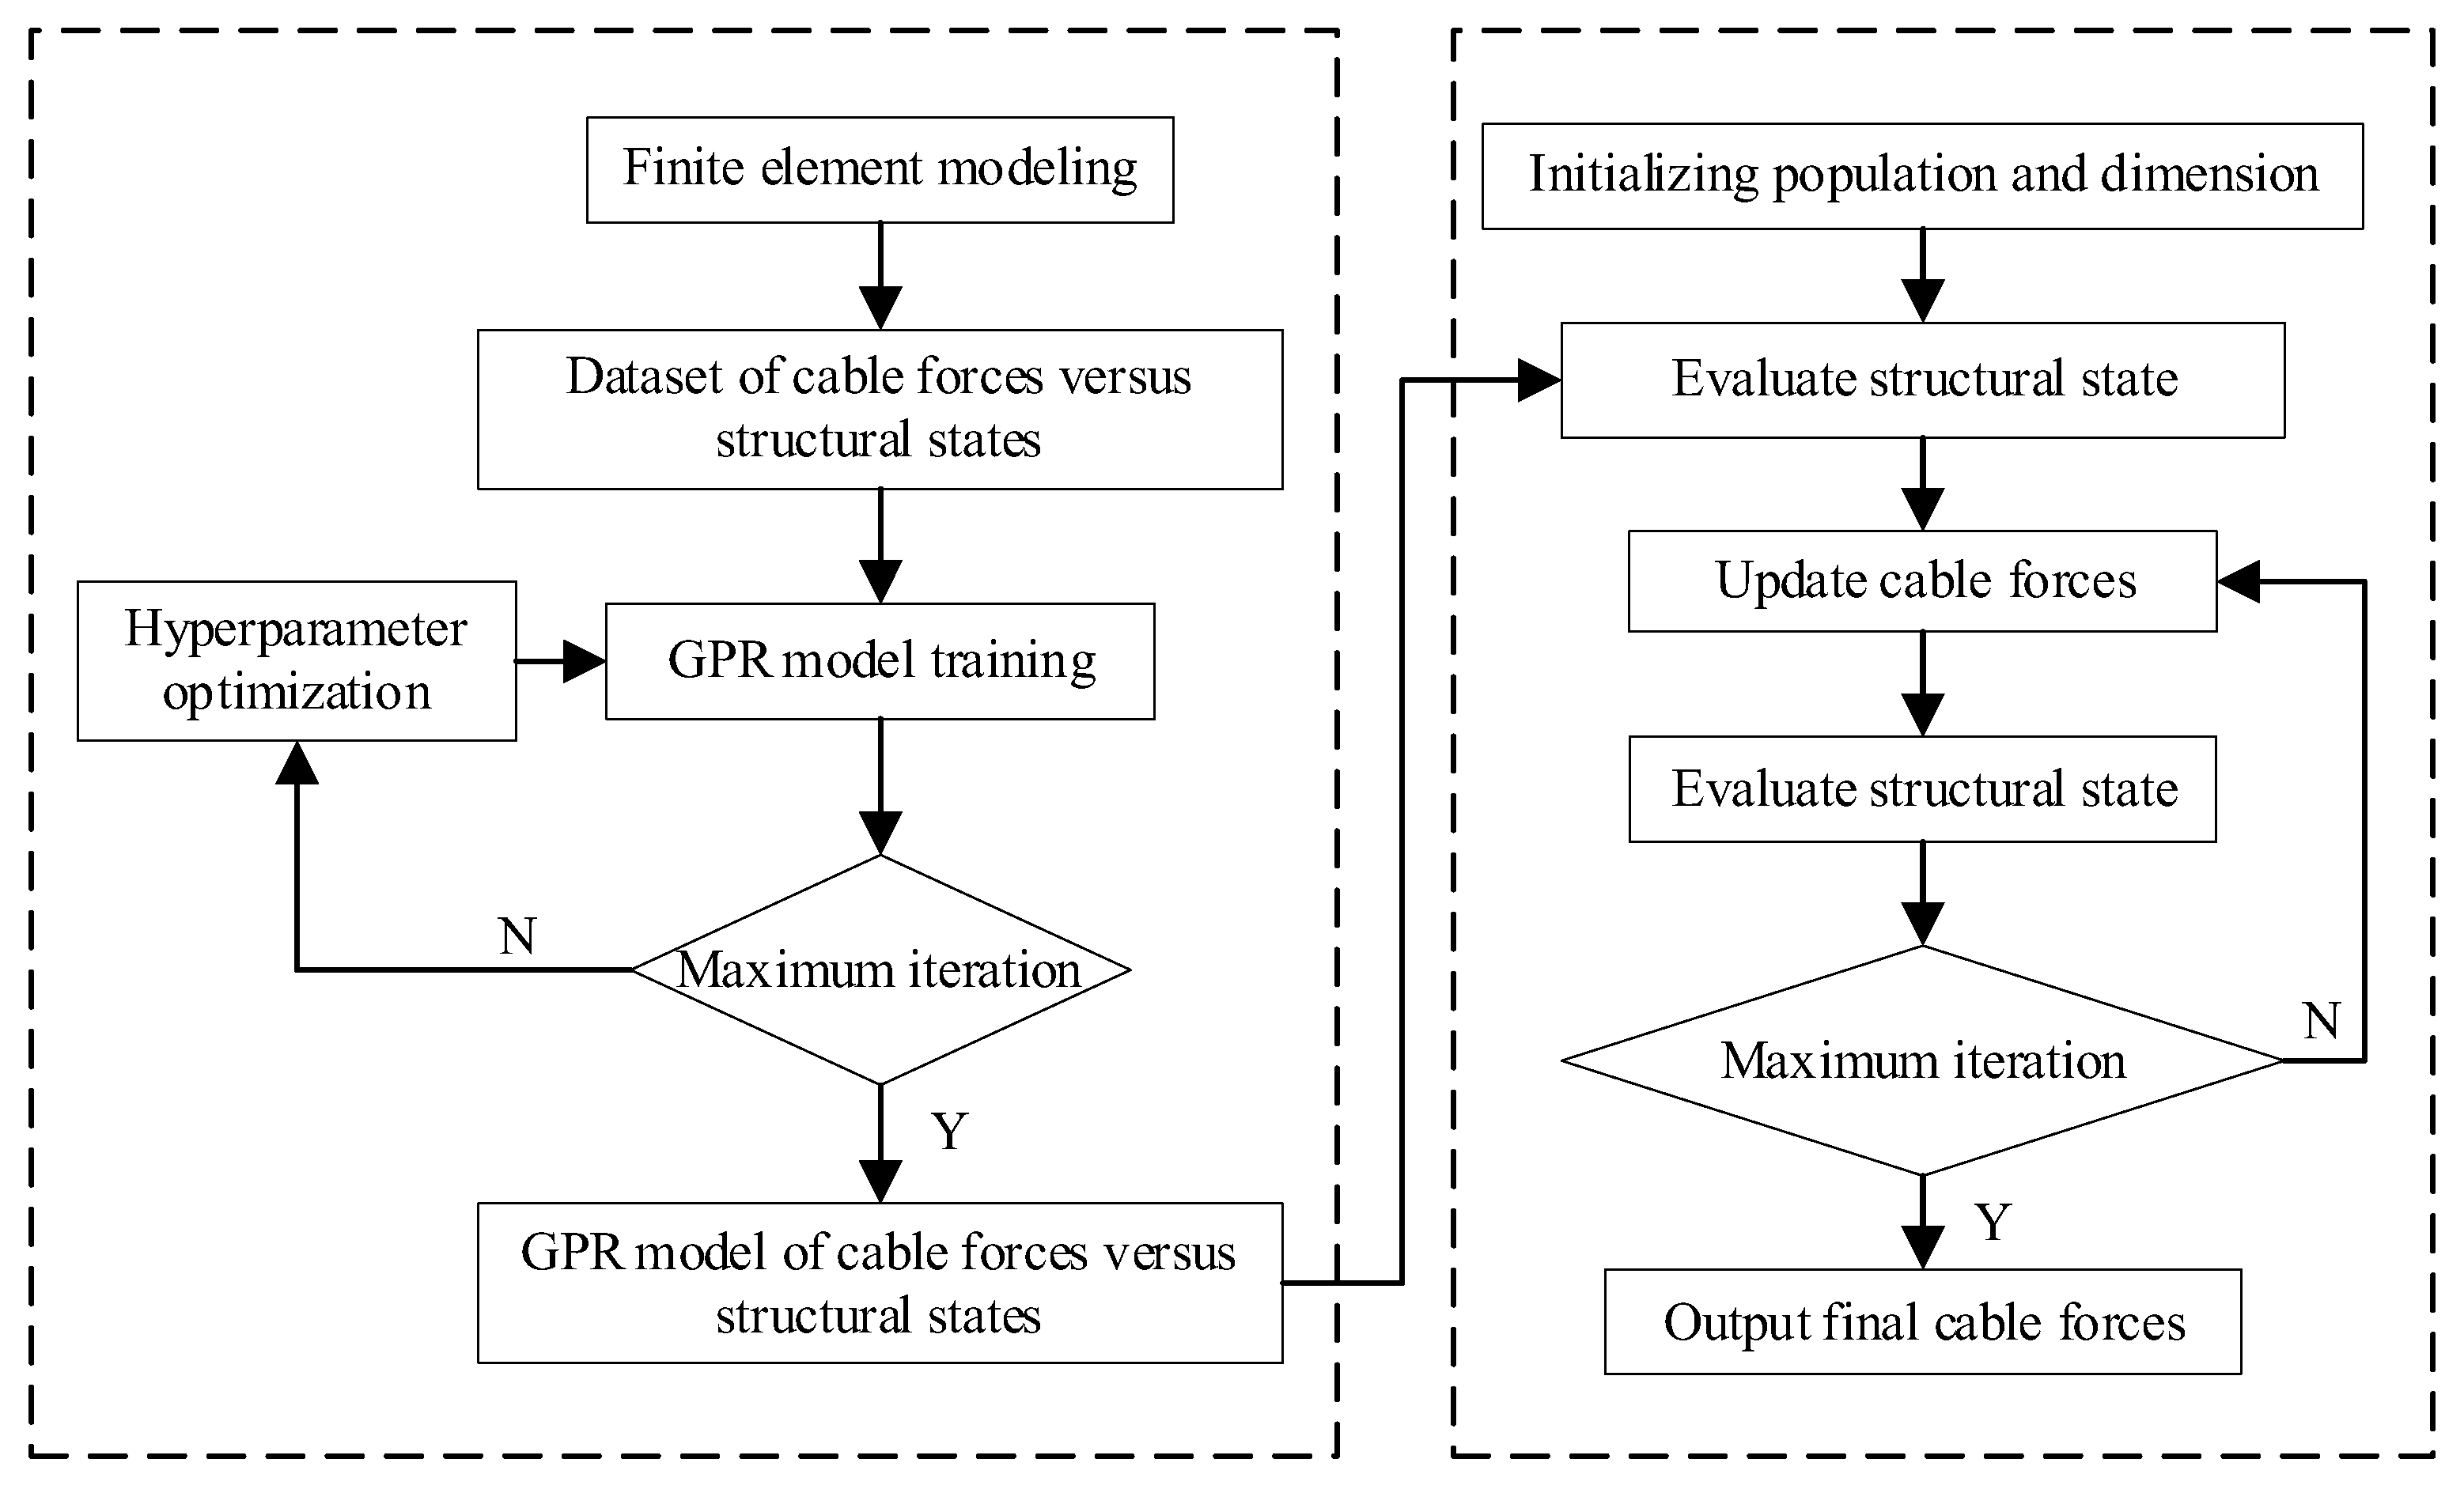
3.2. Optimization Process

The optimization process for cable forces in cable-stayed bridges using the Gaussian process regression (GPR) model and EWOSSA consists of two primary phases (as seen in Figure 4):
  • Phase 1: GPR Model Development. Initially, a GPR model is established that correlates cable forces with bending strain energy. Sample points for cable forces are selected using Latin hypercube sampling, ranging from initial to design cable force values. Corresponding bending strain energy values are calculated through finite element analysis, creating a comprehensive dataset. This dataset is then used to train the GPR model, with its hyperparameters optimized by applying the EWOSSA to maximize the likelihood function.
  • Phase 2: Cable Force Optimization. Following model development, the cable forces are optimized based on the established GPR model. The EWOSSA is employed to identify the cable force combination that minimizes bending strain energy. This approach enables efficient determination of optimal cable forces without requiring extensive computational resources.
Figure 4. Flowchart detailing the integrated GPR model development and optimization process.
Buildings 15 02503 g004

4. Case Study

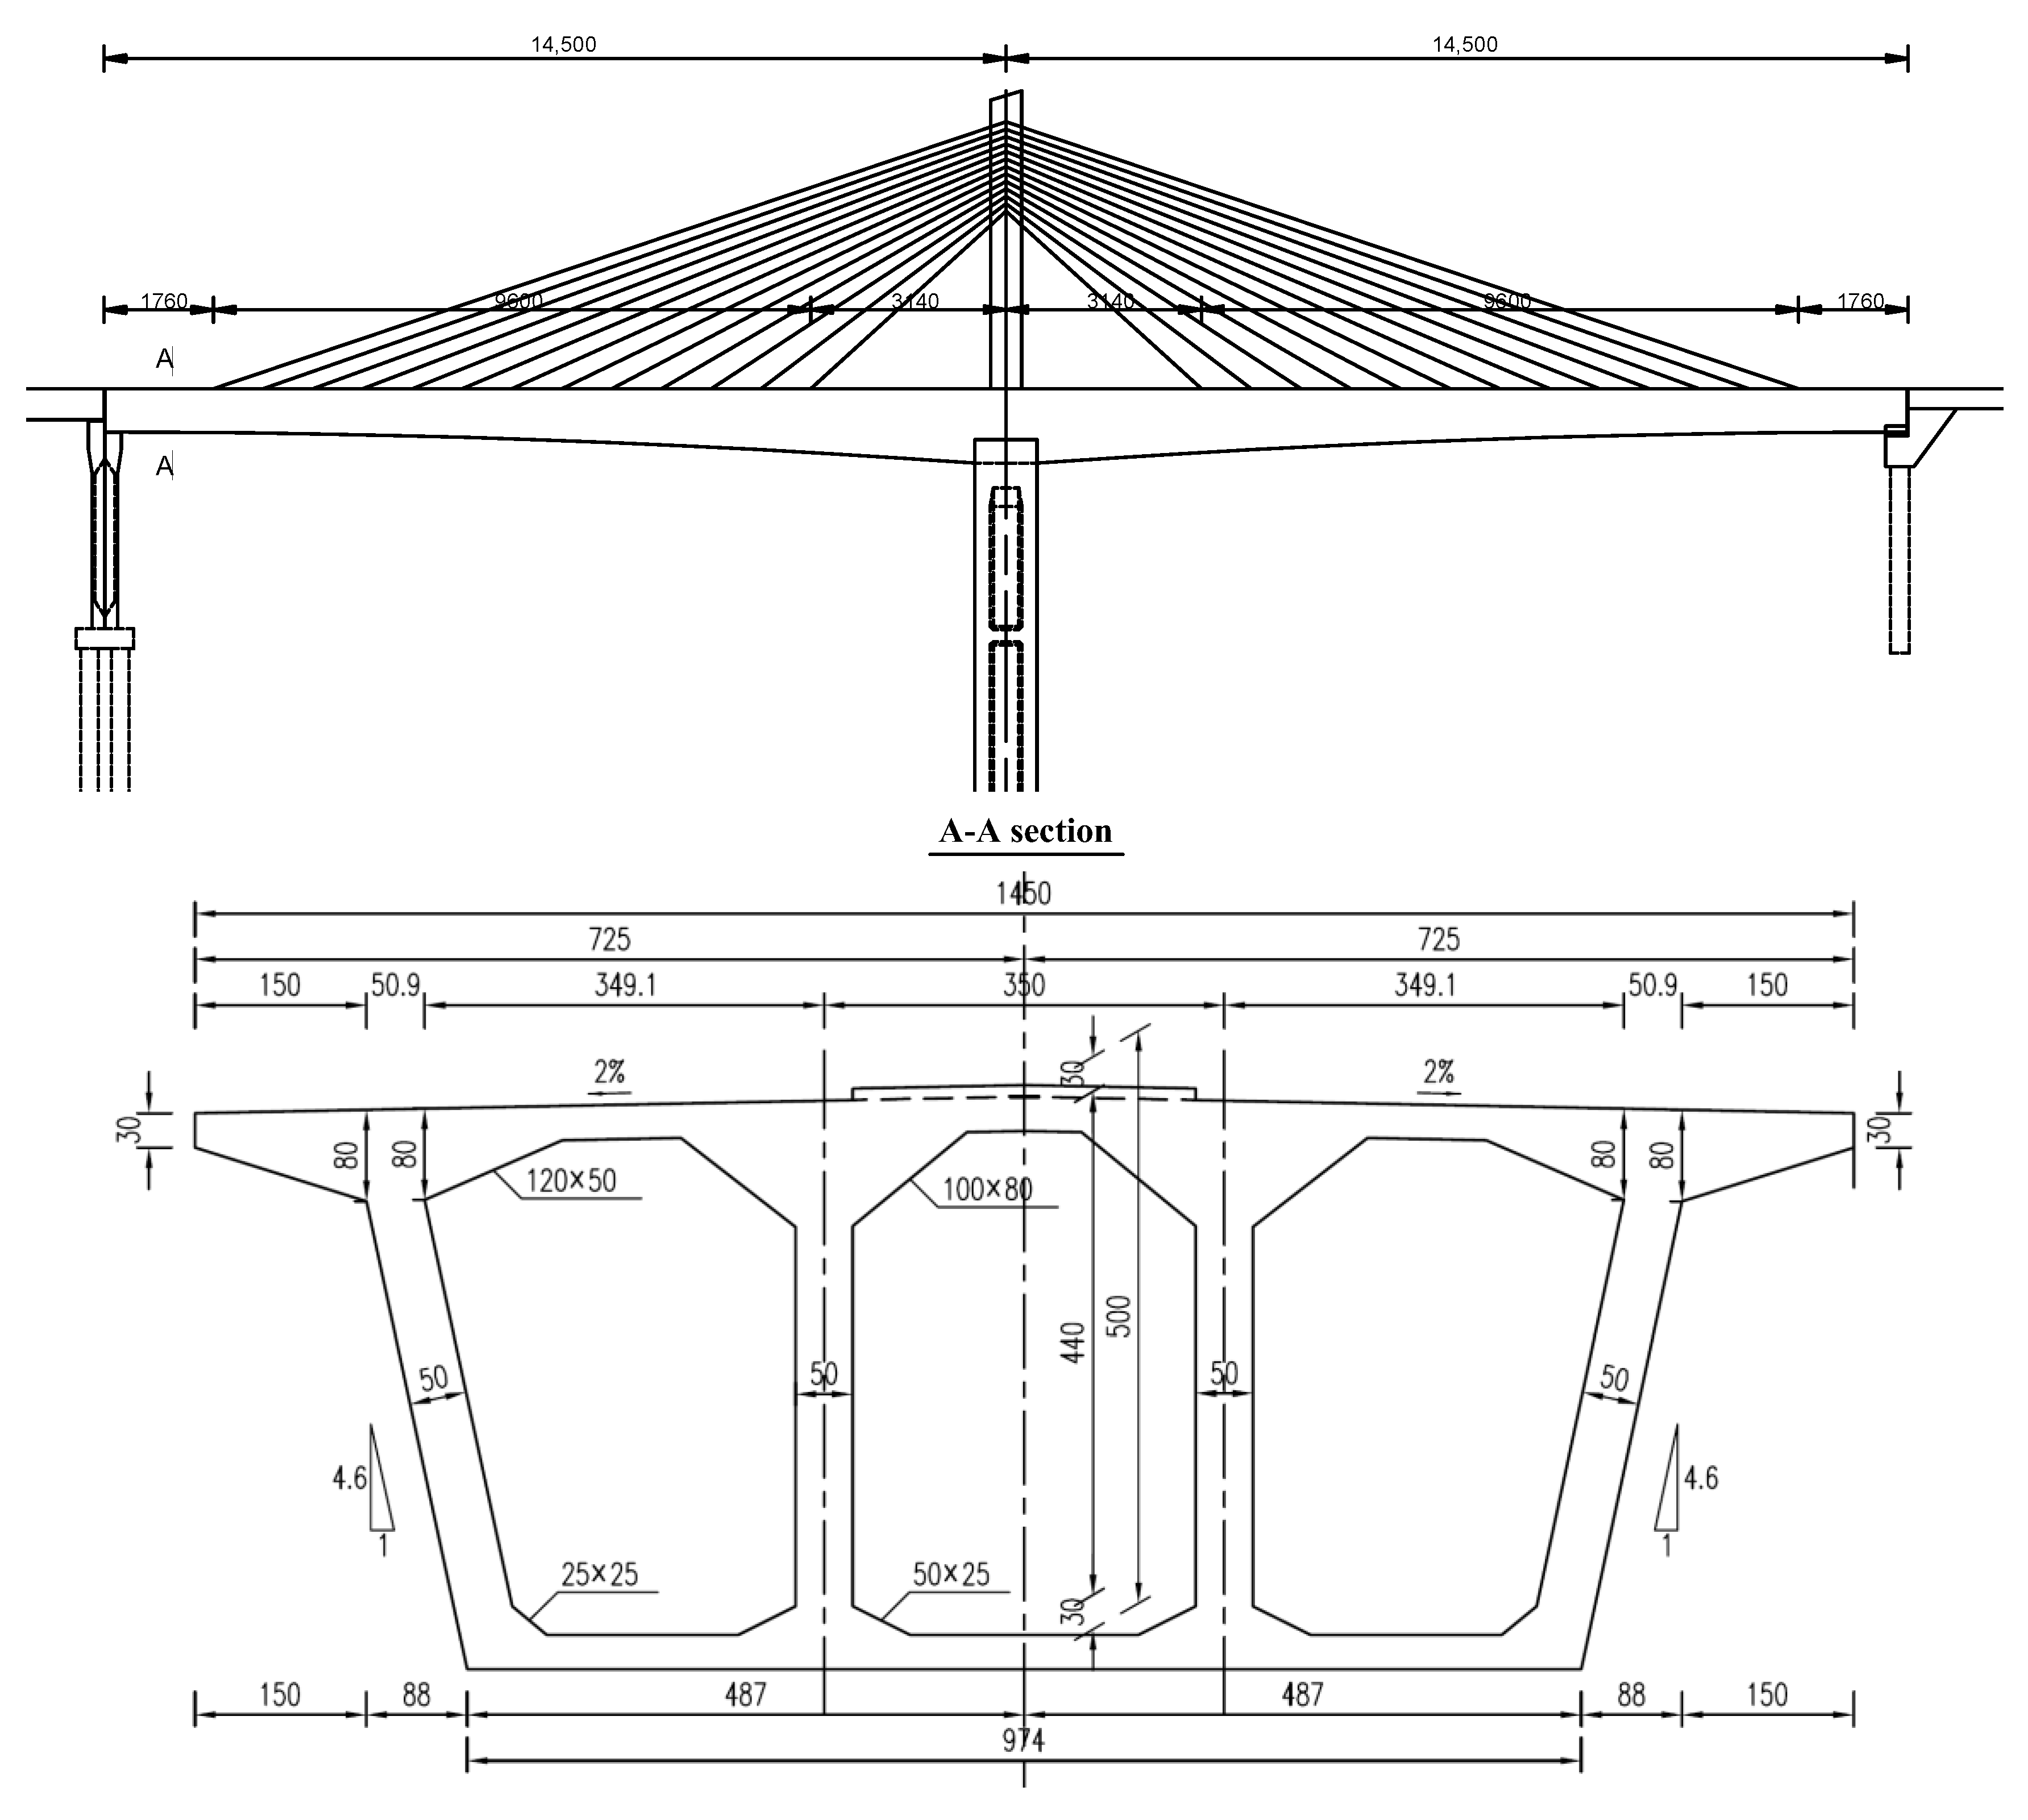
4.1. Bridge Configuration and Structural Characteristics

This study examines a large-span prestressed concrete cable-stayed bridge with a single tower and double cable planes, spanning 2 × 145 m. The main girder is constructed of C60 concrete and features a single-box, three-cell configuration with inclined webs and a variable height profile defined by a quadratic parabola: 12 m in height at the tower roots, tapering quadratically to 5 m at the span ends. The deck comprises a 30 cm thick top slab and a bottom slab that increases from 30 cm at the ends to 150 cm at the roots. Edge webs adjacent to the piers transition over three stages—50 cm, 70 cm, and 90 cm—while all interior webs (except those in segment 0) maintain a constant 50 cm thickness. The bridge incorporates comprehensive prestressing systems in both longitudinal and transverse directions to enhance structural integrity.
The reinforced-concrete towers rise 48 m above the deck, featuring a solid C50 concrete rectangular cross section with rounded chamfers (5 m in longitudinal direction and 3 m transversely). The main girder is structurally integrated with the towers and piers to form a cohesive tower–girder–pier system. The bridge employs 26 symmetrical cable pairs in a fan configuration, with cables spaced at 1.2 m intervals. Figure 5 illustrates the complete bridge layout and structural arrangement.
This bridge, composed of two 145 m spans, was selected as a representative case study for several reasons. First, its significant span length and concrete structure result in considerable dead loads and introduce significant geometric nonlinearities due to cable sag and P-Delta effects. These characteristics make it a challenging optimization problem where traditional linear methods often prove inadequate. Second, the single-tower, symmetrical fan-shaped cable arrangement is a common design, making the findings of this study broadly applicable to many similar structures. Therefore, this bridge serves as an excellent benchmark to demonstrate the capability of the EWOSSA-GPR framework to handle a complex, real-world engineering problem and achieve a balanced optimization outcome.
The primary load case considered for the cable force optimization is the permanent dead load, which includes the self-weight of the concrete girder, pylons, and the cables themselves. This is standard practice in cable-stayed bridge design, as the primary goal of initial cable tensioning is to establish a reasonable or ideal structural state (i.e., geometry and internal forces) under permanent loads. While transient loads such as traffic live loads and environmental effects are critical for final design verification according to relevant bridge design codes, they are not included in this initial optimization phase. The final optimized state obtained from our method is intended to serve as the ideal baseline upon which these transient loads would be applied for subsequent checks.
Key material properties of the case study bridge’s main components are presented in Table 2.
The finite element model of the bridge was developed using MIDAS/Civil, as illustrated in Figure 6. Beam elements simulate the main girder and pylons, with the girder discretized into 128 elements and each tower into 16 elements. Stay cables are modeled as 52 tension-only truss elements whose axial stiffness is computed via an equivalent modulus, based on Ernst’s sag formula, that varies with tension, weight, and unsupported length. This ensures the finite element model accurately represents geometric nonlinearity due to sag, which is critical for realistic girder deflection and bending moment predictions. All cable-to-girder and cable-to-tower connections are represented as rigid.
Simulated boundary conditions are applied as follows: at the permanent support bearings, general supports restrain translations in the transverse (y) and vertical (z) directions, as well as rotations about the longitudinal (x) and vertical (z) axes. Pier bases use fully fixed general supports, locking all six degrees of freedom. One pier–girder connection node is also fully fixed (all translations and rotations). At the 26 cable–girder connection nodes, translations in x, y, and z are constrained, along with rotation about the y-axis. Finally, at the 13 cable–tower connection nodes, all translational degrees of freedom (x, y, and z) are restrained.

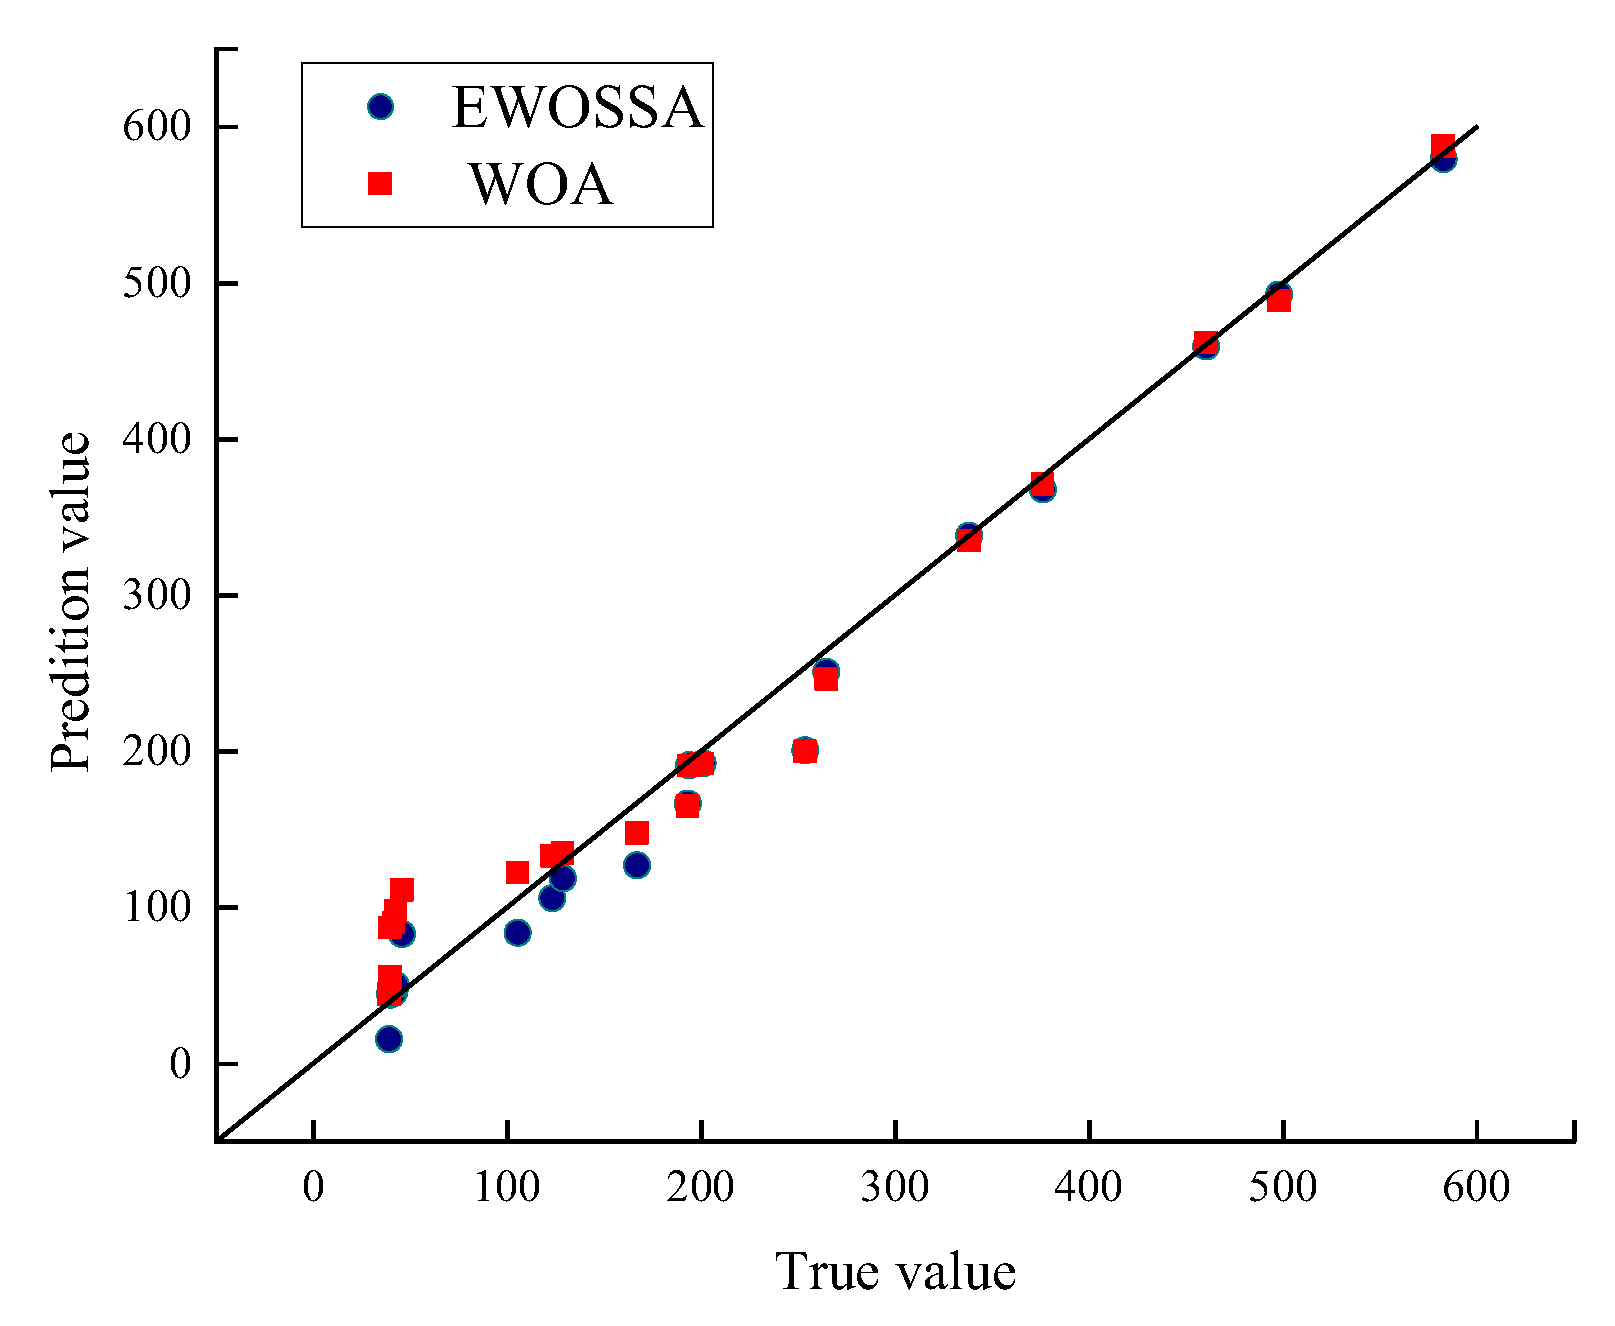
4.2. The GPR Model for Cable Forces–Bending Strain Energy

Given the symmetrical nature of the bridge structure, the optimization problem focuses on 13 cable forces. To construct the GPR surrogate model, 80 distinct cable force combinations were generated using Latin hypercube sampling (LHS). The choice of 80 samples represents a pragmatic balance between the computational cost of performing numerous finite element (FE) analyses and the need for sufficient data to train an accurate model. LHS was specifically chosen over simple random sampling because it ensures a more uniform and comprehensive coverage of the high-dimensional parameter space, maximizing the information gained from a limited number of simulations. The sufficiency of this sample size is empirically validated by the high predictive accuracy achieved by the final GPR model, as detailed later in this section. These 80 data points were then analyzed using the FE model to calculate the corresponding bending strain energy values. The bending strain energy was determined using Equation (25):
U = i = 1 n L i 4 E i L I i L M i L 2 + L i 4 E i R I i R M i R 2
where L and R represent the left and right section of the element, respectively, E, I, L, and M represent the elastic modulus, moment of inertia, length, and cross-sectional bending moment of the element, respectively, while n represents the number of elements.
Equation (25) considers only bending strain energy, excluding shear deformation. For slender structures such as the main girder of a long-span cable-stayed bridge, bending dominates the elastic response, and shear effects on total strain energy are negligible. This simplification is consistent with standard engineering practice and focuses the optimization on the most significant factor influencing global structural behavior.
For the GPR model development, 60 sets of cable forces–bending strain energy data are randomly selected as training samples, reserving the remaining 20 sets for validation purposes. Figure 7 presents the convergence curves of the negative log-likelihood function for both the standard whale optimization algorithm (WOA) and our proposed enhanced whale optimization algorithm with Salp Swarm Optimization (EWOSSA). The results demonstrate that the EWOSSA consistently achieves superior performance throughout the optimization process, including initial, intermediate, and final stages.
To evaluate the effectiveness of both approaches, the optimized hyperparameters from each algorithm in the GPR model are implemented and the validation dataset for performance assessment is used. To further assess the statistical robustness of the models, the Mean Absolute Error (MAE) and Root Mean Square Error (RMSE) in addition to the coefficient of determination (R2) are calculated. Figure 8 illustrates the prediction results, while the comprehensive metrics are presented in Table 3.
The EWOSSA-GPR model achieved an R2 of 0.9896, an MAE of 14.5, and an RMSE of 20.4. In contrast, the WOA-GPR model yielded an R2 of 0.8596, an MAE of 21.3, and an RMSE of 29.3. The significantly lower error values and near-perfect R2 of the EWOSSA-GPR model confirm its superior predictive capability.
The high accuracy of the GPR surrogate model is of paramount importance in this optimization context. The EWOSSA relies on this model to evaluate the fitness of thousands of potential cable force configurations without running a time-consuming FE analysis for each one. An inaccurate surrogate (as indicated by a lower R2 and higher error) would mislead the optimization algorithm, causing it to converge on a solution that is only “optimal” for the flawed model, not for the actual bridge structure. The R2 value of 0.9896 signifies that the EWOSSA-GPR model explains 98.96% of the variance in the FE data, making it a highly reliable and trustworthy proxy for the real structural behavior. This fidelity ensures that the final cable forces identified by our framework are not just theoretical optima but are genuinely effective for the physical system, thereby validating the efficiency and practicality of our proposed method.

4.3. Comparative Analysis of Cable Force Optimization Using EWOSSA-GPR

This section evaluates the performance of the enhanced whale optimization algorithm with the Salp Swarm Algorithm and Gaussian process regression (EWOSSA-GPR) model, using the hyperparameters defined in Section 4.2, for optimizing cable forces in the case study bridge. The primary optimization goal is to minimize the bending strain energy of the main girder and determine the corresponding optimal cable forces. The effectiveness of the EWOSSA-GPR method is assessed by comparing its results with those obtained from two established methods: the internal-force equilibrium method (considering self-weight) and the zero-displacement method. The comparison focuses on four key structural response metrics: cable force uniformity, maximum main girder displacement, main girder bending moments, and maximum stress within the main girder.

4.3.1. Description of Benchmark Methods

To provide a robust benchmark for our proposed EWOSSA-GPR framework, two widely recognized traditional methods for cable force optimization are implemented.
The internal-force equilibrium method seeks a cable force configuration under dead load that balances bending moments in the girder and towers when subjected to combined dead and live loads. The target is to equalize the stress-to-allowable stress ratios at the top and bottom fibers of a chosen control section. Achieving this balance accounts for effects from dead load, live load, creep and shrinkage, temperature changes, and other actions. The method promotes uniform material utilization, avoids local overstressing, and enhances overall safety, making it well suited to complex layouts such as asymmetric spans or highly curved girders. Its drawbacks include the need to predefine control sections and perform substantial computations. In this study, it is applied under dead-load conditions.
The zero-displacement method determines pretension forces that exactly cancel the vertical deflections of the main girder at cable anchorage points under dead load. By eliminating these deflections, it produces a more uniform force distribution and an optimal bridge profile. This method is computationally efficient and especially useful for symmetric spans or preliminary design stages. However, in asymmetric bridges, steeply graded girders, or configurations sensitive to tower-root moments, it can yield uneven cable tensions. It also assumes elastic behavior; significant geometric nonlinearity requires correction.

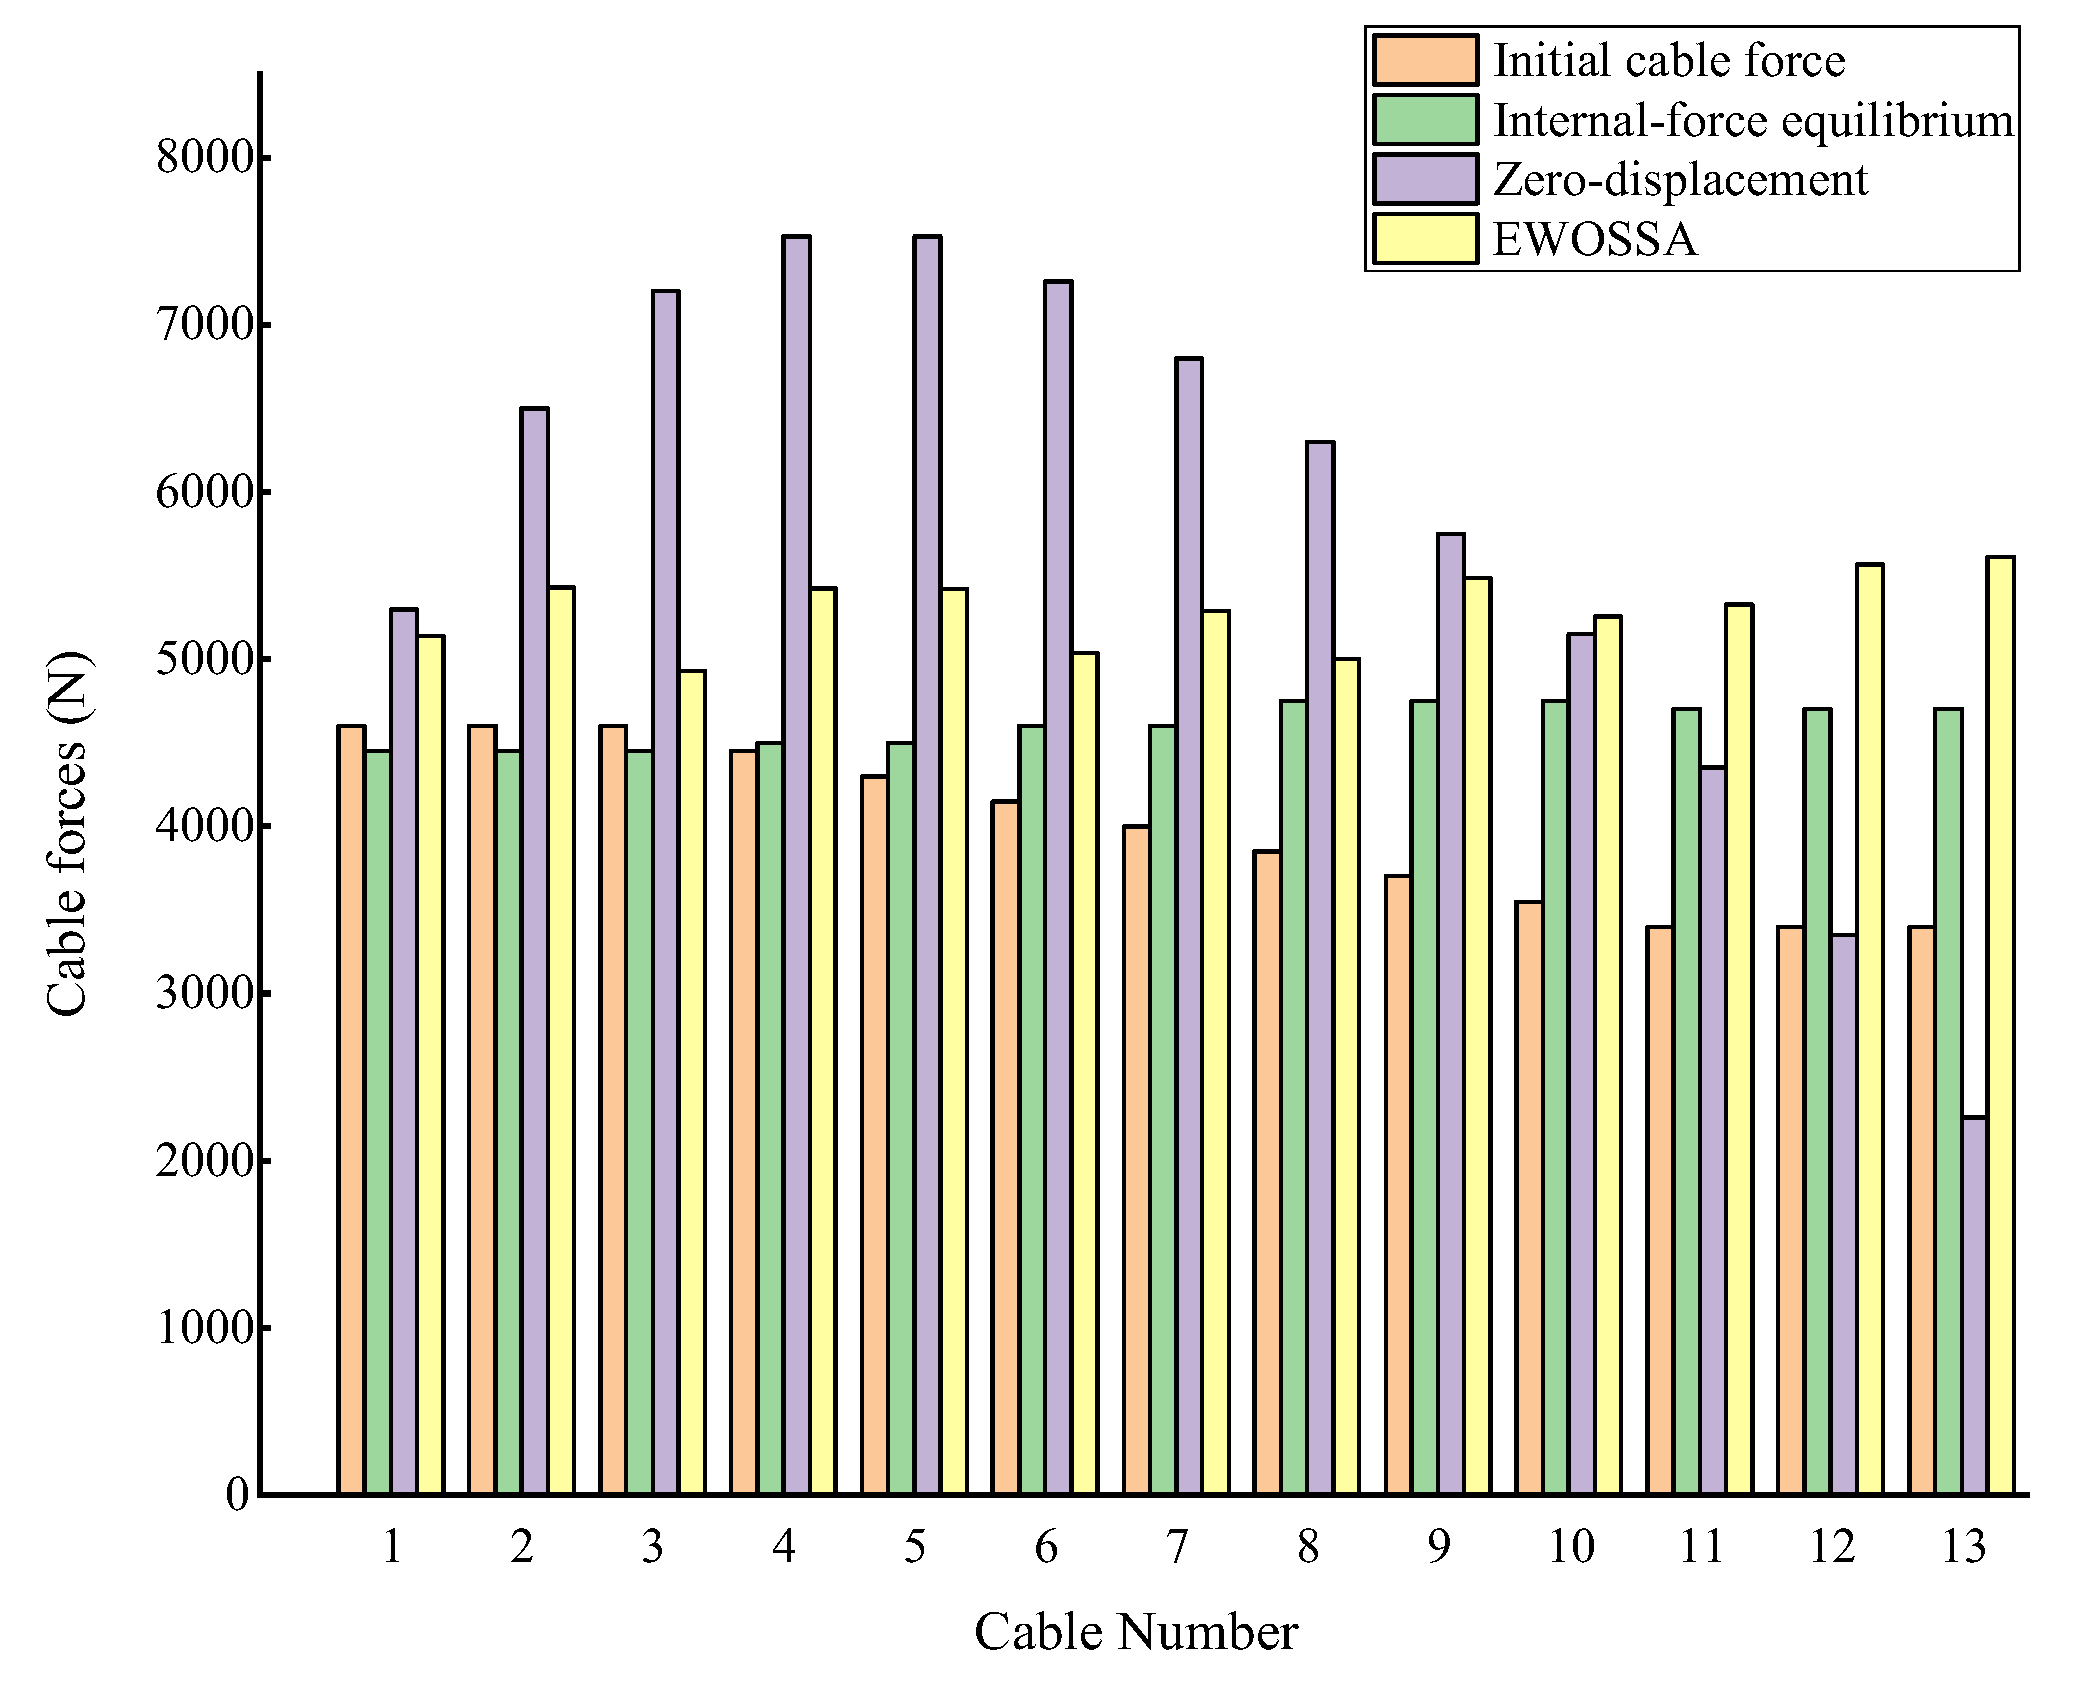
4.3.2. Cable Force Uniformity

Cable force uniformity is quantified using a uniformity coefficient (), calculated as the ratio of the standard deviation (σ) to the mean (x) of the cable forces (Equation (26)). A lower coefficient indicates better uniformity.
ϕ = σ x
The analysis results (Table 4 and Figure 9) reveal that the cable forces derived from the zero-displacement method exhibit significant dispersion, indicated by the highest uniformity coefficient (0.28), suggesting poor uniformity. In contrast, both the internal-force equilibrium method and the EWOSSA-GPR method yielded considerably more uniform cable forces, with coefficients of 0.03 and 0.04, respectively. Compared to the initial cable force state (coefficient of 0.12), the internal-force equilibrium method improved uniformity by 77.7%, while the EWOSSA-GPR method achieved a 65.8% improvement, demonstrating the effectiveness of both approaches in achieving more evenly distributed cable forces. Figure 9 illustrates the cable force distributions for each method.

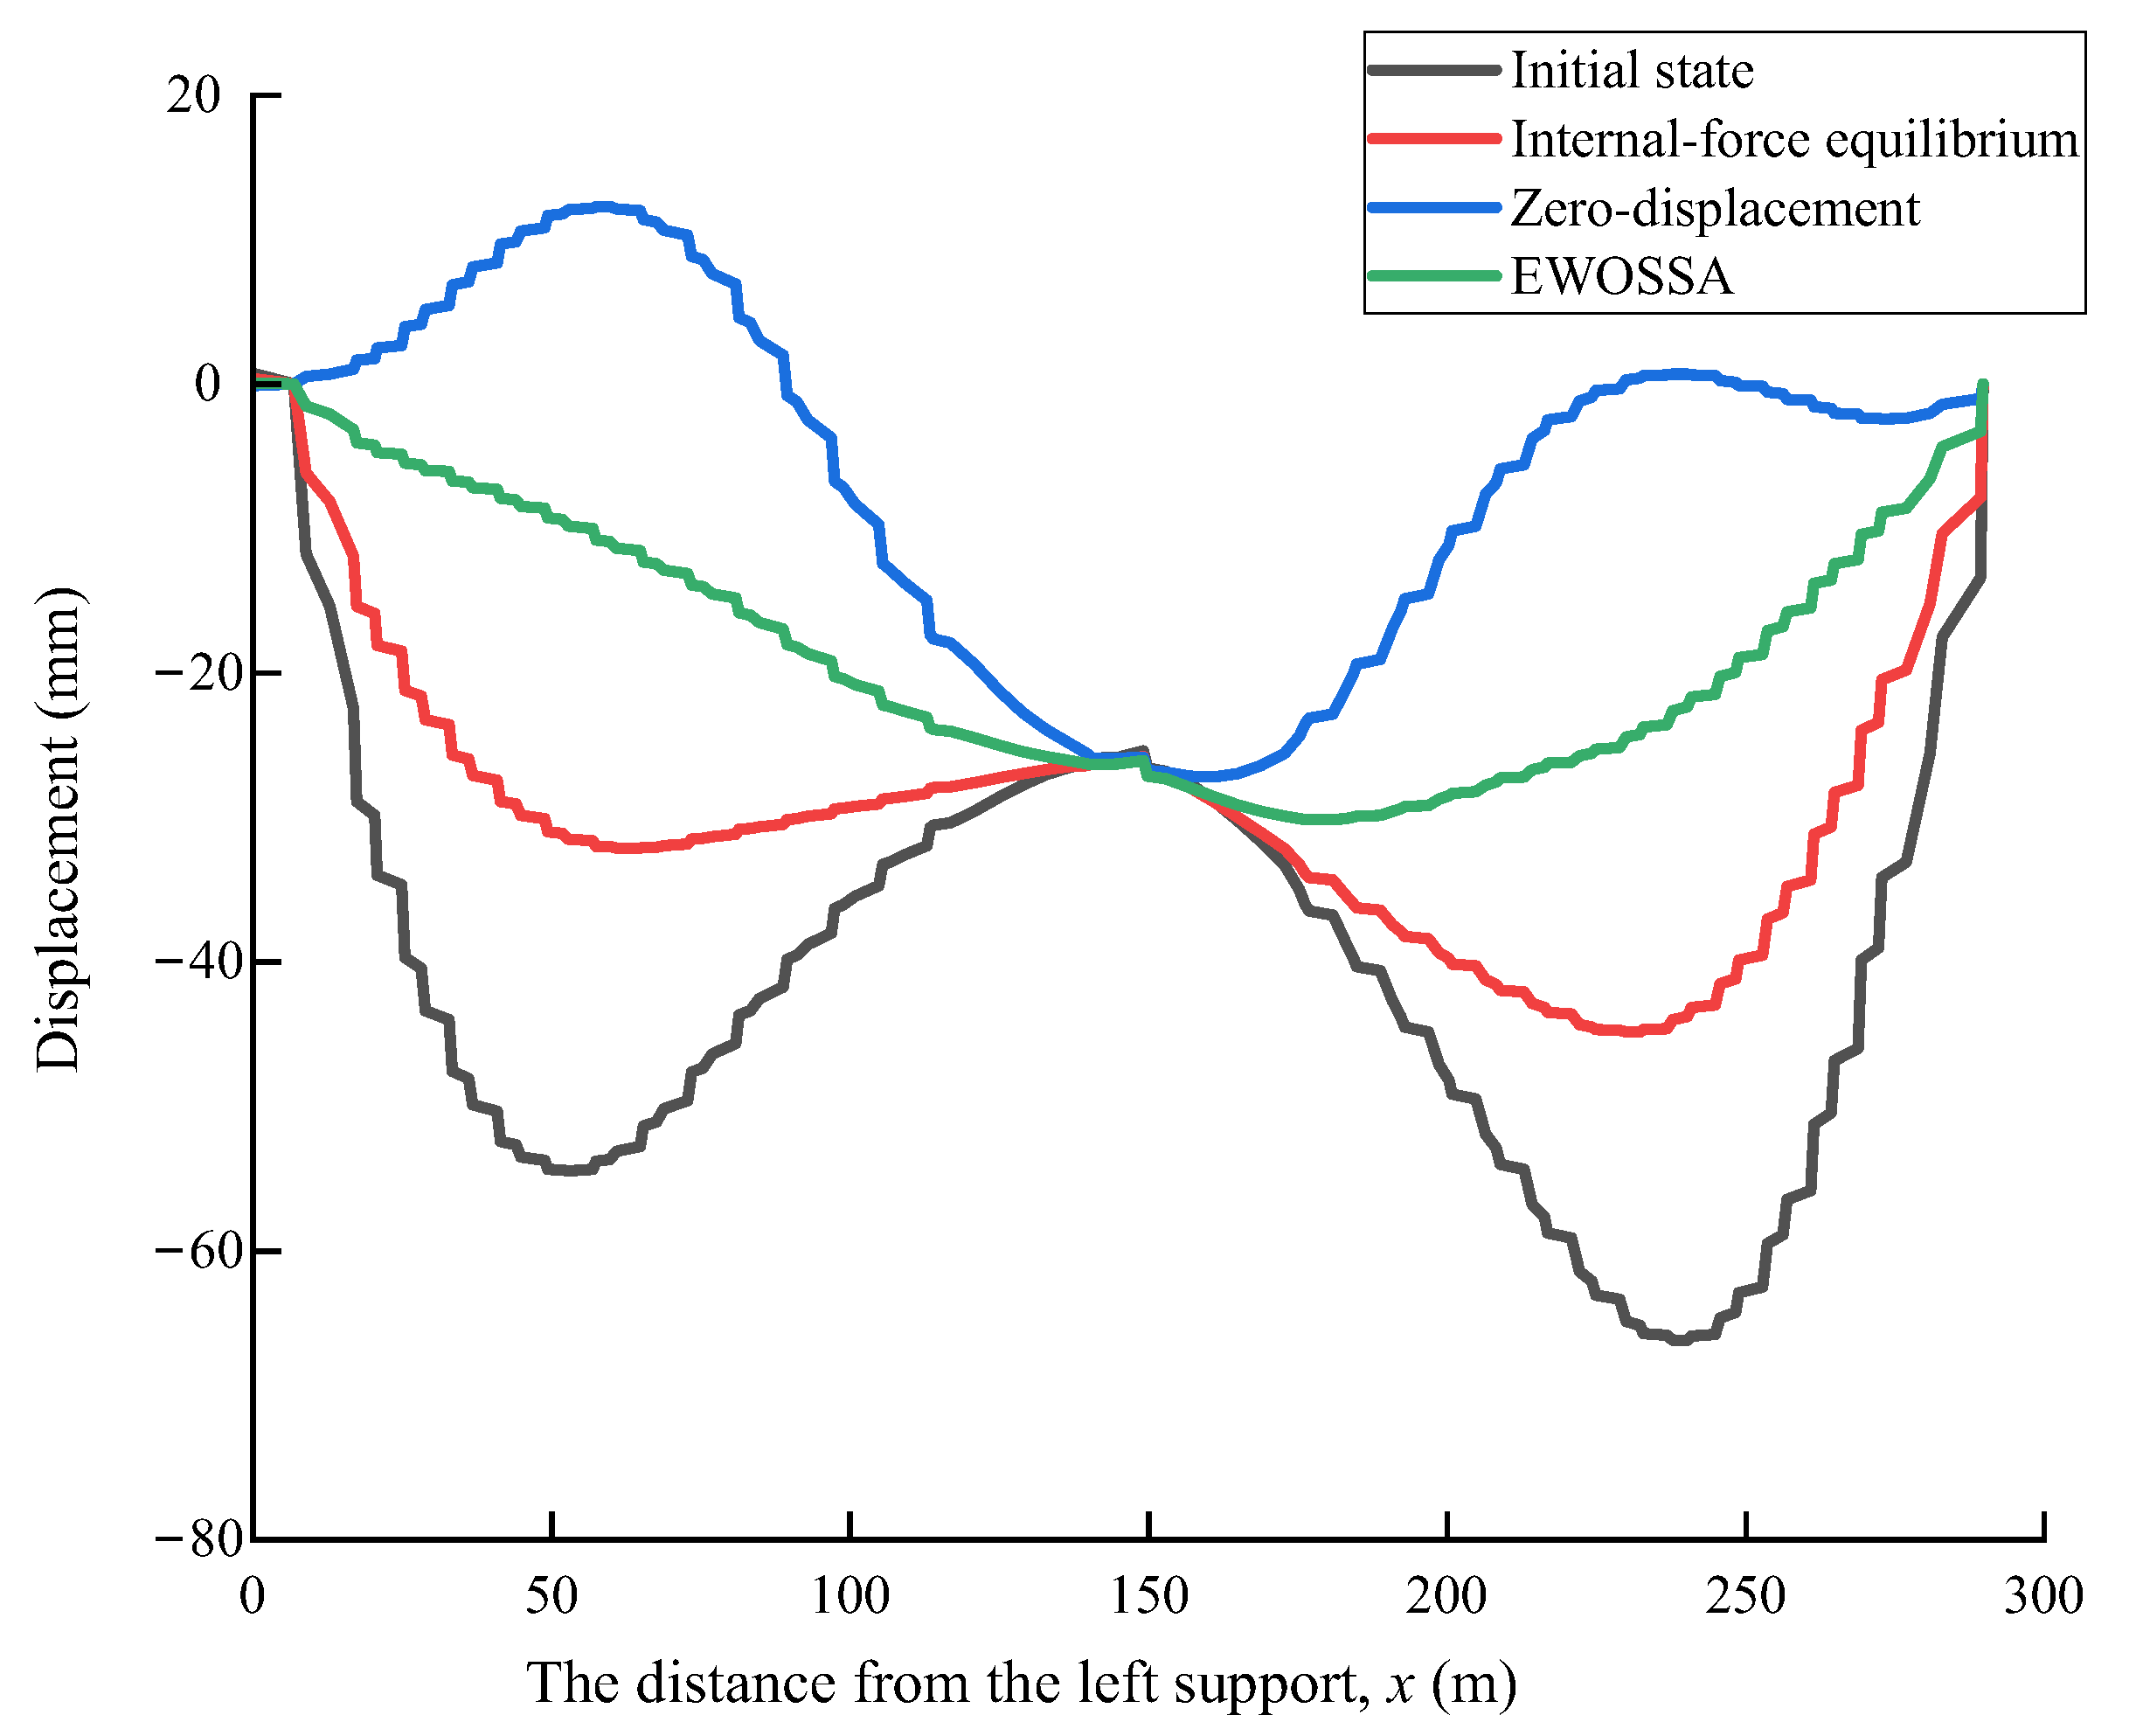
4.3.3. Main Girder Displacement

All optimization methods successfully reduced the maximum vertical displacement of the main girder compared to the initial state. As detailed in Table 5 and illustrated in Figure 10, the zero-displacement method resulted in the smallest maximum girder displacement (−27.18 units), achieving the most significant reduction (58.9%) and thus the most favorable girder shape in terms of deflection minimization. The EWOSSA-GPR method also yielded a substantial reduction in maximum displacement (54.5%, to −30.13 units). The internal-force equilibrium method showed the least improvement, reducing the maximum displacement by 32.2% (to −44.85 units), resulting in a comparatively less optimal girder shape regarding displacement.

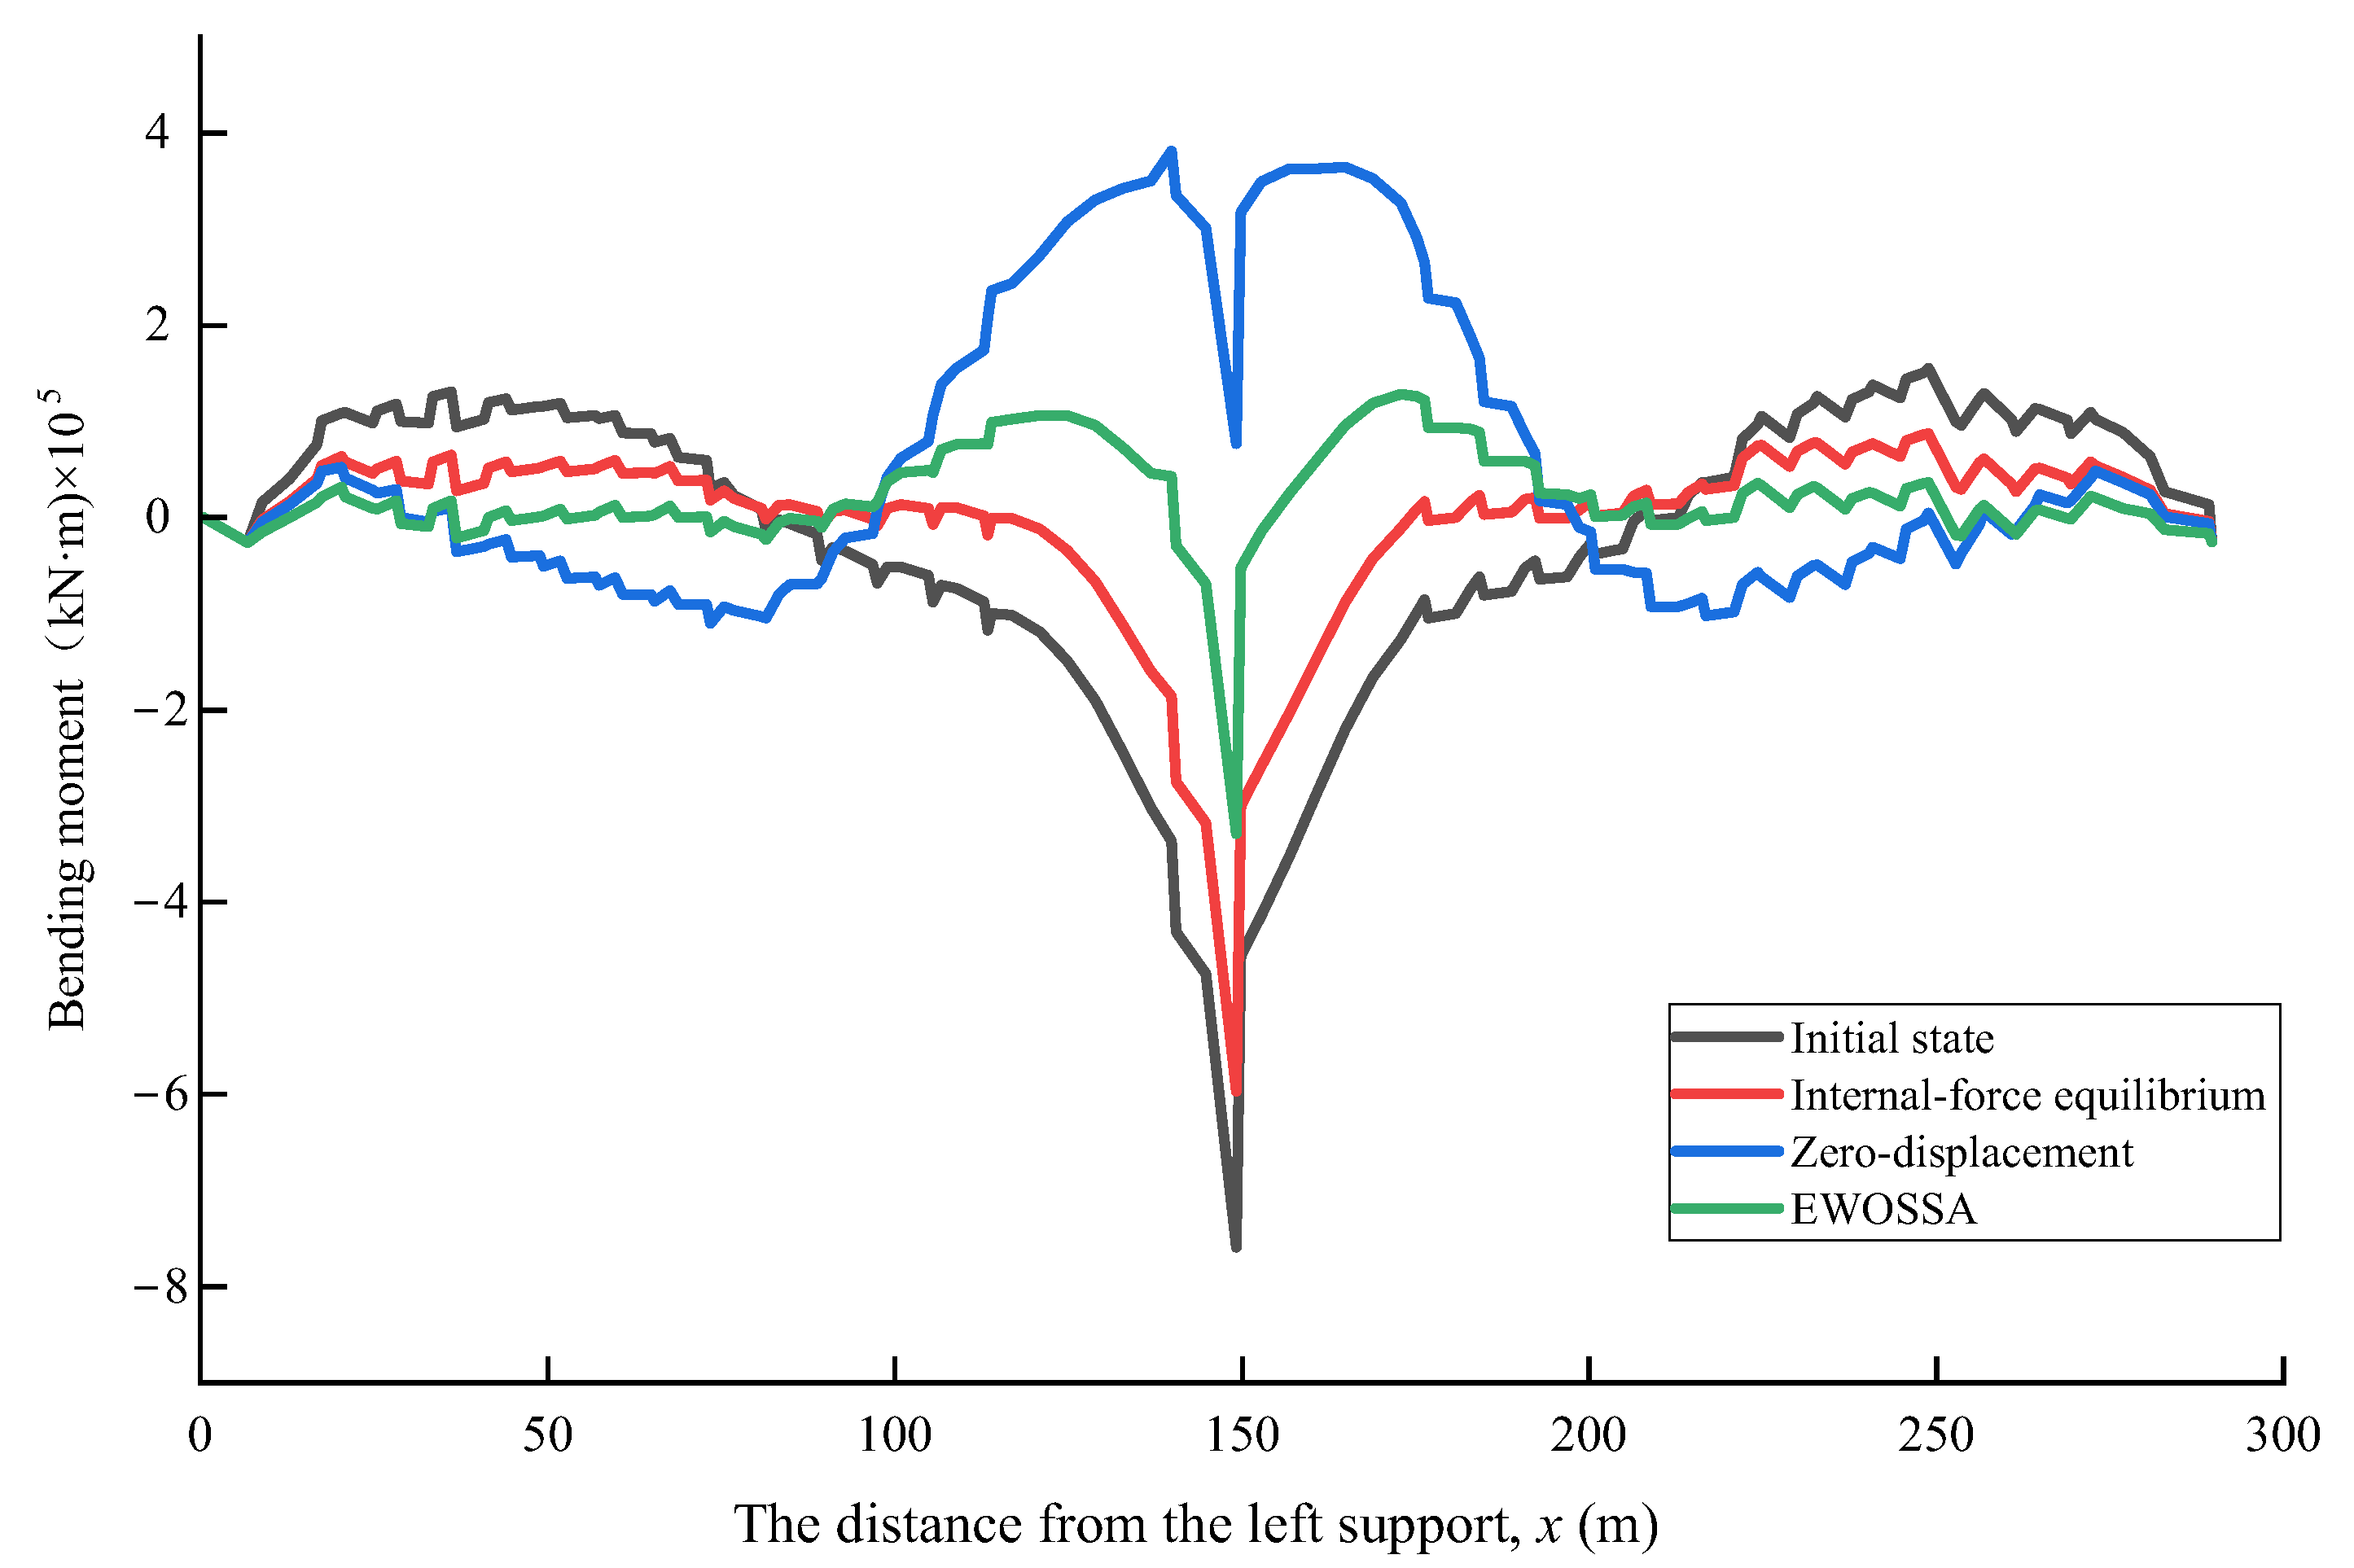
4.3.4. Main Girder Bending Moments

The distribution of bending moments along the main girder varied significantly between methods (Table 6, Figure 11). The internal-force equilibrium method proved particularly effective in minimizing positive (sagging) bending moments and achieving the lowest mean bending moment, consistent with its underlying principle. This method reduced the maximum positive moment by 43.8% compared to the initial state, although its effect on the maximum negative (hogging) moment was less pronounced, showing only a 21.4% reduction.
Conversely, the EWOSSA-GPR method demonstrated a different performance profile. While it achieved a moderate reduction in the maximum positive bending moment (17.3%), it excelled in reducing the maximum negative bending moment by a substantial 56.7%. The zero-displacement method generally resulted in the least favorable bending moment distribution among the evaluated techniques.

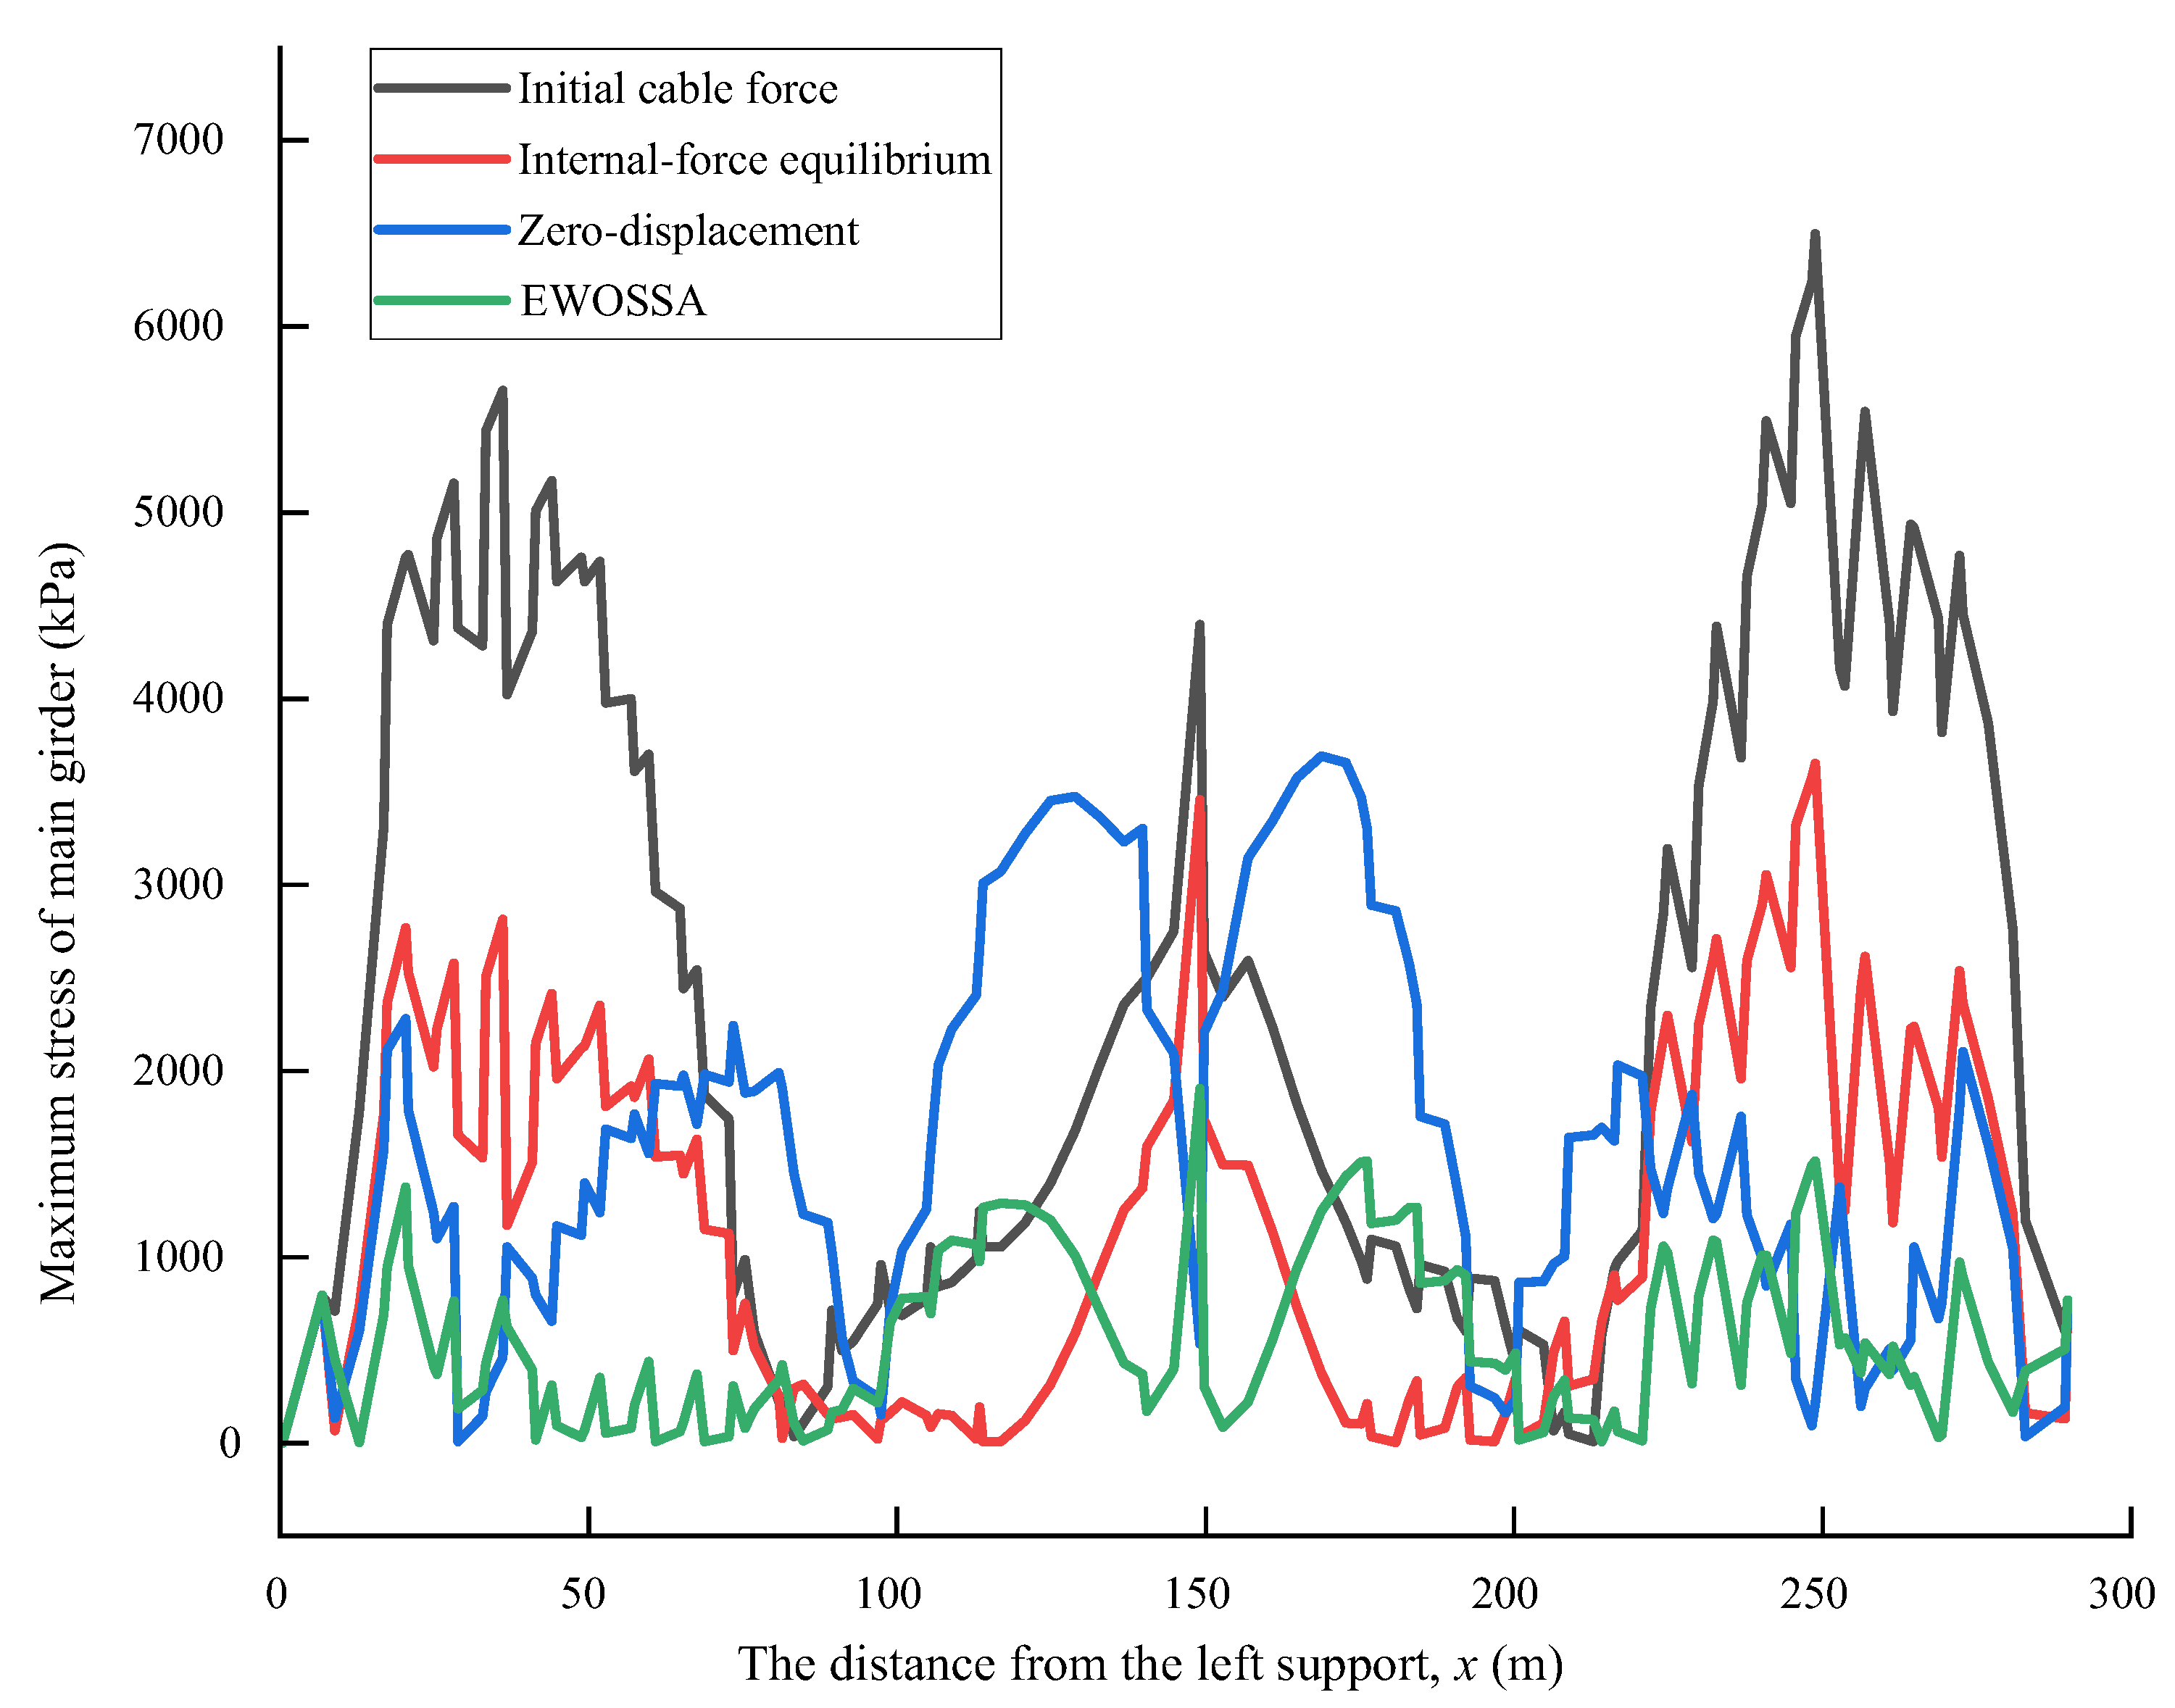
4.3.5. Maximum Stress in Main Girder

All three optimization strategies led to reductions in both the maximum and mean stress values within the main girder compared to the initial cable forces. The EWOSSA-GPR method demonstrated the most effective stress optimization (Table 7, Figure 12). It yielded the most uniform stress distribution and achieved the lowest maximum stress value (1904 units). Compared to the initial state, EWOSSA-GPR reduced the maximum stress by 70.7% and the mean stress by 76.4%.
The internal-force equilibrium method and the zero-displacement method achieved less significant, though still considerable, stress reductions. The internal-force equilibrium method reduced maximum stress by 43.8% and mean stress by 50.8%. The zero-displacement method resulted in reductions of 43.1% for maximum stress and 39.1% for mean stress. However, both of these traditional methods resulted in less optimal distributions of maximum stress along the girder compared to EWOSSA-GPR.
The numerical improvements achieved by the EWOSSA-GPR framework have significant practical implications for the entire lifecycle of a cable-stayed bridge. A 70.7 percent reduction in peak stress, for example, does more than improve a structural metric; it fundamentally enhances safety margins and extends service life. By operating well below material yield limits, steel components and cable anchorages are far less susceptible to fatigue cracking, while reduced tensile forces in concrete elements mitigate long-term creep and shrinkage effects. These benefits can translate into more economical designs: engineers may select lower-grade materials or slimmer cross sections without compromising durability, yielding savings in both material costs and foundation loads. Furthermore, the near-uniform cable force profile produced by our EWOSSA-GPR optimization simplifies the tensioning sequence during construction, reducing the need for iterative adjustments and minimizing the risk of uneven deflections as the deck is erected. Finally, because girder deflections and bending moments are tightly controlled under permanent loads, the resulting bridge deck offers superior ride quality and slower pavement deterioration, cutting maintenance demands over the structure’s lifetime. In short, our balanced optimization not only advances theoretical performance but also delivers tangible advantages in cost, constructability, and long-term durability—key considerations in practical cable-stayed bridge design.

4.4. Analysis of the EWOSSA-GPR Framework’s Superiority

The comparative analysis consistently demonstrates that the EWOSSA-GPR framework provides a more balanced and holistically optimized solution than traditional methods. The underlying reasons for this superior performance can be attributed to three key interacting factors: the choice of a global objective function, the accurate modeling of structural nonlinearity, and the algorithm’s robust global search capability.
A key finding of this analysis is the understanding of performance trade-offs. The traditional methods, being single-objective, excel in their designated area but at the cost of other metrics. For instance, the zero-displacement method provides superior deflection control (58.9% reduction) but induces highly non-uniform cable forces and extreme hogging moments, which is undesirable in practice. Conversely, the internal-force equilibrium method ensures excellent force uniformity but is less effective at controlling girder geometry.
In contrast, the EWOSSA-GPR framework demonstrates the practical superiority of a balanced approach. By optimizing for minimum bending strain energy, a global metric that incorporates both moments and displacements, the framework inherently negotiates these trade-offs. It avoids the extreme, “brittle” optimums of specialized methods and instead finds a holistically robust solution. This is best exemplified by its outstanding performance in reducing the maximum stress by 70.7%, a direct indicator of enhanced safety and durability. For a practical bridge design where multiple performance criteria must be met simultaneously, such a balanced and globally optimized state is far more valuable than one that is perfect in a single aspect but flawed in others.
Finally, the solution space for cable force optimization is vast, high-dimensional, and multimodal, containing numerous local optima. The traditional methods are deterministic and do not perform a broad search. In contrast, the EWOSSA is a powerful metaheuristic designed for global exploration. By integrating the leader-updating mechanism from the Salp Swarm Algorithm and the population diversification strategy of Lens Opposition-based Learning, the EWOSSA is adept at both exploring the entire search space to identify promising regions and exploiting those regions to find high-quality solutions. This prevents the optimization from becoming trapped in a suboptimal state, which can easily happen when only minor, localized adjustments are considered.

5. Conclusions

This paper introduces an enhanced optimization approach, integrating an enhanced whale optimization algorithm with the Salp Swarm Algorithm (EWOSSA) and Gaussian process regression (GPR), termed EWOSSA-GPR. This model optimizes the parameters of the GPR and subsequently applies it to the complex problem of cable force optimization in cable-stayed bridges. The performance of the EWOSSA-GPR method is benchmarked against traditional cable force optimization techniques. The primary findings are summarized below:
  • The EWOSSA-GPR model demonstrates superior predictive capabilities compared to a standard WOA-GPR model. It proves more effective in capturing the complex, nonlinear relationship between cable forces and the resulting structural state (including displacements, moments, and stresses) of the cable-stayed bridge.
  • Established cable force optimization methods, specifically the internal-force equilibrium and zero-displacement methods, show effectiveness in specific areas. The internal-force equilibrium method significantly improves cable force uniformity (77.7% improvement) and reduces maximum positive bending moments (43.8% reduction). However, its impact on other critical metrics, such as minimizing maximum girder displacement or maximum negative bending moments, remains less substantial. Conversely, the zero-displacement method excelled at reducing girder deflection, achieving a 58.9% decrease in maximum displacement and an 89.1% decrease in mean displacement. Yet, this comes at the cost of reduced cable force uniformity and a less favorable bending moment distribution.
  • In contrast to the specialized outcomes of traditional methods, the EWOSSA-GPR approach provides a more balanced optimization performance across multiple structural response metrics. While yielding results for girder displacement and bending moments comparable in magnitude to those from traditional methods, the EWOSSA-GPR method demonstrated a key advantage by considering various aspects of the bridge’s structural state concurrently, offering a more holistic optimization outcome rather than excelling in one area while potentially compromising others.
However, several limitations constrain the broader applicability of the EWOSSA-GPR. The surrogate’s accuracy requires substantial upfront investment in high-fidelity finite element analyses, with the training samples demanding considerable computational time. Although this offline cost is offset by extremely fast optimization evaluations, it may become prohibitive for very large or highly detailed bridge models unless more efficient sampling strategies are adopted. Furthermore, the method’s performance is sensitive to algorithmic parameter settings. While the hyperparameters of the GPR kernel are automatically tuned through marginal likelihood maximization, the metaheuristic optimizer still relies on user-defined settings, such as population size, iteration count, and control coefficients, to ensure reliable convergence. In complex multimodal problem domains, poor parameter choices can lead to premature convergence or excessive runtimes, underscoring the need for adaptive, self-tuning mechanisms. Finally, the method’s demonstration on a symmetric, single-tower cable-stayed bridge raises questions about its scalability to more complex configurations, such as multi-tower layouts or asymmetric geometries, where increased design space dimensionality may necessitate advanced techniques like active learning, multi-fidelity modeling, or dimensionality reduction to preserve accuracy and computational efficiency.
While the proposed EWOSSA-GPR framework has demonstrated significant potential, several promising avenues for future research and applications remain. A primary research gap is the extension from single-objective to multi-objective optimization. Future work could incorporate conflicting objectives, such as minimizing girder displacement, controlling bending moments, reducing construction costs, and ensuring structural safety simultaneously, to provide a more holistic and practical design solution. Furthermore, the current study focuses on static loads in the completed state. Investigating the optimization of cable forces under dynamic loads (e.g., seismic activity, wind, and traffic) and considering time-dependent effects like concrete creep and shrinkage represents a critical direction for enhancing the long-term performance and resilience of bridges. The design for such dynamic events often involves advanced protective strategies, such as the use of friction pendulum systems for base or inter-storey isolation, as investigated by Zhang et al. [46]. The integration of the EWOSSA-GPR model with Structural Health Monitoring (SHM) data offers another exciting prospect. By using real-time sensor data to continuously update the GPR model, the framework could be used for the operational maintenance and adaptive retensioning of cables throughout a bridge’s service life. Finally, the applicability of this methodology could be explored for other complex structural optimization problems, such as the shape optimization of bridge pylons and girders or the design of other long-span structures, thereby broadening its impact within the field of structural engineering.

Author Contributions

Conceptualization, B.T. and S.C.; Methodology, B.T., P.Z. and S.C.; Software, P.Z.; Validation, C.J.; Formal analysis, P.Z.; Investigation, P.Z.; Writing—original draft, B.T., P.Z. and S.C.; Writing—review & editing, B.T. and S.C.; Visualization, C.J.; Supervision, S.C.; Project administration, S.C. All authors have read and agreed to the published version of the manuscript.

Funding

The first author is grateful for the financial support provided by the Post-doctoral Fund Project of Guangxi Communications Investment Group Co., Ltd., and the Open Foundation of State Key Laboratory of Mountain Bridge and Tunnel Engineering, Chongqing Jiaotong University, grant number SKLBT-2211.

Data Availability Statement

The original contributions presented in this study are included in the article. Further inquiries can be directed to the corresponding author.

Conflicts of Interest

Author Bing Tu was employed by the company Guangxi Communications Investment Group Corporation Ltd. Author Pengtao Zhang was employed by the company Sinoma Wind Power Blade (FuNing) Co., Ltd. The remaining authors declare that the research was conducted in the absence of any commercial or financial relationships that could be construed as a potential conflict of interest. The sponsors had no role in the design, execution, interpretation, or writing of the study.

References

  1. Dai, J.; Qin, F.J.; Di, J.; Chen, Y.R. A review of the optimization methods for the cable forces of cable-stayed bridges in the completed state. China J. Highw. Transp. 2019, 32, 17–37. [Google Scholar] [CrossRef]
  2. Ristic, J.; Ristic, D.; Behrami, R.; Hristovski, V. Adaptive seismic upgrading of isolated bridges with c-gapped devices: Model testing. Civ. Eng. J. 2024, 10, 2761–2780. [Google Scholar] [CrossRef]
  3. Wang, Z.; Hu, J.; Jing, W.; Zhang, W. Vibration control of corrugated steel web box girder bridge with friction pendulum isolation. Civ. Eng. J. 2024, 10, 3122–3136. [Google Scholar] [CrossRef]
  4. Zhang, W.; Lin, J.; Huang, Y.; Lin, B.; Liu, X. Experimental and numerical studies on flexural performance of composite beams under cyclic loading. Structures 2024, 70, 107728. [Google Scholar] [CrossRef]
  5. Yang, Y.; Lin, B.; Zhang, W. Experimental and numerical investigation of an arch–beam joint for an arch bridge. Arch. Civ. Mech. Eng. 2023, 23, 101. [Google Scholar] [CrossRef]
  6. Lam, P.L.; Kang, T.H.K. Effects of tensioning forces on the structural behavior of cable-stayed bridges. Steel Compos. Struct. 2022, 43, 457–464. [Google Scholar] [CrossRef]
  7. Asgari, B.; Osman, S.A.; Adnan, A.B. Optimization of pre-tensioning cable forces in highly redundant cable-stayed bridges. Int. J. Struct. Stab. Dyn. 2015, 15, 1540005. [Google Scholar] [CrossRef]
  8. Martins, A.M.B.; Simões, L.M.C.; Negrão, J.H.O. Optimum design of concrete cable-stayed bridges. Eng. Optim. 2016, 48, 772–791. [Google Scholar] [CrossRef]
  9. Gimsing, N.J.; Georgakis, C.T. Cable Supported Bridges: Concept and Design, 3rd ed.; John Wiley & Sons: Chichester, UK, 2012. [Google Scholar]
  10. Wang, P.H.; Tang, T.C.; Yang, C.G. Initial shape of cable-stayed bridges. Comput. Struct. 1993, 46, 1095–1106. [Google Scholar] [CrossRef]
  11. Chen, D.W.; Au, F.T.K.; Tham, L.G.; Lee, P.K.K. Determination of initial cable forces in prestressed concrete cable-stayed bridges for given design deck profiles using the force equilibrium method. Comput. Struct. 2000, 74, 1–9. [Google Scholar] [CrossRef]
  12. Sung, Y.C.; Chang, D.W.; Teo, E.H. Optimum post-tensioning cable forces of Mau-Lo Hsi cable-stayed bridge. Eng. Struct. 2006, 28, 1407–1417. [Google Scholar] [CrossRef]
  13. Martins, A.M.B.; Simões, L.M.C.; Negrão, J.H.O. Optimization of cable-stayed bridges: A literature survey. Adv. Eng. Softw. 2020, 149, 102888. [Google Scholar] [CrossRef]
  14. Song, C.L.; Xiao, R.C.; Sun, B.; Wang, Z.Y.; Zhang, C. Cable force optimization of cable-stayed bridges: A surrogate model-assisted differential evolution method combined with B-spline interpolation curves. Eng. Struct. 2023, 283, 115893. [Google Scholar] [CrossRef]
  15. Zhang, W.M.; Zhang, Z.H.; Tian, G.M.; Chang, J.Q. Determining the reasonable completed bridge state of a self-anchored suspension bridge with a spatial cable system based on minimum bending strain energy: An analytical algorithm. J. Bridge Eng. 2023, 28, 04023071. [Google Scholar] [CrossRef]
  16. Mao, J. Research on the Optimization of the Cable Forces of Cable-Stayed Bridges in the Completed State and the Reasonable Construction State Based on the Influence Matrix Method. Ph.D. Thesis, Jilin University, Changchun, China, 2017. [Google Scholar]
  17. Hassan, M.M.; Nassef, A.O.; El Damatty, A.A. Surrogate function of post-tensioning cable forces for cable-stayed bridges. Adv. Struct. Eng. 2013, 16, 559–578. [Google Scholar] [CrossRef]
  18. Zhou, W. Research on the Optimization and Application of the Cable Forces of Cable-Stayed Bridges Considering the Non-Linear Influence of the Influence Matrix. Master’s Thesis, Changsha University of Science and Technology, Changsha, China, 2021. [Google Scholar]
  19. Wang, D.; Li, Z.; Xiang, S.T.; Tan, B.K. Step-by-step optimization and control of cable force of hybrid composite beam cable-stayed bridges. J. Zhejiang Univ. Technol. 2022, 50, 524–533. [Google Scholar]
  20. Asgari, B.; Osman, S.A.; Adnan, A. A new multiconstraint method for determining the optimal cable stresses in cable-stayed bridges. Sci. World J. 2014, 2014, 503016. [Google Scholar] [CrossRef] [PubMed]
  21. Jordan, M.I.; Mitchell, T.M. Machine learning: Trends, perspectives, and prospects. Science 2015, 349, 255–260. [Google Scholar] [CrossRef] [PubMed]
  22. Zhao, H.; Gong, Z.; Gan, K.; Gan, Y.; Xing, H.; Wang, S. Supervised kernel principal component analysis-polynomial chaos-Kriging for high-dimensional surrogate modelling and optimization. Knowl. Based Syst. 2025, 305, 112617. [Google Scholar] [CrossRef]
  23. Fang, T.; Hui, Z.; Rey, W.P.; Yang, A.; Liu, B.; Xie, Z. Digital restoration of historical buildings by integrating 3D PC reconstruction and GAN algorithm. J. Artif. Intell. Technol. 2024, 4, 179–187. [Google Scholar] [CrossRef]
  24. Touil, M.; Bahadi, L.; Elmagri, A. Automatic sleep quality analysis using an artificial intelligence algorithm and EEG signal processing. J. Artif. Intell. Technol. 2024, 4, 153–159. [Google Scholar] [CrossRef]
  25. Wood, D.A. Spatio-temporal attributes of Varicella-Zoster case number trends assist with optimizing machine learning predictions. Medinformatics 2024, 1, 43–53. [Google Scholar] [CrossRef]
  26. El Aeraj, O.; Leghris, C. Intrusion detection system based on an intelligent multilayer model using machine learning. J. Artif. Intell. Technol. 2024, 4, 332–341. [Google Scholar] [CrossRef]
  27. Pant, S.; Ram, M.; Yadav, O. (Eds.) Meta-Heuristic Optimization Techniques: Applications in Engineering; Walter de Gruyter GmbH: Berlin, Germany, 2022; Volume 10. [Google Scholar] [CrossRef]
  28. Kennedy, J.; Eberhart, R. Particle swarm optimization. In Proceedings of the IEEE International Conference on Neural Networks, Perth, WA, Australia, 27 November–1 December 1995; IEEE: Piscataway, NJ, USA, 1995; pp. 1942–1948. [Google Scholar] [CrossRef]
  29. Mirjalili, S.; Mirjalili, S.M.; Lewis, A. Grey wolf optimizer. Adv. Eng. Softw. 2014, 69, 46–61. [Google Scholar] [CrossRef]
  30. Abdel-Basset, M.; El-Shahat, D.; Sangaiah, A.K. A modified nature inspired meta-heuristic whale optimization algorithm for solving 0-1 knapsack problem. Int. J. Mach. Learn. Cybern. 2019, 10, 495–514. [Google Scholar] [CrossRef]
  31. Chiaradonna, S.; Di Giandomenico, F.; Murru, N. On enhancing efficiency and accuracy of particle swarm optimization algorithms. Int. J. Innov. Comput. Inf. Control. 2015, 11, 1165–1189. [Google Scholar] [CrossRef]
  32. Manzoni, L.; Mariot, L.; Tuba, E. Tip the balance: Improving exploration of balanced crossover operators by adaptive bias. arXiv. 2020, arXiv:2008.03369. [Google Scholar] [CrossRef]
  33. Chen, Z.J.; Liu, Y.; Yang, L.F.; Zhang, S.B. Optimization of stay cable tension of completed bridge of single-pylon cable-stayed bridge based on particle swarm optimization algorithm. Bridge Constr. 2016, 46, 40–44. [Google Scholar]
  34. Jiang, Z.G.; Zhu, B. Cable force optimization of dissymmetric cable-stayed bridge based on improved particle swarm optimization. Highw. Eng. 2018, 43, 117–121. [Google Scholar]
  35. Sung, Y.C.; Wang, C.Y.; Teo, E.H. Application of particle swarm optimisation to construction planning for cable-stayed bridges by the cantilever erection method. Struct. Infrastruct. Eng. 2016, 12, 208–222. [Google Scholar] [CrossRef]
  36. Hassan, M.M. Optimization of stay cables in cable-stayed bridges using finite element, genetic algorithm, and B-spline combined technique. Eng. Struct. 2013, 49, 643–654. [Google Scholar] [CrossRef]
  37. Hassan, M.M.; Nassef, A.O.; El Damatty, A.A. Determination of optimum post-tensioning cable forces of cable-stayed bridges. Eng. Struct. 2012, 44, 248–259. [Google Scholar] [CrossRef]
  38. Rasmussen, C.E.; Williams, C.K.I. Gaussian Processes for Machine Learning; The MIT Press: Cambridge, MA, USA, 2006. [Google Scholar]
  39. Hittawe, M.M.; Langodan, S.; Beya, O.; Hoteit, I.; Knio, O. Efficient SST prediction in the Red Sea using hybrid deep learning-based approach. In Proceedings of the 2022 IEEE 20th International Conference on Industrial Informatics (INDIN), Perth, WA, Australia, 25–28 July 2022; IEEE: Piscataway, NJ, USA, 2022. [Google Scholar] [CrossRef]
  40. Tahri, O.; Usman, M.; Demonceaux, C.; Fofi, D.; Hittawe, M. Fast earth mover’s distance computation for catadioptric image sequences. In Proceedings of the 2016 IEEE International Conference on Image Processing (ICIP), Phoenix, AZ, USA, 25–28 September 2016; IEEE: Piscataway, NJ, USA, 2016; pp. 101–105. [Google Scholar] [CrossRef]
  41. Mirjalili, S.; Lewis, A. The whale optimization algorithm. Adv. Eng. Softw. 2016, 95, 51–67. [Google Scholar] [CrossRef]
  42. Tizhoosh, H.R. Opposition-based learning: A new scheme for machine intelligence. In Proceedings of the International Conference on Computational Intelligence for Modelling, Control and Automation, Vienna, Austria, 28–30 November 2005; IEEE: Piscataway, NJ, USA, 2005; Volume 1, pp. 695–701. [Google Scholar] [CrossRef]
  43. Yu, F.; Li, Y.X.; Wei, B.; Xu, X.; Zhao, Z.Y. The application of a novel OBL based on lens imaging principle in PSO. Acta Electron. Sin. 2014, 42, 230–235. [Google Scholar] [CrossRef]
  44. Mirjalili, S.; Gandomi, A.H.; Mirjalili, S.Z.; Saremi, S.; Faris, H.; Mirjalili, S.M. Salp swarm algorithm: A bio-inspired optimizer for engineering design problems. Adv. Eng. Softw. 2017, 114, 163–191. [Google Scholar] [CrossRef]
  45. Yao, X.; Liu, Y.; Lin, G. Evolutionary programming made faster. IEEE Trans. Evol. Comput. 1999, 3, 82–102. [Google Scholar] [CrossRef]
  46. Zhang, C.; Duan, C.; Sun, L. Inter-storey isolation versus base isolation using friction pendulum systems. Int. J. Struct. Stab. Dyn. 2024, 24, 2450022. [Google Scholar] [CrossRef]
Figure 1. Flowchart of the EWOSSA optimization procedure, including encircling, hunting, and opposition-based learning phases.
Buildings 15 02503 g001
Figure 2. Visualization of the two benchmark test functions used for algorithm validation.
Buildings 15 02503 g002
Figure 3. Comparison of convergence performance for the standard WOA and SSA and the proposed EWOSSA on the benchmark test functions.
Buildings 15 02503 g003
Figure 5. Elevation view and cross section of the single-tower cable-stayed bridge used as the case study (units: cm).
Buildings 15 02503 g005
Figure 6. Three-dimensional view of the finite element model of the case study cable-stayed bridge.
Buildings 15 02503 g006
Figure 7. Convergence curves for the GPR model hyperparameter optimization.
Buildings 15 02503 g007
Figure 8. Prediction results on the validation dataset for the GPR models optimized with the WOA and EWOSSA.
Buildings 15 02503 g008
Figure 9. Comparison of optimized cable force distributions for the 13 symmetrical cable pairs of the case study bridge across different approaches.
Buildings 15 02503 g009
Figure 10. Vertical displacement along the main girder for the initial state and three optimization methods (2 × 145 m spans).
Buildings 15 02503 g010
Figure 11. Bending moment distribution along the main girder for the initial state and three optimization methods (2 × 145 m spans).
Buildings 15 02503 g011
Figure 12. Distribution of maximum stress within the main girder cross section along its length (2 × 145 m spans).
Buildings 15 02503 g012
Table 1. Final optimal solutions and corresponding fitness values found by the WOA, SSA, and EWOSSA for the benchmark functions.
FunctionOptimization Methodxf(x)
f1WOA[0, 0, 0, 0, 0, 0, 0, 0, 0, 0]0
SSA[0, 1, 2, 0, 0, 0, 1, −1, −1, 2]11.95
EWOSSA[0, 0, 0, 0, 0, 0, 0, 0, 0, 0]0
f2WOA[−301.71, −302.84, −302.72, −303.60, −126.24, −302.81, −300.48, −304.65, −122.34, −301.77]−3510.35
SSA[−302.52, −302.53, 65.55, 420.97, 420.97, −302.52, −25.88, 420.97, 203.81, 420.97]−2867.13
EWOSSA[−297.86, −298.67, −305.53, −310.90, −296.90,
−298.39, −307.88, −304.27, −300.70, −303.38]
−4187.55
Table 2. Key material properties of the main components of the case study bridge.
ComponentMaterialUnit WeightElastic ModulusPoisson’s Ratio
Main girderC60263.65 × 1040.2
TowerC50263.55 × 1040.2
PierC40263.25 × 1040.2
Pile capC30263.0 × 1040.2
Cable1860 MPa steel strand78.51.95 × 1050.3
Table 3. Performance metric comparison (R2, MAE, and RMSE) for the GPR models optimized with the standard WOA and the proposed EWOSSA.
MetricWOA-GPREWOSSA-GPR
R20.85960.9896
MAE21.314.5
RMSE29.320.4
Table 4. Quantitative comparison of cable force uniformity metrics corresponding to the distributions shown in Figure 9.
Initial StateInternal-Force EquilibriumZero DisplacementEWOSSA-GPR
Mean value (kN)4000.004607.695790.775301.00
Standard deviation (kN)463.27119.041596.34209.89
Uniformity coefficient0.120.030.280.04
Improvement ratio-77.7%−138.1%65.8%
Table 5. Quantitative comparison of main girder displacement metrics for the initial state and three optimization methods.
Initial StateInternal-Force EquilibriumZero DisplacementEWOSSA-GPR
Maximum displacement (mm)−66.18−44.85−27.18−30.13
Improvement ratio-32.2%58.9%54.5%
Mean value (mm)−42.89−30.64−4.69−18.24
Improvement ratio-28.6%89.1%57.5%
Table 6. Comparison of key bending moment metrics for the main girder.
Initial StateInternal-Force EquilibriumZero DisplacementEWOSSA-GPR
Maximum moment (kN·m)154,993.1987,066.66381,408.92128,233.47
Improvement ratio-43.8%−146.1%17.3%
Minimum moment (kN·m)−759,352.56−596,710.65−110,059.38−328,628.29
Improvement ratio-21.4%85.5%56.7%
Mean value (kN·m)−4641.366523.8142,127.9620,030.43
Table 7. Quantitative comparison of maximum stress metrics within the main girder.
Initial StateInternal-Force Equilibrium Zero DisplacementEWOSSA-GPR
Maximum value (kPa)6497365036941904
Improvement ratio-43.8%43.1%70.7%
Mean value (kPa)252112411539596
Improvement ratio-50.8%39.1%76.4%
Disclaimer/Publisher’s Note: The statements, opinions and data contained in all publications are solely those of the individual author(s) and contributor(s) and not of MDPI and/or the editor(s). MDPI and/or the editor(s) disclaim responsibility for any injury to people or property resulting from any ideas, methods, instructions or products referred to in the content.

