
Fire Hazard Risk Grading of Timber Architectural Complexes Based on Fire Spreading Characteristics


Abstract
1. Introduction
2. Materials and Methods
2.1. Fire Hazard Spreading Risk Characteristics of Architectural Complexes
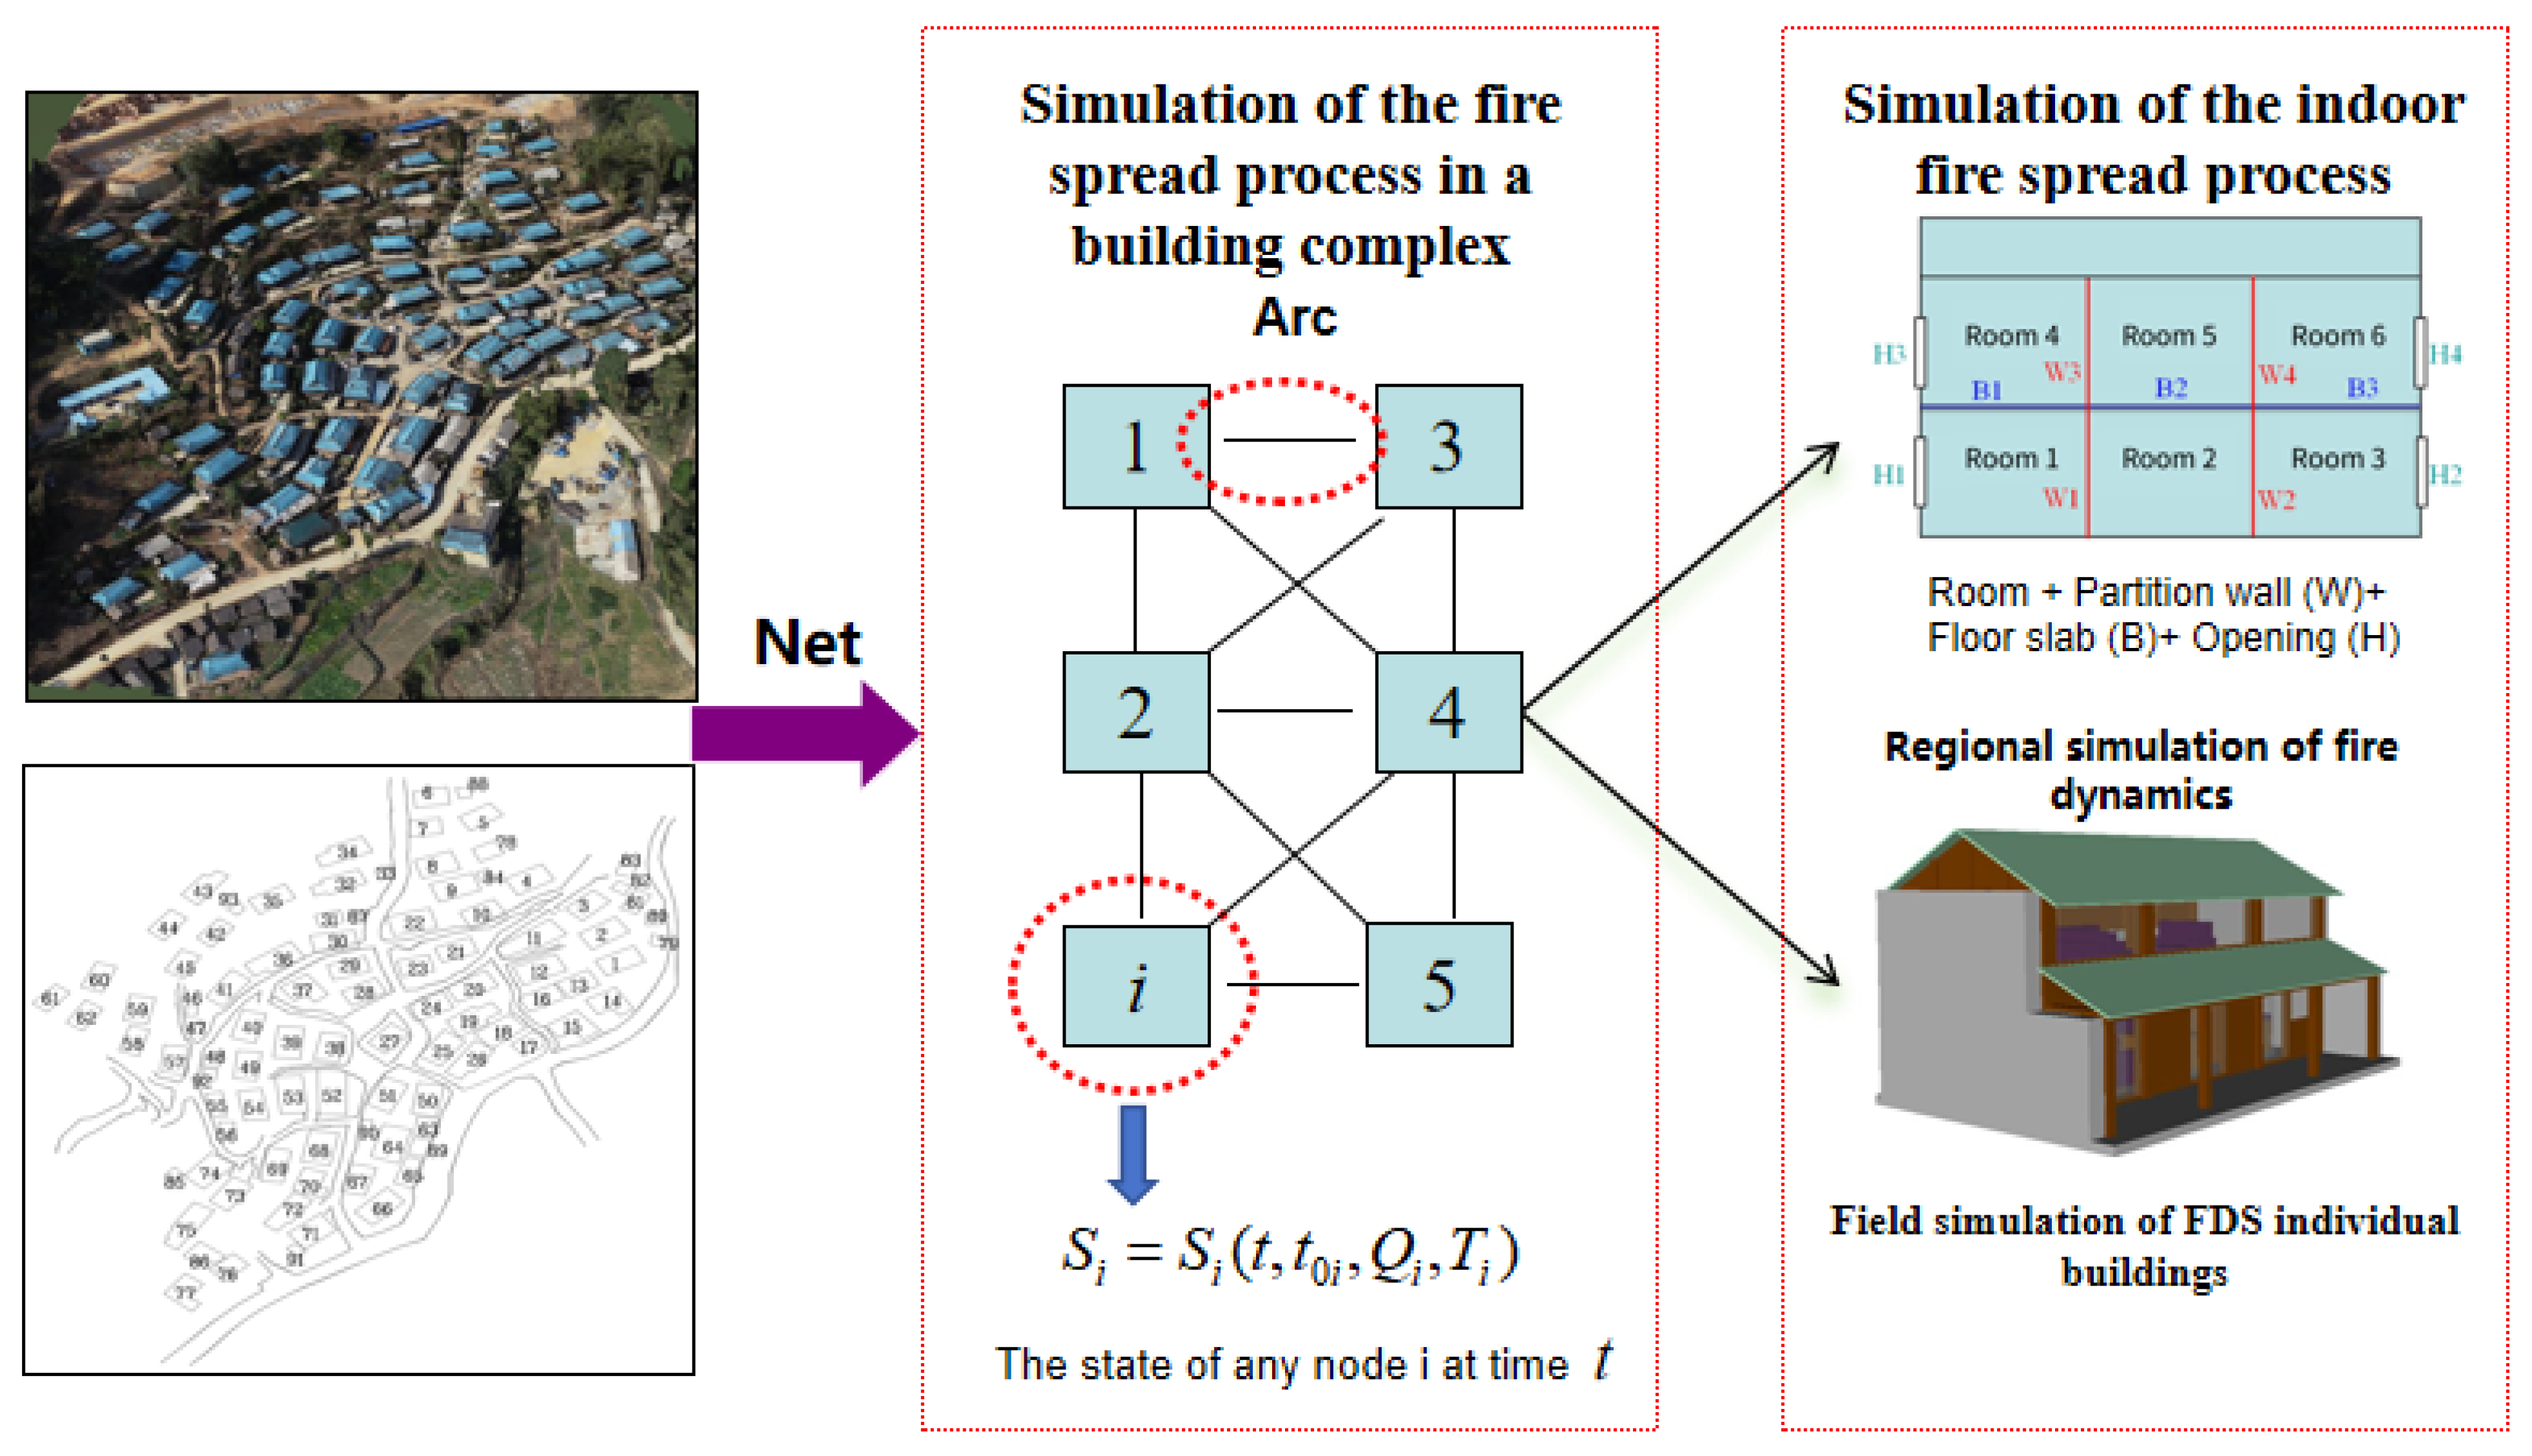
2.1.1. Fire Spread Process in Building Clusters
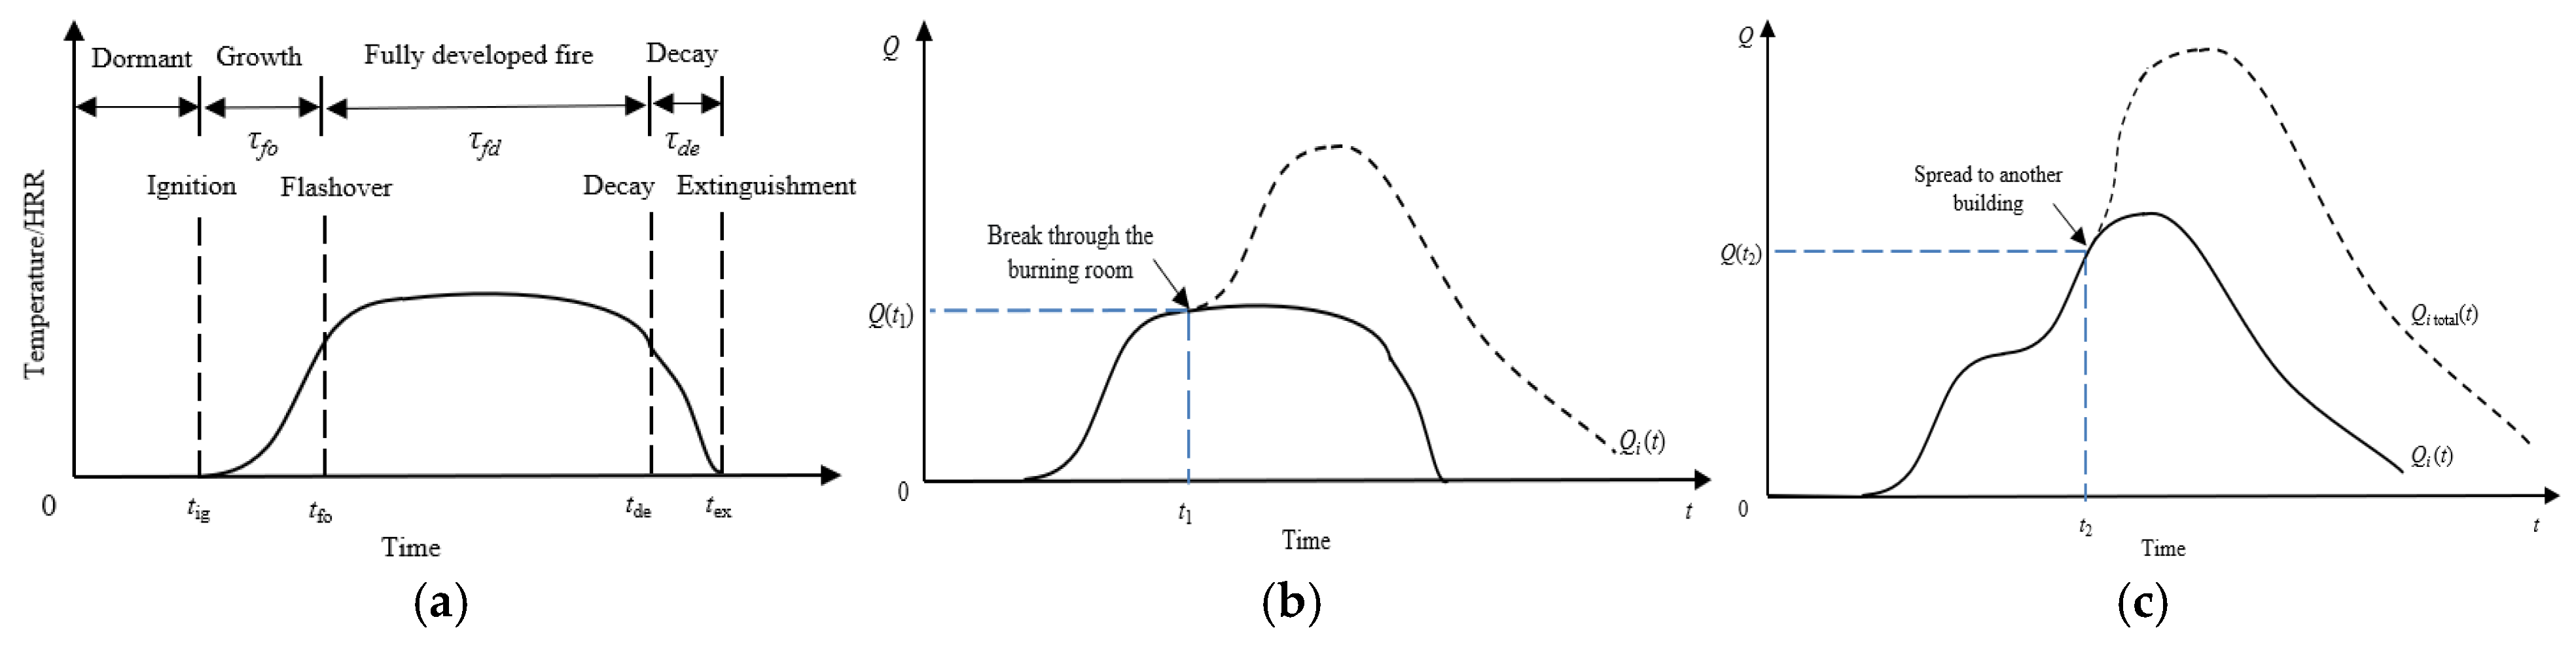
Fire Spread Development Process
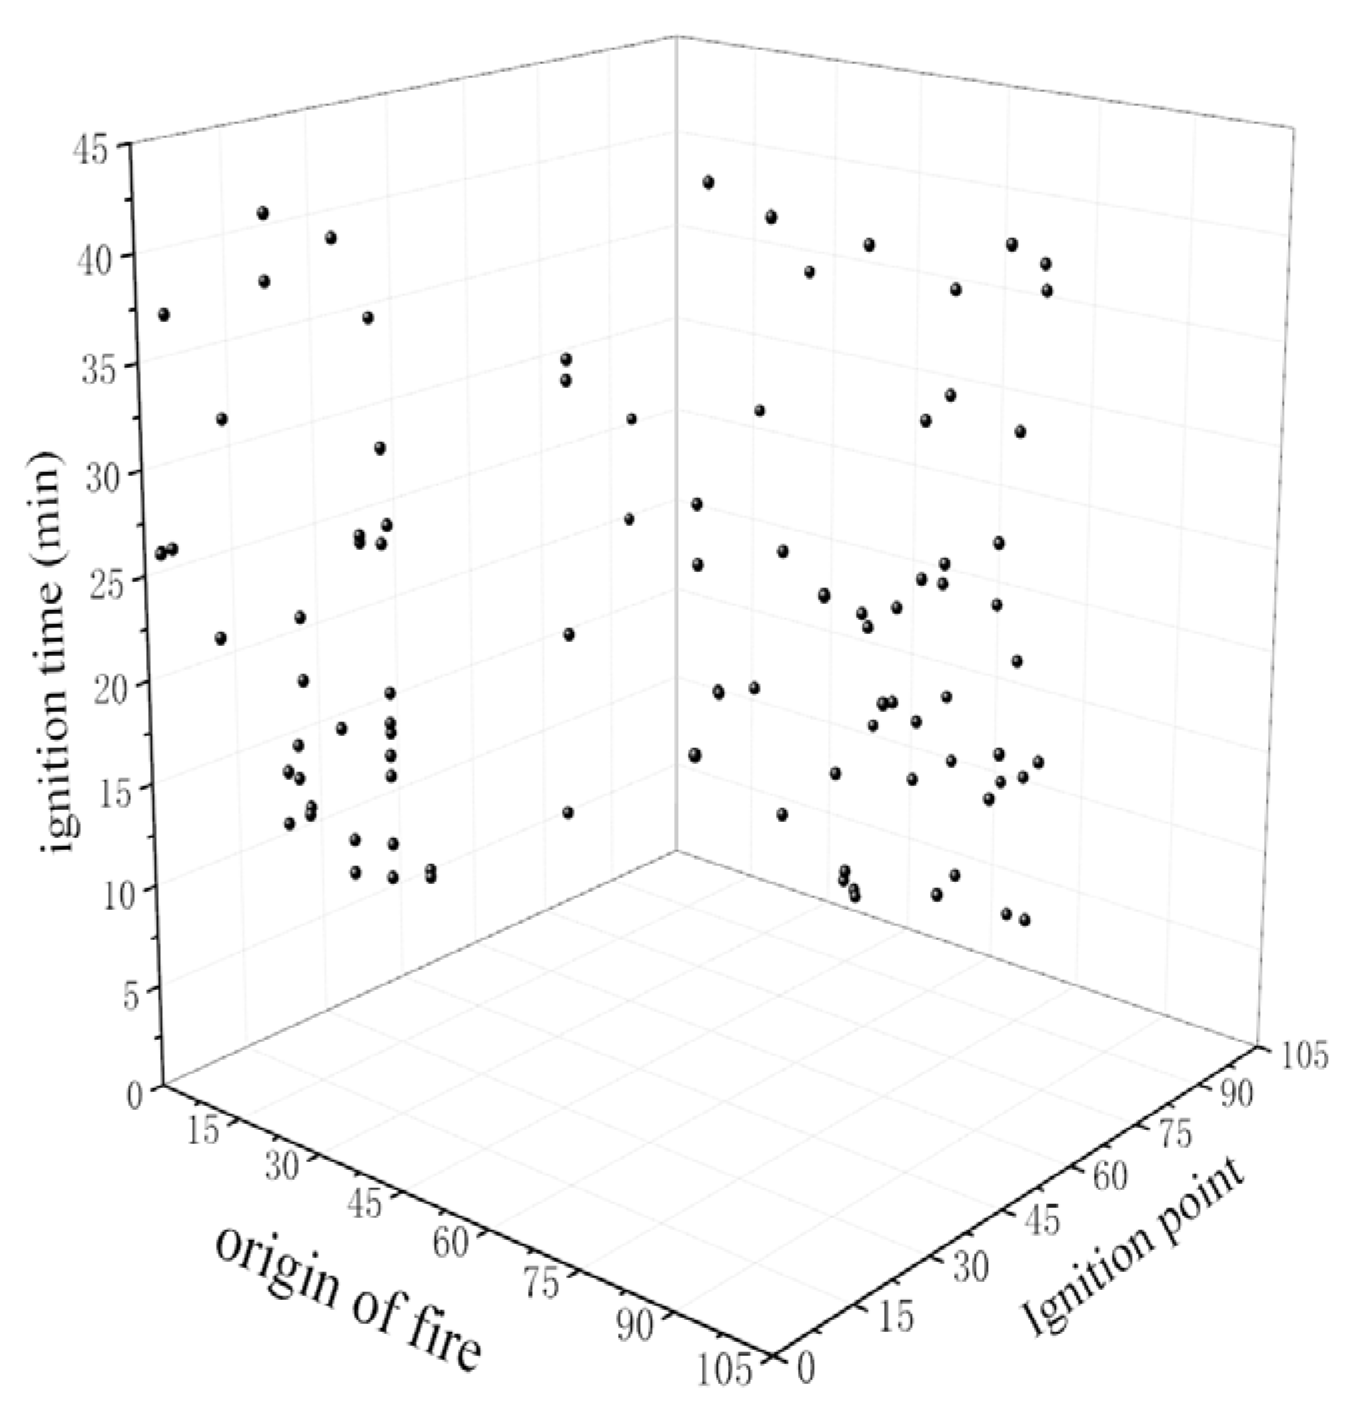
Simulation of Fire Spread Process in Building Clusters
- (1)
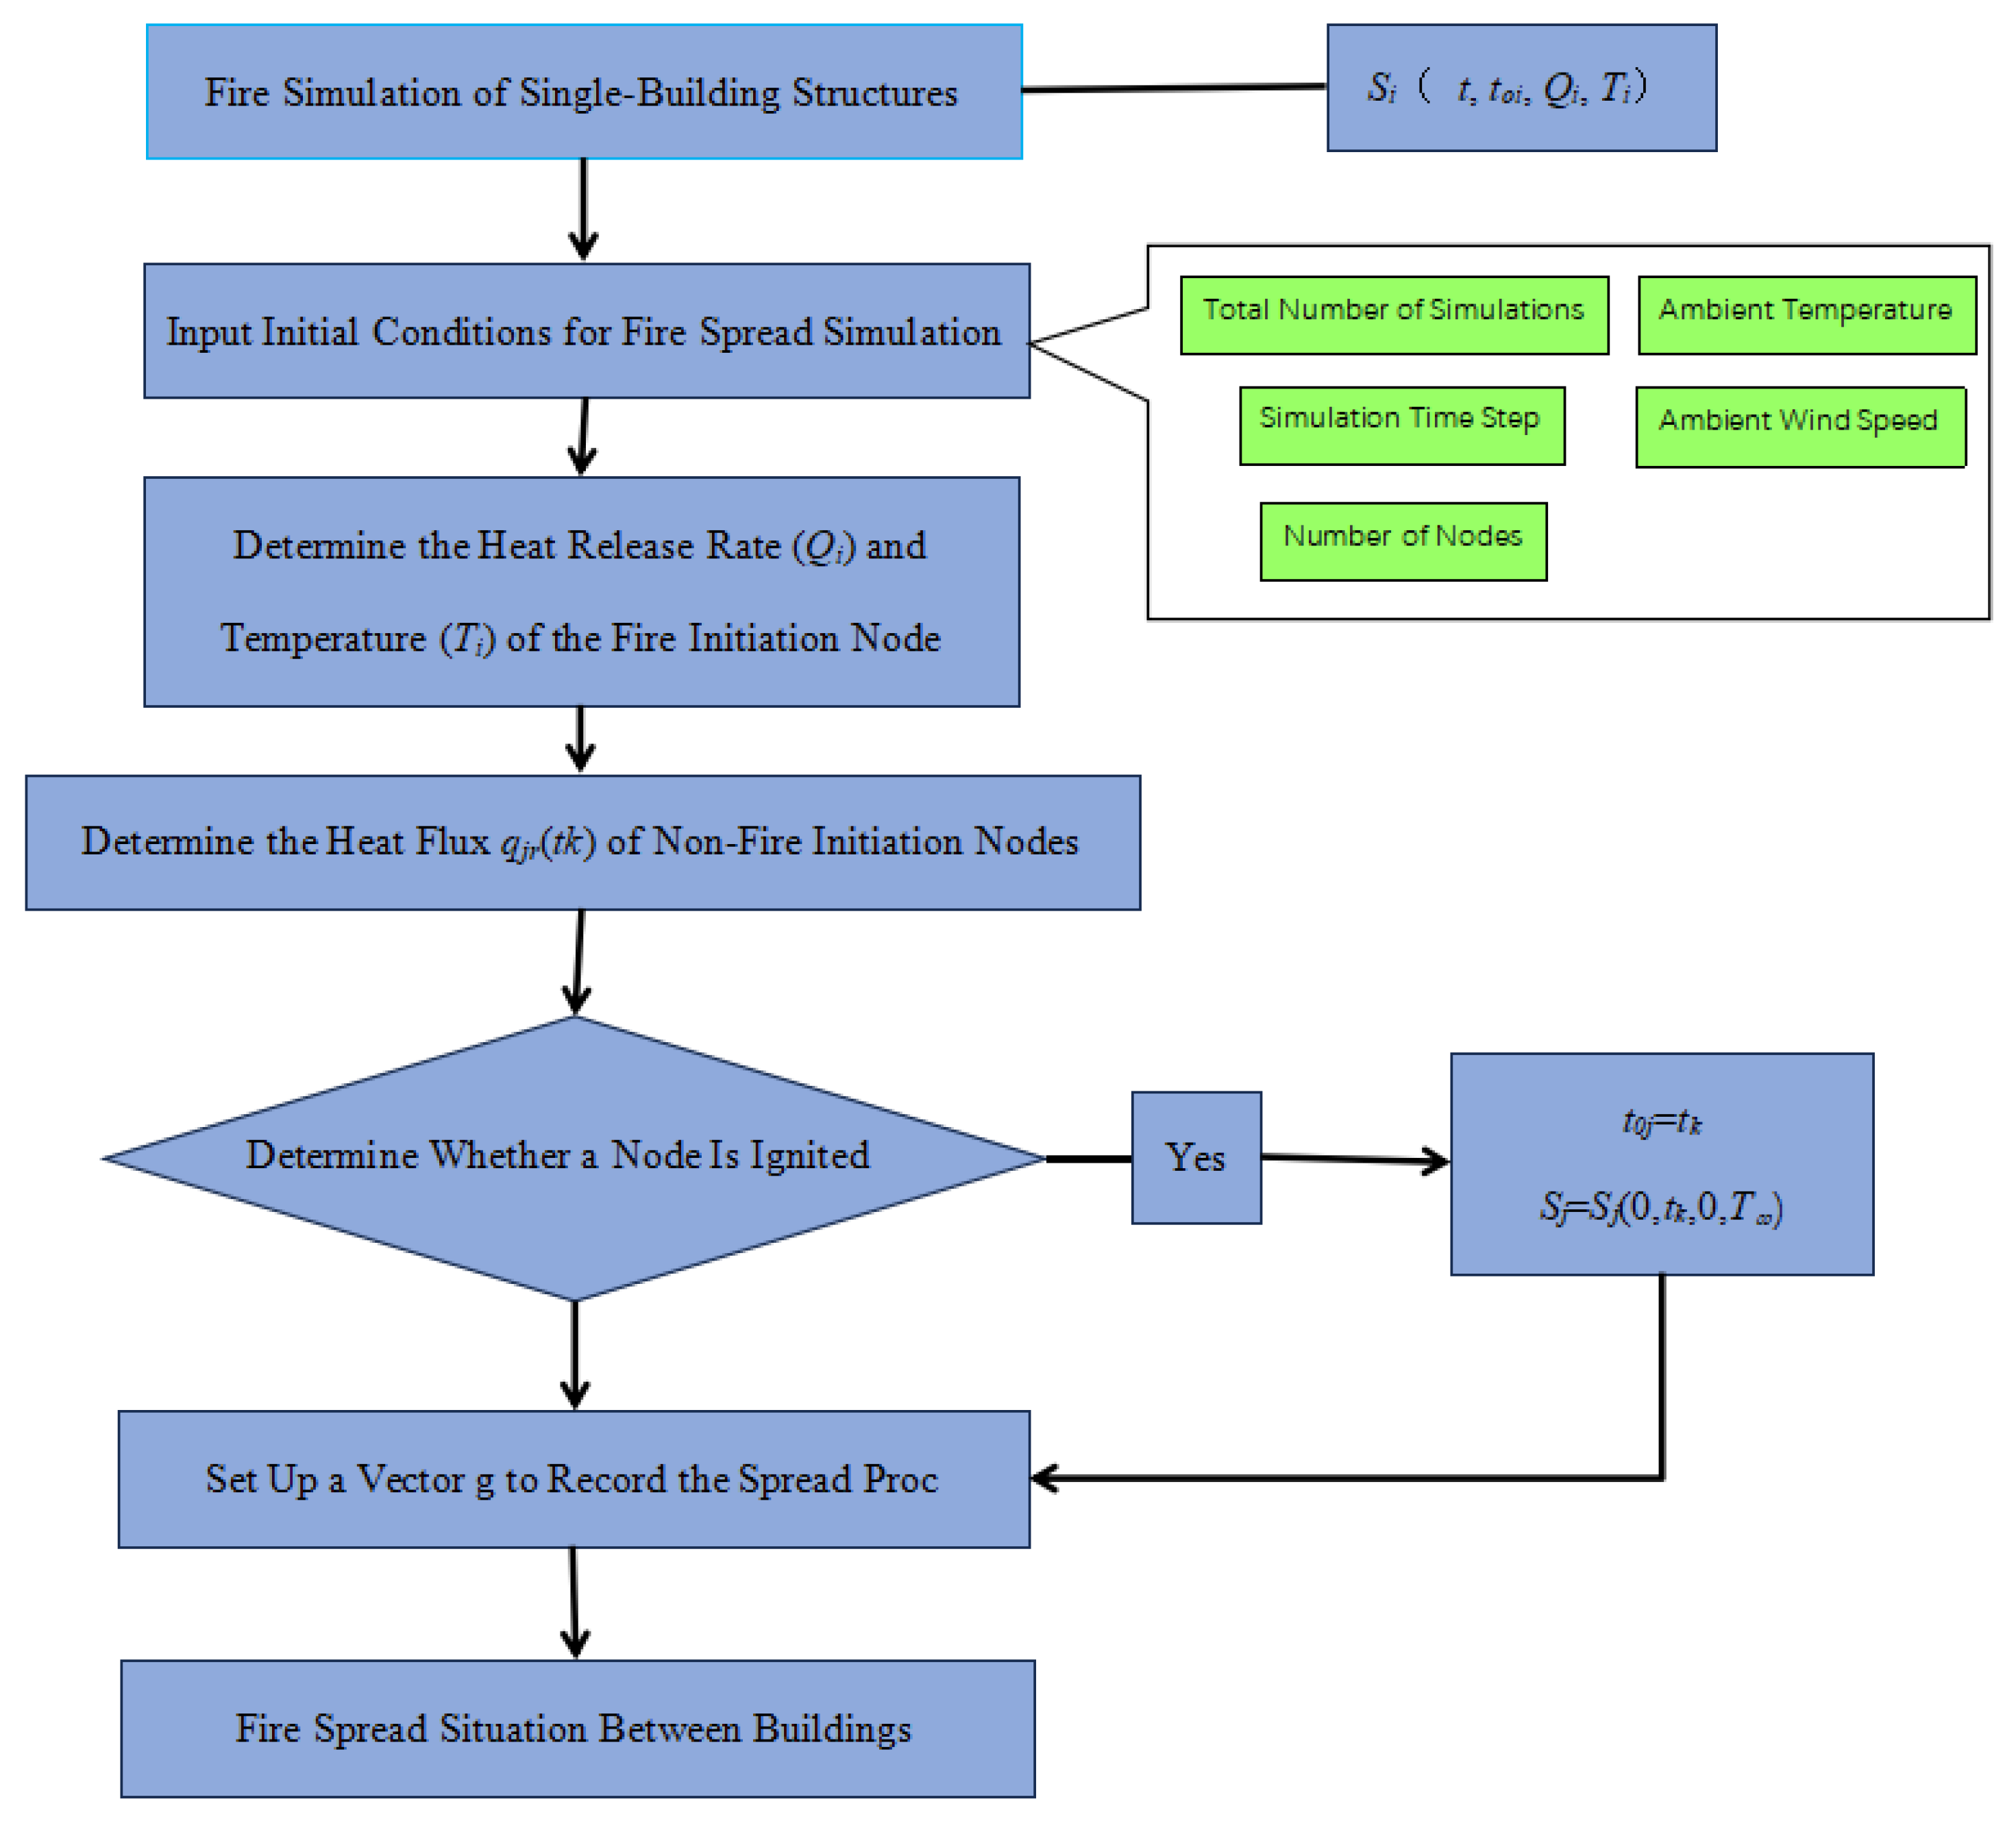
- Single-building fire simulation: Based on the building characteristics, analyze the fire development process in a single building to determine the state of the single building at different time nodes, denoted as Si(t, t0i, Qi, Ti).
- (2)
- Determine the initial conditions for fire spread simulation, mainly including environmental conditions such as wind speed and ambient temperature, simulation conditions such as the number of nodes in the building cluster, simulation time step dt, and total simulation steps Nt, as well as the initial conditions for the nodes. For the initially ignited node, its ignition time is set as t0i = 0, and its initial state is set as Si = Si(0, 0, 0, T∞). For non-ignited nodes, their ignition time is assigned a large value, which can be taken as t0i = (Nt + 1)dt during calculation, and their initial state is set as Si = Si(0, (Nt + 1)dt, 0, T∞).
- (3)
- Update the nodal states at different simulation times tk = kdt, (k = 1, 2, …, Nt) to determine the ignition status of different nodes. The nodal state update can be performed as follows: ① For all ignited nodes (satisfying t0i ≤ tk), interpolate their heat release rate Qi and temperature Ti at time tk using the HRR and temperature interpolation curves of individual buildings. ② Calculate the total heat flux qjr(tk) exerted by all ignited nodes on each non-ignited node j (satisfyingt0i = (Nt + 1)dt) at time tk based on the inter-building fire spread relationship determination method. ③ Determine whether node j is ignited. If node j is ignited, set t0j = tk and update its state to Sj = Sj(0, tk, 0, T∞). ④ Define a 1 × M row vector g as the ignition time vector during the simulation to record the temporal process of fire spread among buildings. The i-th element of vector g records the ignition time of node i.
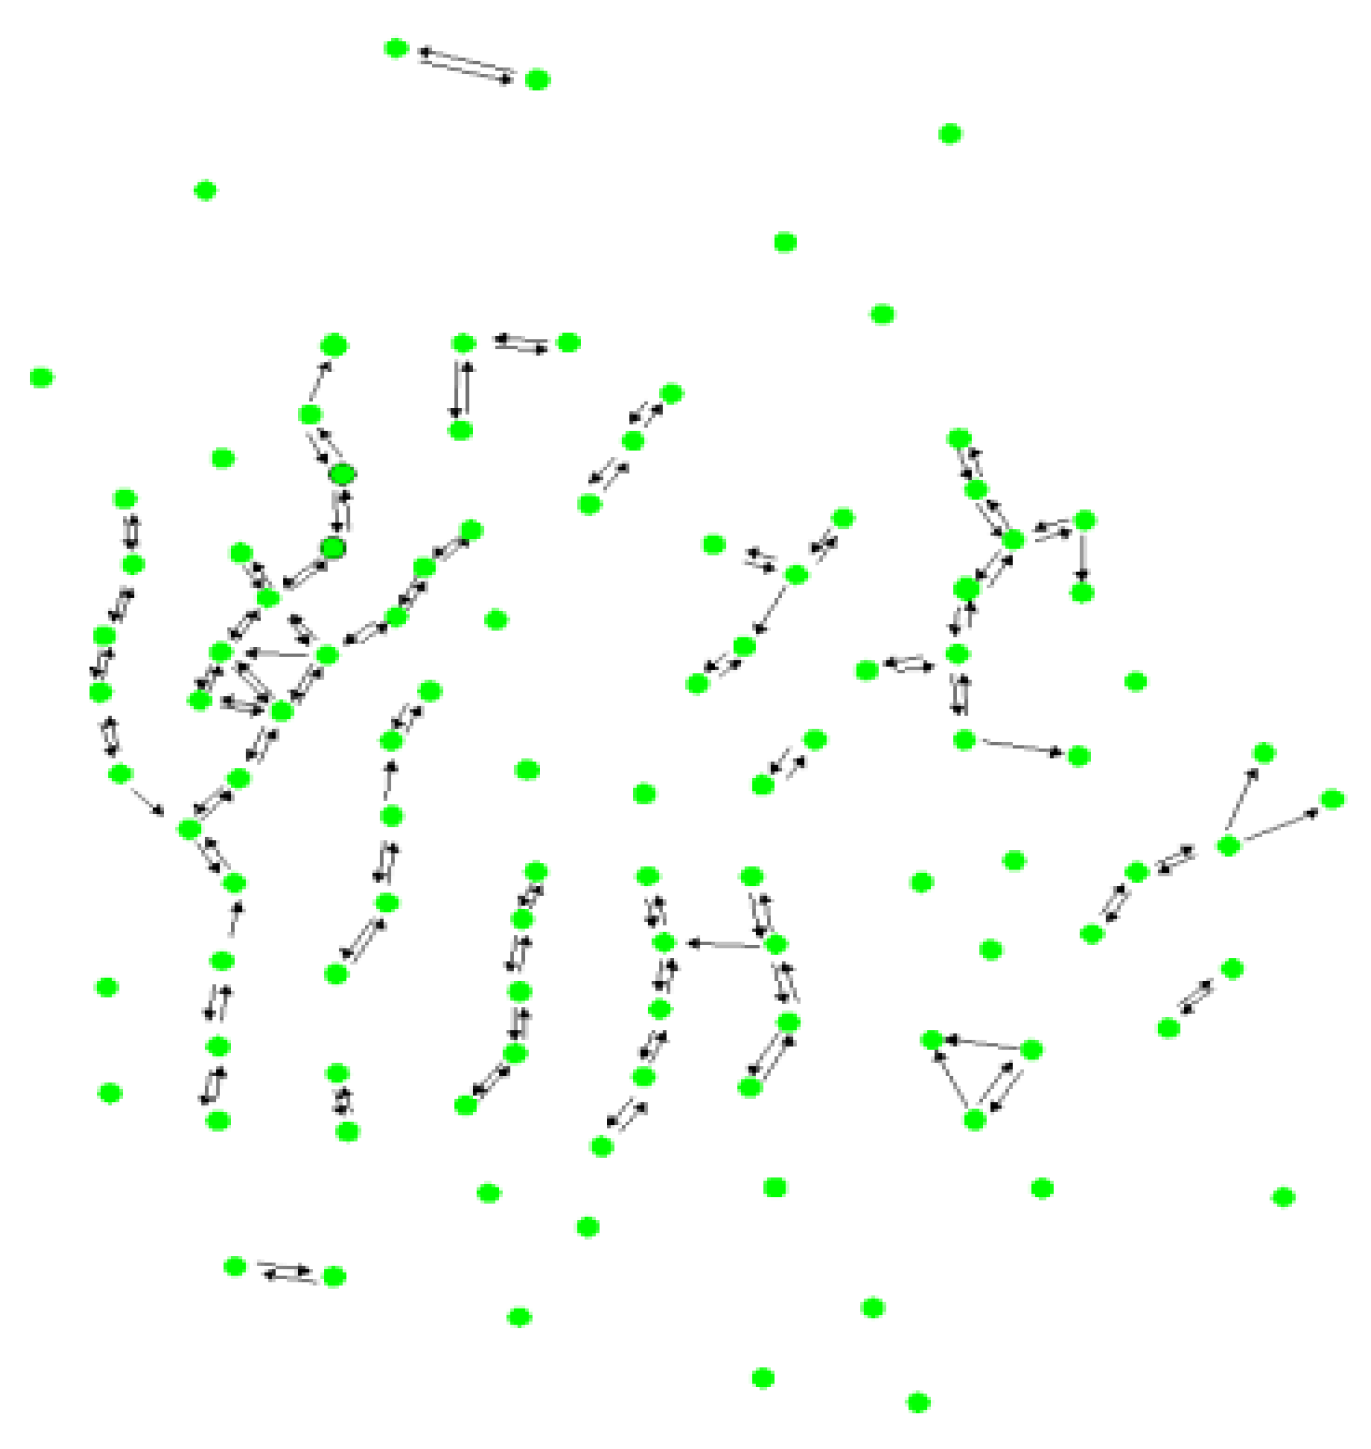
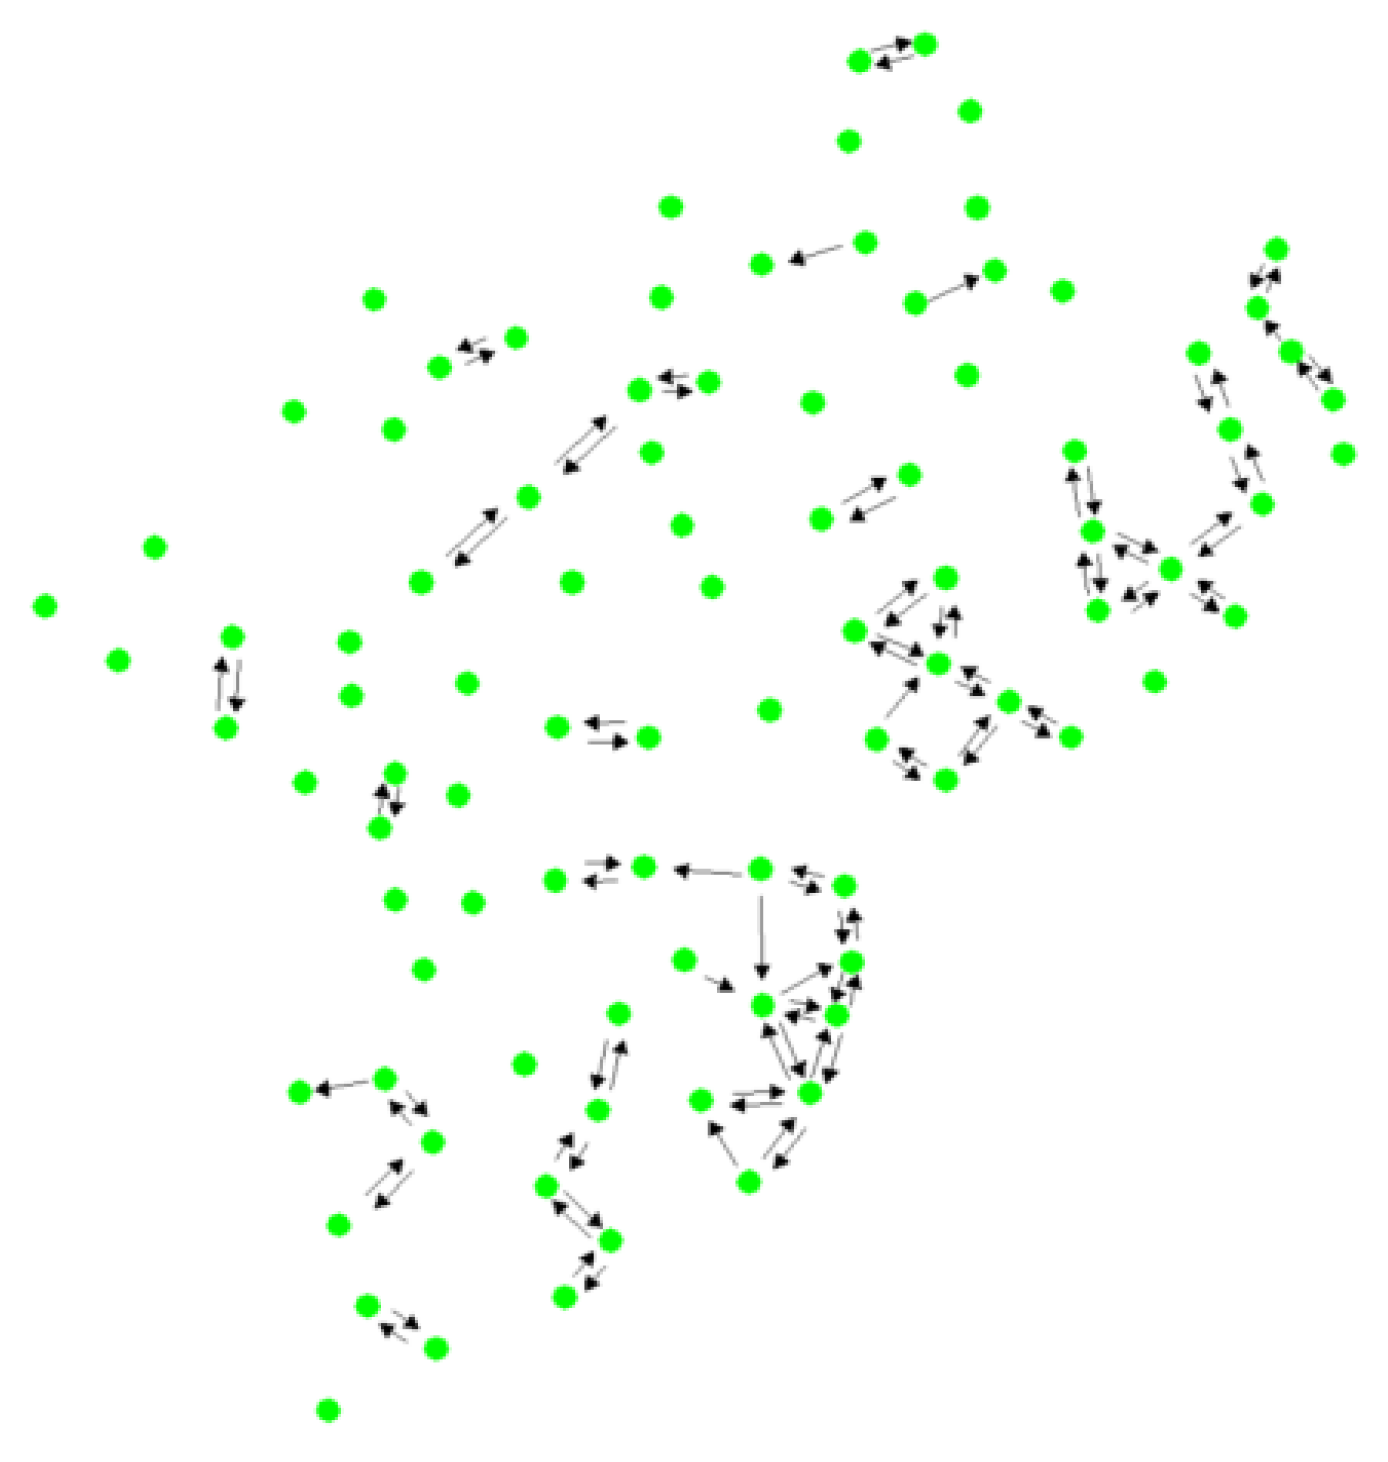
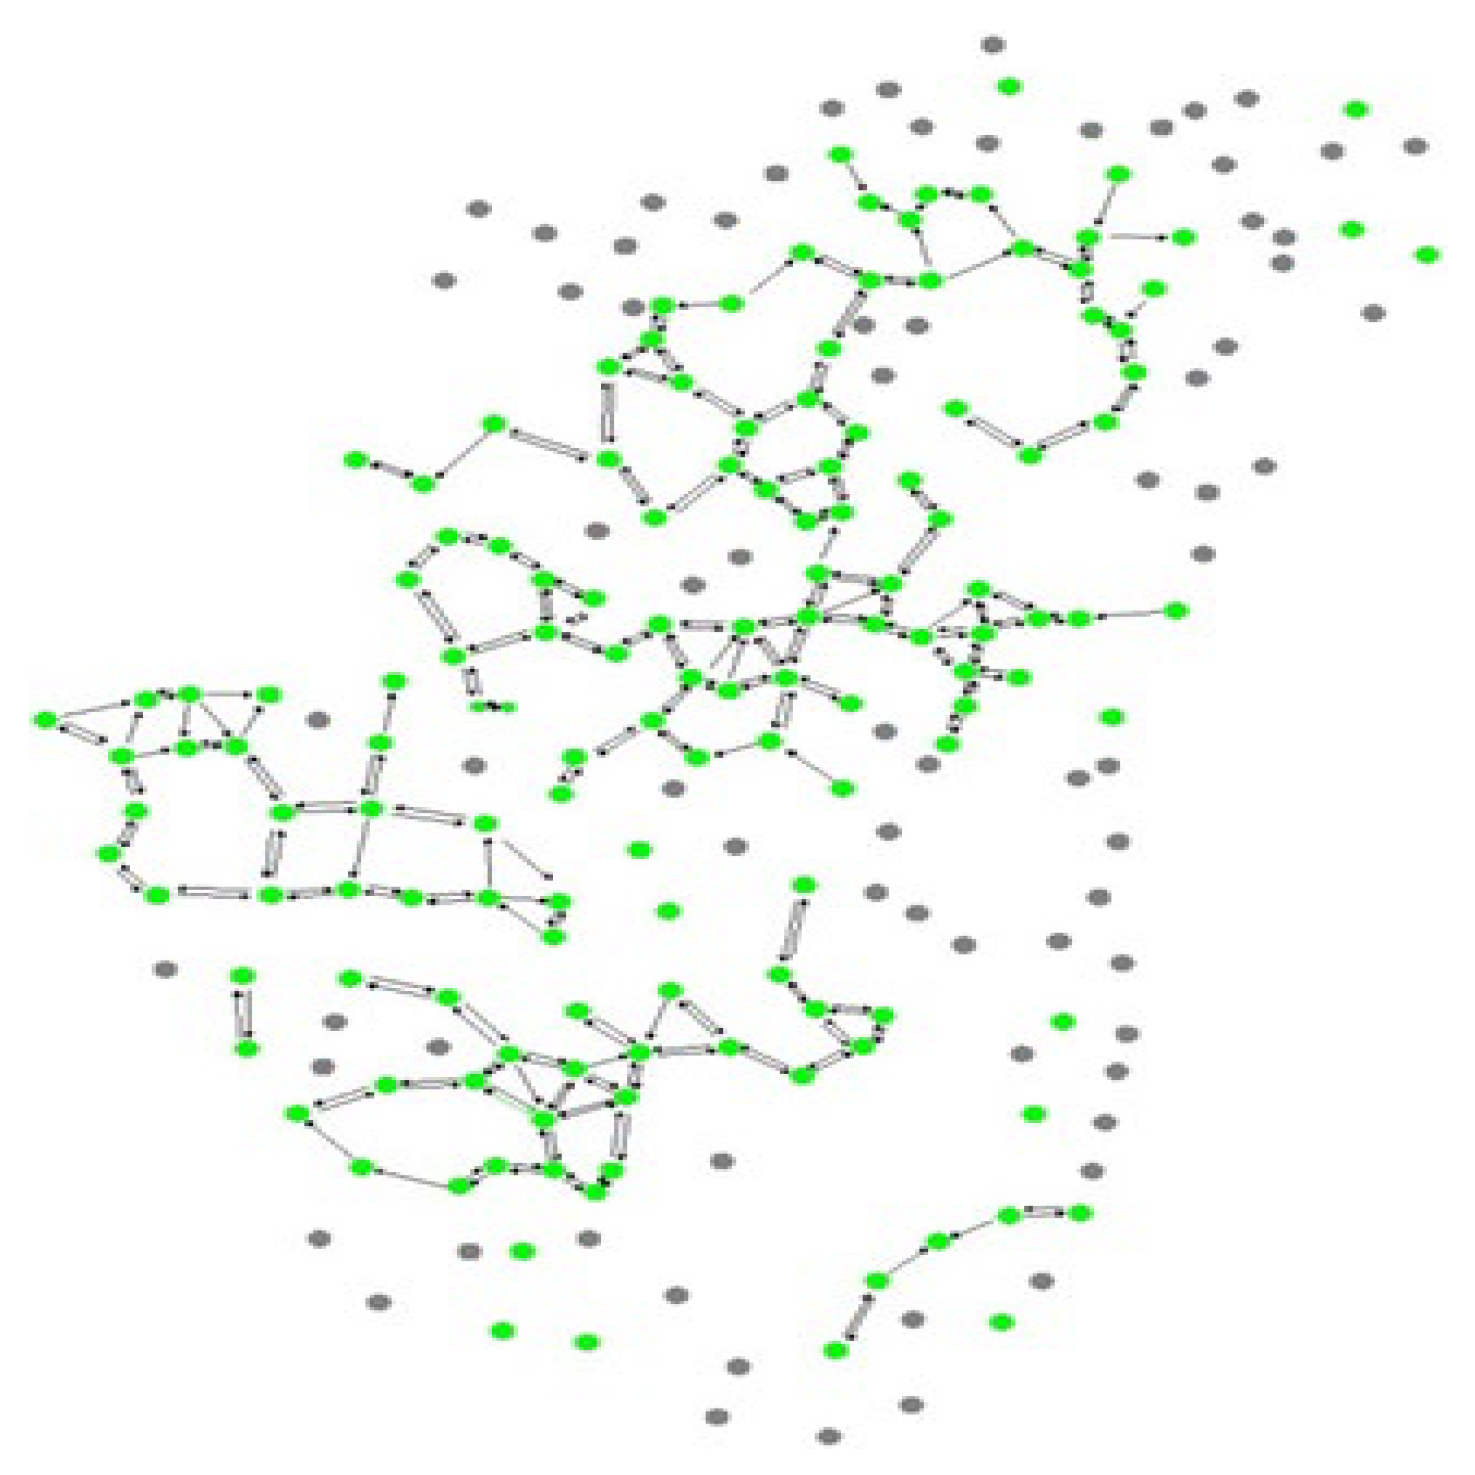
2.1.2. Directed Graph Model
2.1.3. Fire Hazard Spreading Characteristics
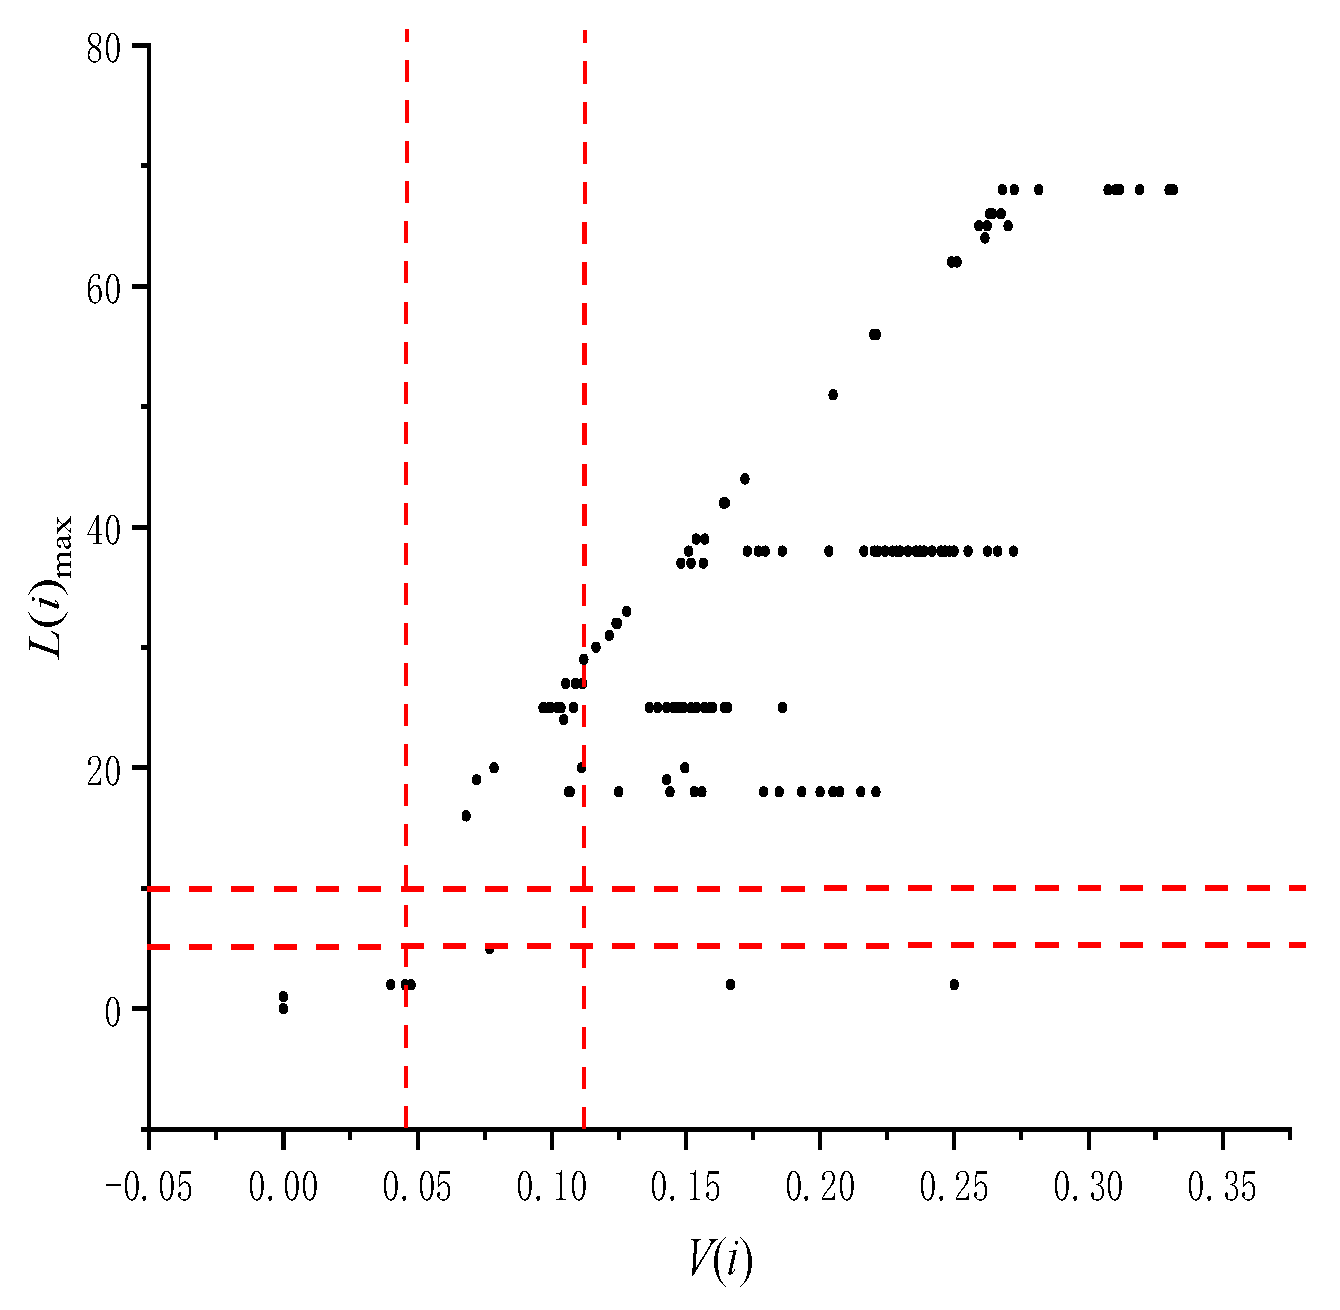
2.1.4. Sensitivity Analysis Method for Fire Spread Networks
2.2. Fire Hazard Risk Partition Model
2.2.1. Fire Hazard Spreading Risk of Single Buildings
2.2.2. Fire Hazard Spreading Risk of Architectural Complexes
2.2.3. Fire Spread Prevention and Control Strategies
3. Results
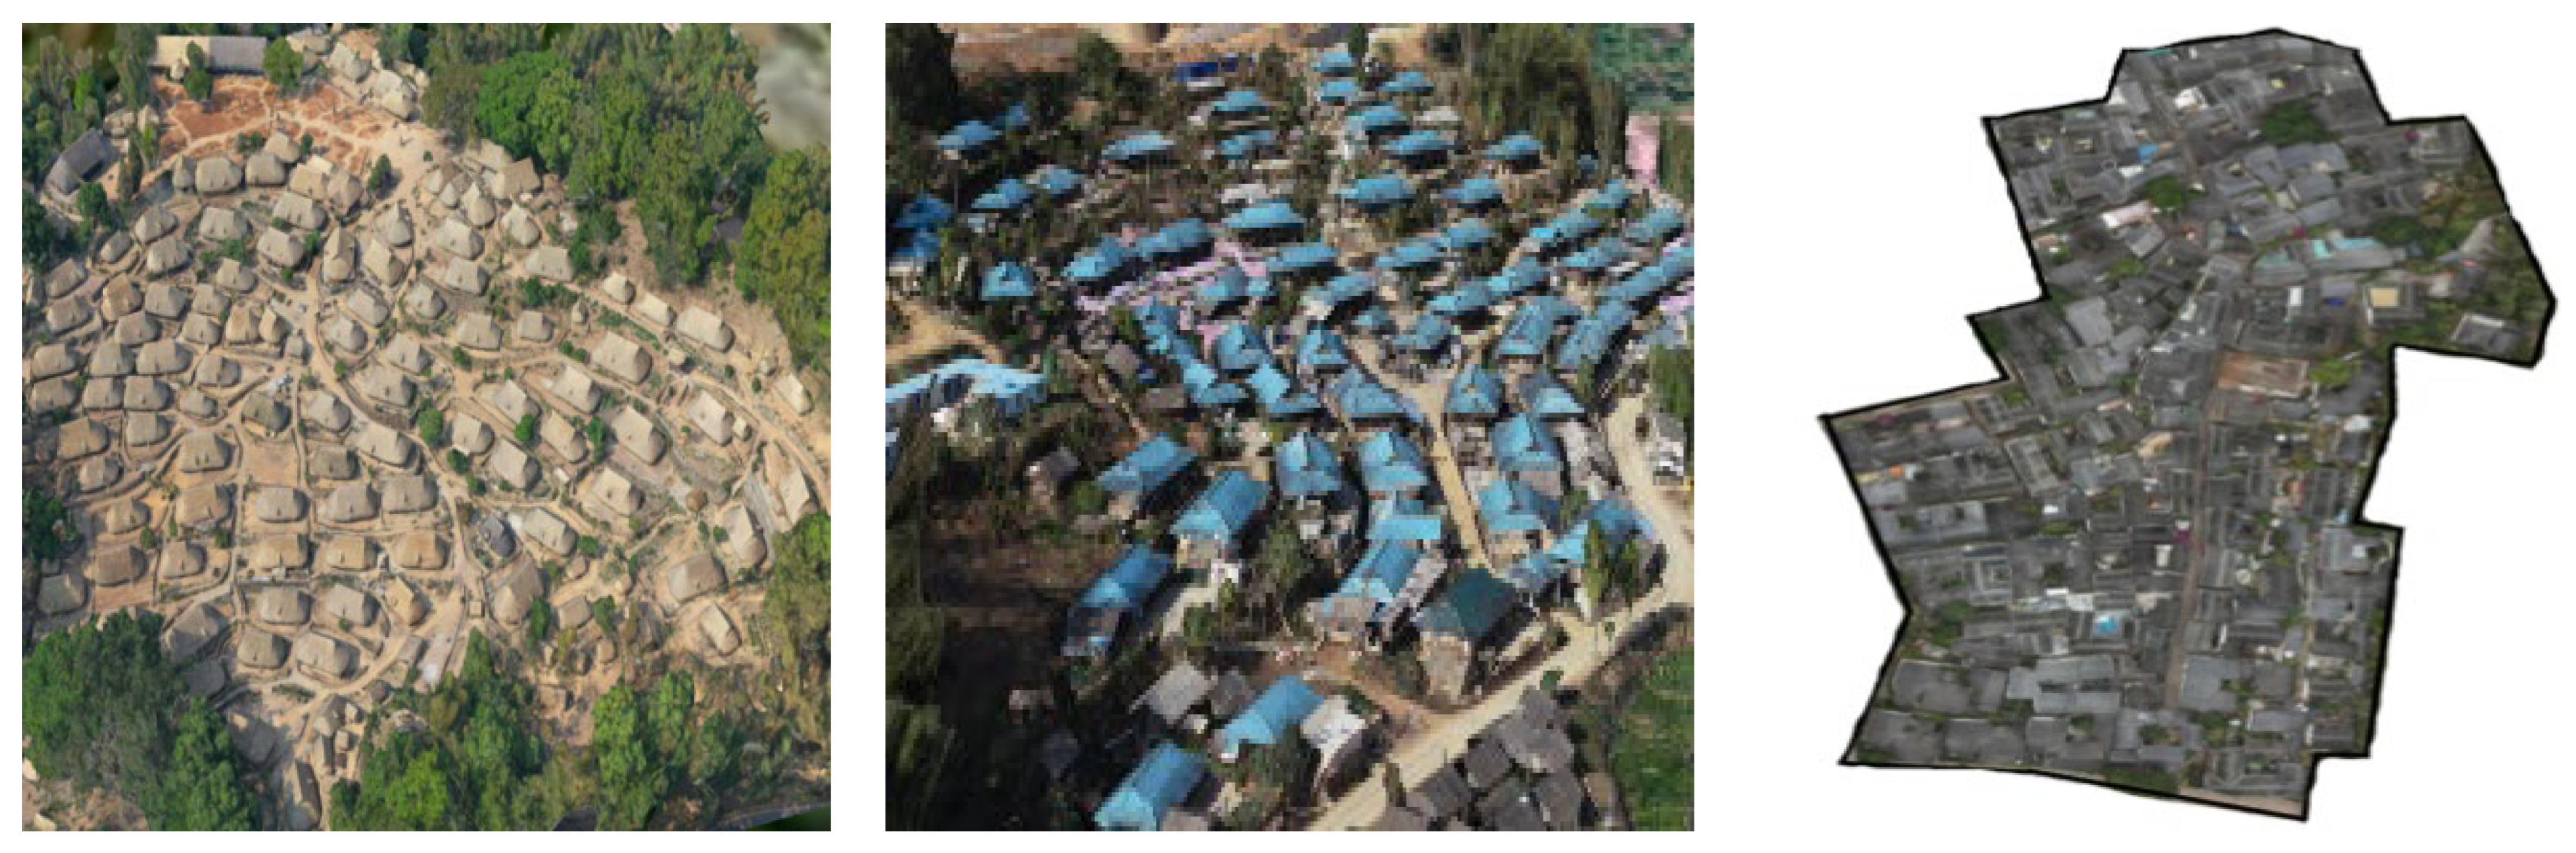
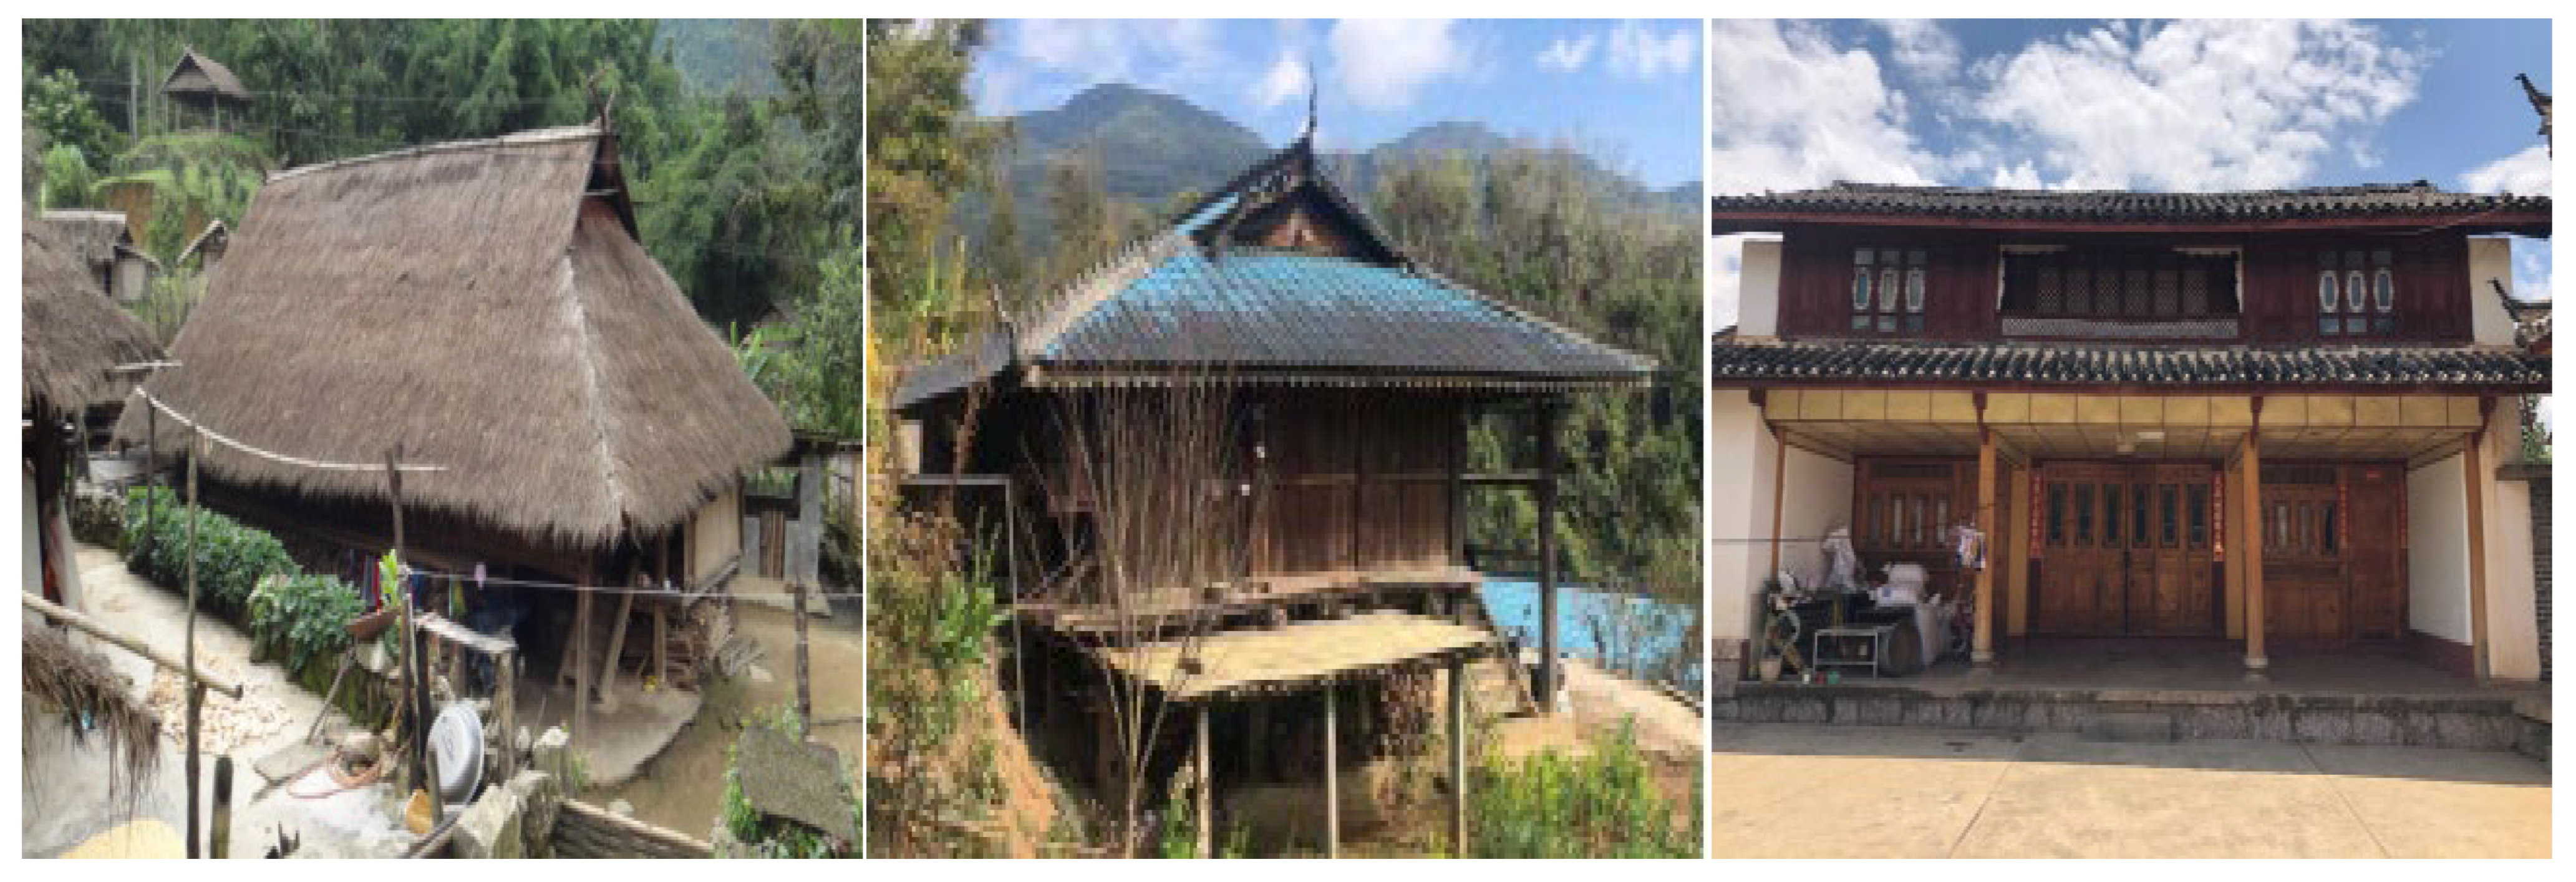
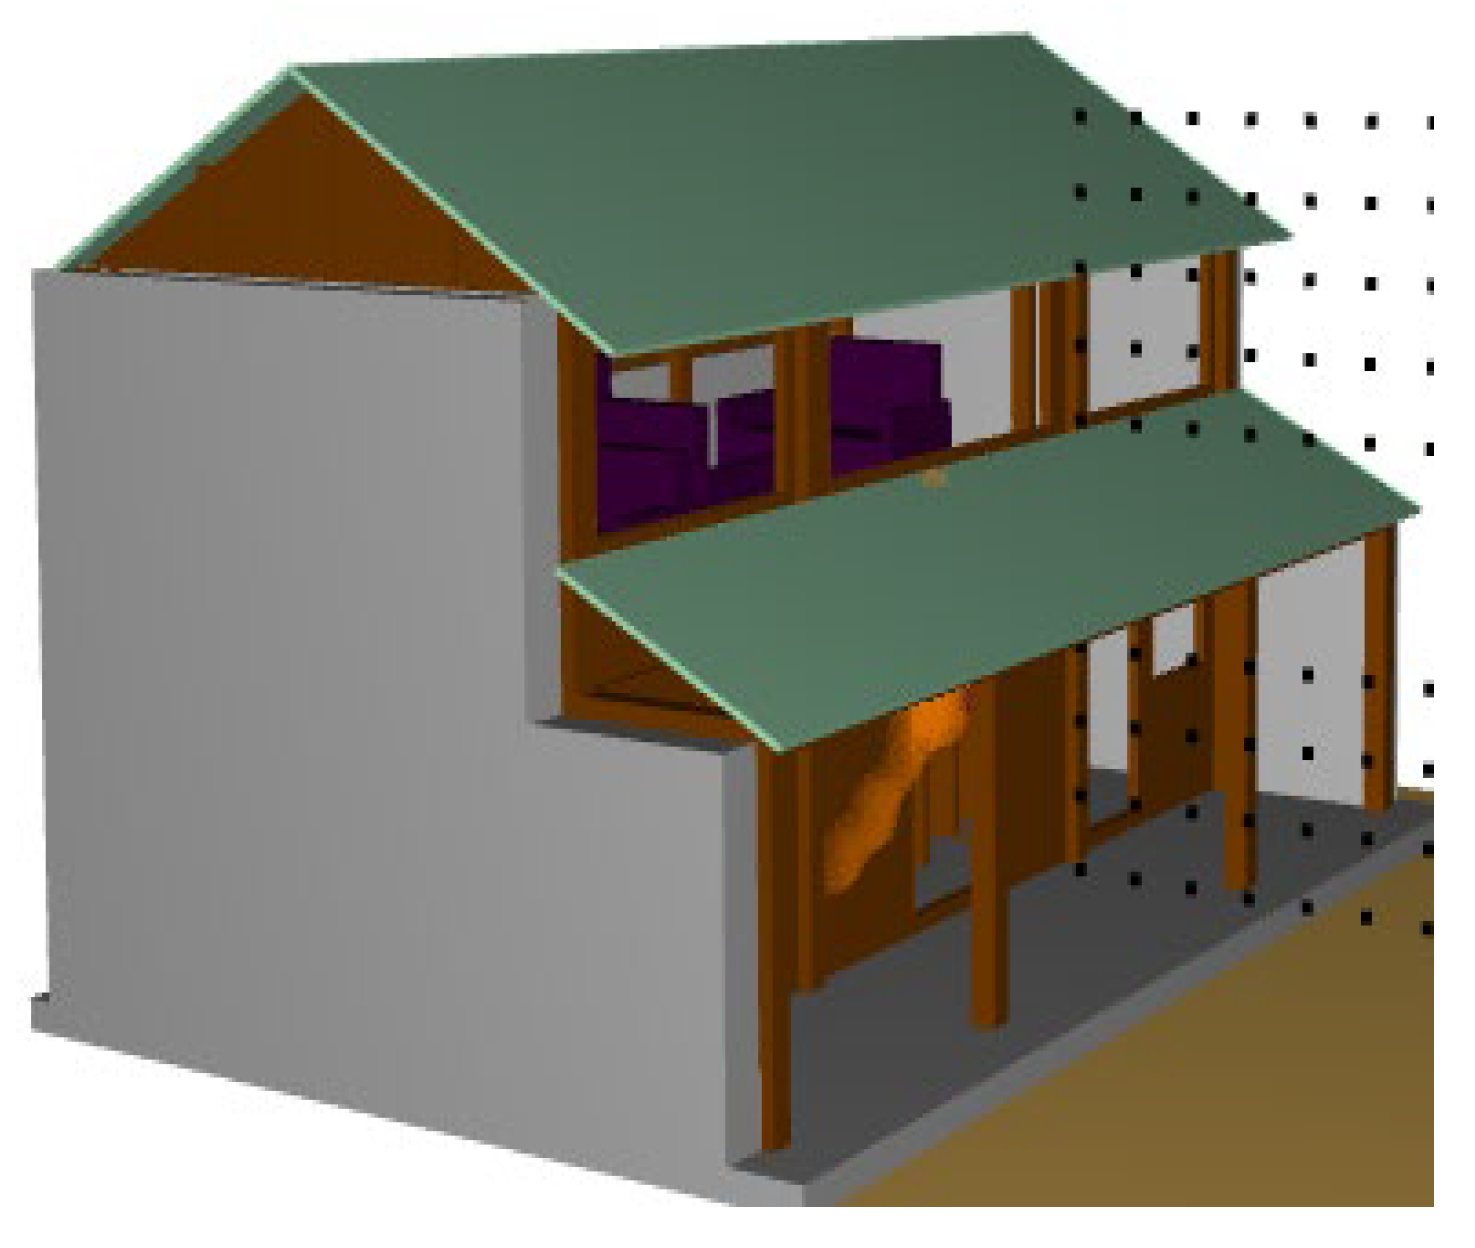
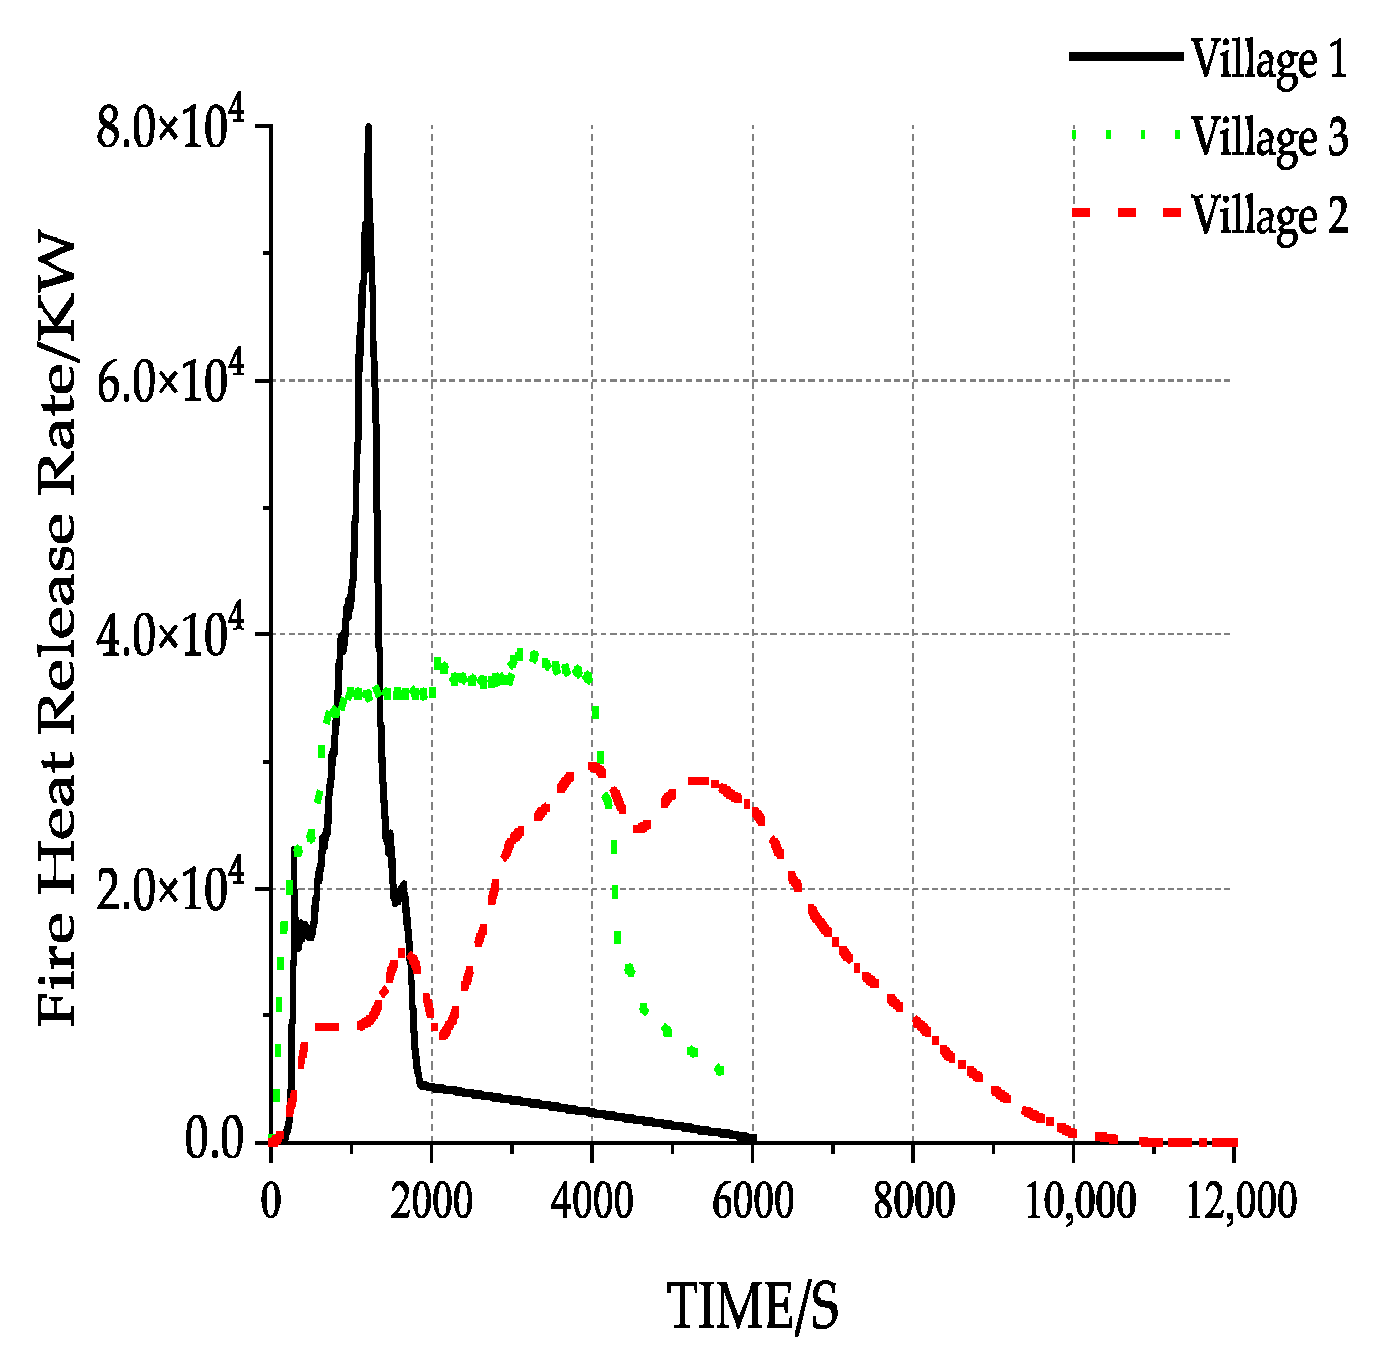
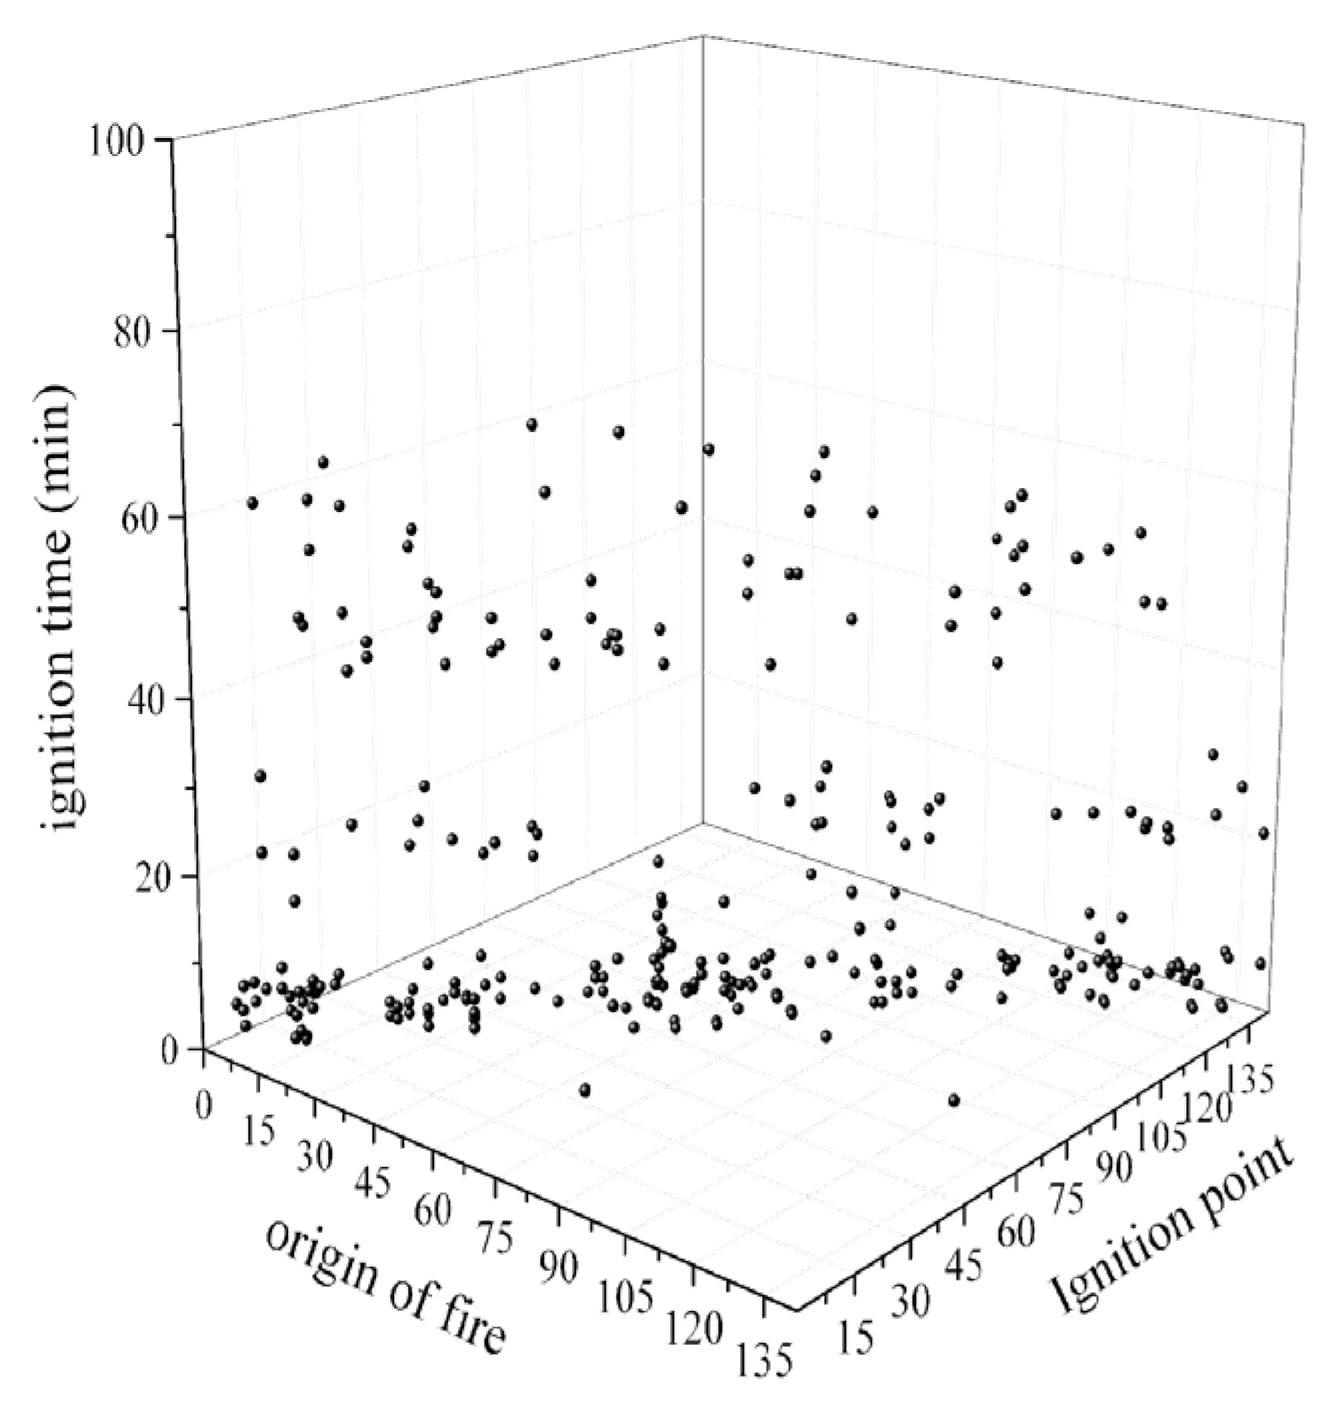
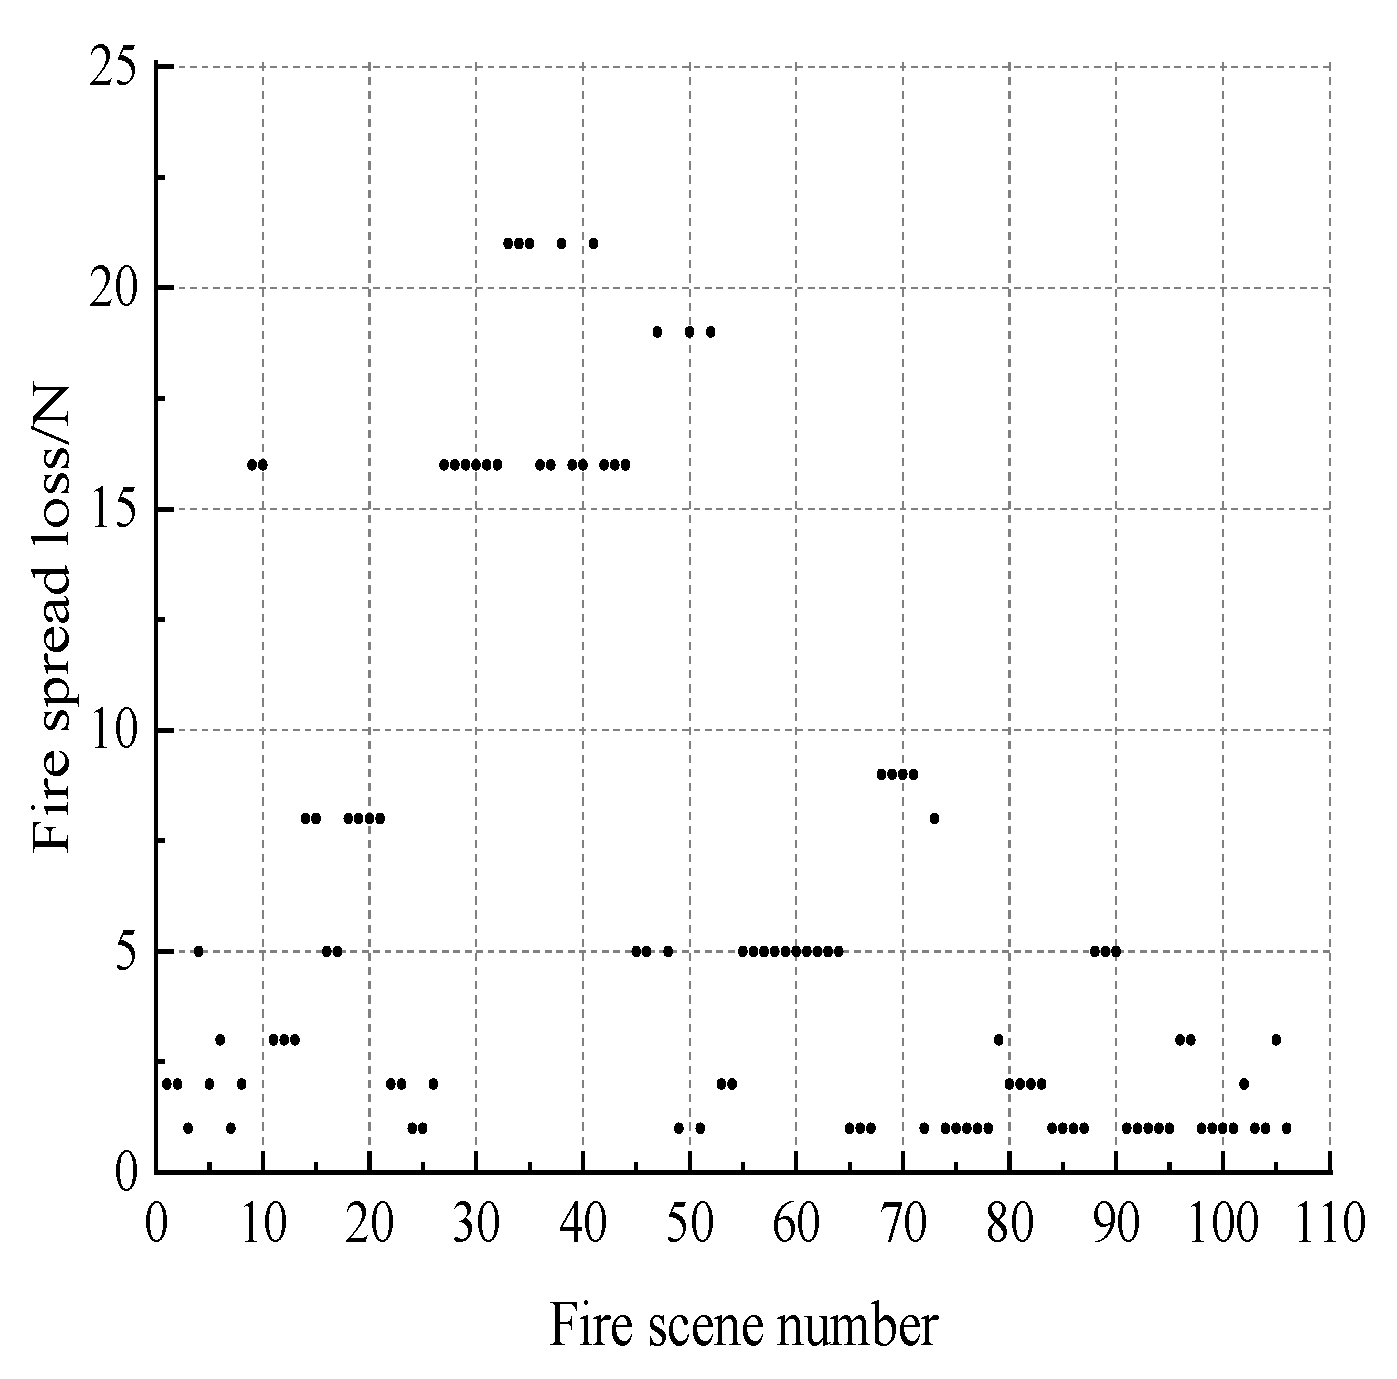
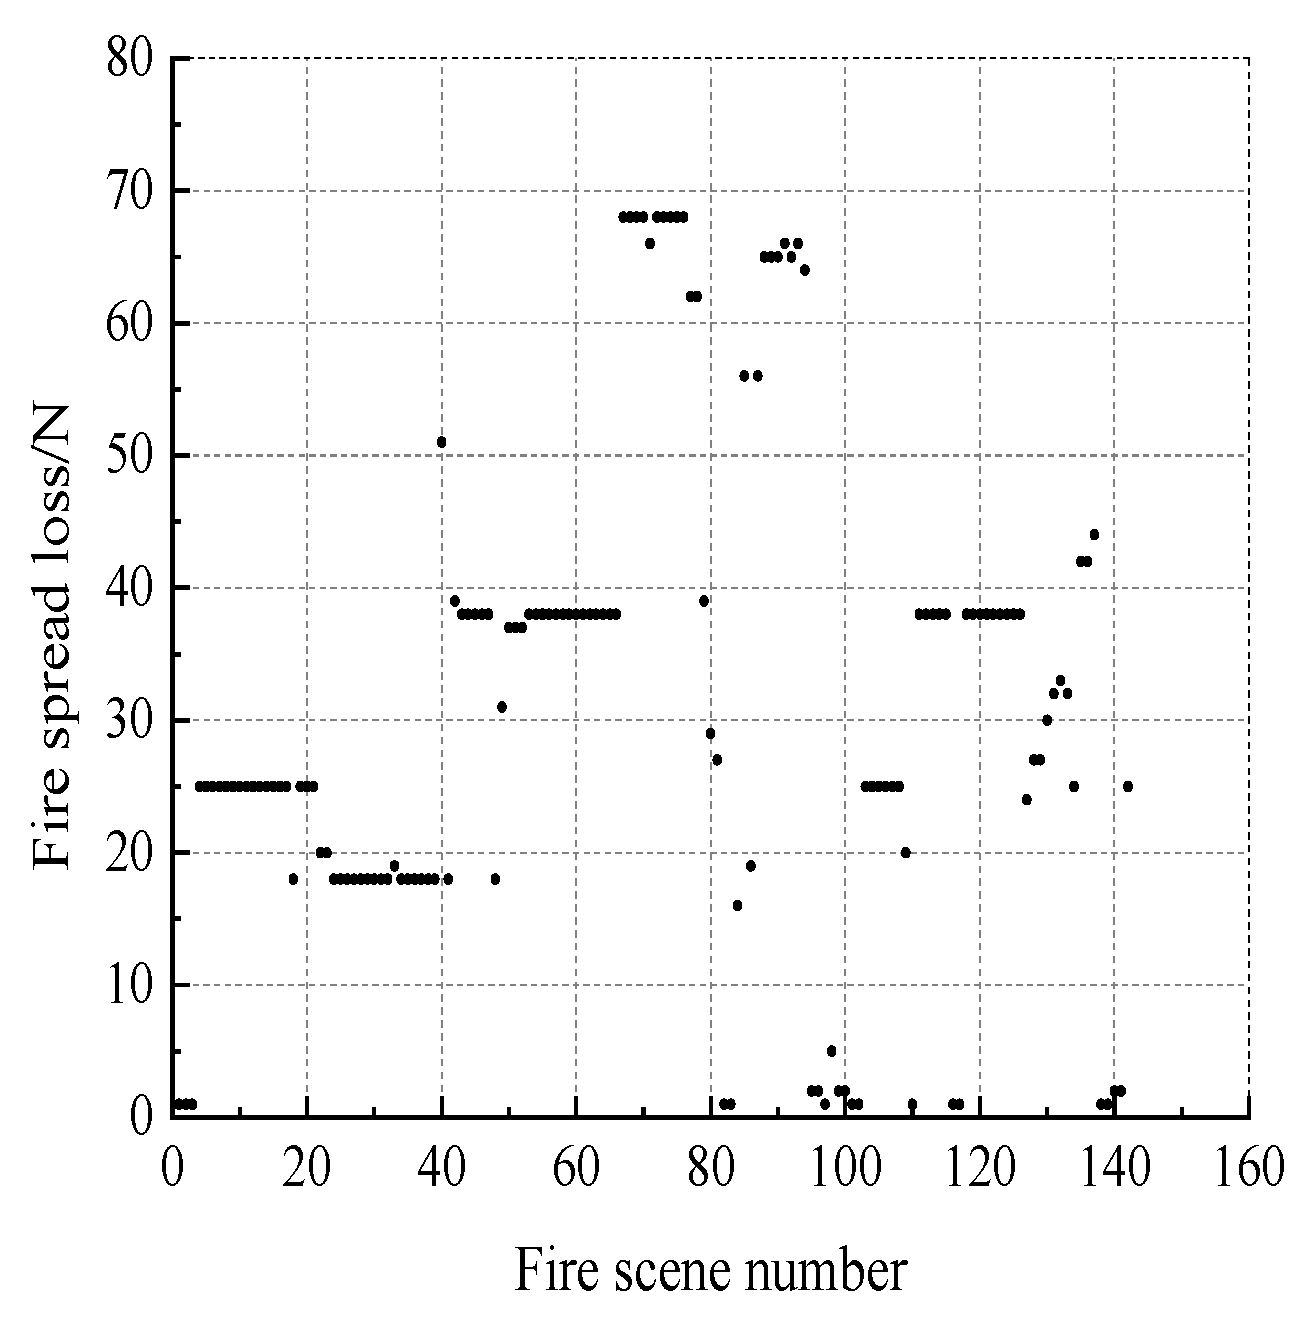
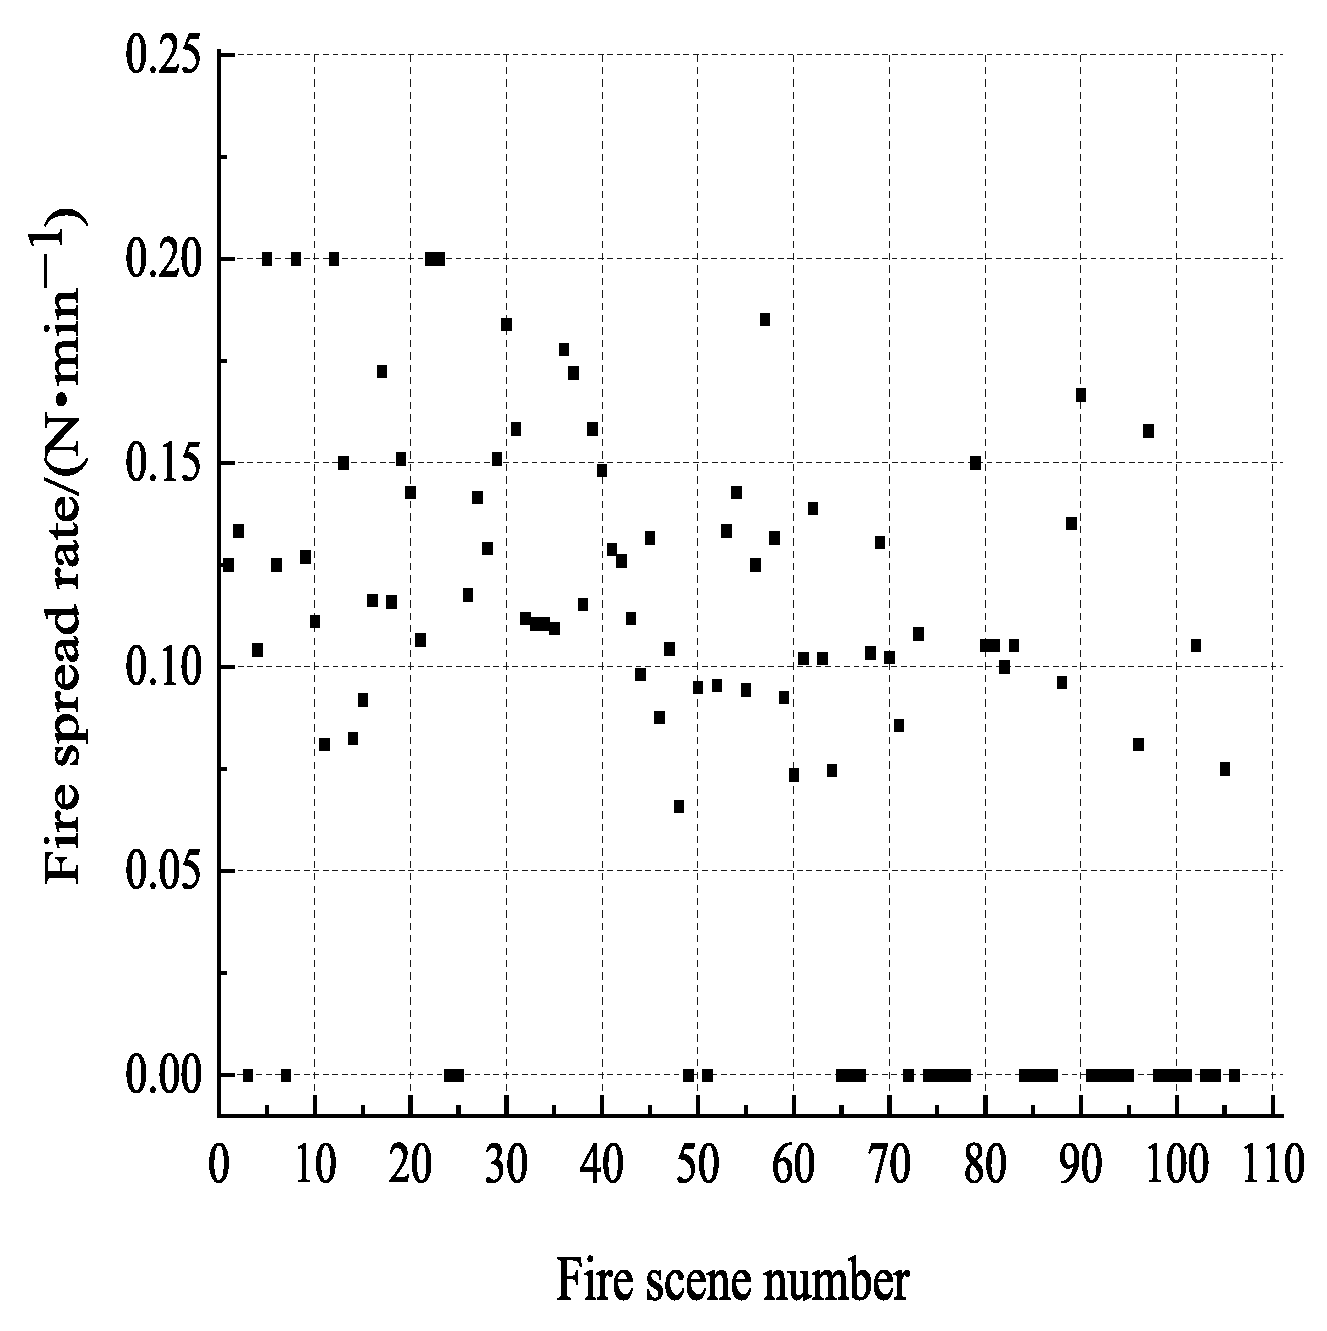
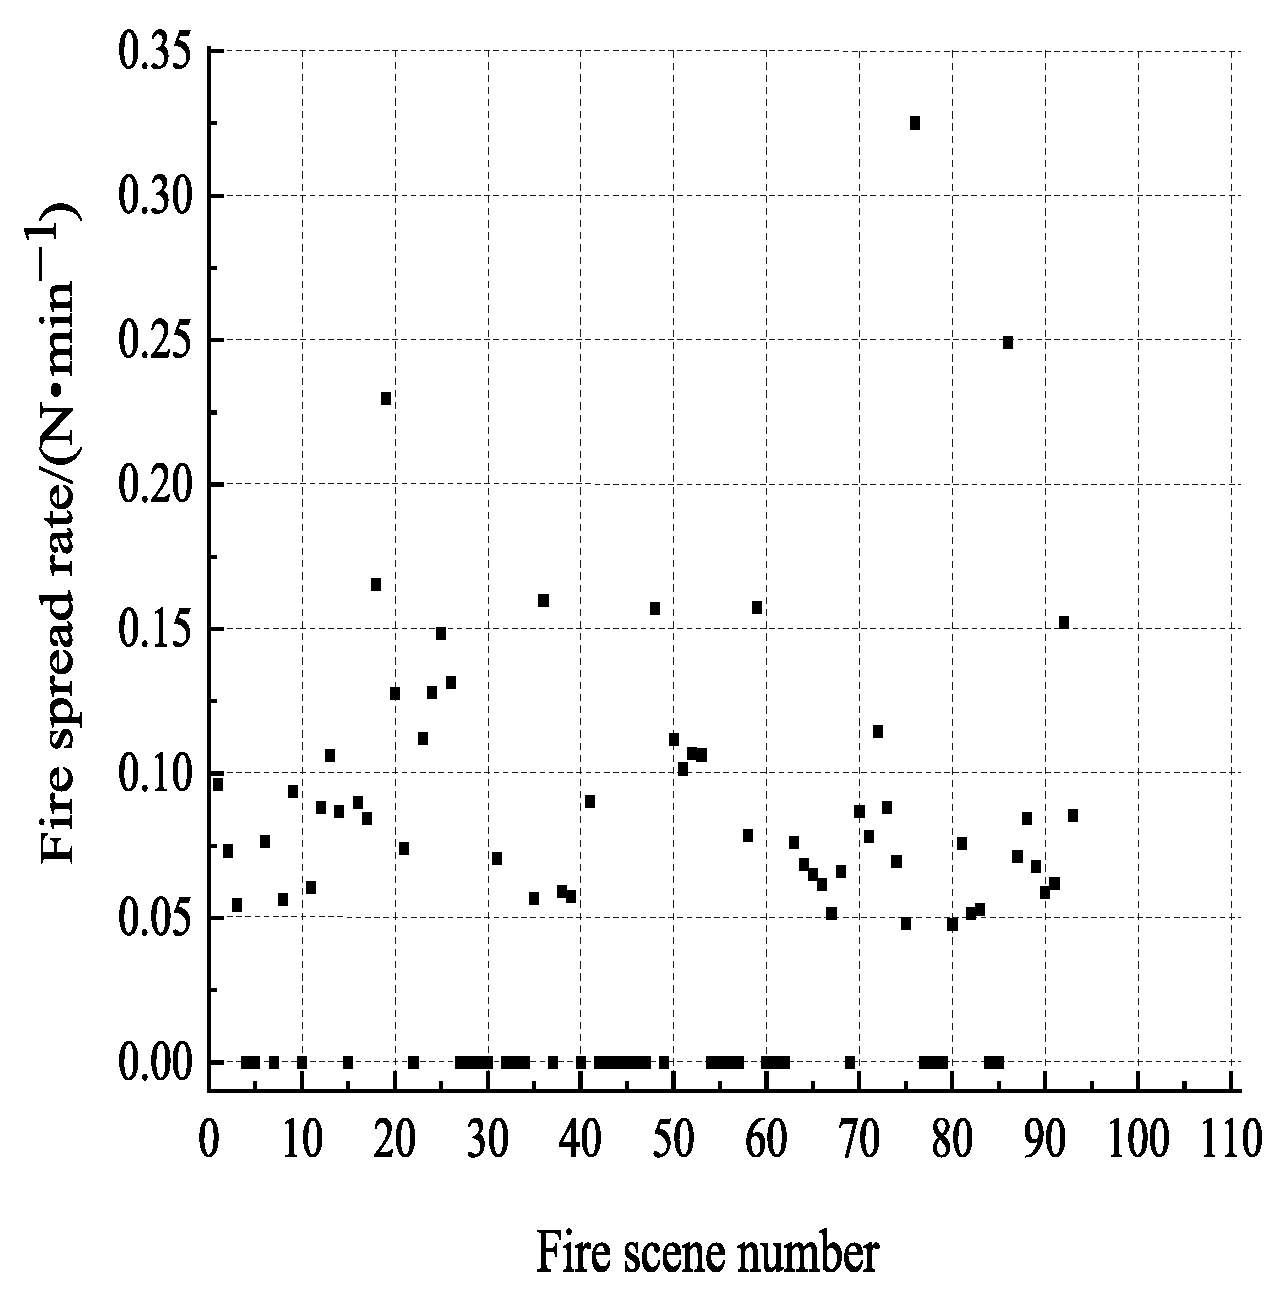
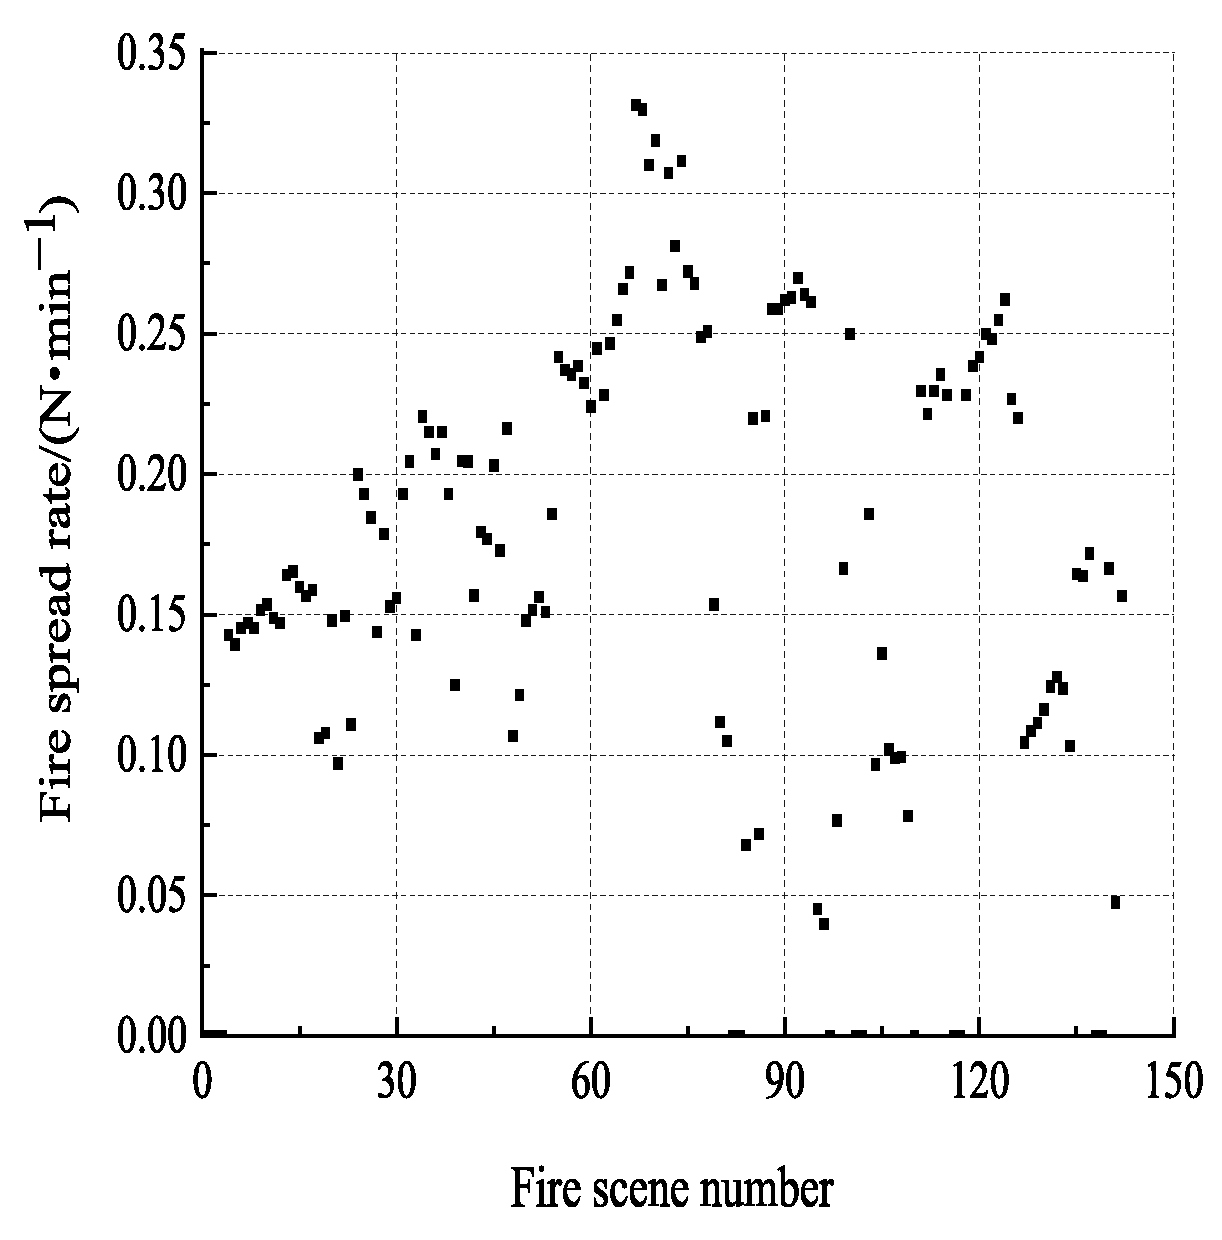
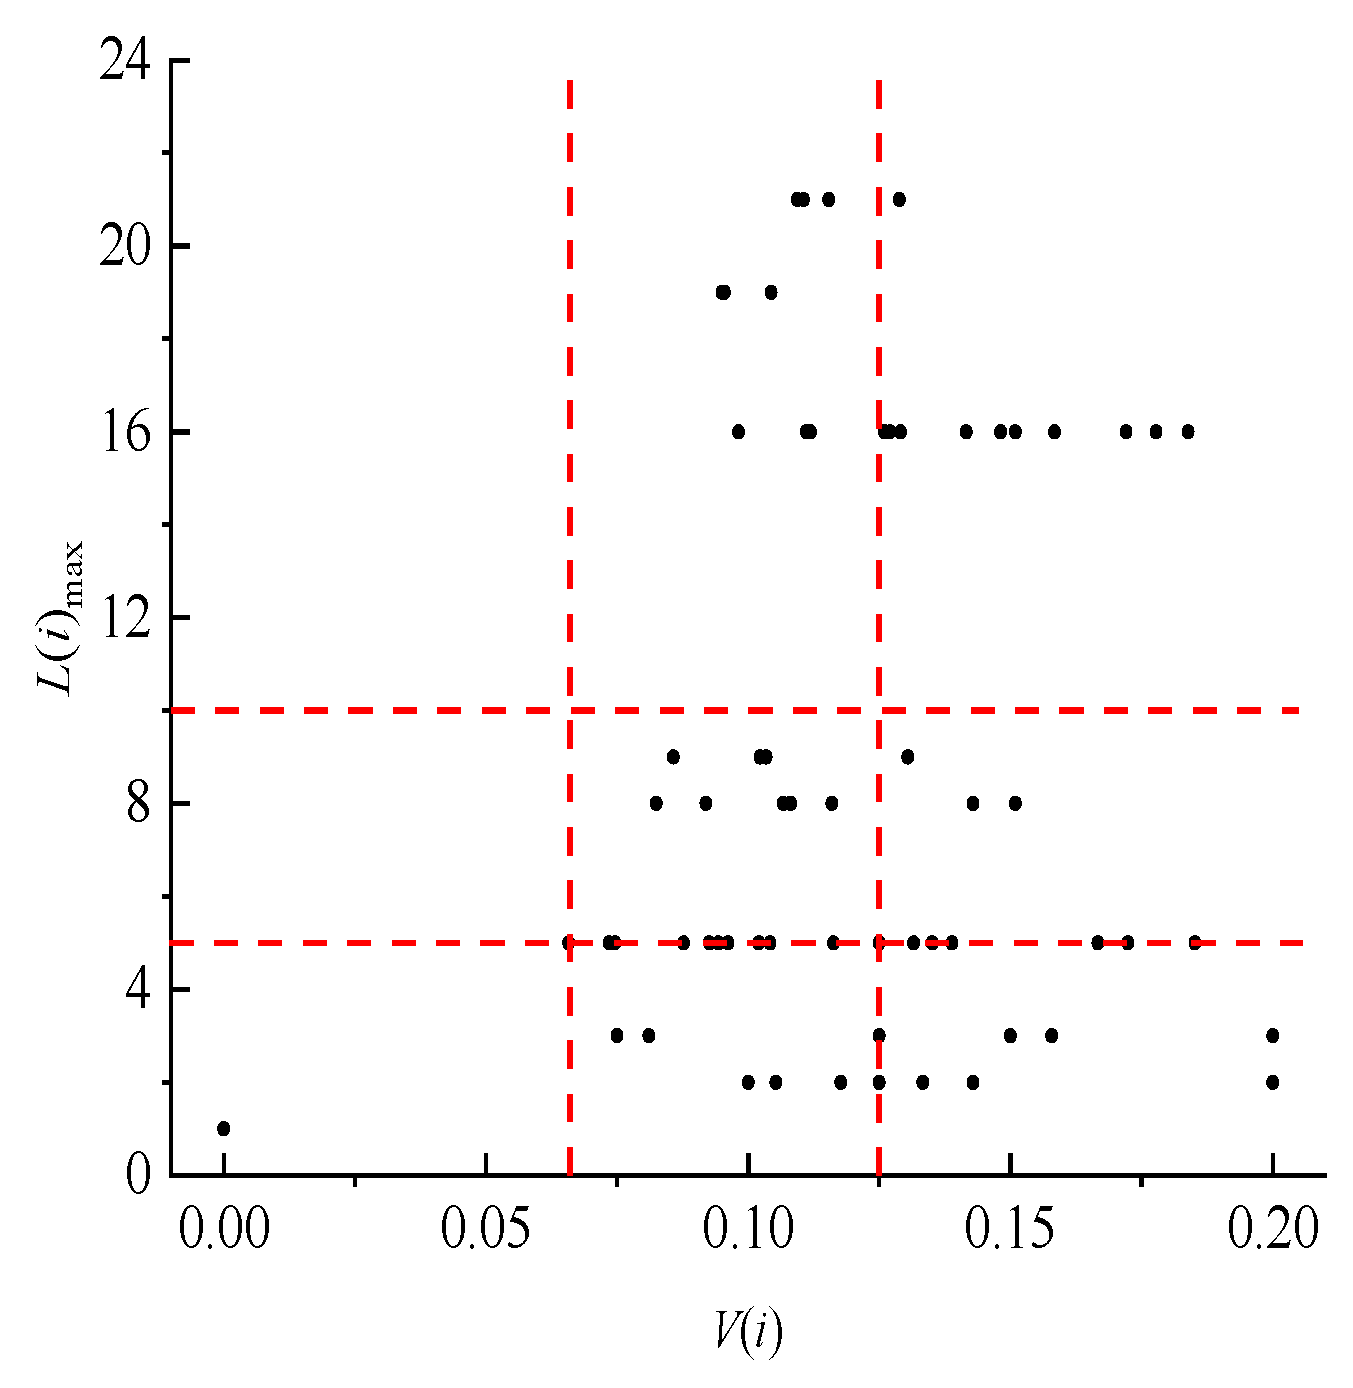
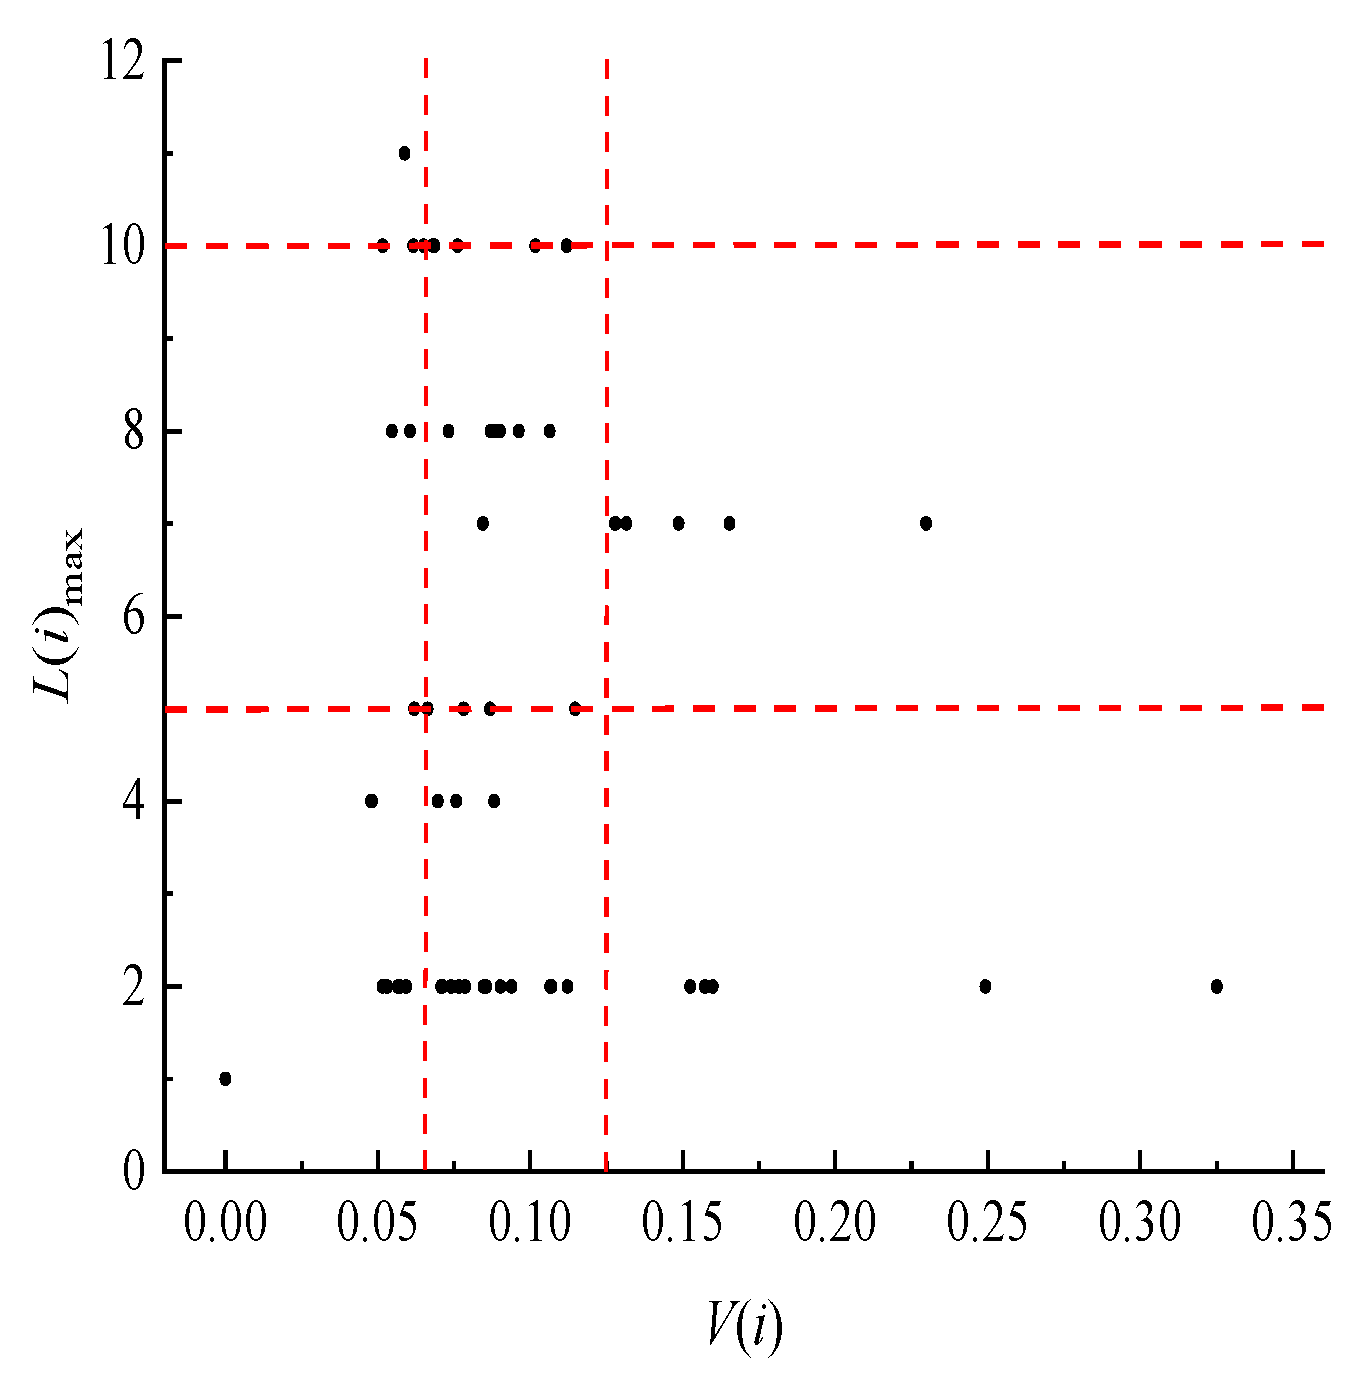
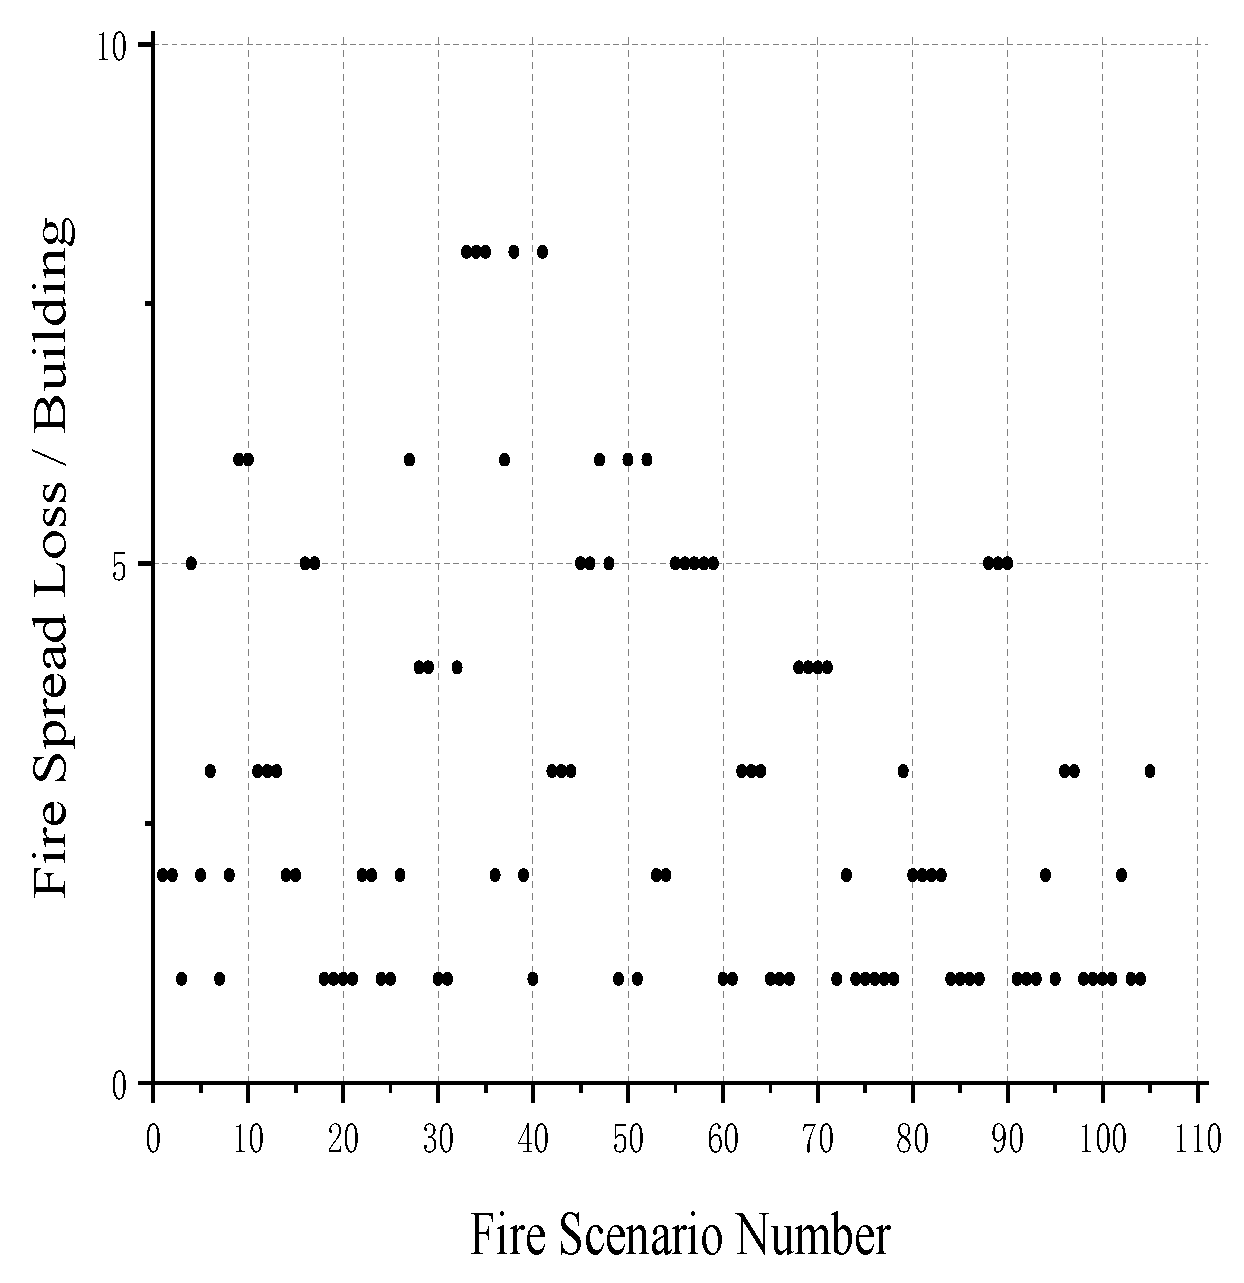
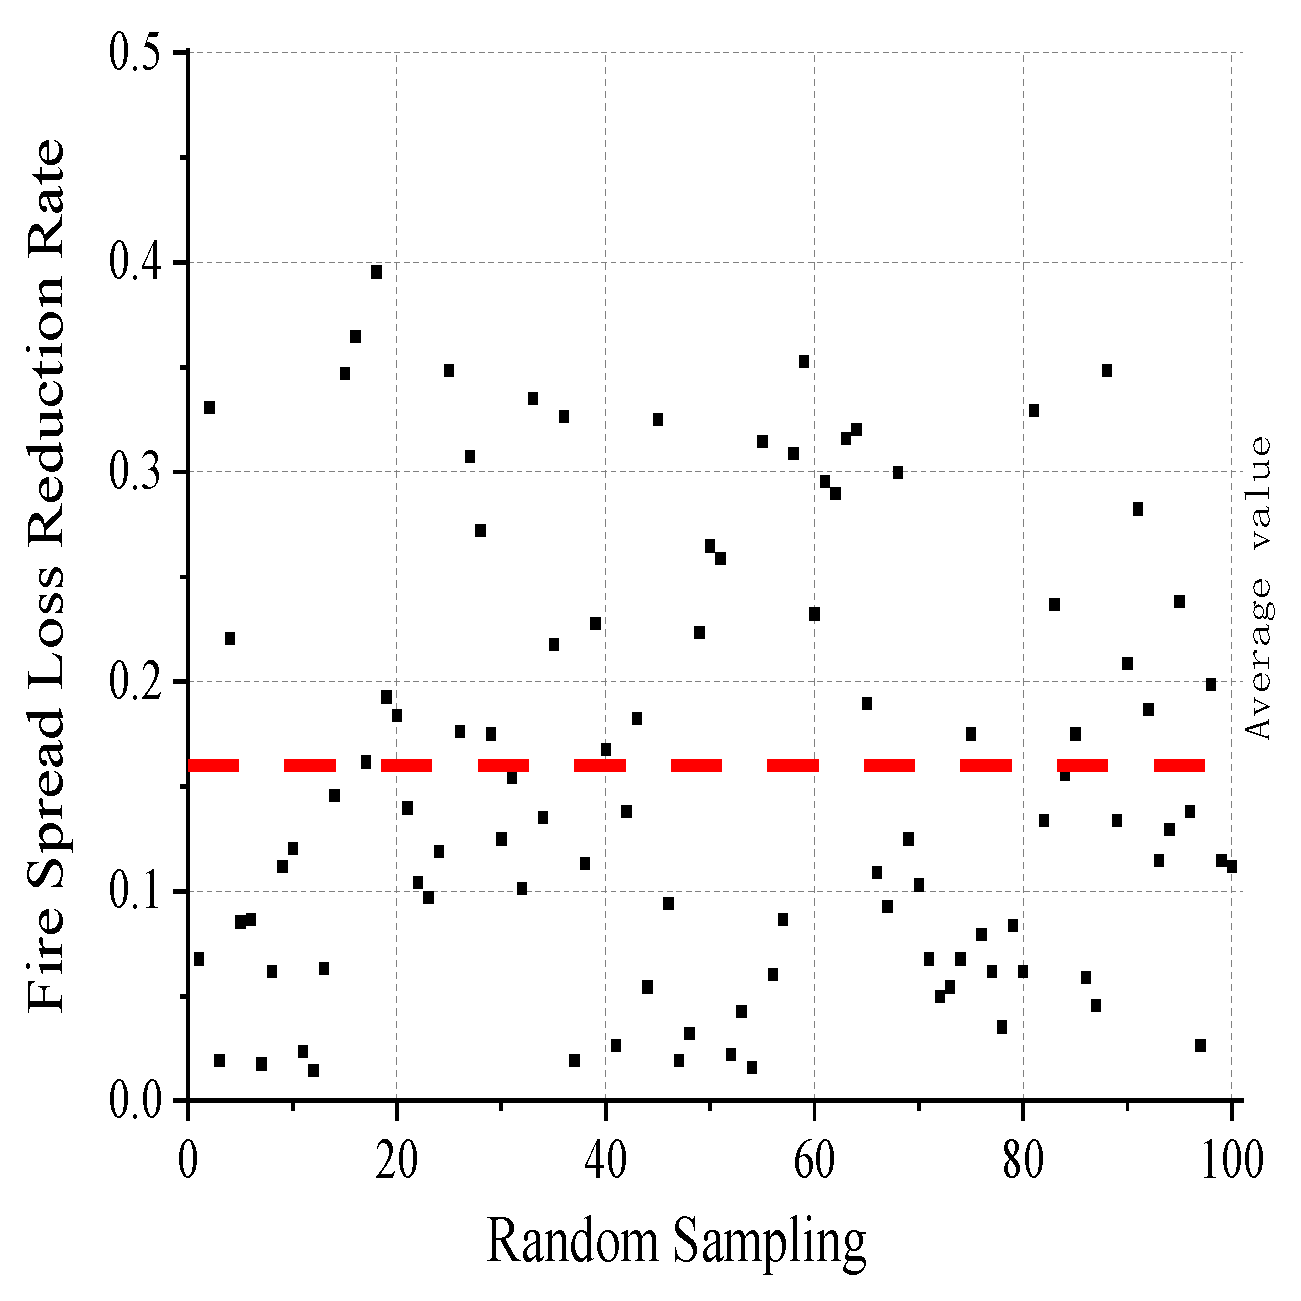
3.1. Analysis of Examples
3.2. Fire Spread Risk Level Assessment
3.3. Preliminary Study on Daily Management and Prevention Strategies for Fire Spread Risk in Building Clusters
3.3.1. Daily Management of Fire Spread Risk in Building Clusters
3.3.2. Preliminary Study on Fire Spread Prevention and Control Strategies for Building Clusters
4. Discussion
4.1. Work Performed
4.2. Model Validation and Comparison
4.3. Future Perspectives
Author Contributions
Funding
Data Availability Statement
Acknowledgments
Conflicts of Interest
References
- Zhang, J.; Song, Z.; Zhang, Y.; Gao, X. Simplified simulation assessment method of fire spreading risk in traditional villages in southwest China. J. Saf. Environ. 2023, 23, 2167–2176. [Google Scholar] [CrossRef]
- Xu, F.; Shen, H. Analysis on the fire control strategy of historic district by Lijiang 3·11 fire. Sichuan Build. Sci. 2015, 41, 138–141. [Google Scholar]
- Qiu, R. The “1.11” Major Fire Accident in Dukezong Ancient City, Shangri-La County. China Occup. Saf. Health 2014, 9, 62–63. [Google Scholar]
- Gao, W. Discussion on fire prevention and control countermeasures of traditional villages from Wengding fire accident. China Fire 2021, 53–56. [Google Scholar]
- Wu, Y. Study on causes and countermeasures of fire accident in traditional residence Area. China Saf. Sci. J. 2004, 229, 72–75. [Google Scholar] [CrossRef]
- Cui, F.; Luo, Q.; Gao, Z.; Zheng, Y. Study on fire safety strategies for ancient buildings in Lijiang Dayan ancient town. Saf. Environ. Eng. 2009, 89–91. [Google Scholar] [CrossRef]
- Fan, W.; Sun, J.; Lu, S. Fire Risk Assessment Methodology; Science Press: Beijing, China, 2004. [Google Scholar]
- Li, J. The fire risk assessment and fire prevention research of Lijiang historical buildings. J. Chin. Peoples Armed Police Force Acad. 2014, 30, 57–61. [Google Scholar]
- Chen, L.; Song, Z.; Zhang, J.; Li, S.; Du, K. Regional fire risk assessment based on single building risk. Fire Sci. Technol. 2018, 37, 1428–1431. [Google Scholar]
- Fan, W.; Wang, Q.; Jiang, F.; Zhou, J. Fire Science Simple Tutorial; Press of University of Science and Technology of China: Hefei, China, 1995. [Google Scholar]
- Zhang, J.; Song, Z.; Li, Q.; Hao, A. Identification and fire protection evaluation of critical buildings to prevent fire spread in densely built wood building areas. Eng. Mech. 2020, 37, 60–69. [Google Scholar] [CrossRef]
- Zhang, J.; Song, Z. Directed Graph Based Risk Analysis of Fire Spread in Buildings in Chinese Traditional Villages. J. Southwest Jiaotong Univ. 2022, 57, 447–454. [Google Scholar]
- Hamada, M. On Fire Spreading Speed, Disasters Research; Sagami Shobo: Tokyo, Japan, 1951. [Google Scholar]
- Yasuno, K.; Takai, H.; Namba, Y. A basic study on the fire spread of buildings. Bull. Jpn. Assoc. Fire Sci. Eng. 1982, 32, 23–32. [Google Scholar]
- Huang, W.; Zhang, S.; Lei, G.; Wang, Y. A mathematical model of an urban fire-spread and computer simulation. Chin. J. Comput. Phys. 1993, 10, 9. [Google Scholar]
- Nishino, T.; Tanaka, T.; Hokugo, A. An evaluation method for the urban post-earthquake fire risk considering multiple scenarios of fire spread and evacuation. Fire Saf. J. 2012, 54, 167–180. [Google Scholar] [CrossRef]
- Ohgai, A.; Gohnai, Y.; Watanabe, K. Cellular automata modeling of fire spread in built-up areas—A tool to aid community-based planning for disaster mitigation. Comput. Environ. Urban Syst. 2007, 31, 441–460. [Google Scholar] [CrossRef]
- Meng, X.; Yang, L.; Li, J. Probability model of urban district fire spread based on cellular automata. China Saf. Sci. J. 2008, 18, 28–33. [Google Scholar]
- Liu, C.; Wang, B.; Pan, J. Urban post-earthquake fire spread model based on cellular automata. J. Nat. Disasters 2010, 19, 152–157. [Google Scholar]
- Himoto, K.; Tanaka, T. Development and validation of a physics-based urban fire spread model. Fire Saf. J. 2008, 43, 477–494. [Google Scholar] [CrossRef]
- Zhao, S.; Xiong, L.; Ren, A. A spatial–temporal stochastic simulation of fire outbreaks following earthquake based on GIS. J. Fire Sci. 2006, 24, 313–339. [Google Scholar] [CrossRef]
- Zhao, S.; Ren, A.; Xiong, L. Review of studies on urban post-earthquake fires. J. Nat. Disasters 2006, 15, 57. [Google Scholar]
- Zhang, J.; Song, Z.; Zhang, Y. Method of determining high-risk buildings for fire spreading in densely built building areas based on importance of network nodes. Complex Syst. Complex. Sci. 2022, 19, 66–73. [Google Scholar] [CrossRef]
- Song, Z.; Zhang, Y.; Zhang, J. Evaluation of the importance of fire spreading nodes in wood structure building groups based on node shrinkage method. J. Saf. Environ. 2022, 22, 16–21. [Google Scholar] [CrossRef]
- Himoto, K.; Shinohara, M.; Sekizawa, A.; Takanashi, K.-I.; Saiki, H. A field experiment on fire spread within a group of model houses. Fire Saf. J. 2018, 96, 105–114. [Google Scholar] [CrossRef]
- NFPA 80A; Recommended Practice for Protection of Buildings from Exterior Fire Exposures. NFPA: Quincy, MA, USA, 2019.
- NFPA 92B; Standard for Smoke Management Systems in Malls, Atria and Large Spaces. NFPA: Quincy, MA, USA, 2009.
- Liao, H.; Zhu, Y.; Chen, Z. A fire disaster dynamic evacuation in-dicating system based on the Dijkstra algorithm. J. Saf. Environ. 2021, 21, 1676–1683. [Google Scholar]
- Dijkstra, E.W. A note on two problems in connexion with graphs. Numer. Math. 1959, 1, 269–271. [Google Scholar] [CrossRef]
- Shi, X.; Sun, L.; Ge, N. Research on the improved algorithm of Dijkstra in emergency resource distribution. J. Beijing Union Univ. 2018, 32, 61–66. [Google Scholar]
- Choi, M.; Chi, S. Optimal route selection model for fire evacuations based on hazard prediction data. Simul. Model. Pract. Theory 2019, 94, 321–333. [Google Scholar] [CrossRef]
- Arrumdany, A.C.; Sari, P.P.; Rahmadani, P.; Lubis, A.I. Web-based geographic information system (GIS) in determining shortest path of MSME medan city using bellman-ford algorithm. J. Phys. Conf. Ser. 2019, 1255, 12075. [Google Scholar] [CrossRef]
- Khamami, A.; Saputra, R. The shortest path search application based on the city transport route in Semarang using the Floyd-warshall algorithm. J. Phys. Conf. Ser. 2019, 1217, 12116. [Google Scholar] [CrossRef]
- National Cultural Heritage Administration; China Academy of Building Research. Guidelines for Fire Protection Design of Heritage Buildings (Trial); National Cultural Heritage Administration; China Academy of Building Research: Beijing, China, 2015.
- GA/T 1463-2018; Fire Safety Management for Heritage Buildings. The Ministry of Public Security of the People’s Republic of China: Beijing, China, 2018.
- JB152-2017; Standard for Construction of Urban Fire Stations. The Ministry of Public Security of the People’s Republic of China: Beijing, China, 2017.
- Xie, L. A method for evaluating cities’ ability of reducing earthquake disasters. Earthq. Eng. Eng. Dyn. 2006, 26, 1–10. [Google Scholar]
- Li, J.; Li, G.; Zhu, Z.; Chang, C.; Chen, B.; Ji, W.; Qi, H.; Wang, Y.; Chen, N.; Yang, X.; et al. Experimental and numerical study on fire-induced collapse of an existing truss roof building. J. Build. Struct. 2025, 46, 153–163. [Google Scholar]


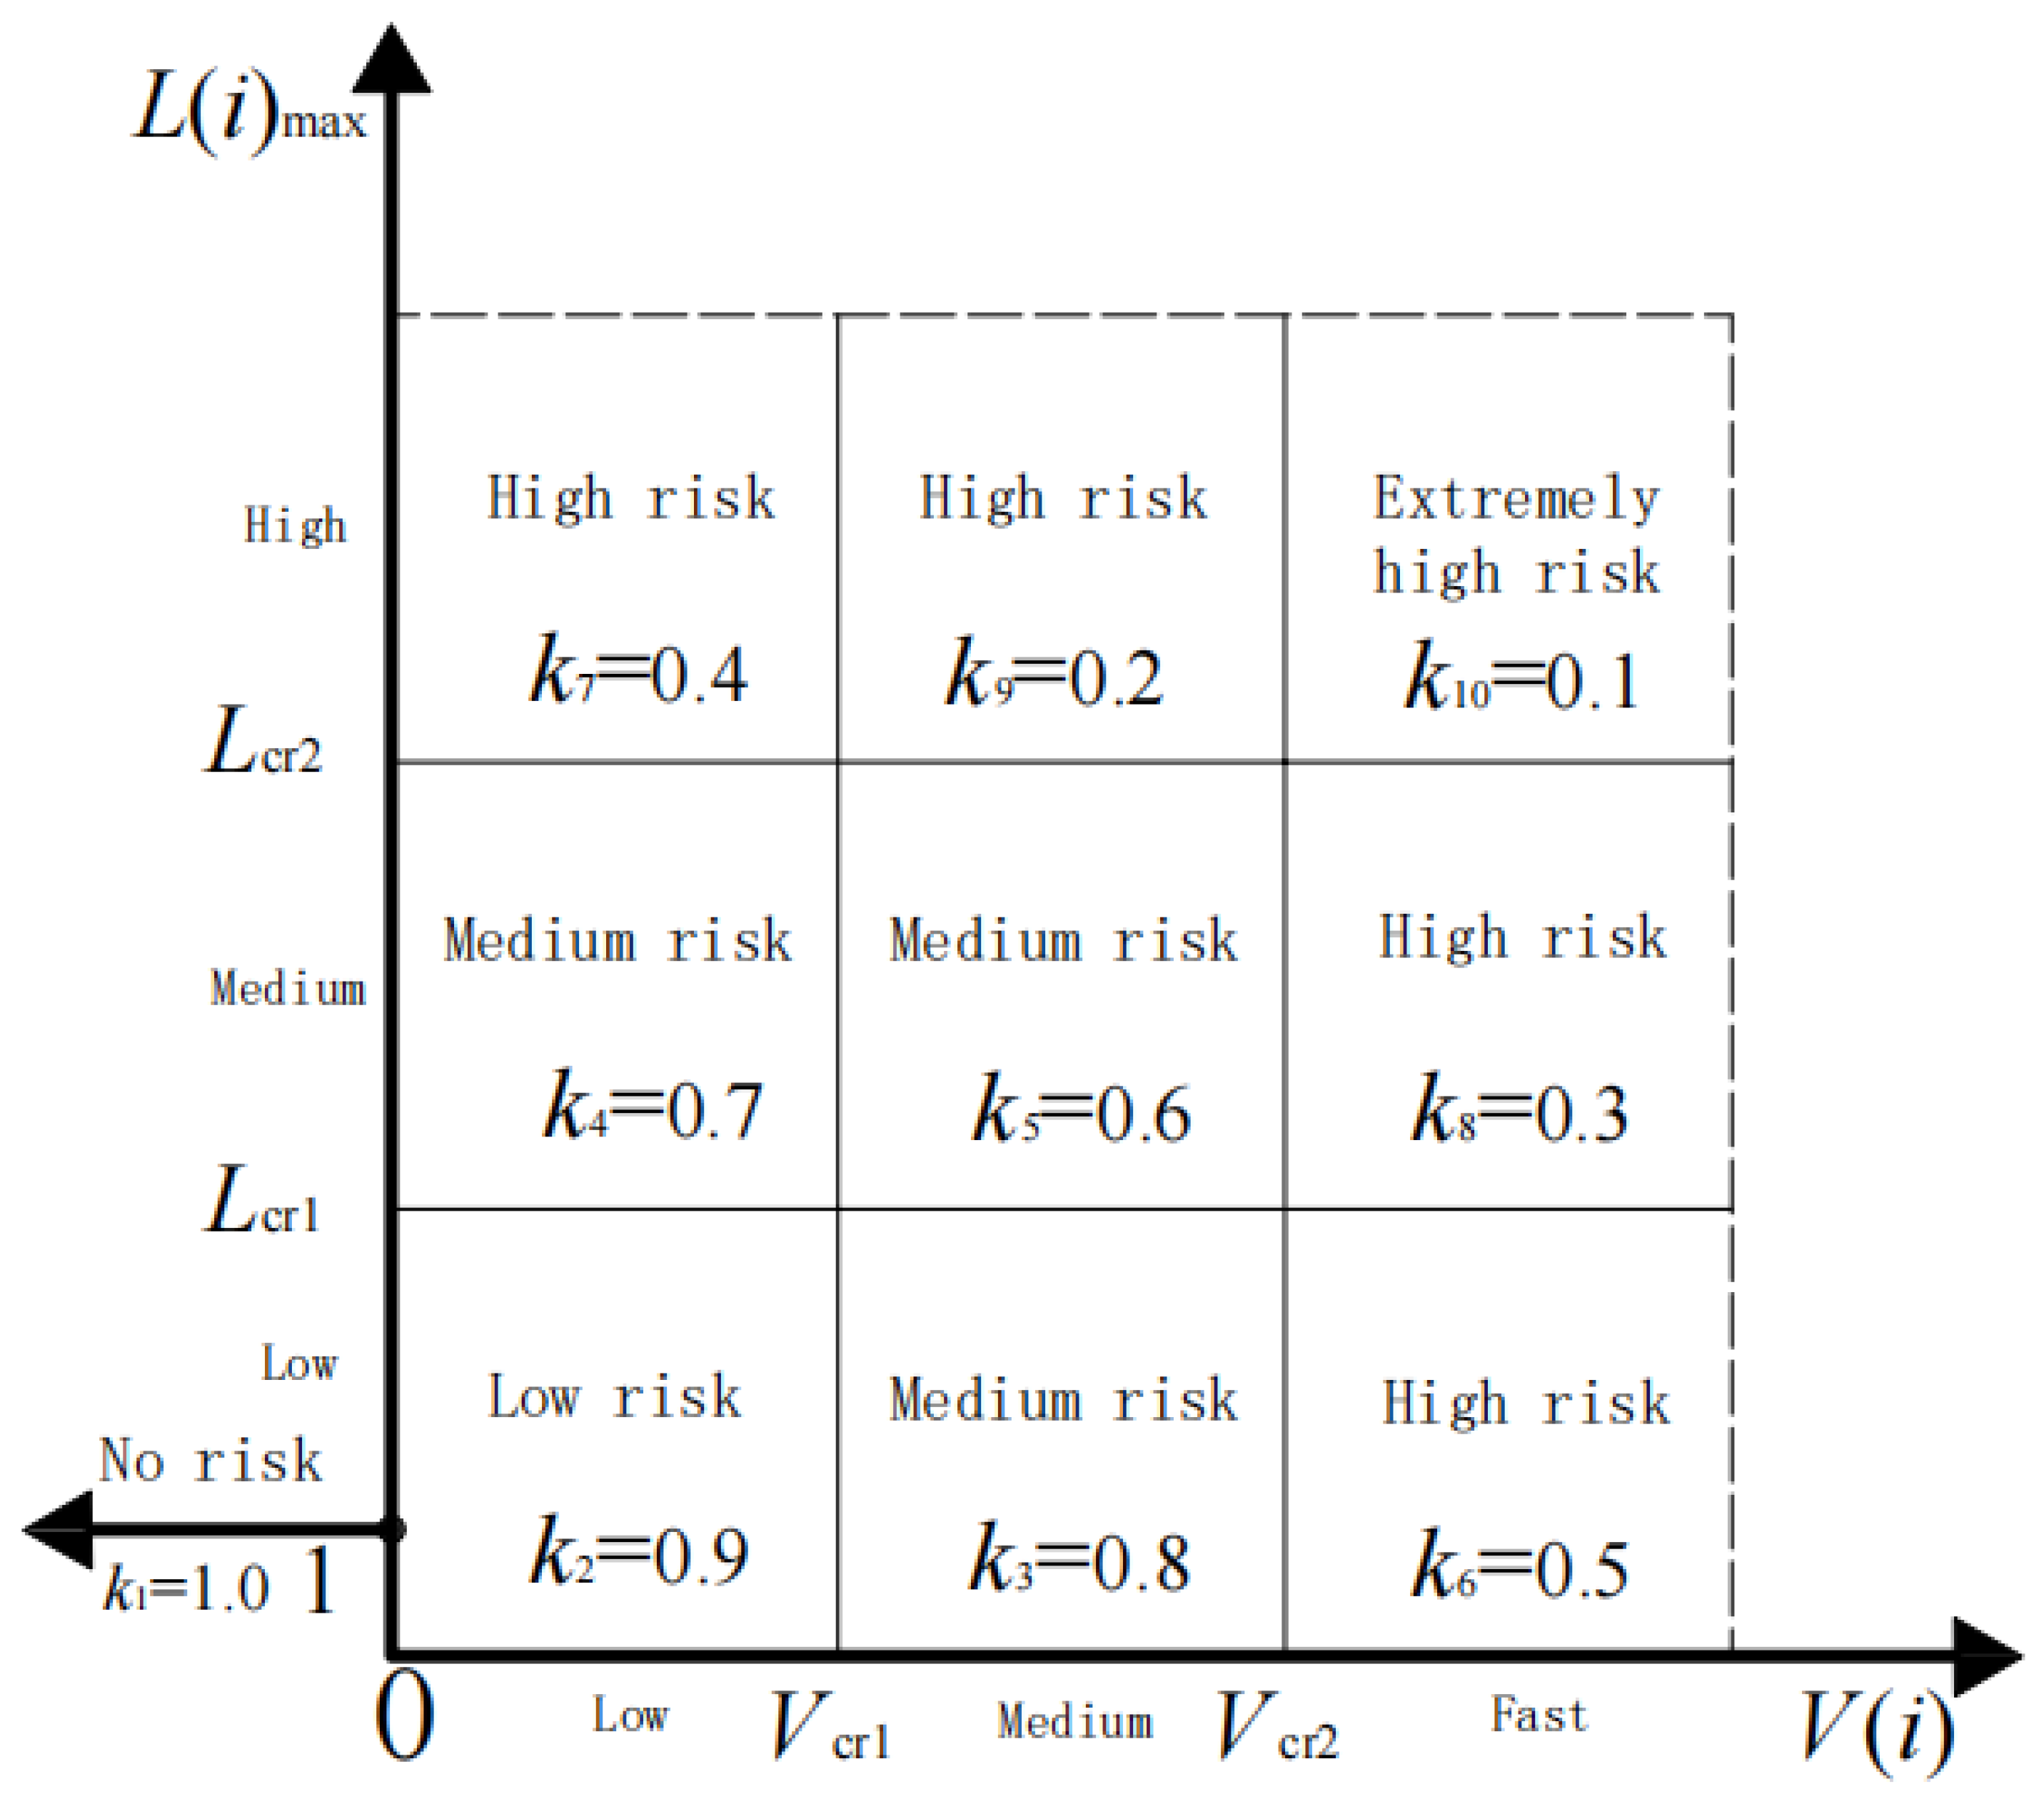
| Risk Grade | No Risk | Low Risk | MEDIUM RISK | High Risk | Extremely High Risk |
|---|---|---|---|---|---|
| Fire-resistance index | k1 | k2 | k3–k5 | k6–k9 | k10 |
| Fire Hazard Spreading Risk Grade of Architectural Complexes | I |
|---|---|
| Extremely high risk | [0.1, 0.3) |
| High risk | [0.3, 0.6) |
| Medium risk | [0.6, 0.9) |
| Low risk | [0.9, 1.0) |
| No risk | 1 |
| Risk Grade | No Risk | Low Risk | Medium Risk | High Risk | Extremely High Risk | |||||
|---|---|---|---|---|---|---|---|---|---|---|
| Amount | Proportion | Amount | Proportion | Amount | Proportion | Amount | Proportion | Amount | Proportion | |
| Village 1 | 31 | 29.25% | 0 | 0.00% | 28 | 26.41% | 35 | 33.02% | 12 | 11.32% |
| Village 2 | 35 | 37.63% | 8 | 8.60% | 29 | 31.18% | 21 | 22.58% | 0 | 0.00% |
| Village 3 | 86 | 40.00% | 4 | 1.86% | 2 | 0.93% | 22 | 10.23% | 101 | 46.97% |
| Case | Fire Safety Characteristics | Reconstruction Direction |
|---|---|---|
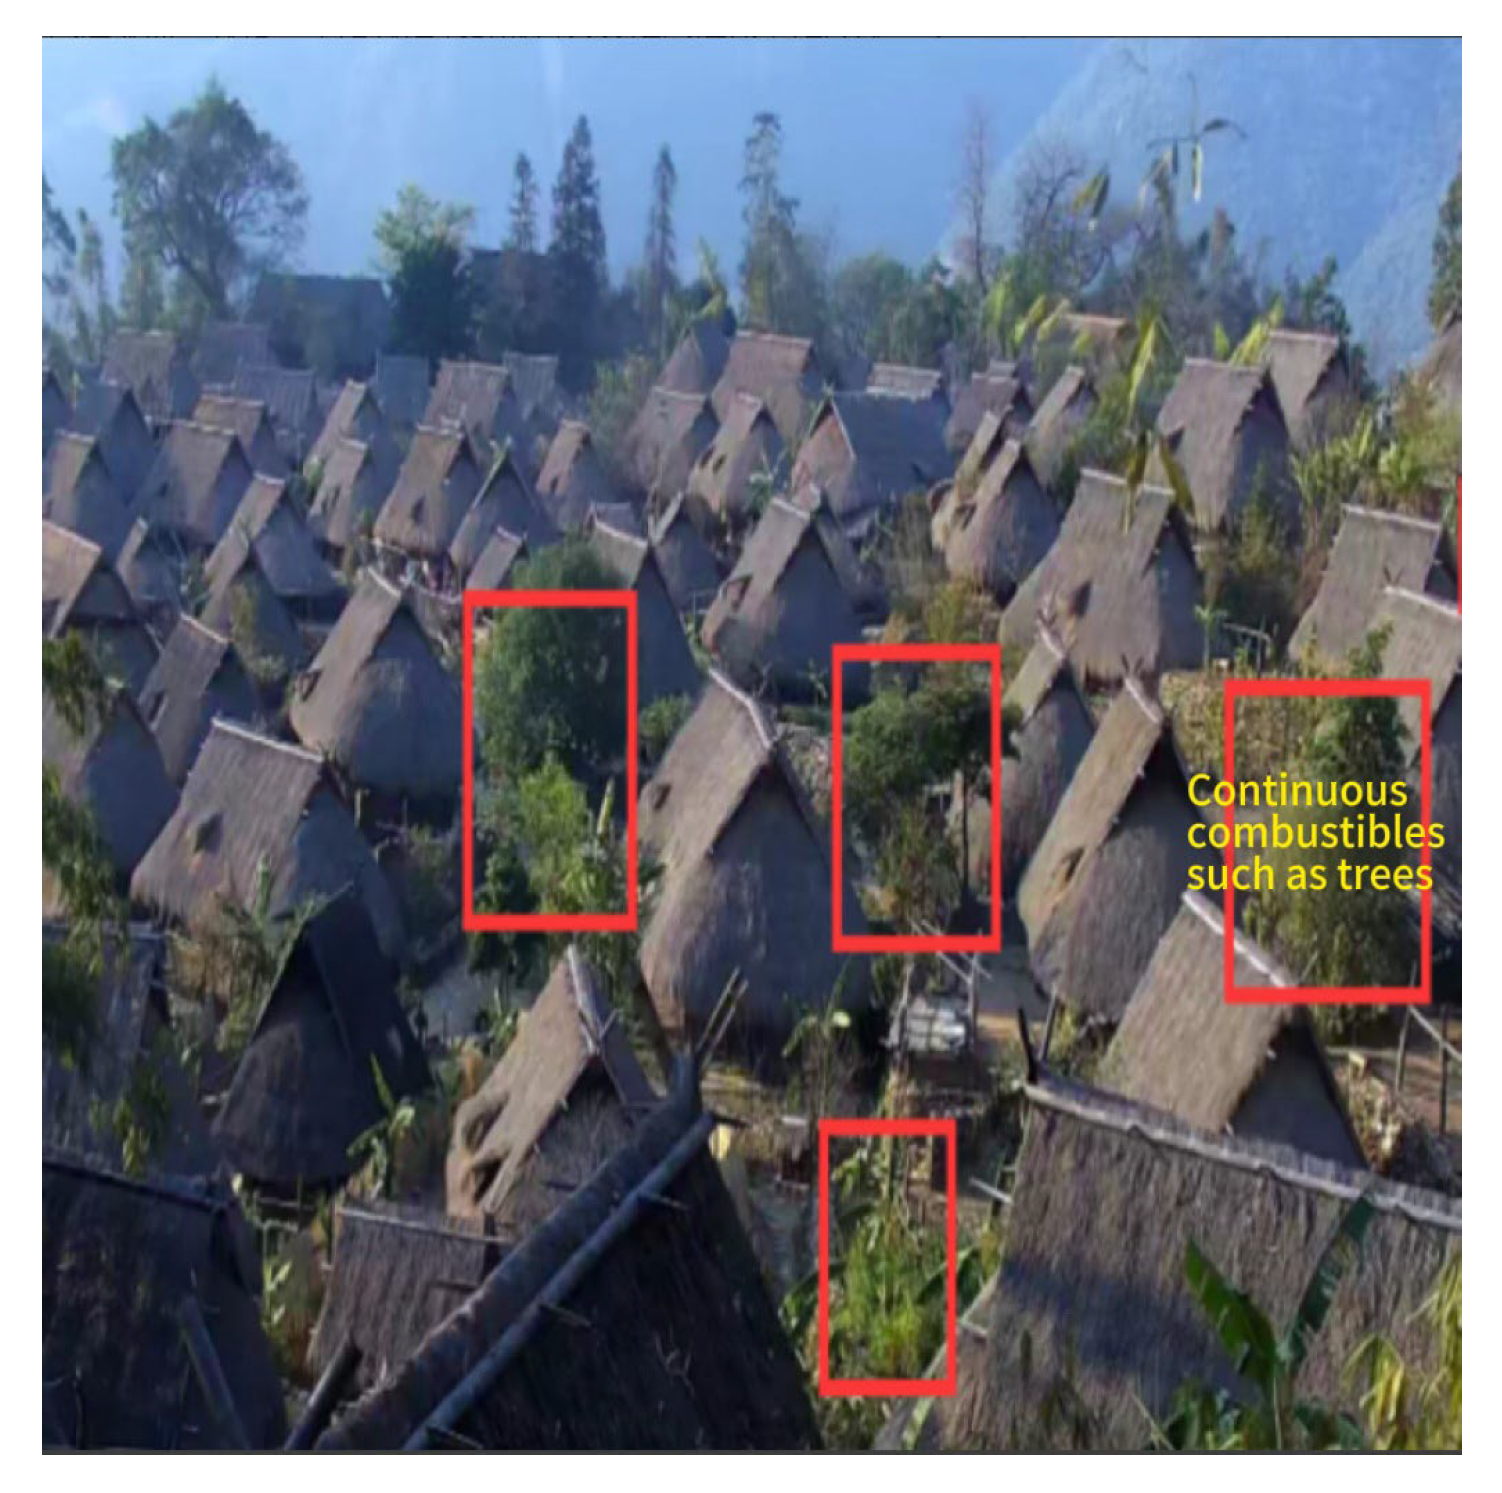
| Village 1 | It is mainly characterized by high fire spread loss and high fire spread speed, and buildings with high or extremely high fire spread risk account for about 44.34% of the total number of buildings. | Remove continuous combustibles between buildings, install sprinkler systems, and prevent the spread of flying sparks; focus on fire protection reconstruction of buildings with extremely high fire spread risks to reduce the fire spread risks of building groups. Increase fire water supply, establish volunteer fire brigades, and shorten the fire-fighting intervention time. |
| Village 2 | Medium fire spread loss and medium fire spread speed. | Focus on controlling the fire risks of individual buildings and strengthening fire safety education to prevent deaths from small fires. Increase fire water supply, establish volunteer fire brigades, and improve early fire-fighting and rescue capabilities. |
| Village 3 | High fire spread loss and high fire spread speed. There are dense areas with relatively high fire spread risks. | For dense areas with relatively high fire spread risks, priority should be given to controlling the fire spread risks of building groups, identifying important buildings, cutting off spread paths, improving the fire resistance of buildings, and strengthening fire source control; add alarm systems, set up different types of fire rescue teams, and enhance the ability of early intervention in fire rescue. |
Disclaimer/Publisher’s Note: The statements, opinions and data contained in all publications are solely those of the individual author(s) and contributor(s) and not of MDPI and/or the editor(s). MDPI and/or the editor(s) disclaim responsibility for any injury to people or property resulting from any ideas, methods, instructions or products referred to in the content. |
© 2025 by the authors. Licensee MDPI, Basel, Switzerland. This article is an open access article distributed under the terms and conditions of the Creative Commons Attribution (CC BY) license (https://creativecommons.org/licenses/by/4.0/).
Share and Cite
Wang, C.; Song, Z.; Zhang, J.; Liu, L.; Zheng, F.; Cao, S. Fire Hazard Risk Grading of Timber Architectural Complexes Based on Fire Spreading Characteristics. Buildings 2025, 15, 2472. https://doi.org/10.3390/buildings15142472
Wang C, Song Z, Zhang J, Liu L, Zheng F, Cao S. Fire Hazard Risk Grading of Timber Architectural Complexes Based on Fire Spreading Characteristics. Buildings. 2025; 15(14):2472. https://doi.org/10.3390/buildings15142472
Chicago/Turabian StyleWang, Chong, Zhigang Song, Jian Zhang, Lijiao Liu, Feiyang Zheng, and Siqi Cao. 2025. "Fire Hazard Risk Grading of Timber Architectural Complexes Based on Fire Spreading Characteristics" Buildings 15, no. 14: 2472. https://doi.org/10.3390/buildings15142472
APA StyleWang, C., Song, Z., Zhang, J., Liu, L., Zheng, F., & Cao, S. (2025). Fire Hazard Risk Grading of Timber Architectural Complexes Based on Fire Spreading Characteristics. Buildings, 15(14), 2472. https://doi.org/10.3390/buildings15142472