Article

Hysteresis Model for Flexure-Shear Critical Circular Reinforced Concrete Columns Considering Cyclic Degradation

1
School of Civil & Architecture Engineering, Xi’an Technological University, Xi’an 710021, China
2
Liaoning Provincial Transportation Planning and Design Institute Co., Ltd., Shenyang 110166, China
3
China Construction Eight Engineering Division Co., Ltd., Shanghai 200112, China
4
College of Civil and Transportation Engineering, Hohai University, Nanjing 210024, China
5
State Key Laboratory of Coastal and Offshore Engineering, Dalian University of Technology, Dalian 116024, China
*
Authors to whom correspondence should be addressed.
Buildings 2025, 15(14), 2445; https://doi.org/10.3390/buildings15142445
Submission received: 7 June 2025 / Revised: 4 July 2025 / Accepted: 10 July 2025 / Published: 11 July 2025
(This article belongs to the Section Building Materials, and Repair & Renovation)

Abstract

Accurate seismic performance assessment of flexure-shear critical reinforced concrete (RC) columns necessitates precise hysteresis modeling that captures their distinct cyclic characteristics—particularly pronounced strength degradation, stiffness deterioration, and pinching effects. However, existing hysteresis models for such circular RC columns fail to comprehensively characterize these coupled cyclic degradation mechanisms under repeated loading. This study develops a novel hysteresis model explicitly incorporating three key mechanisms: (1) directionally asymmetric strength degradation weighted by hysteretic energy, (2) cycle-dependent pinching governed by damage accumulation paths, and (3) amplitude-driven stiffness degradation decoupled from cycle count, calibrated and validated using 14 column tests from the Pacific Earthquake Engineering Research Center (PEER) structural performance database. Key findings reveal that significant strength degradation primarily manifests during initial loading cycles but subsequently stabilizes. Unloading stiffness degradation demonstrates negligible dependency on cycle number. Pinching effects progressively intensify with cyclic advancement. The model provides a physically rigorous framework for simulating seismic deterioration, significantly improving flexure-shear failure prediction accuracy, while parametric analysis confirms its potential adaptability beyond tested scenarios. However, applicability remains confined to specific parameter ranges with reliability decreasing near boundaries due to sparse data. Deliberate database expansion for edge cases is essential for broader generalization.

1. Introduction

Reinforced concrete (RC) structures or components generally experience low-cycle reversed loading during seismic events. Research [1,2,3,4,5] shows that RC columns under this cyclic reversed loading exhibit three primary failure modes: flexure, shear, and coupled flexure-shear mechanisms. Shear-dominated brittle failure can be effectively mitigated through structural design, especially by controlling the shear span-to-depth ratio [6]. For the flexure failure characterized by ductile behavior, sudden structural collapse or global instability can be generally avoided. In contrast to these modes, low-ductility flexure-shear failure, an intermediate mode between brittleness and ductility, exhibits complex mechanisms [2,3]. Such an intermediate mode demonstrates significant hysteretic pinching effects and abrupt strength degradation under cyclic loading [7,8]. Typical hysteretic curves of these three column failure modes [9,10,11] under reversed-cyclic loading are illustrated in Figure 1. Post-earthquake investigations [12,13,14] reveal that columns susceptible to flexure-shear failure, indicative of inadequate seismic resistance, persist in practice. This vulnerability is particularly observed in short piers of transportation infrastructure (e.g., bridge bents) and marine structures (e.g., wharf piers) and may also manifest in certain building components. Consequently, it is imperative to conduct research into the hysteretic behavior of flexure-shear critical columns, aiming to provide a foundation for rational seismic performance assessment and the development of effective retrofit solutions.
Given the critical vulnerability and complex hysteretic degradation identified in such flexure-shear critical components, considerable research has been conducted toward examining the seismic performance [15,16,17,18,19,20,21,22,23,24,25,26] and developing quantitative hysteresis models [27,28,29,30,31,32,33,34,35,36,37,38] capable of simulating the observed degradation phenomena.
Focusing on the shear strength and defining failure modes under combined actions forms, Ang et al. [15] established foundational models for the shear strength of circular bridge piers by experimentally investigating their behavior under combined loading conditions and defining distinct failure modes. Setzler and Sezen [16] introduced a classification system categorizing piers into five distinct failure modes based on the ratio of shear to flexural strength. A model was developed to estimate the lateral force-displacement for flexure-shear critical columns. Ma [17] quantified the profound impact of design parameters (shear-span ratio, axial load ratio, transverse reinforcement ratio) on the shear strength and displacement ductility demand of flexure-shear critical piers, developing predictive equations for the shear strength. Crucially, experimental findings by Zhang et al. [22,23,24] and Zhu et al. [25] have unequivocally established the severe detrimental effects of repeated loading cycles. They observed that the energy dissipation capacity of the specimens undergoes exponential decay with increasing loading cycles due to cyclic degradation. Meanwhile, the strength degradation progressed slowly during the initial loading cycles but accelerated significantly in later cycles, highlighting the paramount importance of accounting for cyclic-induced degradation.
Aiming at accurately simulating the complex hysteretic curves of flexure-shear failure columns, several researchers have developed quantitative hysteresis models. Ozcebe and Saatcioglu [26] established dedicated shear hysteretic models incorporating pinching and stiffness degradation effects. Sezen and Chowdhury [28] proposed a synergistic macromodel decomposing the total response into flexural, bar-slip, and shear components. These components are combined based on the predicted failure mode, allowing simulation of strength decay and stiffness degradation with reasonable computational efficiency. Similarly, Lee and Elnashai [29] emphasized the criticality of flexure–shear interaction within lumped hysteretic models, demonstrating that ignoring shear interaction yields unrealistic predictions, while their coupled model showed good accuracy and computational benefits. Recent efforts led by Zhang and Han [30] specifically target flexure-shear critical piers, incorporating post-yield strength degradation via a modification factor and pinching. Crucially, their model explicitly includes path-dependent cyclic strength deterioration, recognizing its dependence on factors like aspect ratio and axial load ratio. Sae-Long et al. [31,32] and Limkatanyu et al. [33,34] developed efficient force-based and displacement-based frame elements, respectively, to effectively capture flexure-shear failure modes.
From the literature review, current research on flexure-shear columns still faces two key limitations, primarily focusing on the mechanisms of cyclic degradation and their modeling challenges. On the one hand, while experimental studies demonstrate the significant influence of loading cycles on the hysteretic characteristics (e.g., strength degradation, pinching effect, and energy dissipation) of flexure-shear critical columns, quantitative studies on the performance deterioration of column members under varying numbers of loading cycles remain inadequately characterized. On the other hand, existing hysteresis models for flexure-shear critical columns incorporate features like strength degradation, stiffness degradation, and the pinching effect. However, they fail to accurately account for the impact of loading cycles.
This study systematically quantifies the cumulative degradation effects of cyclic loading on RC columns exhibiting flexure-shear failure. To achieve this, a representative ensemble of flexure-shear critical circular columns, curated from the Pacific Earthquake Engineering Research Center (PEER) structural performance database, is organized to investigate the impact of loading cycles on four pivotal hysteresis parameters: strength decay, stiffness deterioration, pinching behavior, and hysteretic energy dissipation. A cycle-dependent strength degradation model is established, explicitly incorporating loading history as a governing variable to predict residual capacity decay. A dynamic pinching model incorporating cumulative cyclic damage effects is proposed. Finally, these elements are synthesized into a comprehensive hysteresis model specifically addressing the deteriorating response of flexure-shear critical columns under cyclic loading.

2. Selection of Specimens and Hysteretic Characteristics

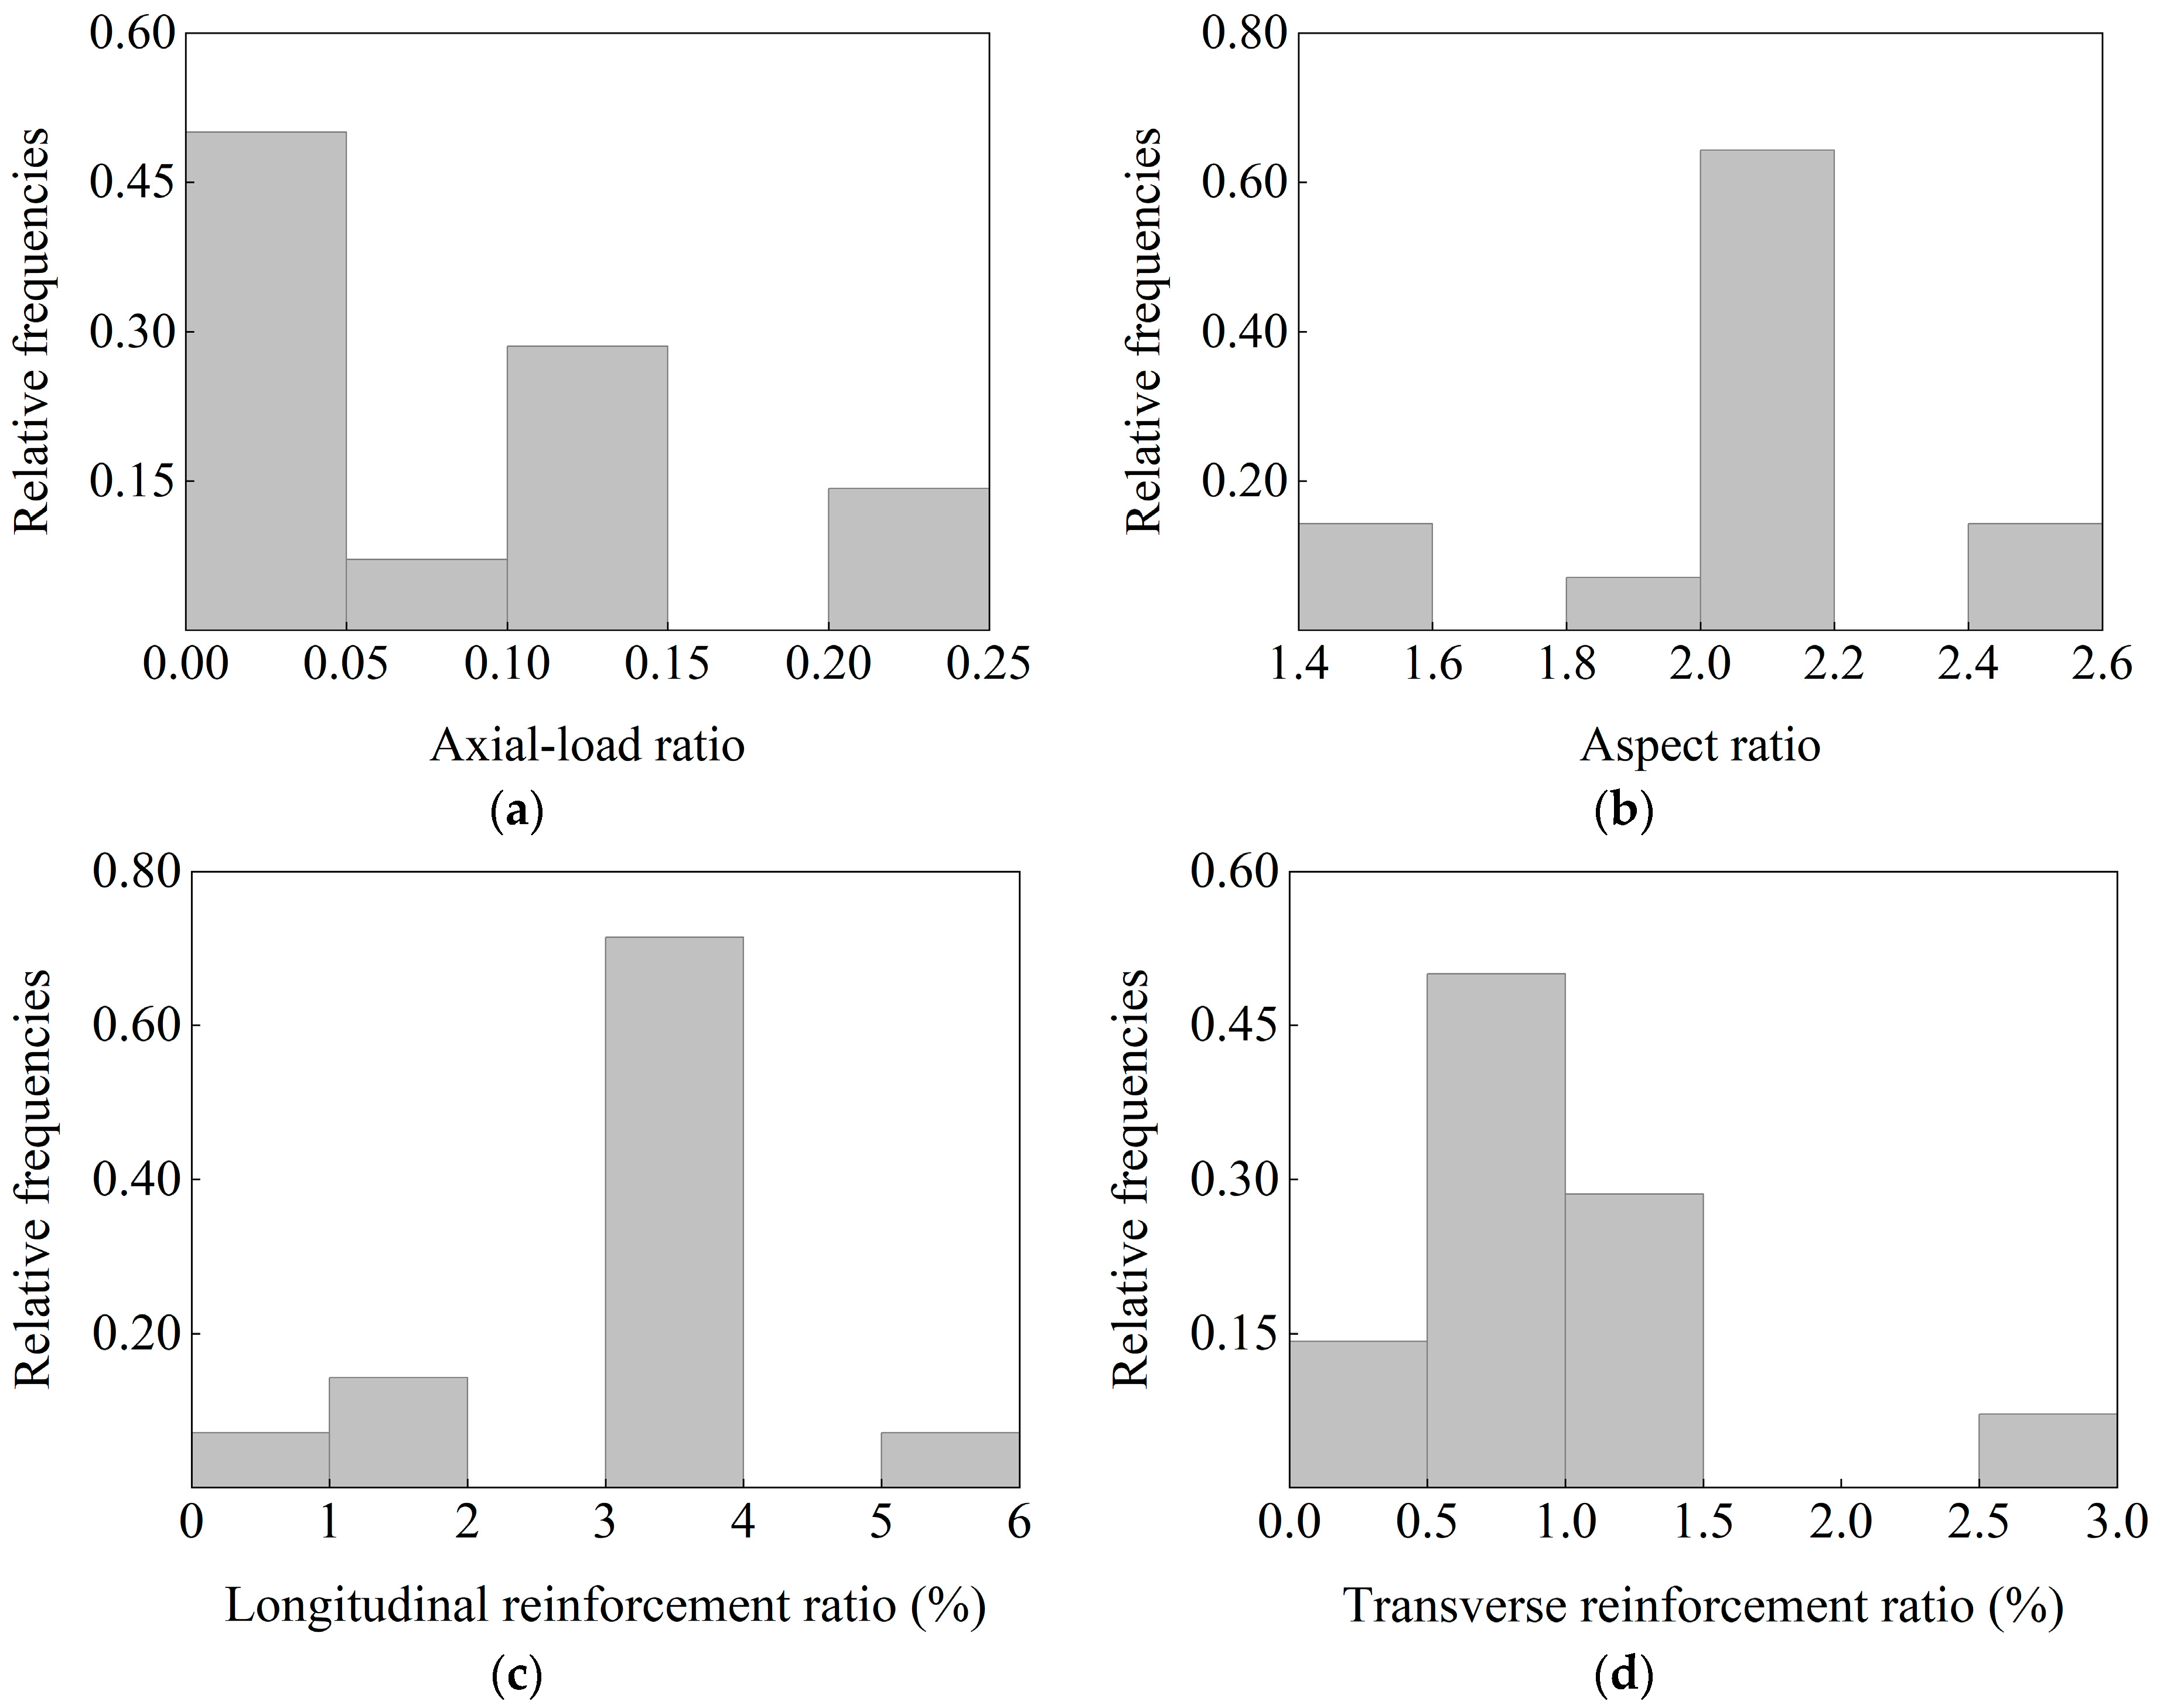
2.1. Selection of Experimental Specimens

The PEER structural performance database [35] provides a large number of cyclic lateral-load tests of RC columns. Key test information such as column geometry, material properties, reinforcement details, failure classification, loading protocol, and force-displacement history is available in the database.
This study selected 14 circular RC columns from the PEER structural performance database to examine the hysteretic characteristics of flexure-shear critical columns. The selection criteria are summarized as follows: (1) circular cross-section geometry; (2) flexure-shear failure mode; (3) constant axial load during testing; (4) multi-level displacement-controlled cyclic loading (≥2 displacement levels); (5) no less than three cycles per displacement level. It should be noted that the flexure-shear critical failure mode is identified according to the following dual-criterion protocol as follows: when experimentally reported shear damage exists, (1) the absolute maximum effective force (Feff) must equal or exceed 95% of the theoretical force threshold (F0.004) corresponding to maximum longitudinal reinforcement strain of 0.004, and (2) the displacement ductility demand at 80% force degradation (μfail) is more than 2.0. This classification hierarchy prioritizes shear-critical designation for cases failing either mechanical capacity (Feff / F0.004 < 0.95) or deformation-based limits (μfail ≤ 2.0). Fundamental properties of the selected flexure-shear critical columns are listed in Table 1.
The quantitative distributions of critical structural parameters (axial-load ratio, column aspect ratio, longitudinal reinforcement ratio and transverse reinforcement ratio) for all tested specimens are graphically represented through histogram analyses, as systematically demonstrated in Figure 2 based on the experimental configurations detailed in Table 1.
As can be observed in Figure 2, the selected specimens cover typical parameter ranges for flexure-shear critical columns. However, significant clustering is observed in key parameters: aspect ratio (λ = 2 in 9/14 specimens), longitudinal reinforcement ratio (LRR = 3.2% in 10/14), and axial load ratios (n ≤ 0.2). This parameter concentration may limit the generalization capacity of the developed hysteresis model. For scenarios beyond these clustered values, model predictions should be applied with caution.

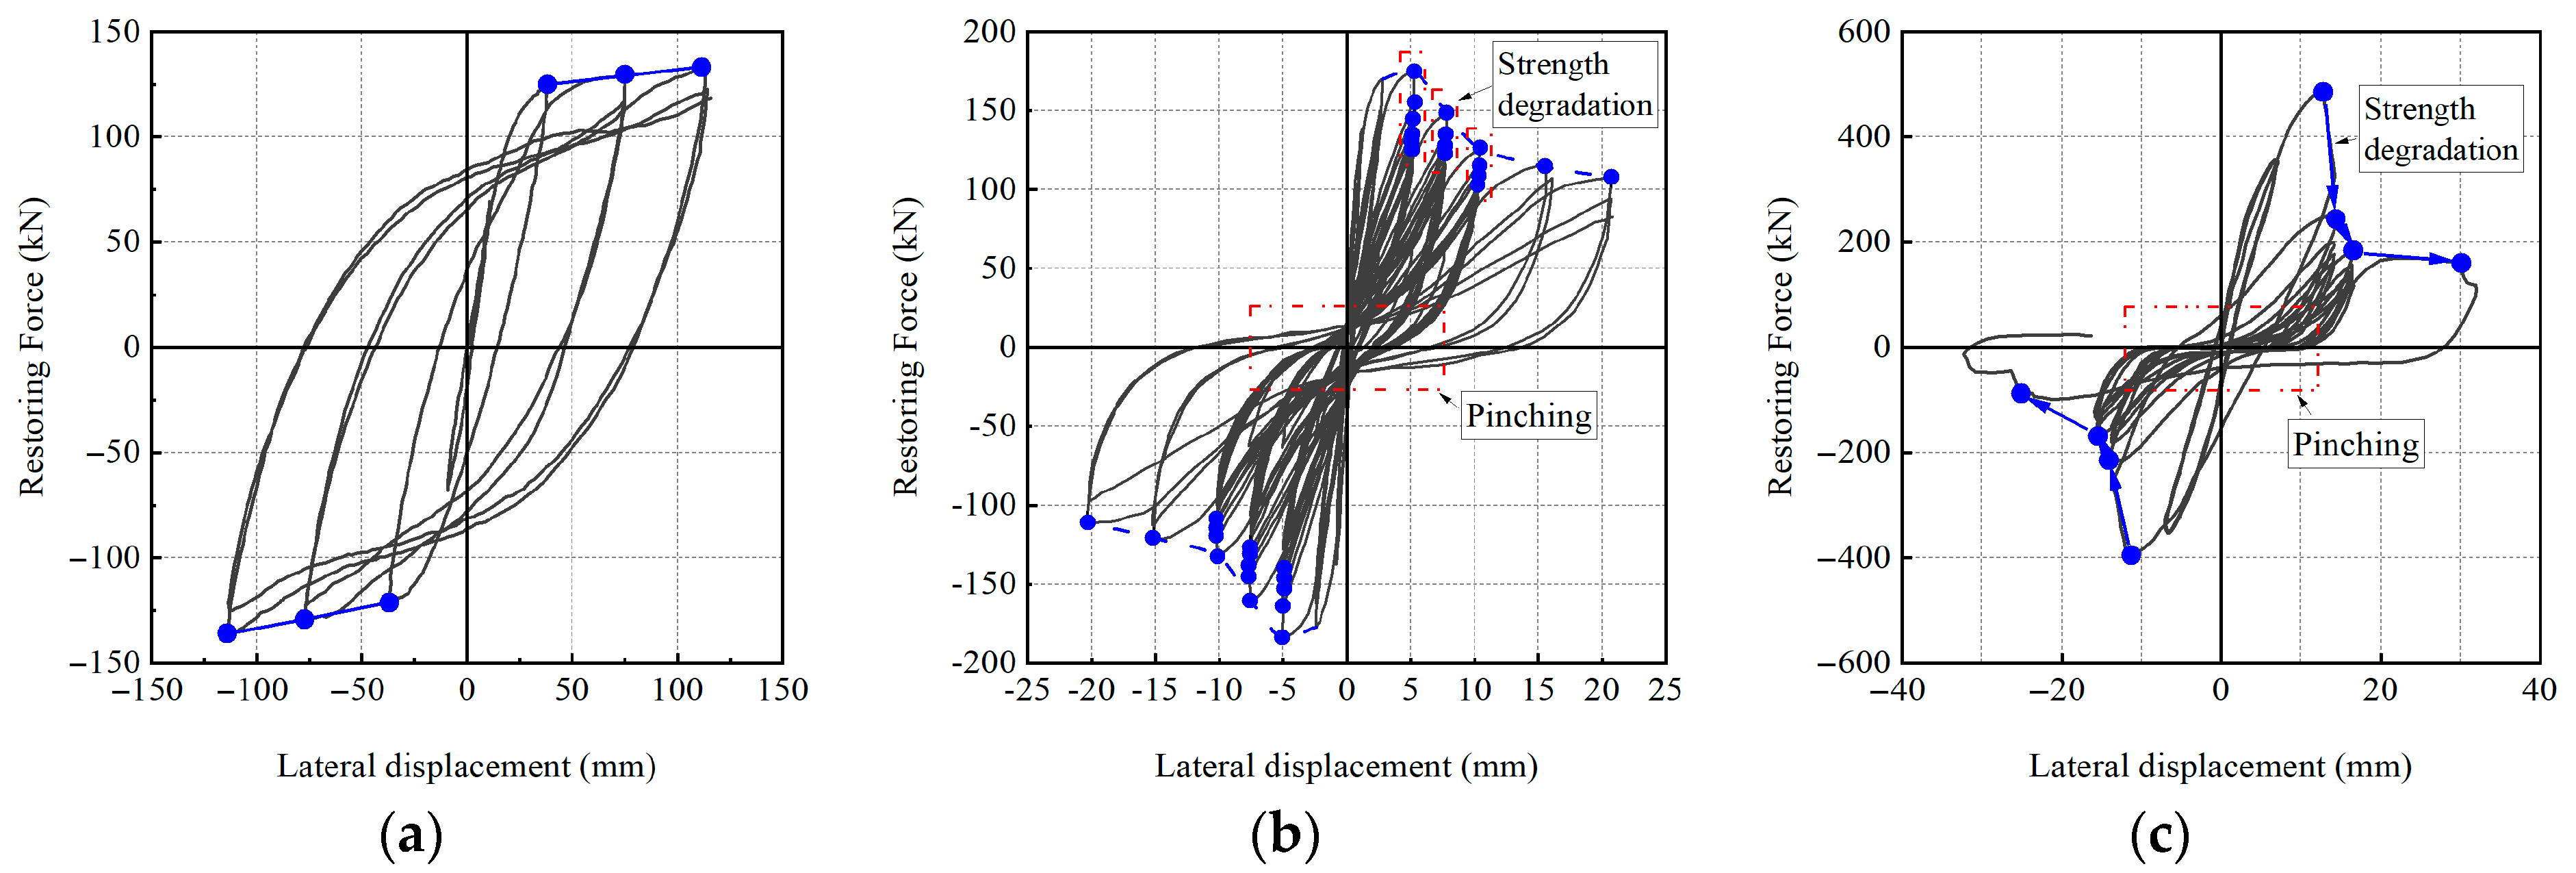
2.2. Hysteretic Characteristics of Flexure-Shear Critical Columns

To establish a foundational framework for the hysteresis model, this section systematically investigates three intrinsic hysteretic degradation mechanisms of flexure-shear critical columns: (1) nonlinear strength degradation driven by concrete spalling and reinforcement buckling; (2) stiffness deterioration induced by cyclic crack accumulation; and (3) hysteretic energy dissipation governed by pinch effects in post-yield cycles. Quantitative relationships between these features and key structural parameters are statistically analyzed, directly informing the multi-phase damage evolution rules to be embedded in the subsequent model formulation.

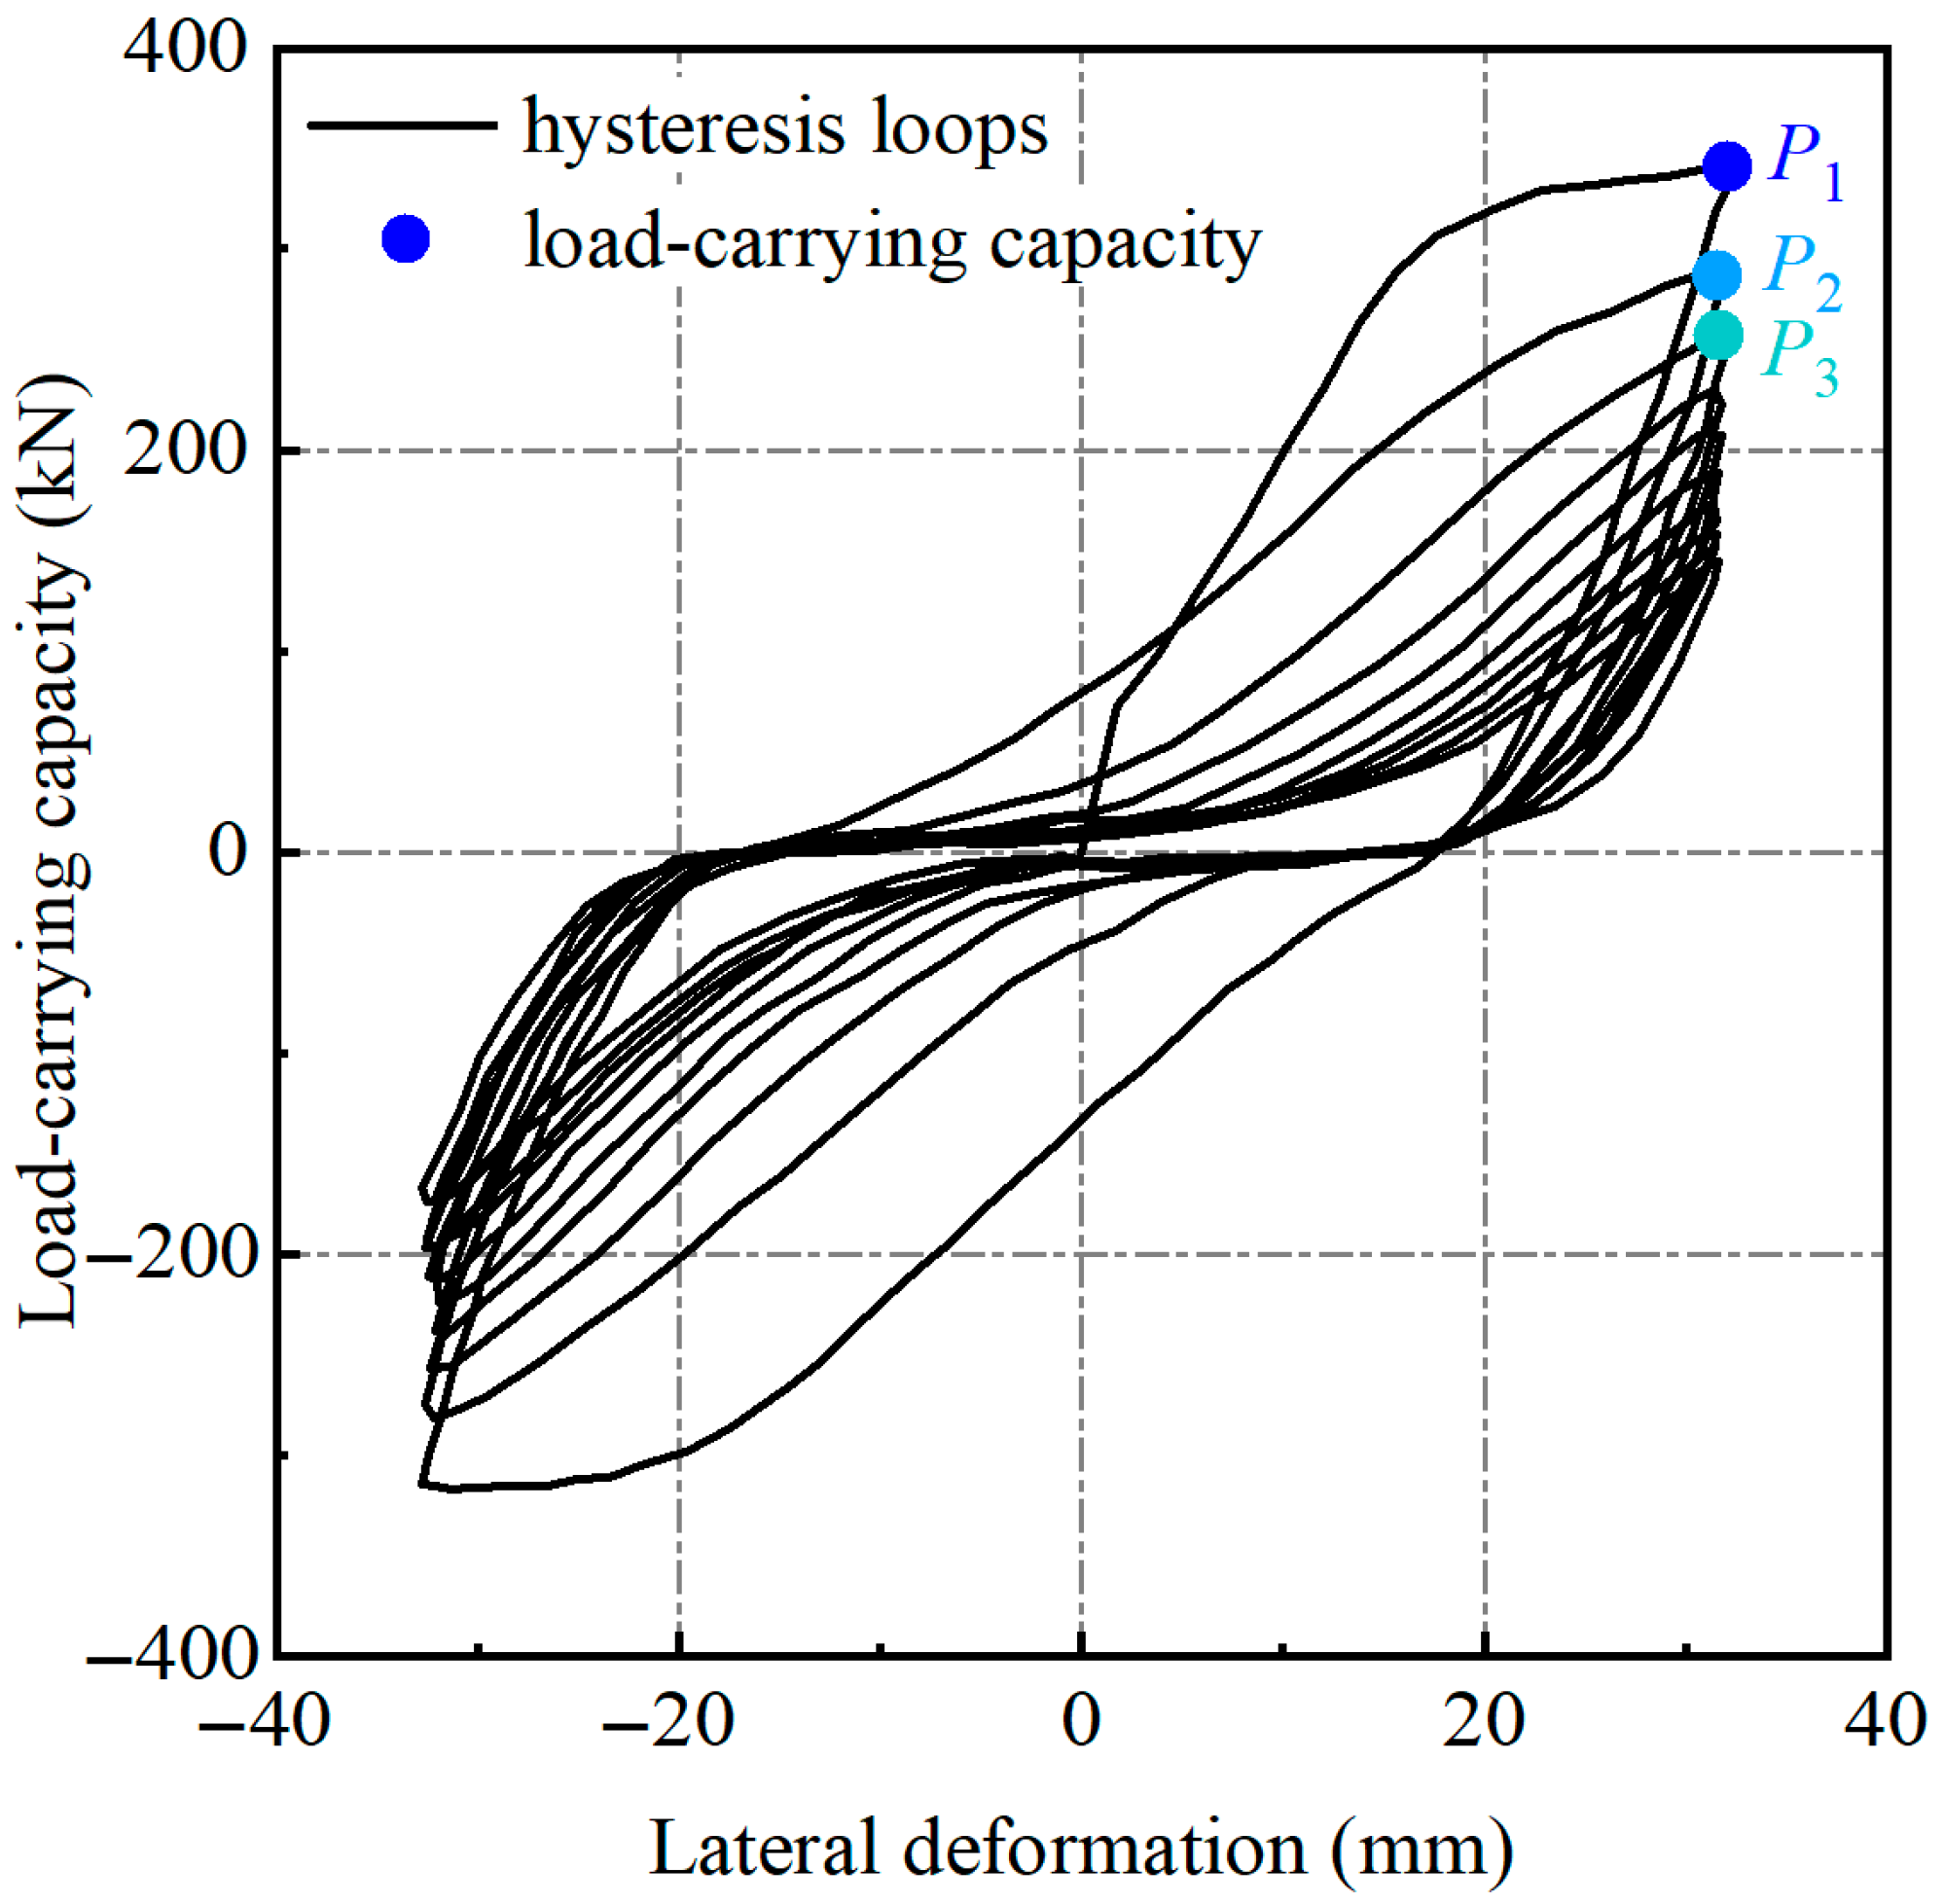
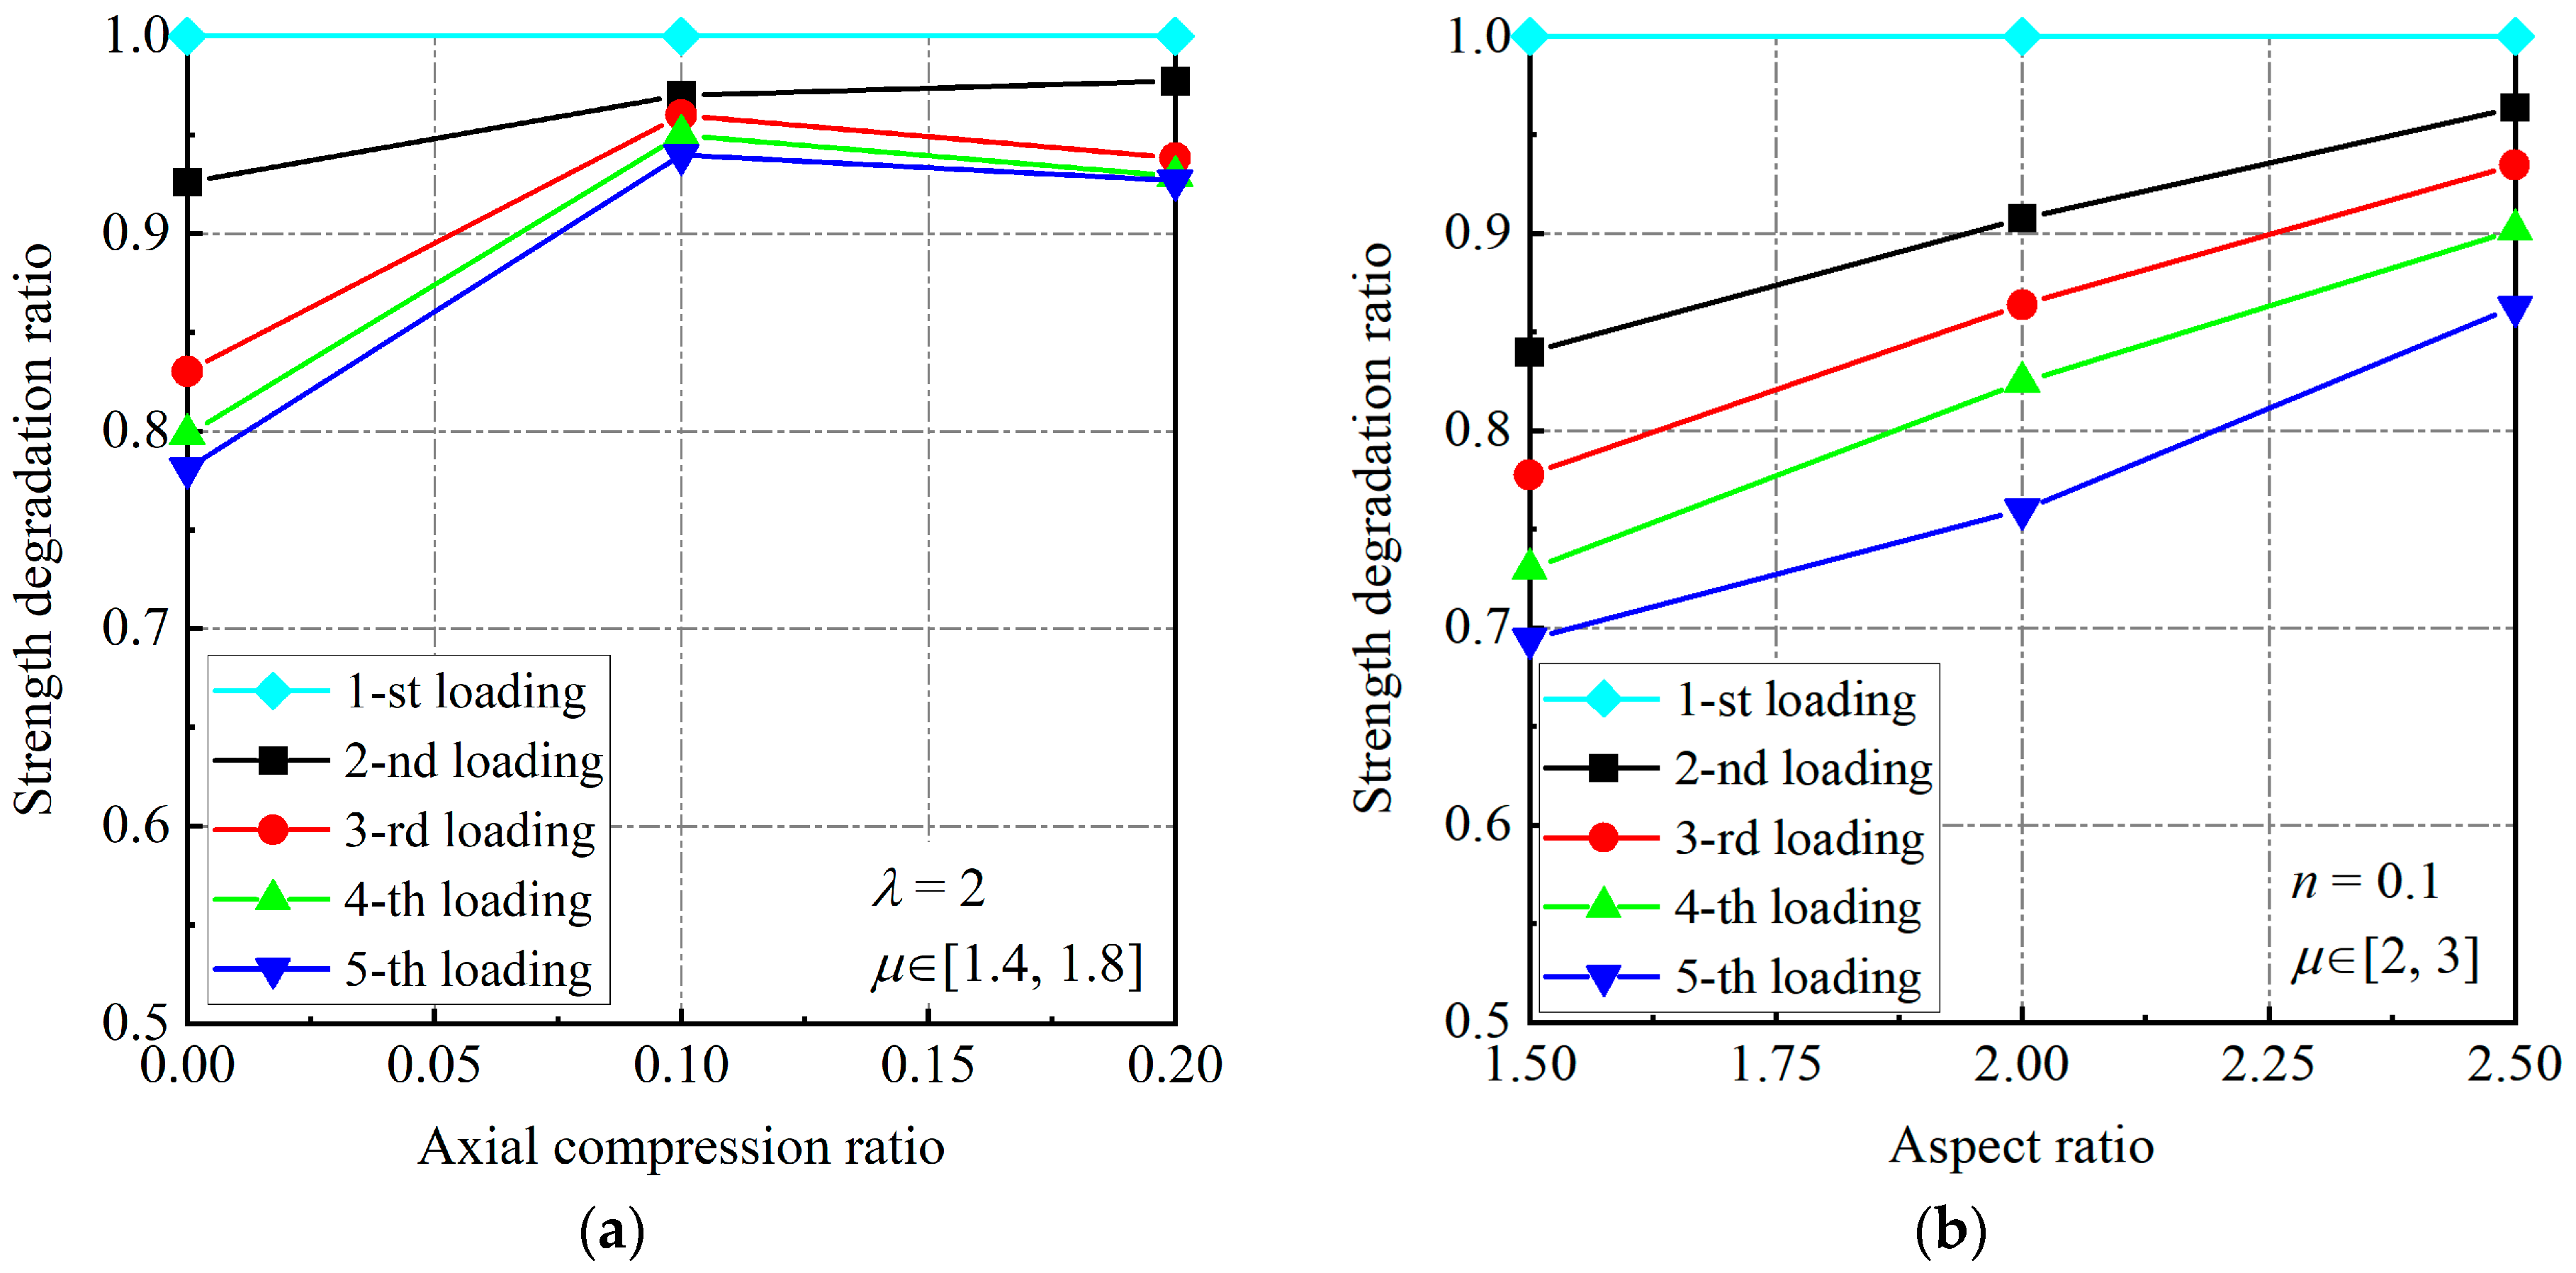
2.2.1. Nonlinear Strength Degradation

The strength degradation of RC columns characterizes their progressive loss of load-bearing capacity under cyclic loading, directly reflecting the structural resistance to fracture and failure. Compared to pure flexure failure modes, flexure-shear critical columns exhibit significantly accelerated strength degradation due to the synergetic interplay of bending-induced cracking and shear-driven damage mechanisms. As lateral load cycles intensify, shear cracks propagate diagonally while flexural cracks widen vertically, collectively accelerating concrete crushing, rebar bond slip, and stirrup confinement loss. This coupled damage accumulation evidently reduces both strength recovery and residual load resistance in post-yield phases.
To intuitively illustrate the strength degradation characteristics, Figure 3 presents the hysteretic loops of specimen No. 1. As shown in the figure, at the displacement amplitude level of 31.6 mm, the peak load P1 during the first cycle reaches 340.48 kN. Subsequently, the strength progressively decreases to P2 = 286.52 kN in the second cycle and further degrades to P3 = 254.14 kN upon the third cycle loading at the same displacement level. The strength degraded to 144.24 kN after 10 cycles of loading.
Figure 4 illustrates the relationship between lateral load-carrying capacity and number of cyclic loading for all specimens. The red dots mark where the displacement level changes. It should be noted that the specimens were classified into four groups based on their displacement ductility demands (μ) to evaluate degradation patterns across distinct displacement amplitude levels. Specifically, Figure 4a–d correspond to ductility ranges of μ = 1–2, μ = 2–3, μ = 3–4, and μ = 4–6, respectively. This grouping strategy facilitates systematic analysis of cumulative displacement-dependent strength deterioration and its correlation with ductility thresholds. As can be observed from the figure, the lateral load-carrying capacity exhibits a progressive decline with increasing cyclic loading numbers under identical displacement amplitudes, accompanied by a decelerating degradation rate. This suggests that the material or structural system undergoes a nonlinear accumulation of damage, where initial cycles impose the most severe strength losses.
Furthermore, comparative evaluations across displacement ductility demands grades highlight a distinct trend: specimens subjected to higher ductility demands (e.g., μ = 4–6) demonstrate substantially amplified strength deterioration compared to those experiencing lower ductility levels (e.g., μ = 1–2). This phenomenon may be attributed to cumulative micro-cracking and plastic hinge development under large displacement reversals, which disproportionately accelerates degradation mechanisms at elevated ductility thresholds. Such observations underscore the critical influence of ductility-dependent damage thresholds on the seismic resilience of flexure-shear critical structural components.

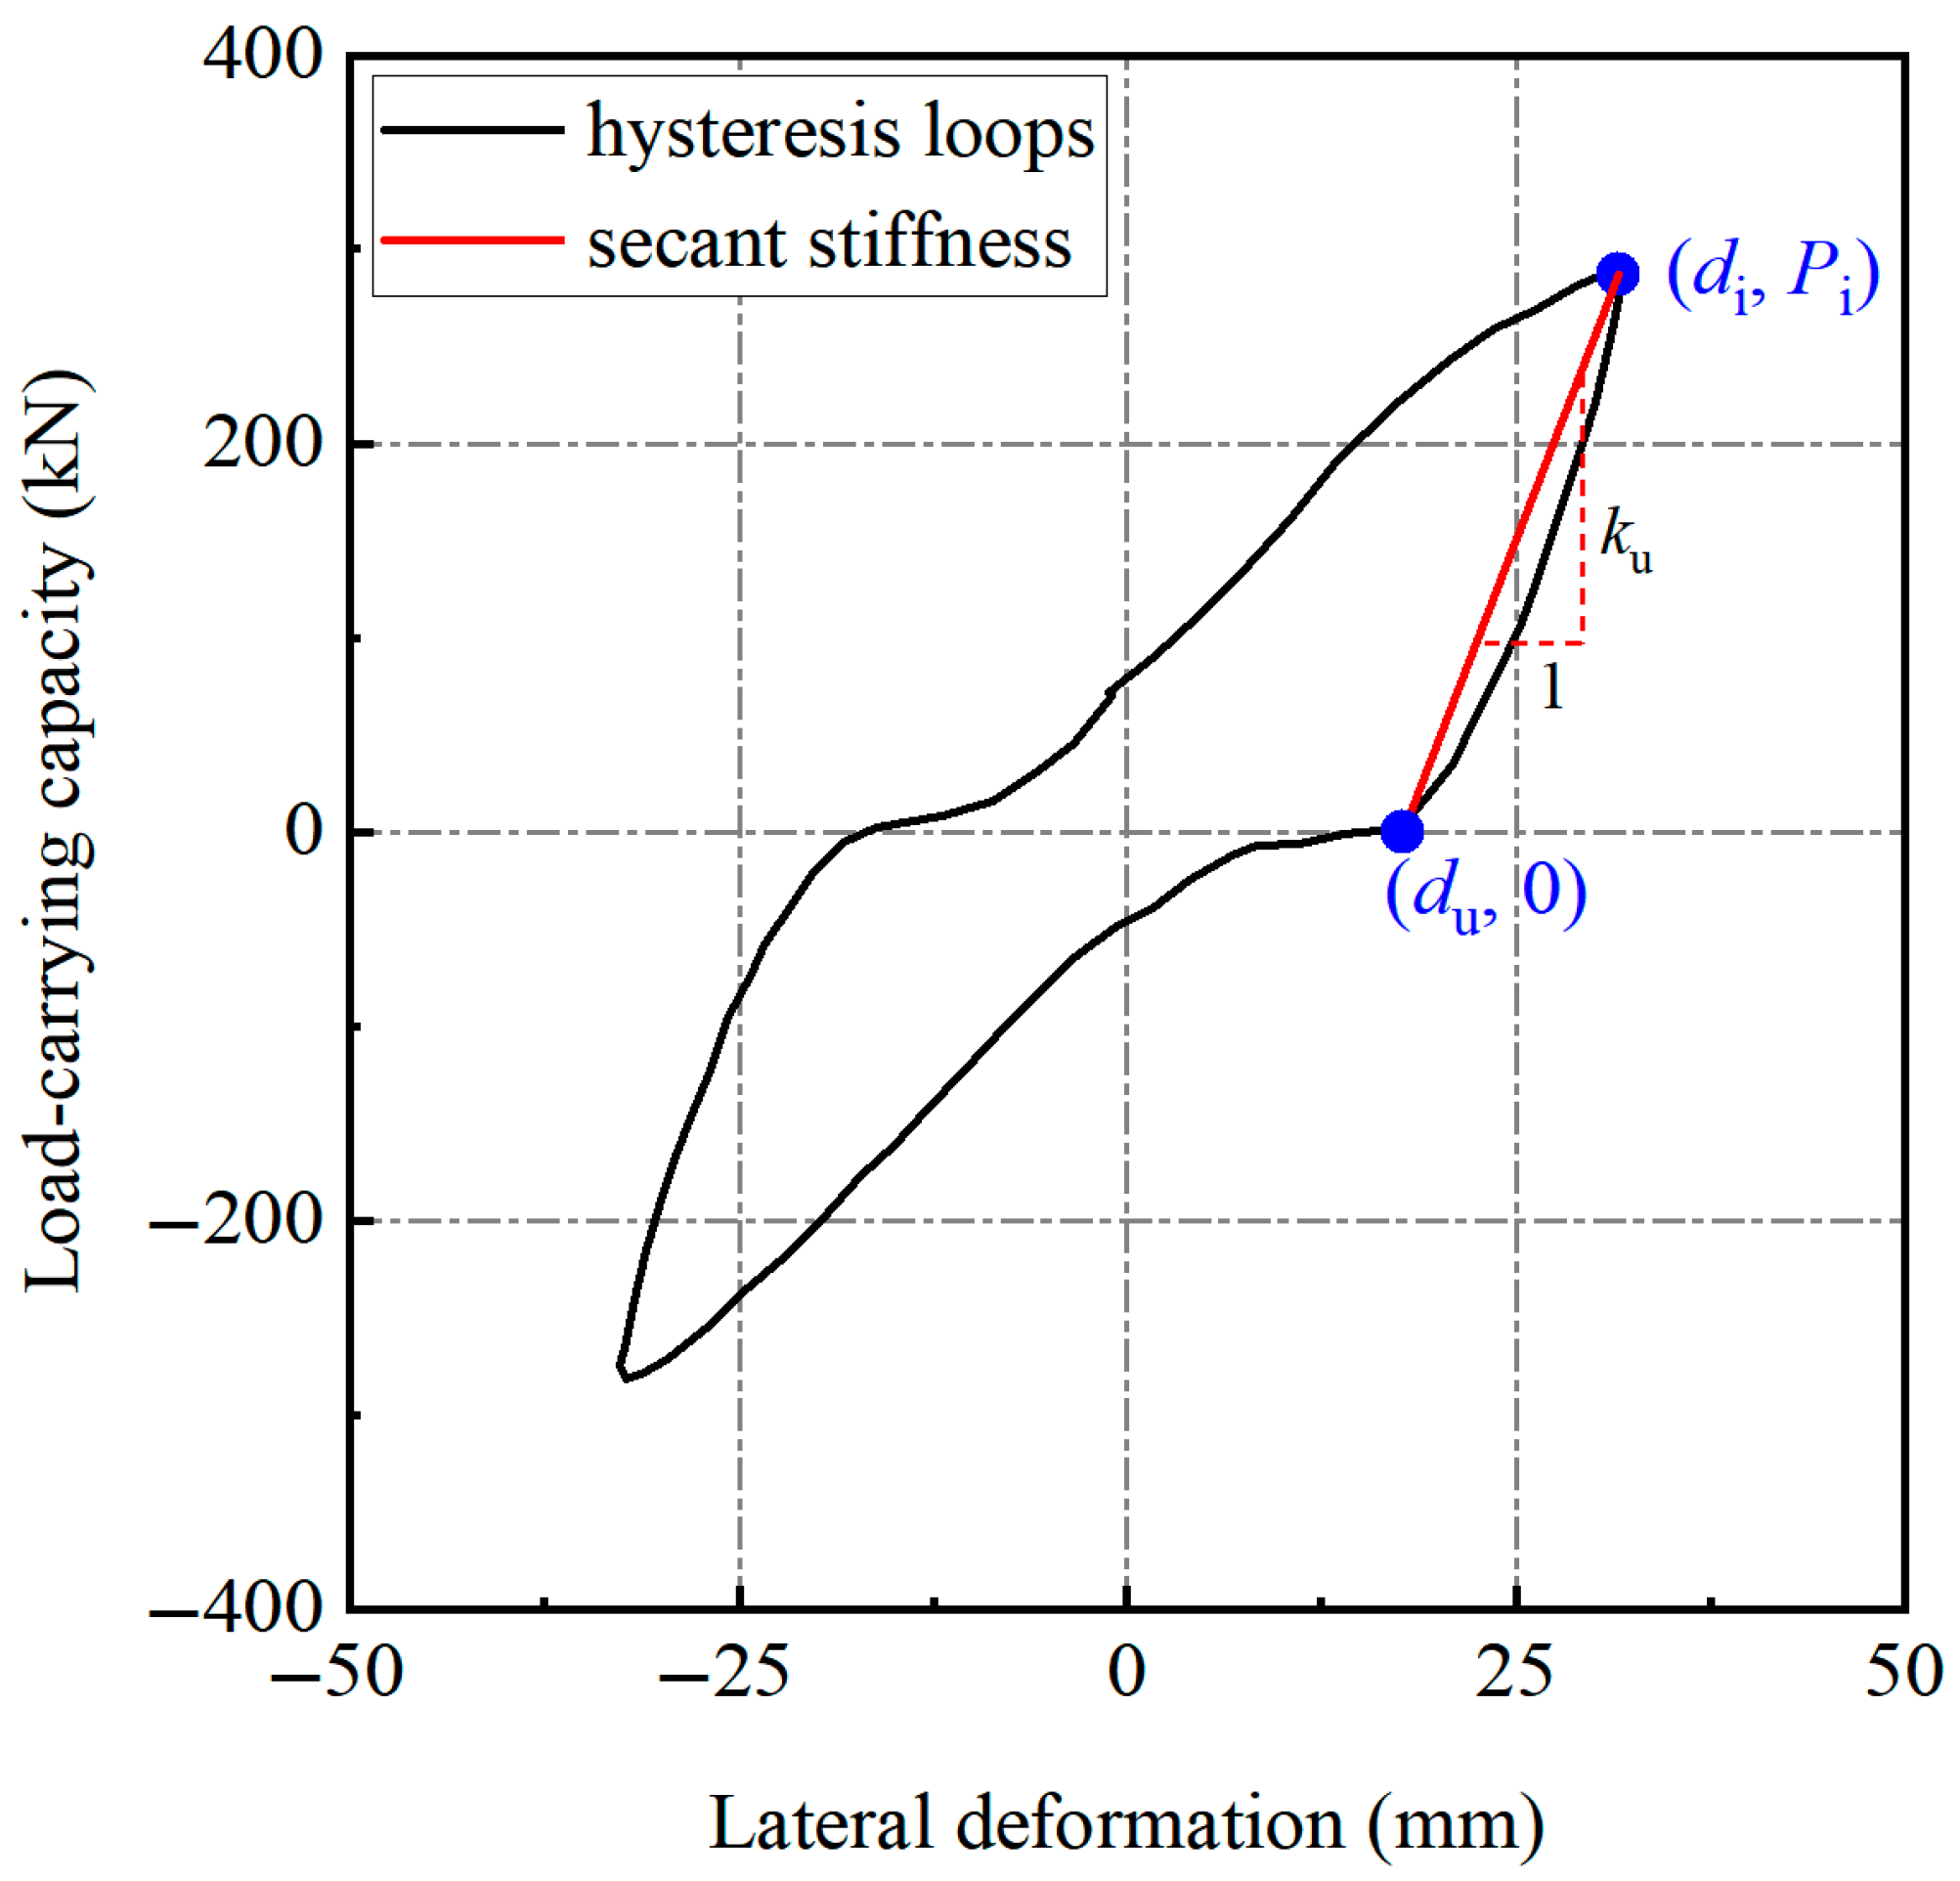
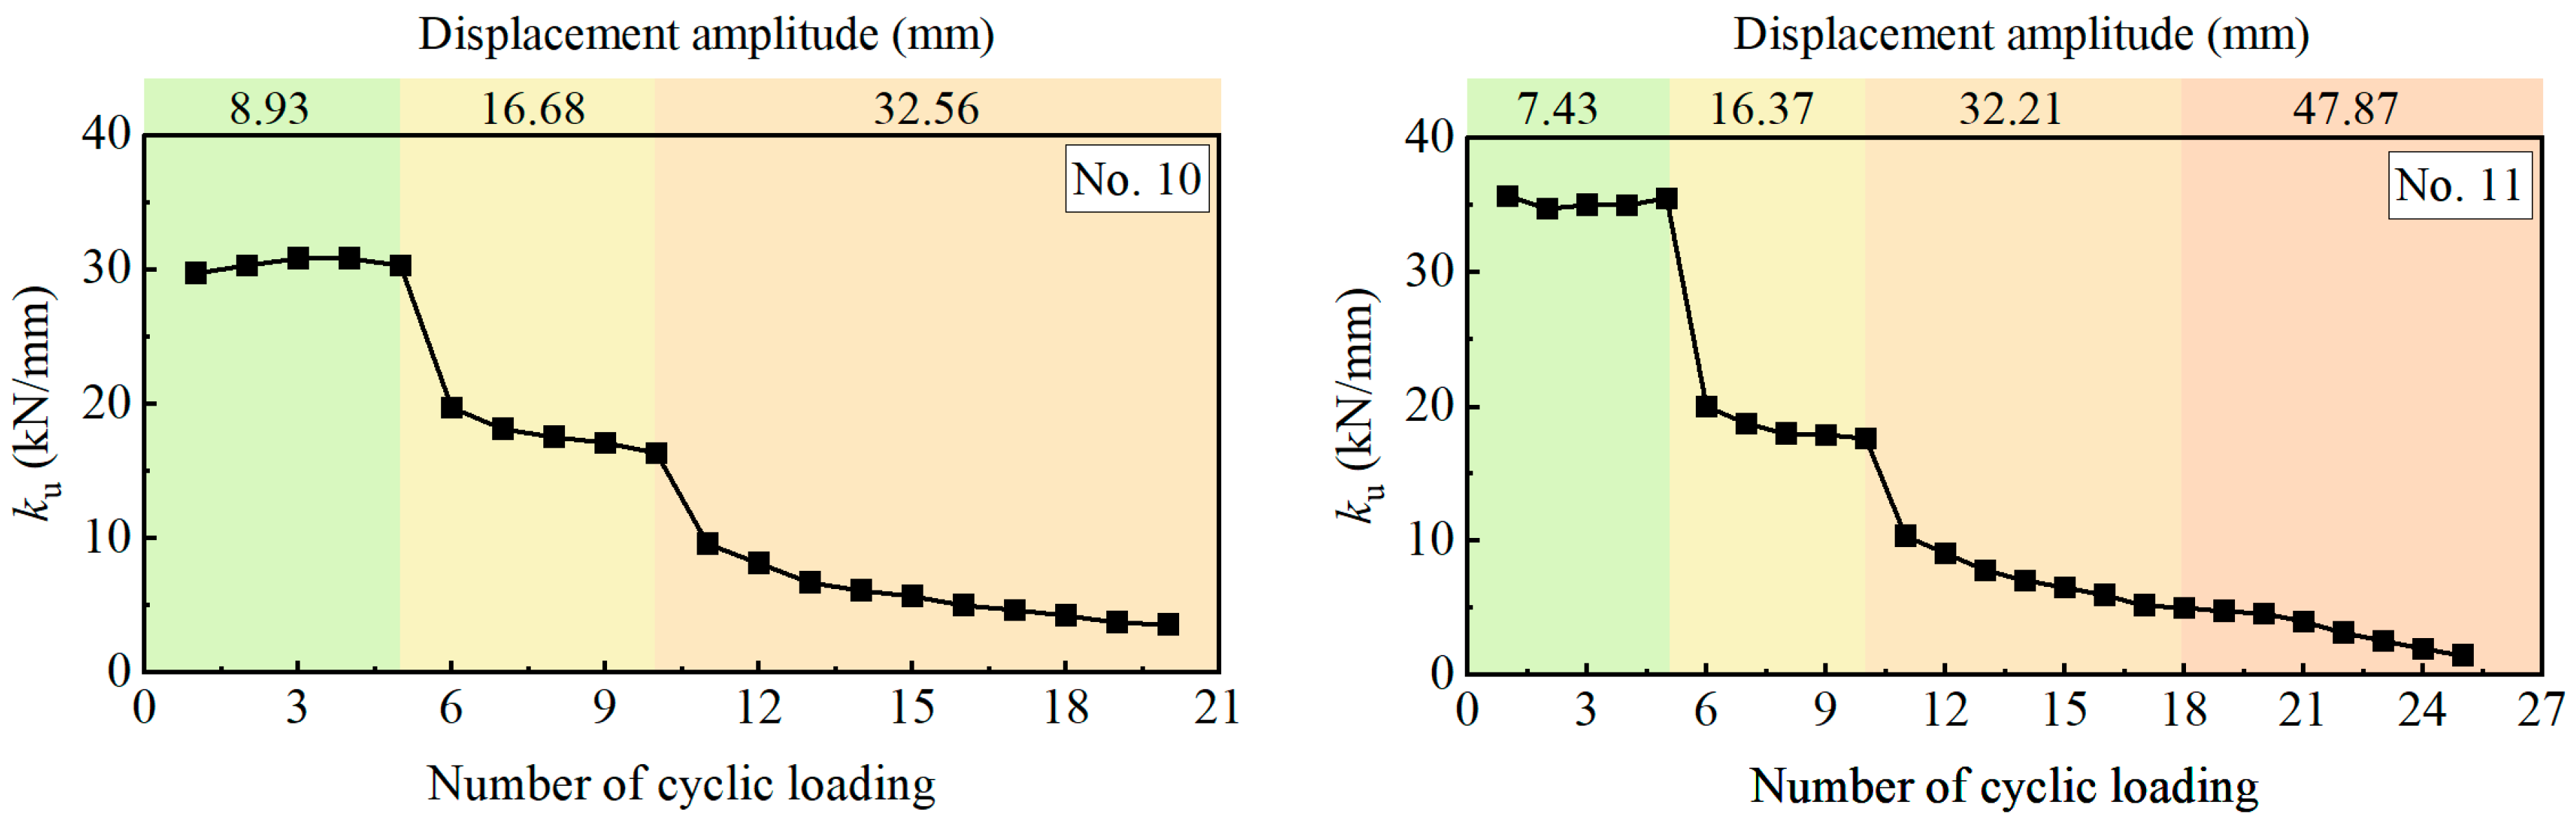
2.2.2. Stiffness Degradation

Stiffness degradation constitutes critical hysteretic characteristics in the modeling of flexure-shear critical columns, with its precise characterization being pivotal for developing reliable numerical models. Generally, stiffness degradation comprises two aspects: loading stiffness degradation and unloading stiffness degradation. For the former, the degraded stiffness can be quantified by the slope of the line connecting unloading points and strength degradation points, indicating its dependency on the progression of strength deterioration. This study focuses specifically on the evolution of unloading stiffness degradation under cyclic loading at identical displacement amplitudes.
To quantify unloading stiffness degradation, the secant stiffness defined as the slope of the line connecting the strength degradation point (di, pi) and the unloading displacement point (du, 0) is adopted as illustrated in Figure 5. The unloading stiffness ku is formulated as:
k u = P i d i d u
where Pi denotes the peak strength attained during the i-th loading cycle at displacement amplitude di, and du represents the unloading displacement.
Figure 6 illustrates the degradation patterns of unloading stiffness across various column specimens under increasing cyclic repetitions, where vertical division lines delineate distinct displacement amplitude levels. Due to space constraints, only selected representative results are shown.
It can be observed that the unloading stiffness remains nearly constant regardless of the number of cycles at a fixed displacement amplitude, suggesting minimal influence of repeated loading on stiffness retention under elastic–plastic shakedown. However, a pronounced degradation trend emerges as displacement amplitudes escalate, characterized by a progressive reduction in secant stiffness with elevated ductility demands. This implies that unloading stiffness degradation is predominantly governed by displacement amplitude rather than cyclic repetition.

2.2.3. Hysteretic Energy Dissipation

During seismic excitation, a structure is subjected to continuous energy input from the earthquake, which must be absorbed and dissipated through its components to avoid catastrophic failure. Upon entering the inelastic phase, the seismic resilience of the structure increasingly relies on the reversible and irreversible energy dissipation mechanisms of its critical members. Among these, the hysteretic energy dissipation, characterized by the area enclosed between the loading and unloading branches of the load–displacement hysteresis loop, serves as a key indicator of nonlinear energy consumption capacity in cyclic damage processes. A larger enclosed area corresponds to a “fuller” hysteresis loop, indicating superior energy dissipation capacity and enhanced seismic performance.
Figure 7 presents the hysteretic load–displacement curves of Specimen No. 1 subjected to cyclic loading to illustrate the calculation of hysteretic energy. Notably, cumulative strength degradation is influenced by both positive (e.g., displacement toward the right side) and negative (e.g., displacement toward the left side) loading phases. To address this phenomenon, the total hysteretic energy is intentionally partitioned into positive hysteretic energy dissipation (shaded blue in Figure 7, denoted as E+) and negative hysteretic energy dissipation (shaded red, denoted as E), corresponding to the respective loading directions.
The hysteretic energy dissipation is calculated by performing integration over the enclosed areas of the loading-unloading curves in both positive and negative phases. To facilitate engineering applications and achieve dimensionless results, the calculated energy values are then normalized with respect to the reference strain energy, that is:
E n , i + = E i + E s 0 = F ( x ) d x         ( x > 0 )
E n , i = E i E s 0 = F ( x ) d x         ( x < 0 )
where E i + and E i represent the accumulated hysteretic energy dissipation during positive and negative displacement excursions, respectively, measured from the beginning of loading through the completion of the i-th cycle. Correspondingly, E n , i + and E n , i are the normalized hysteretic energy dissipation in the positive and negative loading directions. F(x) denotes the restoring force at deformation x, and E s 0 represents the reference strain energy, calculated as E s 0 = k d 0 2 / 2 . Here, k is the secant stiffness at the peak point, and d0 is the loading displacement amplitude. All symbol definitions ( E s 0 , k and d0) are illustrated in Figure 7.
This methodology explicitly accounts for asymmetric damage evolution (e.g., differences in concrete cracking and steel yielding under tension versus compression), thereby enabling a rigorous evaluation of energy dissipation capacity under cyclic loading.
To elucidate the cyclic degradation mechanism of flexure-shear critical columns, Figure 8 illustrates the normalized hysteretic energy dissipation in positive ( E n + ) and negative ( E n ) loading directions across sequential cycles at varying displacement levels. Note that the normalized energy dissipation values presented in the figure were reset at the onset of each new displacement level to isolate displacement-escalation-dependent damage evolution.
As shown in Figure 8, both positive and negative hysteretic energy dissipation exhibit gradual accumulation with increasing cycle numbers under identical displacement levels. At lower displacement amplitudes (e.g., μ = 1–2), the energy accumulation approximately follows a linear trend with nearly constant incremental gains per cycle. However, at higher displacement levels, the rate of energy accumulation declines progressively, evidenced by reduced slopes of the curves. This attenuation correlates with accelerated stiffness degradation and shear-dominated damage under large cyclic levels. In addition, the symmetric loading protocol ensures comparable magnitudes of positive and negative hysteretic energy dissipation, with minor deviations attributed to inherent material heterogeneity.

3. Model Framework for Degradation and Pinching Effect

3.1. Energy-Based Strength Degradation Model

The hysteretic behavior of flexure-shear critical columns under cyclic loading is characterized by pronounced strength deterioration, a phenomenon inextricably linked to cumulative damage progression in both concrete and reinforcement. To quantify the strength degradation, the strength degradation ratio is defined as follows:
γ i = P i P 1 ( i = 1 , 2 , 3 )
where P1 represents the peak load during the first cycle at a given displacement amplitude level, and Pi denotes the peak load attained during the i-th cycle under the same displacement level. The definitions of P1 and Pi (i = 1, 2, 3…), illustrated schematically in Figure 3, emphasize the progressive loss of load-bearing capacity due to cumulative damage.
Notably, the strength degradation exhibits marked dependency on the loading history. Variations in load reversals and displacement amplitudes directly influence the degradation extent. Hysteretic energy dissipation, calculated as the cumulative area enclosed by load–displacement loops, serves as a robust descriptor of cyclic load history. A strong correlation has been observed between cumulative energy dissipation and strength degradation rates in flexure-shear critical columns. Such observations highlight the critical role of integrating energy-based metrics into hysteresis models. By establishing a functional relationship between hysteretic energy and the strength degradation ratio, advanced models can more realistically simulate the path-dependent strength reduction essential for seismic performance assessment.
Figure 9 delineates the interdependence among loading cycles (N), cumulative hysteretic energy dissipation (En), and strength degradation ratio (γ), revealing accelerated strength deterioration under progressive energy accumulation—particularly at large displacement amplitudes. Projection of Figure 9 as well as quantitative analysis of these experimental data demonstrates that the relationship between γ and En follows an exponential decay pattern at constant displacement levels. To rigorously formulate this observed behavior, several candidate nonlinear models provided by 1stOpt software (version 15.0) were systematically evaluated. The adjusted determination coefficient (Adj. R2) served as the primary selection criterion to optimize model fidelity while controlling complexity. Exponential formulations consistently achieved superior fit, establishing the governing equation for cycle-dependent degradation:
γ i = e x p [ β ( n , λ ) ( a E n , i + + b E n , i ) ]
where β ( n , λ ) is the adjustment coefficient dependent on axial-load ratio n and aspect ratio λ. a and b are the fitting parameters.
To examine the influence of specimen parameters on strength degradation and then establish a rational expression for β ( n , λ ) , Figure 10 illustrates strength degradation ratios under varying axial compression ratios and aspect ratios. For valid comparison, Figure 10a displays results with the comparable aspect ratio and the displacement ductility demand but differing axial compression ratios, and Figure 10b presents results with the consistent axial compression ratio and displacement ductility demand but varying aspect ratios. Results reveal that specimens subjected to smaller axial compression ratios exhibit progressively greater reductions in their strength degradation as cyclic loading advances. Conversely, when the axial compression ratio exceeds 0.1, the strength degradation ratio remains stable throughout cycling. In addition, specimens with smaller aspect ratios exhibit more pronounced strength degradation.
Building on the analysis above, the optimal empirical formulation was identified through systematic function screening in 1stOpt software’s nonlinear regression module, applying dual selection criteria: (1) maximized adjusted determination coefficient (Adj. R2); (2) mathematical parsimony. This rigorous calibration process yields the following expression of β ( n , λ ) :
β ( n , λ ) = 30 n 0.83 λ + 35 n 1.88
By substituting Equation (6) into Equation (5) and performing nonlinear regression against experimental data via 1stOpt, the coefficients a and b were calibrated to optimized values of 0.10 and 0.05, respectively.
Critically, unlike conventional strength degradation models [3,39,40], the proposed framework explicitly differentiates the degradation contributions from positive and negative hysteretic energy dissipation. This directional sensitivity is robustly confirmed by the parameter values (a = 0.10, b = 0.05), indicating significantly higher degradation impact from positive-direction energy dissipation.
To validate the proposed strength degradation model, critical parameters including axial-load ratio (n) and aspect ratio (λ) were incorporated into Equations (5) and (6). Hysteretic energy dissipation ( E n , i + , E n , i ) was computed via numerical integration of Equations (2) and (3). The resulting predictions were validated against experimental data, with Figure 11 comparing experimental versus simulated strength degradation ratios (γ). The results demonstrate good agreement, yielding a Pearson correlation coefficient of 0.84 and an adjusted determination coefficient (Adj. R2) of 0.72, indicating acceptable predictive capability for estimating strength degradation in flexure-shear critical columns.

3.2. Stiffness Degradation Model

As observed in Section 2.2.2, the cyclic loading number negligibly influences unloading stiffness degradation under the same displacement level. Consequently, the stiffness degradation model for flexure-critical columns remains applicable to flexure-shear critical circular columns. In view of this, the unloading stiffness of the Takeda hysteresis model [41] is adopted as follows:
k u = k 0 ( d y / d 0 ) α
where k0 is the initial stiffness. For bilinear backbone curves, the initial stiffness k 0 = F y / d y . Here Fy and dy are the yield strength and yield displacement, respectively. d0 is the maximum displacement attained in the direction of loading. α is the degradation exponent, which is taken as 0.4 for flexure-shear critical columns according to nonlinear regression analysis.

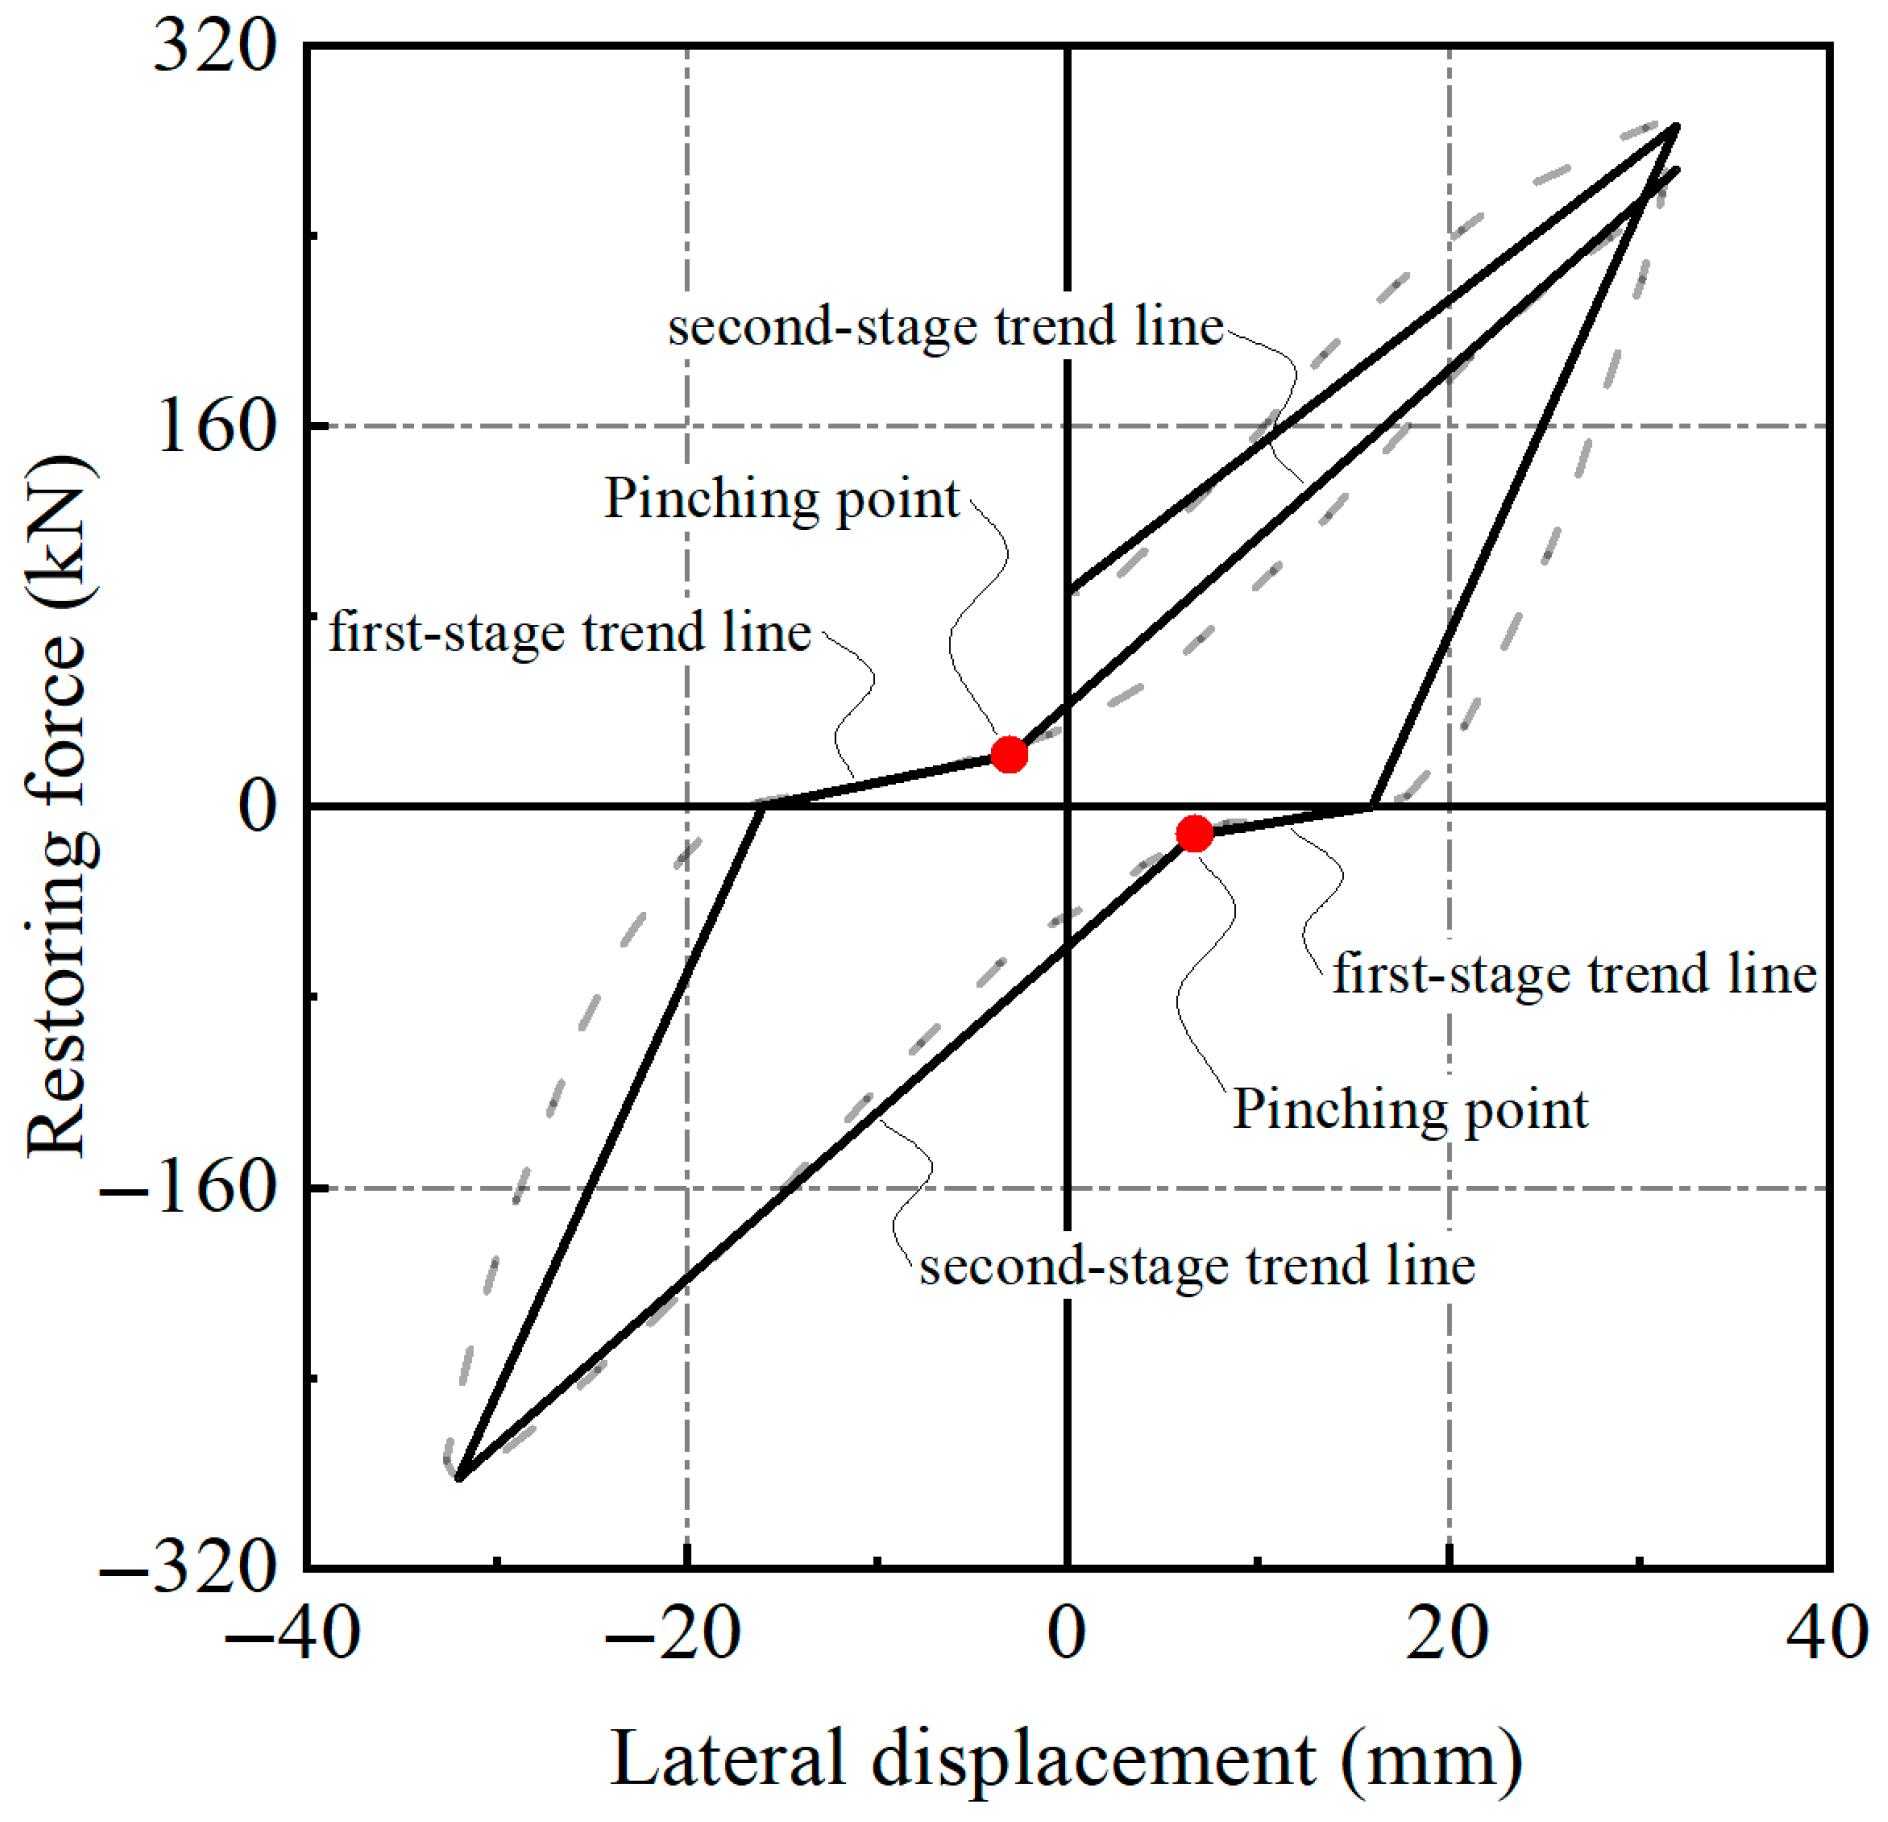
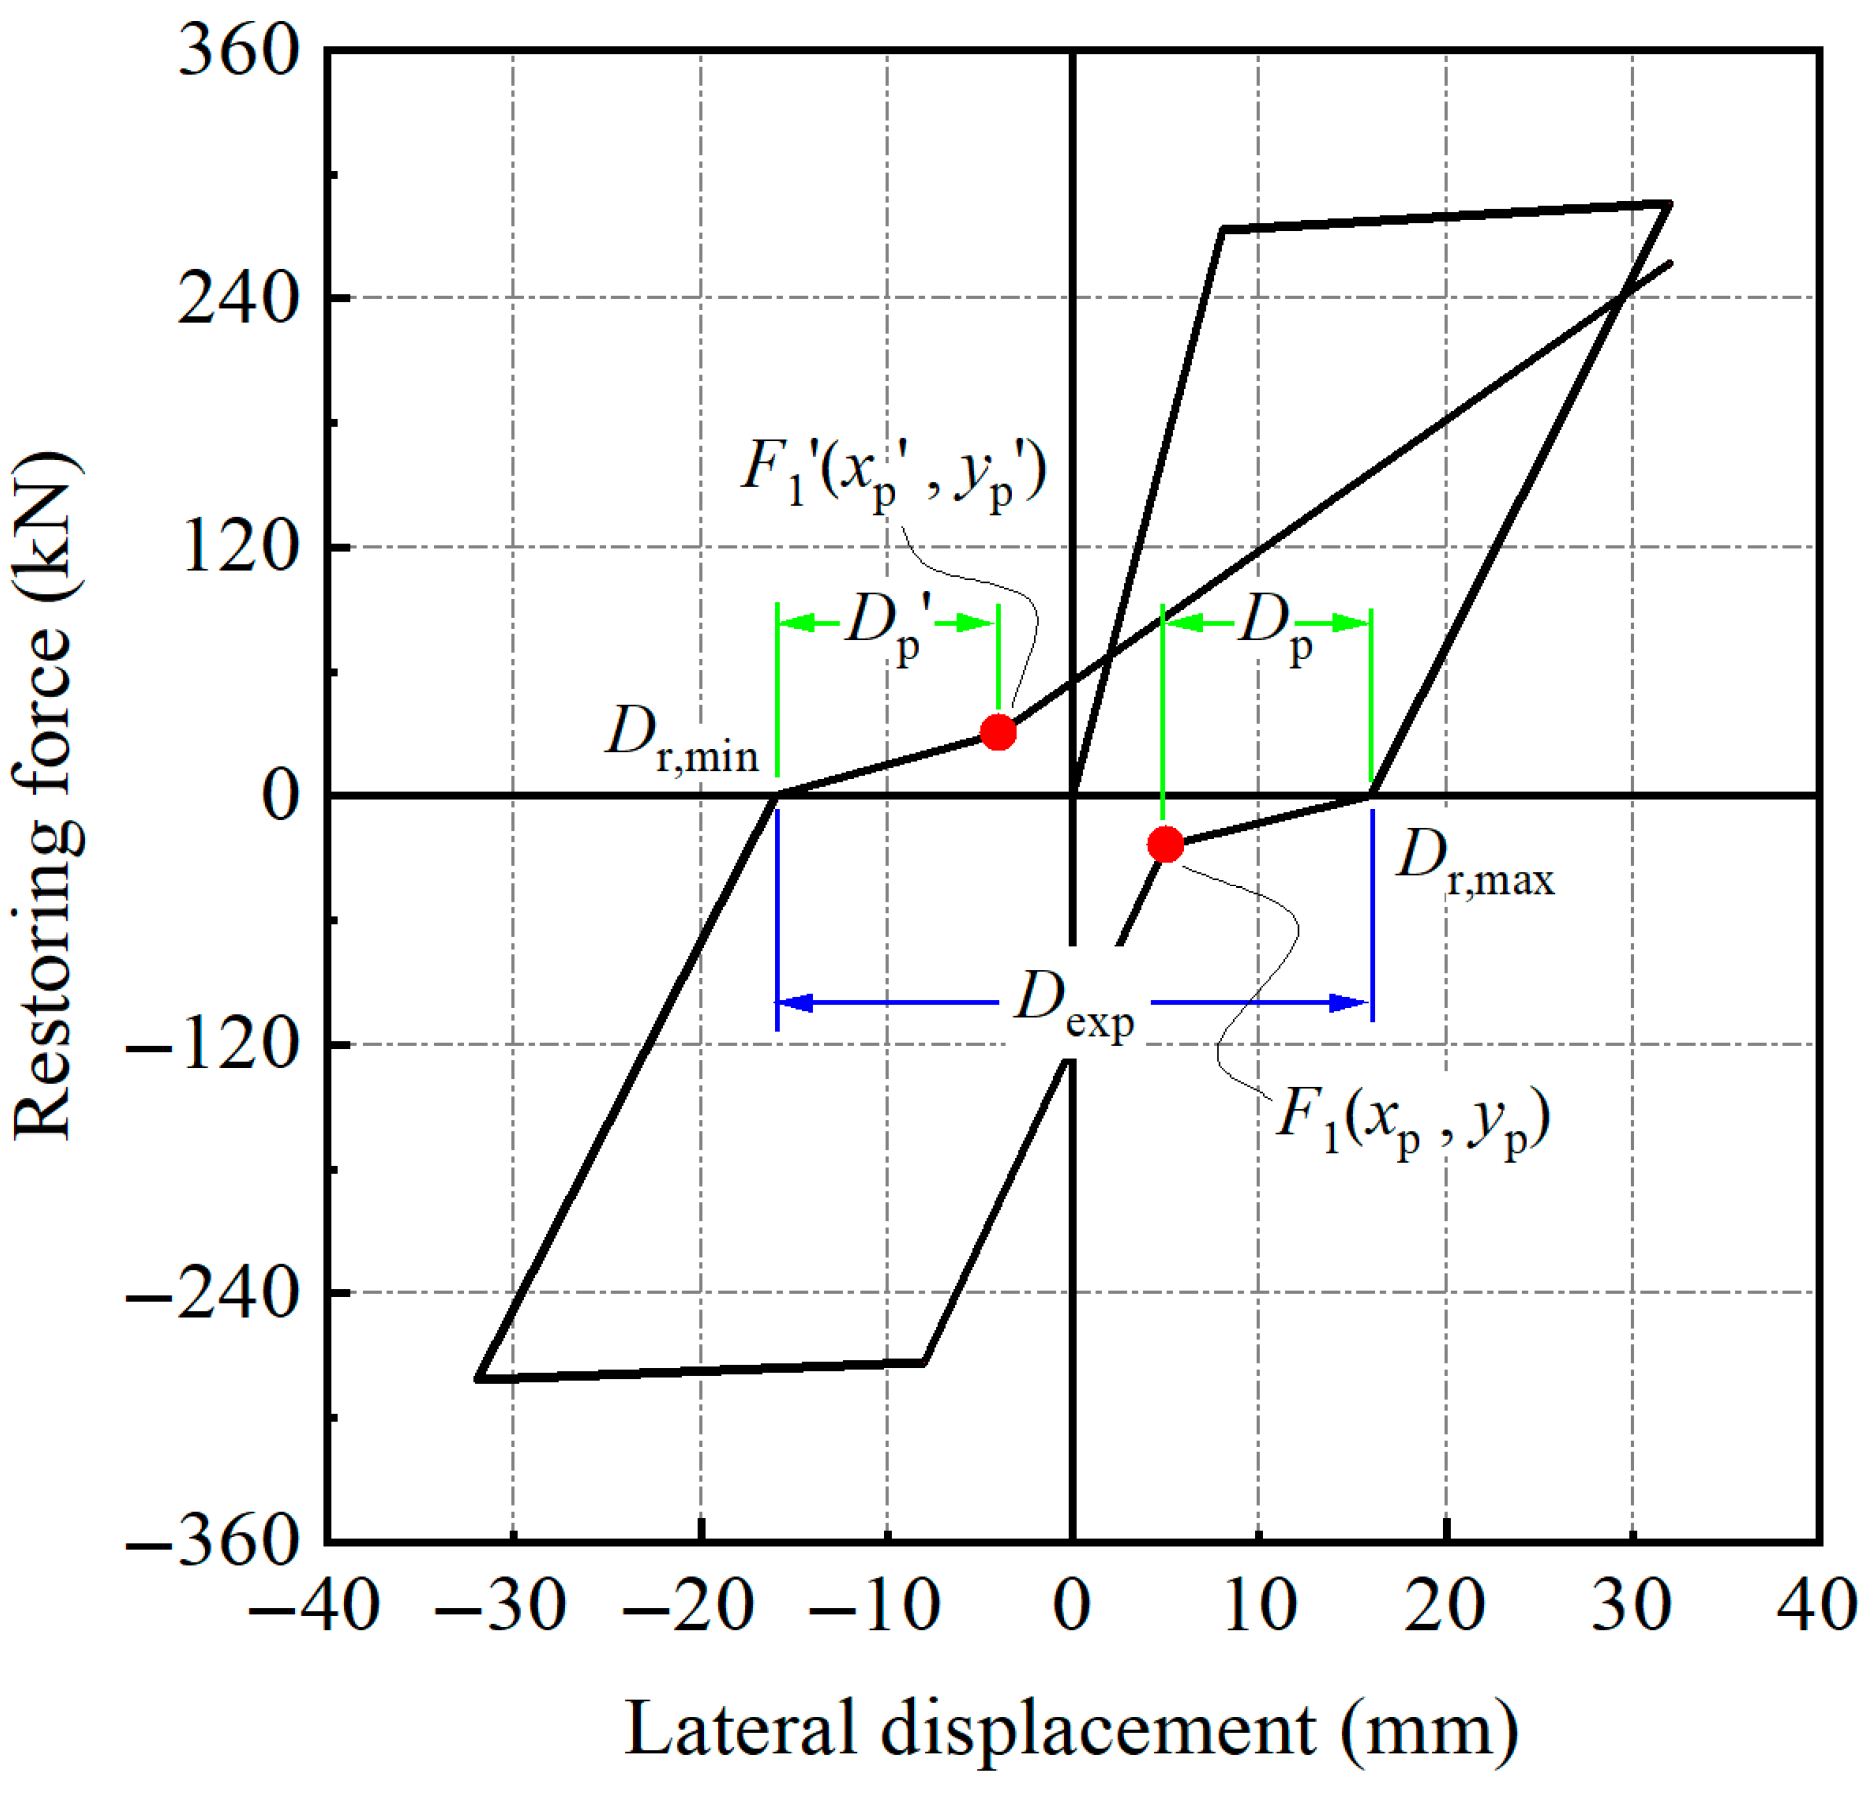
3.3. Pinching Behavior Characterization

Pinching is an essential characteristic of hysteretic curves for flexure-shear critical columns, serving as a key indicator of their energy dissipation capacity under cyclic loading. This pronounced pinching effect reflects the distinctive nonlinear behavior resulting from combined damage mechanisms under reversed loading.
Within this study, the pinching point is defined as the intersection between the first-stage trend line and the second-stage reloading trend line, as graphically represented in Figure 12. To accurately characterize the progressive migration of pinching points, Figure 13 presents the hysteretic response of Specimen No. 1, a representative case of flexure-shear failure. Analysis confirms that pinching points consistently manifest between the unloading reversal point and the subsequent peak point in the opposite loading direction. Crucially, these pinching points exhibit cyclic degradation with increasing load cycles: both displacement magnitude and associated force progressively diminish, accompanied by a notable shift in the pinching locations toward the displacement (x-) axis. This demonstrates that the pinching effect becomes progressively more pronounced with increasing number of loading cycles.
Based on the preceding results and regression analysis, the pinching point model for piers exhibiting flexure-shear failure can be characterized by the following definition:
D p D e x p = η γ i 2
where Dp represents the horizontal distance between a pinching point and the recent unloading point. Dexp denotes the distance between the positive and negative unloading points, explicitly defined as Dexp = Dr,maxDr,min. Here, Dr,max and Dr,min represent the displacement at the positive unloading point and negative unloading point, respectively. η is the pinching coefficient, which is calibrated as 0.3 for flexure-shear critical columns according to nonlinear regression analysis. The term γ i corresponds to the strength degradation ratio, computed according to Equation (5). It is critical to note that for the first cyclic loading at each displacement level, γ 1 is prescribed as 1.0. All symbol definitions (Dp, Dexp, Dr,max and Dr,min) are illustrated in Figure 14.
Utilizing fundamental geometric relationships, the coordinates of the positive and negative pinching points can be systematically derived as follows:
x p = D r , m a x D p = D r , m a x η γ i 2 D e x p
x p = D r , m i n D p = D r , m i n η γ i 2 D e x p
Similarly, experimental observations across multiple column specimens, combined with nonlinear regression analysis, yielded the following governing expression for strength of pinching points:
y p = κ P 1 μ 1 μ
where μ is the displacement ductility demand historically attained in the loading direction. κ is the scale factor, which is calibrated as −0.2 according to nonlinear regression analysis.
Collectively, Equations (4)–(11) establish an explicit mathematical framework for degradation and pinching. By parametrically linking each mechanism (strength decay, stiffness reduction, pinching effect) to its primary drivers—axial load ratio (n), aspect ratio (λ), and cumulative hysteretic energy (En)—the model achieves rigorous mathematical transparency while preserving physical interpretability of damage evolution progression. This formalism reduces implementation discrepancies inherent in computational simulations of nominally hysteretic systems [42].

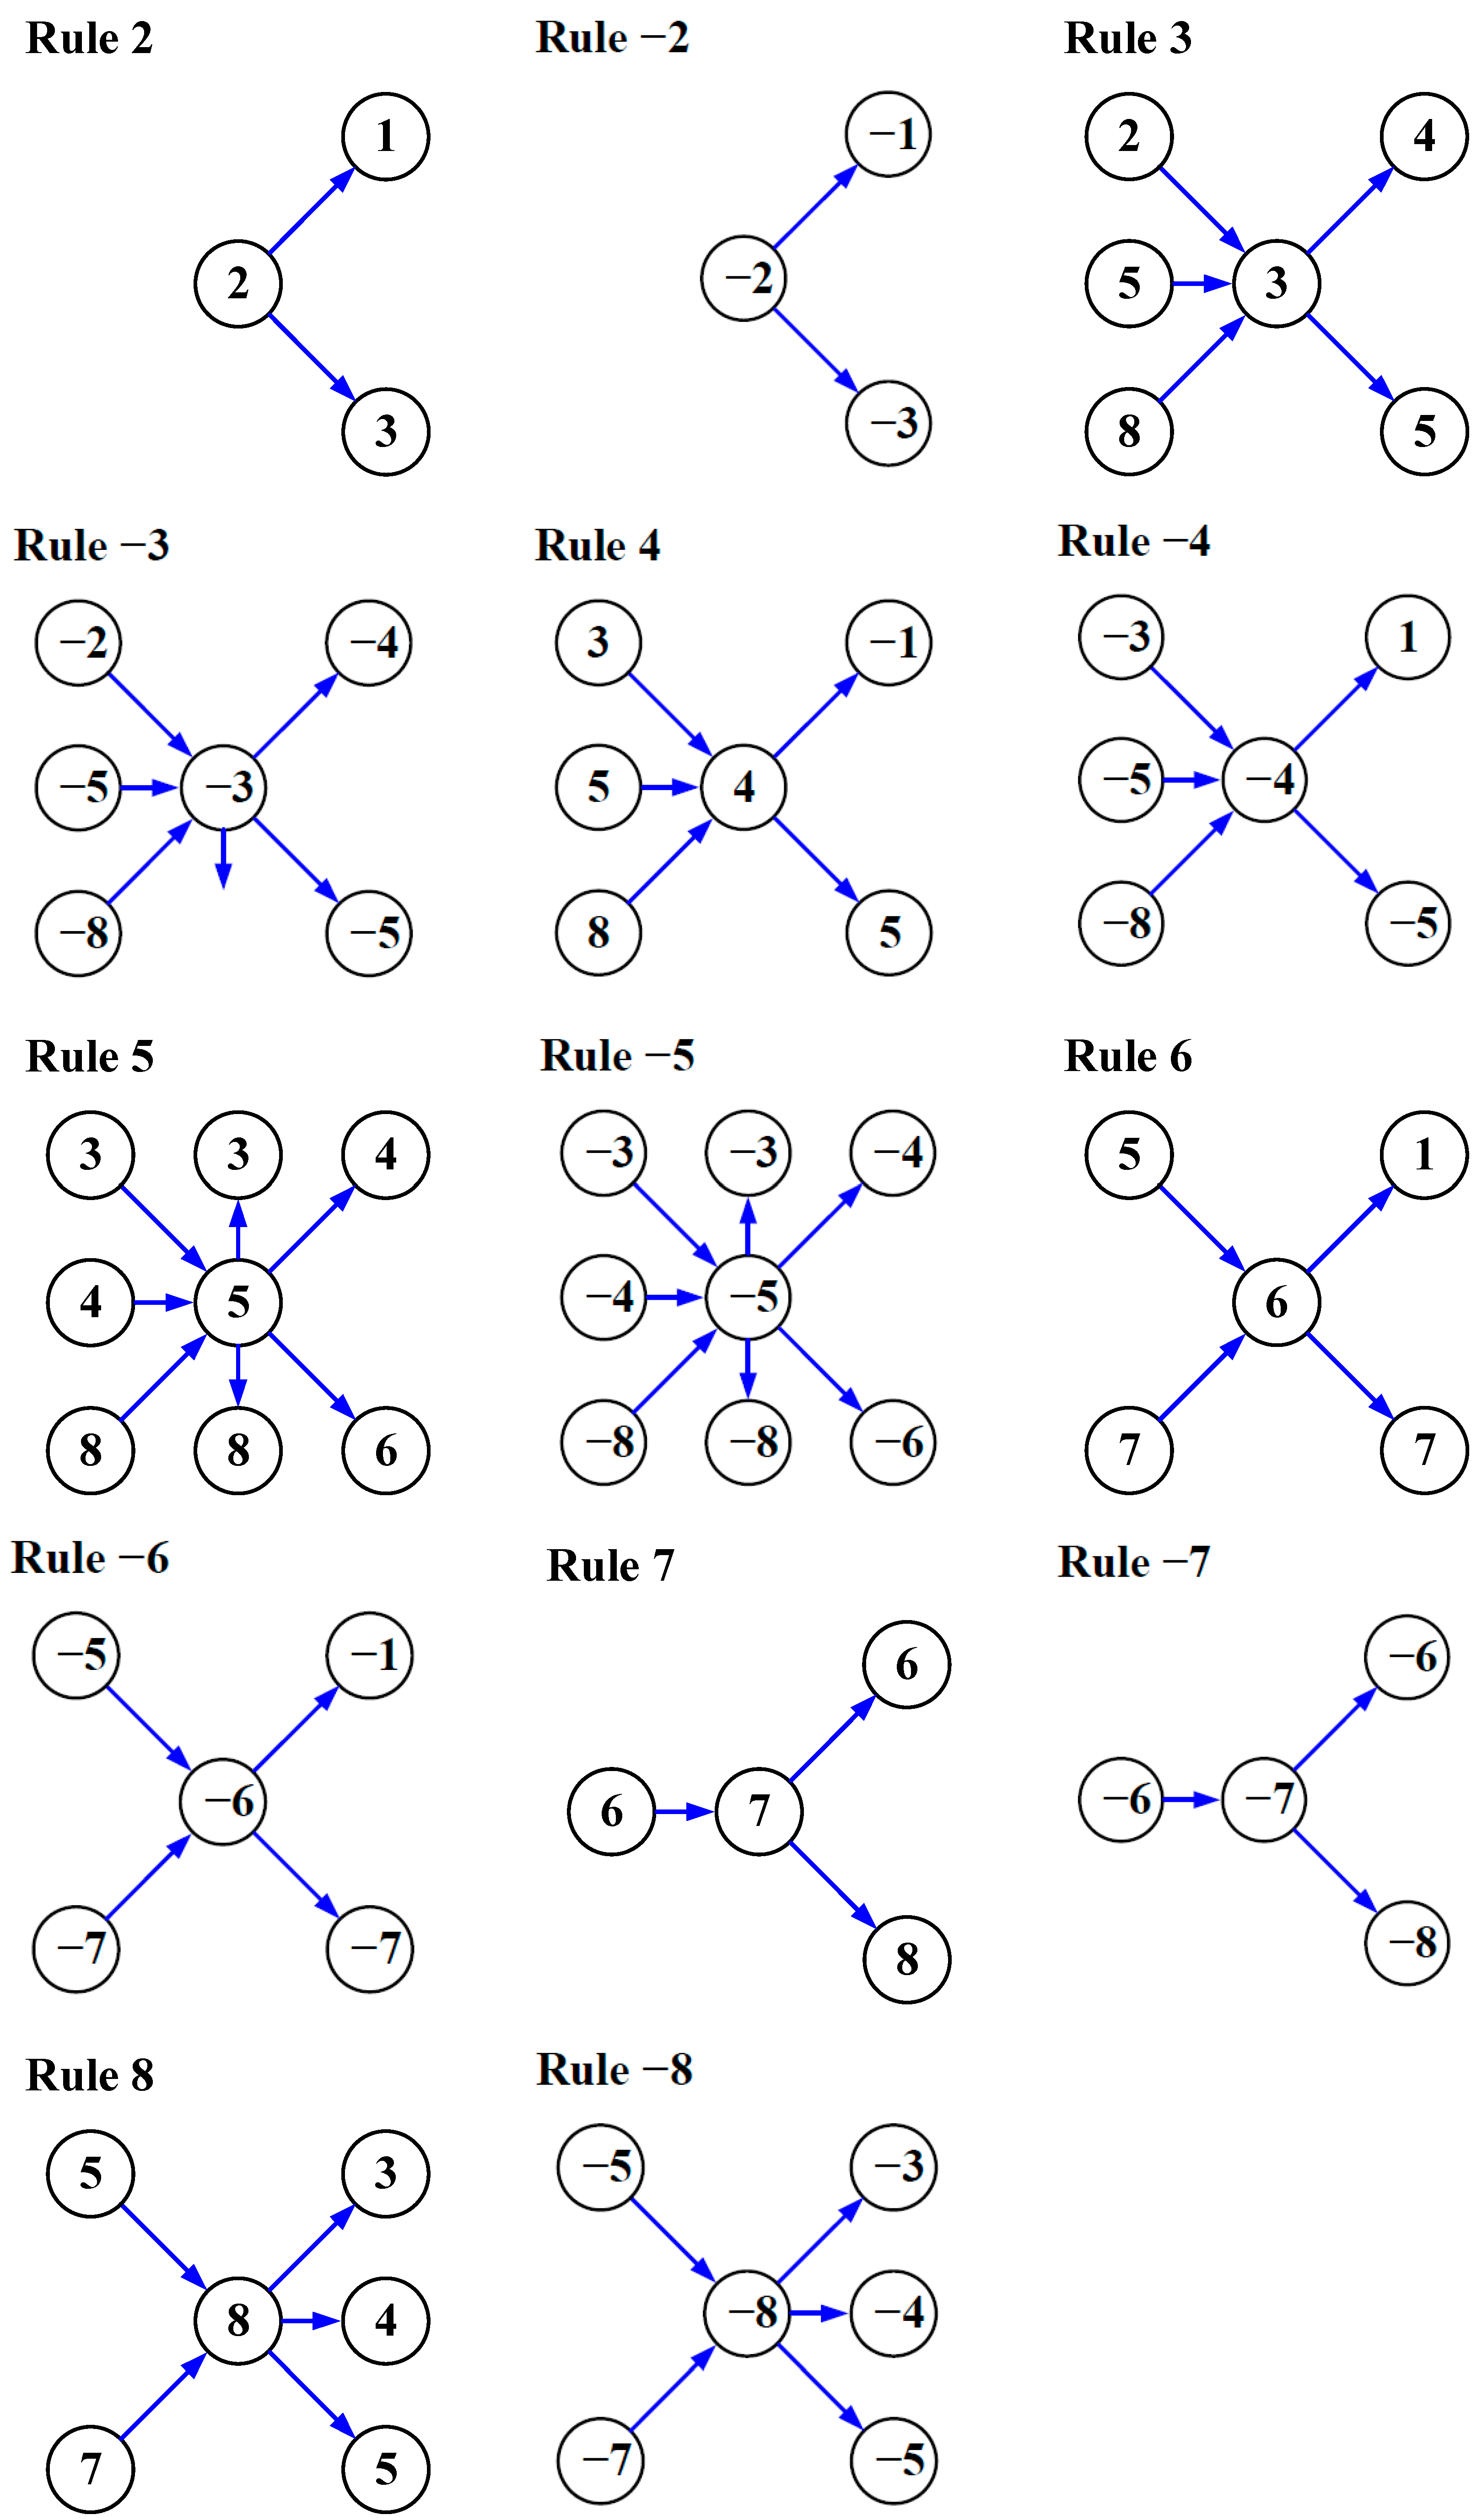
4. Hysteresis Model Considering Cyclic Degradation

The formulation of hysteresis relationships for structural members typically relies on two established model families: smooth curve-based and piecewise linear (polygonal) representations [43,44,45]. While smooth curve models offer a potentially closer approximation to actual structural hysteresis, they impose significant computational demands due to the continuous requirement for updating the tangent stiffness during incremental analysis. Furthermore, accurately capturing complex hysteretic phenomena, such as pronounced pinching or flag-shaped behavior, often necessitates highly intricate mathematical expressions within such frameworks.
Piecewise linear models provide exceptional versatility, theoretically capable of accommodating virtually any form of hysteretic characterization, including the combined effects of strength degradation, stiffness degradation, and pinching critical to flexure-shear critical column response. However, the inherent nature of linear segments connected at discrete points introduces discontinuous derivative changes at the transition vertices. This discontinuity necessitates careful implementation within numerical integration schemes to ensure algorithmic stability and accurate energy dissipation tracking, particularly when modeling severe degradation paths.
Given the complexity inherent in simultaneously capturing strength decay, stiffness degradation, and pinching effects of flexure-shear critical columns, the piecewise linear approach offers a more practical and adaptable foundation. Its inherent ability to distinctly define different stiffness regions and degradation mechanisms makes it ideally suited for the targeted development of a dedicated hysteresis model that efficiently addresses the coupled degradation phenomena observed in flexure-shear critical RC columns.
Figure 15 depicts the proposed hysteresis model for flexure-shear critical columns. It should be noted that Figure 15a illustrates the hysteretic rules applicable to large amplitude cycles, while Figure 15b represents the hysteretic rules governing small amplitude cycles. Within this model, positive values signify the hysteretic rules governing the positive loading, unloading, and reloading path, while negative values signify the hysteretic rules corresponding to the negative loading, unloading, and reloading path. To facilitate implementation, Table 2 details the hysteretic rules governing the positive loading direction (used as an example case), including their transition criteria and stiffness parameters. Each branch results in other branches, and the map of branch connectivity for the proposed hysteresis model is summarized in Figure 16. It should be noted that since positive and negative hysteresis rules differ merely in loading direction while maintaining identical mapping relationships, the hysteresis rules of the proposed model can be condensed into nine in total.
The proposed hysteretic model advances conventional frameworks [20,23,24,25,26,27,28] by resolving two critical limitations: (1) direction-sensitive strength degradation is achieved through weighted energy contributions (Equation (5)), overcoming the scalar energy summation approach that ignores asymmetric dissipation effects; (2) cycle-dependent degradation in flexural-shear critical columns is quantified via energy-based strength decay and path-governed pinching laws, accurately replicating low-cycle fatigue mechanisms.

5. Verification and Application Extension

5.1. Verification of the Proposed Model

To validate the effectiveness of the proposed hysteresis model for flexure-shear critical circular columns, the predicted force-displacement responses are compared against experimental results in Figure 17. As evidenced by the figure, the model predictions exhibit close agreement with the experimental results across the entire loading history.
This demonstrates that the developed model accurately captures the key behavioral characteristics of such columns, including strength degradation, stiffness deterioration, and the distinctive pinching effect observed during cyclic loading. Consequently, the comparison provides strong confirmation of the model’s validity and its capability to faithfully represent the complex hysteretic response of flexure-shear critical RC circular columns.

5.2. Application Extension

The capacity for hysteresis models to capture varied cyclic behavior patterns enhances their applicability across diverse scenarios. To evaluate this adaptability specifically within the proposed model for flexure-shear critical columns, its response characteristics were explored using key parameters. This exploration focused on simulating fundamental phenomena: strength degradation, stiffness degradation, and pinching effect.
Figure 18 presents the outcomes demonstrating this adaptability. Model predictions clearly illustrate how modifying specific parameters alters the hysteretic response. Figure 18a depicts the simulated hysteresis loop incorporating the full complexity of strength degradation, stiffness degradation, and pinching effect. Figure 18b illustrates the response when parameters a = 0 and b = 0 (see Equation (5)) suppress strength degradation entirely. Similarly, Figure 18c portrays the behavior achieved by setting parameters η = 0 (see Equation (8)), κ = –1 (see Equation (11)), and α = 0 (see Equation (7)) to simultaneously deactivate both pinching effect and unloading stiffness degradation.
Collectively, these results establish the proposed model’s inherent versatility. The controlled modification of a targeted set of parameters successfully reproduced distinct cyclic behaviors, ranging from fully degraded responses to simpler loops lacking specific degradation features. Consequently, this exercise demonstrates that the proposed model framework fundamentally possesses the flexibility necessary to capture the hysteretic characteristics exhibited by different structural conditions or elements. Such parametric adaptability confirms the model’s broad applicability.

5.3. Limitations and Further Research Directions

While the developed hysteretic model for flexure-shear critical columns demonstrates considerable application, its generalizability is still constrained by dual-dimensional limitations. These manifest concretely in the following:
(1) Sectional geometry.
Crucially, the findings and the developed hysteretic model are exclusively applicable to circular RC columns. This constraint stems from the potential divergence in performance degradation mechanisms across column section typologies. Specifically, circular columns leverage their geometric axisymmetry to achieve near-uniform confinement under uniaxial loading, resulting in full and stable hysteretic loops with consistent energy dissipation. Conversely, rectangular columns suffer from acute confinement inadequacy at corners accompanied by abrupt transitions in effective confined zones, resulting in abrupt deterioration. Therefore, extending and adapting flexure-shear hysteretic models specifically for rectangular/square cross-sections represents a critical direction for subsequent research.
(2) Parametric domain boundaries.
The applicability of the proposed hysteretic model is confined to RC columns with aspect ratios 1.5 ≤ λ ≤ 2.58, longitudinal reinforcement ratios 0.5% ≤ LRR ≤ 5.2%, axial load ratios 0 ≤ n ≤ 0.2, and flexure-shear failure modes, where prediction accuracy is hierarchically governed by parameter proximity to data-dense clusters—specifically: (1) core regions (e.g., λ ≈ 2, LRR ≈ 3.2%) demonstrate high confidence aligning with high-data-density zones; (2) domain peripheries near parametric boundaries (e.g., λ within [1.5, 2.58] but remote from 2.0) require cautious implementation due to sparse experimental support; (3) extrapolatory predictions beyond stated ranges may be considered unreliable without independent experimental verification. Consequently, deliberate expansion of the experimental database for edge-case parametric regimes (e.g., relatively high axial loads n > 0.2) constitutes an essential pathway to generalize the model’s generalizability.

6. Conclusions

This study developed a novel hysteresis model for RC circular columns susceptible to flexure-shear failure, utilizing a comprehensive set of experimental results extracted from the PEER structural performance database. The key findings are summarized as follows:
(1) Strength degradation mechanism: significant strength degradation in flexure-shear critical columns occurs predominantly during initial loading cycles under constant displacement amplitude, stabilizing nonlinearly in subsequent cycles.
(2) Stiffness degradation behavior: unlike strength degradation, unloading stiffness at fixed displacement levels demonstrates minimal cycle-dependence, being primarily governed by displacement amplitude.
(3) Evolution of pinching effects: progressive pinching behavior emerges with cyclic advancement, directly correlating with diminished energy dissipation capacity. This highlights the necessity of path-dependent pinching laws to capture low-cycle fatigue effects in seismic simulations.
(4) Directional energy sensitivity: a critical innovation in the developed strength degradation model is its explicit consideration of the differing contributions of positive and negative hysteretic energy dissipation. This feature is vital for realistically simulating asymmetric loading patterns typically encountered during random seismic excitation.
(5) Integrated model performance: the unified framework successfully captures coupled degradation mechanisms (strength degradation, stiffness degradation, pinching) under cyclic loading. Its parametric adaptability demonstrates significant versatility beyond flexure-shear columns, suggesting broad applicability to diverse structural systems.
These findings collectively advance seismic performance prediction by resolving two critical limitations in existing models:
(1) The assumption of equal degradation contributions from positive and negative hysteretic energy (in conventional scalar energy summation approaches), which fails to capture directionally sensitive strength deterioration under asymmetric loading.
(2) Inability to concurrently model coupled cyclic-induced deterioration mechanisms—particularly the interdependence of strength degradation, stiffness degradation, and pinching effects in flexure-shear critical columns—while this study integrates all three through unified energy-path laws.
The validated model provides engineers with a physically rigorous framework for simulating critical deterioration mechanisms under seismic loads, significantly improving prediction accuracy for flexure-shear failure modes compared to conventional approaches.

Author Contributions

Conceptualization, Z.F., Q.Z. and J.G.; methodology, all authors; data curation, J.W., H.H. and W.L.; software, Z.F. and J.W.; formal analysis, Z.F. and H.H.; investigation, Z.F., Q.Z. and J.W.; validation, Z.F. and Y.Z.; writing—original draft, Z.F.; writing—review and editing, all authors; visualization, Z.F. and Q.Z. All authors have read and agreed to the published version of the manuscript.

Funding

This research was funded by the Natural Science Basic Research Program of Shaanxi Province (No: 2024JC-YBQN-0434), the Natural Science Foundation of Shaanxi Provincial Department of Education (No: 23JK0474), the Shaanxi Provincial Science Foundation for Outstanding Young Scholars (No. 2023-JC-JQ-47), the Shaanxi Province International Science and Technology Cooperation Program Project (No. 2024 GH-ZDXM-18), the Shaanxi University Youth Innovation Team Construction Project (2023), the Scientific Research Project of Young Innovation Team of Shaanxi Provincial Department of Education (24JP076), Xi’an Science and Technology Plan Project (No. 23GXFW0035) and the National Natural Science Foundation of China (Nos. 51978125, 51978060).

Data Availability Statement

The original contributions presented in the study are included in the article. Further inquiries can be directed at the corresponding author.

Conflicts of Interest

Author Jiying Wang was employed by Liaoning Provincial Transportation Planning and Design Institute Co., Ltd. Authors Weiqi Liang and Yingjie Zhou were employed by China Construction Eight Engineering Division Co., Ltd. The remaining authors declare that the research was conducted in the absence of any commercial or financial relationships that could be construed as a potential conflict of interest.

References

  1. Yoshikawa, H.; Miyagi, T. Ductility and failure modes of singly reinforced concrete columns. In Modeling of Inelastic Behavior of RC Structures Under Seismic Loads; American Society of Civil Engineers: Reston, VA, USA, 2001; pp. 35–368. [Google Scholar]
  2. Ma, Y.; Gong, J. Seismic failure modes and deformation capacity of reinforced concrete columns under cyclic loads. Period. Polytech. Civ. Eng. 2018, 62, 80–91. [Google Scholar]
  3. Zhang, Q.; Chen, M.; Li, W.; Gu, X.; Gong, J. Seismic performance and damage properties of flexure–shear critical RC columns with various loading cycles. Bull. Earthq. Eng. 2023, 21, 5083–5113. [Google Scholar] [CrossRef]
  4. Yan, H.; Peng, J.; Zhou, S.; Qin, Y.; Kang, S.; Chen, Y. Behaviour of reinforced ultra-high performance concrete columns with medium shear span ratios under reversed cyclic loading. Eng. Fail. Anal. 2025, 179, 109769. [Google Scholar] [CrossRef]
  5. Hu, B.; Wang, X.; Zhou, Y.; Huang, X.; Zhu, Z. Seismic performance of shear-critical RC columns strengthened by multiple composites considering shifted failure zone. Case Stud. Constr. Mater. 2024, 20, e02971. [Google Scholar] [CrossRef]
  6. Gurbuz, T.; Ilki, A.; Thambiratnam, D.P.; Perera, N. Low-elevation impact tests of axially loaded reinforced concrete columns. ACI Struct. J. 2019, 116, 118–128. [Google Scholar] [CrossRef]
  7. Jeon, J.S.; Lowes, L.N.; DesRoches, R.; Brilakis, I. Fragility curves for non-ductile reinforced concrete frames that exhibit different component response mechanisms. Eng. Struct. 2015, 85, 127–143. [Google Scholar] [CrossRef]
  8. Xu, S.; Zhang, J. Hysteretic shear–flexure interaction model of reinforced concrete columns for seismic response assessment of bridges. Earthq. Eng. Struct. Dyn. 2011, 40, 315–337. [Google Scholar] [CrossRef]
  9. Munro, I.; Park, R.; Priestley, M.J.N. Seismic Behaviour of Reinforced Concrete Bridge Piers; Department of Civil Engineering, University of Canterbury: Christchurch, New Zealand, 1976; pp. 76–79. [Google Scholar]
  10. Siryo, K.K. A Seismic Analysis of Building Structural Members: A List of Experimental Results on Deformation Ability of Reinforced Concrete Columns Under Large Deflection (No. 3); Building Research Institute, Ministry of Construction: Tsukuba, Japan, 1978. [Google Scholar]
  11. Ghee, A.B.; Priestley, M.J.N.; Paulay, T. Seismic Shear Strength of Circular Reinforced Concrete Columns. ACI Struct. J. 1985, 86, 45–59. [Google Scholar]
  12. Ma, F.; Zhang, H.; Bockstedte, A.; Foliente, G.C.; Paevere, P. Parameter analysis of the differential model of hysteresis. J. Appl. Mech. 2004, 71, 342–349. [Google Scholar] [CrossRef]
  13. Cai, G.; Sun, Y.; Takeuchi, T.; Takeuchi, T.; Zhang, J. Proposal of a complete seismic shear strength model for circular concrete columns. Eng. Struct. 2015, 100, 399–409. [Google Scholar] [CrossRef]
  14. Azadi Kakavand, M.R.; Allahvirdizadeh, R. Enhanced empirical models for predicting the drift capacity of less ductile RC columns with flexural, shear, or axial failure modes. Front. Struct. Civ. Eng. 2019, 13, 1251–1270. [Google Scholar] [CrossRef]
  15. Ang, B.G. Seismic Shear Strength of Circular Bridge Piers. Ph.D. Thesis, University of Canterbury, Christchurch, New Zealand, 1985. [Google Scholar]
  16. Setzler, E.J.; Sezen, H. Model for the lateral behavior of reinforced concrete columns including shear deformations. Earthq. Spectra 2008, 24, 493–511. [Google Scholar] [CrossRef]
  17. Ma, Y. Study on Failure Modes and Seismic Behavior of Reinforced Concrete Columns. Ph.D. Thesis, Dalian University of Technology, Dalian, China, 2012. [Google Scholar]
  18. Mullapudi, T.R.S.; Ayoub, A. Analysis of reinforced concrete columns subjected to combined axial, flexure, shear, and torsional loads. J. Struct. Eng. 2013, 139, 561–573. [Google Scholar] [CrossRef]
  19. Xu, J.; Feng, D.; Wu, G.; Demitrios, M.C.; Lu, Y. Analytical modeling of corroded RC columns considering flexure-shear interaction for seismic performance assessment. Bull. Earthq. Eng. 2020, 18, 2165–2190. [Google Scholar] [CrossRef]
  20. Ling, Y.; Mogili, S.; Hwang, S. Parameter optimization for Pivot hysteresis model for reinforced concrete columns with different failure modes. Earthq. Eng. Struct. Dyn. 2022, 51, 2167–2187. [Google Scholar] [CrossRef]
  21. Yi, W.; Liu, Y.; Zhou, Y. Behavior of reinforced concrete columns under different loading histories. In Proceedings of the 12th International Symposium on Structural Engineering, Wuhan, China, 16 November 2012. [Google Scholar]
  22. Zhang, Q.; Gong, J.; Ma, Y. Seismic shear strength and deformation of RC columns failed in flexural shear. Mag. Concr. Res. 2014, 66, 234–248. [Google Scholar] [CrossRef]
  23. Zhang, Q.; Chen, M.; Gu, X.; Li, Y.; Li, W.; Gong, J. Low-Cycle Fatigue Properties and Model for Flexure-Shear Critical Reinforced Concrete Columns Considering Cyclic Damage Effects. J. Struct. Eng. 2024, 150, 04024071. [Google Scholar] [CrossRef]
  24. Zhang, Y.; Gong, J.; Zhang, Q.; Han, S. Equivalent damping ratio model of flexure-shear critical RC columns. Eng. Struct. 2017, 130, 52–66. [Google Scholar] [CrossRef]
  25. Zhu, J.; Tang, G. Experimental investigation and load-deformation analysis of reinforced concrete bridge columns under various loading cycles. Structures 2023, 49, 570–582. [Google Scholar] [CrossRef]
  26. Ozcebe, G.; Saatcioglu, M. Hysteretic shear model for reinforced concrete members. J. Struct. Eng. 1989, 115, 132–148. [Google Scholar] [CrossRef]
  27. Takayanagi, T.; Schnobrich, W.C. Computed Behavior of Reinforced Concrete Coupled Shear Walls; Civil Engineering Studies, University of Illinois, Urbana: Champaign, IL, USA, 1976; pp. 60–97. [Google Scholar]
  28. Sezen, H.; Chowdhury, T. Hysteretic model for reinforced concrete columns including the effect of shear and axial load failure. J. Struct. Eng. 2009, 135, 139–146. [Google Scholar] [CrossRef]
  29. Lee, D.H.; Elnashai, A.S. Seismic analysis of RC bridge columns with flexure-shear interaction. J. Struct. Eng. 2001, 127, 546–553. [Google Scholar] [CrossRef]
  30. Zhang, Y.; Han, S. Hysteretic Model for flexure-shear critical reinforced concrete columns. J. Earthq. Eng. 2018, 22, 1639–1661. [Google Scholar] [CrossRef]
  31. Sae-Long, W.; Limkatanyu, S.; Hansapinyo, C.; Imjai, T.; Kwon, M. Forced-based shear-flexure-interaction frame element for nonlinear analysis of non-ductile reinforced concrete columns. J. Appl. Comput. Mech. 2020, 6, 1151–1167. [Google Scholar]
  32. Sae-Long, W.; Limkatanyu, S.; Panedpojaman, P.; Prachasaree, W.; Damrongwiriyanupap, N.; Kwon, M.; Hansapinyo, C. Nonlinear Winkler-based frame element with inclusion of shear-flexure interaction effect for analysis of non-ductile RC members on foundation. J. Appl. Comput. Mech. 2021, 7, 148–164. [Google Scholar]
  33. Limkatanyu, S.; Sae-Long, W.; Damrongwiriyanupap, N.; Imjai, T.; Chaimahawan, P.; Sukontasukkul, P. Shear-flexure interaction frame model on Kerr-type foundation for analysis of non-ductile RC members on foundation. J. Appl. Comput. Mech. 2022, 8, 1076–1090. [Google Scholar]
  34. Limkatanyu, S.; Sae-Long, W.; Damrongwiriyanupap, N.; Sukontasukkul, P.; Imjai, T.; Chompoorat, T.; Hansapinyo, C. Nonlinear shear-flexure-interaction RC frame element on Winkler-Pasternak foundation. Geomech. Eng. 2023, 32, 69–84. [Google Scholar]
  35. Pacific Earthquake Engineering Research Center (PEER) Structural Performance Database. Available online: https://peer.berkeley.edu/spd (accessed on 20 February 2025).
  36. Priestley, M.J.N.; Benzoni, G. Seismic performance of circular columns with low longitudinal reinforcement ratios. ACI Struct. J. 1996, 93, 474–485. [Google Scholar]
  37. Vu, N.D.; Priestley, M.J.N.; Seible, F.; Benzoni, G. Seismic response of well confined circular reinforced concrete columns with low aspect ratios. In Proceedings of the 5th Caltrans Seismic Research Workshop, San Diego, CA, USA, 9–11 June 1998. [Google Scholar]
  38. Hamilton, C.H.; Pardoen, G.C.; Kazanjy, R.P. Experimental Testing of Bridge Columns Subjected to Reversed-Cyclic and Pulse-Type Loading Histories; Technical Report; Department of Civil and Environmental Engineering, University of California: Irvine, CA, USA, 2002. [Google Scholar]
  39. Baber, T.T.; Noori, M.N. Random vibration of degrading, pinching systems. J. Eng. Mech. 1985, 111, 1010–1026. [Google Scholar] [CrossRef]
  40. Erberik, M.A. Fragility-based assessment of typical mid-rise and low-rise RC buildings in Turkey. Eng. Struct. 2008, 30, 1360–1374. [Google Scholar] [CrossRef]
  41. Takeda, T.; Sozen, M.A.; Nielsen, N.N. Reinforced concrete response to simulated earthquakes. J. Struct. Div. 1970, 96, 2557–2573. [Google Scholar] [CrossRef]
  42. Montuori, R.; Nastri, E.; Palese, M.I.; Piluso, V. Comparison among different software for the evaluation of moment-curvature of RC columns. Comput. Concr. 2019, 24, 259–269. [Google Scholar]
  43. An, D.; Qin, Z.; Yang, Y.; Yu, X.; Li, C. Hybrid Compensation Method for Non-Uniform Creep Difference and Hysteresis Nonlinearity of Piezoelectric-Actuated Machine Tools Under S-Shaped Curve Trajectory. Appl. Sci. 2025, 15, 4207. [Google Scholar] [CrossRef]
  44. Lu, Y.; Xiong, F.; Zhong, J. Uniaxial hysteretic spring models for static and dynamic analyses of self-centering rocking shallow foundations. Eng. Struct. 2022, 272, 114995. [Google Scholar] [CrossRef]
  45. Chen, P.; Bai, X.; Qian, L.; Choi, S.B. A new hysteresis model based on force–displacement characteristics of magnetorheological fluid actuators subjected to squeeze mode operation. Smart Mater. Struct. 2017, 26, 06LT01. [Google Scholar] [CrossRef]
Figure 1. Hysteresis curves for RC columns with different failure modes: (a) Flexure failure [9]; (b) Flexure-shear failure [10]; (c) Shear failure [11].
Buildings 15 02445 g001
Figure 2. Distributions of structural parameters for RC flexure-shear critical columns: (a) Axial-load ratio; (b) Aspect ratio; (c) Longitudinal reinforcement ratio; (d) Transverse reinforcement ratio.
Buildings 15 02445 g002
Figure 3. Example of strength degradation for specimen No. 1.
Buildings 15 02445 g003
Figure 4. Strength degradation of flexure-shear critical columns: (a) μ = 1–2; (b) μ = 2–3; (c) μ = 3–4; (d) μ = 4–6.
Buildings 15 02445 g004
Figure 5. Definition of unloading stiffness.
Buildings 15 02445 g005
Figure 6. Degradation patterns of unloading stiffness.
Buildings 15 02445 g006aBuildings 15 02445 g006b
Figure 7. Positive and negative hysteretic energy dissipation.
Buildings 15 02445 g007
Figure 8. Variation in normalized hysteretic energy dissipation with number of cyclic loading.
Buildings 15 02445 g008aBuildings 15 02445 g008b
Figure 9. Relationship between strength degradation ratio (γ), hysteretic energy dissipation (En), and loading cyclic number (N).
Buildings 15 02445 g009aBuildings 15 02445 g009b
Figure 10. Effect of structural parameters on strength degradation ratio: (a) Effect of axial compression ratio; (b) Effect of aspect ratio.
Buildings 15 02445 g010
Figure 11. Scatter plots of experimental results and fitted strength degradation ratios.
Buildings 15 02445 g011
Figure 12. Definition of pinching point.
Buildings 15 02445 g012
Figure 13. Progressive migration of pinching points.
Buildings 15 02445 g013
Figure 14. Graphical representation of the pinching point calculation.
Buildings 15 02445 g014
Figure 15. Hysteresis rules for flexure-shear critical columns: (a) Large amplitude cycles; (b) Small amplitude cycles.
Buildings 15 02445 g015
Figure 16. Map of branch connectivity for the proposed hysteresis model.
Buildings 15 02445 g016aBuildings 15 02445 g016b
Figure 17. Comparison of experimental and model-estimated hysteretic curves.
Buildings 15 02445 g017aBuildings 15 02445 g017b
Figure 18. Extended applications of proposed hysteresis model: (a) Strength degradation, stiffness degradation and pinching; (b) Stiffness degradation and pinching; (c) Only (reloading) stiffness degradation.
Buildings 15 02445 g018
Table 1. Key properties of flexure-shear critical columns.
Test NumberExperimentersColumn
Designation
D
(mm)
H
(mm)
N
(kN)
nλfc
(MPa)
LRR
(%)
TRR
(%)
1Ghee et al. (1985) [11]No. 140080000237.53.20.51
2Ghee et al. (1985) [11]No. 540080000231.13.20.76
3Ghee et al. (1985) [11]No. 84008007210.2228.73.21.02
4Ghee et al. (1985) [11]No. 104008007840.2231.23.21.02
5Ghee et al. (1985) [11]No. 124006003590.11.528.63.21.02
6Ghee et al. (1985) [11]No. 134008004550.1236.23.21.02
7Ghee et al. (1985) [11]No. 1440080000233.73.20.51
8Ghee et al. (1985) [11]No. 1540080000234.81.90.51
9Ghee et al. (1985) [11]No. 1740010004310.12.534.33.20.51
10Ghee et al. (1985) [11]No. 2340080000232.33.20.76
11Ghee et al. (1985) [11]No. 2440080000233.13.20.77
12Priestley et al. (1994) [36]NR1610914.55030.0571.5300.50.28
13Vu et al. (1998) [37]NH44579108500.1481.99355.22.7
14Hamilton (2002) [38]UC15406.41047.8002.5835.41.20.26
Note: D is the diameter; H is the column height; N is the axial load applied to the column; n is the axial-load ratio; λ is the column aspect ratio; fc’ is the cylindrical compressive strength of concrete; LRR is the longitudinal reinforcement ratio; TRR is the transverse reinforcement ratio.
Table 2. Hysteretic rules governing positive loading direction.
RuleStageLoadingUnloading
0ElasticCondition: d > dy
Toward: 1
Stiffness: S(YU)
Condition: Δd < 0
Toward: 0
Stiffness: S(OY)
1Primary curve up to yieldingCondition: Δd > 0
Toward: 1
Stiffness: S(YU)
Condition: Δd < 0
Toward: 2
Stiffness: S(UR)
2Unloading from point U on primary curveCondition: d > Dmax
Toward: 1
Stiffness: S(YU)
Condition: F < 0
Toward: 3
Stiffness: S(RP)
3Reloading toward pinching point PCondition: d < Dp
Toward: 4
Stiffness: S(PY)
Condition: Δd > 0
Toward: 5
Stiffness: S(UR)
4Reloading toward yielding point YCondition: d < –dy
Toward: –1
Stiffness: S(YU)
Condition: Δd > 0
Toward: 5
Stiffness: S(UR)
5Unloading from line RP or PYCondition: [d > Du1 & Du1 > Dp] or [d > Du2 & Du2 < Dp]
Toward: 3 or 4
Stiffness: S(RP) or S(PY)
Condition: F > 0
Toward: 6
Stiffness: S(QPd)
6Loading toward strength degradation point PdCondition: F > Fdmax
Toward: 1
Stiffness: S(YU)
Condition: Δd < 0
Toward: 7
Stiffness: S(UR)
7Unloading from small amplitude cyclesCondition: d > Du1
Toward: 6
Stiffness: S(QPd)
Condition: F < 0
Toward: 8
Stiffness: S(TU1)
8Reloading from small amplitude cyclesCondition: [d < Du1 & Du1 > Dp] or [d < Du2 & du2 < Dp]
Toward: 3 or 4
Stiffness: S(RP) or S(PY)
Condition: Δd > 0
Toward: 5
Stiffness: S(UR)
Note: d represents the instantaneous lateral displacement. F denotes the corresponding restoring force. Δd signifies the increment of lateral displacement, S(AB) designates the slope of line segment AB. Dmax indicates the maximum attained displacement. Du1 and Du2 represent the displacement at the unloading point when unloading commences under Rule 3 and Rule 4, respectively. Dp defines the displacement at the pinching point.
Disclaimer/Publisher’s Note: The statements, opinions and data contained in all publications are solely those of the individual author(s) and contributor(s) and not of MDPI and/or the editor(s). MDPI and/or the editor(s) disclaim responsibility for any injury to people or property resulting from any ideas, methods, instructions or products referred to in the content.

