
Influence of Steel Fiber Content on the Fractal Evolution of Bending Cracks in Alkali-Activated Slag Concrete Beams


Abstract
1. Introduction
2. Experiment
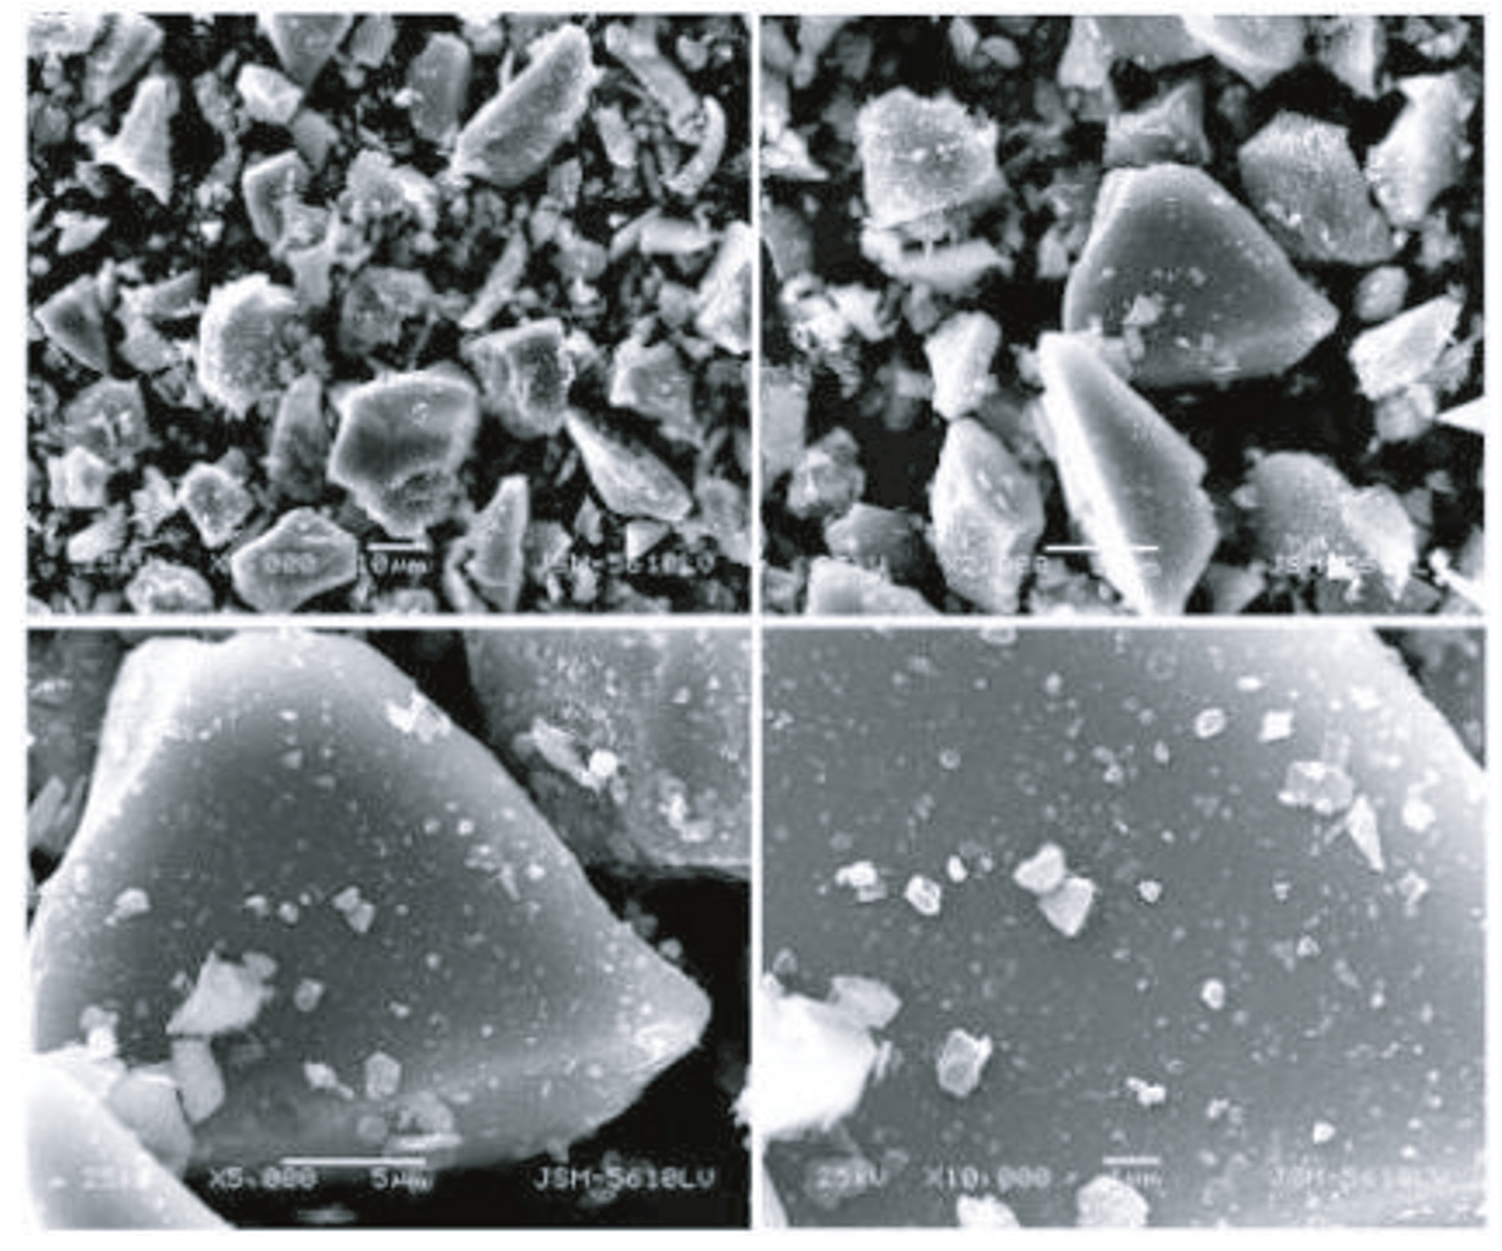
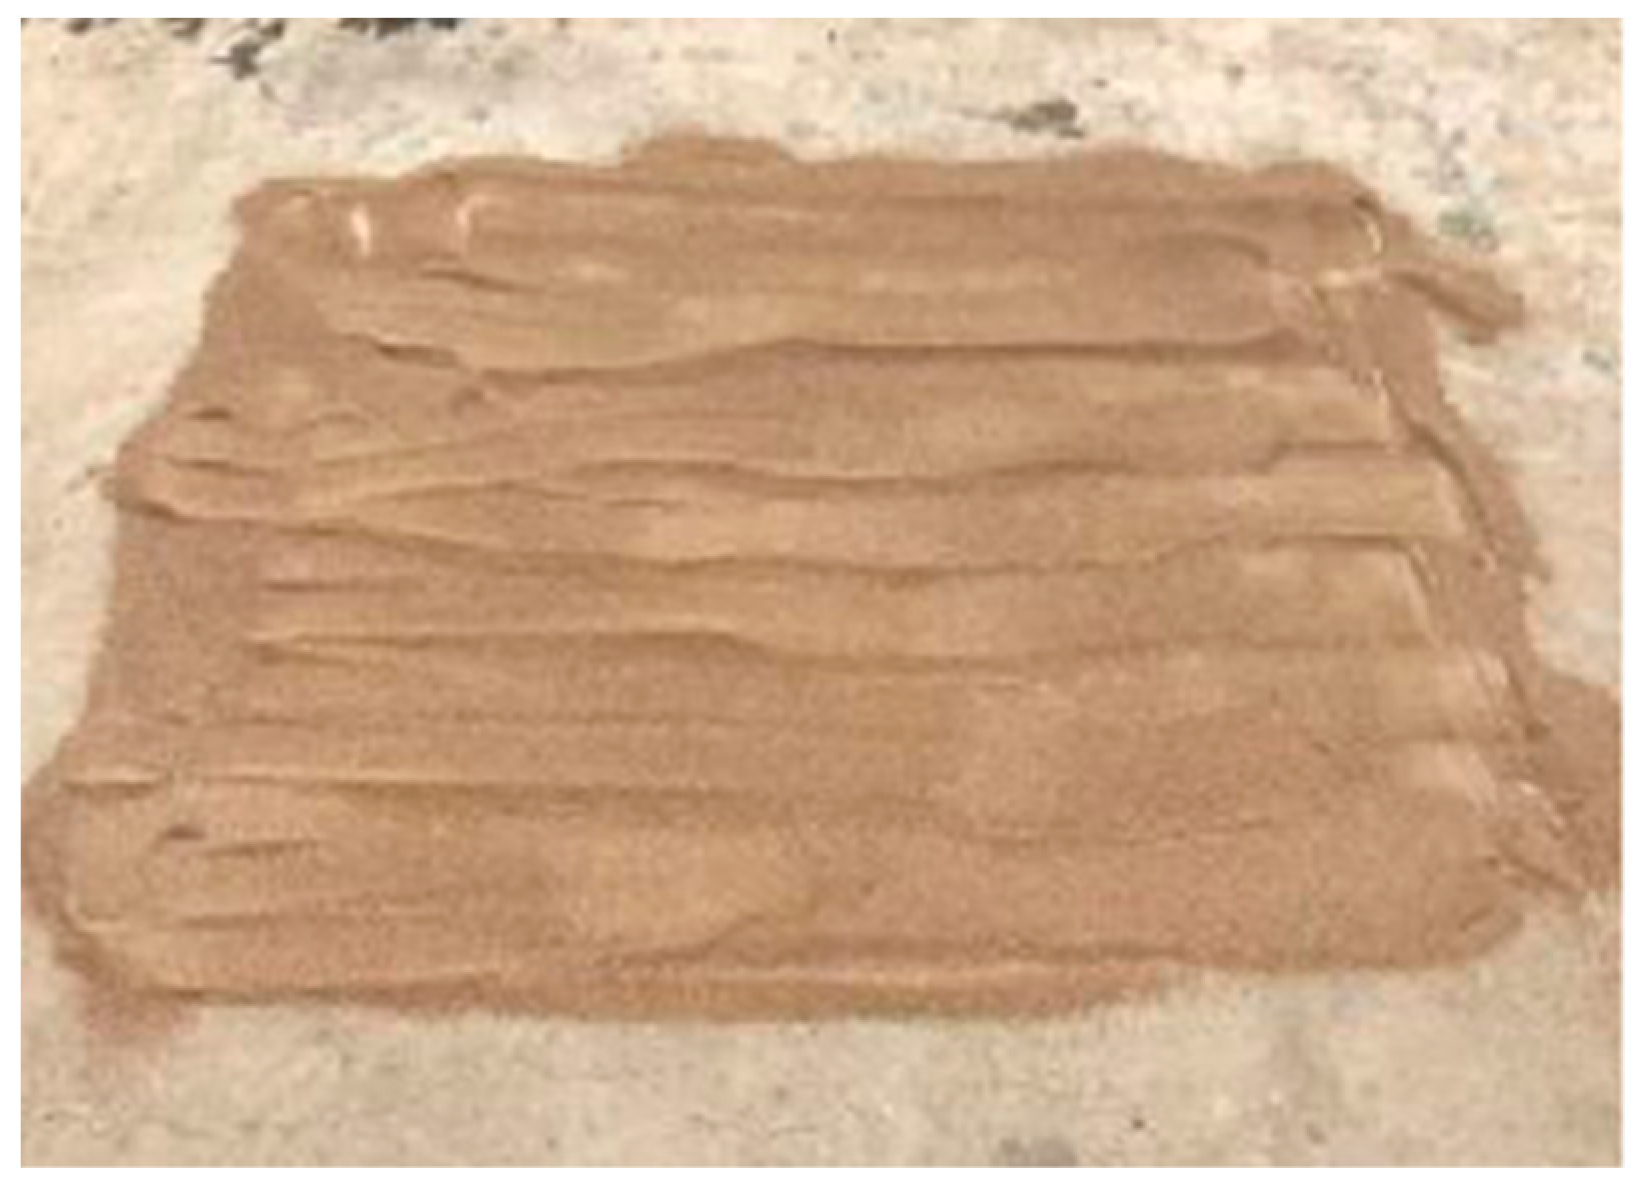
2.1. Materials
2.2. Test Beam Design
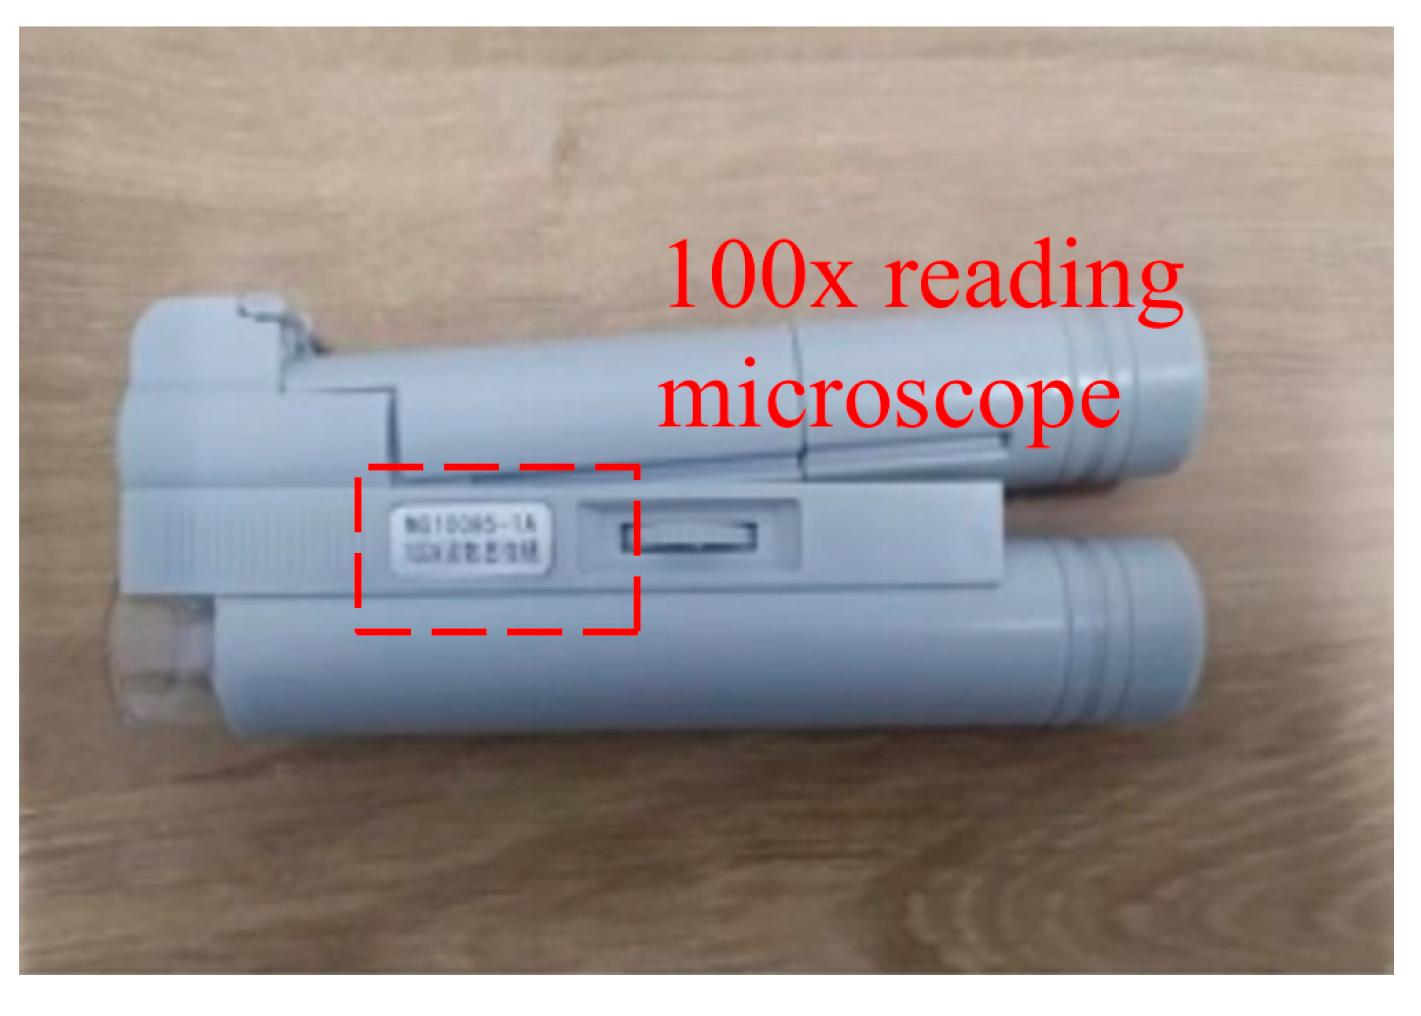
2.3. Loading and Testing
2.4. Analysis of Test Results
2.4.1. Load Result Analysis
2.4.2. Deflection Results and Analysis
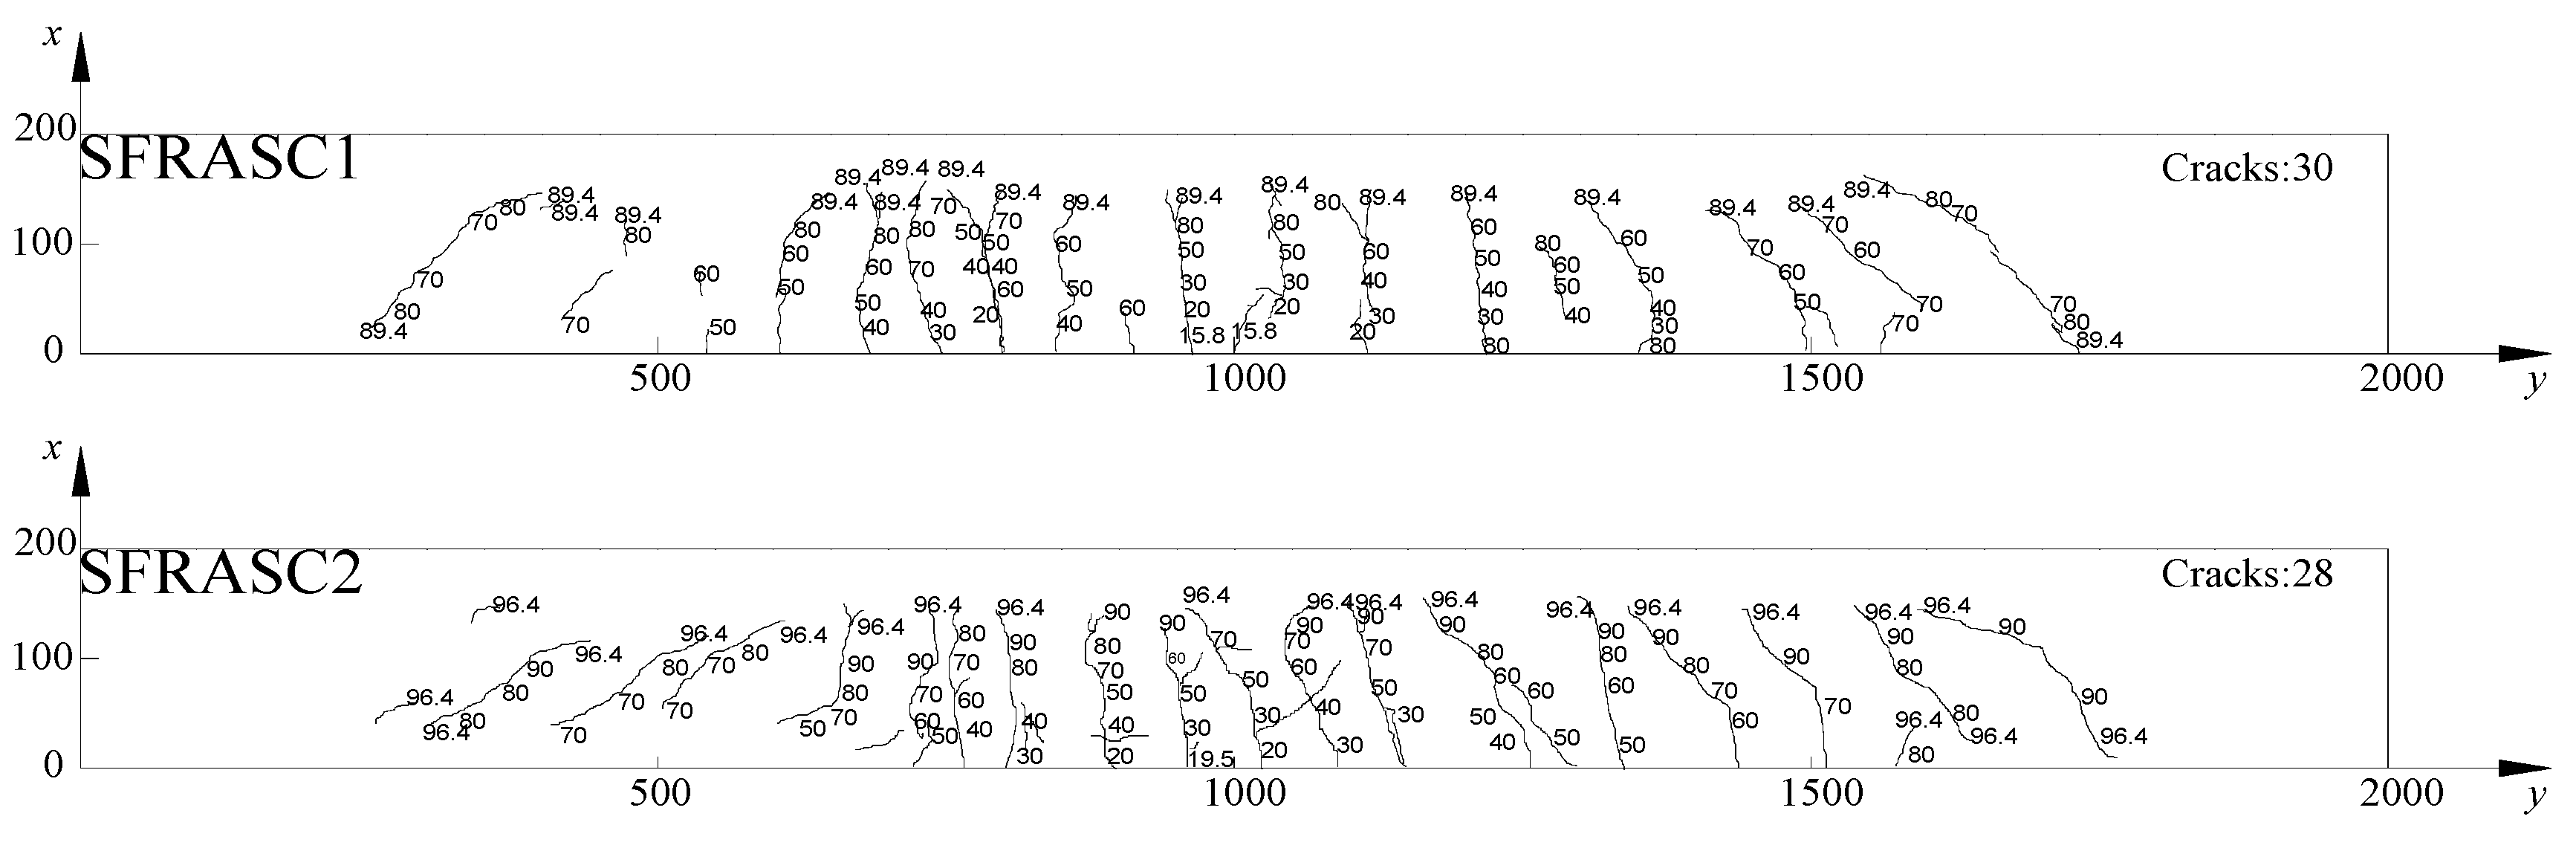
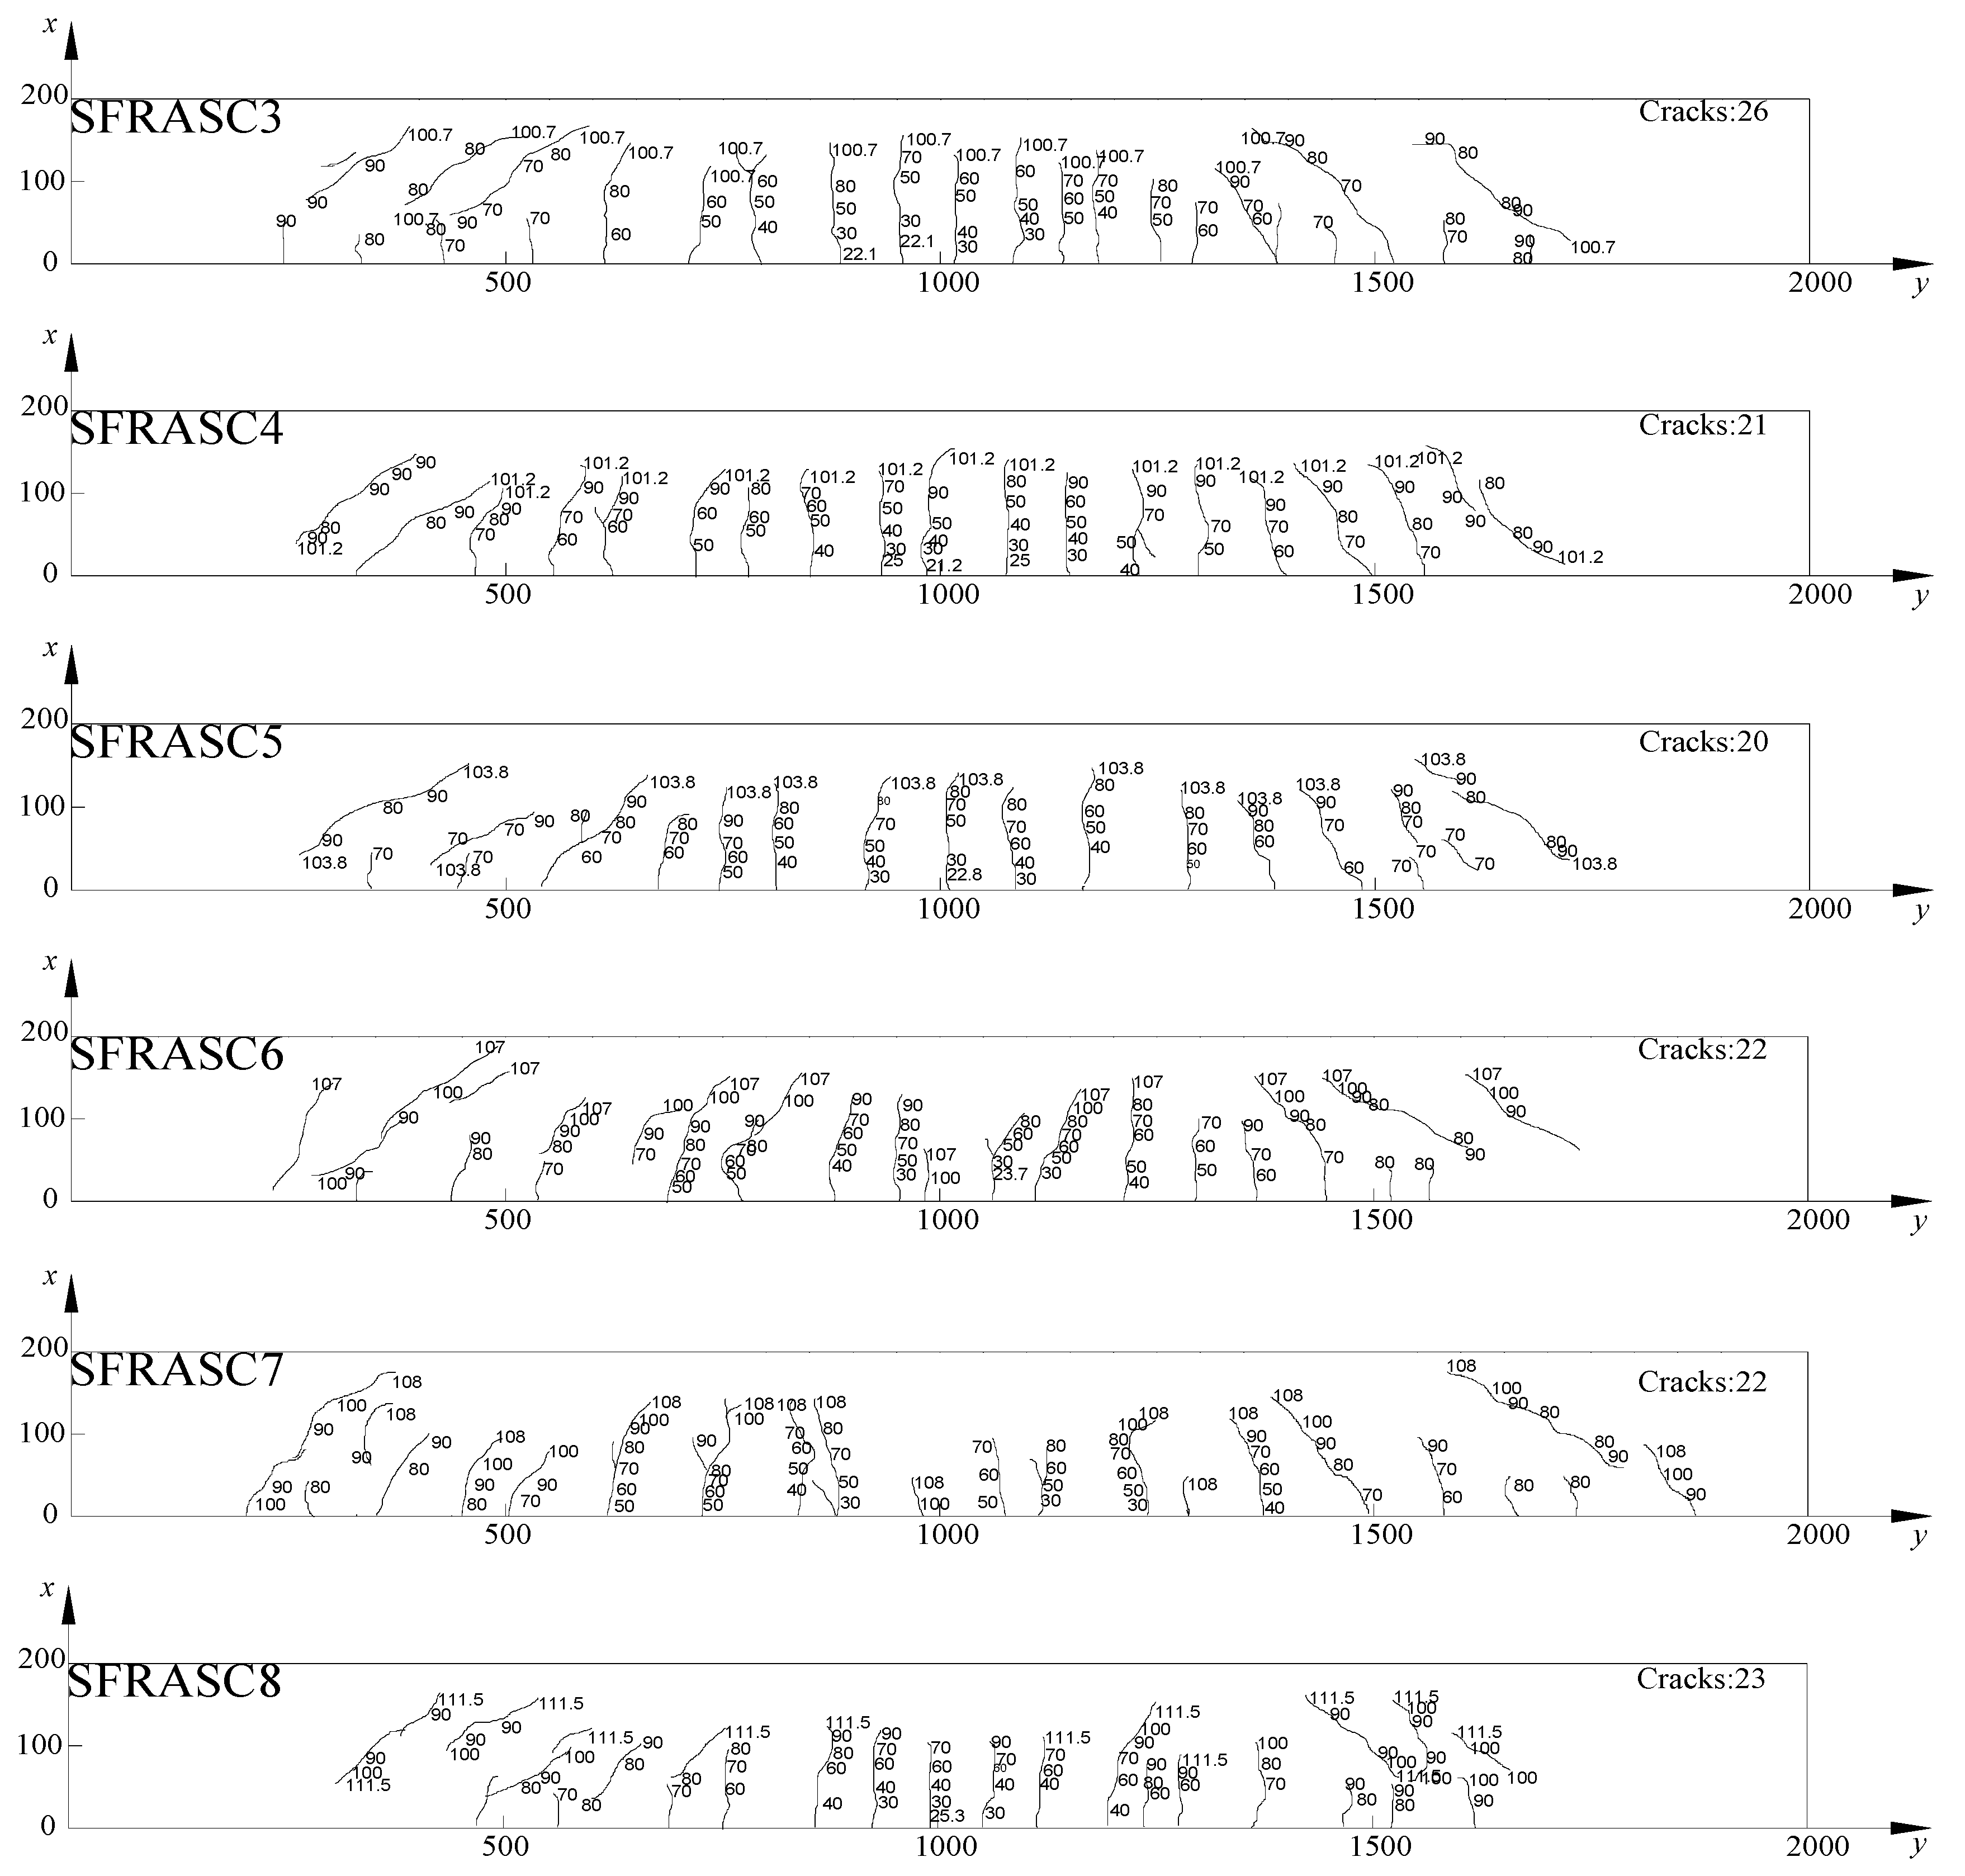
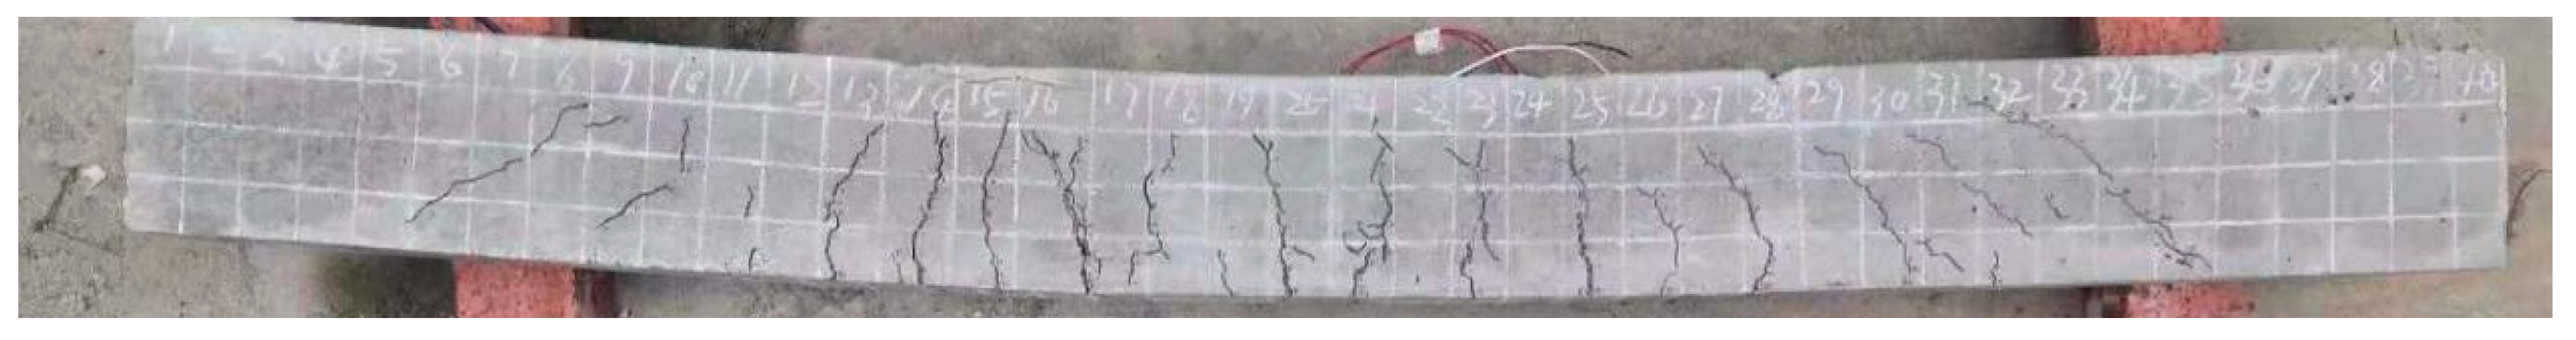
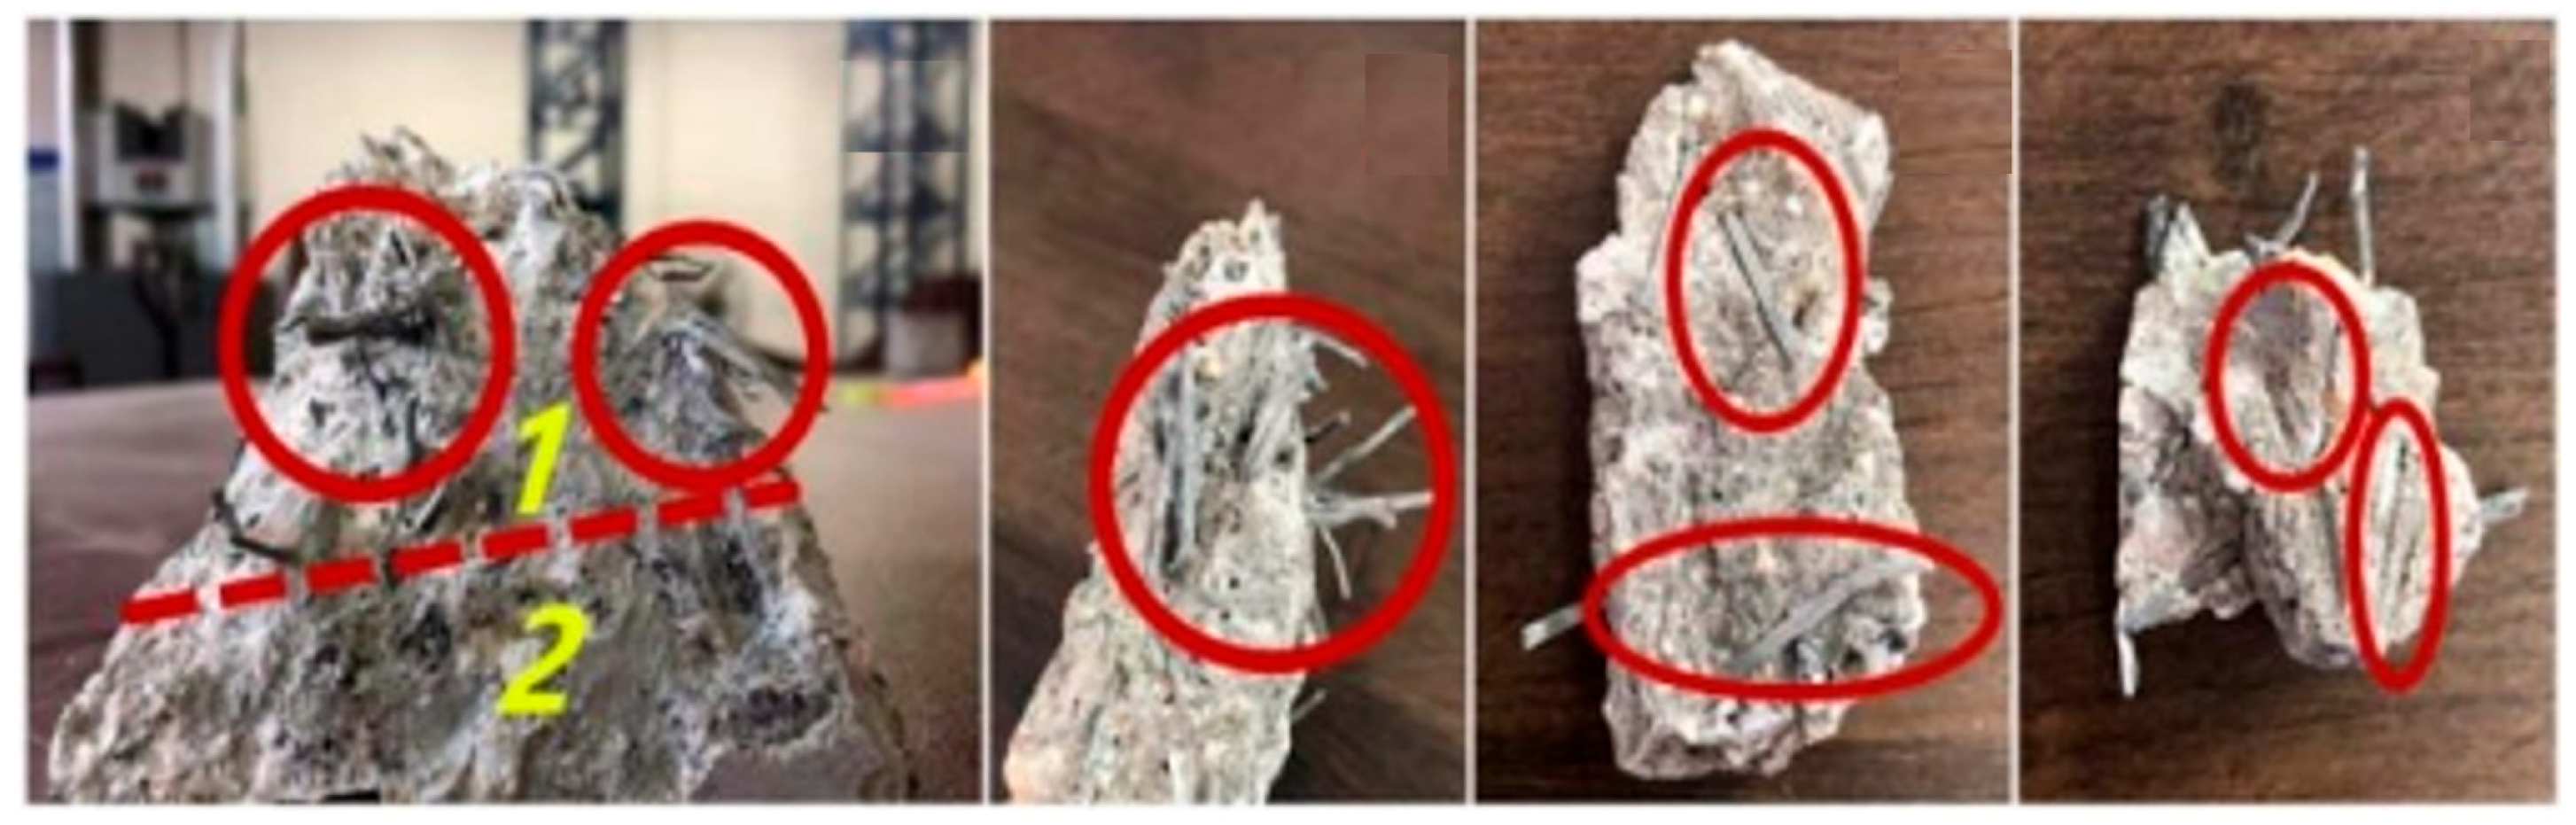
2.4.3. Crack Results and Analysis
3. Quantification and Analysis of Fractal Characteristics
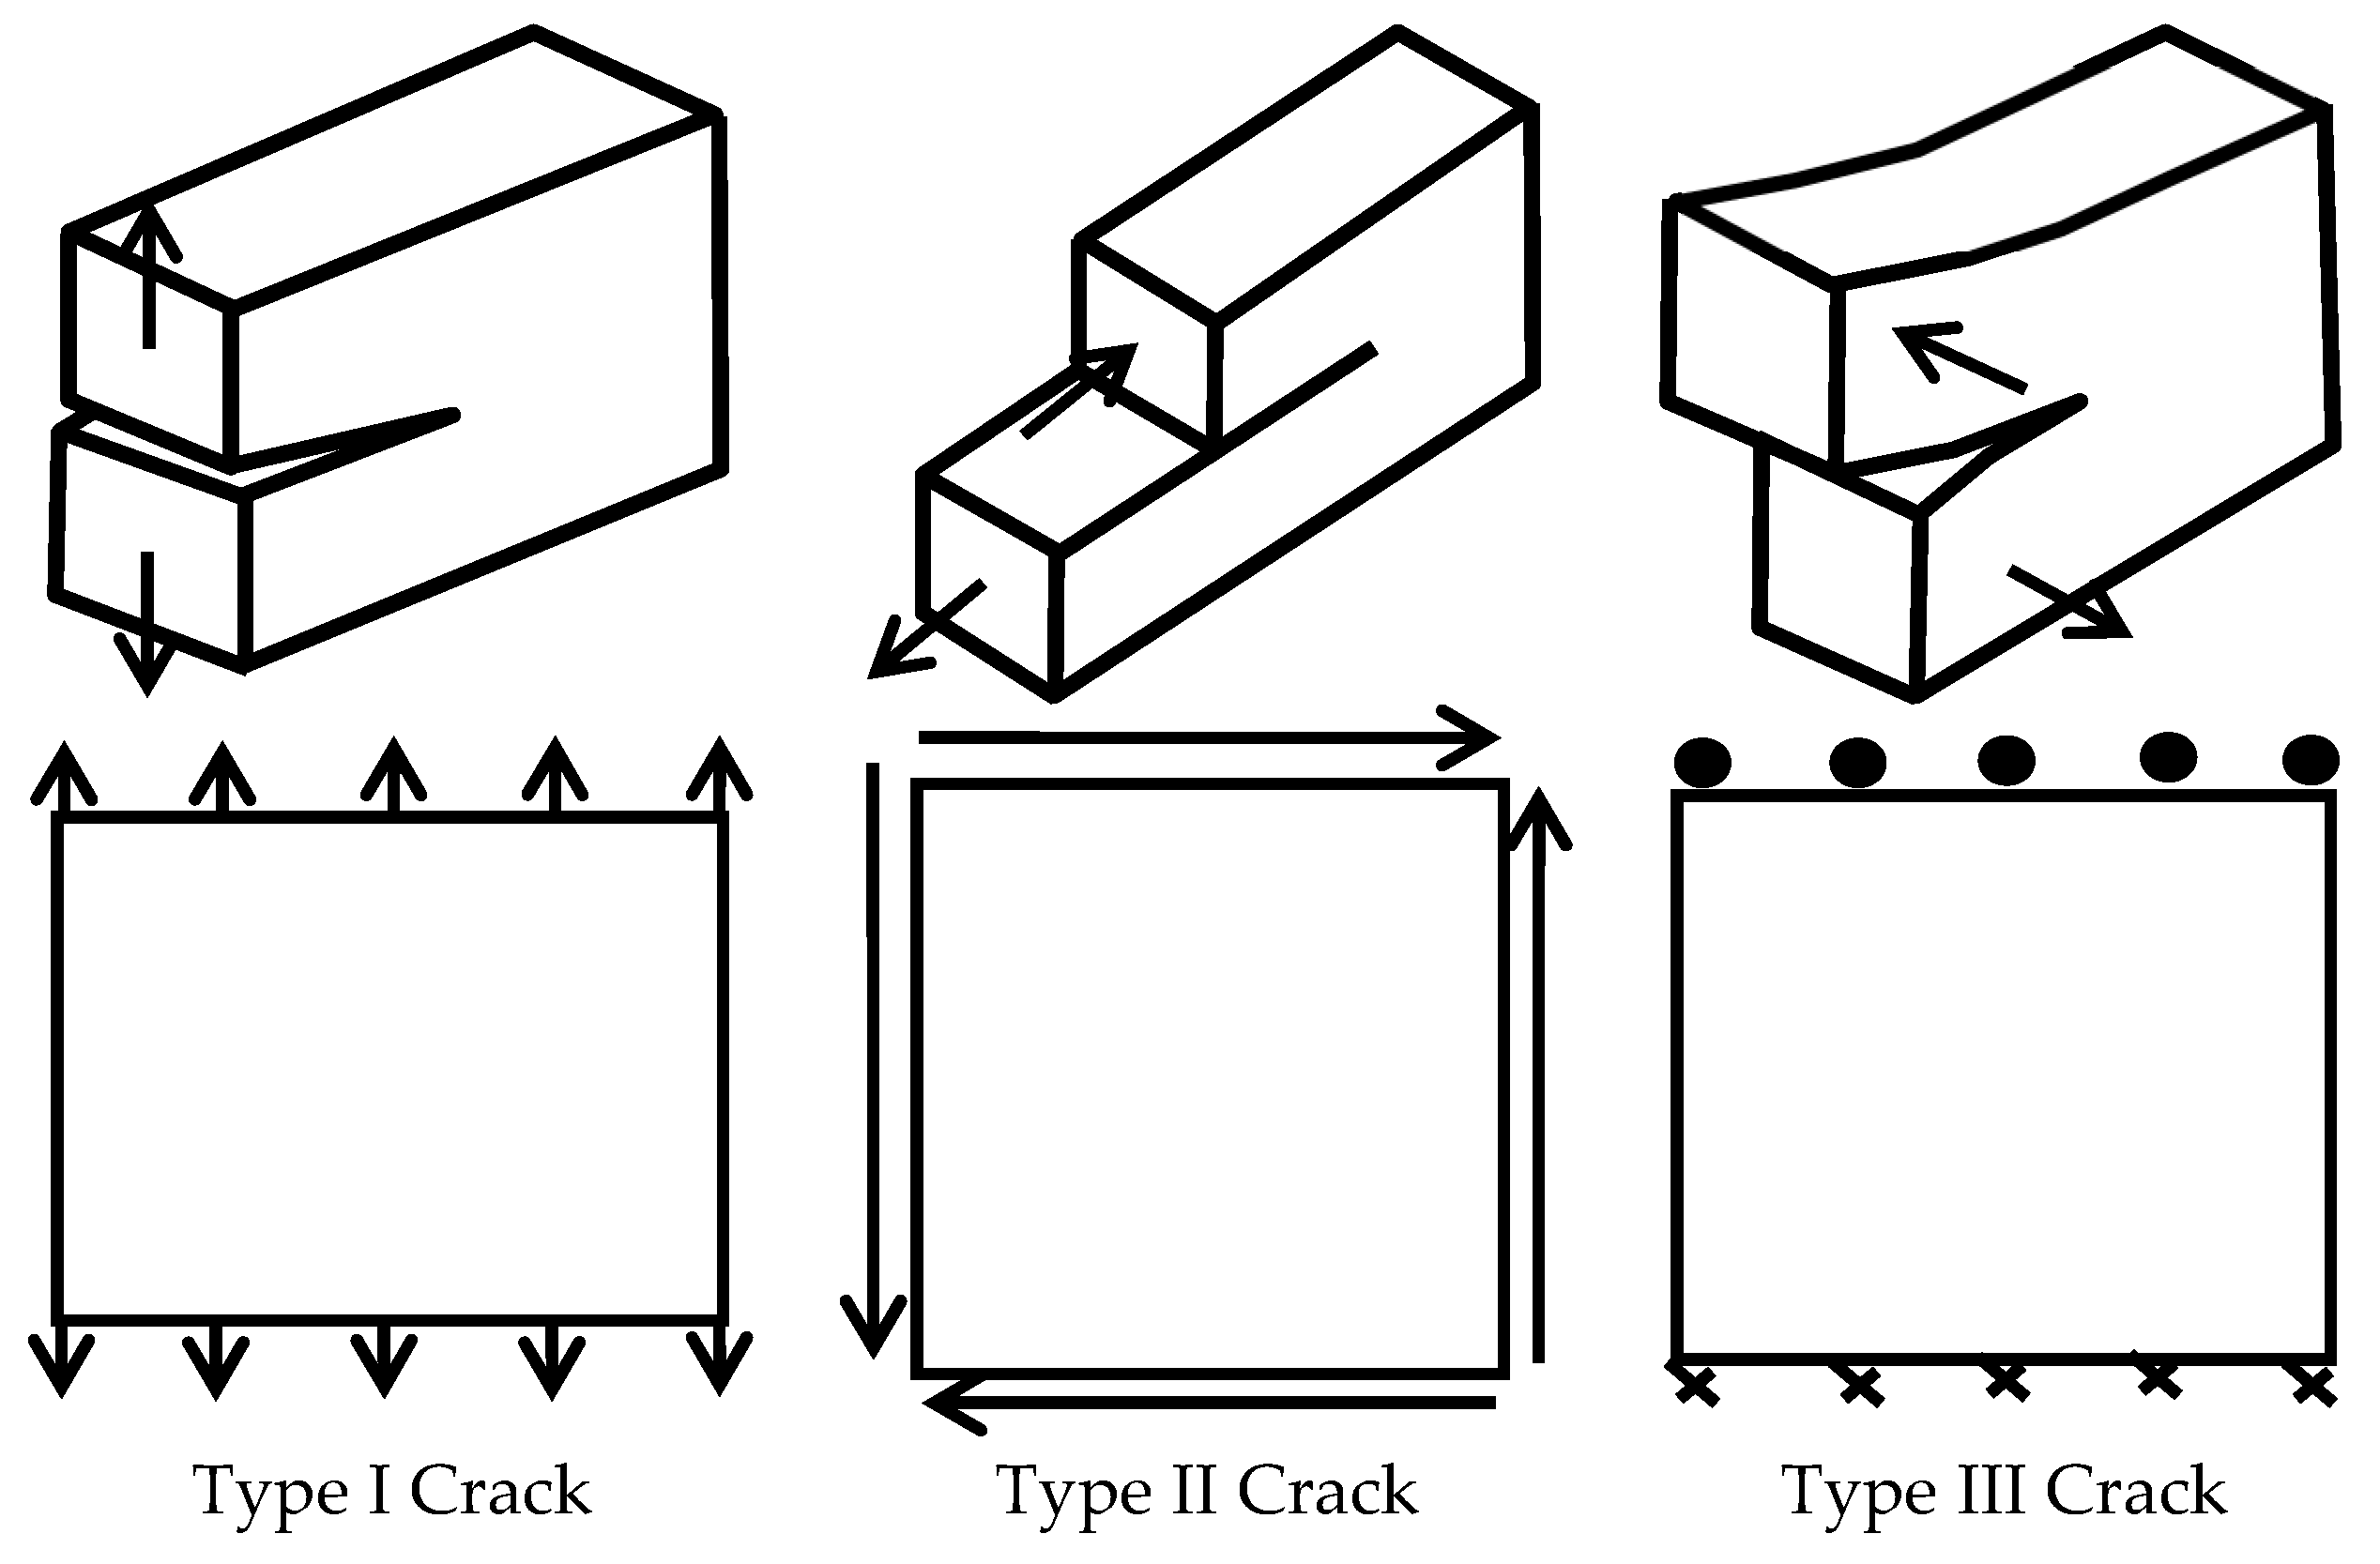
3.1. Types of Fractal Dimensions
3.2. Fractal Expansion Model of Stress-Induced Cracks
4. Fractal Analysis of the Mechanical Properties of Steel Fiber Alkali-Activated Slag Concrete Beams
4.1. Calculation Results of the Crack Fractal Dimension
4.2. Relationship Between Fracture Energy and Fractal Dimension
4.3. Relationship Between Mid-Span Deflection and Fractal Dimension
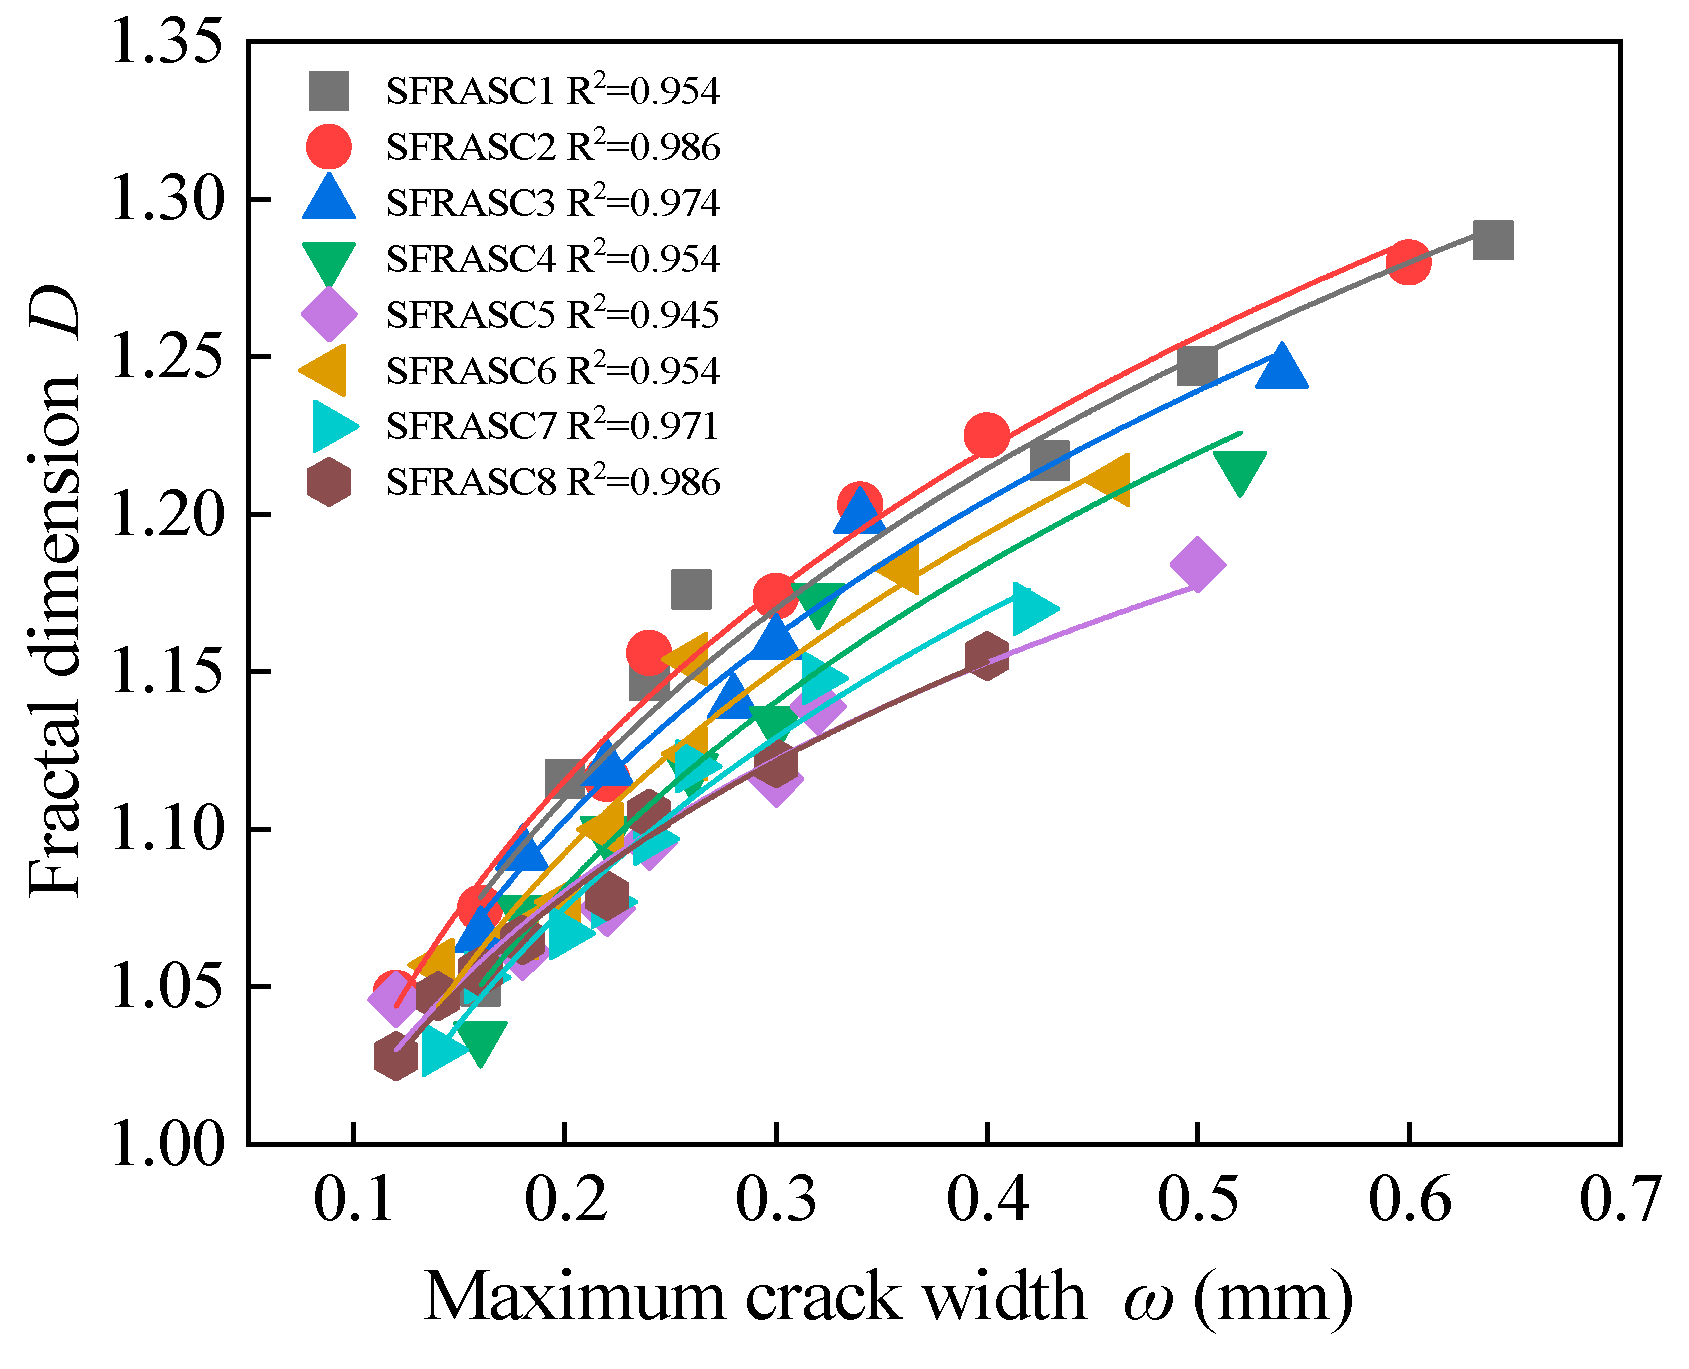
4.4. Relationship Between Maximum Crack Width and Fractal Dimension
5. Relationship Between the Fracture Toughness and Fractal Dimension of Steel Fiber Alkali-Activated Slag Concrete Beam
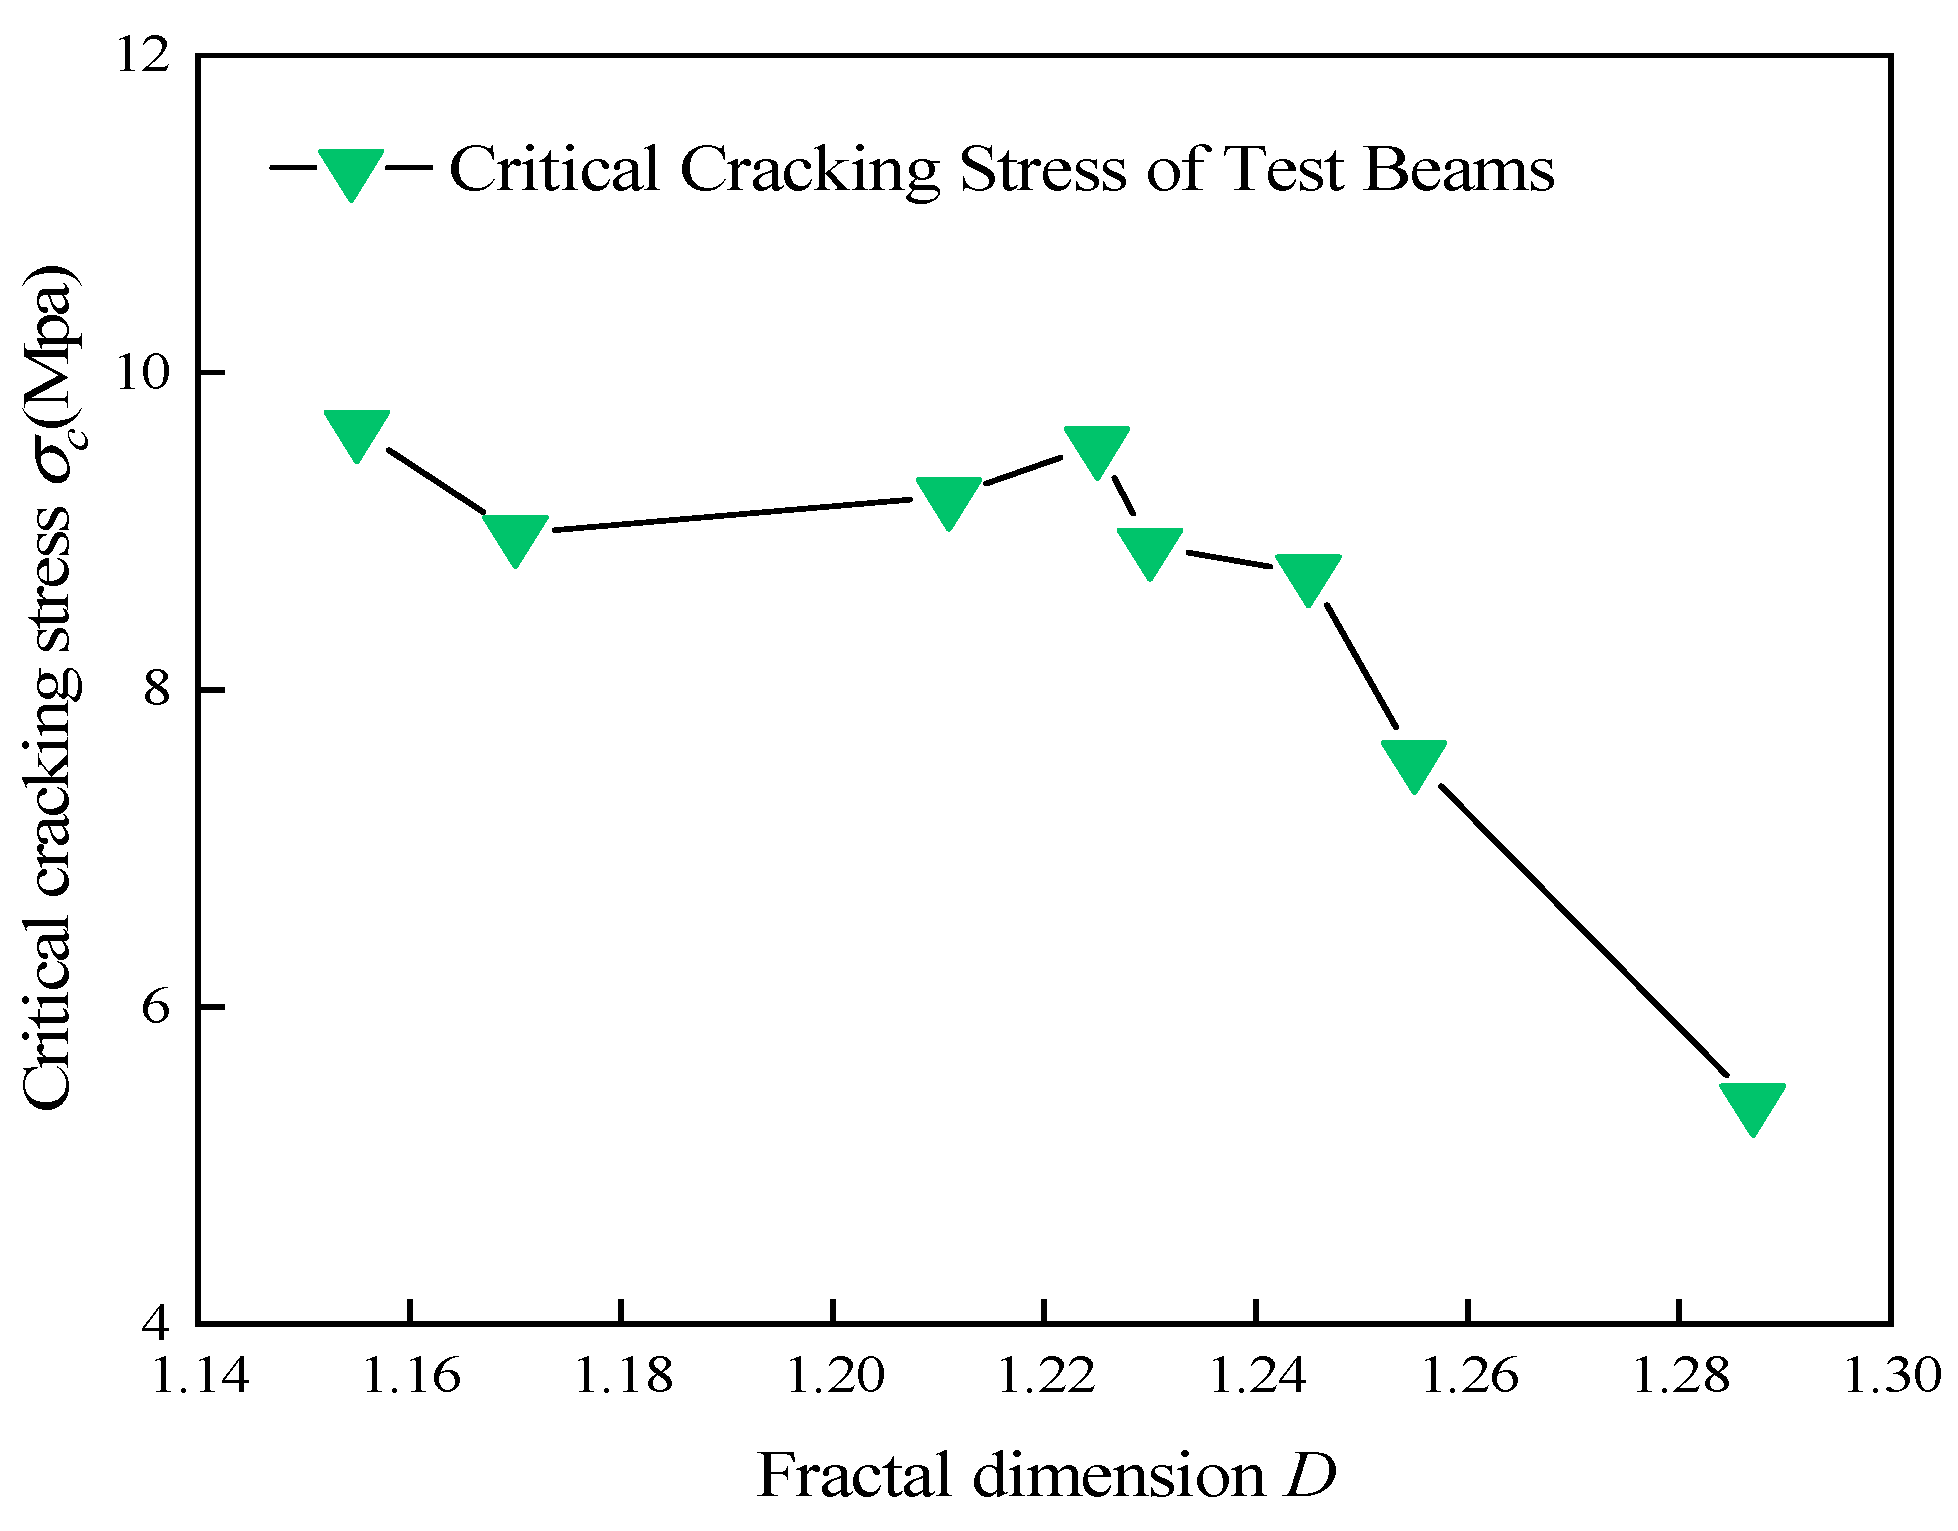
5.1. The Relationship Between Critical Crack Stress and Fractal Dimension
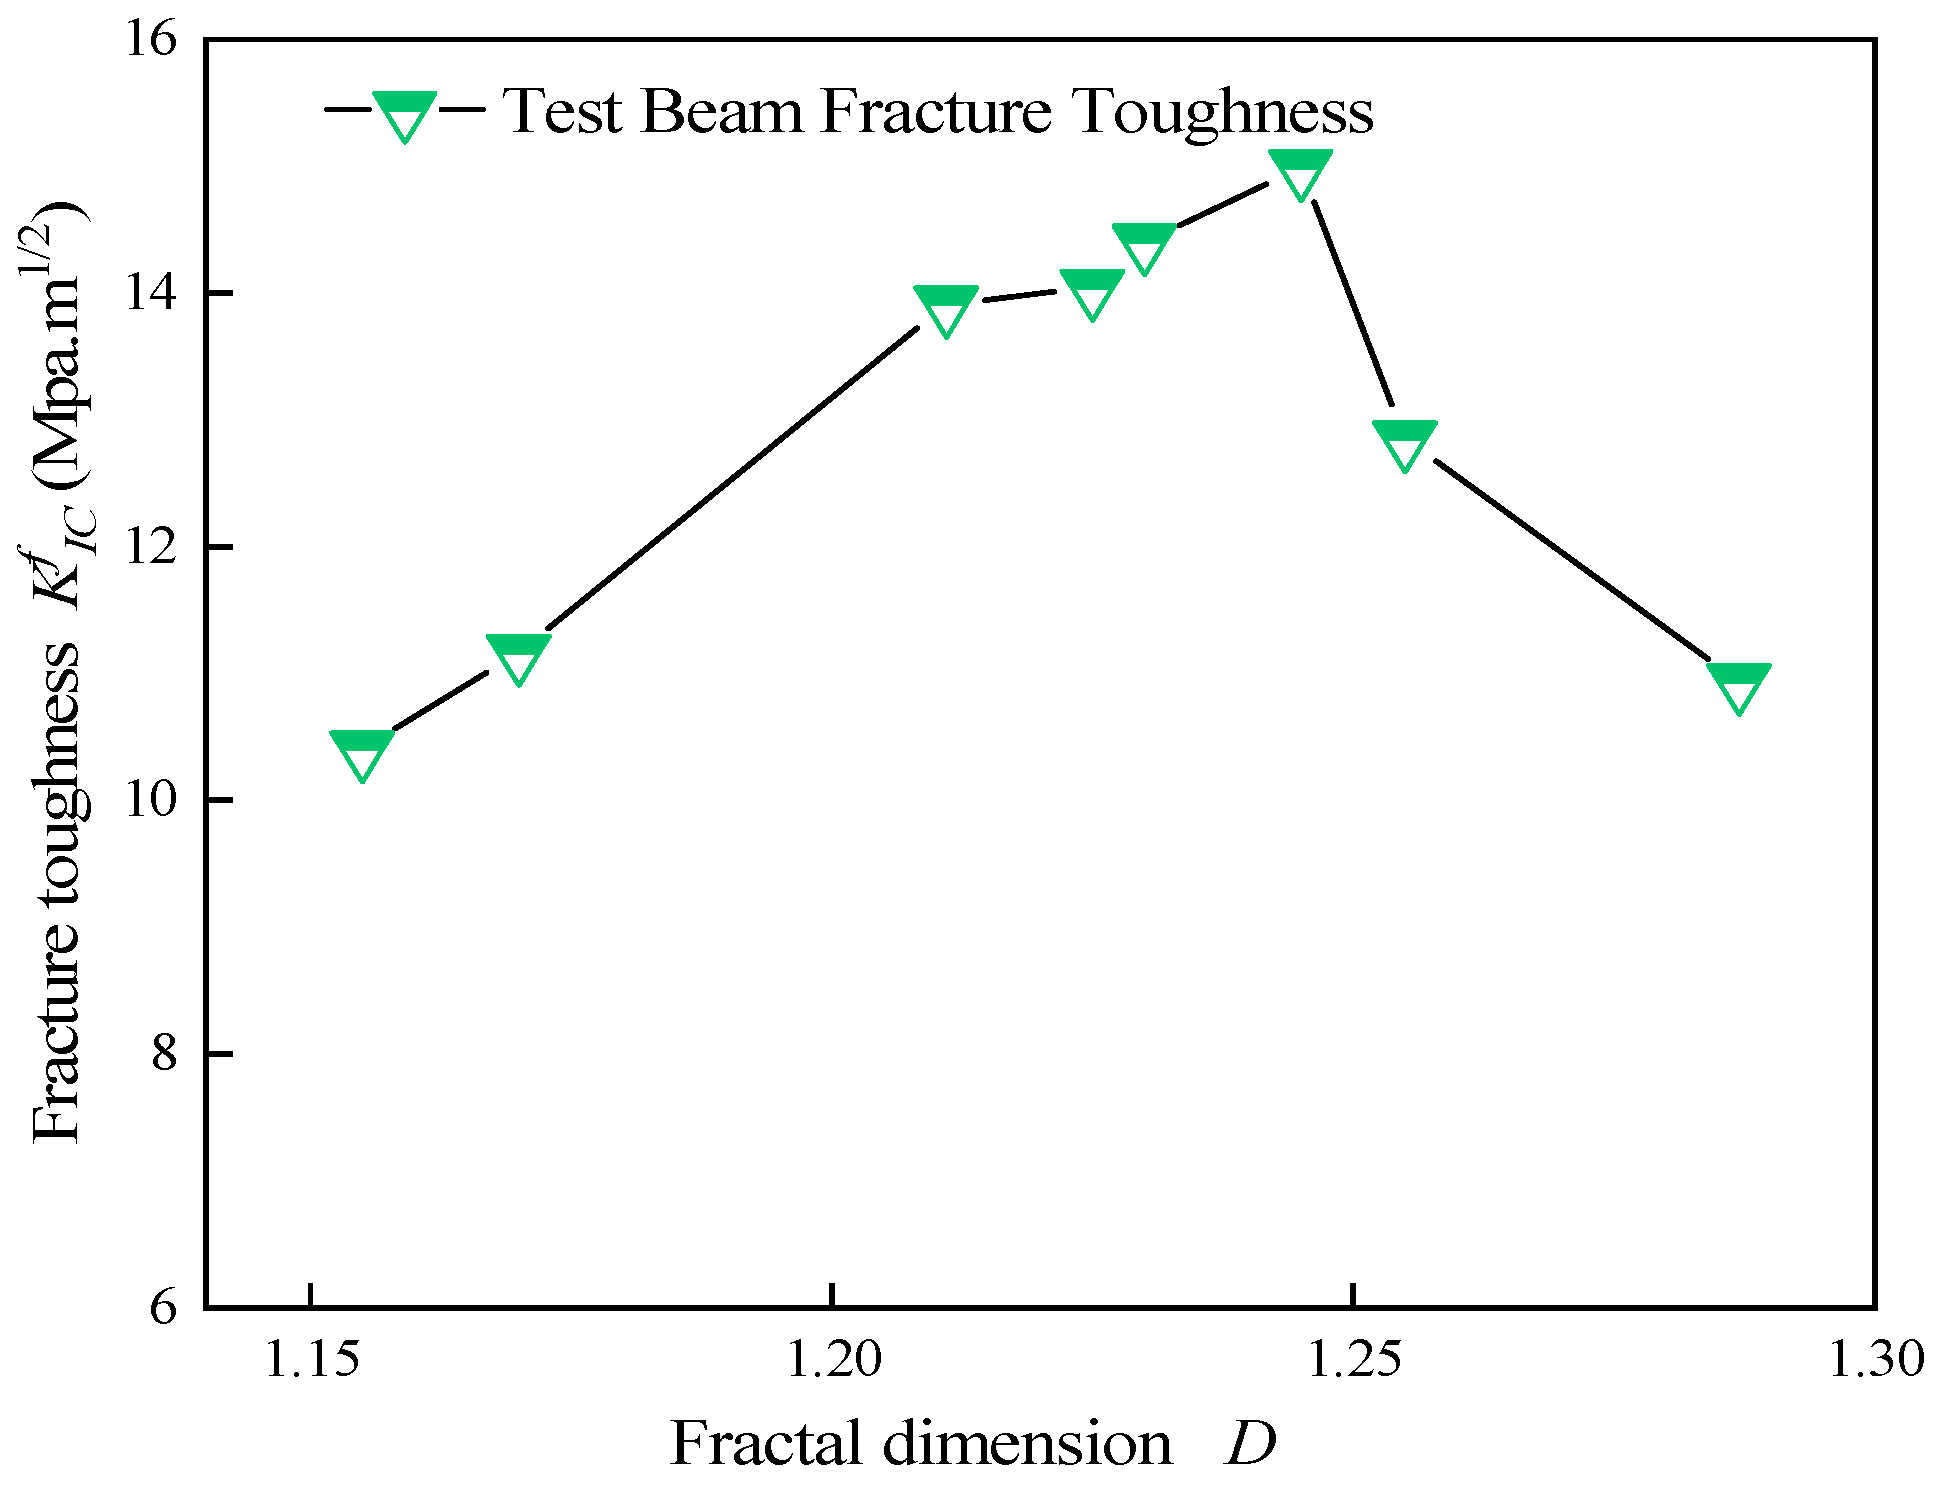
5.2. The Relationship Between Fracture Toughness and Fractal Dimension
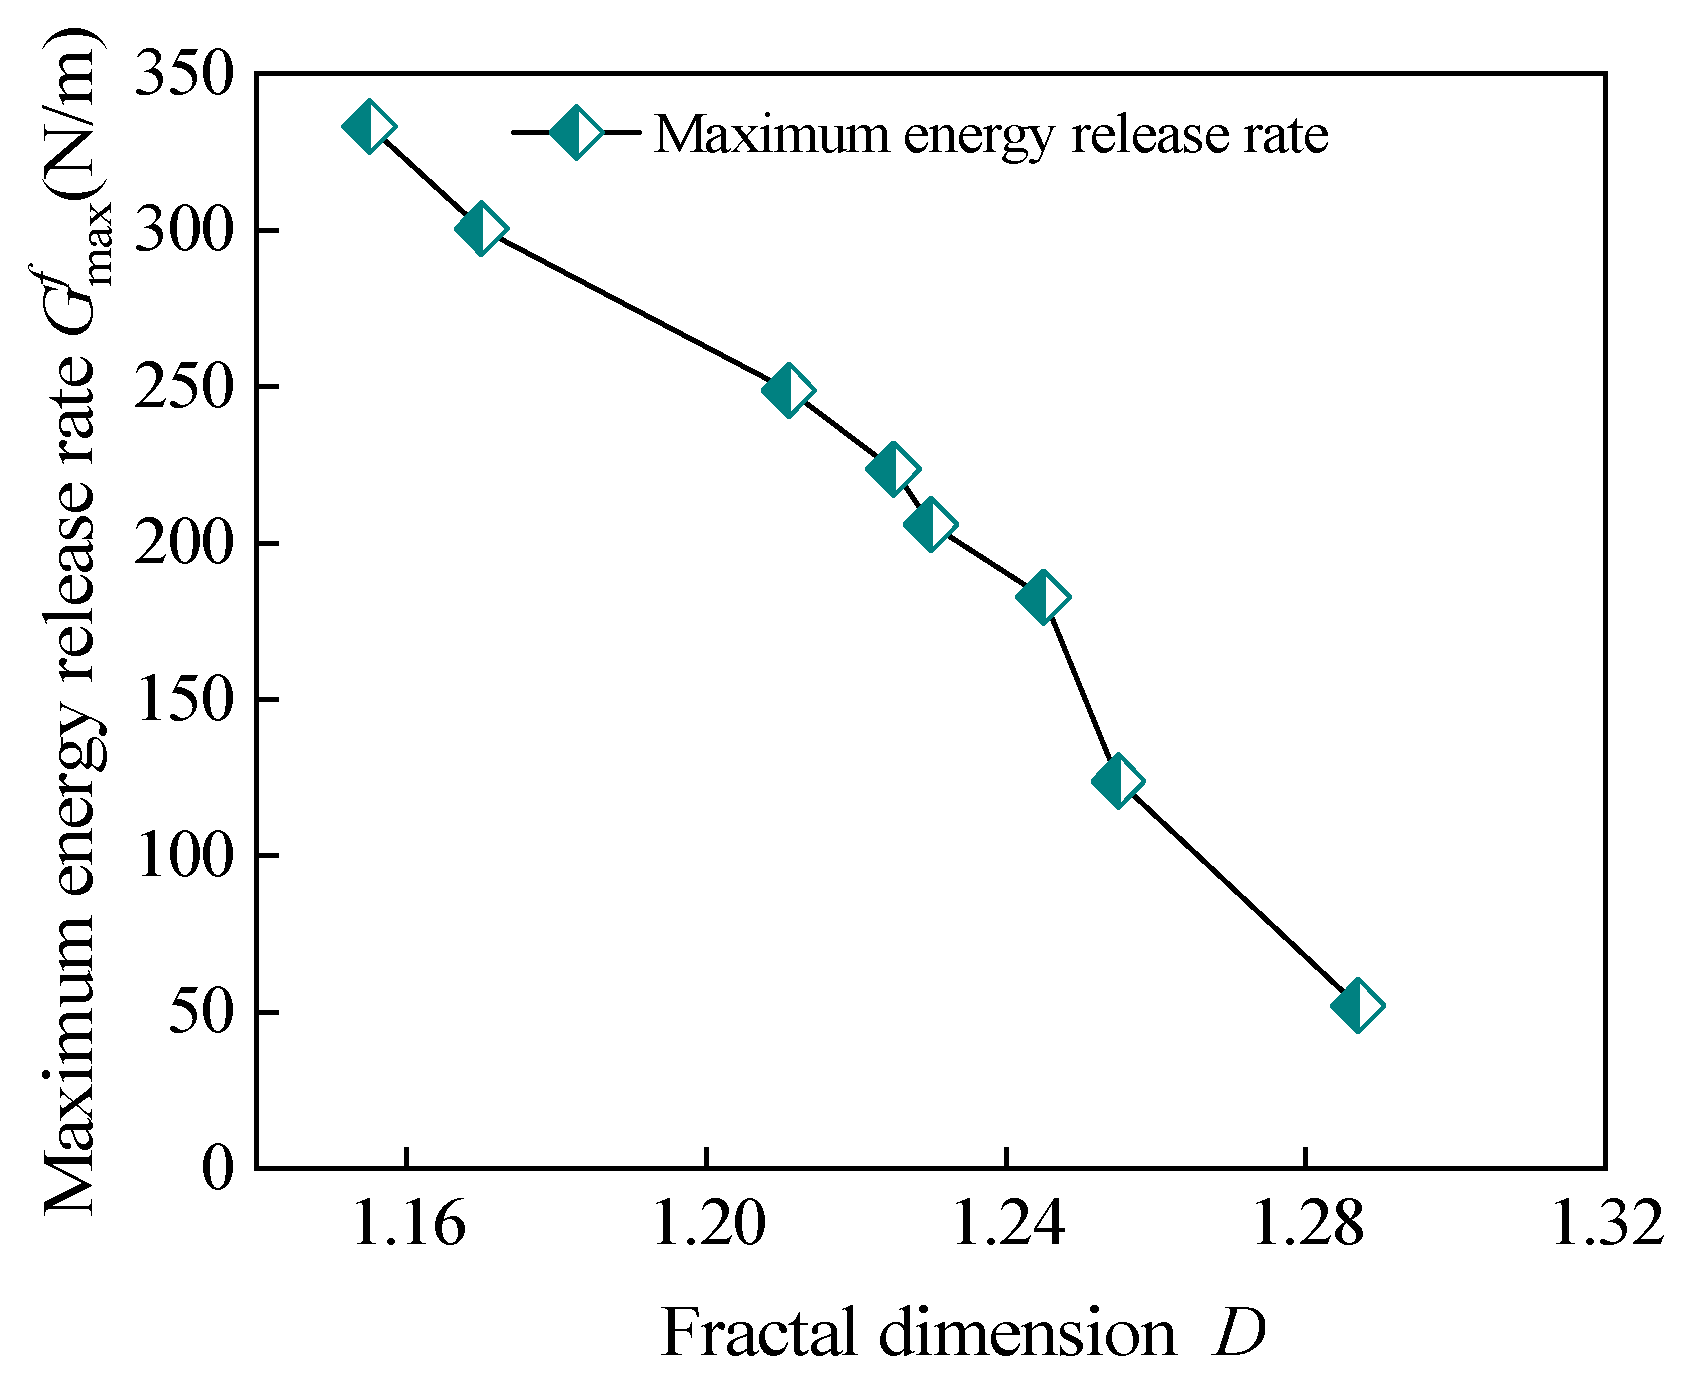
5.3. The Relationship Between the Maximum Energy Release Rate and the Fractal Dimension
6. Conclusions
Author Contributions
Funding
Data Availability Statement
Conflicts of Interest
References
- Zhang, S.; Duque-Redondo, E.; Kostiuchenko, A.; Dolado, J.S.; Ye, G. Molecular dynamics and experimental study on the adhesion mechanism of polyvinyl alcohol (PVA) fiber in alkali-activated slag/fly ash. Cem. Concr. Res. 2021, 145, 106452. [Google Scholar] [CrossRef]
- Luga, E.; Mustafaraj, E.; Corradi, M.; Atiș, C.D. Alkali-Activated Binders as Sustainable Alternatives to Portland Cement and Their Resistance to Saline Water. Materials 2024, 17, 4408. [Google Scholar] [CrossRef]
- Salami, B.A.; Ibrahim, M.; Algaifi, H.A.; Alimi, W.; Ewebajo, A.O. A review on the durability performance of alkali-activated binders subjected to chloride-bearing environment. Constr. Build. Mater. 2022, 317, 125947. [Google Scholar] [CrossRef]
- Provis, J.L.; Palomo, A.; Shi, C. Advances in understanding alkali-activated materials. Cem. Concr. Res. 2015, 78, 110–125. [Google Scholar] [CrossRef]
- Mundra, S.; Criado, M.; Bernal, S.A.; Provis, J.L. Chloride-induced corrosion of steel rebars in simulated pore solutions of alkali-activated concretes. Cem. Concr. Res. 2017, 100, 385–397. [Google Scholar] [CrossRef]
- Zhang, W.; Liu, X.; Huang, Y.; Tong, M.-N. Reliability-based analysis of the flexural strength of concrete beams reinforced with hybrid BFRP and steel rebars. Arch. Civ. Mech. Eng. 2022, 22, 171. [Google Scholar] [CrossRef]
- Zhang, W.; Yang, X.; Lin, J.; Lin, B.; Huang, Y. Experimental and numerical study on the torsional behavior of rectangular hollow reinforced concrete columns strengthened By CFRP. Structures 2024, 70, 107690. [Google Scholar] [CrossRef]
- Gao, D.; Li, Z.; Ding, C.; Yu, Z. Uniaxial tensile stress-strain constitutive relationship of 3D/4D/5D steel fiber-reinforced concrete. Constr. Build. Mater. 2025, 470, 140539. [Google Scholar] [CrossRef]
- Ghasemi, M.; Zhang, C.; Khorshidi, H.; Zhu, L.; Hsiao, P.-C. Seismic upgrading of existing RC frames with displacement-restraint cable bracing. Eng. Struct. 2023, 282, 115764. [Google Scholar] [CrossRef]
- Xu, W.; Chen, Y.; Miao, H.; Zhang, L. An experimental study on fracture characteristics of high-performance fiber-reinforced cement composites through combined acoustic emission and digital image correlation. J. Build. Eng. 2025, 103, 112110. [Google Scholar] [CrossRef]
- Rossi, L.; Zappitelli, M.P.; Patel, R.A.; Dehn, F. Flexural tensile behaviour of alkali-activated slag-based concrete and Portland cement-based concrete incorporating single and multiple hooked-end steel fibres. J. Build. Eng. 2024, 98, 111090. [Google Scholar] [CrossRef]
- Yuan, P.; Ren, X.; Xie, Y. Experimental Study on the Flexural Properties of Steel-Fibre-Reinforced Concrete Specimens with Different Heights. Sustainability 2024, 16, 1900. [Google Scholar] [CrossRef]
- Hashmi, M.H.; Koloor, S.S.R.; Abdul-Hamid, M.F.; Tamin, M.N. Fractal Analysis for Fatigue Crack Growth Rate Response of Engineering Structures with Complex Geometry. Fractal Fract. 2022, 6, 635. [Google Scholar] [CrossRef]
- Niu, Y.; Wang, W.; Su, Y.; Jia, F.; Long, X. Plastic damage prediction of concrete under compression based on deep learning. Acta Mech. 2024, 235, 255–266. [Google Scholar] [CrossRef]
- Chen, L.; Pei, Q.; Fei, Z.; Zhou, Z.; Hu, Z. Deep-neural-network-based framework for the accelerating uncertainty quantification of a structural–acoustic fully coupled system in a shallow sea. Eng. Anal. Bound. Elem. 2025, 171, 106112. [Google Scholar] [CrossRef]
- Gong, B.; Li, H. A couple Voronoi-RBSM modeling strategy for RC structures. Struct. Eng. Mech. Int. J. 2024, 91, 239–250. [Google Scholar] [CrossRef]
- Wang, K.; Cao, J.; Ye, J.; Qiu, Z.; Wang, X. Discrete element analysis of geosynthetic-reinforced pile-supported embankments. Constr. Build. Mater. 2024, 449, 138448. [Google Scholar] [CrossRef]
- Chen, L.; Huo, R.; Lian, H.; Yu, B.; Zhang, M.; Natarajan, S.; Bordas, S.P. Uncertainty quantification of 3D acoustic shape sensitivities with generalized nth-order perturbation boundary element methods. Comput. Methods Appl. Mech. Eng. 2025, 433, 117464. [Google Scholar] [CrossRef]
- Li, D.; Nie, J.H.; Wang, H.; Yu, T.; Kuang, K.S.C. Path planning and topology-aided acoustic emission damage localization in high-strength bolt connections of bridges. Eng. Struct. 2025, 332, 120103. [Google Scholar] [CrossRef]
- Li, D.; Chen, Q.; Wang, H.; Shen, P.; Li, Z.; He, W. Deep learning-based acoustic emission data clustering for crack evaluation of welded joints in field bridges. Autom. Constr. 2024, 165, 105540. [Google Scholar] [CrossRef]
- Chen, L.; Lian, H.; Liu, C.; Li, Y.; Natarajan, S. Sensitivity analysis of transverse electric polarized electromagnetic scattering with isogeometric boundary elements accelerated by a fast multipole method. Appl. Math. Model. 2025, 141, 115956. [Google Scholar] [CrossRef]
- Chen, L.; Liu, C.; Lian, H.; Gu, W. Electromagnetic scattering sensitivity analysis for perfectly conducting objects in TM polarization with isogeometric BEM. Eng. Anal. Bound. Elem. 2025, 172, 106126. [Google Scholar] [CrossRef]
- Lian, H.; Li, X.; Qu, Y.; Du, J.; Meng, Z.; Liu, J.; Chen, L. Bayesian uncertainty analysis for underwater 3D reconstruction with neural radiance fields. Appl. Math. Model. 2025, 138, 115806. [Google Scholar] [CrossRef]
- CECS 38:2004; Technical Code for Fiber-Reinforced Concrete Structures. China Engineering Construction Standardization Association. China Planning Press: Beijing, China, 2004.
- GB/T 50152-2012; Standard for Testing Methods of Concrete Structures. Ministry of Housing and Urban-Rural Development of the People’s Republic of China. China Architecture and Building Press: Beijing, China, 2012; pp. 23–24.
- Zhang, M.; Jing, J.; Zhang, S. Effect of steel fiber content on fatigue performance of high-strength concrete beams. Sci. Rep. 2025, 15, 11815. [Google Scholar] [CrossRef]
- Chai, H.; Wu, H.; Zhang, Y.; Zhou, J.; Liu, D.; Yu, Y.; Liao, W. Research on the shear behavior of PBL connectors in steel fiber reinforced concrete composite beam. Sci. Rep. 2025, 15, 5824. [Google Scholar] [CrossRef]
- Zheng, Y.; Lv, X.; Hu, S.; Zhuo, J.; Wan, C.; Liu, J. Mechanical properties and durability of steel fiber reinforced concrete: A review. J. Build. Eng. 2024, 82, 108025. [Google Scholar] [CrossRef]
- Rossi, L.; Patel, R.A.; Dehn, F. New analytical models to predict the mechanical performance of steel fiber-reinforced alkali-activated concrete. Struct. Concr. 2025, 26, 236–247. [Google Scholar] [CrossRef]
- GB 50010-2010; Code for Design of Concrete Structures. Ministry of Housing and Urban-Rural Development of the People’s Republic of China. China Architecture and Building Press: Beijing, China, 2010; pp. 1–63.
- Hentschel, H.G.E.; Procaccia, I. The infinite number of generalized dimensions of fractals and strange attractors. Phys. D Nonlinear Phenom. 1983, 8, 435–444. [Google Scholar] [CrossRef]
- Mandelbrot, B.B.; Passoja, D.E.; Paullay, A.J. Fractal character of fracture surfaces of metals. Nature 1984, 308, 721–722. [Google Scholar] [CrossRef]
- Grassberger, P.; Procaccia, I. Measuring the strangeness of strange attractors. Phys. D Nonlinear Phenom. 1983, 9, 189–208. [Google Scholar] [CrossRef]
- Halsey, T.C.; Jensen, M.H.; Kadanoff, L.P.; Procaccia, I.; Shraiman, B.I. Fractal measures and their singularities: The characterization of strange sets. Phys. Rev. A 1986, 33, 1141. [Google Scholar] [CrossRef]
- Song, C.; Havlin, S.; Makse, H.A. Self-similarity of complex networks. Nature 2005, 433, 392–395. [Google Scholar] [CrossRef] [PubMed]
- Niu, Q.; Wang, J.; He, J.; Yuan, W.; Chang, J.; Wang, W.; Yuan, J.; Wang, Q.; Zheng, Y.; Shang, S. Evolution of pore structure, fracture morphology and permeability during CO2+O2 in-situ leaching process of fractured sandstone. Energy 2025, 315, 134348. [Google Scholar] [CrossRef]
- Kaplan, M.F. Crack propagation and the fracture of concrete. J. Proc. 1961, 58, 591–610. [Google Scholar] [CrossRef]
- Wnuk, M.P.; Yavari, A. On estimating stress intensity factors and modulus of cohesion for fractal cracks. Eng. Fract. Mech. 2003, 70, 1659–1674. [Google Scholar] [CrossRef]
- Griffith, A.A., VI. The phenomena of rupture and flow in solids. Philos. Trans. R. Soc. Lond. Ser. A Contain. Pap. Math. Phys. Character 1921, 221, 163–198. [Google Scholar] [CrossRef]
- Wang, T.; Yang, J. Fractal geometric analysis of crack state and its propagation in concrete structures. J. Dalian Univ. Technol. 1997, 37, 79–83. [Google Scholar]
- Euro-International Concrete Committee. CEB-FIP Model Code 1990; Thomas Telford Ltd.: Lausanne, Switzerland, 1993. [Google Scholar]
- Ding, Z.Y.; Zhou, J.H.; Su, Q.; Sun, H.; Zhang, Y.C.; Wang, Q. Influence of sodium silicate module on size effect of geopolymer recycled aggregate concrete. Chin. J. Appl. Mech. 2024, 41, 1394–1402. [Google Scholar] [CrossRef]


| Particle Size/mm | 4.75 | 2.36 | 1.18 | 0.6 | 0.3 | 0.15 | Pan | Total Mass |
|---|---|---|---|---|---|---|---|---|
| mass/g | 48.27 | 287.43 | 253.68 | 392.15 | 613.72 | 198.34 | 55.56 | 1857.15 |
| mass percentage/% | 2.60 | 15.47 | 13.66 | 21.11 | 33.04 | 10.68 | 2.99 | 99.99 |
| Water Glass Solution (%) | NaOH (%) | Water (%) | Moisture Content (%) |
|---|---|---|---|
| 100 | 10.36 | 90.35 | 73.5 |
| Mix Proportion of the Concrete (kg/m3) | Solution to Powder Ratio | Water to Solid Ratio | Steel Fiber Content | ||||
|---|---|---|---|---|---|---|---|
| GGBS | Fly Ash | Fine Aggregate | Coarse Aggregate | Activator Solution | |||
| 280 | 120 | 615 | 1260 | 298.5 | 0.75 | 0.55 | 0.0% |
| Number | Steel Fiber Content (%) | Cracking Load on the Cross-Section Pcr (kN) | Cracking Load of Inclined Section Vcr (kN) | Ultimate Load Pu (kN) |
|---|---|---|---|---|
| SFRASC1 | 0.0 | 15.8 | 45.2 | 89.4 |
| SFRASC2 | 0.5 | 19.5 | 50.0 | 96.4 |
| SFRASC3 | 0.9 | 22.1 | 55.2 | 100.2 |
| SFRASC4 | 1.0 | 21.2 | 57.4 | 101.2 |
| SFRASC5 | 1.1 | 22.8 | 60.7 | 103.8 |
| SFRASC6 | 1.2 | 23.7 | 63.1 | 107.0 |
| SFRASC7 | 1.3 | 24.4 | 65.7 | 108.0 |
| SFRASC8 | 1.4 | 25.3 | 67.5 | 110.5 |
| Number | Steel Fiber Content (%) | Width of Crack (mm) | Crack Distribution Characteristics |
|---|---|---|---|
| SFRASC1 | 0.0 | 0.50 | Concentration and vertical development |
| SFRASC2 | 0.5 | 0.34 | The main crack is clearly visible at mid-span, with only a few horizontal cracks observed. |
| SFRASC3 | 0.9 | 0.31 | Cracks are interconnected, but their width increases at a slow rate. |
| SFRASC4 | 1.0 | 0.29 | Diagonal cracks propagate in the bending-shear region. |
| SFRASC5 | 1.1 | 0.28 | Crack intersections are observed, exhibiting complex propagation directions. |
| SFRASC6 | 1.2 | 0.26 | The crack height is restricted, and the distribution is irregular. |
| SFRASC7 | 1.3 | 0.24 | Cracks are tortuous, accompanied by numerous fine secondary cracks. |
| SFRASC8 | 1.4 | 0.23 | Crack development remains limited, with relatively few secondary cracks. |
| Type | Calculation Method | Applicable Scenarios | Advantages | Limitations |
|---|---|---|---|---|
| Capacity Dimension (Dcap) | The box-counting method is used to compute the number of covering boxes, denoted as N(ε) | General fractals, such as cracks, surface roughness, or damage zones of beams | Strong versatility, straightforward calculation | Sensitive to image resolution; requires multi-scale fitting |
| Information Dimension (DI) | Based on probability distribution Pi | Non-uniform fractals, such as mass distribution or energy dissipation | Quantifies distribution heterogeneity | Complex to calculate; requires large datasets |
| Correlation Dimension (DC) | Correlation integral C(ε) to analyze point pair distance distribution | Dynamical system attractors, time series, such as vibration signals | Suitable for analyzing chaotic systems | Requires phase space reconstruction; parameter sensitive |
| Generalized Dimension (Dq) | Multifractal spectrum | Multi-scale complex systems, such as turbulence or financial fluctuations | Provides a comprehensive characterization of multi-scale features | High computational cost; complex interpretation |
| Self-similarity Dimension (DS) | Based on the number of subparts N and ratio r, derived from the generation rule | Strictly self-similar fractals, such as the Koch curve or Sierpinski carpet | Simple theoretical computation | Applicable only to ideal fractals, lacks universality |
| Different Load Levels (kN) | Fractal Dimensions of Test Beams in Each Group | |||||||
|---|---|---|---|---|---|---|---|---|
| SFRASC1 | SFRASC2 | SFRASC3 | SFRASC4 | SFRASC5 | SFRASC6 | SFRASC7 | SFRASC8 | |
| 30 | 1.050 | 1.048 | ||||||
| 40 | 1.116 | 1.075 | 1.066 | 1.034 | 1.046 | 1.057 | 1.030 | 1.028 |
| 50 | 1.147 | 1.116 | 1.092 | 1.074 | 1.061 | 1.067 | 1.053 | 1.047 |
| 60 | 1.176 | 1.156 | 1.119 | 1.099 | 1.075 | 1.077 | 1.067 | 1.055 |
| 70 | 1.217 | 1.174 | 1.140 | 1.119 | 1.096 | 1.100 | 1.077 | 1.065 |
| 80 | 1.247 | 1.203 | 1.159 | 1.134 | 1.116 | 1.124 | 1.097 | 1.079 |
| 90 | 1.287 | 1.225 | 1.199 | 1.173 | 1.139 | 1.154 | 1.120 | 1.105 |
| 100 | 1.280 | 1.245 | 1.215 | 1.184 | 1.183 | 1.148 | 1.121 | |
| 110 | 1.211 | 1.170 | 1.155 | |||||
| Value | SFRASC1 | SFRASC2 | SFRASC3 | SFRASC4 | SFRASC5 | SFRASC6 | SFRASC7 | SFRASC8 |
|---|---|---|---|---|---|---|---|---|
| fcm (N/mm2) | 30.5 | 38.5 | 46.6 | 47.5 | 53.8 | 55.1 | 59.2 | 67.6 |
| Gf (N/m) | 80.76 | 95.07 | 108.66 | 110.13 | 120.16 | 122.18 | 128.48 | 140.98 |
| D | 1.287 | 1.280 | 1.245 | 1.215 | 1.184 | 1.211 | 1.170 | 1.155 |
| Coefficient | SFRASC1 | SFRASC2 | SFRASC3 | SFRASC4 | SFRASC5 | SFRASC6 | SFRASC7 | SFRASC8 |
|---|---|---|---|---|---|---|---|---|
| a | 0.00857 | 0.00868 | 0.00862 | 0.00835 | 0.00864 | 0.00851 | 0.00869 | 0.00910 |
| b | 0.175 | 0.141 | 0.149 | 0.155 | 0.127 | 0.139 | 0.119 | 0.091 |
| Fit Coefficient | SFRASC1 | SFRASC2 | SFRASC3 | SFRASC4 | SFRASC5 | SFRASC6 | SFRASC7 | SFRASC8 |
|---|---|---|---|---|---|---|---|---|
| g | 1.368 | 1.175 | 1.353 | 1.335 | 1.256 | 1.343 | 1.306 | 1.259 |
| h | 0.130 | 0.130 | 0.127 | 0.131 | 0.094 | 0.128 | 0.121 | 0.096 |
| Volume Ratio of Steel Fiber ρf | Modulus of Elasticity (MPa) | Ultimate Deflection (mm) | Load (kN) | Characteristic Length of the Crack a (mm) | Fractal Dimension D | Critical Cracking Stress σc (Mpa) | Fracture Toughness KfIC (Mpa⋅m1/2) | Maximum Energy Release Rate Gfmax (N/m) |
|---|---|---|---|---|---|---|---|---|
| 0.0 | 26,000 | 9.53 | 89.40 | 158 | 1.287 | 5.396 | 10.939 | 52.163 |
| 0.005 | 26,000 | 10.14 | 96.40 | 144 | 1.255 | 7.560 | 12.851 | 124.026 |
| 0.009 | 27,000 | 10.76 | 100.20 | 155 | 1.245 | 8.735 | 14.991 | 182.764 |
| 0.01 | 28,000 | 10.72 | 101.20 | 154 | 1.230 | 8.903 | 14.403 | 205.856 |
| 0.011 | 28,000 | 10.83 | 103.80 | 136 | 1.225 | 9.542 | 14.044 | 223.677 |
| 0.012 | 29,000 | 11.56 | 107.00 | 154 | 1.211 | 9.220 | 13.911 | 248.916 |
| 0.013 | 30,000 | 11.01 | 108.00 | 143 | 1.170 | 8.985 | 11.168 | 300.481 |
| 0.014 | 31,000 | 11.08 | 110.50 | 123 | 1.155 | 9.645 | 10.406 | 333.258 |
Disclaimer/Publisher’s Note: The statements, opinions and data contained in all publications are solely those of the individual author(s) and contributor(s) and not of MDPI and/or the editor(s). MDPI and/or the editor(s) disclaim responsibility for any injury to people or property resulting from any ideas, methods, instructions or products referred to in the content. |
© 2025 by the authors. Licensee MDPI, Basel, Switzerland. This article is an open access article distributed under the terms and conditions of the Creative Commons Attribution (CC BY) license (https://creativecommons.org/licenses/by/4.0/).
Share and Cite
Yuan, X.; Cui, Z.; Chen, G. Influence of Steel Fiber Content on the Fractal Evolution of Bending Cracks in Alkali-Activated Slag Concrete Beams. Buildings 2025, 15, 2444. https://doi.org/10.3390/buildings15142444
Yuan X, Cui Z, Chen G. Influence of Steel Fiber Content on the Fractal Evolution of Bending Cracks in Alkali-Activated Slag Concrete Beams. Buildings. 2025; 15(14):2444. https://doi.org/10.3390/buildings15142444
Chicago/Turabian StyleYuan, Xiaohui, Ziyu Cui, and Gege Chen. 2025. "Influence of Steel Fiber Content on the Fractal Evolution of Bending Cracks in Alkali-Activated Slag Concrete Beams" Buildings 15, no. 14: 2444. https://doi.org/10.3390/buildings15142444
APA StyleYuan, X., Cui, Z., & Chen, G. (2025). Influence of Steel Fiber Content on the Fractal Evolution of Bending Cracks in Alkali-Activated Slag Concrete Beams. Buildings, 15(14), 2444. https://doi.org/10.3390/buildings15142444