Article

Fuzzy Chance-Constrained Day-Ahead Operation of Multi-Building Integrated Energy Systems: A Bi-Level Mixed Game Approach

1
School of Electrical Power Engineering, Nanjing Institute of Technology, Nanjing 211167, China
2
School of Electrical and Power Engineering, Hohai University, Nanjing 211100, China
*
Author to whom correspondence should be addressed.
Buildings 2025, 15(14), 2441; https://doi.org/10.3390/buildings15142441
Submission received: 27 May 2025 / Revised: 3 July 2025 / Accepted: 8 July 2025 / Published: 11 July 2025
(This article belongs to the Section Building Energy, Physics, Environment, and Systems)

Abstract

Highlights

  • A mixed game-based bi-level operation model for multiple buildings incorporating Stackelberg games and cooperative games.
  • A fuzzy chance-constrained operation model addressing uncertainties in distributed renewable generation and loads.
  • An analytical approach to reformulate the fuzzy chance-constrained model into a tractable deterministic type.
  • A privacy-preserving hierarchical solution approach for bi-level optimization model mixed-binary variables.

Abstract

This paper proposes a novel mixed game-based day-ahead operation strategy for multi-building integrated energy systems, which innovatively addresses both inter-building cooperation and non-cooperative energy transactions with system operators under uncertainties. Specifically, a bi-level operation model is established in which the upper level maximizes the benefits of the energy system operator, and the lower level minimizes the costs of multiple buildings. Then, in consideration of source-load uncertainties in multiple building energy systems, the fuzzy chance-constrained programming method is introduced, and the clear equivalent class method is used to reformulate the fuzzy chance constrained model into a tractable deterministic type. Further, a privacy-preserving hierarchical solution approach is presented to solve the bi-level optimization model, and the Shapley value method is adopted for benefits redistribution. Case studies on a multi-building system in East China showcase the effectiveness of the proposed work and demonstrate that the proposed strategy contributes to reducing the operation costs of the multi-building system by approximately 3.98% and increasing the revenue of the energy system operators by 10.31%.

1. Introduction

Currently, global building energy demand is still growing rapidly, and the carbon emissions from buildings account for a relatively high proportion of global emissions. The process of energy transition continues to face considerable difficulties. The building integrated energy system, as an energy production, supply, and consumption system integrating multiple heterogeneous energy sources, can leverage the complementary advantages among different energy systems, thereby achieving energy coupling at different links, optimizing the energy consumption structure of buildings and enhancing multiple energy source utilization, energy conservation, and carbon reduction. The collaborative optimization operation among multiple buildings can further improve the operation efficiency. In this context, strategic operation collaboration among multi-buildings is vital.
A rich body of literature has addressed the hierarchical decision-making mechanism of both distribution network operators and prosumers, including smart buildings. The superior distribution network first issues dynamic electricity price signals, and the subordinate prosumers employing integrated energy systems (IESs) adjust load demand based on this pricing strategy, ultimately achieving the flexibility equilibrium of energy supply and load demand. In the literature [1], the supply–demand dynamics and energy conversion processes were analytically investigated within the framework of the sharing economy, with a specific focus on the dual roles of prosumers as both producers and consumers. A Stackelberg game theoretical model was formulated, wherein the IES assumed the role of the leader, while the prosumer operated as the follower. Reference [2], based on the typical structure of distributed IESs, introduced IES operators and proposed an electricity and heat energy trading framework with the operators as the leader and the distributed IES as the follower in order to enhance the operator’s profit and mitigate the system cost and carbon emissions. The model is built in based on the Stackelberg game model, and the existence of Nash equilibrium is proved. Reference [3] proposed a Stackelberg game model for a community IES considering carbon trading and demand response, with community integrated energy service providers as the leader and user aggregators as the followers. Reference [4] established a coordinated scheduling model for microgrids and electric vehicles based on the Stackelberg game. In Reference [5], a Stackelberg game-theoretic framework was proposed to address the optimal configuration and service pricing problem in an electricity–heat cloud energy storage system. The hierarchical leader–follower interaction was subsequently transformed into a tractable single-layer optimization model through the application of Karush–Kuhn–Tucker (KKT) optimality conditions.
In the electricity market transactions, different stakeholders display competitive relationships. They are all independent rational entities and exhibit an equal cooperative relationship [6]. Therefore, in the research regarding multi-combined energy system optimization, the cooperative revenue distribution among the participating entities and the overall revenue improvement must be considered [7,8]. Reference [9] established an IES optimization model inspired by the cooperative game theory, using the asymmetric Nash bargaining method to ensure that cooperative revenue is properly dispensed in alignment with contribution, solving the bargaining model using the ADMM algorithm. Reference [10] constructed a tripartite collaborative game framework comprising government, enterprises, and users, quantifying the collective welfare optimal solution through the Nash bargaining theory and empirically demonstrated that this mechanism not only achieves Pareto improvement of alliance benefits but also significantly enhances the willingness of participating entities to cooperate by designing an incentive-compatible revenue distribution mechanism. Reference [11] proposed a Nash–Harsanyi bargaining game revenue distribution method which focused on equality and renewable energy acceptance and designed a random hierarchical optimization method to optimize the multi-operator, multi-energy interaction, inlcuding multi-RIES operation strategies with multiple uncertainties. Reference [12] proposed a coalition division strategy based on regional energy endowment, achieving cross-regional backup resource sharing through a multi-level coalition game architecture. Reference [13] considered comprehensive demand response and carbon trading mechanisms to establish a decentralized energy exchange structure obeying cooperative game theory and distributed optimization algorithms. As for the uncertainty of renewable energy, the accuracy of renewable energy prediction results was quantified in the benefit distribution process, thereby improving the traditional Shapley value method to achieve fairer and more reasonable profit coordination.
Based on the non-cooperative game and cooperative game theories, conducting mixed game research in the integrated energy system has become an important direction [14]. Reference [15] proposed a multi-agent low-carbon optimal scheduling model based on the mixed game strategy, aiming for economic optimality and introducing carbon emission flow as a constraint, effectively guiding the low-carbon economic operation of multiple RIES. A mixed game theoretical framework for IES was proposed [16], incorporating regulatory agencies as exogenous stakeholders. The model synthesized hierarchical Stackelberg interactions—in which the IES operator acted as the leader, while the energy storage systems and end-users constituted the followers—under regulatory constraints. To achieve this multi-agent equilibrium, the study employed a composite solution methodology combining game theory with a divide-and-conquer algorithmic paradigm, thereby deriving optimal strategic responses for all participants under regulatory oversight. Additionally, a multi-IES three-layer mixed game optimal control strategy was proposed [17], taking into account multiple uncertainties. Chance-constrained programming and robust optimization methods were employed to tackle the uncertainties associated with renewable energy and electricity prices. The Stackelberg game between the IES and the energy producers was resolved by integrating KKT conditions with the Big M and McCormick methods. Meanwhile, the cooperative game between the energy producers and the IES was addressed by utilizing the ADMM algorithm. A two-tier coordinated control strategy model was devised for the IES encompassing electricity, heat, and gas in Reference [18], which was founded on multi-agent deep reinforcement learning. Specifically, the upper tier of the model constructs a multi-agent mixed game decision-making framework, leveraging the multi-agent deterministic policy gradient algorithm. Meanwhile, the lower tier established a computation model that incorporated power and gas flow dynamics. This dual-layer approach effectively addressed the high-dimensional nonlinear optimization challenges inherent in complex coupled networks. Reference [19] hypothesized that extending the energy boundary from the building-integrated photovoltaic system to e-mobility is an effective alternative to further improve integrated energy system performance. Reference [20] constructed a novel two-layer energy dispatching and collaborative optimization model for a regional integrated energy system considering the stakeholders game theory and flexible load management. Reference [21] proposed a master–slave game-based optimization strategy for pricing and scheduling within integrated electricity–heating energy systems. Initially, the transactional model between integrated energy operators and load aggregators is presented. Second, a master–slave game model for the integrated electricity–heating energy system is developed.
Overall, although existing studies have conducted numerous investigations on the optimal operation of building integrated energy systems, as summarized in Table 1, few have addressed mixed game strategies for multi-building collaborative operation considering multi-agent benefits and uncertainties simultaneously. Moreover, uncertainties regarding sources and loads and their impacts on multi-building system decision making have been extensively addressed using scenario-based stochastic or robust optimization, which lacks model-tractable chance-constrained formulation. Focusing on these research gaps, this paper proposes a bi-level day-ahead operation model for multi-buildings considering mixed games and uncertainties. Specifically, the Stackelberg game, which is a non-cooperative game, is employed for modeling the non-cooperative interaction between the energy operator and multiple buildings. The energy operator, as a leader in the non-cooperative game, maximizes its operational revenue, while building agents, as followers in the non-cooperative game, aim to minimize their own operation costs. In addition, cooperative game theory is employed for multiple building agents, which allows for energy exchange to optimize their overall costs. The main contributions of this paper are summarized as follows:
(1) A mixed game-based day-ahead operation strategy for multi-building systems is established that incorporates both Stackelberg games and cooperative games. The operation strategy is modeled using a bi-level optimization model, where the upper level maximizes benefits of the ESO, and the lower level minimizes the operation benefits of buildings.
(2) To address the uncertainties in distributed renewable generation and loads, the fuzzy chance-constrained program is employed for the established operation model. Further, an analytical model reformulation approach is presented to reformulate the fuzzy chance-constrained program into a tractable deterministic model.
(3) In consideration of the solution challenges due to the mixed-binary variables in the established bi-level optimization model, a hierarchical solution approach is presented.
The remainder of this paper is configured as follows. Section 2 introduces the energy structure and equipment models in buildings. Section 3 establishes the mixed game-based bi-level day-ahead operation model. Section 4 presents solution approaches and Shapley value-based benefit allocation. Section 5 presents case studies, and Section 6 draws conclusions.

2. Building Structure and Equipment Model

The building integrated energy system consists of integrated electricity, heating, and cooling systems. The building agent transacts with electricity and natural gas grids and satisfies multi-energy load within buildings via energy generation conversion and storage. Various devices in the system play different roles. Specifically, the cogeneration equipment mainly supplies the electricity and heat loads of the system. The refrigeration equipment mainly supplies the cooling load of the system by converting electricity and heating energy into cooling energy. The energy storage devices play the role of smoothing the load curve, and the auxiliary equipment supplements the system load when it cannot be met. Figure 1 shows the schematic diagram of the building integrated energy system.

2.1. Gas Turbines

Gas turbines equipped with a waste heat boiler can achieve the conversion of natural gas into electrical energy and thermal energy and can enhance the coupling degree of the power grid, heating network, and gas network. They are key coupling devices in the system, mainly including compressors, combustion chambers, and gas turbines. During operation, the high-pressure air processed by the compressor is mixed with natural gas and ignited to generate exhaust gas. The gas further flows into the gas turbine to drive the turbine to rotate and generate electricity. The remaining part of the exhaust gas will be reused by the waste heat boiler and used for heating, thus realizing the conversion of energy. The mathematical model of gas turbine is as follows:
P i , GT , t = η GT H G V i , GT , t
Q i , GT , h , t = P i , GT , t η HRB ( 1 η GT ) / η GT
where i represents the i-th building. P i , GT , t represents the output electrical power of the gas turbine in period t. η GT represents the rated conversion electrical efficiency of the gas turbine. H G represents the calorific value of natural gas. V i , GT , t represents the gas consumption of the gas turbine in period t. Q i , GT , h , t represents the output thermal power of the gas turbine in period t. η HRB represents the conversion efficiency of the waste heat boiler.

2.2. Absorption Chillers

An absorption chiller is a refrigeration machine that realizes a complete refrigeration cycle through the cooperation of absorption and generation devices. It is a key cooling device in the integrated energy system. It converts energy through absorbing the residual heat of gas turbines for refrigeration, improving the coupling degree of the hot water network and the cold water network, further enhancing the energy supply efficiency of the system. A lithium bromide absorption chiller is selected as an important cooling device in the system. The absorption chiller is modeled as follows:
Q i , AR , c , t = C O P AR Q i , AR , h , t
where Q i , AR , c , t represents the output cooling power of the absorption refrigeration machine in period t. C O P AR represents the energy efficiency coefficient of the absorption chiller. Q i , AR , h , t represents the input heating power of the absorption refrigeration machine in period t.

2.3. Gas Boilers

Compared with boilers fueled by coal, petroleum, and other fuels, gas-fired boilers create no pollution and are highly efficient. Gas-fired boilers can achieve energy conversion from gas to heat and can satisfy the heat requirements of the system. When the heating capacity of the gas turbine is insufficient, gas boilers can be considered to fill the gap in heat demand. Gas boilers are selected as one of the heating devices in the integrated energy system. The gas boiler is modeled as follows:
Q i , GB , h , t = η GB H G V i , GB , t
where Q i , GB , h , t represents the output thermal power of the gas boiler in period t. η GB represents the conversion efficiency of the gas boiler. V i , GB , t represents the gas consumption of the gas boiler in period t.

2.4. Electric Boilers

Electric boilers can enhance the coupling degree between the electricity grid and the heating network. Utilizing electricity as the energy source, they generate heat through resistance or electromagnetic induction principles to supply thermal energy to meet the heating demands. They display a relatively high efficiency in converting electricity to heat. When the system exhibits abundant electricity or the electricity price is low, from an economic perspective, it is advisable to consider using electric boilers to meet the shortage of heating demands. Therefore, electric boilers are regarded as one of the possible system heating devices. The electric boiler is modeled as follows:
Q i , EB , h , t = η EB P i , EB , t
where Q i , EB , h , t represents the output thermal power of the electric boiler in period t. η EB represents the heating efficiency of the electric boiler. P i , EB , t represents the input electric power of the electric boiler in period t.

2.5. Energy Storage Devices

The mathematical models of energy storage devices, e.g., batteries and heat storage tanks, are similar and can be uniformly expressed as follows:
E i , s , t = E i , s , t 1 E i , s , t 1 η s , loss Δ t + η s , char P i , s , char , t P i , s , dis , t η s , dis Δ t
where E i , s , t represents the storage capacity of the energy storage device in period t. P i , s , char , t represents the energy storage power of the energy storage device in period t. P i , s , dis , t represents the energy release power of the energy storage device in period t. η s , loss represents the self-energy consumption rate of the energy storage device. η s , char represents the energy storage efficiency of the energy storage device. η s , dis represents the energy release efficiency of the energy storage device. Δ t represents the duration of the unit scheduling period.

2.6. Electrical Chillers

The air conditioning system is the main auxiliary cooling equipment in the comprehensive energy system of buildings. When the system fails to meet the cooling demand, it will provide auxiliary cooling to meet this need. The air conditioning system is modeled as follows:
Q i , air , c , t = COP air P i , air , t
where COP air represents the energy efficiency ratio of the air conditioner. P i , air , t represents the total power consumption of the air conditioner in period t. Q i , air , c , t represents the total cooling power of the air conditioner in period t.

2.7. Electric Vehicles

Suppose that electric vehicles adopt the orderly charging and discharging mode, and there are N electric vehicles available for scheduling. For any electric vehicle, the types of its related parameters are consistent. Suppose that all the electric vehicles are equipped with lithium battery modules, and the lithium batteries are charged and discharged at a constant power level within a single period. The operational status parameters of the electric vehicles can be modeled as follows:
ε i , k = 1 t in k t t out k 0 else
where ε i , k represents the schedulable status parameter of the electric vehicle, 1 indicates that it can participate in scheduling, and 0 indicates that it cannot. t in k represents the time when electric vehicle k connects to the building. t out k represents the time when electric vehicle k leaves the building.
The actual charging and discharging power of the k-th electric vehicle at time t can be expressed as
P i , EV , t k = ε i , k η EV , char P i , EV , char , t k P i , EV , dis , t k η EV , dis
where P i , EV , char , t k and P i , EV , dis , t k represent the charging and discharging power of electric vehicle k in period t, respectively. η EV , char and η EV , dis represent the charging and discharging efficiency of the electric vehicle, respectively.
The battery charge level of electric vehicle k at time period t is
E i , EV , t k = E i , EV , t 1 k + P i , EV , t k Δ t
where E i , EV , t k represents the electricity level of electric vehicle k in period t.

3. Day-Ahead Optimal Operation Model of Multi-Buildings Based on Mixed Game Theory

3.1. Operation Framework

In the context of the electricity market enabling load-side recourse regulation, a single building system faces difficulties in improving operational energy efficiency due to its limited regulation capability to meet market requirements. Under such a background, establishing an energy interconnection framework coordinating multiple buildings presents unique advantages, which can simultaneously strengthen the general revenue of the alliance and the economic benefits of individual members, promoting the formation of a win–win situation for all parties.
In this consideration, this paper constructs a multi-building mixed game framework, i.e., Stackelberg game and cooperative game, to enable heat energy exchange among multi-buildings and power exchange with grids. Specifically, a bi-level game model including the cooperative alliance and the superior energy operator (energy system operator, ESO) is proposed. In the upper level, the ESO maximizes operation benefits via determining the power exchange between power and natural gas grids and electricity prices with buildings, while in the lower-level model, the building systems minimize total operation costs by optimizing energy purchase with the ESO. The system game framework is shown in Figure 2. It should be noted that following the methods used in many previous studies [5,15], this work ignores the network-constrained energy flow within each building energy system to formulate the operating constraints.

3.2. Upper-Level Leader Model

3.2.1. Objective Function

The leader in the leader–follower game is the ESO. The upper-level leader model is established to maximize the revenue of the ESO and dynamically optimizes the electricity prices for the power exchange between with the BIES cooperative alliance. The objective function is modeled as follows:
max F ESO = t = 1 t day I sell , t I buy , t + I heat , t
where F ESO represents the total revenue of the ESO. I sell , t represents the total revenue of the ESO from selling energy. I buy , t represents the total cost of purchasing energy from the ESO. I heat , t represents the transmission revenue paid by the thermal energy exchange between the BIES cooperation alliance to the ESO.
I sell , t = i = 1 n ε sell , t e P i , buy , t e + ε sell g V i , buy , t g + ε ESO , sell , t e P ESO , sell , t e
where n represents the number of BIES in the cooperative alliance. ε sell , t e represents the price in period t at which the ESO sells electricity to the BIES. ε sell g represents the price at which the ESO sells gas to the BIES. ε ESO , sell , t e represents the on-grid price in period t at which the ESO sells electricity to the superior power grid. P i , buy , t e represents the power purchased by BIESi from the ESO in period t. V i , buy , t g represents the volume of gas purchased by BIESi from the ESO in period t. P ESO , sell , t e represents the power sold by the ESO to the superior power grid in period t.
I buy , t = ε ESO , buy , t e P ESO , buy , t e + ε ESO , buy g V ESO , buy , t g + i = 1 n ε buy , t e P i , sell , t e
where ε buy , t e represents the price of electricity purchased by the ESO from the BIES in period t. P ESO , buy , t e represents the power purchased by the ESO from the superior power grid in period t. V ESO , buy , t g represents the volume of natural gas purchased by the ESO from the superior gas grid in period t. P i , sell , t e represents the power sold by BIESi to the ESO in period t.
I heat , t = i = 1 n 1 j = i + 1 n α h Q i j , h , t
where α h represents the coefficient of heat energy transmission cost. Q i j , h , t represents the heat power transmitted between BIESi and BIESj in period t, and its value greater than 0 indicates that BIESj transmits heat power to BIESi.

3.2.2. Constraints

To ensure the effectiveness of the strategy and prevent the BIES cooperation alliance from directly trading electricity with the higher-level power grid, bypassing the ESO, it is necessary to guarantee that the electricity prices between the ESO and the BIES cooperation alliance fall within the range of time-of-use electricity prices and grid connection prices. The following constraints are to be satisfied:
ε ESO , sell , t e < ε sell , t e < ε ESO , buy , t e ε ESO , sell , t e < ε buy , t e < ε ESO , buy , t e
Furthermore, the electricity selling price offered by the ESO to the BIES cooperative alliance also needs to comply with the following constraints:
t = 1 t day ε sell , t e t day ε ¯ sell , max e
where ε ¯ sell , max e represents the upper limit of the average electricity selling price.

3.3. Lower-Level Follower Model

3.3.1. Objective Function

The follower in the leader–follower game is a cooperative alliance composed of multiple BIES. BIES form a BIES alliance based on the electricity prices decided by the ESO in the form of a cooperative alliance, and the objective function is to minimize the overall operating cost of the cooperative alliance.
min F BIES = t = 1 t day i = 1 n C i , e , t + C i , gas , t + C i , om , t + C i , c , t + C tp , t
where F BIES represents the total operating cost of the BIES cooperation alliance. C i , e , t represents the purchase cost of electricity for BIESi in the cooperation alliance in period t. C i , gas , t represents the purchase cost of gas for BIESi in the cooperation alliance in period t. C i , om , t represents the operation and maintenance cost for BIESi in the cooperation alliance in period t. C i , c , t represents the compensation cost for the discharge of electric vehicles by BIESi in the cooperation alliance in period t. C tp , t represents the heat power interaction cost among various BIES in the cooperation alliance in period t.
C i , e , t = ε sell , t e P i , buy , t e ε buy , t e P i , sell , t e
where P i , buy , t e represents the electric power purchased by BIESi from the ESO in period t within the cooperation alliance. P i , sell , t e represents the electric power sold by BIESi to the ESO in period t within the cooperation alliance.
C i , gas , t = ε sell g V i , GT , t + V i , GB , t
where V i , GT , t represents the volume of natural gas consumed by BIESi in the gas turbine of the cooperation alliance in period t. V i , GB , t represents the volume of natural gas consumed by BIESi in the gas boiler of the cooperation alliance in period t.
C i , om , t = λ PV P ˜ i , PV , t + λ GT P i , GT , t + λ GB Q i , GB , h , t + λ EB Q i , E B , h , t + λ air Q i , air , c , t + λ AR Q i , AR , c , t + λ BT P i , BT , dis , t + P i , BT , char , t + λ HS P i , HS , dis , t + P i , HS , char , t
where λ PV , λ GT , λ GB , λ EB , λ air , and λ AR represent the unit operation and maintenance costs of photovoltaic, gas turbine, gas boiler, electric boiler, air conditioner, absorption refrigeration machine, respectively, along with other equipment, of each BIES in the cooperation alliance. λ BT and λ HS represent the unit power storage or release operation and maintenance costs of each BIES’s battery and heat storage tank.
C i , c , t = λ c k = 1 N P i , EV , dis , t k
where P i , EV , dis , t k represents the discharge power of electric vehicle k in period t within the cooperative alliance BIESi.
Suppose that the thermal pipelines required for the BIES’s interconnection belong to the ESO. When the BIESs exchange thermal energy with each other, transmission fees should be paid to the superior ESO according to the exchanged thermal power.
C tp , t = i = 1 n 1 j = i + 1 n α h Q i j , h , t
where α h represents the coefficient of heat energy transmission cost. Q i j , h , t represents the heat power transmitted between BIESi and BIESj in period t, and its value greater than 0 indicates that BIESj transmits heat power to BIESi.

3.3.2. Constraints

In the lower-level model, the considered constraints are those of each BIES in the cooperative alliance, including system power balance constraints, upper and lower limits constraints for system power purchase and gas purchase, constraints on the upper and lower limits of equipment output, constraints on the ramping of equipment output, constraints related to energy storage equipment, constraints for electric vehicles, and upper and lower limit constraints for thermal interaction power.
The power balance constraints for each building system are as follows:
P i , e , t + P ˜ i , PV , t + P i , GT , t + P i , s , dis , t + P i , EV , dis , t = P i , air , t + P i , EB , t + P ˜ i , L , t + P i , s , char , t + P i , EV , char , t
where P ˜ i , L , t represents the fuzzy representation of the system electric load power in period t. P i , e , t = P i , buy , t e P i , sell , t e .
The thermal power balance constraints for each building system are as follows:
Q i , GT , h , t + Q i , GB , h , t + Q i , EB , h , t + Q i , s , dis , t + j = 1 j i n Q i j , h , t = Q i , AR , h , t + Q ˜ i , L , h , t + Q i , s , char , t
where Q ˜ i , L , h , t represents the fuzzy representation of the system heating load power in period t.
The cold power balance constraints for each building system are as follows:
Q i , AR , c , t + Q i , air , c , t = Q ˜ i , L , c , t
where Q ˜ i , L , c , t represents the fuzzy representation of the system cooling load power in period t.
When a building purchases electricity from the external power grid, the power purchased at any given time period should fall within a certain limit range:
0 V i , t V max
where V i , t = V i , GT , t + V i , GB , t . V max represents the upper limit of natural gas consumption.
Controllable equipment includes gas turbines, absorption chillers, air conditioners, gas boilers, electric boilers, etc. Their output upper and lower limit constraints are similar in form:
P s min P i , s , t P s max
where P s max and P s min represent the upper and lower limits of the output of controllable equipment s. P i , s , t represents the output of controllable equipment s in period t.
The ramping constraints of gas turbines and gas boilers are as follows:
Δ P GT min Δ t P i , GT , t + 1 P i , GT , t Δ P GT max Δ t
Δ Q GT , h min Δ t Q i , GT , h , t + 1 Q i , GT , h , t Δ Q GT , h max Δ t
Δ Q GB , h min Δ t Q i , GB , h , t + 1 Q i , GB , h , t Δ Q GB , h max Δ t
where Δ P GT max , Δ Q GT , h max , Δ Q GB , h max and Δ P GT min , Δ Q GT , h min , and Δ Q GB , h min represent the upper and lower limits of the ramp power of the gas turbine and the gas boiler, respectively.
The mathematical models of the energy storage devices are similar and can be represented by a unified model. During operation, they are subject to constraints such as the capacity of the energy storage devices, the upper and lower limits of charging and discharging power, the charging or discharging states, and the return of the stored energy to the initial state at the end of the dispatch horizon. The specific relationships are as follows:
E min E i , s , t E max
0 P i , s , char , t α i , char , t P char max
0 P i , s , dis , t α i , dis , t P dis max
α i , char , t + α i , dis , t 1
E i , s , 0 = E i , s , T
where E max and E min represent the upper and lower limits of the capacity of the energy storage equipment, respectively. P char max and P dis max represent the upper limits of the charging and discharging power of the energy storage equipment, respectively. α i , char , t and α i , dis , t represent the state quantities of the energy storage equipment of building i characterized by the energy storage equipment, which are 0–1 variables; 1 indicates that the energy storage device is in the charging and discharging state, and 0 indicates that it is in the state of stopping charging and discharging. E i , s , 0 and E i , s , T represent the energy storage capacity of building i at time 0 and time T, respectively.
The constraints for electric vehicles are similar to those for energy storage. Moreover, assuming that the expected SOC value of the user when electric vehicle k leaves the building is S exp , k , then
E i , EV , t out k k S exp , k E i e , EV k
where E i , EV , t out k k represents the electricity quantity of electric vehicle k when it leaves the building i. E e , EV k represents the rated capacity of electric vehicle k.
Furthermore, the interaction of heat power among various BIESs is restricted by factors such as the safety of transmission pipelines, and therefore, certain constraints need to be imposed on their transmission power.
Q i j , h , max Q i j , h , t Q i j , h , max
where Q i j , h , max represents the maximum transmission power of thermal power, and the positive or negative sign indicates the direction of power transmission.

3.4. Fuzzy Chance-Constrained Model Reformulation

PV power output and loads in building energy systems show uncertainties in the day-ahead decision-making process. This paper models PV power output and loads as fuzzy parameters and then establish the day-ahead operation model using fuzzy chance constraints. The fuzzy optimization is as follows:
min f x s . t .   g x , ξ 0
where f x represents the objective function. g x , ξ represents the constraints. x represents the decision variable. ξ represents the fuzzy parameters.
The fuzzy chance-constrained programming accepts that the constraints do not always hold but hold under the preset confidence level; that is
C r g x , ξ 0 α
where α represents the confidence level, and C r g x , ξ 0 is the possibility of the occurrence of constraint condition g x , ξ 0 .
Specifically, the fuzzy parameters are handled using the triangular fuzzy membership function, as shown in Figure 3. The triangular fuzzy membership function is characterized by a single peak, and its peak point of membership corresponds to the predicted value point. This special mathematical property represents a high degree of trust in the predicted value.
The expression of the triangular fuzzy membership function is as follows:
y ξ = 0 0 < ξ < r F 1 ξ r F 1 r F 2 r F 1 r F 1 ξ r F 2 r F 3 ξ r F 3 r F 2 r F 2 ξ r F 3 0 ξ > r F 3
where r F 1 , r F 2 , and r F 3 represents the corresponding membership parameters. Among them, the membership degree parameters are related to the predicted values of uncertain parameters, as follows:
r F k = ω F k P Fpre , k = 1 , 2 , 3
where PFpre denotes the predicted value of uncertain parameters, and ω F k represents the fuzzy degree, which can be determined based on historical data [22].
The fuzzy chance-constrained program can be reformulated into a deterministic model in an analytical manner, which leads to high solution efficiency in comparison with that of sample-based approaches [23]. Specifically, assuming the constraint condition g x , ξ is expressed in the following mathematical form:
g x , ξ = h 1 x ξ 1 + h 2 x ξ 2 + h n x ξ n + h 0
where ξ n represents the relevant fuzzy parameter of the fuzzy membership function, and ξ F = r F 1 , r F 2 , r F 3 .
Define the function as follows:
h k + x = h k x h k x 0 0 h k x < 0
h k x = 0 h k x 0 h k x h k x < 0
where k = 1 , 2 , , n .
When the confidence level is α 0.5 , the clear equivalent class of the fuzzy chance-constrained C r g x , ξ 0 α with respect to the credibility is
2 2 α k = 1 n r k 3 h k + x r k 2 h k x + 2 α 1 k = 1 n r k 4 h k + x r k 1 h k x + h 0 x 0
On this basis, Formulas (23)–(25) will be transformed into the aforementioned form in (45). Therefore, the established day-ahead operation model considering uncertainties in source and load is reformulated into a fuzzy chance-constrained program.

4. Solution Method and Shapley Value-Based Benefit Allocation

4.1. Solution Method

The established day-ahead optimal operation model of multi-buildings based on mixed game theory is a bi-level optimization with binary variables in the lower-level model. The solution methods for the bi-level optimization models mainly include two types, that is, an analytical solution based on KKT conditions [24] and heuristic intelligent algorithms [25]. However, when binary decision variables exist in the lower-level model, the strong duality does not hold, disabling the complementary slackness conditions and the KKT-based reformulation of the original bi-level optimization model, while intelligent optimization algorithms offer unique advantages in handling bi-level optimization with binary variables. They can effectively avoid the dimension curse faced by traditional analytical methods and provide a feasible solution scheme for complex hierarchical optimization problems.
To tackle the bi-level optimization model with mixed-integer variables, this paper employs a hierarchical approach for the established bi-level optimization model. Figure 4 shows the flowchart of the mixed game solution. Specifically, the upper layer adopts the genetic algorithm for the solution, where the optimal energy purchase quantity and the electricity prices are optimized and sent to the lower-level mode. The lower-level model, with electricity prices from the ESO, is a mixed-integer linear program, which can be solved directly using off-the-shelf solvers, and the optimized energy exchange with the ESO would be sent to the upper-level. The iterative solution approach terminates after reaching a predefined iteration number. The hierarchical solution approach requires only the exchange of necessary coupling variables between hierarchical models, thereby preserving the information privacy of individual agents. Such privacy-preserving characteristics significantly improve the feasibility for real-world applications, and the hierarchical structure helps reduce the computational complexity.

4.2. Shapley Value Method-Based Benefit Allocation

After solving the established game-based operation model, the costs and benefits are re-attributed according to the marginal contributions of each building. The Shapley value method is employed. Specifically, suppose that the set of participants involved in the game is N = 1 , 2 , , n , and any cooperative subset of the participant set N is S. Then, the maximum benefit of all participants participating in the cooperation is V N , and the cooperative benefit of set S is V S . This satisfies
V ϕ = 0 , V S 1 S 2 V S 1 + V S 2 , S 1 S 2 = ϕ
When employing the Shapley value to allocate benefits among buildings, the marginal contribution of building i for participating in set S is expressed as follows:
φ i V = ω S V S V S i ω S = S 1 ! n S ! n !

5. Case Studies

5.1. Case Data

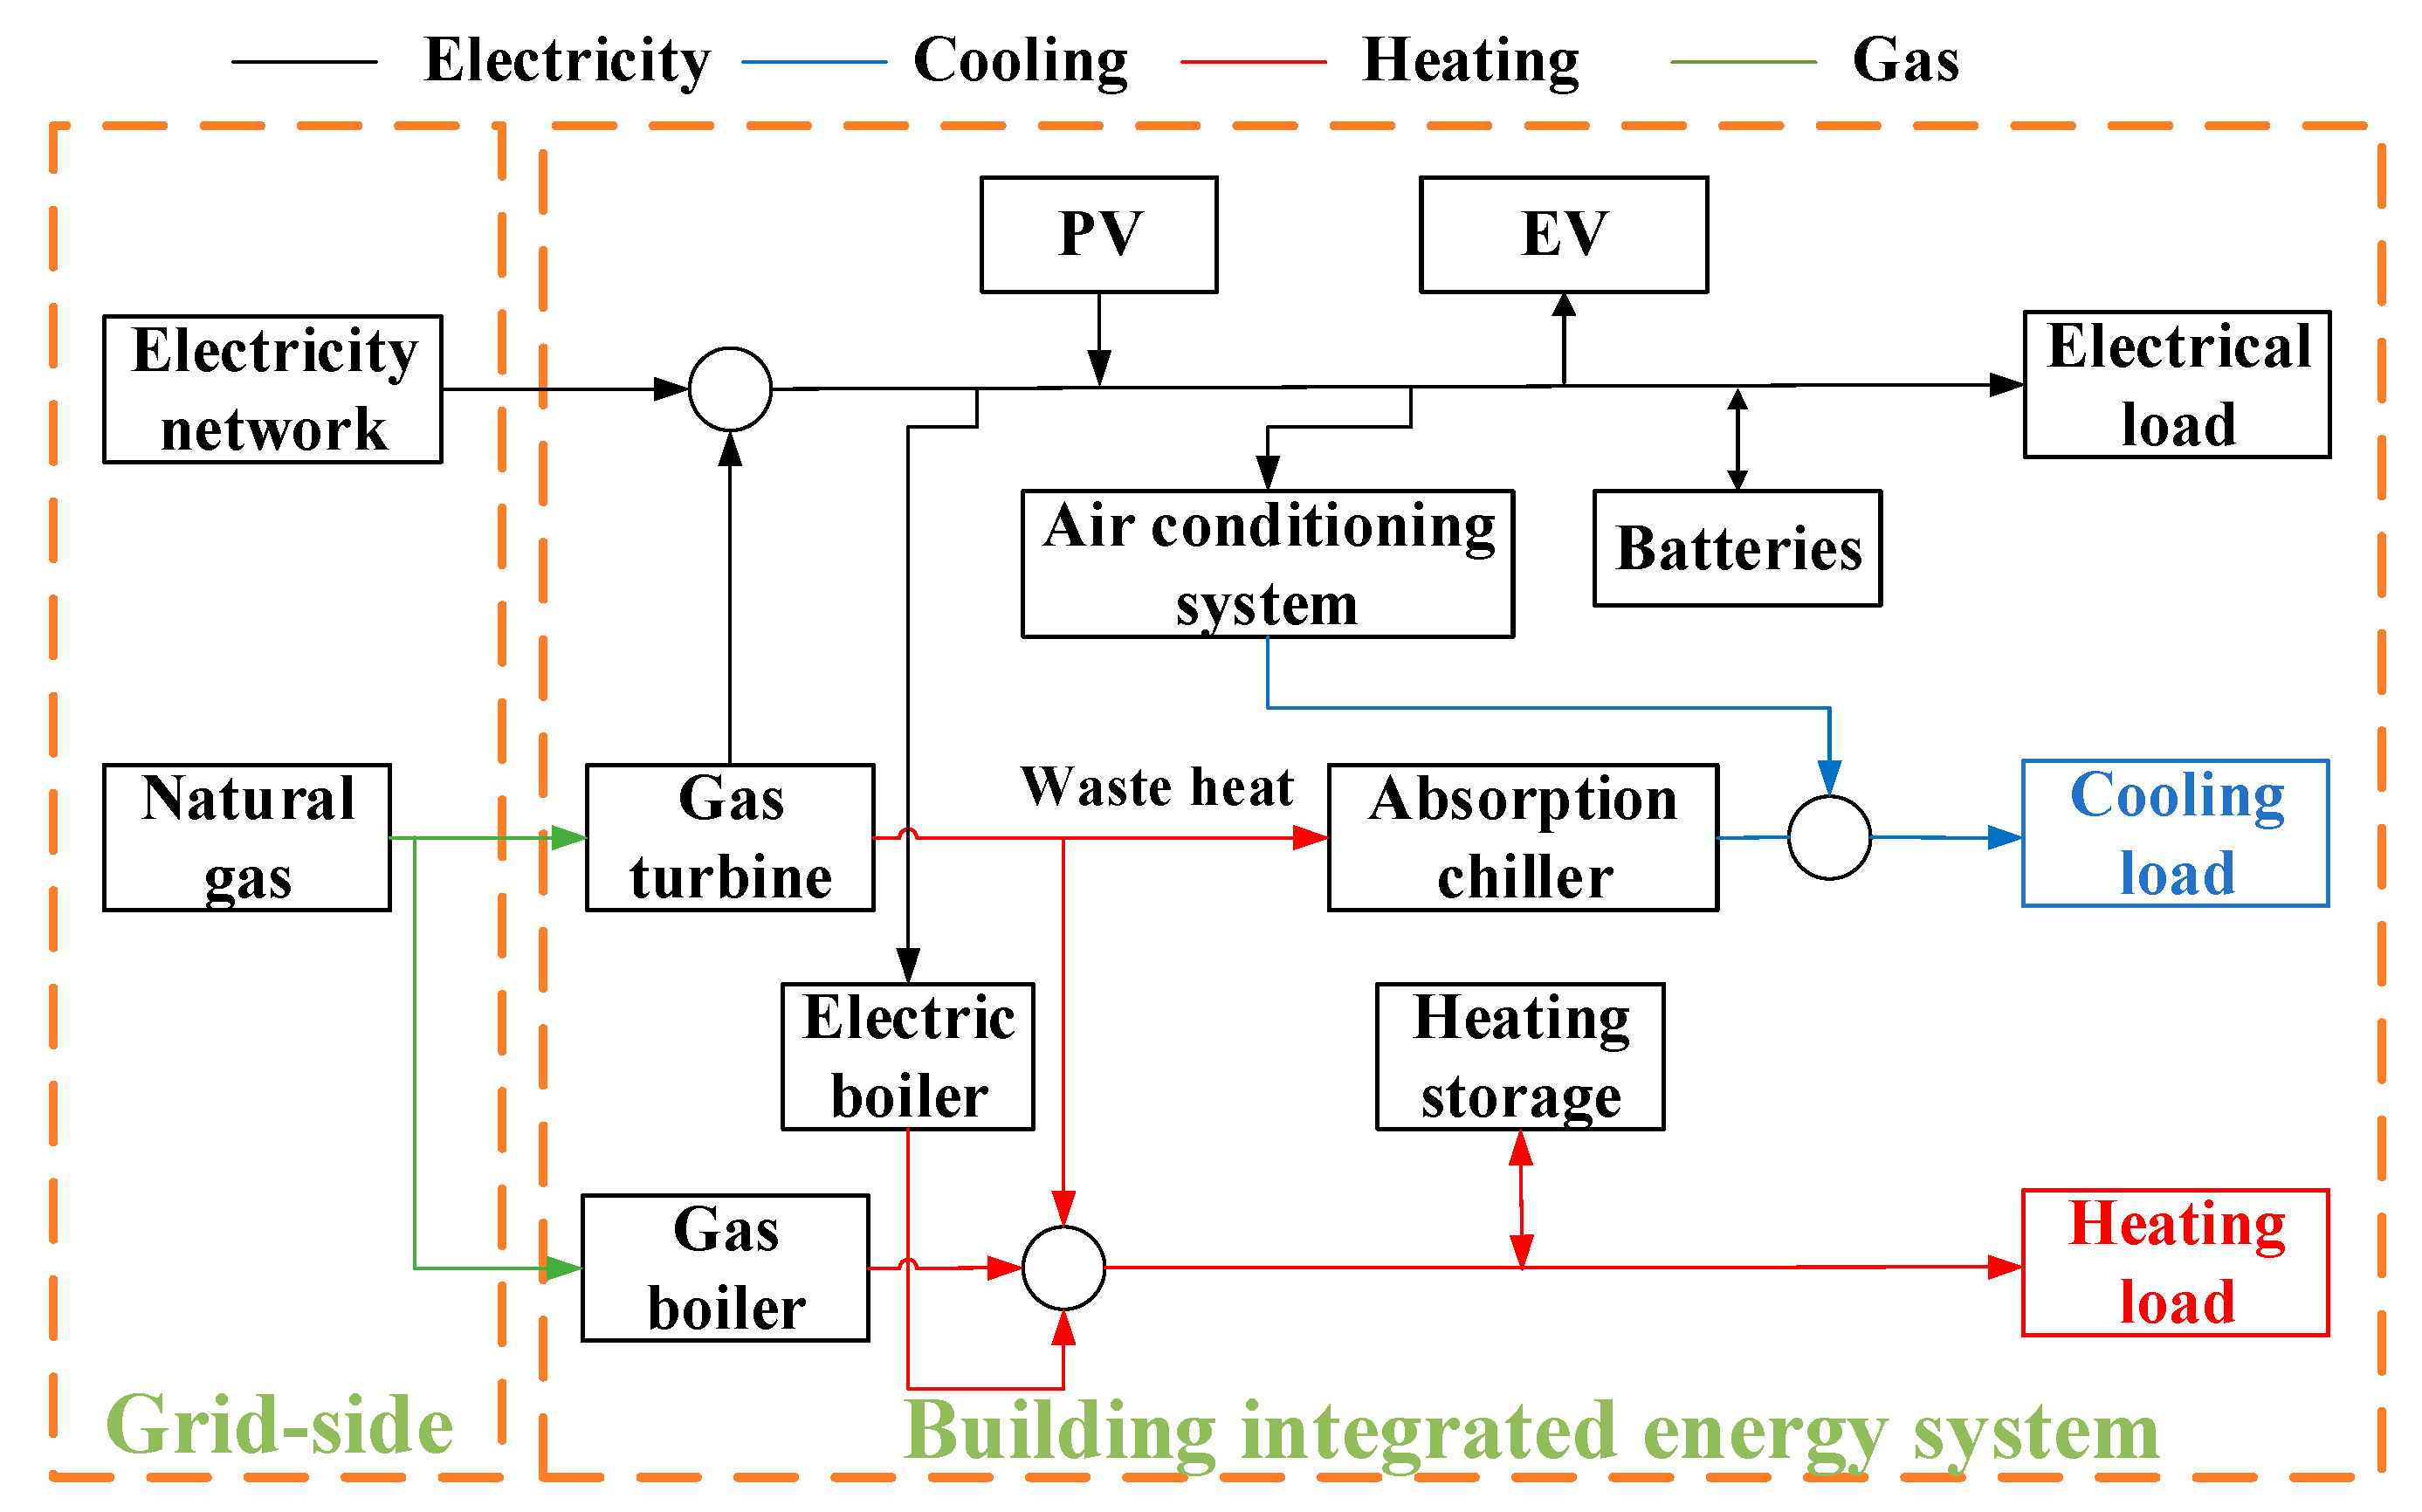
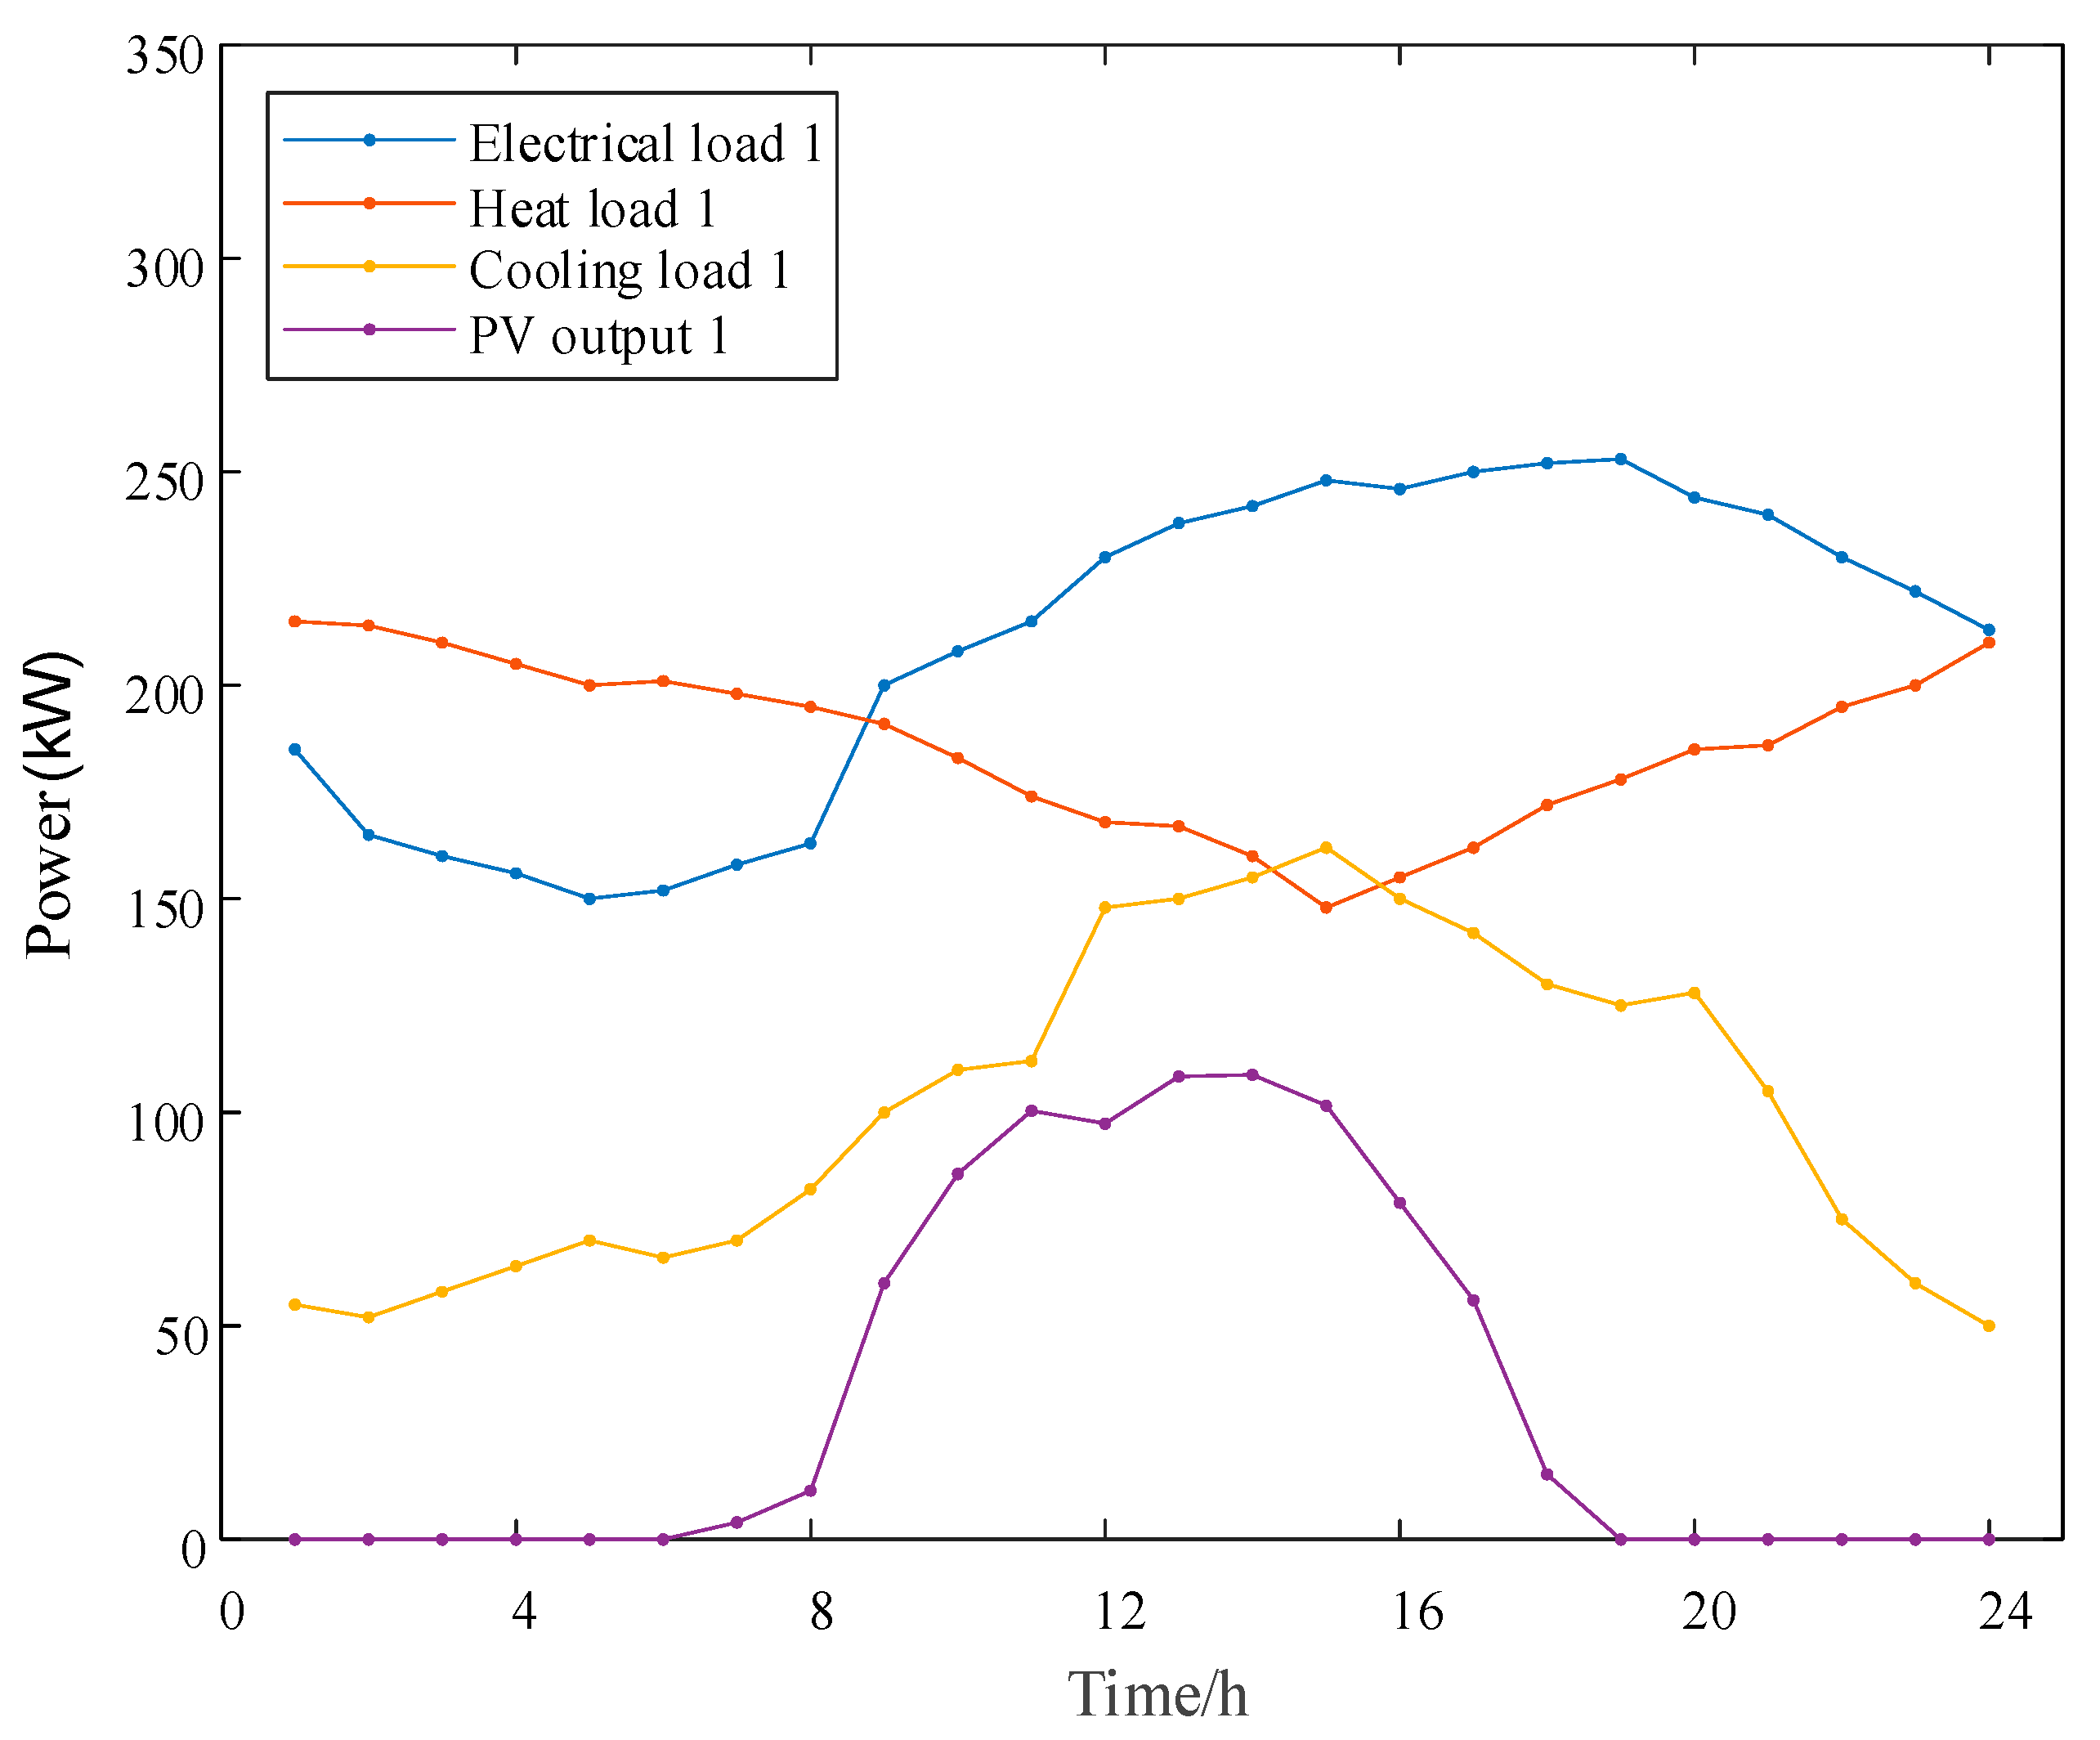
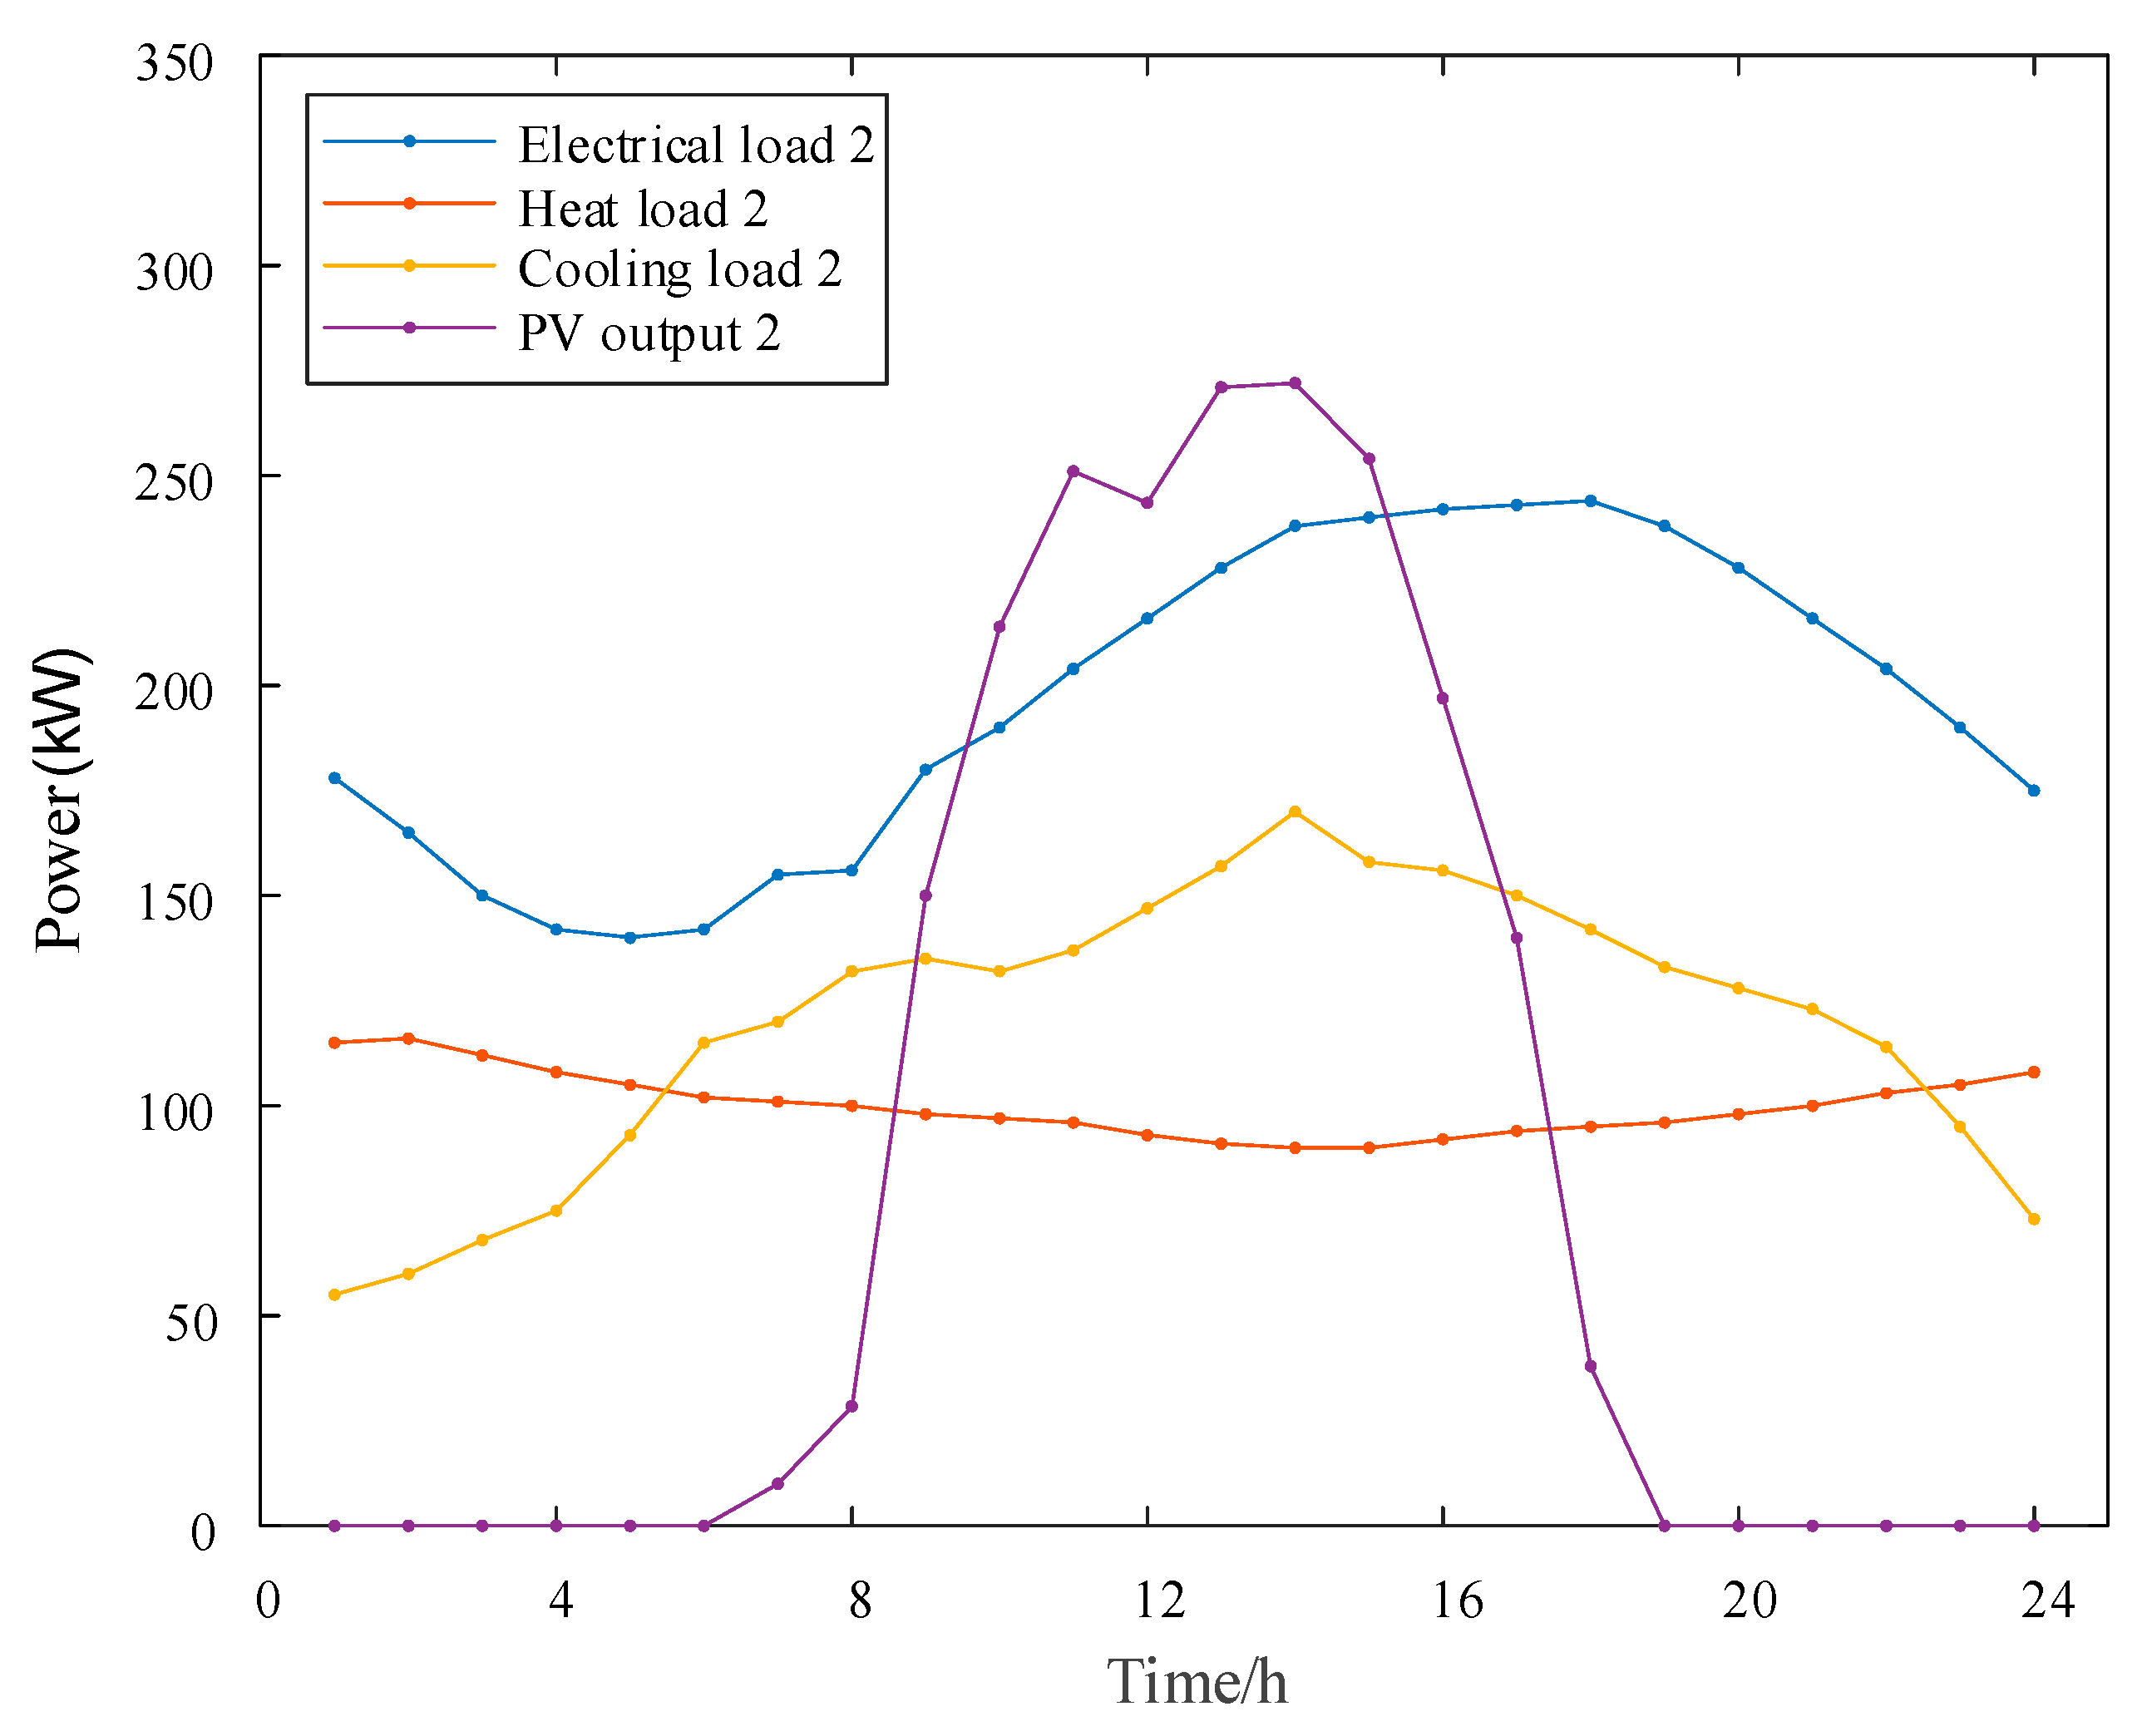
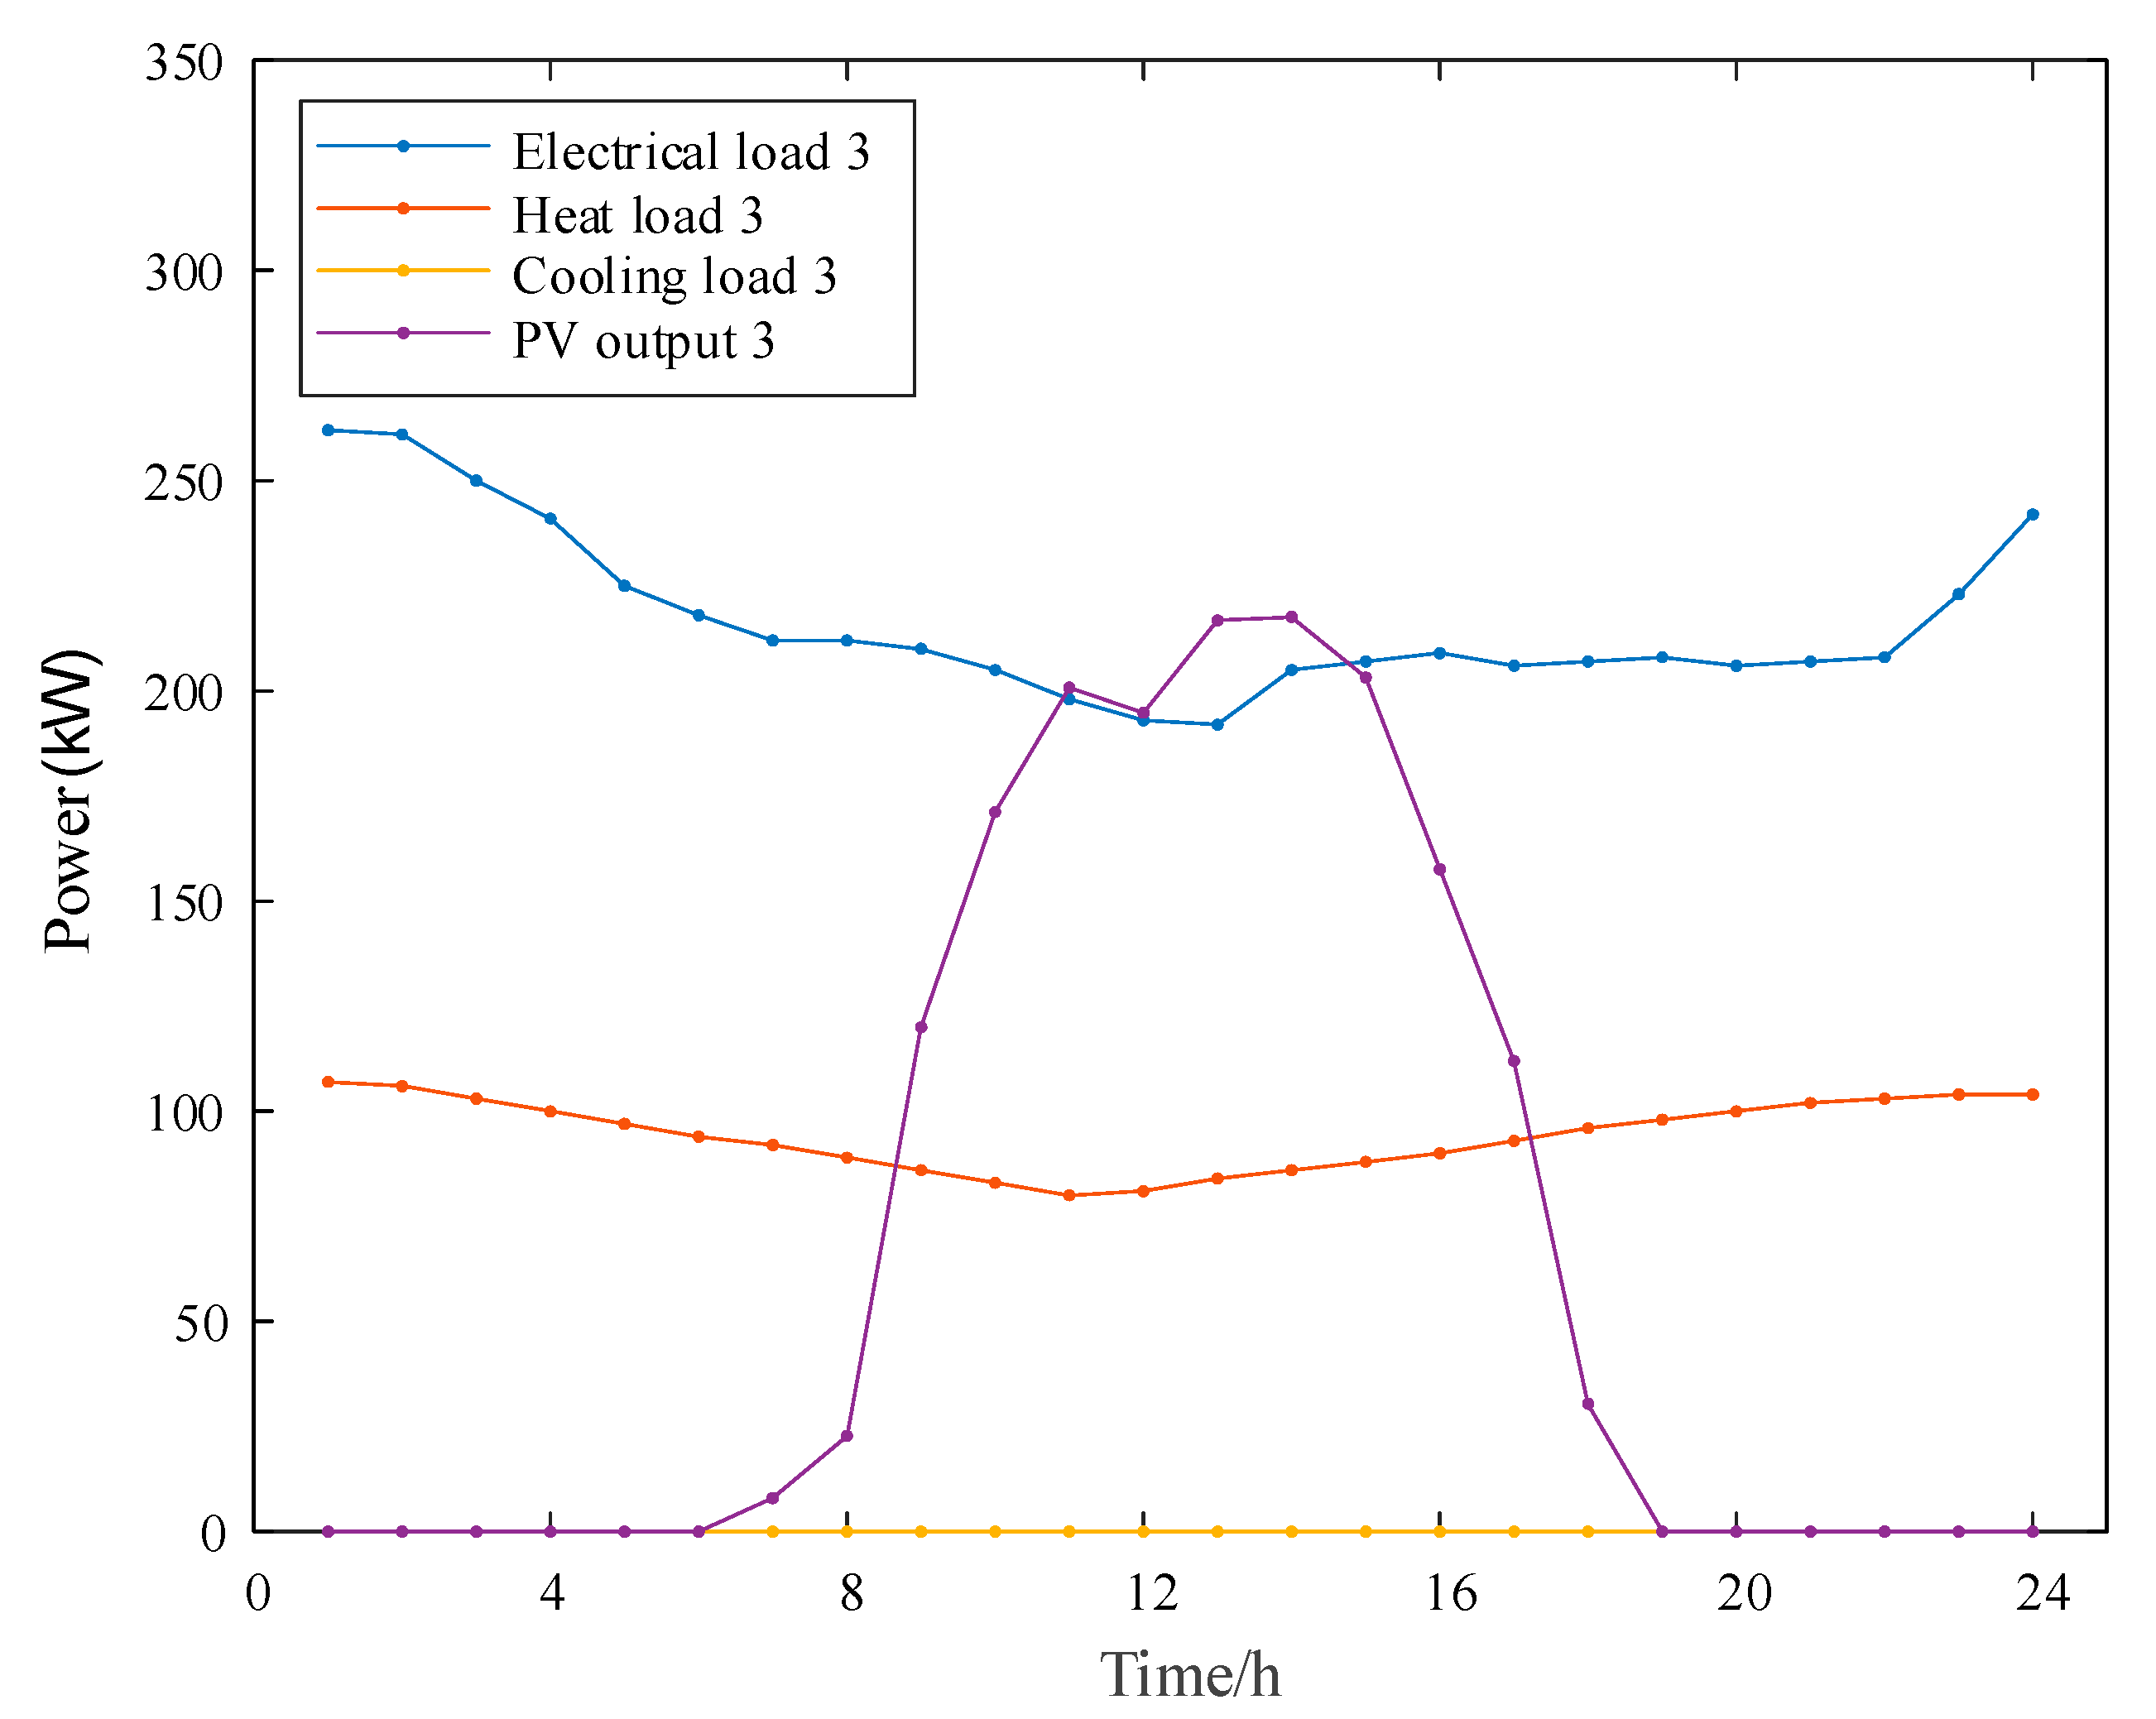
We conduct case studies on multiple building integrated energy systems within a certain “smart town” in East China. The multi-building system consists of three buildings that are located adjacent to each other under the management of the same energy operator. The buildings are connected through a heat pipe network to achieve the heat energy exchange between them. The energy flow and equipment within each building are shown in Figure 1, including equipment such as distributed PV generators, gas turbines, electric boilers, battery and heating energy storage, etc. Note that we ignore the network constraints within energy systems. We select one day with an hourly resolution for the multi-building system for the case studies. The daily load and renewable generation data in each building are presented in Figure A1, Figure A2 and Figure A3 in Appendix A. The quantity and technical and economic information for the equipment in each building is presented in Table A1 in 
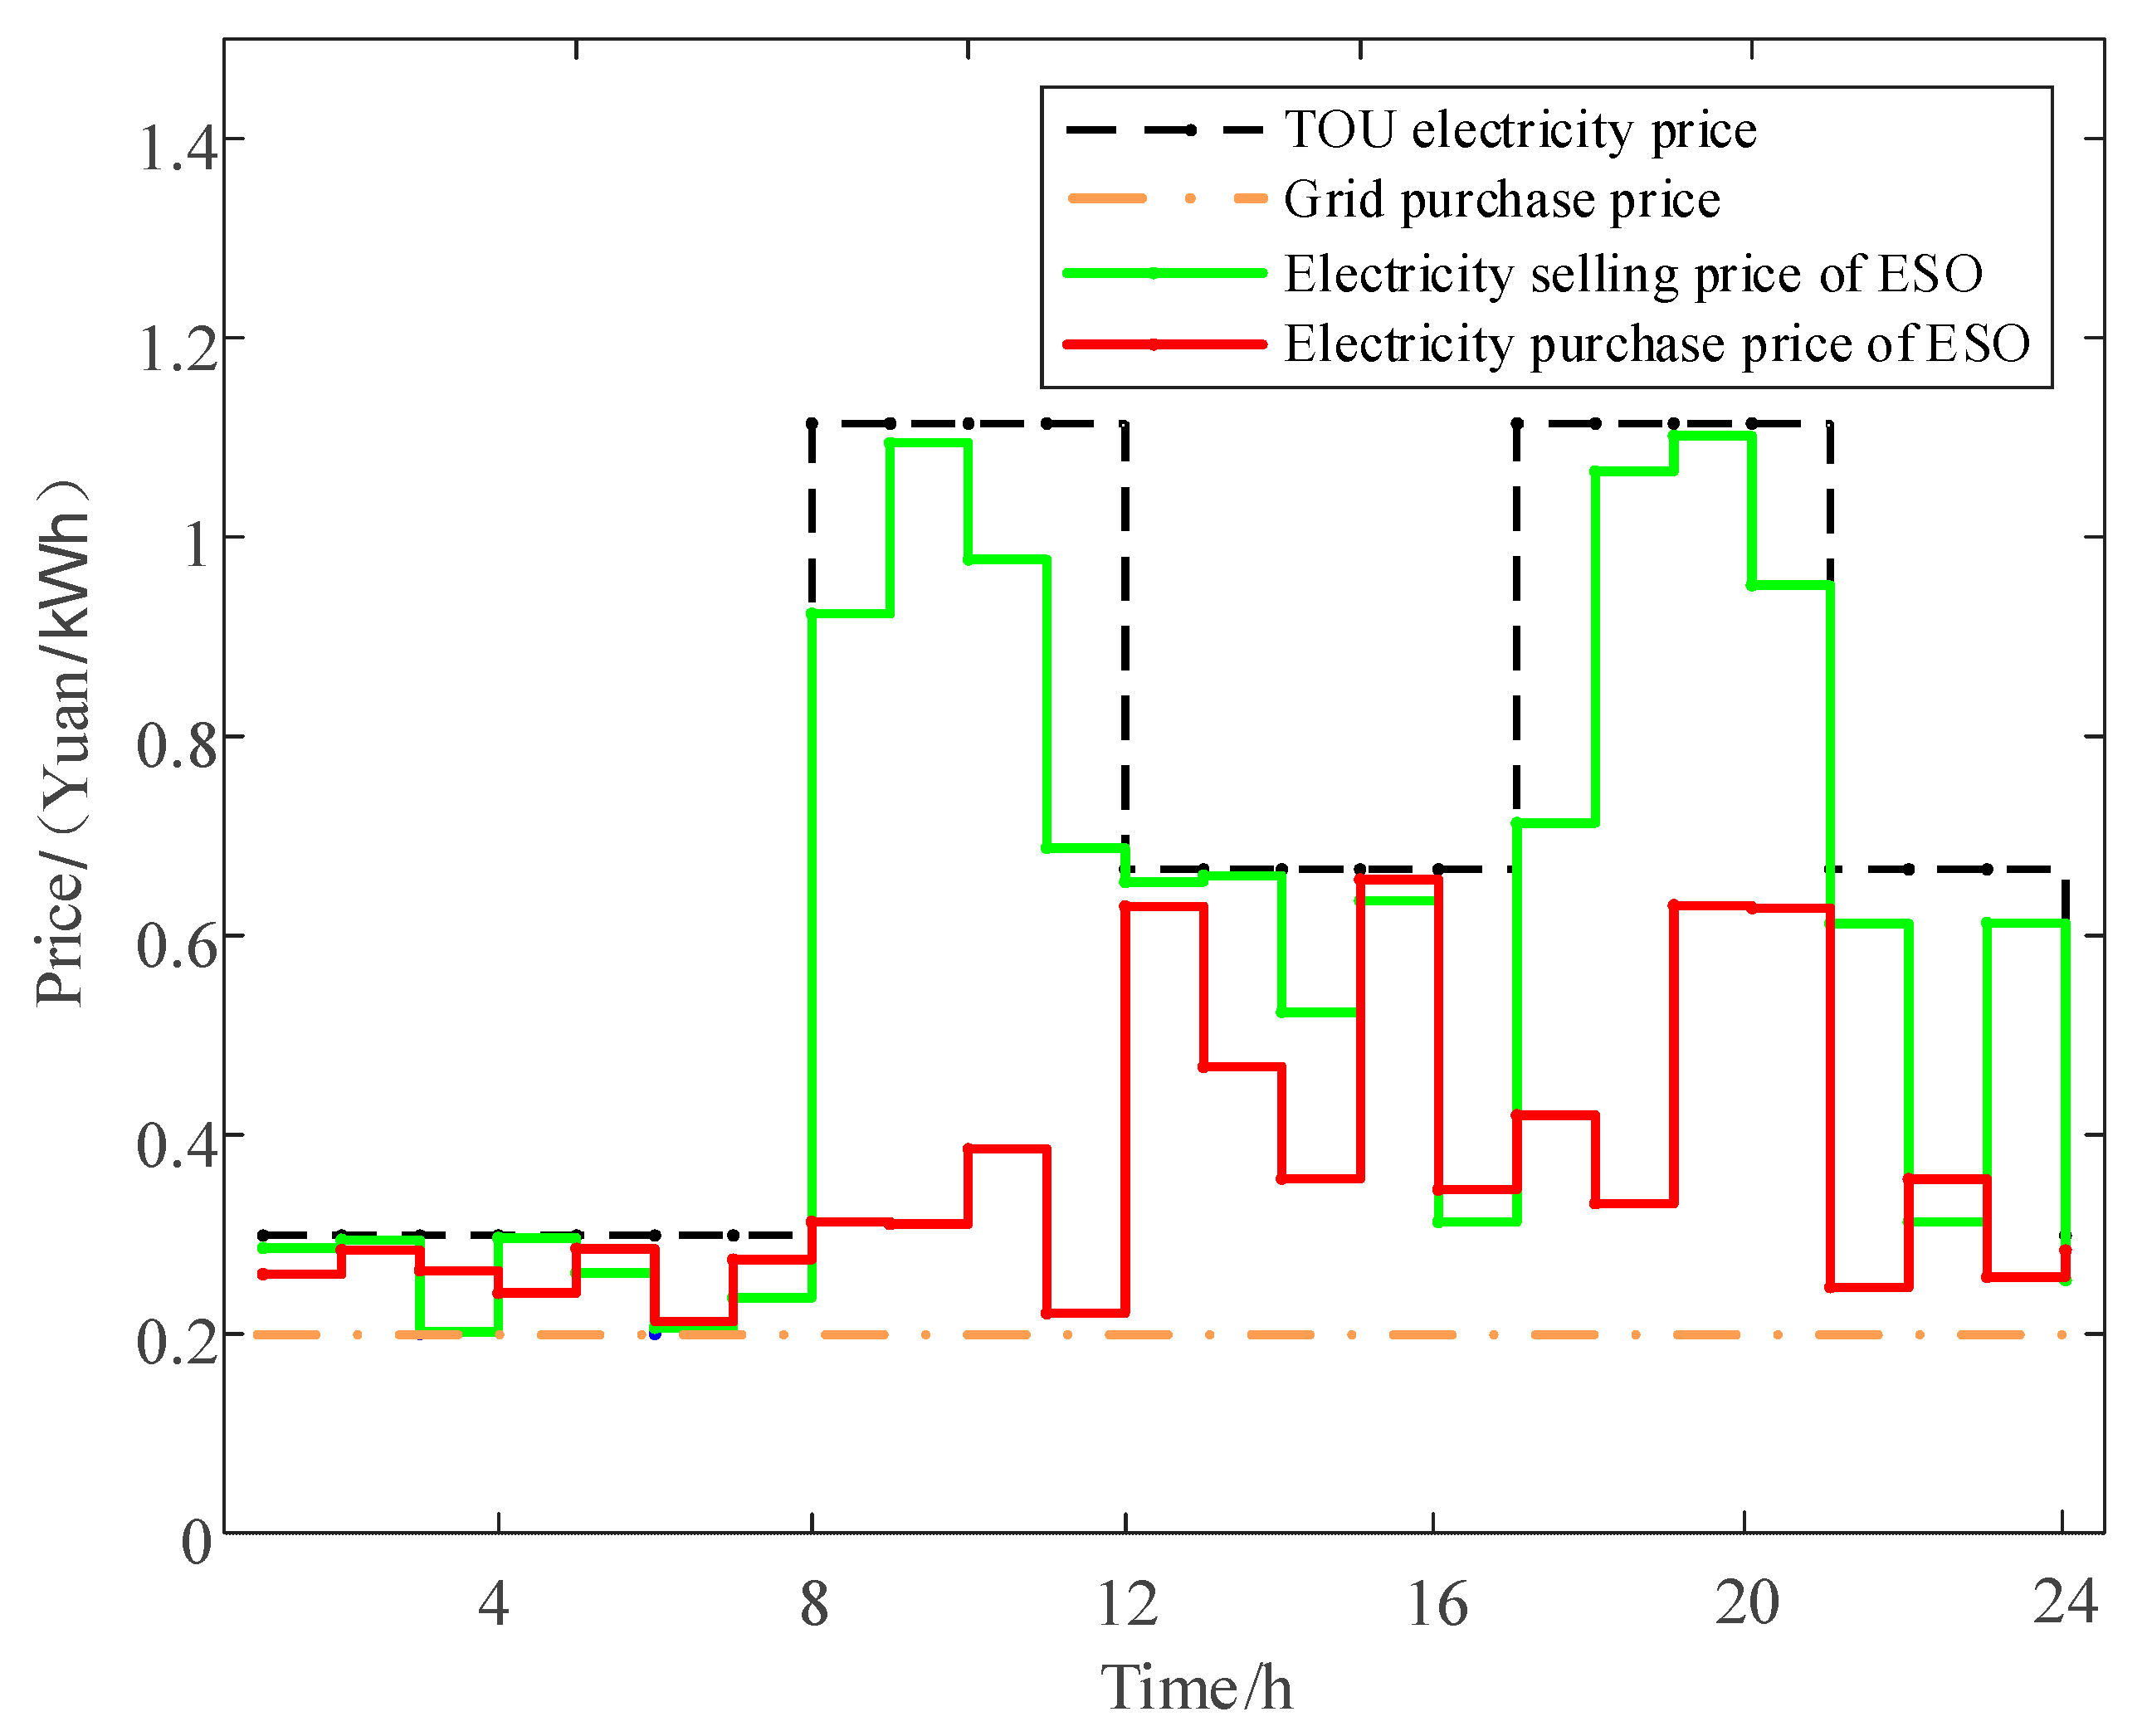
Appendix A. The TOU electricity prices from the power grids are shown in Figure 5. The prices of electricity exchange between the ESO and the buildings are to be optimized. To better demonstrate the cooperative game-based cooperation among multiple buildings, we select three buildings for operation and compare the effectiveness of the cooperative game-based scheduling among three buildings and that for only two buildings.

5.2. Case Study Results

The optimal prices of the upper-level leader ESO are illustrated in Figure 5. In Figure 5, the black dotted line and the orange dotted line represent the time-of-use electricity price that the ESO purchases from the superior power grid and the grid-connected electricity price that the ESO sells to the superior power grid, respectively. The ESO formulates its price strategy within the two price ranges to provide a more favorable price for the BIES cooperation alliance compared to that of the power grid.
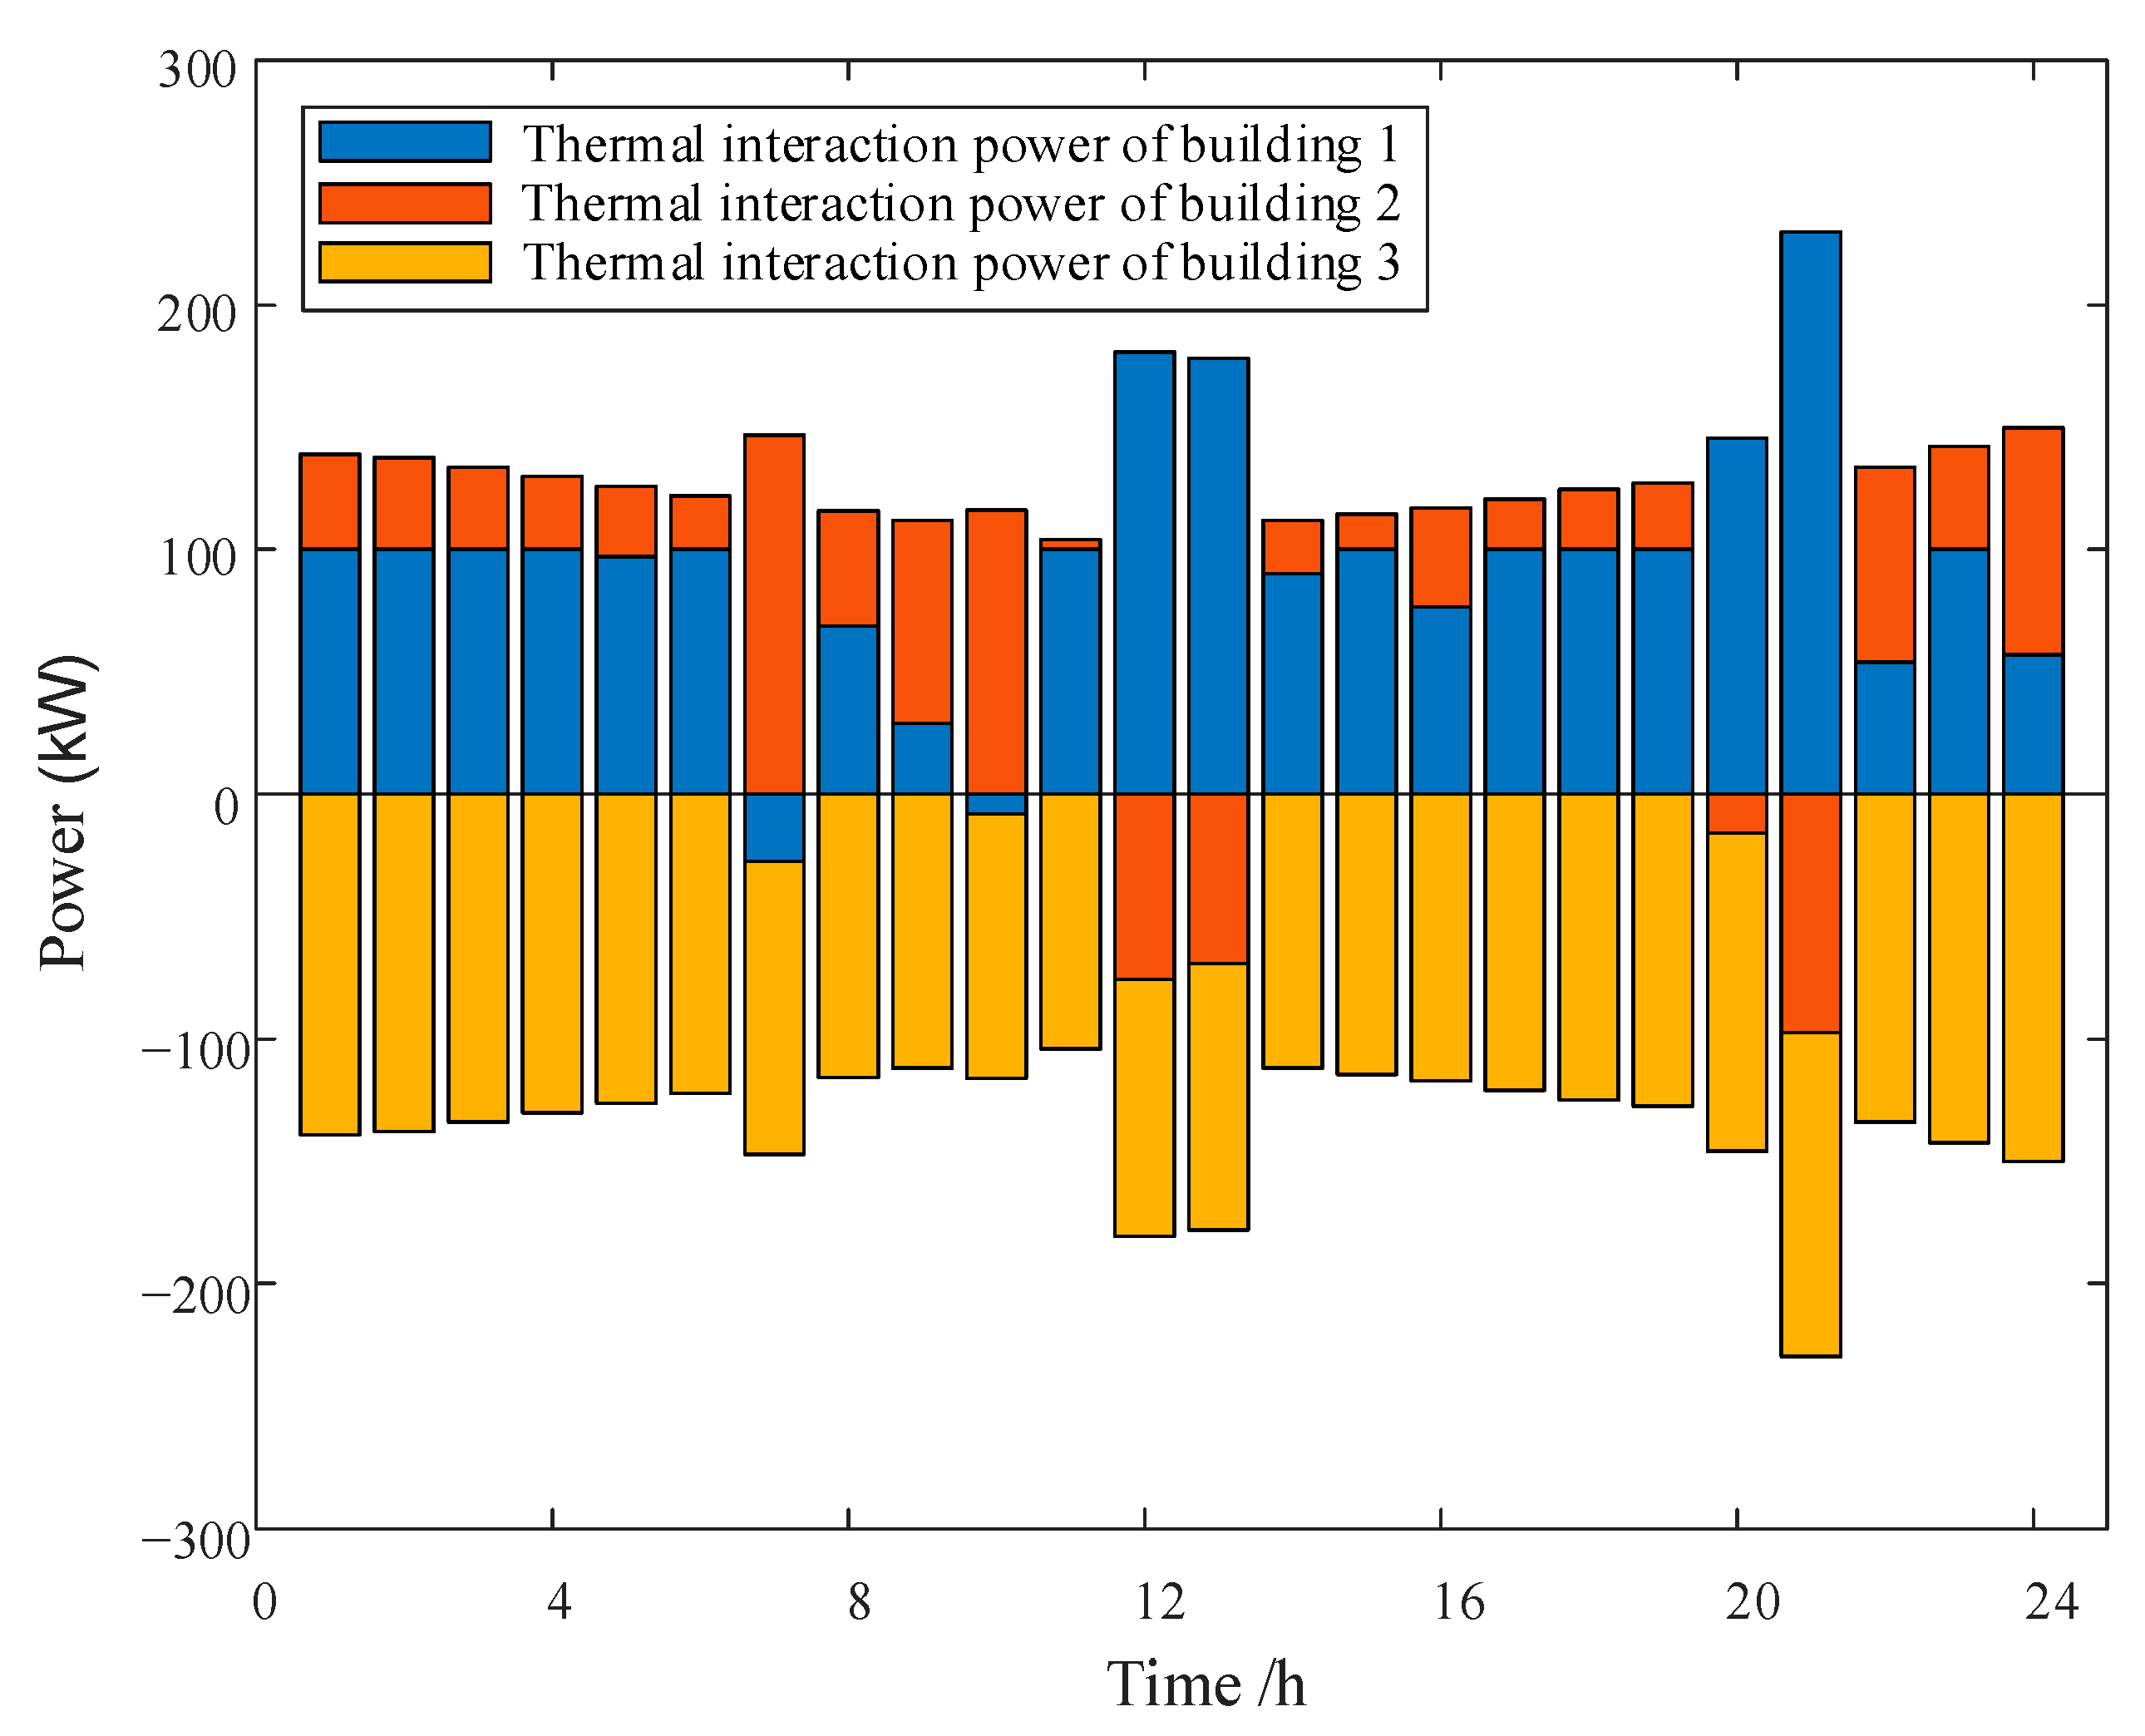
The results of the thermal power interaction scheduling by the BIES cooperative alliance are shown in Figure 6. The results in Figure 6 reveal that the thermal energy supply of both building 1 and building 2 expressed an over-supply state for most time periods, while the thermal energy supply of building 3 displayed an insufficient supply state for most time periods. Therefore, building 3 mainly received the interaction thermal energy from building 1 and building 2. Since building 3 was the main entity consuming the excess thermal energy in the alliance, it made a relatively high marginal contribution to the alliance. Thus, compared with building 1 and building 2, more benefits should be allocated to building 3, based on its degree of contribution in the final benefit distribution, which is consistent with the final benefit distribution result. After multiple buildings joined the cooperative alliance, the cost of external purchased energy decreased, stimulating energy complementarity sharing and collaborative optimization operation among the buildings. Through the thermal energy pipelines among the buildings, the optimized scheduling of thermal energy within the multi-building cooperative alliance area was achieved. The proposed strategy contributes to improving the overall economy, energy utilization efficiency, and overall flexibility of the multi-building integrated energy system.

5.3. Analysis of the Benefit Distribution Allocation

To verify the validity and accuracy of the proposed mixed game optimization model, four scenarios are set up for comparative analysis:
Scenario I: Each multi-building operates independently, adopting time-of-use electricity prices.
Scenario II: Each building interacts with the ESO, without cooperation among buildings.
Scenario III: Multi-buildings conduct mixed game optimization operation, without benefit distribution.
Scenario IV: Multi-buildings conduct mixed game optimization operation and adopt the Shapley value method for benefit distribution.
Table 2 shows the cost results when two buildings in the alliance cooperate. The cost results of each building in the BIES cooperative alliance under different scenarios are shown in Table 3.
By comparing the results of Scenario I and Scenario III, it is noticeable that the operating costs of building 1, building 2, and building 3 in Scenario III have decreased by 530.3 CNY, 679.5 CNY, and 1558.1 CNY, respectively. The total operating cost of the BIES cooperation alliance has decreased by 2678.9 CNY, showing a reduction of 15.61%. This indicates that the adoption of mixed game optimization for operation can effectively reduce the total operating cost of the BIES cooperation alliance and enhance the economic efficiency of the system.
By comparing Scenario I, Scenario II, and Scenario III, it can be observed that when only the master–slave game (Scenario II) is adopted, the overall operating cost of the multi-building system decreased by 11.11%, while when the mixed game (Scenario III) is adopted, the overall operating cost of the multi-building system decreased by 15.61%. Compared with Scenario I, Scenario III has further decreased by 3.98%, and the revenue of the energy operator has further increased by 10.31% after adopting the mixed game. These outcomes show that the proposed mixed game strategy can further reduce the operating cost of the multi-building system and enhance the revenue of the energy operator.
Furthermore, compared with the mode in which multiple buildings operate independently under the time-of-use electricity pricing system, the system operation cost of the BIES using the mixed game optimization method has been reduced by 2812.8 CNY, accounting for 17.24% of the total cost. This indicates that through the lower-level cooperative game, each BIES optimizes the energy output of its internal equipment, reduces energy transactions with the superior power supply network by increasing energy interaction among the BIESs, and enhances the overall economic efficiency of the cooperative alliance. Moreover, the energy operator can obtain certain benefits.
From Table 2 and Table 3, it can be concluded that when building 1 and building 2 form a cooperative alliance and building 3 operates independently, the total operation cost of multiple buildings is 16,126.5 CNY. When building 3 joins the cooperative alliance, the total operation cost of multiple buildings becomes 14,485.1 CNY. Similarly, when building 1 and building 3 form a cooperative alliance and building 2 operates independently, the total operation cost of multiple buildings is 15,439.5 CNY. When building 3 joins the cooperative alliance, the total operation cost of multiple buildings becomes 14,485.1 CNY. When building 2 and building 3 form a cooperative alliance and building 1 operates independently, the total operation cost of multiple buildings is 15,482.8 CNY. When building 3 joins the cooperative alliance, the total operation cost of multiple buildings becomes 14,485.1 CNY. It can be seen that whenever a subject participates in the cooperative alliance, the total operation cost of the cooperative alliance can be reduced. The BIES cooperative alliance satisfies the superadditivity condition, which means it meets the overall rationality.
Furthermore, as can be seen from Table 2 and Table 3, when building 1 and building 2 cooperate, the total operating cost decreases by 1037.5 CNY, representing a reduction of 8.71%. When building 1 and building 3 cooperate, the total operating cost decreases by 1724.5 CNY, representing a reduction of 14.55%. When building 2 and building 3 cooperate, the total operating cost decreases by 1681.2 CNY, representing a reduction of 15.91%. At the same time, compared with the individual cooperation of building 1 and building 2, the energy operator gains more revenue when building 1 and building 3 cooperate with each other. It can be seen that the complementary characteristics of building 1 and building 2 are relatively weak, while the complementary characteristics of building 3 with the other two buildings are relatively strong. Participating in the cooperation alliance, building 3 can more effectively reduce the operating cost and obtain more revenue for the energy operator.
On the basis of meeting the overall rationality, we further analyze the individual rationality within the cooperation alliance. By comparing the results of Scenario I and Scenario III in Table 2, we can see that the operating costs of building 1, building 2, and building 3 decrease by 530.3 CNY, 679.5 CNY, and 1558.1 CNY, respectively. Due to the different contributions of each building in the cooperation alliance during the cooperative operation, directly adopting the revenue distribution results of the mixed game optimization obviously does not meet the individual rationality. By comparing the results in Scenario I and Scenario IV in Table 2, we can observe that after the revenue distribution using the Shapley value method, the operating costs of building 1, building 2, and building 3 decrease by 792.9 CNY, 771.2 CNY, and 1114.8 CNY, respectively. Therefore, before the distribution, the revenue and contribution degree of each building do not match. The revenue of building 1 and building 2 is relatively low, which may lead to the low motivation of building 1 and building 2 to participate in the cooperation alliance. It can be seen that using the Shapley value method for distribution, based on the marginal contribution of each building, can enhance the motivation of each building to participate in the cooperation alliance and effectively reduce the operating cost of each building.

5.4. Analysis of Impacts of Confidence Levels and Degrees of Fuzziness

5.4.1. Impacts of Different Confidence Levels

The cost results at different confidence levels are shown in Table 4.
From Table 4, it can be observed that as the confidence level “α” increases, the operating costs of the cooperative alliance continue to rise, and the revenue of the energy operator also keeps increasing. This indicates that the cost control and risk avoidance of the building integrated energy system are in conflict. When the confidence level is set higher, decision makers exhibit higher requirements for the validity of the fuzzy constraints. At this time, although the stability of building operation is better guaranteed, due to the relatively strict constraints, the economy of the building is reduced, the energy demand of the building increases, and therefore, the revenue of the energy operator also increases accordingly. when the confidence level is set lower, decision makers display lower requirements for the validity of the fuzzy chance constraints. At this time, although the building operation is more economical, it will significantly increase the potential risks of building operation, and the revenue of the energy operator also decreases due to the reduction in energy demand in the cooperative alliance. Therefore, in actual scheduling decisions, it is necessary to take into account multiple factors, such as the consumption of distributed new energy and the operational risks of buildings; to select a confidence level that is acceptable in terms of risk and displays lower building operation costs; and to formulate corresponding building optimization operation strategies.

5.4.2. Impacts of Different Degrees of Fuzziness

The operating costs of the multi-building system under different degrees of fuzziness were compared, where σ = 1 - ω F k , and the comparison results are shown in Table 5.
From Table 5, we can observe that as σ decreases, the degree of fuzziness continuously decreases, indicating that the prediction accuracy continuously increases. The total operating cost of the cooperative alliance has decreased from 14,131.8 CNY to 11,051.1 CNY, a reduction of 21.80%. The revenue of the energy operator has decreased from 1821.7 CNY to 1082.2 CNY, a reduction of 40.59%. It can be seen that the degree of fuzziness of the uncertain parameters of photovoltaic and diversified loads is positively correlated with the total operating cost of the system. The higher the degree of fuzziness, the lower the prediction accuracy and the more conservative the optimization result. Improving the prediction accuracy to reduce the degree of fuzziness of uncertain parameters can improve the economy of the system.

5.5. Solution Process

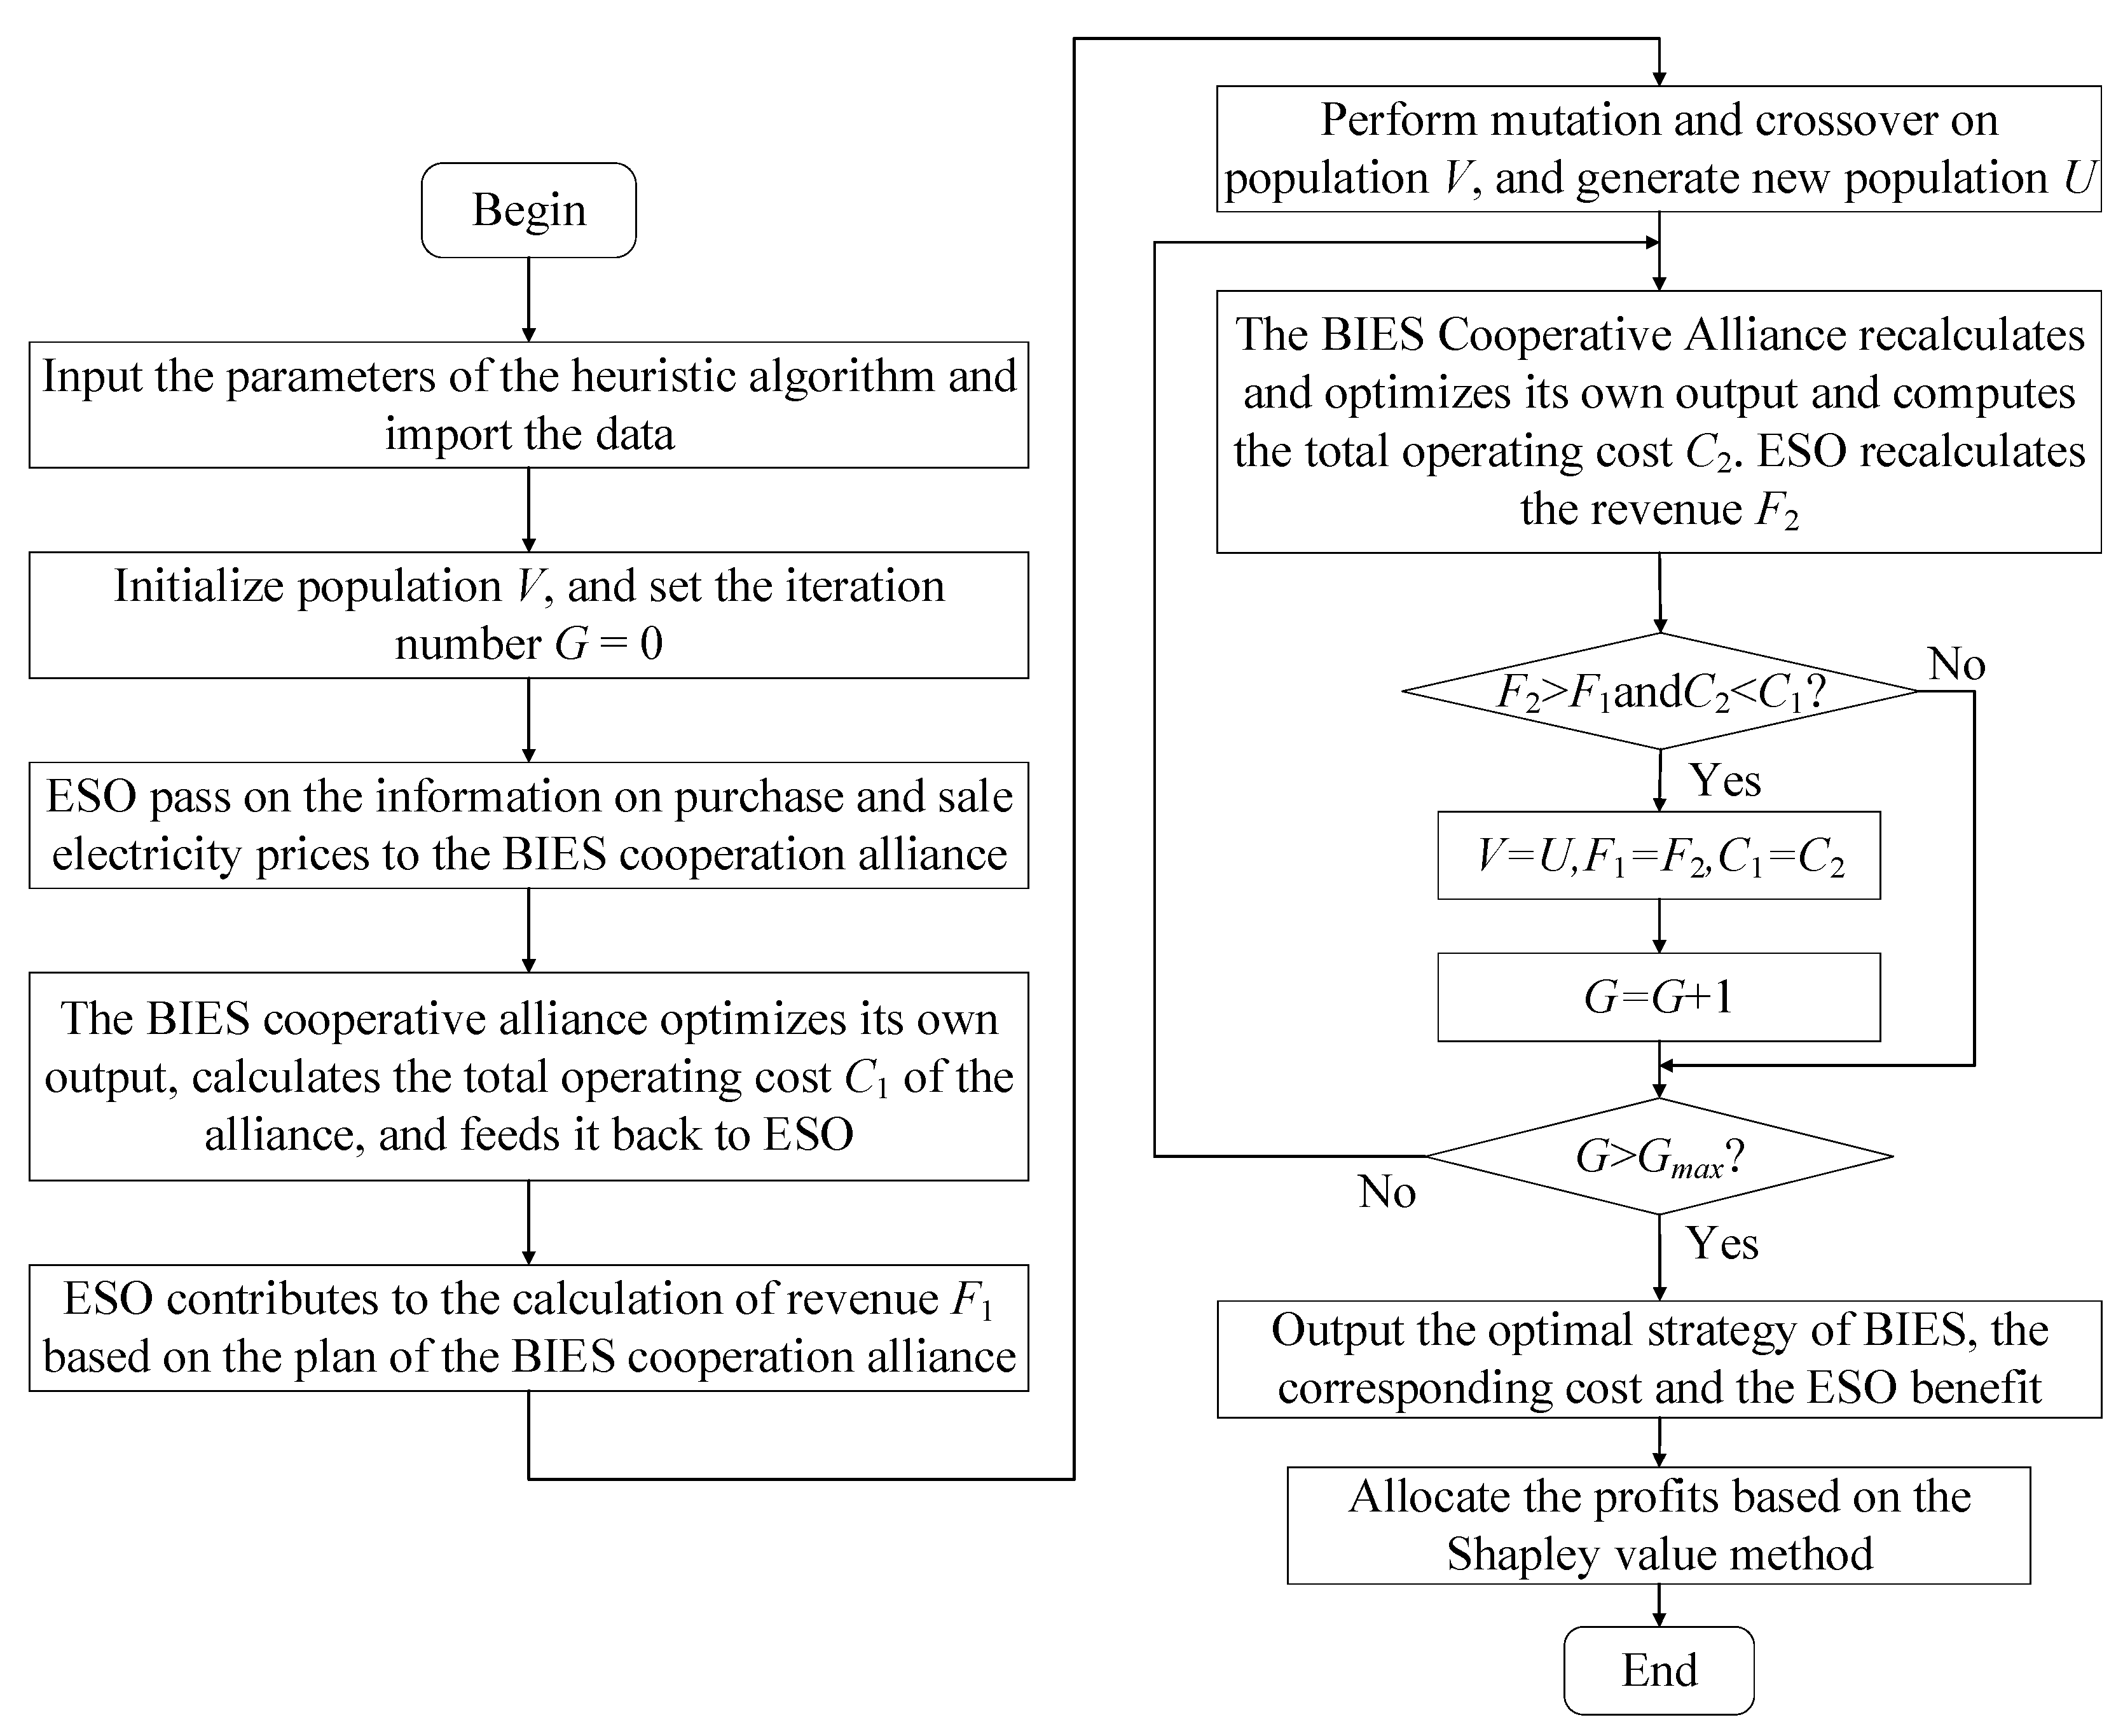
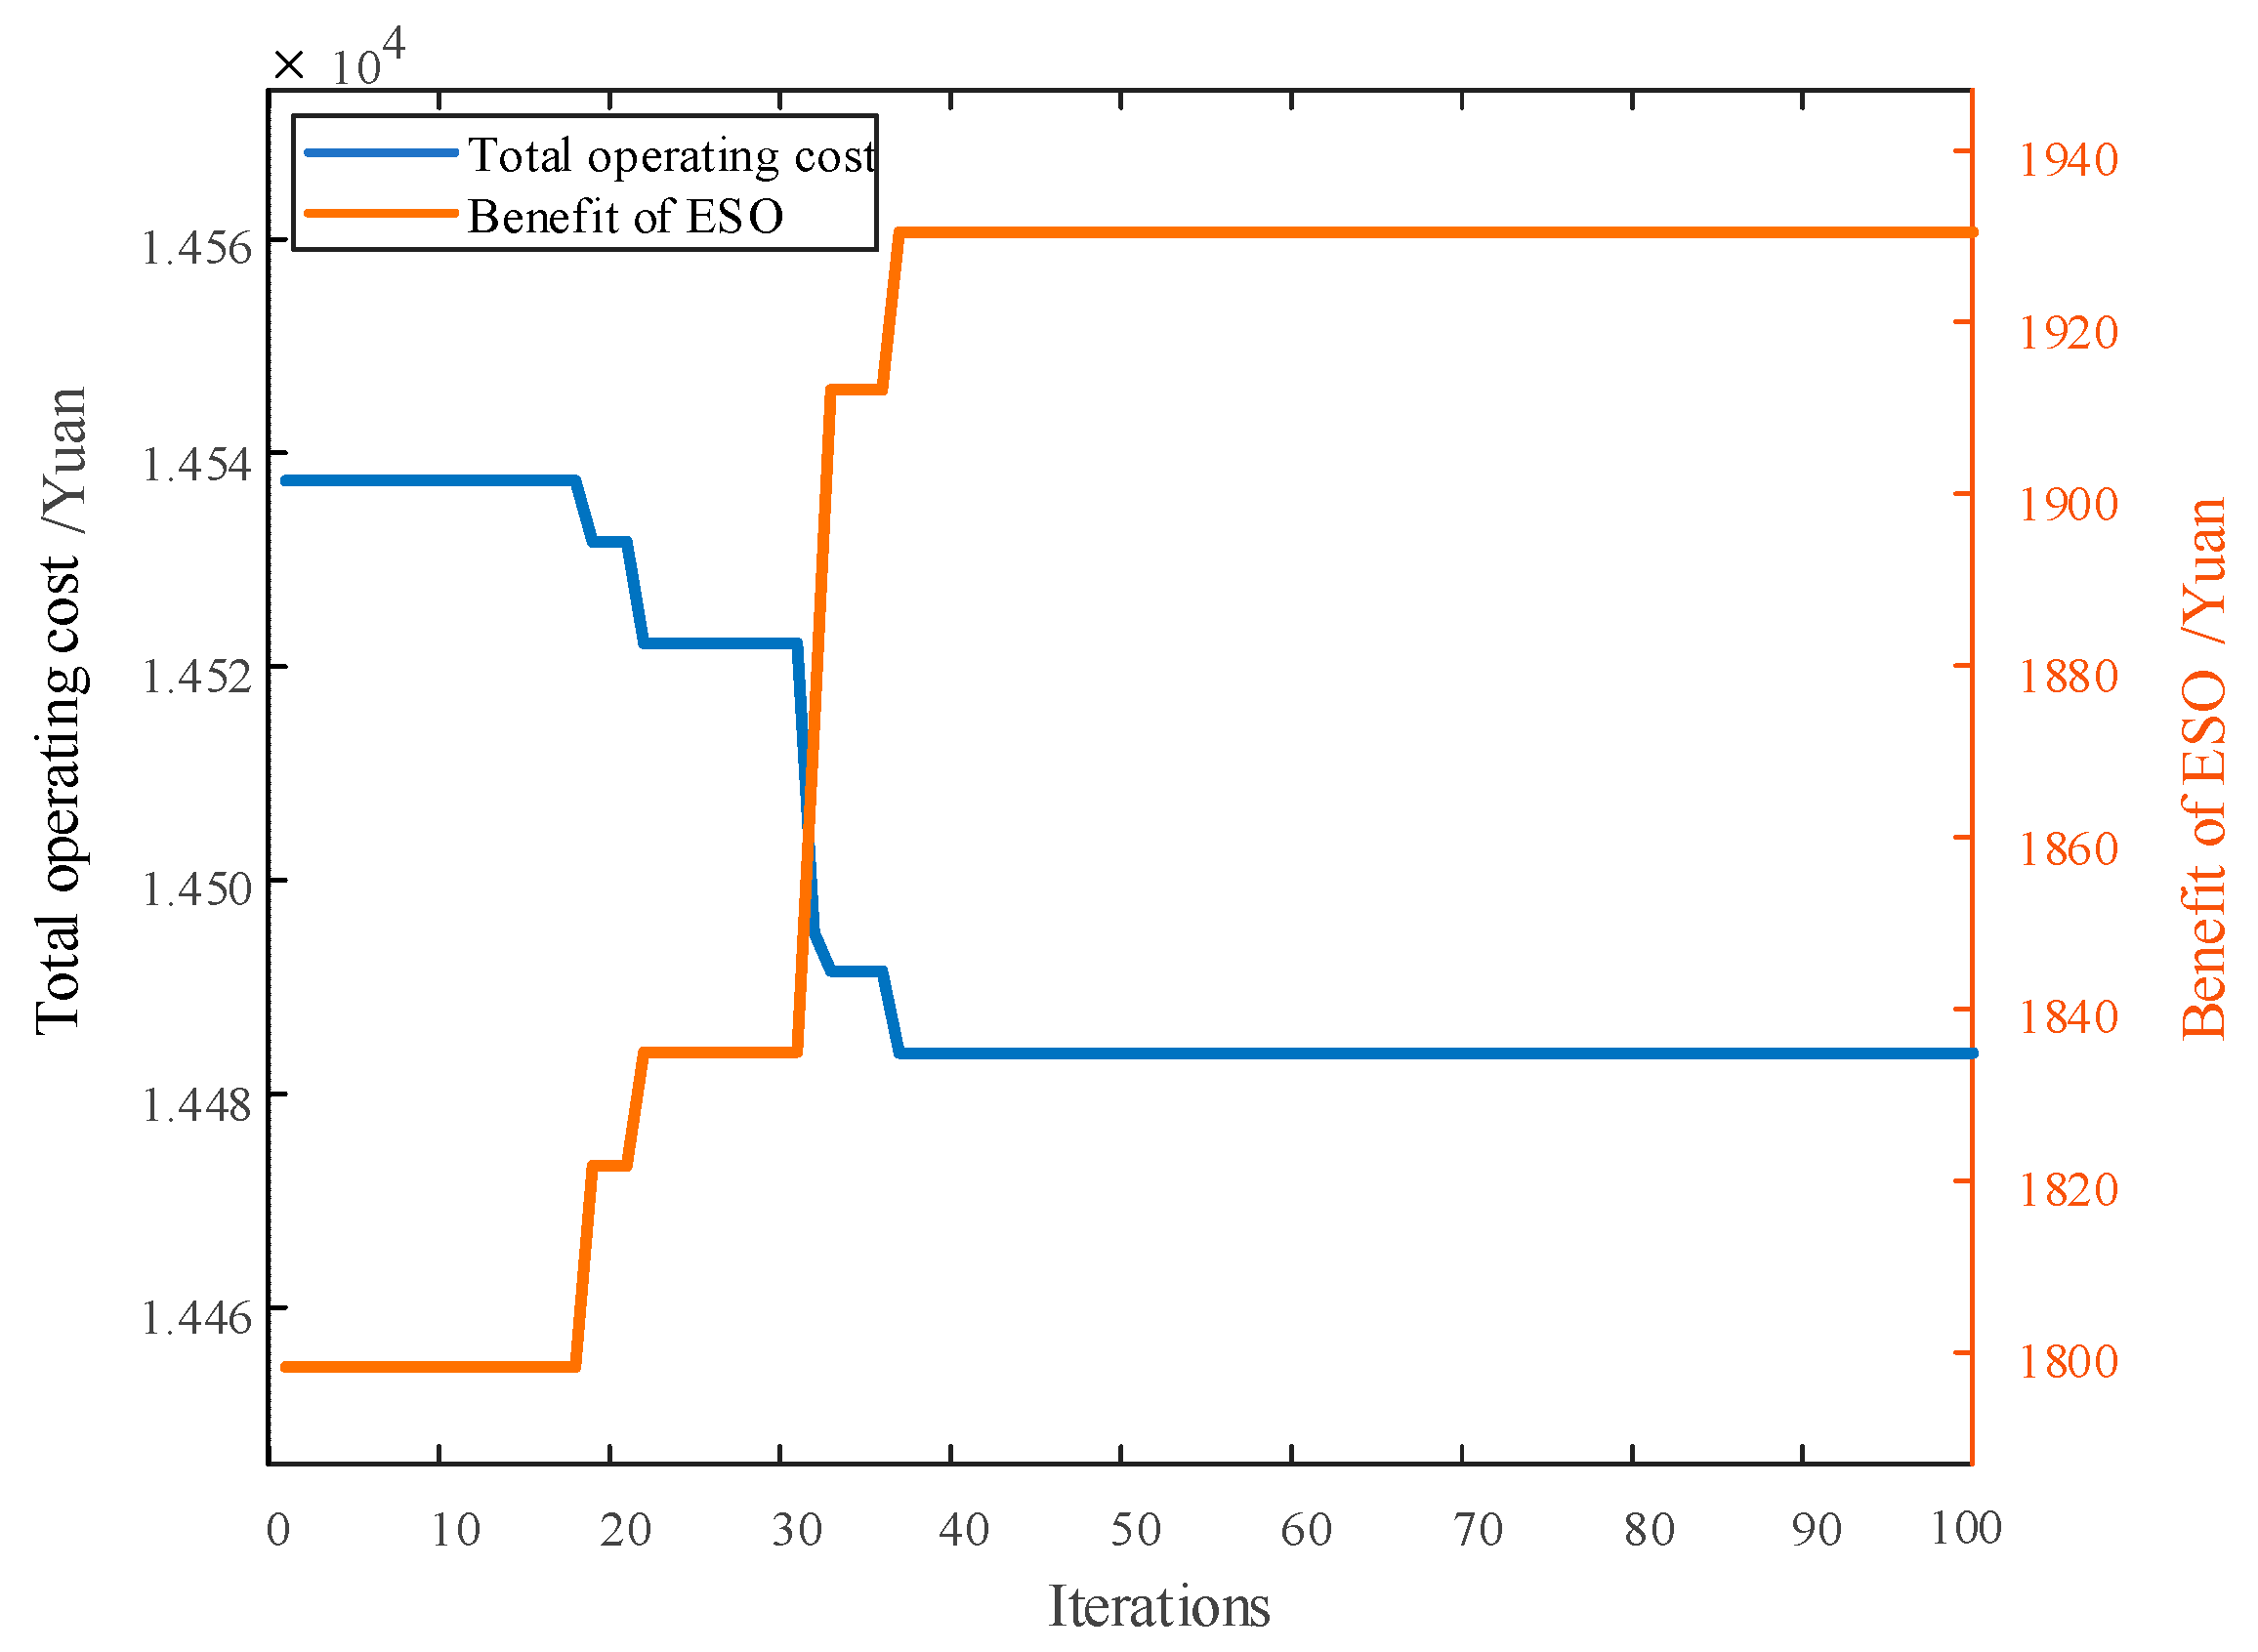
The solution process of the mixed game-based operation is shown in Figure 7. Figure 7 shows that the solution process converges after 37 iterations. The revenue of the ESO presents a positive correlation with the number of iterations, and the total operation cost of the BIES cooperation alliance gradually decreases. This reflects the game process between the two entities. During the iterative process, both entities adjust their strategies to maximize their own benefits. When the game reaches equilibrium, the game strategy no longer changes, indicating that in the current strategy, none of the building entities can further improve their economic benefits by adjusting their own strategies.

6. Conclusions

This paper proposes a mixed game-based day-ahead operation strategy for multi-building integrated energy systems. Specifically, a bi-level game model is established, in which the upper-level model maximizes the benefits of the ESO, and the lower-level model minimizes the operation costs of multiple buildings. Furthermore, in consideration of source-load uncertainties, the established bi-level operation model is reformulated into a fuzzy chance-constrained type. Subsequently, a hierarchical solution approach is presented to solve the bi-level optimization model, and the Shapley value is adopted for benefits re-allocation.
Case studies conducted on a multi-building system in East China verified the effectiveness of the proposed work, and the following conclusions can be drawn:
(1) The proposed game-based operation model contributes to reducing total operation costs by 3.98% and increasing the energy operator’s revenue by 10.31%.
(2) Through the Shapley value method, the operation cost of each building agent is re-attributed based on their marginal contributions, which enhances the motivation of each building to participate in the cooperation alliance and effectively guarantees the benefits of each building.
(3) The proposed fuzzy chance-constrained program effectively addresses source-load uncertainties, allowing for flexible day-ahead decision making according to different prediction accuracy and confidence levels.
(4) The presented hierarchical solution approach effectively solves the game-based bi-level model with mixed-binary variables.
The proposed work offers insights for building sectors in which building operators could participate in energy exchange with both building aggregators and other building sectors so that the overall operation costs could be effectively reduced. In the future, this work could be extended by establishing more accurate equipment models, e.g., disparate timescales between fast electrical response and slow thermal inertia. Moreover, this work is limited by its focus on only electricity, heating, and cooling systems. The proposed work could be extended to more complicated integrated energy systems by incorporating other energy systems, e.g., hydrogen systems.

Author Contributions

Conceptualization, H.L.; Methodology, J.Z.; Software, G.S.; Validation, G.S.; Formal analysis, G.S.; Investigation, J.Z.; Resources, J.Z.; Data curation, C.L.; Writing—original draft, J.Z.; Writing—review & editing, G.S., C.L. and H.L.; Visualization, C.L.; Supervision, J.Z.; Project administration, J.Z. All authors have read and agreed to the published version of the manuscript.

Funding

This research received no external funding.

Data Availability Statement

Data is contained within the article.

Conflicts of Interest

The authors declare no conflict of interest.

Appendix A

Figure A1. Load and photovoltaic output data chart for building 1.
Buildings 15 02441 g0a1
Figure A2. Load and photovoltaic output data chart for building 2.
Buildings 15 02441 g0a2
Figure A3. Load and photovoltaic output data chart for building 3.
Buildings 15 02441 g0a3
Table A1. Parameters of equipment in each building.
BuildingsEquipmentMinimum Power/kWMaximum Power/kWOperation and Maintenance Costs/CNY/kWh
IPower purchase01000-
Gas turbine1206000.1
Gas boiler402000.012
Electric boiler01500.01
Absorption chiller05000.02
Electrical chillers08750.015
IIPower purchase01000-
Gas turbine1608000.1
Gas boiler402000.012
Electric boiler01500.01
Absorption chiller05000.02
Electrical chillers08750.015
IIIPower purchase01000-
Gas turbine20010000.1
Gas boiler402000.012
Electric boiler01500.01
Absorption chiller05000.02
Electrical chillers08750.015

References

  1. Peng, Q.; Wang, X.; Kuang, Y.; Wang, Y.; Zhao, H.; Wang, Z.; Lyu, J. Hybrid energy sharing mechanism for integrated energy systems based on the Stackelberg game. CSEE J. Power Energy Syst. 2021, 7, 911–921. [Google Scholar]
  2. Wang, Y.; Liu, Z.; Wang, J.; Du, B.; Qin, Y.; Liu, X.; Liu, L. A Stackelberg game-based approach to transaction optimization for distributed integrated energy system. Energy 2023, 283, 128475. [Google Scholar] [CrossRef]
  3. Lu, Q.; Guo, Q.; Zeng, W. Optimal dispatch of community integrated energy system based on Stackelberg game and integrated demand response under carbon trading mechanism. Appl. Therm. Eng. 2023, 219, 1–21. [Google Scholar] [CrossRef]
  4. Bo, W.; Zhang, W.; Du, R.; Wang, D.; Zhao, Y.; Li, Q.; Zhang, Z. Collaborative optimal dispatch of microgrid and electric vehicles based on the Stackelberg game. Front. Energy Res. 2022, 10, 1–10. [Google Scholar] [CrossRef]
  5. Wang, J.; Xu, Z.; Sun, Y.; Du, X.; Mahfoud, R.J.; Xiong, J. Optimal configuration and pricing strategies for electric-heat cloud energy storage: A Stackelberg game approach. Sustain. Energy Technol. Assess. 2022, 53, 1–12. [Google Scholar] [CrossRef]
  6. Chen, C.; Li, Y.; Qiu, W.; Liu, C.; Zhang, Q.; Li, Z.; Lin, Z.; Yang, L. Cooperative-game-based day-ahead scheduling of local integrated energy systems with shared energy storage. IEEE Trans. Sustain. Energy 2022, 13, 1994–2011. [Google Scholar] [CrossRef]
  7. Wang, Y.; Liu, Z.; Cai, C.; Xue, L.; Ma, Y.; Shen, H.; Chen, X.; Liu, L. Research on the optimization method of integrated energy system operation with multi-subject game. Energy 2022, 245, 123305. [Google Scholar] [CrossRef]
  8. Chen, C.; Liu, C.; Ma, L.; Chen, T.; Wei, Y.; Qiu, W.; Lin, Z.; Li, Z. Cooperative-game-based joint planning and cost allocation for multiple park-level integrated energy systems with shared energy storage. J. Energy Storage 2023, 73, 108861. [Google Scholar] [CrossRef]
  9. Wu, Y.; Wang, C.; Wang, Y. Cooperative game optimization scheduling of multi-region integrated energy system based on ADMM algorithm. Energy 2024, 302, 131728. [Google Scholar] [CrossRef]
  10. Voropai, N.I.; Ivanova, E.Y. Shapley game for expansion planning of generating companies at many non-coincident criteria. IEEE Trans. Power Syst. 2006, 21, 1630–1637. [Google Scholar] [CrossRef]
  11. Ma, L.; Liu, N.; Zhang, J.; Wang, L. Real-time rolling horizon energy management for the energy-hub-coordinated prosumer community from a cooperative perspective. IEEE Trans. Power Syst. 2018, 34, 1227–1242. [Google Scholar] [CrossRef]
  12. Cong, H.; Wang, X.; Jiang, C. Robust coalitional game theoretic optimization for cooperative energy hubs with correlated wind power. IET Renew. Power Gener. 2019, 13, 2391–2399. [Google Scholar] [CrossRef]
  13. Han, F.; Zeng, J.; Lin, J.; Zhao, Y.; Gao, C. A stochastic hierarchical optimization and revenue allocation approach for multi-regional integrated energy systems based on cooperative games. Appl. Energy 2023, 350, 121701. [Google Scholar] [CrossRef]
  14. He, J.; Li, Y.; Li, H.; Tong, H.; Yuan, Z.; Yang, X.; Huang, W. Application of game theory in integrated energy system systems: A review. IEEE Access 2020, 8, 93380–93397. [Google Scholar] [CrossRef]
  15. Liang, Z.; Mu, L. Multi-agent low-carbon optimal dispatch of regional integrated energy system based on mixed game theory. Energy 2024, 295, 130953. [Google Scholar] [CrossRef]
  16. Wu, Y.; Jin, P.; Li, Q. Research on regulation strategy of integrated energy system based on game theory and divide-and-conquer algorithm. Energy 2025, 319, 134860. [Google Scholar] [CrossRef]
  17. Li, X.; Wu, N.; Lei, L. Nash-Stackelberg-Nash three-layer mixed game optimal control strategy for multi-integrated energy systems considering multiple uncertainties. Energy 2025, 320, 135418. [Google Scholar] [CrossRef]
  18. Yan, J.; Duan, Z.; Gao, J.; Chen, S.; Zhou, B.; Wang, Y. Coordinated control strategy of electricity-heat-gas integrated energy system considering renewable energy uncertainty and multi-agent mixed game. Front. Energy Res. 2022, 10, 943213. [Google Scholar]
  19. Reddy, V.J.; Hariram, N.P.; Ghazali, M.F.; Kumarasamy, S. Pathway to sustainability: An overview of renewable energy integration in building systems. Sustainability 2024, 16, 638. [Google Scholar] [CrossRef]
  20. Liu, Z.-F.; Zhao, S.-X.; Luo, X.-F.; Huang, Y.-H.; Gu, R.-Z.; Li, J.-X.; Li, L.-L. Two-layer energy dispatching and collaborative optimization of regional integrated energy system considering stakeholders game and flexible load management. Appl. Energy 2025, 379, 124918. [Google Scholar] [CrossRef]
  21. Wang, L.; Ma, Y.; Wang, S.; Dong, W.; Ni, L.; Liu, Z. Master-slave game-based optimal scheduling strategy for integrated energy systems with carbon capture considerations. Energy Rep. 2025, 13, 780–788. [Google Scholar] [CrossRef]
  22. He, Z.; Li, K.; Sun, Z.; Yan, Y.; Zhang, C. Optimal scheduling of multi-energy hubs considering carbon trading and its benefit allocation. Int. J. Green Energy 2023, 21, 904–918. [Google Scholar] [CrossRef]
  23. Wang, L.; Lin, J.; Dong, H.; Wang, Y.; Zeng, M. Demand response comprehensive incentive mechanism-based multi-time scale optimization scheduling for park integrated energy system. Energy 2023, 270, 126893. [Google Scholar] [CrossRef]
  24. Yu, W.; Ke, L.I.; Shuzhen, L.I.; Xin, M.; Chenghui, Z. A bi-level scheduling strategy for integrated energy systems considering integrated demand response and energy storage co-optimization. J. Energy Storage 2023, 66, 107508. [Google Scholar] [CrossRef]
  25. Cheng, Y.; Zhang, N.; Zhang, B.; Kang, C.; Xi, W.; Feng, M. Low-carbon operation of multiple energy systems based on energy-carbon integrated prices. IEEE Trans. Smart Grid 2019, 11, 1307–1318. [Google Scholar] [CrossRef]
Figure 1. Schematic diagram of the BIES.
Buildings 15 02441 g001
Figure 2. Operation framework.
Buildings 15 02441 g002
Figure 3. Illustration of the triangular fuzzy membership function.
Buildings 15 02441 g003
Figure 4. Flowchart of the hierarchical solution approach.
Buildings 15 02441 g004
Figure 5. Optimal electricity price of ESO.
Buildings 15 02441 g005
Figure 6. The resulting diagram of the thermal energy interaction between the cooperative alliance.
Buildings 15 02441 g006
Figure 7. ESO and BIES cooperative coalition mixed game iterative process.
Buildings 15 02441 g007
Table 1. Comparison between the proposed work and previous work.
Ref.Energy TypeGame ModelingUncertainty Model
PowerHeatGasColdStackelberg GameCollaborative GameMixed Game
[1]--------
[2]----------
[3,16]------
[4]----------Chance constraints
[5]----------
[9]--------Scenario-based stochastic
[11,13]----Scenario-based stochastic
[12]------Robust optimization
[15]----------
[17]------Chance constraints
[18]------Scenario-based stochastic
[20]--------Scenario-based stochastic
[21]----------
This study----Fuzzy chance-constraints
Table 2. Cost and ESO benefit results when two buildings in the alliance cooperate.
SceneBuildingOperating Costs of Each Building/CNYTotal System Cost After Cooperation/CNYESO Benefits/CNY
1–2
Cooperation
16241.210,872.8920.1
24631.6
1–3
Cooperation
16203.510,128.21276.7
33924.7
2–3
Cooperation
24836.78883.81226.5
34047.1
Table 3. Cost of the cooperative alliance and ESO benefit results under different scenarios.
ScenariosBuildingSystem Purchase Cost/CNYPre-Allocating Cost/CNYCost After Allocation/CNYTotal Cost/CNYESO Benefits/CNY
I116,315.96599.0-17,164.0-
25311.3-
35253.7-
II114,394.45926.2-15,085.21733.6
24652.9-
34506.1-
III113,503.16068.7-14,485.11932.8
24631.8-
33695.6-
IV113,503.16068.75806.114,485.11932.8
24631.84540.1
33695.64138.9
Table 4. Cost results at different confidence levels.
α 0.800.850.900.951.00
Alliance cost/CNY14,131.814,764.415,600.916,345.516,838.2
Revenue of ESO/CNY1821.71909.02157.72375.32537.3
Table 5. Operating cost results at different fuzziness levels.
σ 0.50.40.30.20.1
Alliance cost/CNY14,131.813,538.712,437.111,733.511,051.1
Revenue of ESO/CNY1821.71580.51303.31207.61082.2
Disclaimer/Publisher’s Note: The statements, opinions and data contained in all publications are solely those of the individual author(s) and contributor(s) and not of MDPI and/or the editor(s). MDPI and/or the editor(s) disclaim responsibility for any injury to people or property resulting from any ideas, methods, instructions or products referred to in the content.

