1. Introduction
High-strength bolts such as steel and composite structural universal connecting components are generally subjected to tension, shear and combined loads [
1,
2,
3]. Herein, accurate estimation of the tension and shear behaviors of high-strength bolts is fundamental for the design safety of bolted connections. The numerical simulation method is commonly used to approach the mechanical behaviors of high-strength bolts under combined action, but requires the exact input of material constitutive relations and damage model calibration.
For description of the constitutive relations, called the true stress–strain curve, the elastic and strain-hardening relations of metal materials before necking can be converted from the experimental curves in a tension coupon test. Nevertheless, the post-necking part cannot be accessed from experimental engineering curves due to the inhomogeneous stress distribution at the necking regions. Various mathematical expressions are proposed and developed to characterize material plasticity after necking, mainly containing two types: the single extrapolating model (like Swift’s model [
4]) and the material parametric model (like Ling’s weighted model [
5]). It is noted that differences in the chemical composition, tempering temperature and forming process between the material of the steel and the bolt may cause a deviation in stress–strain responses. Hence, it is worthwhile to conduct an investigation of the constitutive model of high-strength bolts.
Recent studies have started to discuss the post-necking behavior of high-strength bolts, and they propose several mathematical expressions to characterize the full range of true stress–strain relations, but the characterization of their shear behavior remains insufficient. Li et al. [
6,
7] proposed two mechanical constitutive models based on cylindrical tensile coupon tests, and they are verified for bolt grades of 10.9 and 12.9. Zhang et al. [
8] carried out a model experiment and FE simulation on the plasticity characteristics of high-strength bolts under tension and proposed a new mechanical expression for describing the tensile true stress–strain relation. Xin et al. [
9,
10] develops the weighted function to describe the stress–strain relationship and discusses the ultimate tensile–shear coupling behavior of high-strength bolts. However, the existing studies mainly focus on the constitutive relations of high-strength bolts under uniaxial tension, yet few research studies take their shear behavior into account. Many studies reporting numerical analysis, considering the constitutive relations calibrated from tensile coupon tests, may overestimate the shear resistance by over 20% for steel components [
11,
12,
13], which is called steel shear behavior, especially in high-strength steel, as well as for high-strength bolts. The literature [
14,
15] indicates that the estimation error originates from the inaccurate yield description in the von Mises criterion. Consequently, numerous yield criteria have been proposed and validated for evaluating steel components under different stress states. Nevertheless, it is mentioned that the von Mises criterion is still universally employed in steel structural analysis due to its easy formula formation and wide applicable range. Therefore, study on the mathematical expression describing shear constitutive relations is very necessary.
The accurate prediction of failure behavior in high-strength bolts urgently requires the development of a shear-based constitutive ductile fracture criterion to address the limitations of existing models in shear fracture evaluation. The failure behavior of high-strength bolts is another fundamental mechanical response for structural estimation under the ultimate state. The prediction’s accuracy is highly relative to an appropriate fracture criterion. The ductile fracture criterion can be categorized into the coupled and uncoupled groups. The coupled one incorporating the damage model with the constitutive relation can describe the cumulative damage of metal materials, involving the two typical models of the GTN family [
16,
17,
18] and CDM family [
19,
20], but they require mass material parameters’ calibration based on various corresponding experiments. In contrast, the separate consideration of the ductile fracture criterion and the constitutive model in the uncoupled damage model generally contains fewer parameters’ calibration, which is more suitable for structural analysis. The Rice and Tracey (R-T) model [
21] and Bao and Wierzbicki (BW) model [
22] are two typical uncoupled damage models, and they show the capability of the fracture estimation of high-strength bolts under monotonic tension and pure shear force [
6,
7,
8]. The author of [
8] verified that the R-T model can predict the tensile failure of various grades of bolts under elevated temperature. Yang et al. [
23] conducted numerical simulation with the BW model to reveal the shank tension and thread-stripping failure of high-strength bolts. It was also applied by Li et al. [
6,
7] to study the fracture behaviors of high-strength bolts subjected to tension–shear coupling loads. Li et al. [
24] carried out FE simulation with the calibrated BW model against experimental results to reveal the shear failure mechanism of modified blind-bolts. Saglik et al. [
25] proposed and discussed the effect of elevated temperatures on BW calibration parameters for high-strength bolts under tension and shear coupling stress. However, the accuracy of fracture behavior prediction based on the uncoupled damage model is highly relative to the constitutive relation, yet the lack of study on the shear constitutive relation results in the inadequacy of the damage model in shear fracture. Accordingly, an in-depth study on the ductile fracture criterion considering the shear constitutive model is significantly essential for evaluating the fracture mechanism of high-strength bolts.
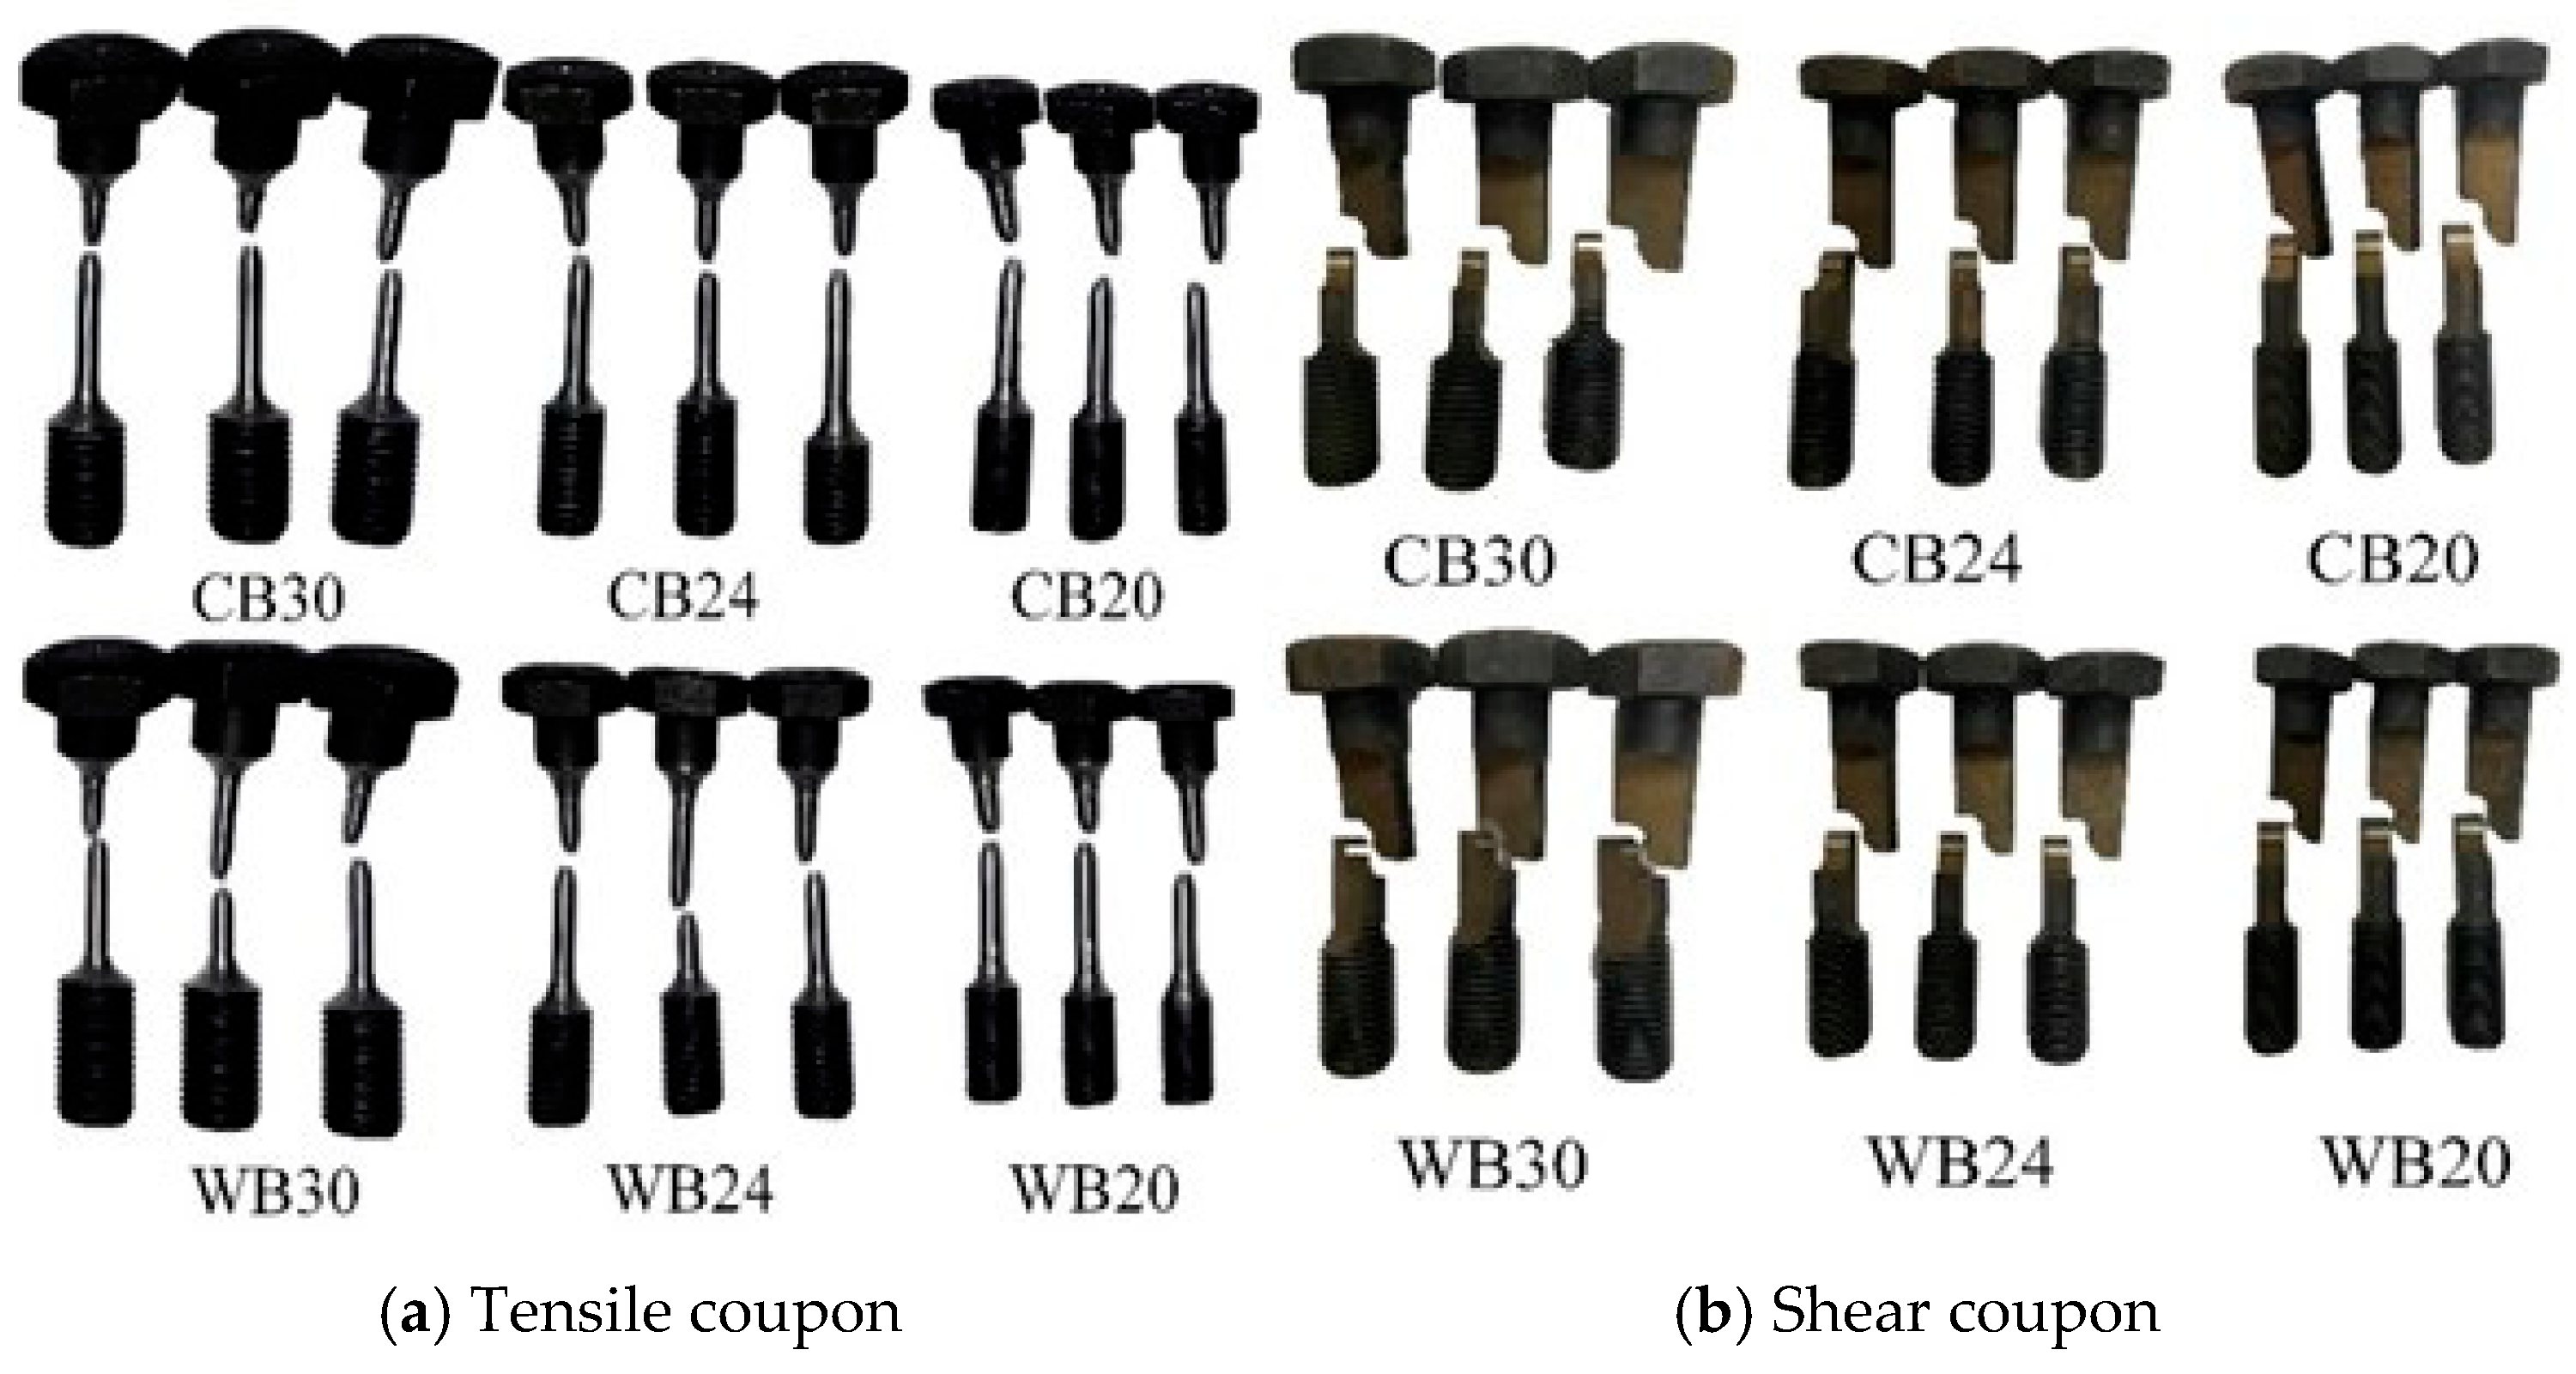
This paper presents a mathematical model to investigate the plasticity and fracture behavior of high-strength bolts and provide insights into the relation of bolts under tension, shear and combined loading conditions. An experimental program containing cylindrical uniaxial tension tests and shear tests is conducted to compare and discuss the mechanical properties of common and weathering high-strength bolts. The combined S-V model is used to describe the tensile constitutive relation, collaborating with the modified shear constitutive model to characterize the shear true stress–strain relation of high-strength bolts. The BW model then is implemented to investigate the fracture behaviors of the bolts. Finally, experimental results are collected to discuss the ultimate tensile- and shear-dominated responses of high-strength bolts under tension–shear coupling loads.
3. Steel Shear Behavior of High-Strength Bolts
The experimental program provides the basic mechanical responses of structures, and the further deep understanding of the load-transferring mechanism, failure behavior, etc., are generally investigated with the aid of a numerical simulation method. Notably, the material properties inputted into the numerical model are highly relative to the simulation validity. Therefore, an accurate and reasonable constitutive model describing the stress–strain relation and fracture properties is essential for numerical investigation.
However, the constitutive relations inputted into numerical analysis, calibrated from the tensile coupon test, may overestimate the shear resistance by over 20% for steel components, commonly shown in high-strength steel, as well as for high-strength bolts [
11,
12,
13]. This so-called steel shear behavior may lead to unsafe steel constructions. This section proposes the constitutive models with a corresponding damage model to describe the steel shear behavior of high-strength bolts well and further discusses their differences.
3.1. Numerical Model
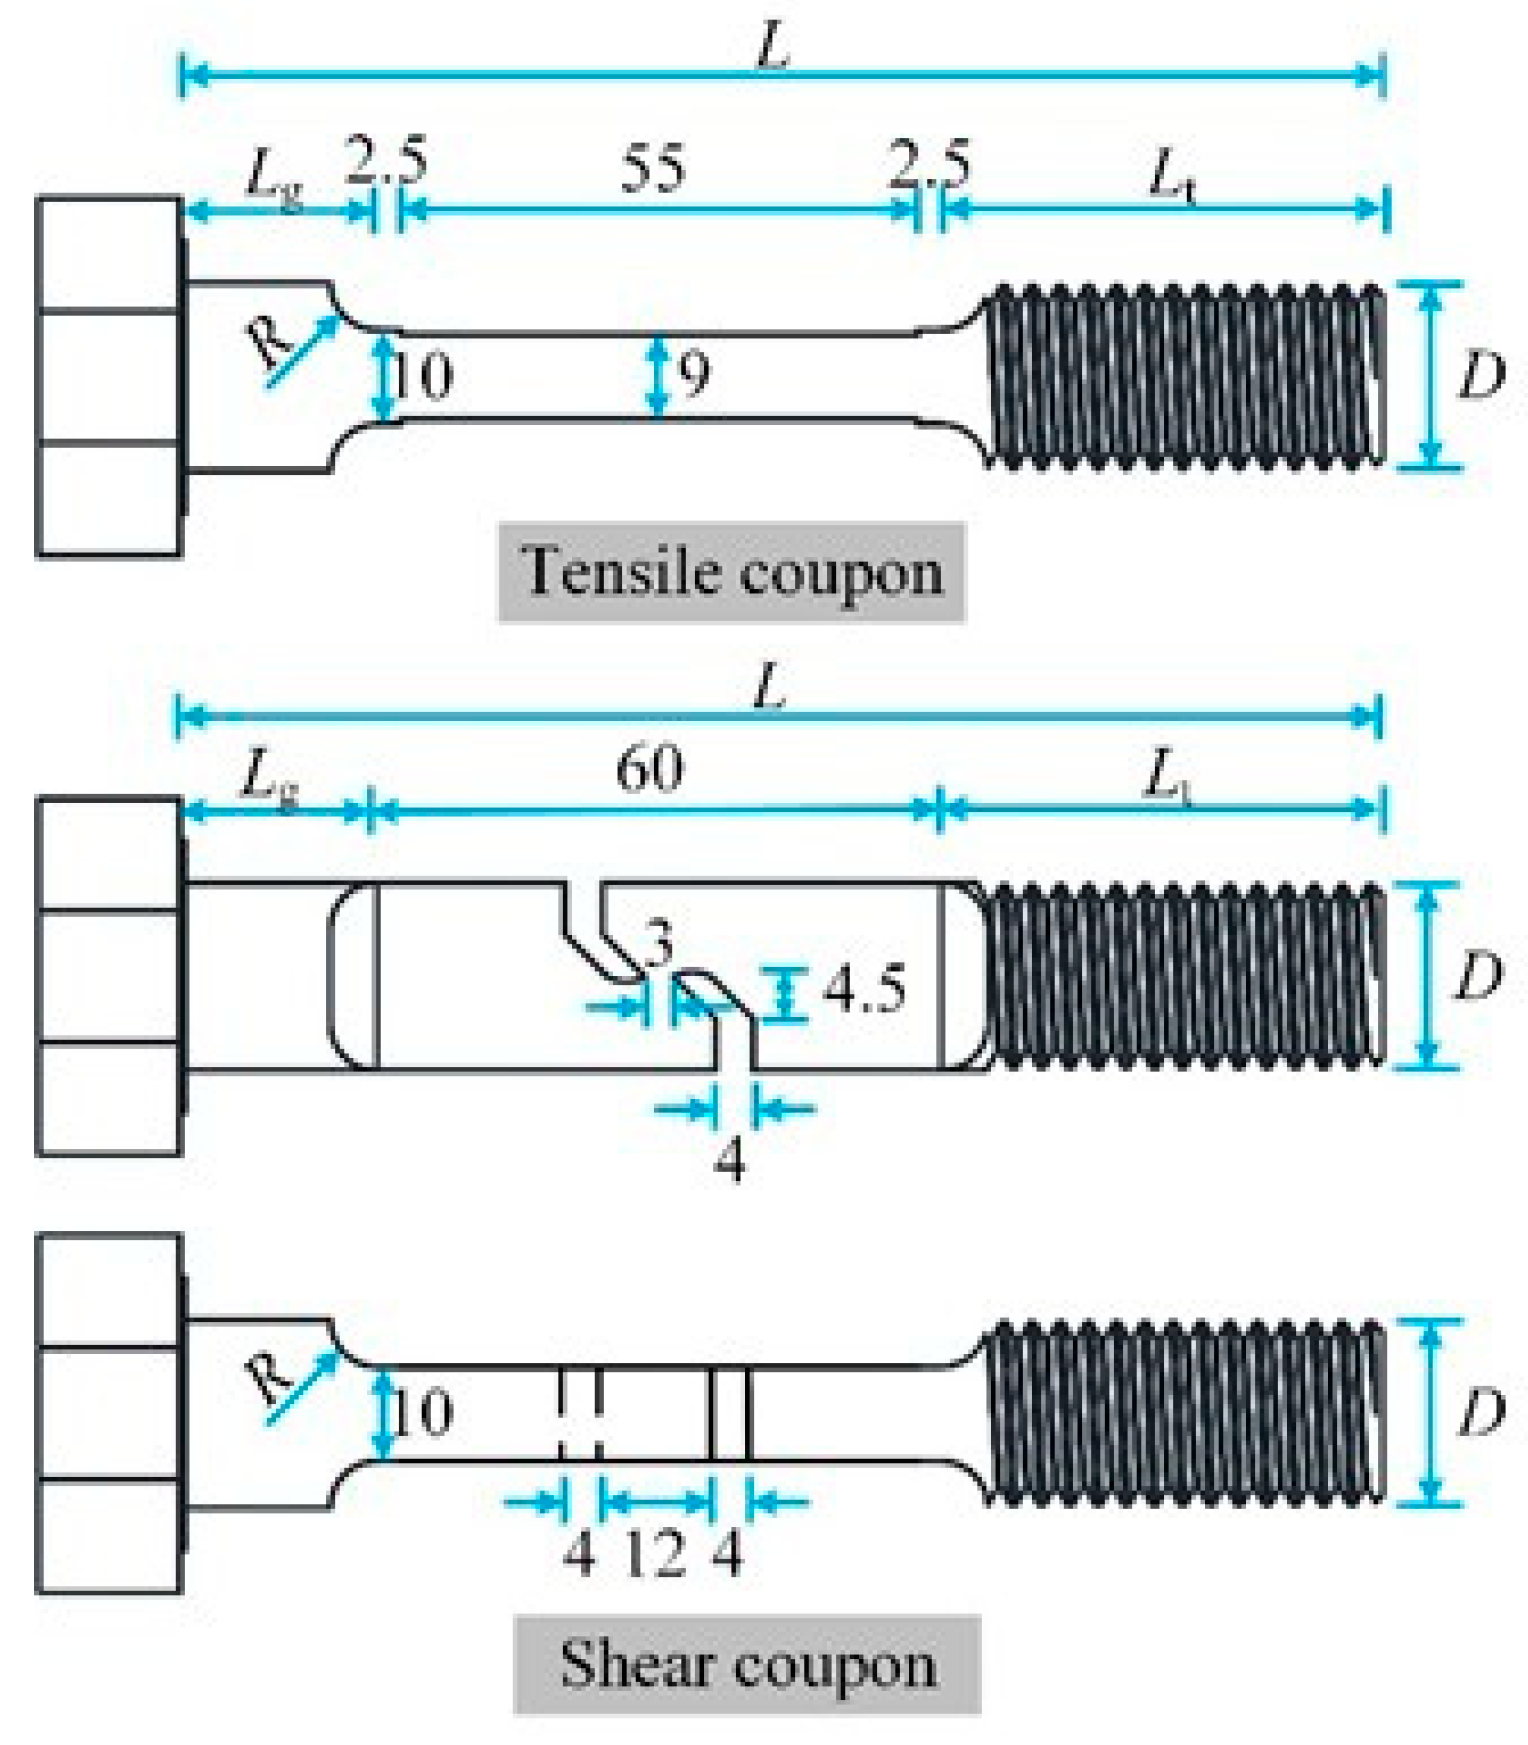
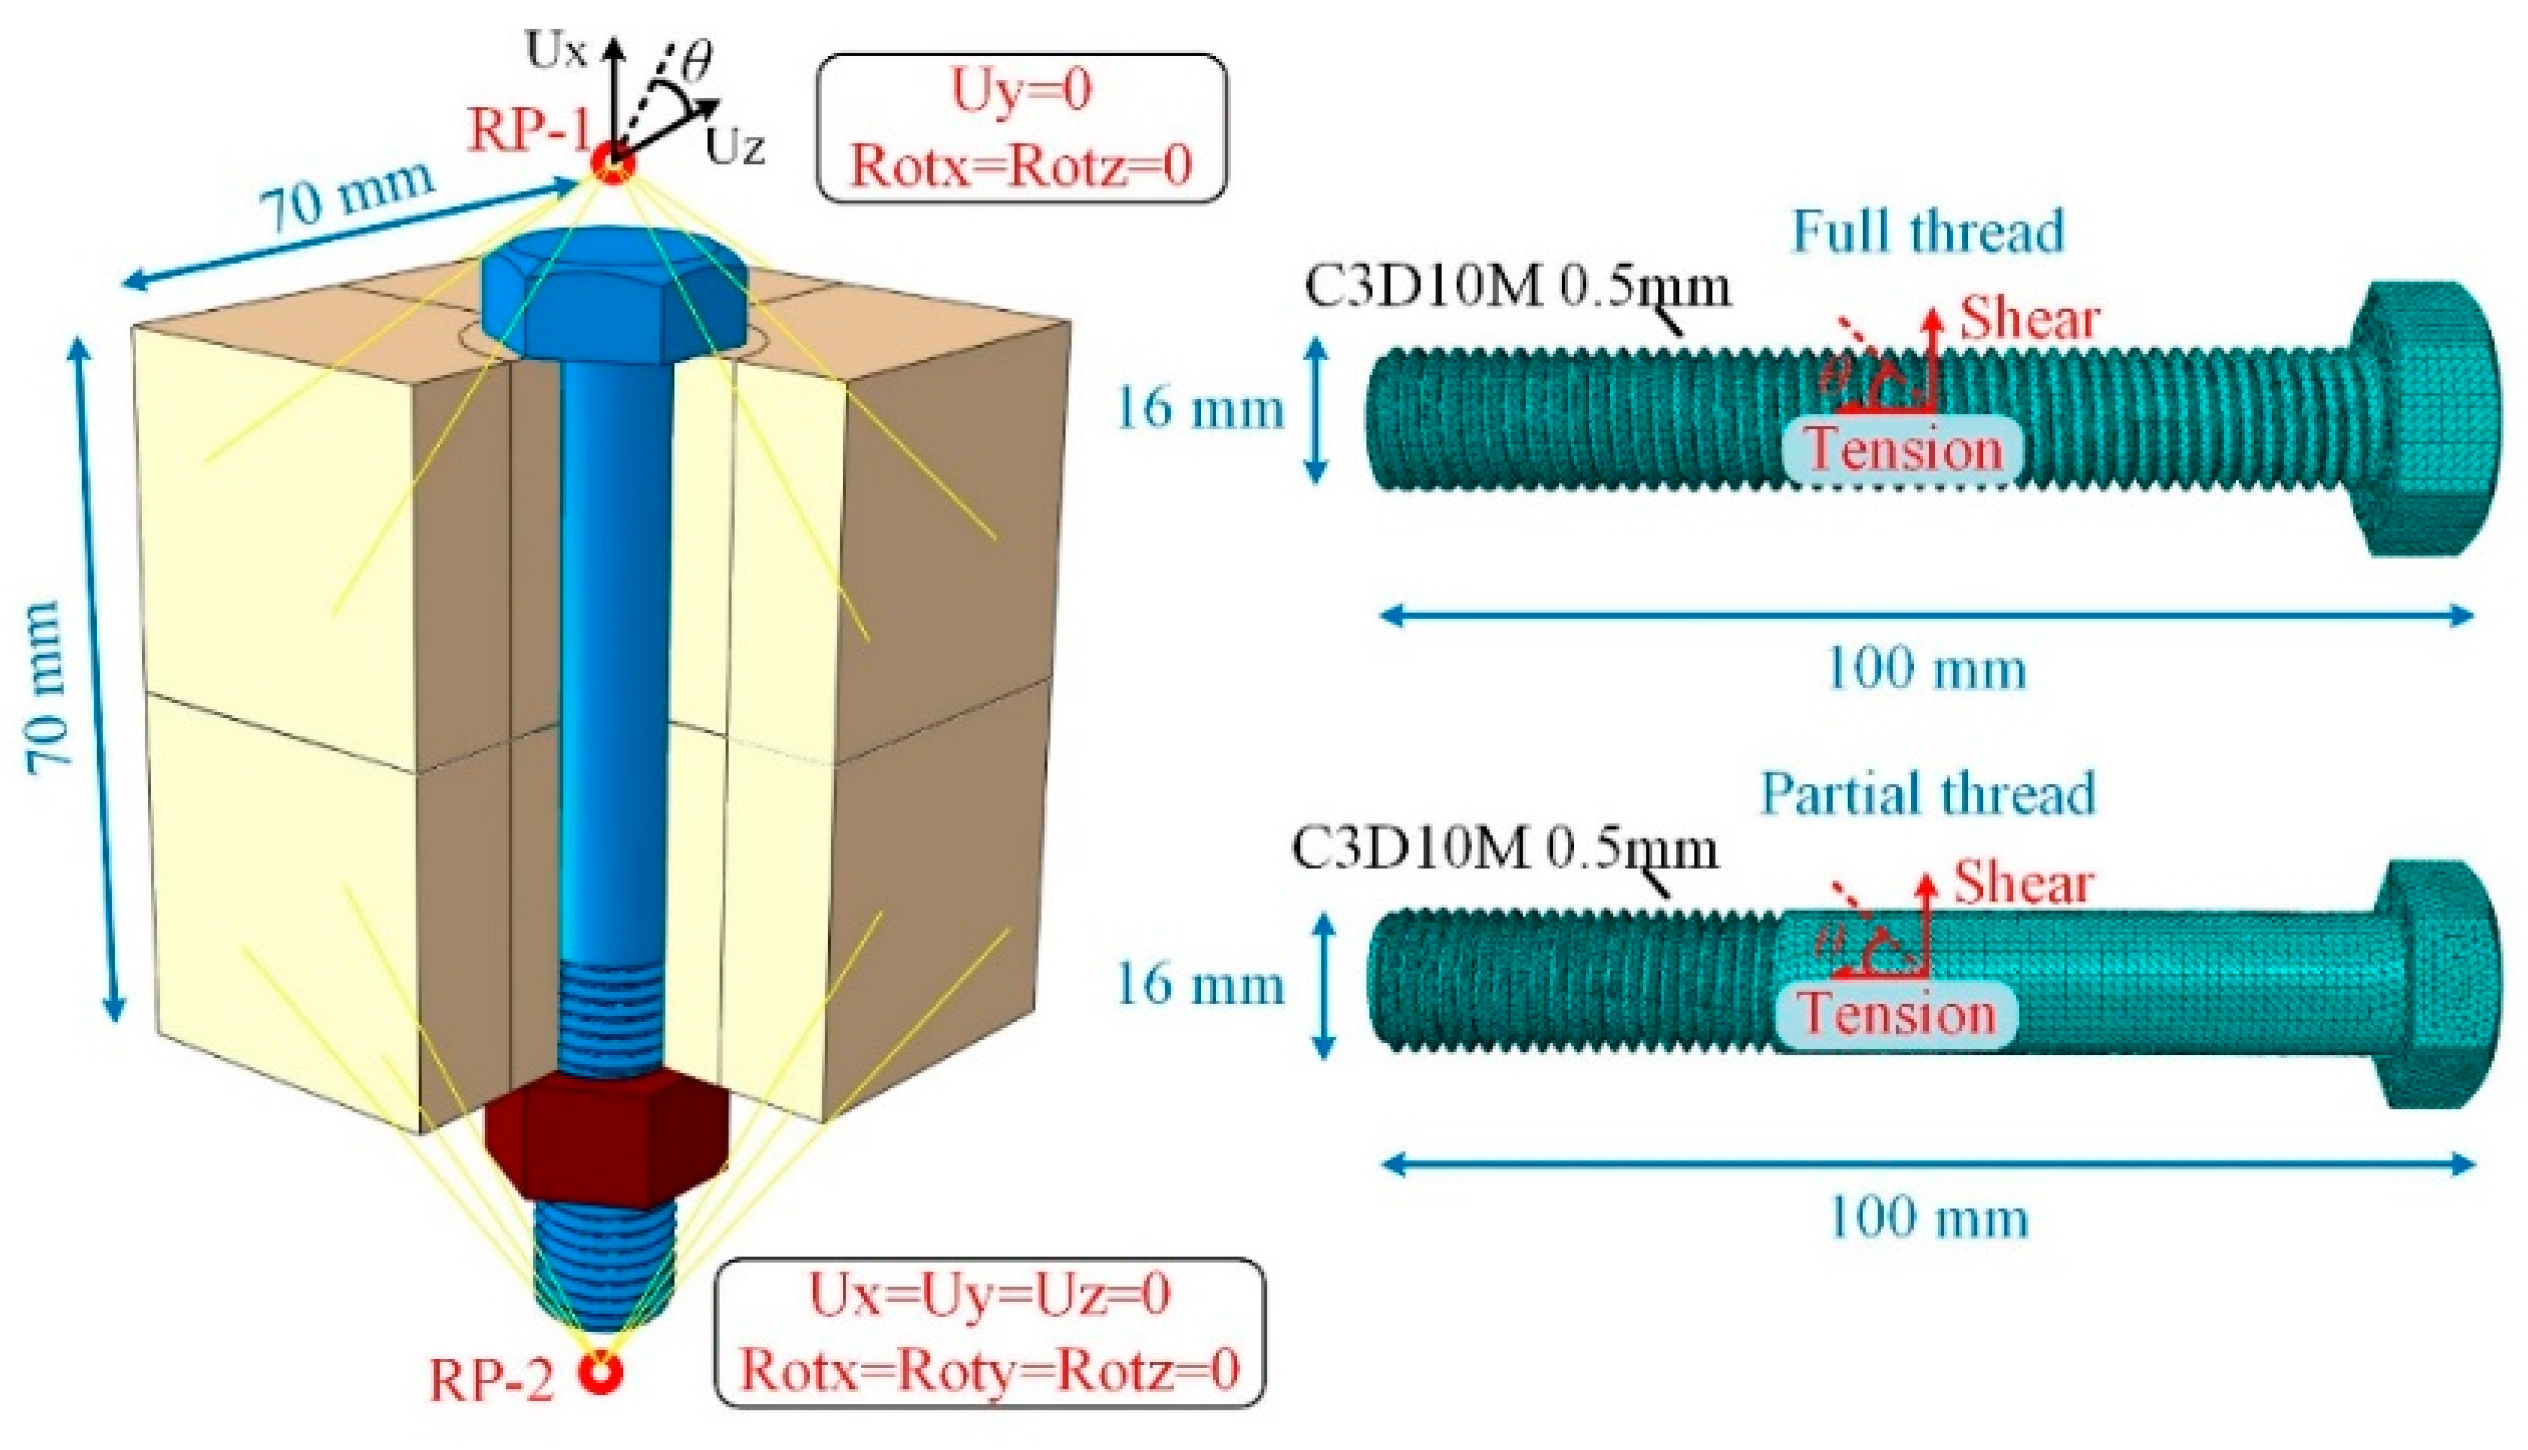
Figure 4 shows the FE model of test coupons, where the simplified geometric shapes of both specimen types are used for saving time-consuming calculations. The bolt diameter
D, the total length
L and the loading length
Lt correspond to the geometrical dimensions presented in
Figure 1 and
Table 1.
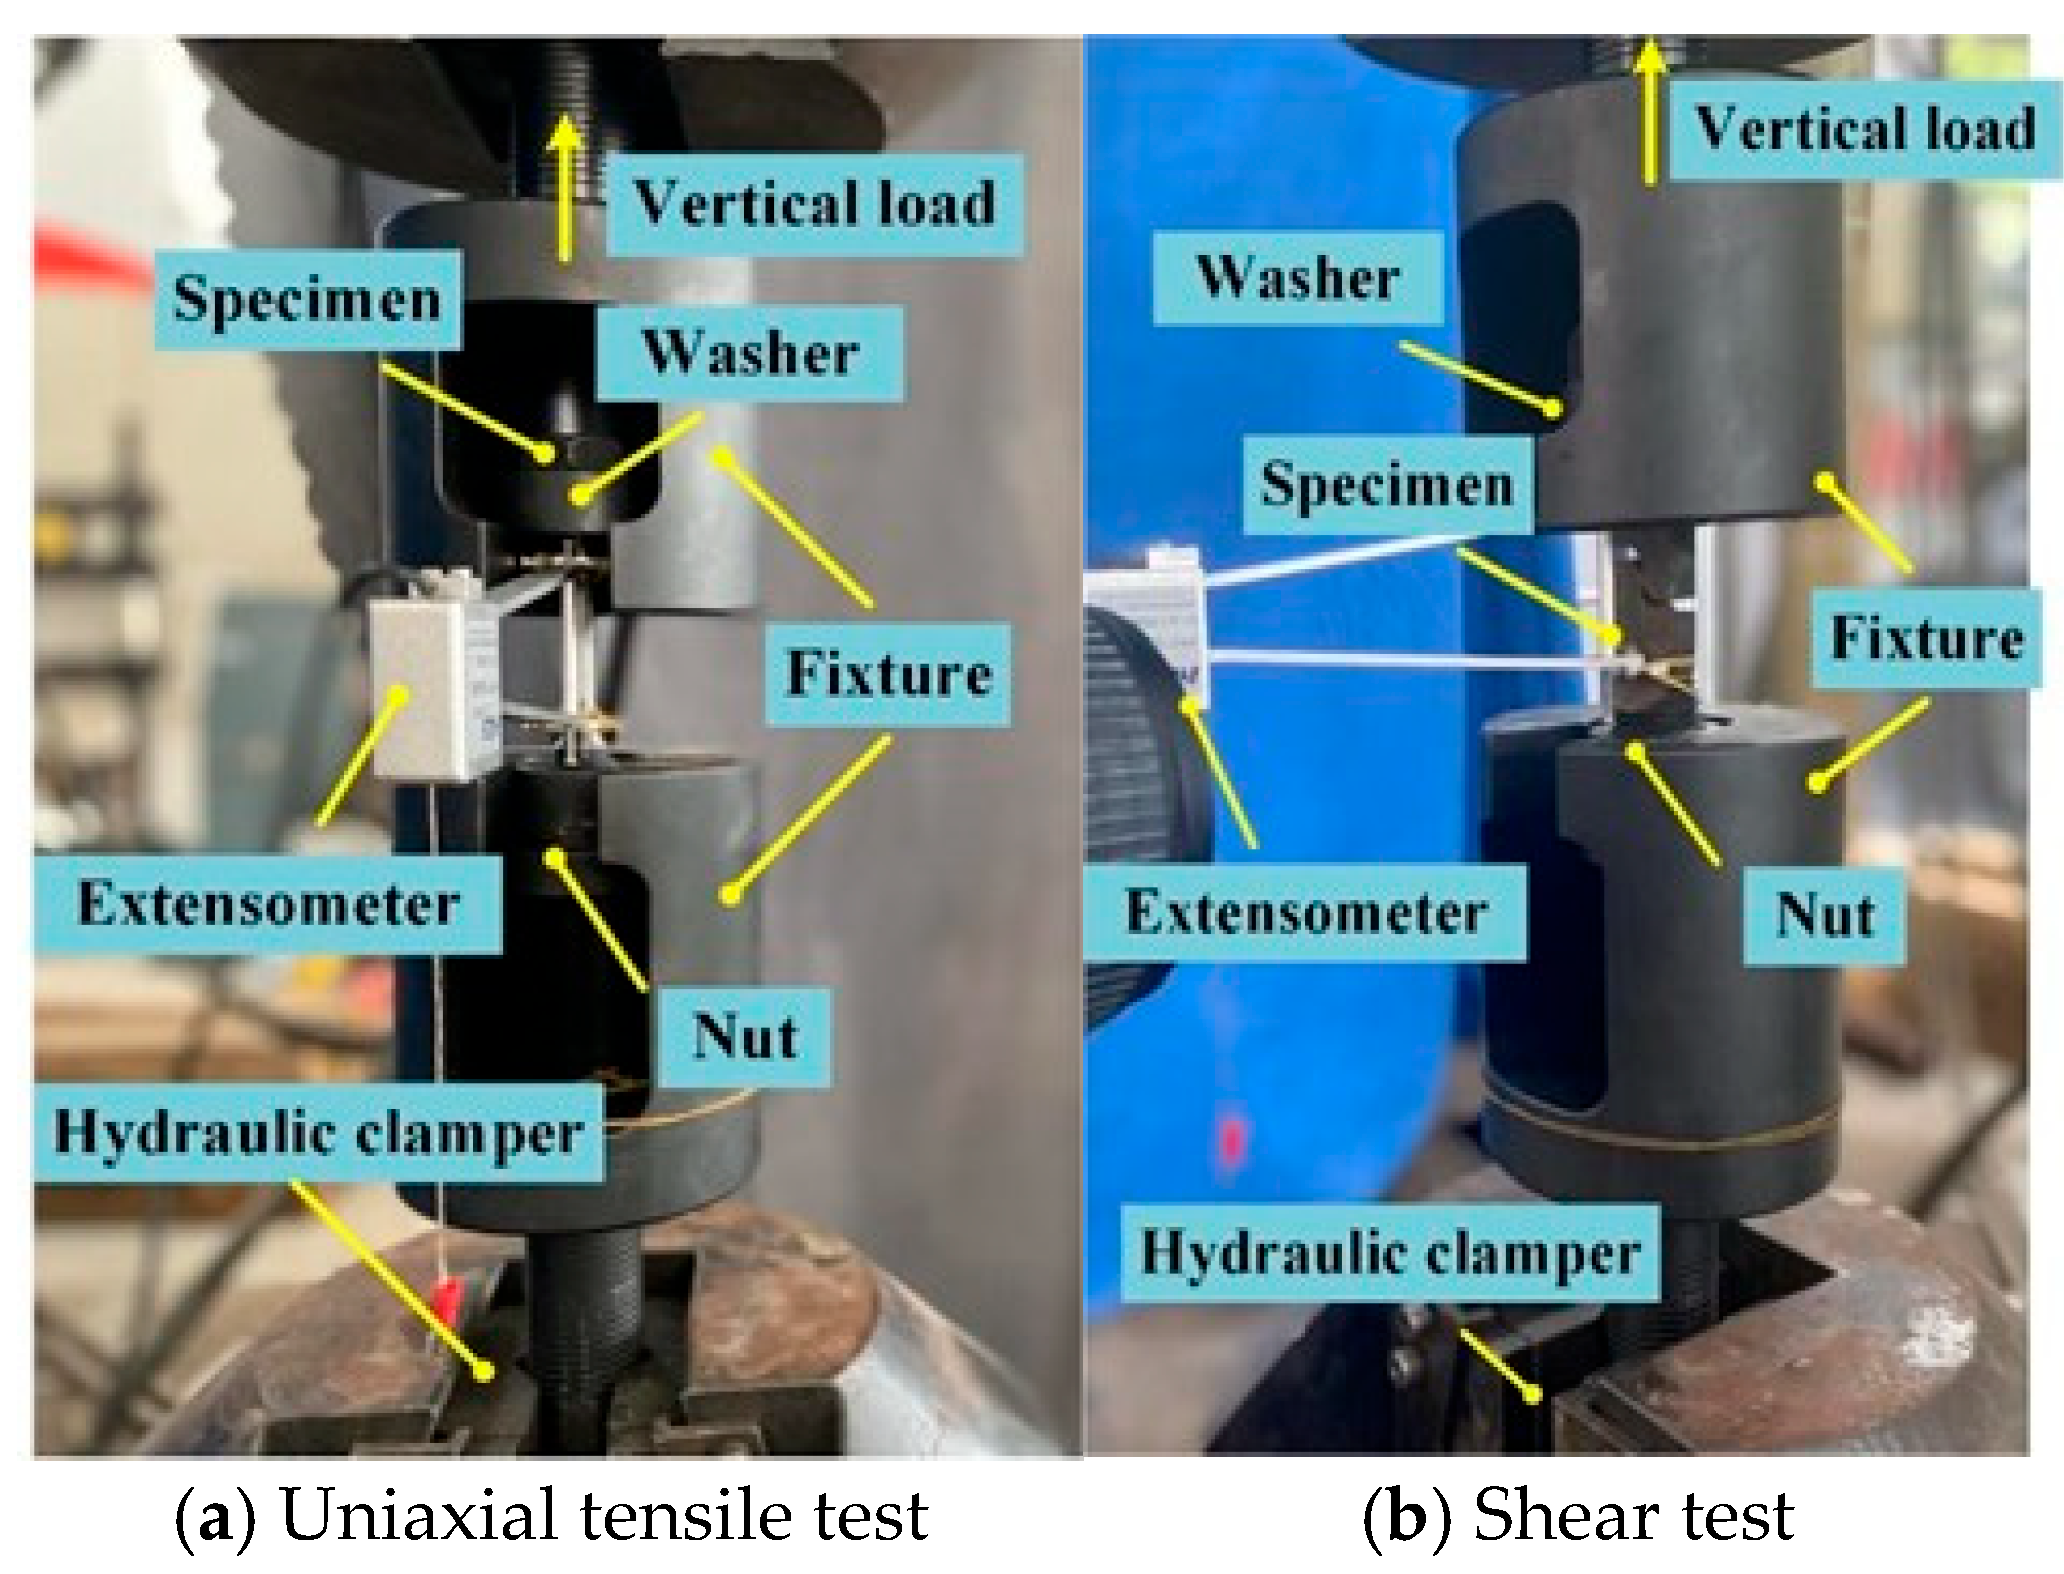
The FEM software ABAQUS version 2020 is used to simulate test coupons of CB and WB high-strength bolts under tension and shear loads [
30]. The same boundary condition is used to apply the tensile and shear loads. Two reference points (RP-1 and RP-2) are located at the cross-sectional centroid at the end, and they are coupled to the clamping parts with all freedoms fixed. RF-1 is used to apply the vertical load with the horizontal freedoms fixed, and the vertical and horizontal freedoms of RF-2 are constrained to the simulated experimental set-up. Quasi-static analysis is adopted to simulate the test loading procedure based on the explicit solver, and the target time increment of stability is set as 0.001 s with a total time of 200 s for both types of specimens.
3.2. Sensitivity Analysis
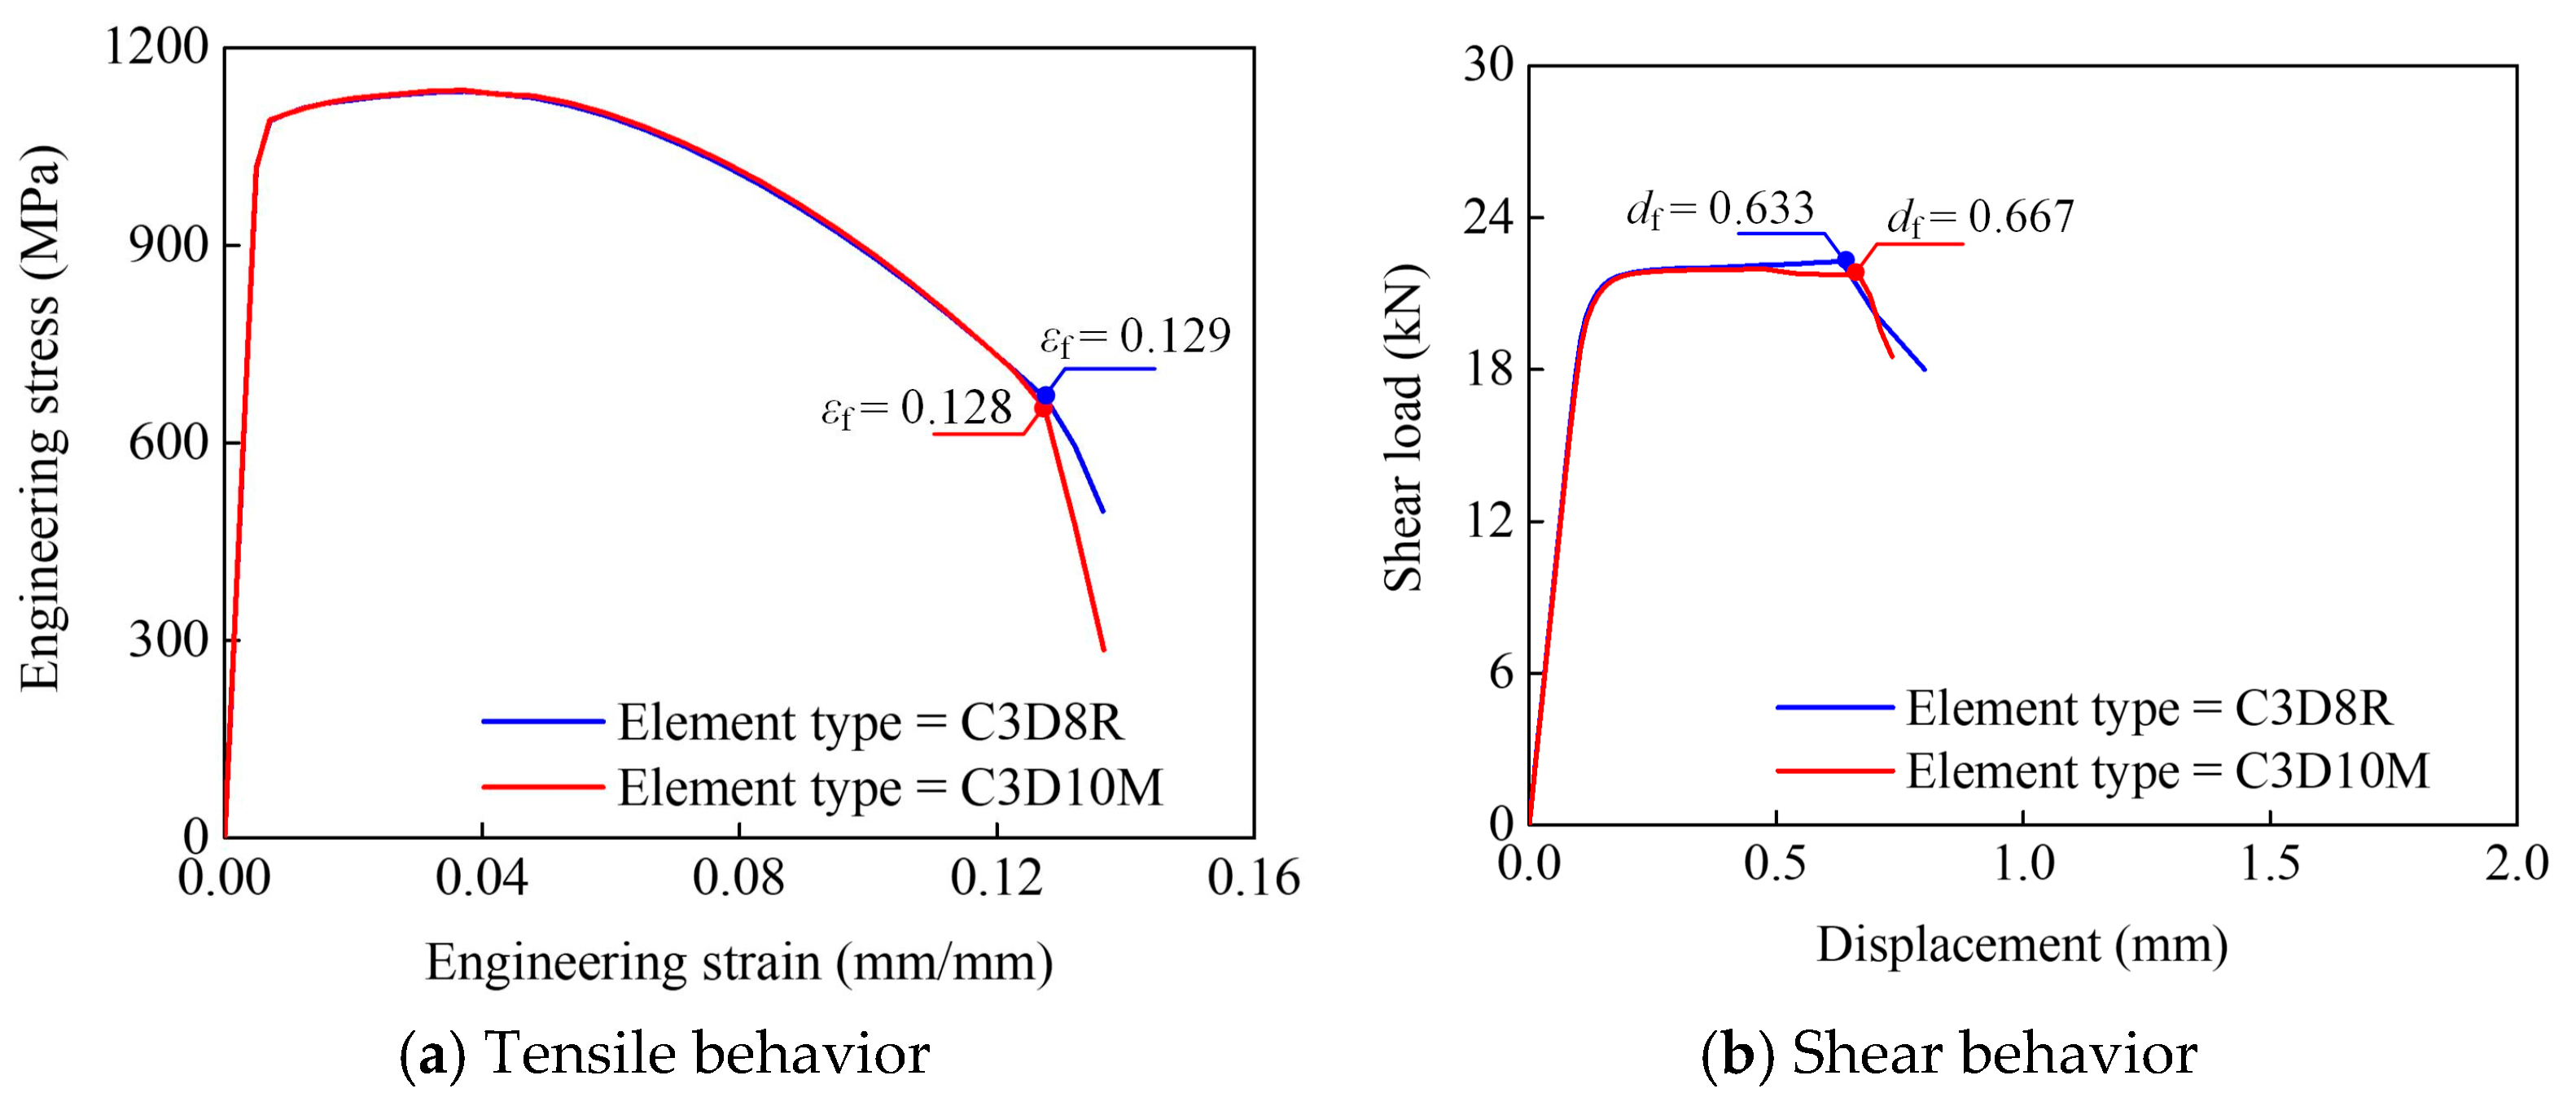
Meshing size and element type selection are two basic points affecting mechanical responses and fracture behavior estimation. FE simulation on tensile and shear coupons of CB24 is presented as an example herein to discuss meshing and element type sensitivity.
Figure 5 presents mesh sensitivity analysis with fracture properties for tensile and shear simulations from a mesh size of 1.00 mm to 0.25 mm. The tensile and shear resistance predicted from mesh size of 1.00 mm are slightly higher than those of 0.50 mm and 0.25 mm with a maximum deviation of less than 3%. A minor deviation (<4%) of tensile and shear fracture prediction is found between the simulation results from a mesh size of 0.50 mm and 0.25 mm, compared to over 14% differential with tension estimated based on a mesh size of 1.00 mm. In addition, the time consumption of the mesh size at 0.50 mm is only 1/16 that seen at 0.25 mm.
Therefore, both tensile and shear coupons follow the coarse-to-refined element meshing strategy, in which the mesh size of 0.5 mm is set to the tensile parallel gauge and the shear plane of the test coupons, while the element size is smoothly transitioned into 2 mm at the clamping parts. Such an element size being chosen can accurately simulate the tension and shear behavior of steel components and reduce the calculation time based on the mesh sensitivity analysis, which is also confirmed in the literature [
13].
Two commonly used element types in FE modeling are 8-node hexahedral solid elements with reduced integration (C3D8R) and 10-node modified tetrahedron (C3D10M).
Figure 6 presents sensitivity analysis with fracture properties for tensile and shear simulations from the element types of C3D8R to C3D10M. It is found that the engineering stress–strain relations of tensile behavior captured by both element types are consistent, and the minor differences in the shear resistance and fracture point are also present in the shear load–displacement curves. Accordingly, both types of C3D8R and C3D10M can simulate the tensile and shear behaviors of specimens well, where C3D8R has the advantage of time–cost saving and C3D10M is capable of meshing heterosexual geometries, like bolt threads. Therefore, tensile and shear specimens are meshed by C3D8R following the media axis to improve the mesh transition, and C3D10M is applied to simulate high-strength bolts with real threads in the following section.
3.3. True Stress–Strain Relation
The stress–strain relation input of the FE model should be the true stress
σt and the true strain
εt considering the homogeneous and necking deformation of the test coupons, while stress–strain curves are directly obtained from the tension test, called the engineering stress and strain
σe and
εe. In general, the uniform deformation of tensile coupons is captured at the yield and strain-hardening stage for metal materials under tension, and thus the engineering stress–strain curve can be converted into the true stress–strain relation based on Equations (1) and (2), given the cross-sectional deformation along the gauge part.
As necking within the tensile parallel gauge, the regional inhomogeneous deformation leading to the above equations cannot be continuously used to calibrate the true stress–strain relation. Hence, the mathematical expression, called the combined S-V model, is proposed and verified to be capable of describing the tensile behavior of high-strength bolts, expressed as Equation (3), where the material parameters
SA and
nS can be calibrated based on Swift’s model, and
VA and
nV based on Voce’s model. In addition, the hardening stress and strain
σt and
εt are re-defined as the beginning of the strain-hardening curve, and ε
h can be obtained by ε
h = ε
t − ε
t,hard;
k is the weighting factor.
The tensile true stress–strain relation calibrated from the tensile coupon test is usually inputted into the FE model to investigate structural behavior under various stress state. However, recent studies [
12,
13,
29] indicate that the shear capacity, ductility and failure modes of steel components may be inaccurately estimated based on the tension true stress–strain relation considering the von Mises criterion. To accurately simulate steel structural responses, the modified shear constitutive model, in collaboration with Ling’s weighted model [
5], is proposed to describe the steel shear stress–strain relation, as expressed in Equation (4) [
13,
31]. The modified shear true stress σ
p,s can be obtained from the stress σ
p,sw, recalibrating the weight factor
k, multiplied by the shear factor
α. It is noted that study on the modified shear model with the combined S-V model characterizing the shear true stress–strain relation is very limited, and it is worthwhile to discuss it deeply.
3.4. Ductile Fracture Model for Shear-Dominated State
The ductile fracture behavior of steel structures predicted by the FE model is highly relative to the fracture properties input calibrated from coupon tests. The fracture criterion and the true stress–strain relation can be separately considered in the uncoupled damage model, and fewer material fracture parameters are required in comparison to the coupling model. Hence, the uncoupled damage model is more appropriate for engineering analysis.
The Bao and Wierzbicki model (BW model) with only two material parameters [
22], as one of the uncoupled damage models, is proved to describe the tensile and shear fracture behaviors of steel structures, and thus it could be also applied to discuss those of high-strength bolts. As expressed in Equation (5), the BW model defines the relation between the stress triaxiality
η and the fracture plastic strain (PEEQ), where
C1 and
C2 represent the shear and tension parameters obtained from the corresponding tests.
In Equation (5), metal fracture dominated by shear failure is defined as −1/3 ≤
η ≤ 0. The stress triaxiality
η =
η0 = 1/3 is found as the boundary to determine void growth at
η ≥
η0 = 1/3 and the combined failure mechanism at 0 ≤
η ≤ 1/3.
Additionally, the fracture evolution law following Equation (6) is defined to dominate the initial fracture happening. The damage index
ωf is the integration of the equivalent plastic strain
by the fracture strain
, and it is 1.0 when deciding fracture initiation.
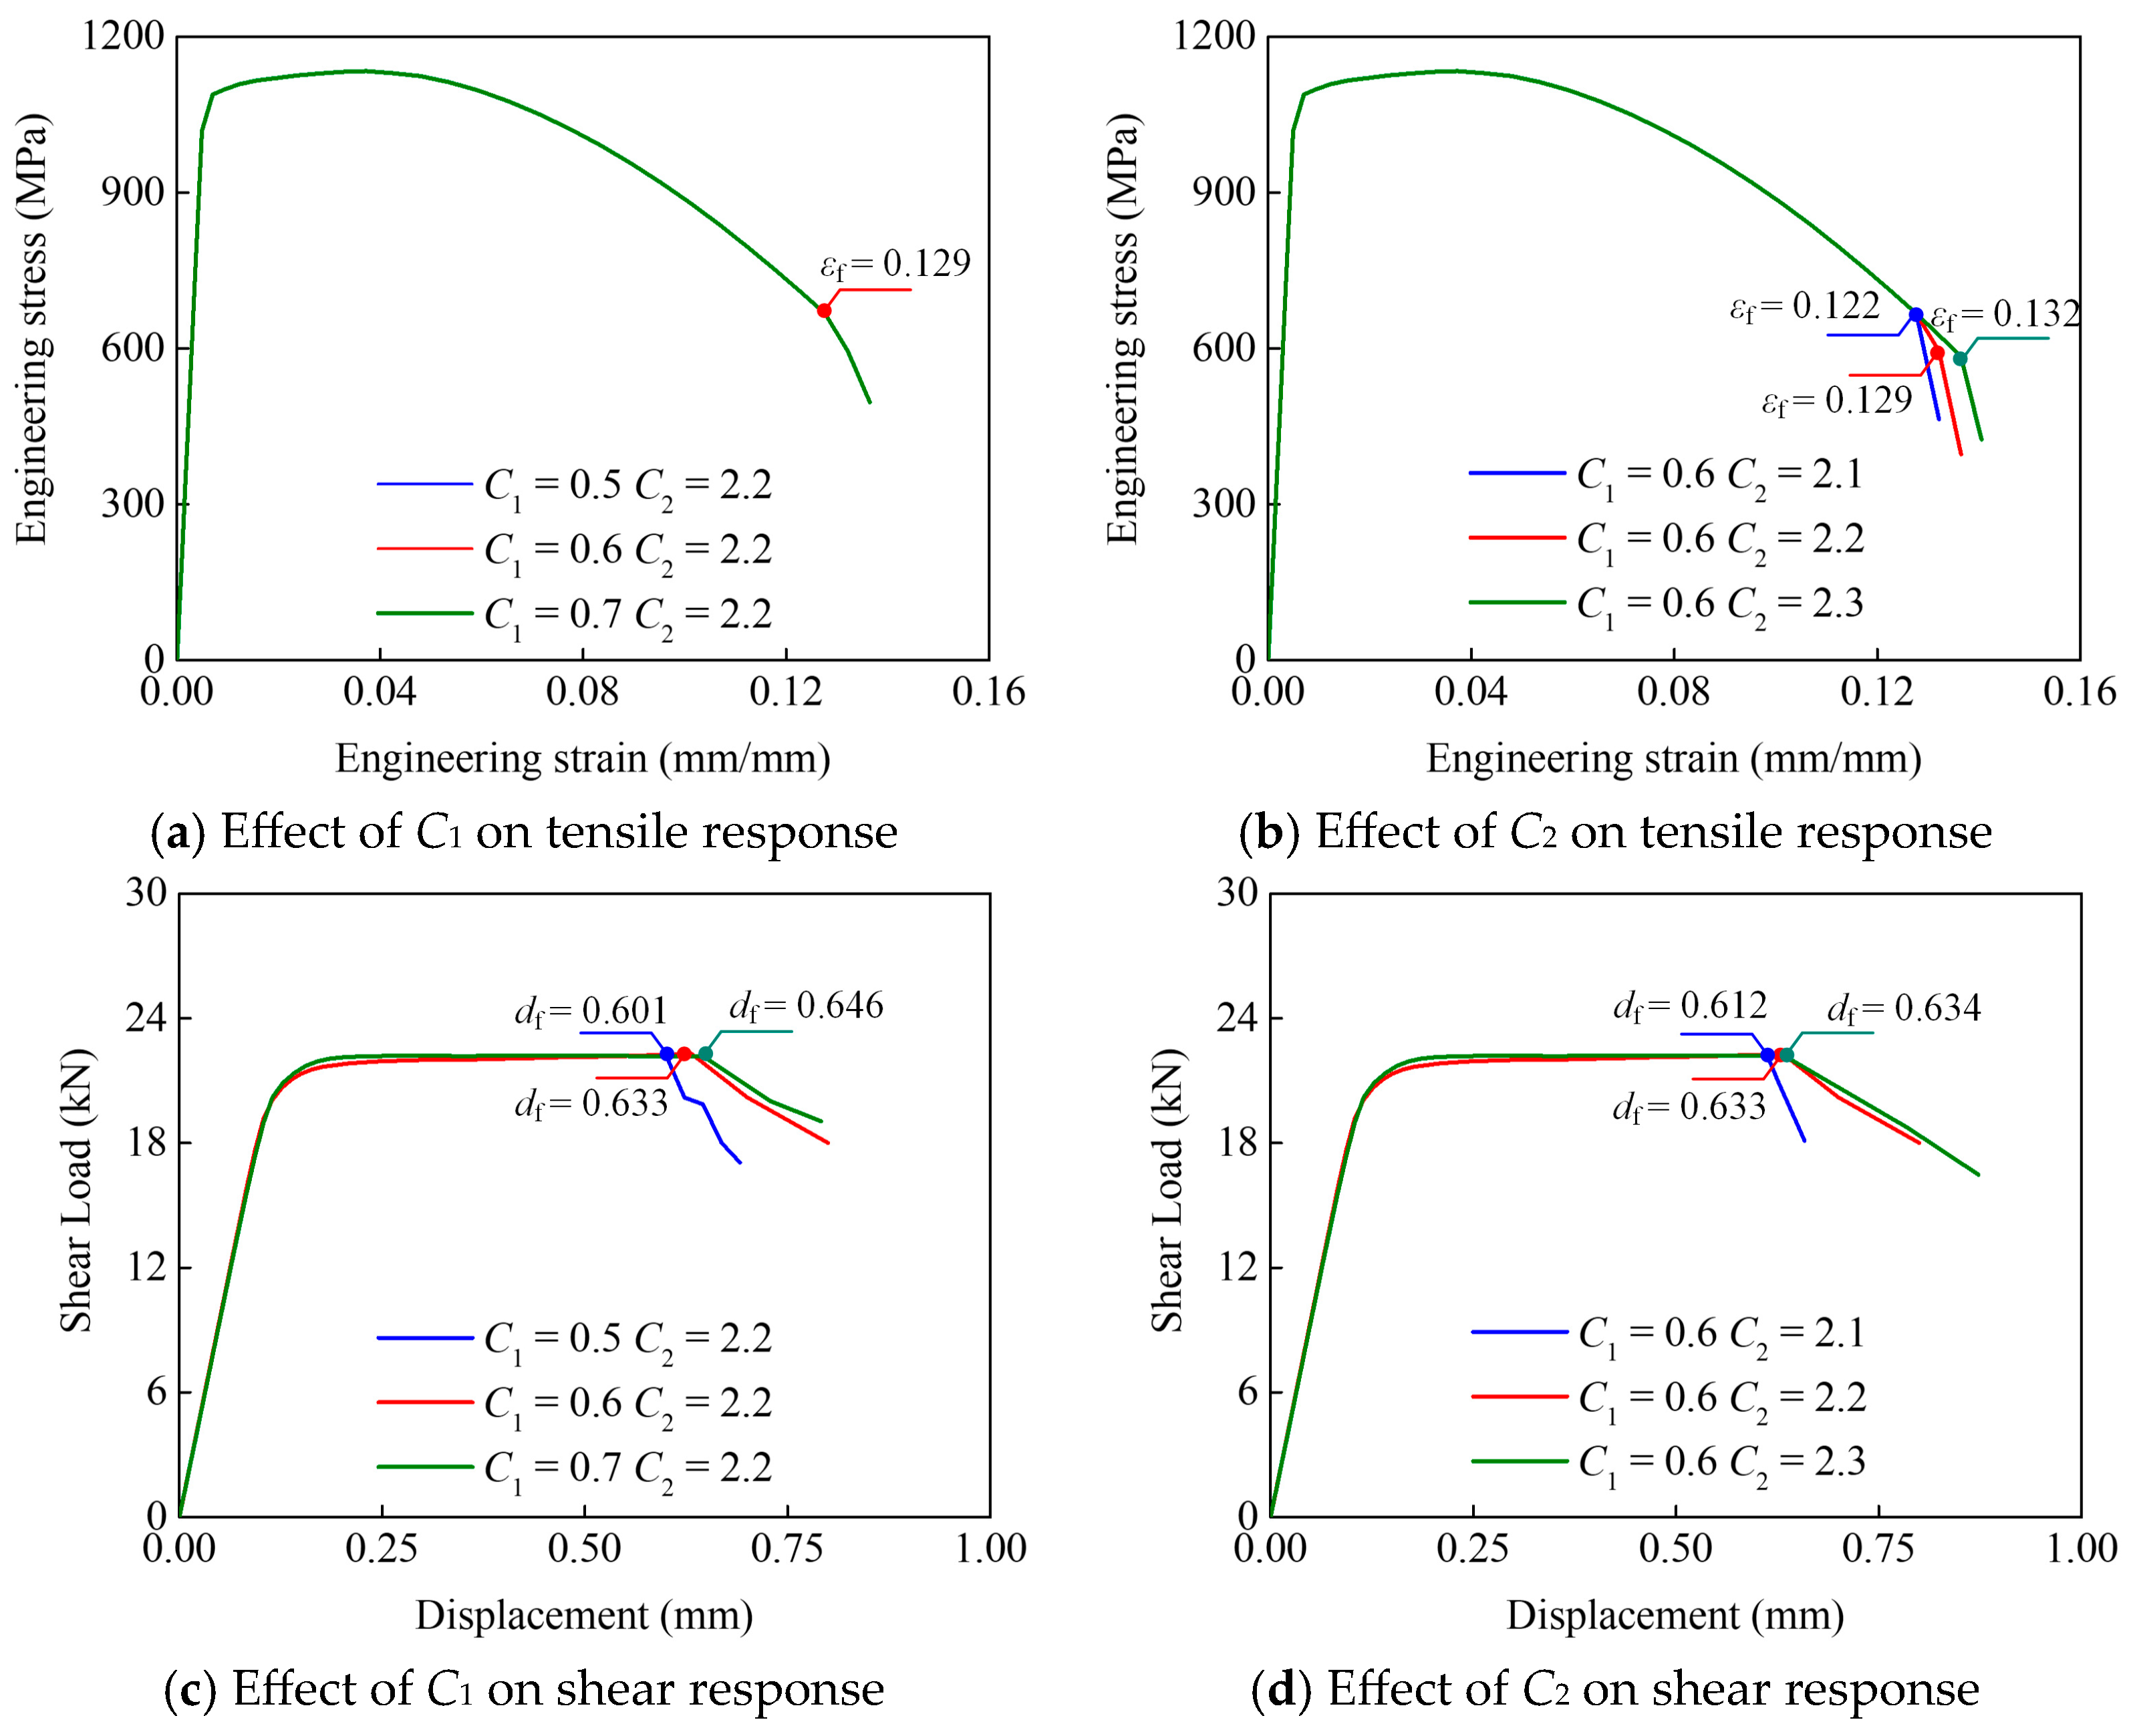
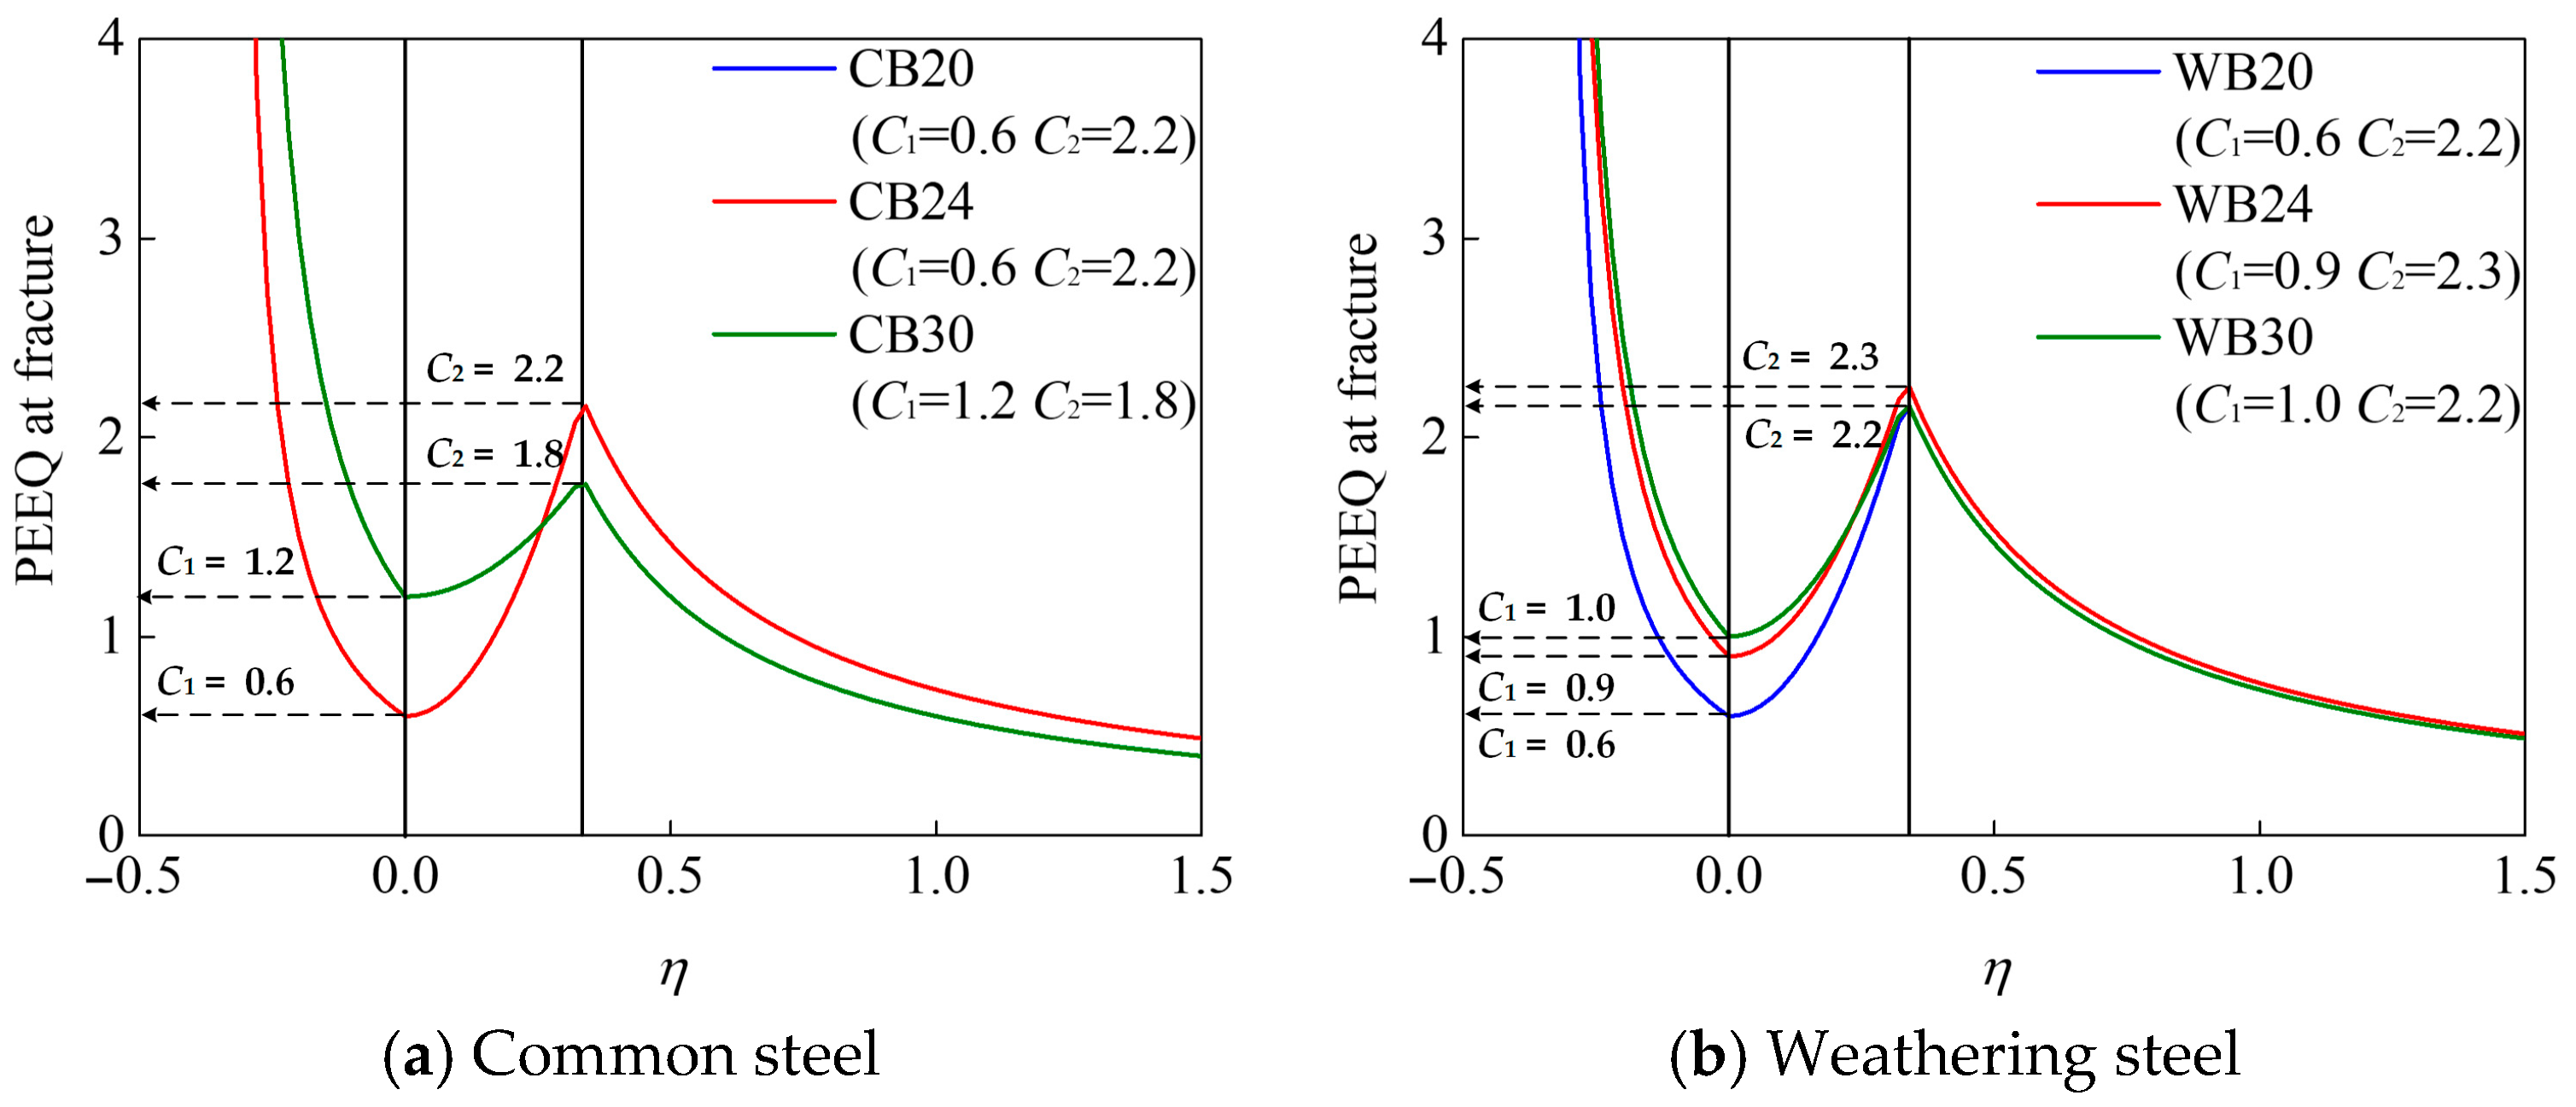
Figure 7 shows the effect of the parameters
C1 and
C2 on tensile and shear fracture responses. The tensile and shear responses of CB24 are also taken as an example herein. It is found that the parameter
C1 governing shear fracture shows a negligible impact on tensile fracture initiation, while the tensile parameter
C2 shows a positive effect on the fracture displacement corresponding to
C2 from 2.1 to 2.3. Both parameters
C1 and
C2 represent a positive correlation to shear fracture responses, but the effect of the shear parameter
C1 (deviation > 5%) is much more significant than that of the tensile parameter
C2 (deviation < 3%).
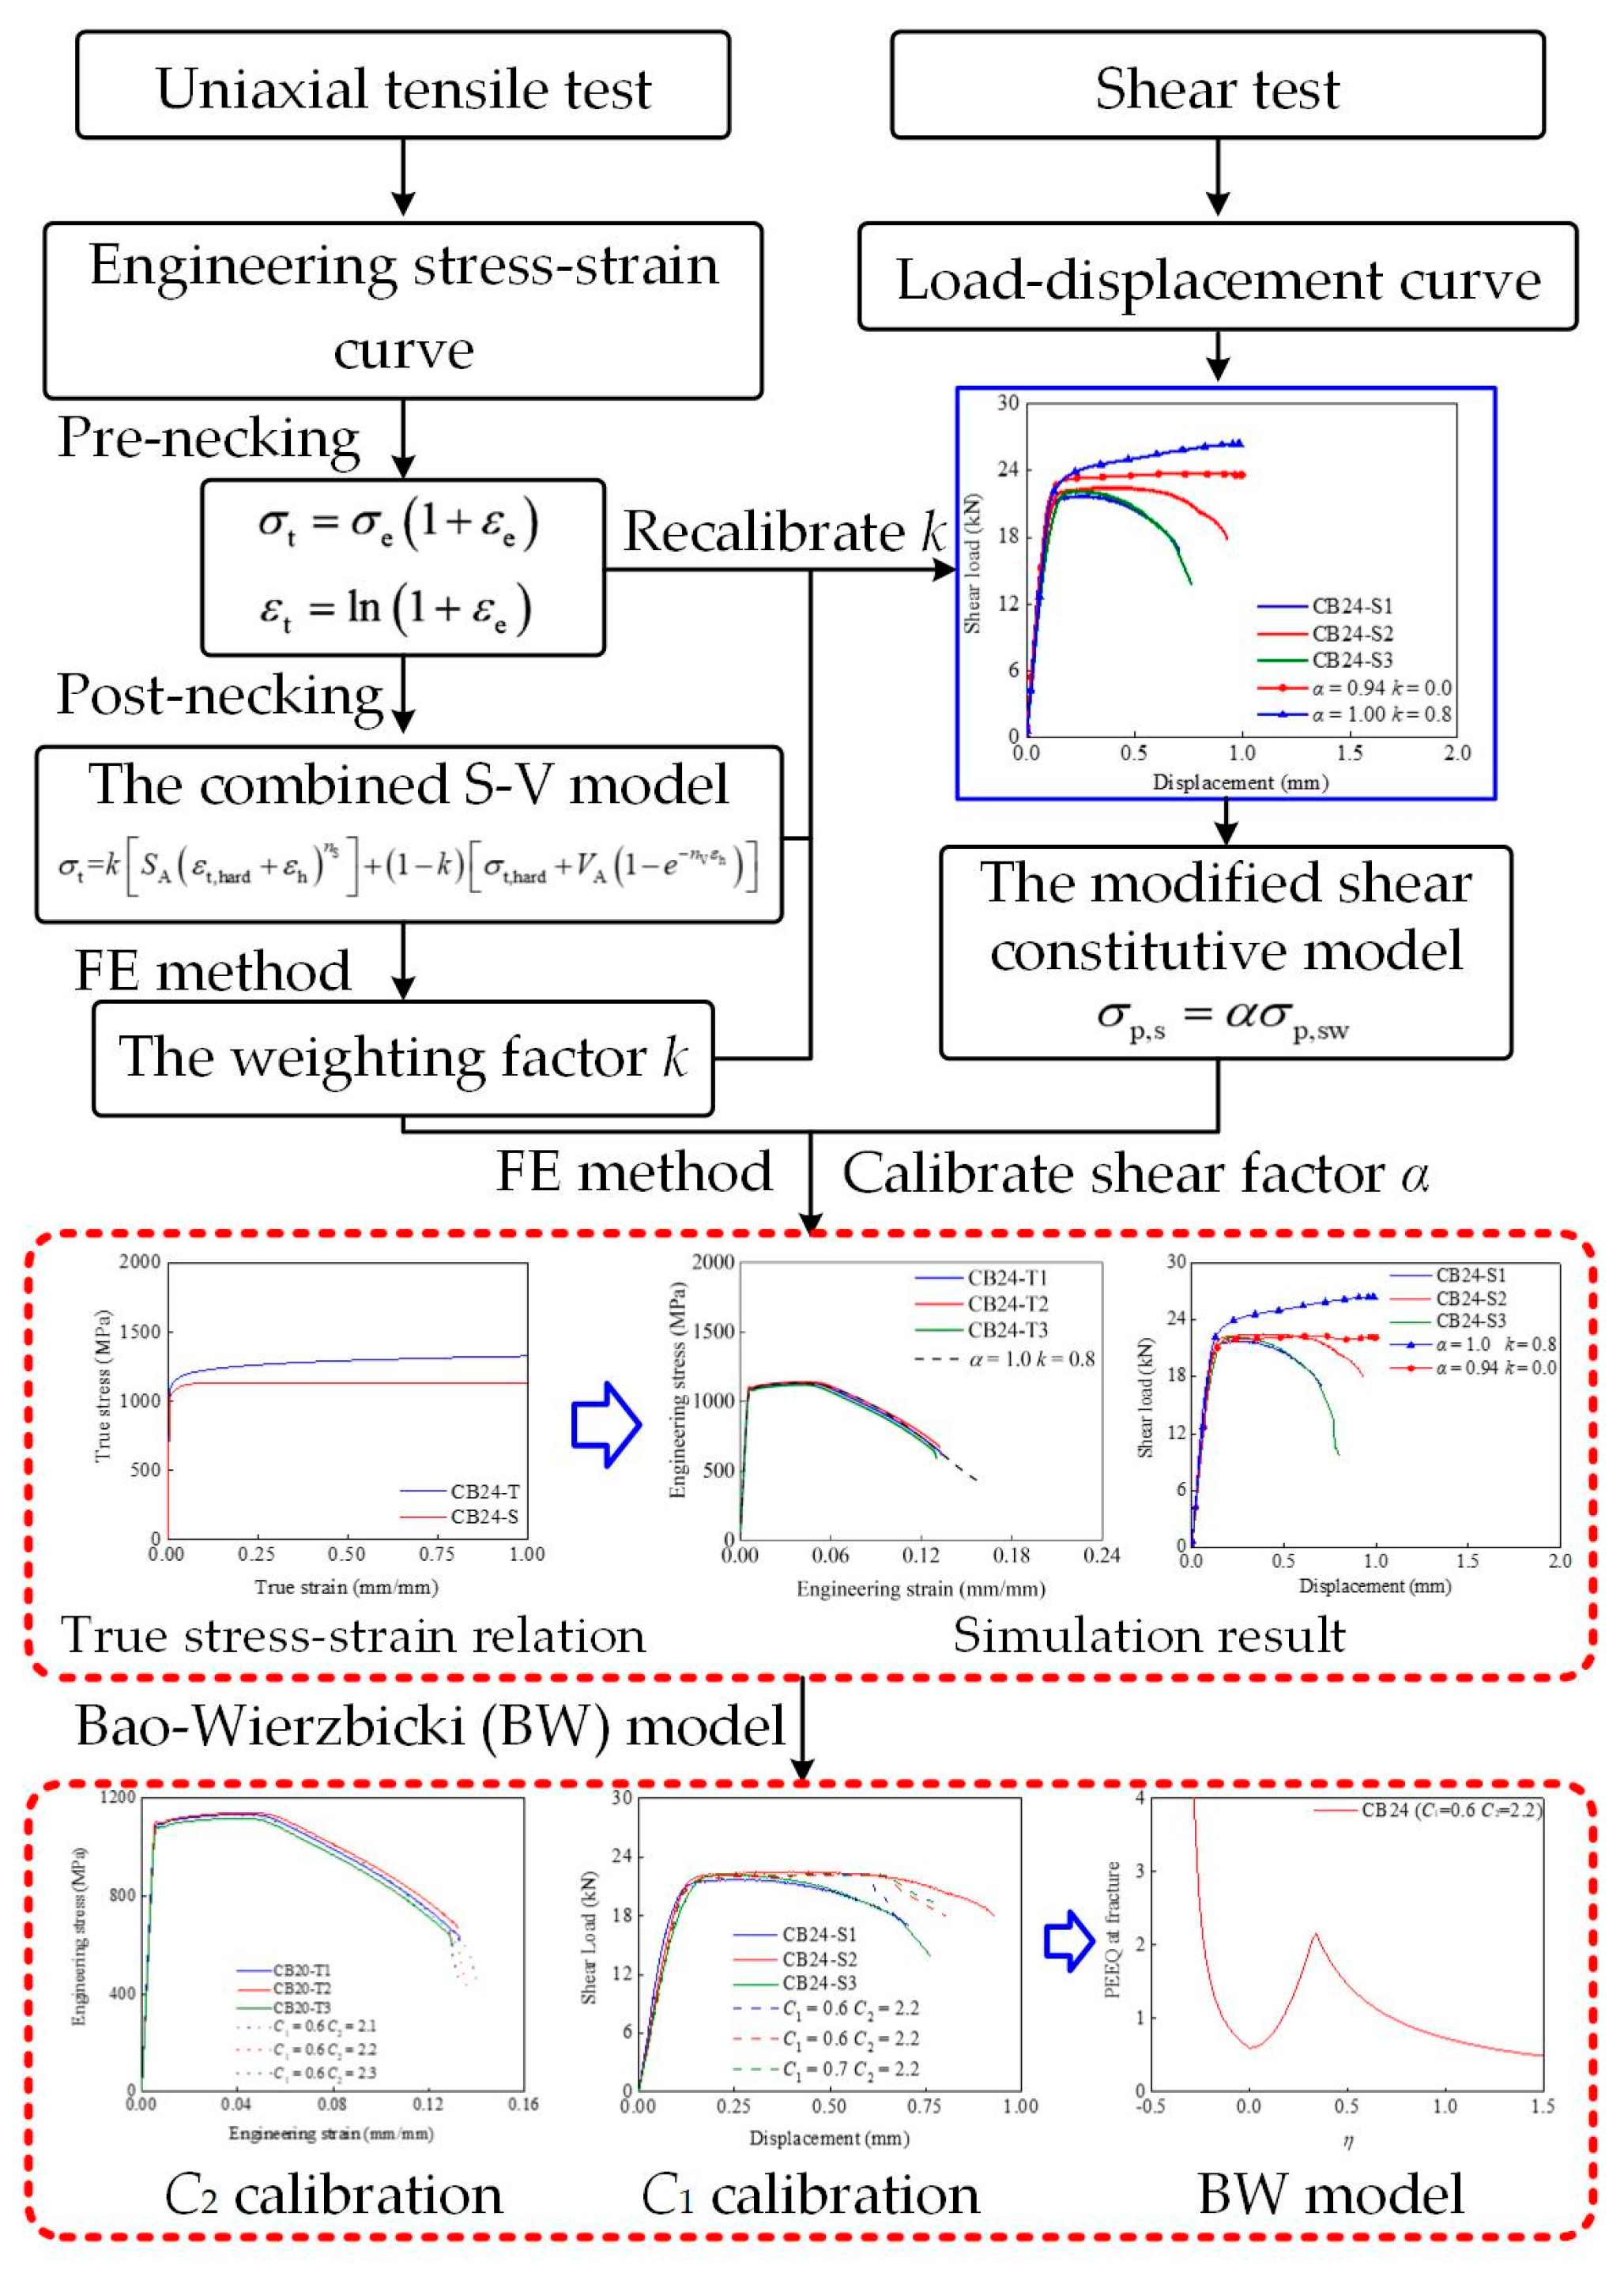
3.5. Calibration Process
Figure 8 shows the calibration process for capturing the true stress–strain relation and damage model, also taking CB24 as the example. Pre-necking engineering stress–strain curves obtained from uniaxial tensile tests are transferred to the true stress–strain relation, and then the combined S-V model is used to describe the true stress–strain relation after necking, with the collaboration of the FE method to decide the weight factor
k, thereby finishing the tensile true stress–strain relation calibration. Such a calibration could be found in the literature [
8].
As shown in
Figure 8, the tensile true stress–strain relation is used to capture the shear true stress–strain curve. The weight factor
k needs to be recalibrated first to the shear responses (reflected in the load–displacement curve) similar to the shear test. It is found that the curve characteristics between the simulation and experimental results are consistent, but the corresponding shear load in the load–displacement curve from the FE method is higher than in the experimental results. Hence, the shear factor
α needs to be calibrated based on the modified shear constitutive model next, and the shear factor
α is used to convert the stress–strain relation (with a recalibrated
k) to the shear true stress–strain relation, in which all true stress is reduced by the shear factor
α. Hence, the tensile and shear true stress–strain relation is captured, respectively, and capable of demonstrating the description of tensile and shear behavior without fracture.
Based on the tensile and shear true stress–strain relation, the BW model expressed in Equation (5) is employed to describe the fracture behaviors of high-strength bolts. Referring to
Figure 7, the tensile fracture of the high-strength bolts is dominated by the parameter
C2, but both parameters
C1 and
C2 would influence their shear fracture. Accordingly, it is first necessary to calibrate the parameter
C2, based on the comparison of the initial fracture points between the numerical and experimental results. And then, the same method is used to capture the shear parameter
C1 regarding to the shear true stress–strain relation and shear imitation. Finally, both the true stress–strain relation and ductile fracture criterion of high-strength bolts are calibrated for the tensile- and shear-dominated states.
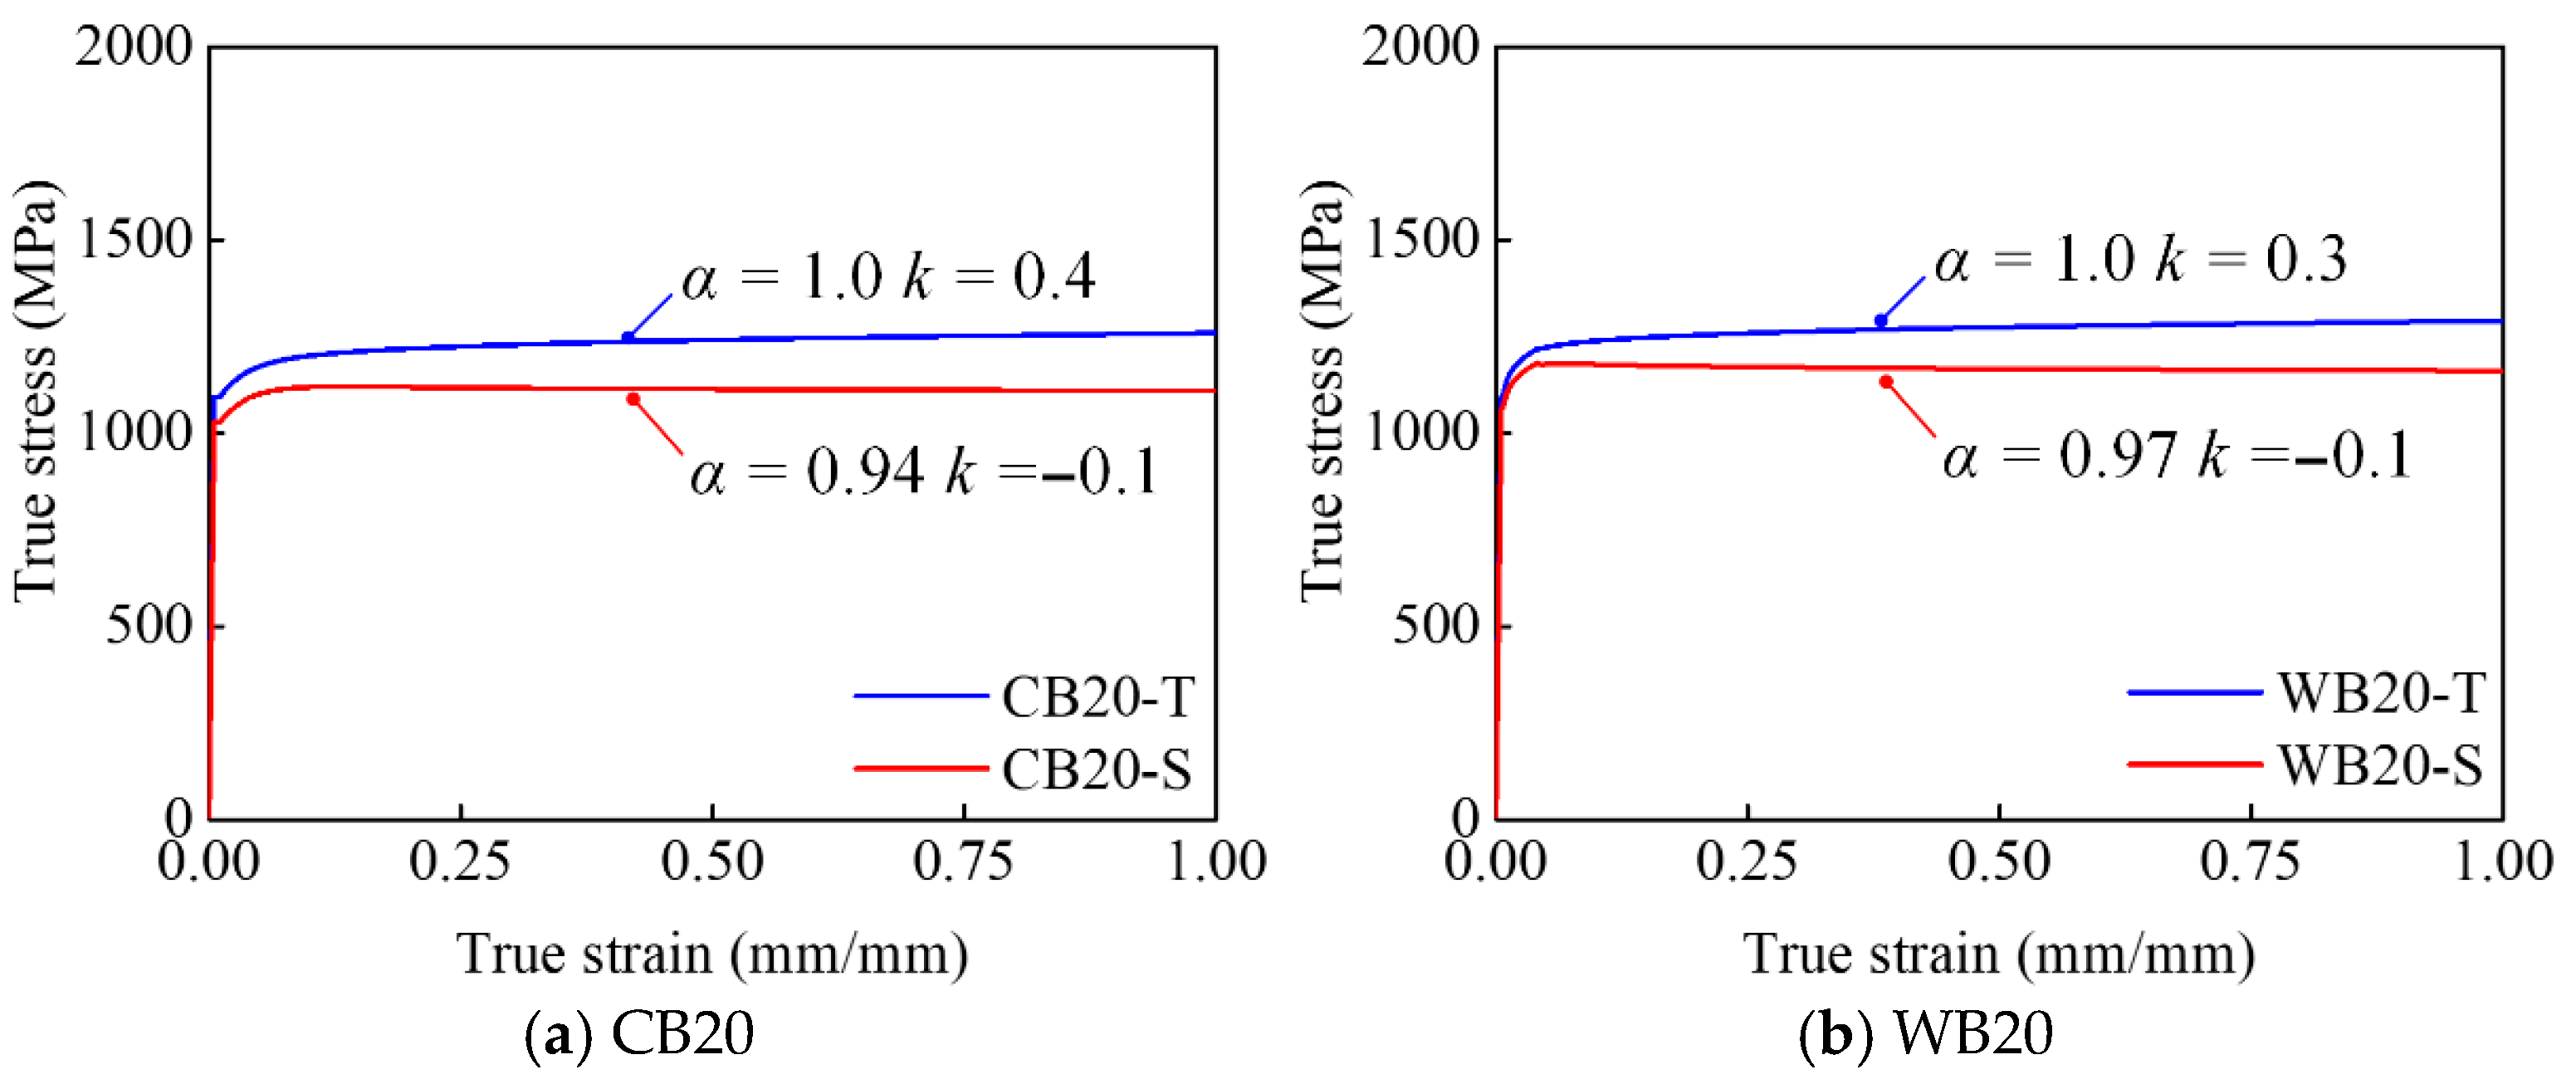
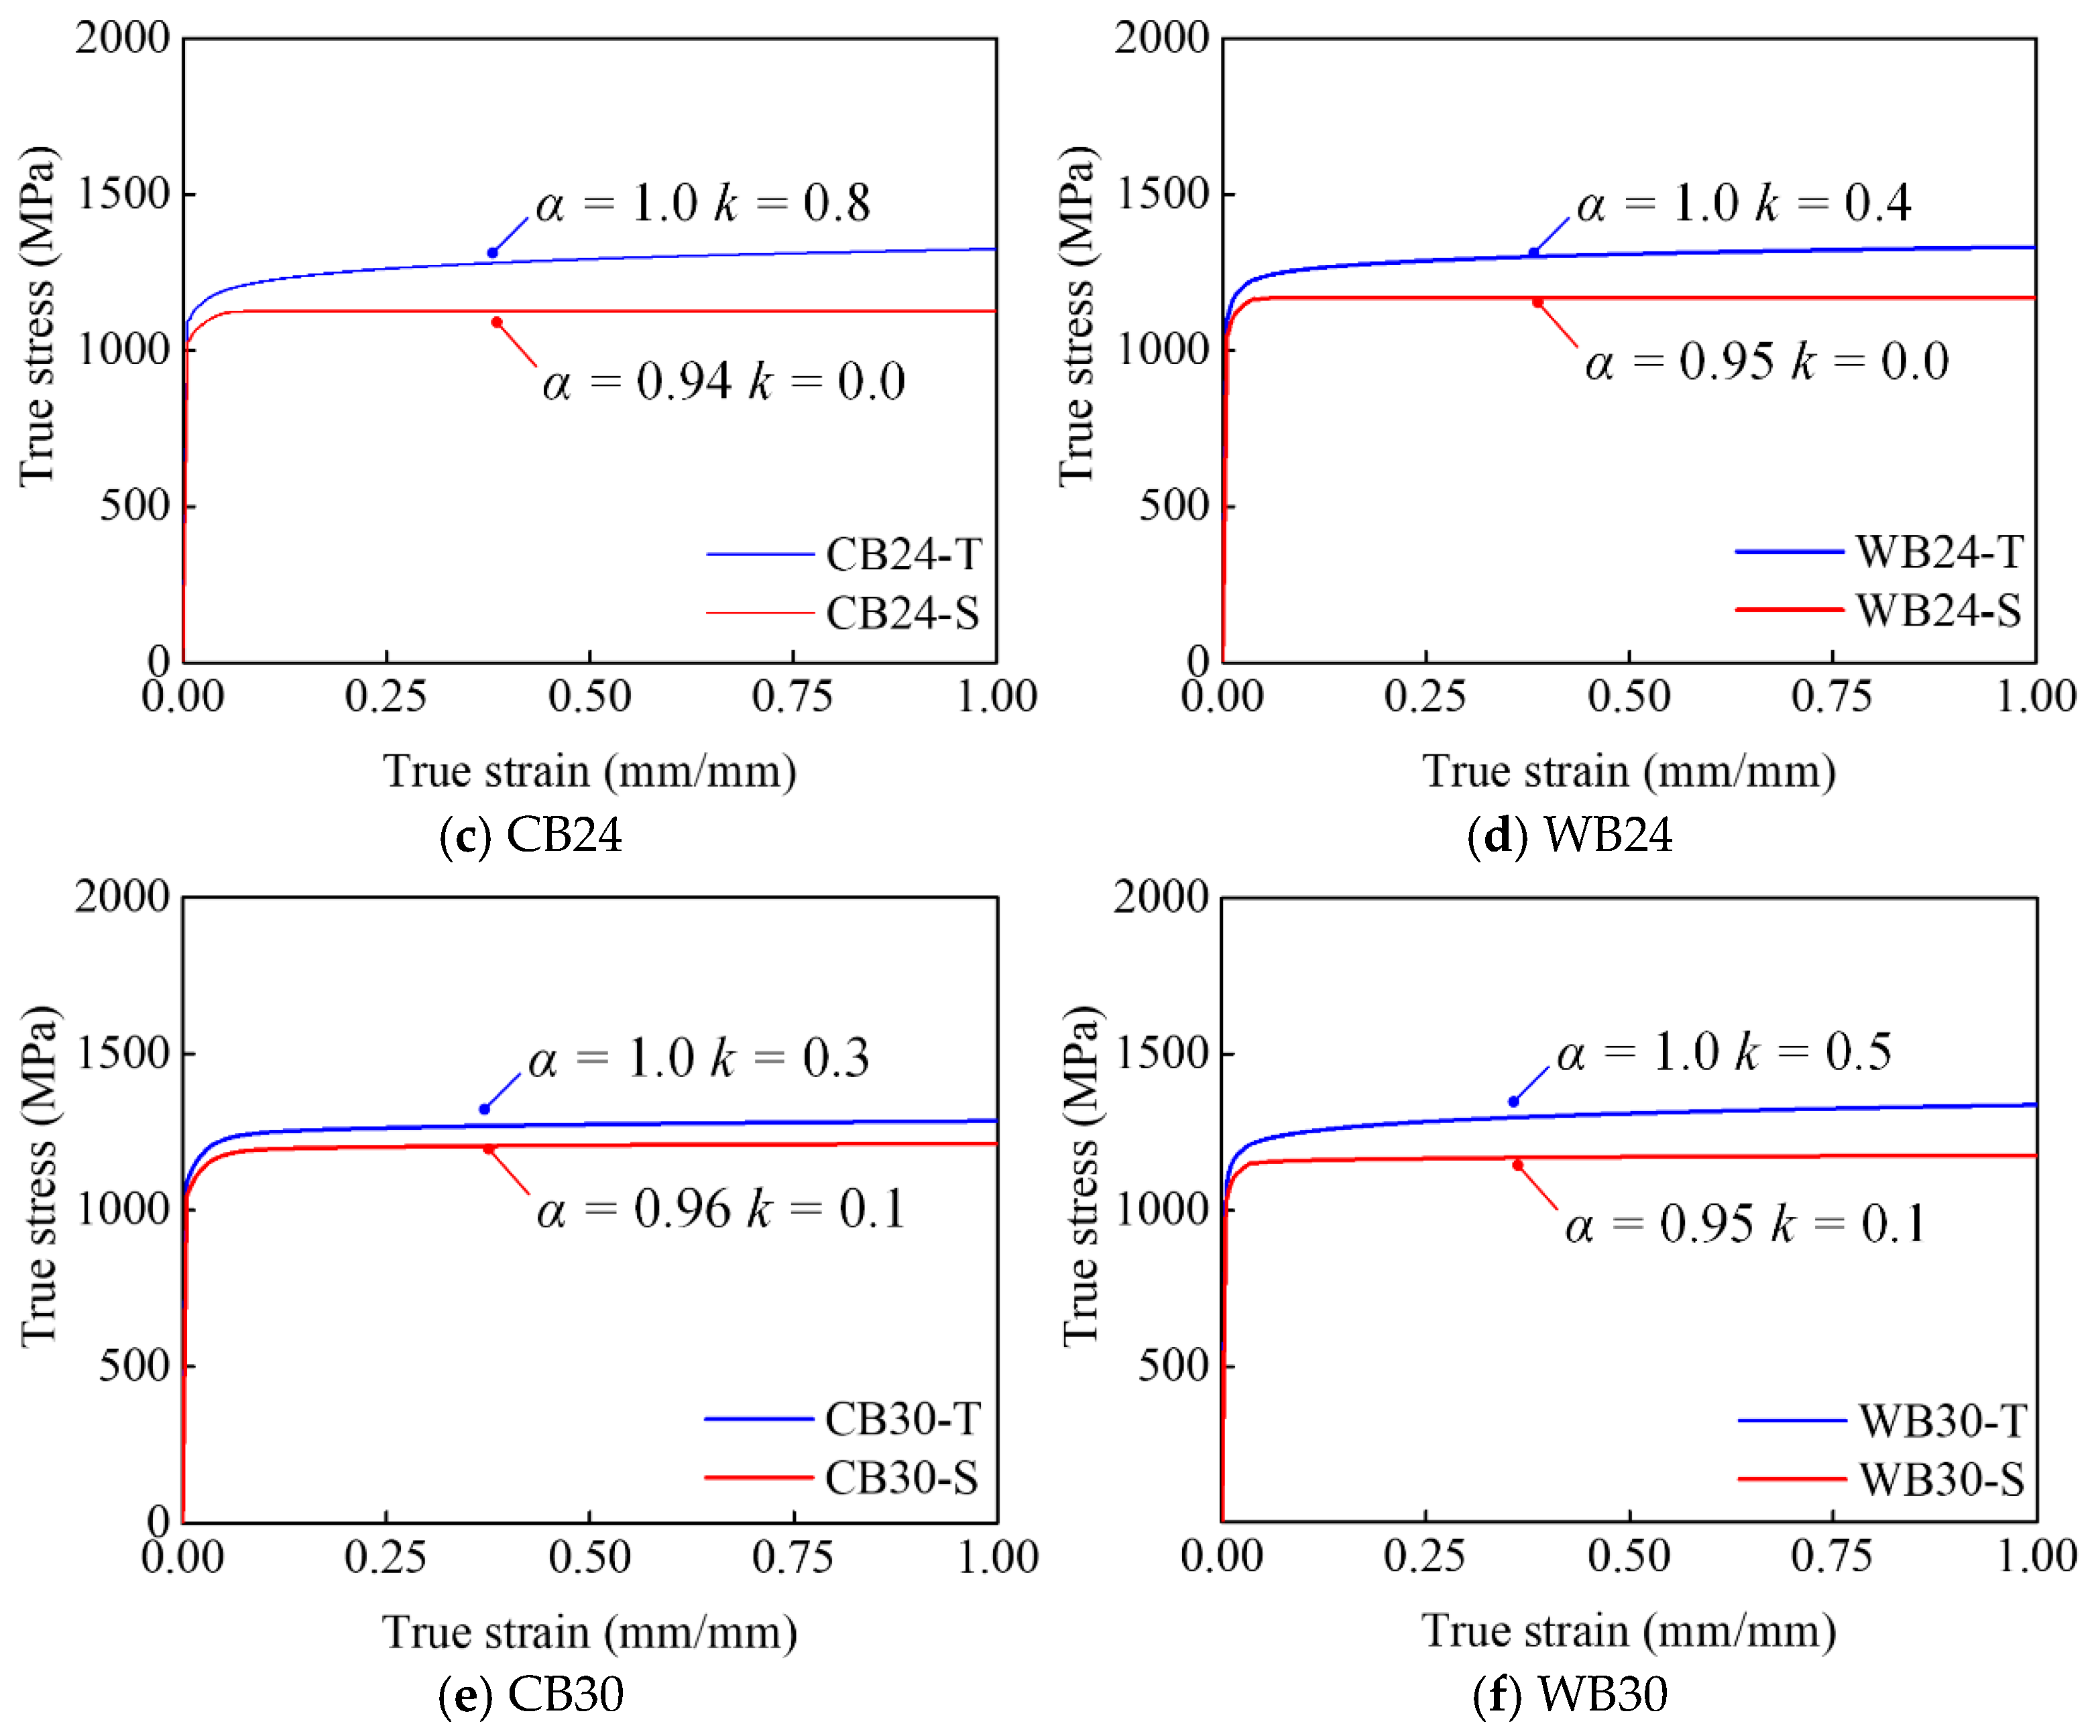
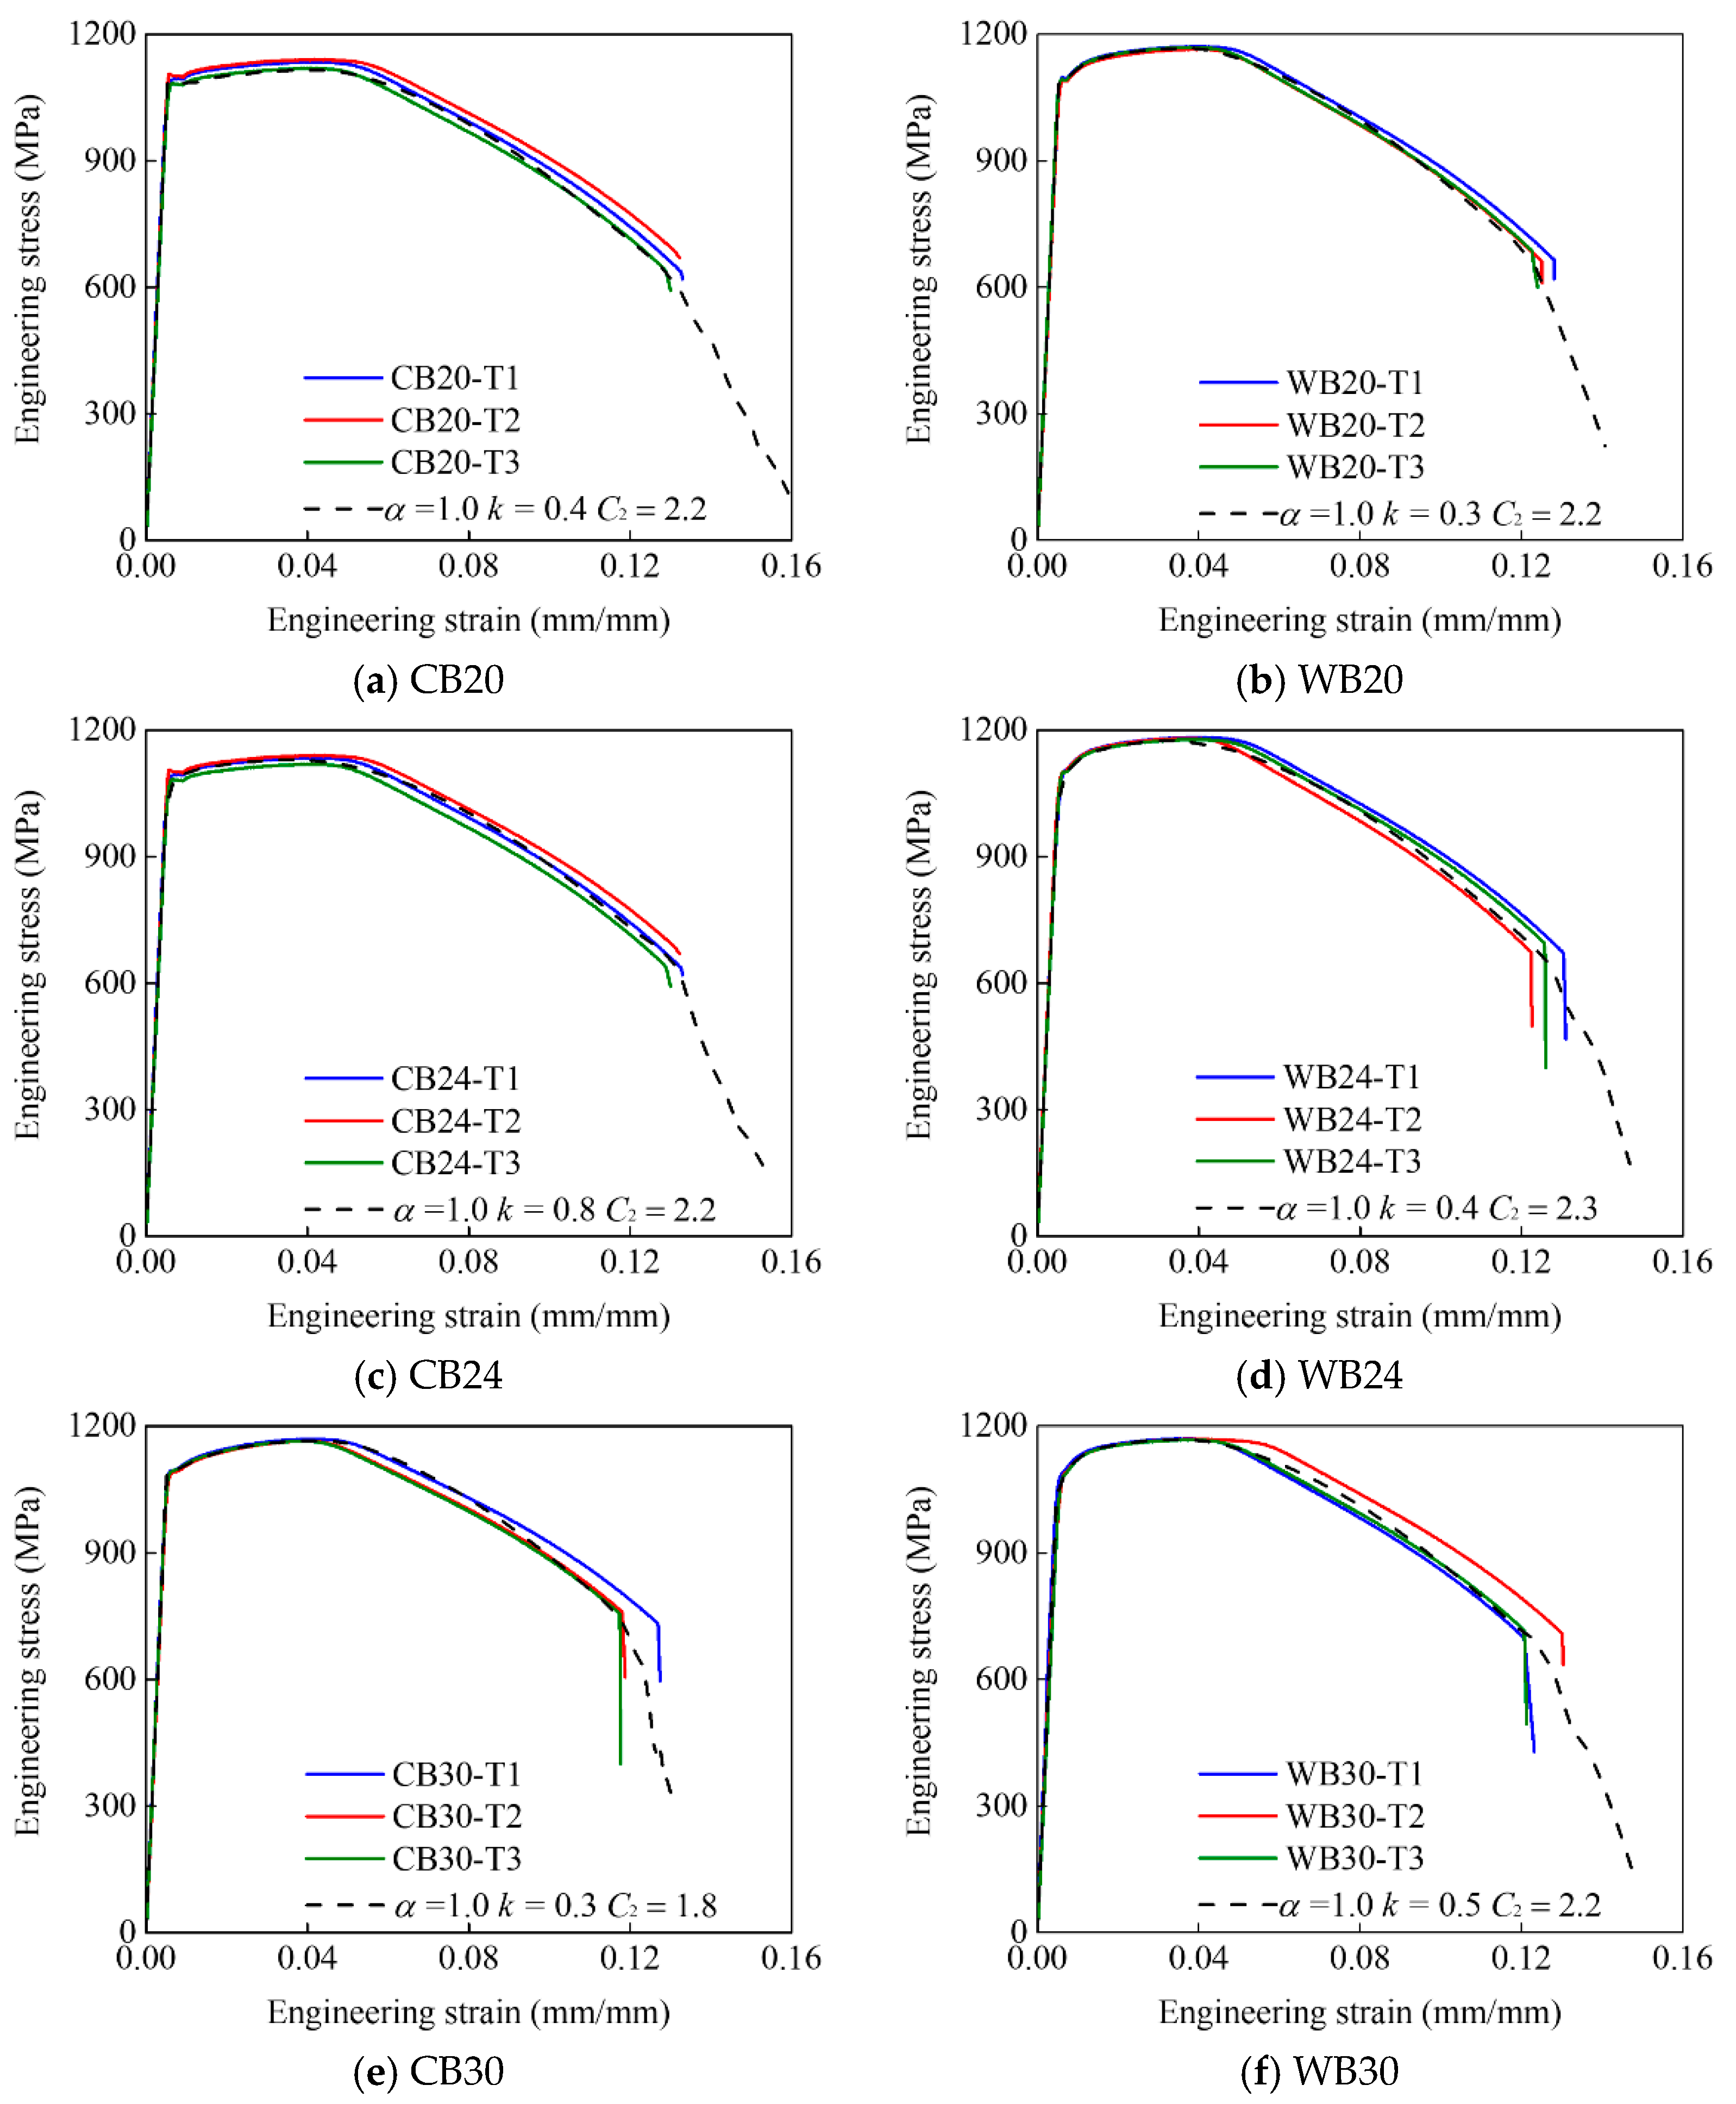
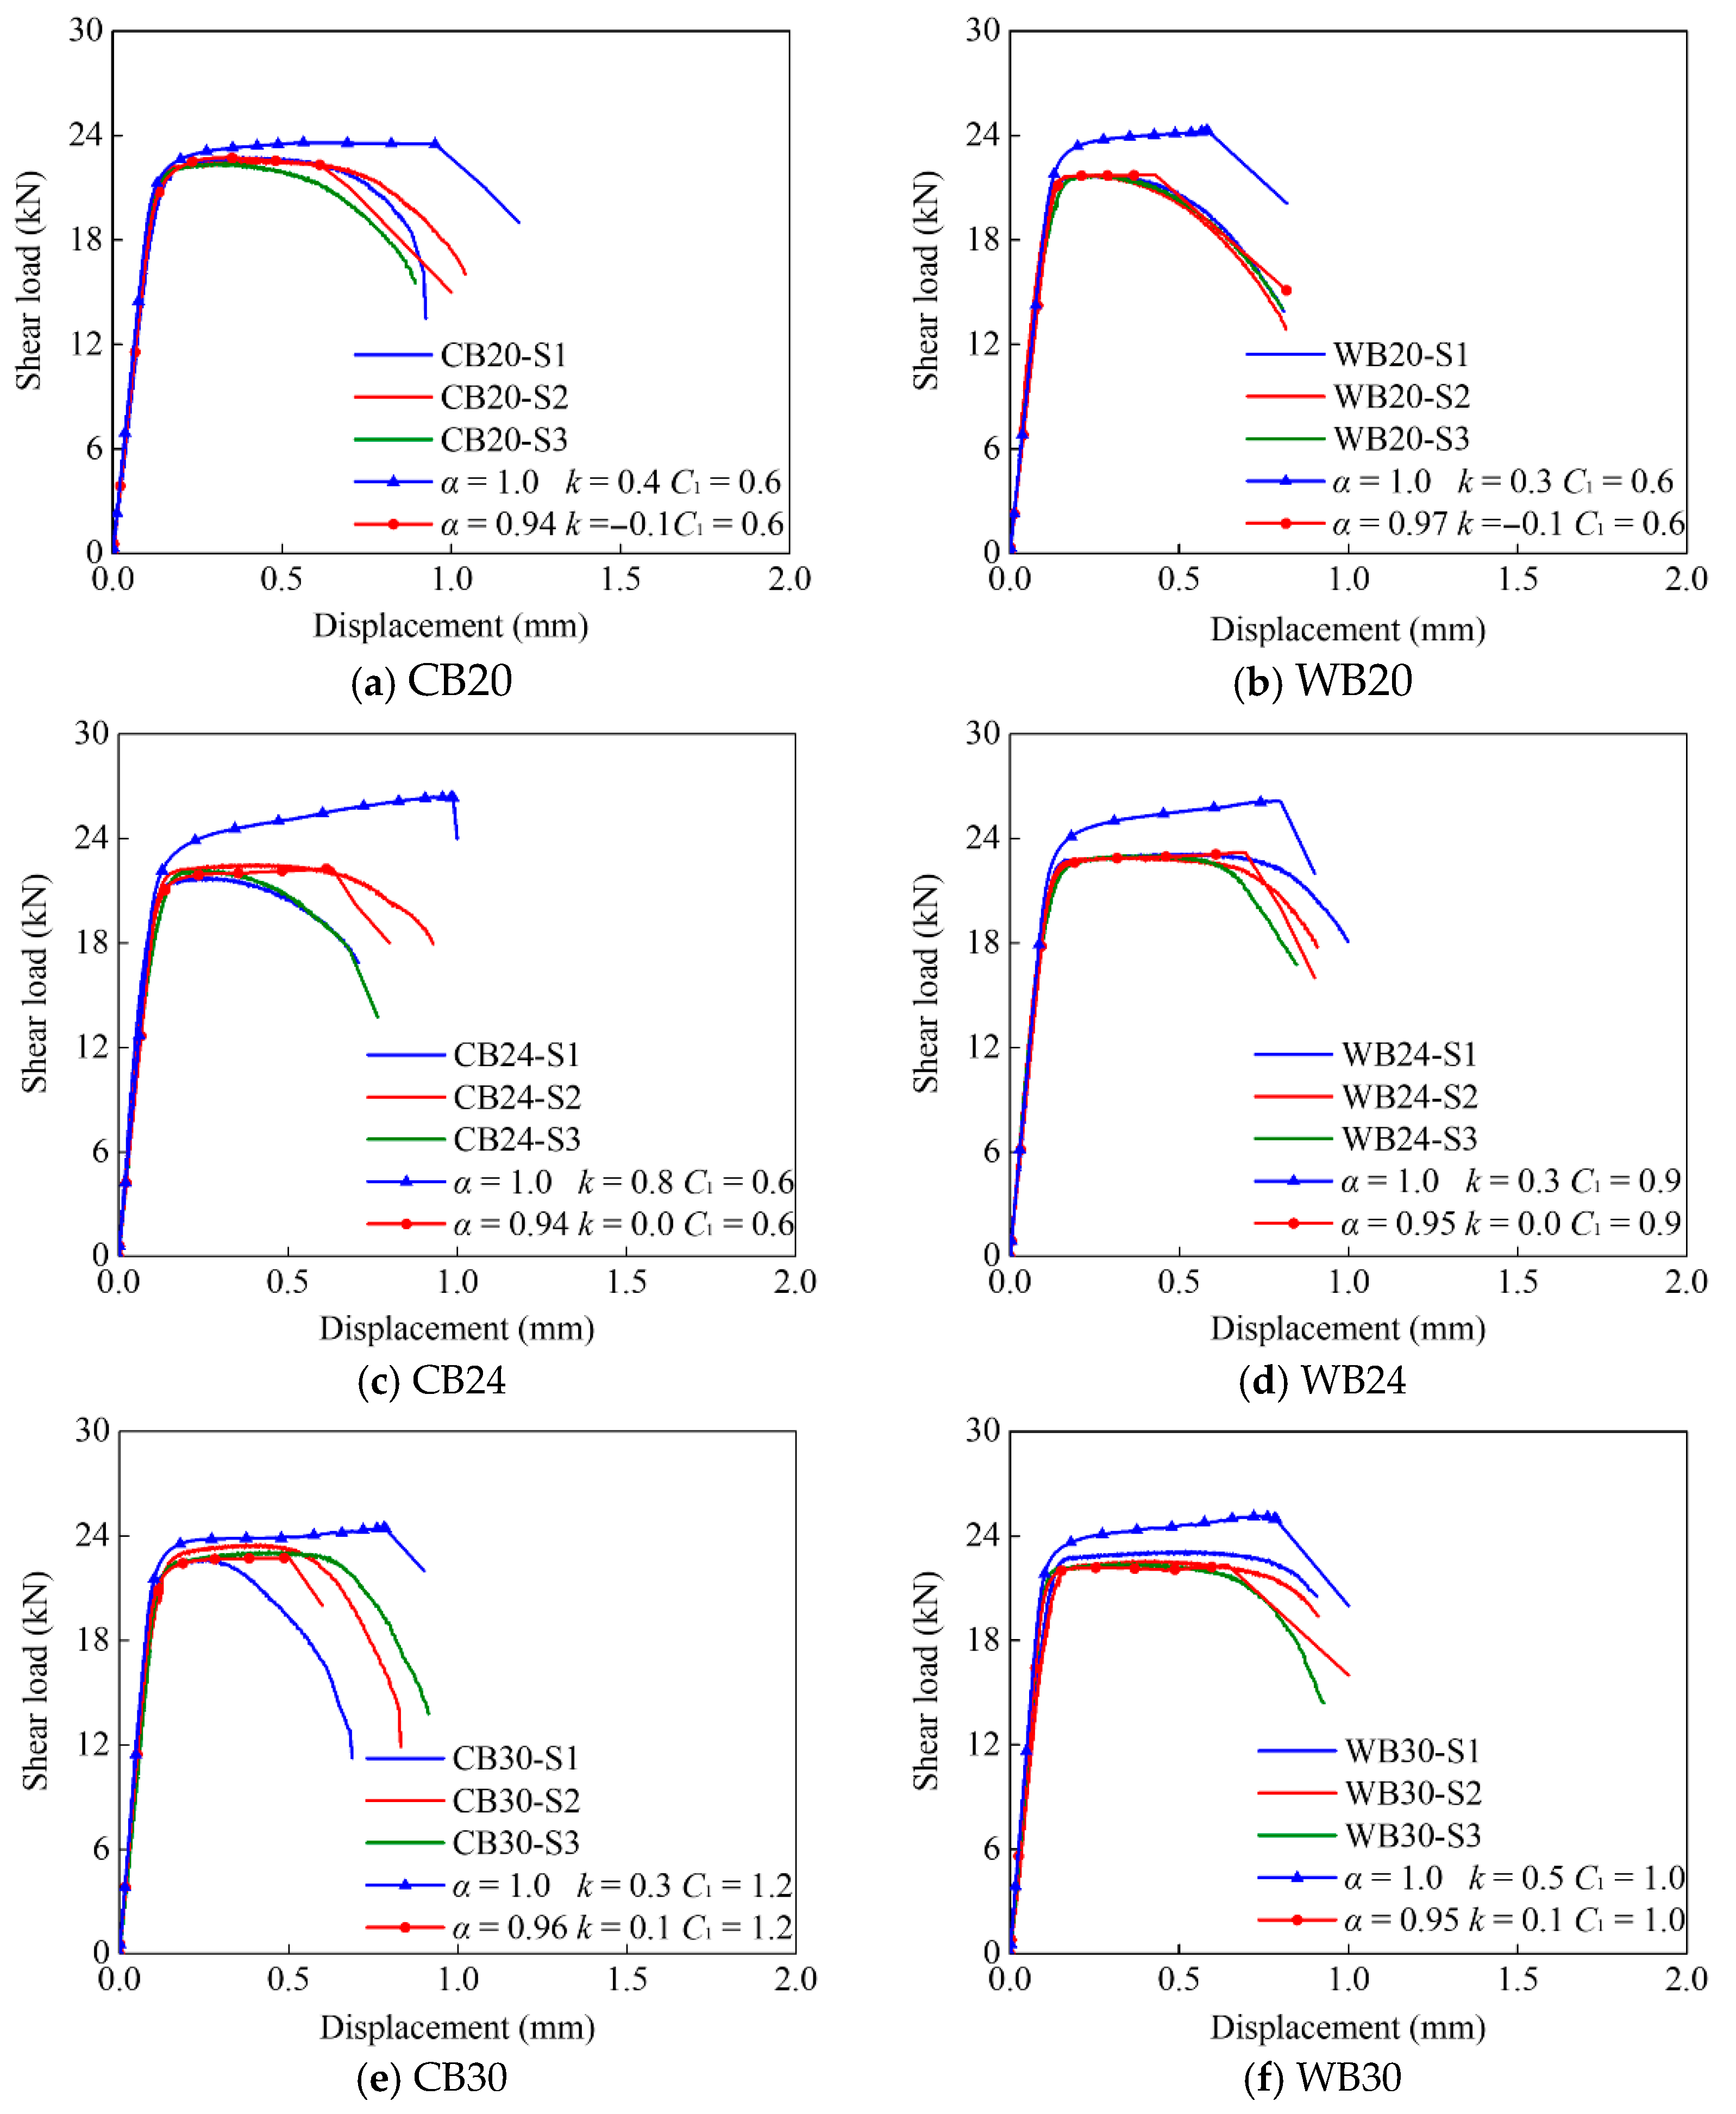
Figure 9 shows the calibration of the tensile and shear true stress–strain relation based on the combined S-V model and the modified shear model. For both materials, the weight factor
k ranges from 0.3 to 0.8 within 0 to 1.0 for the tensile stress–strain relation, while it ranges from 0.1 to −0.1 as the diameter of high-strength bolts decreases from 30 mm to 20 mm. As for the shear factor α, it takes the lowest value of 0.94 for CB20 and CB24, while the highest value of 0.97 is seen for WB20, with an average reduction of 0.95 for common and weathering high-strength bolts.
Figure 10 shows the calibration of BW models for Grade 10.9 s common and weathering high-strength bolts. The tension parameter
C2 is around 2.2 for the different bolt diameters, while it shows an increasing tendency of the shear parameter
C1 with the increase in bolt diameter from M20 to M30, and the average value of
C1 and
C2 is around 0.8 and 2.2, respectively. It is mentioned that the tempering temperature, cooling period, rolling stress, etc., during the production process may lead to the difference of microstructure between variable bolt diameters, in which high-strength bolts are made from the same material batch. This may result in the discrepancy of fracture behaviors of high-strength bolts reflected in the parameter
C1, and more research is required to investigate this phenomenon in the future.
Referring to
Figure 9, the weighting factor
k and the shear factor
α in the combined S-V and the modified shear constitutive model represent a negligible effect on the tension parameter
C2. However, a strong positive correlation is found between the weighting factor
k and shear parameter
C1, which shows an increase in
k from −0.1 to 0.1 leading to a rise in
C1 at 0.6 up to 1.2 and 1.0 for both materials.
Figure 11 shows the simulation results of tensile coupons compared to experimental curves.
Figure 12 shows the comparison between the experimental results and FE simulation considering the tension and shear true stress–strain relation with the corresponding damage model. It is found that the mechanical properties calibrated from the uniaxial tension test can well predict the tensile behaviors of common and weathering high-strength bolts, with a maximum deviation of yield, ultimate stress, and fracture strain under 3%.
However, the comparison indicates the shear resistance and plastic responses of high-strength bolts would be overestimated as the tension true stress–strain relation inputted into the FE model, and this phenomenon is named as steel shear behavior, which is represented in high-strength steel [
12]. The maximum deviation of shear capacity between experimental and FE results is over than 20%, obtained in the M24 common high-strength bolt (CB24). As expressed in the BW model, the fracture prediction is highly relative to the stress state estimation, and it thereby causes a high overestimation of the fracture displacement with a maximum deviation over 60% as the tensile constitutive model’s input.
On the contrary, the shear behavior of high-strength bolts predicted based on the FE model shows high agreement with the experimental results, including the load–deformation relation and failure responses, as the steel shear behavior is considered in the stress–strain relation and fracture properties. It shows a maximum deviation of the ultimate shear capacity and fracture displacement below 3% and 8%. Accordingly, both common and weathering high-strength bolts also represent steel shear behavior as the FE simulation is based on the von Mises criterion. The tensile and shear true stress–strain relation based on the combined S-V model and the modified shear model with the BW model can be used in numerical modeling to simulate high-strength bolts under tensile and shear stress, respectively.
4. Discussion on High-Strength Bolts Under Tensile–Shear Coupling Stress
The above theoretical and numerical modeling presents an effective analytical method for high-strength bolts under tension and shear stress, which is suitable for cases of ring–flange connection in wind turbine towers (bolts under tension) and double-lap connection with fitting bolts (bolts under shear). This suggests that the tensile and shear mechanical models of high-strength bolts should be used, respectively, with the corresponding practical relevance. However, high-strength bolts employed in steel and composite structures are more commonly subjected to combined tensile and shear stress, for example, the rotation subjecting high-strength bolts to the tension–shear coupling force of lap connections in structure constructions, and the demountable steel–concrete bolted connector in composite bridges. Therefore, it is essential to further investigate the steel shear behavior of high-strength bolts under tension–shear coupling stress, or the applicable range of tensile and shear true stress–strain relations.
Figure 13 shows an FE model simulating high-strength bolt tests in [
32]. Two 70 × 70 × 70 mm steel blocks are used to transfer loads onto high-strength bolts, with a Young’s modulus of 210 GPa and a Poisson ratio of 0.3. Grade 10.9 s M16 full-thread and partial-thread high-strength bolts are investigated, and the actual thread pits are finely modeled, according to EN ISO 4017 [
33] and EN ISO 4014 [
34]. The element size of 0.5 mm following the above study is applied to mesh both types of high-strength bolts with the element type of C3D10M.
Two datum points are located at both ends of the cross-sectional centroid, and the vertical load is applied on RP-1 with the degree of RP-2 fixed. To simulate different proportions of tension to shear force on the bolts, the whole model, involving the steel blocks and high-strength bolt, is rotated to a loading angle θ of 15°, 30°, 45°, 67.5° and 90°.
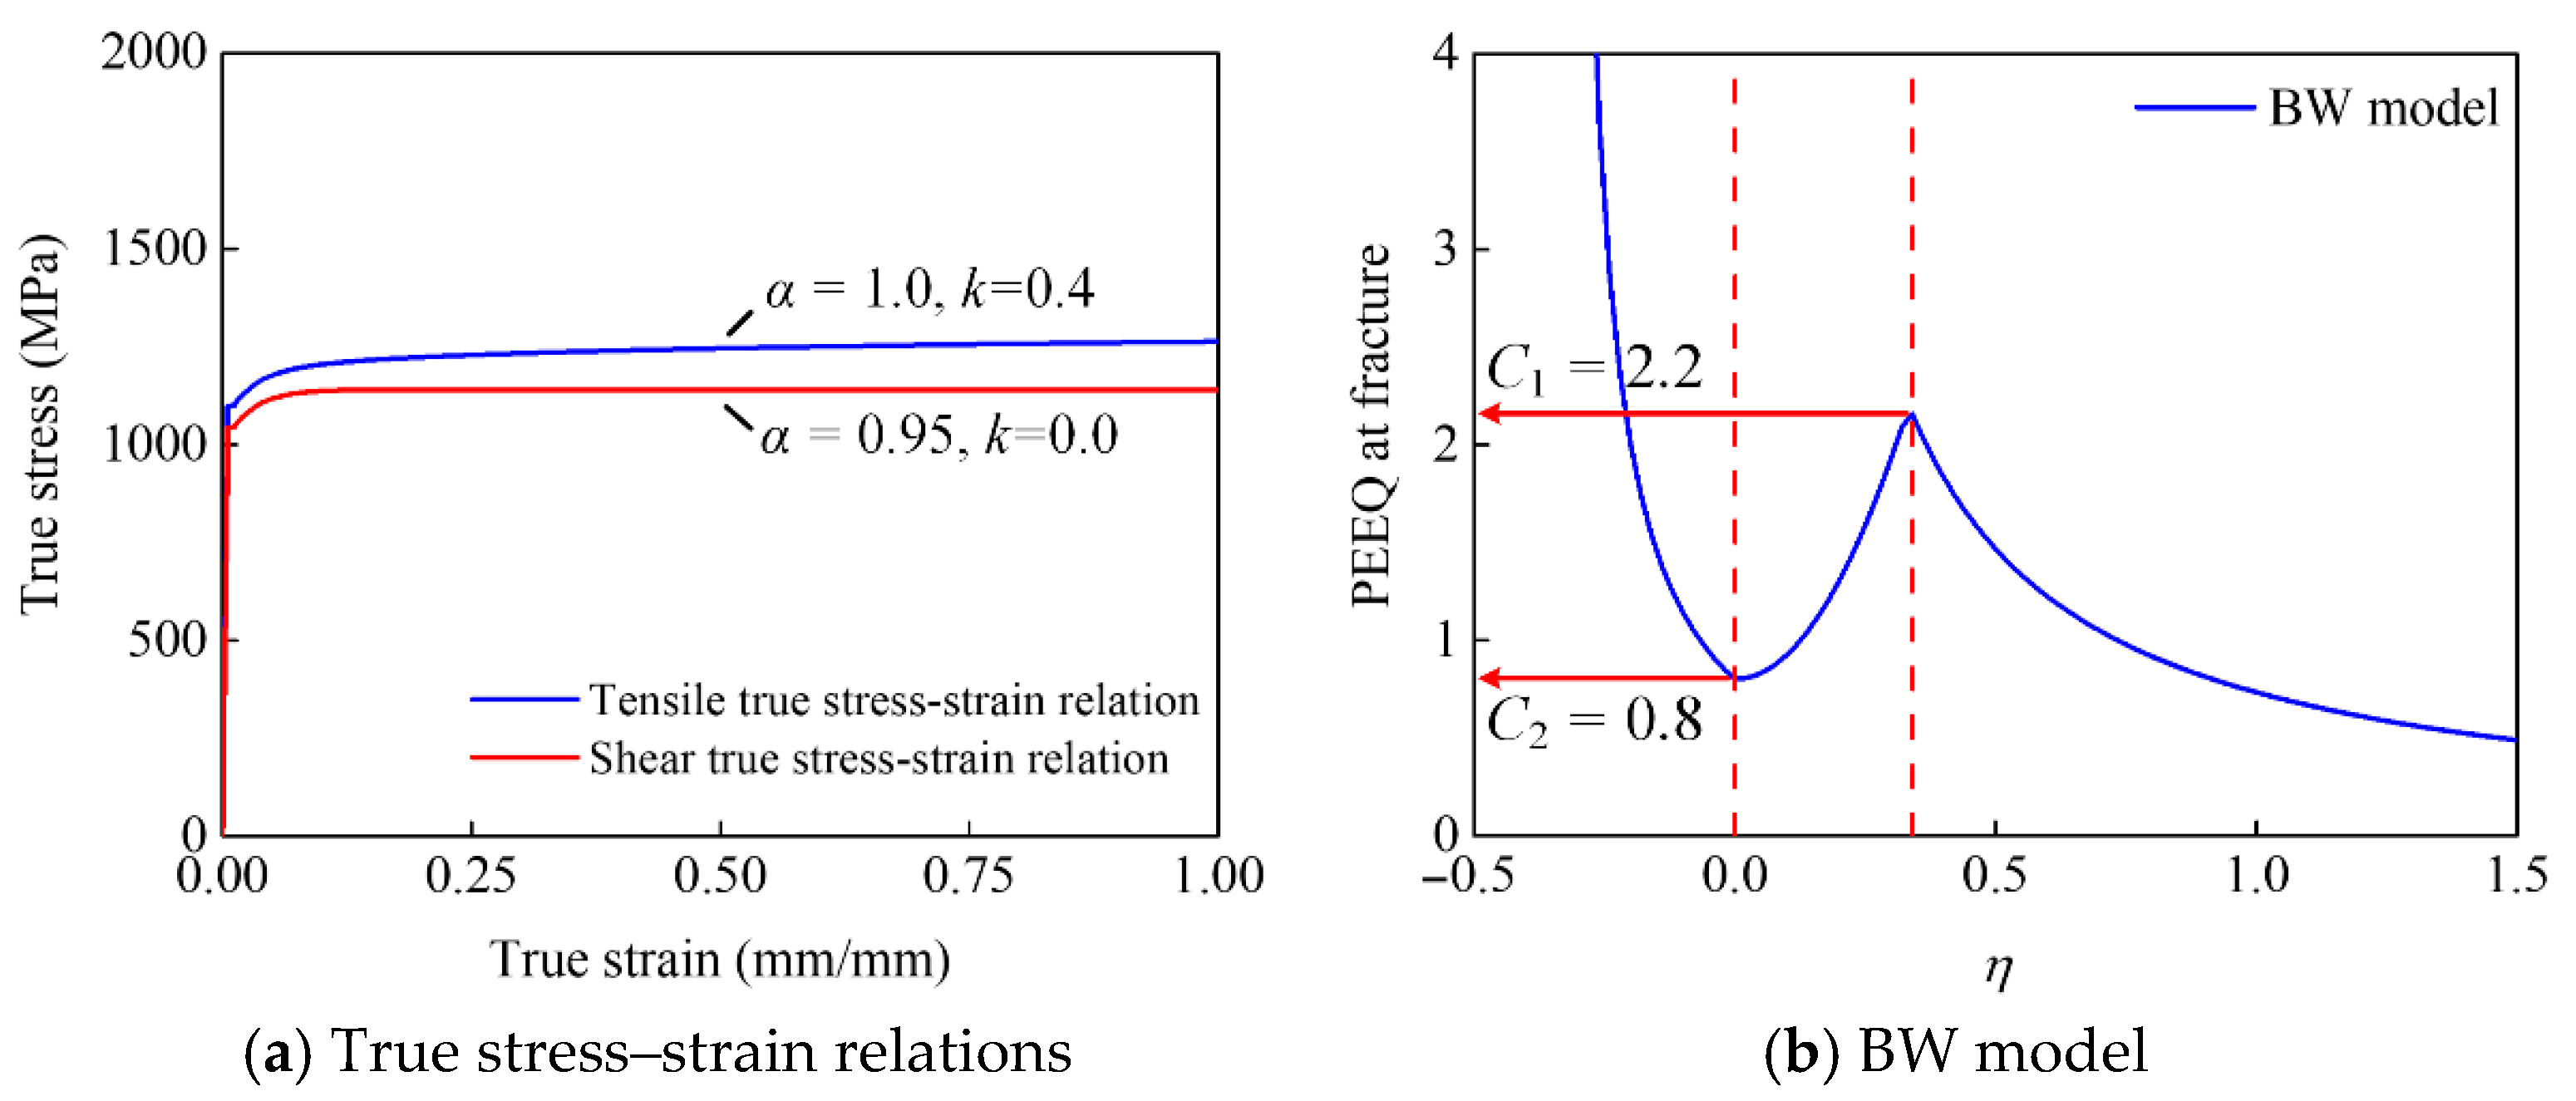
Figure 14a presents the tensile and shear true stress–strain relations, and
Figure 14b shows the BW model for full- and partial-thread bolts. Due to a lack of engineering stress–strain curves in the literature [
30], the average value of the basic material properties from this paper is used to calibrate the mechanical relation and fracture model, involving Young’s modulus, the yield strength, the ultimate strength and so on in
Table 2, and the average value of the weighting factor
k at 0.4 for the tensile true stress–strain relation, while the weighting factor
k of 0.0 and the shear factor
α of 0.95 determines the shear one. In addition, the parameters of
C1 and
C2 in BW damage model adopt the average value of 2.2 and 0.8 from
Figure 10.
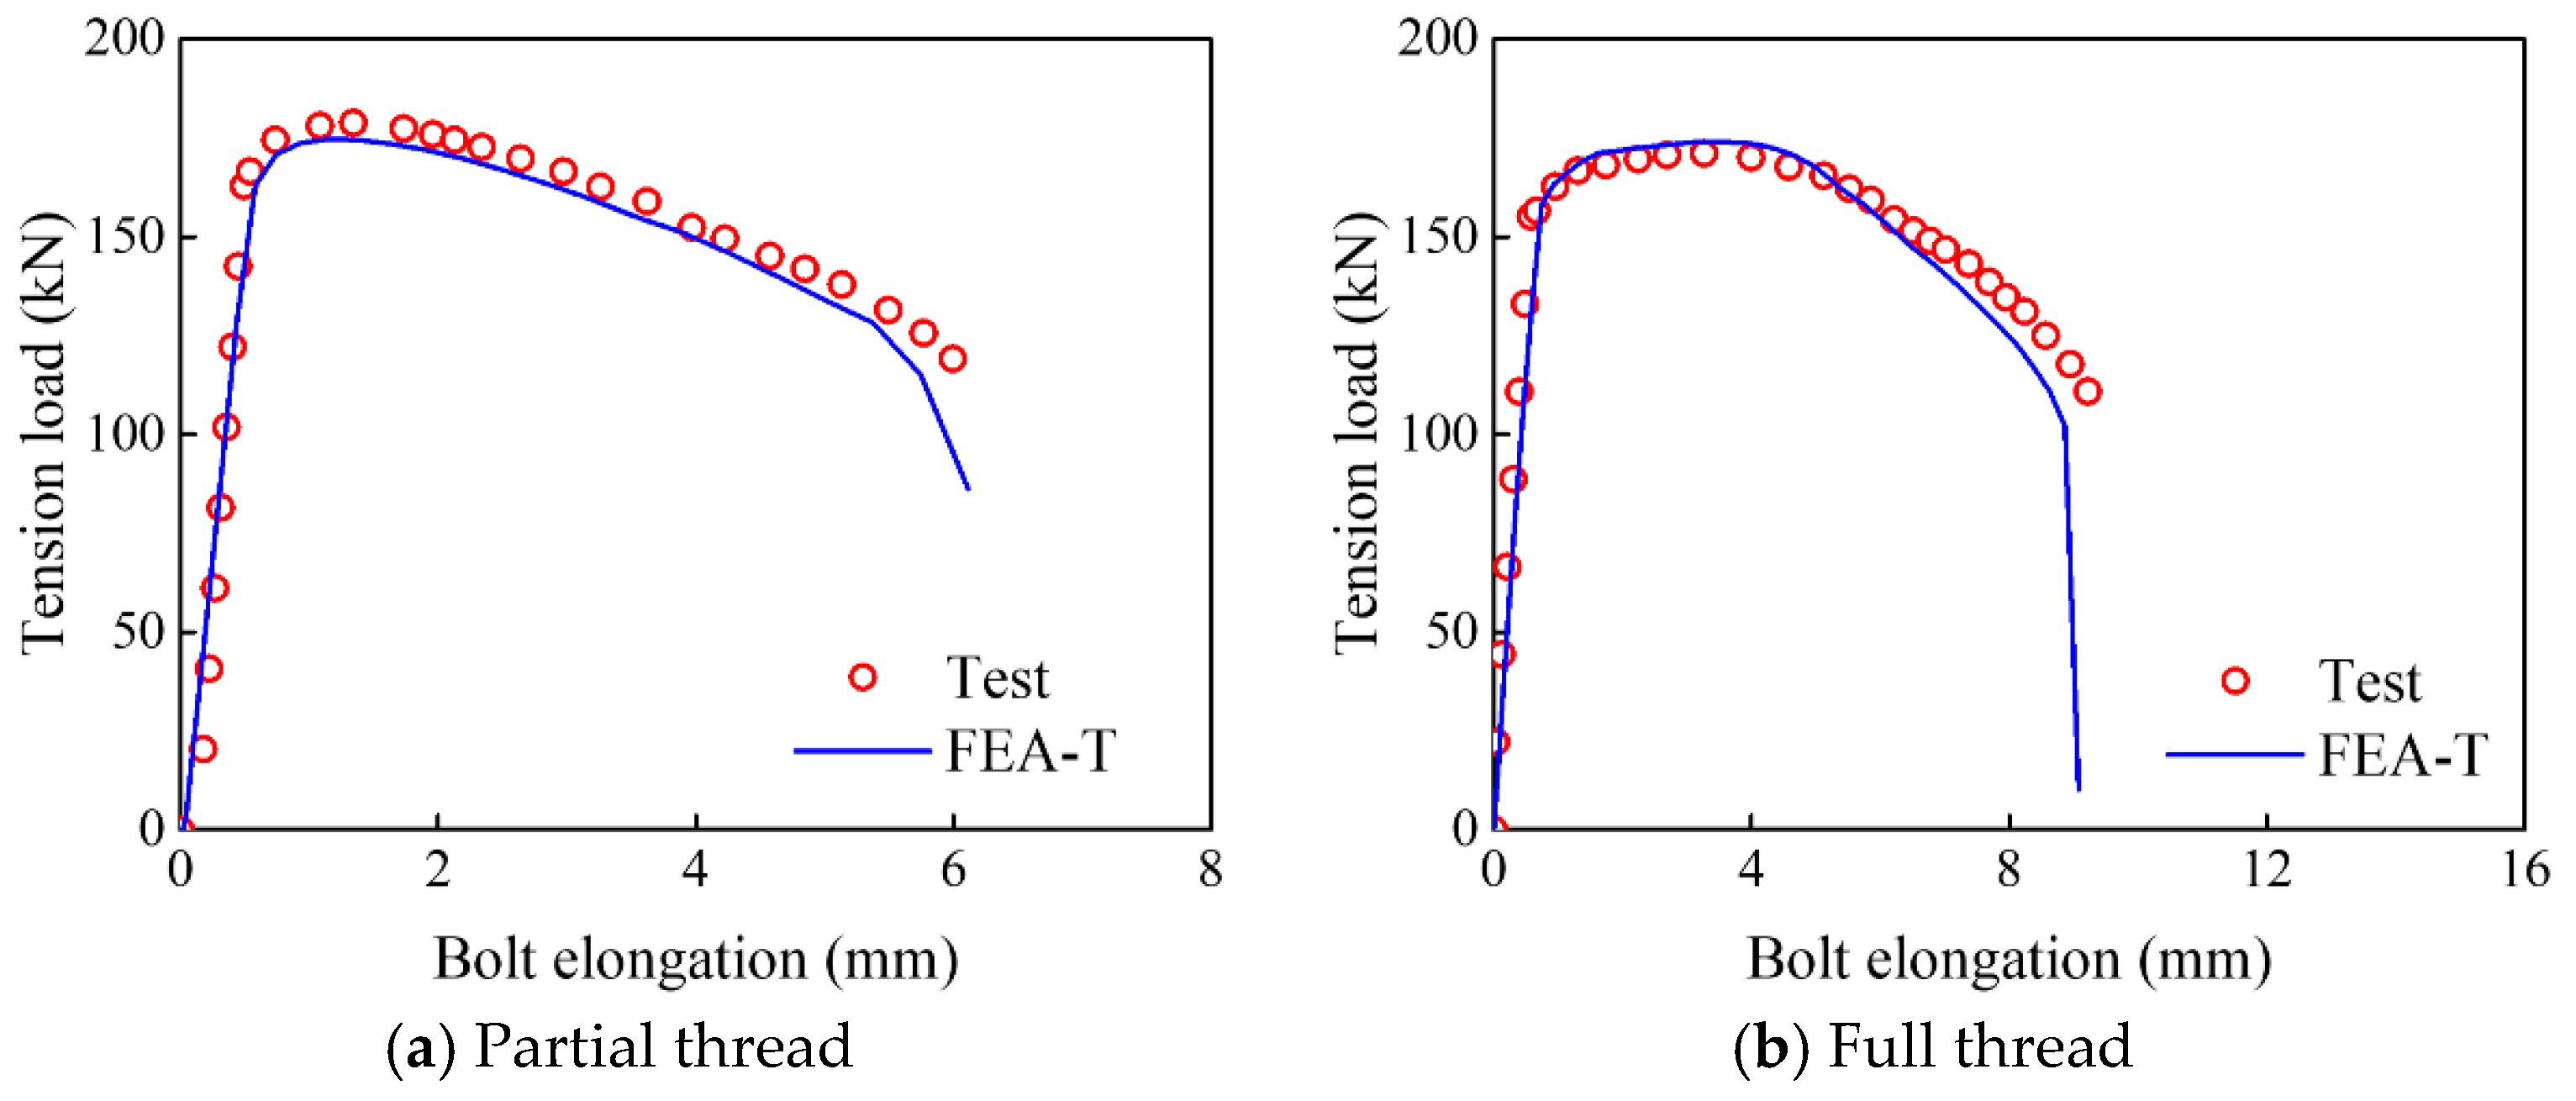
Figure 15 shows the comparison of tension load–elongation curves between FE and test results. For both partial- and full-thread bolts, it shows the material properties calibration inputted into the FE model can accurately describe their tensile behaviors, and the maximum deviations of the ultimate tension resistance and the fracture deformation are 2.2% and 6.7%, respectively. Test set-up and measurement of high-strength under tensile–shear load and pure shear force are not represented in the literature, and thus the load–deformation responses are not comparable with FE simulation. Nevertheless, the ultimate resistances as one of the most important factors controlled in the relevant standards or code, are used to discuss the applicable range of tensile and shear constitutive models. Additionally, high-strength bolts reach their ultimate shear capacity as its fracture deformation, as shown in
Figure 12, so the accurate ultimate shear resistance prediction can also reflect the reasonable ductile fracture models employment.
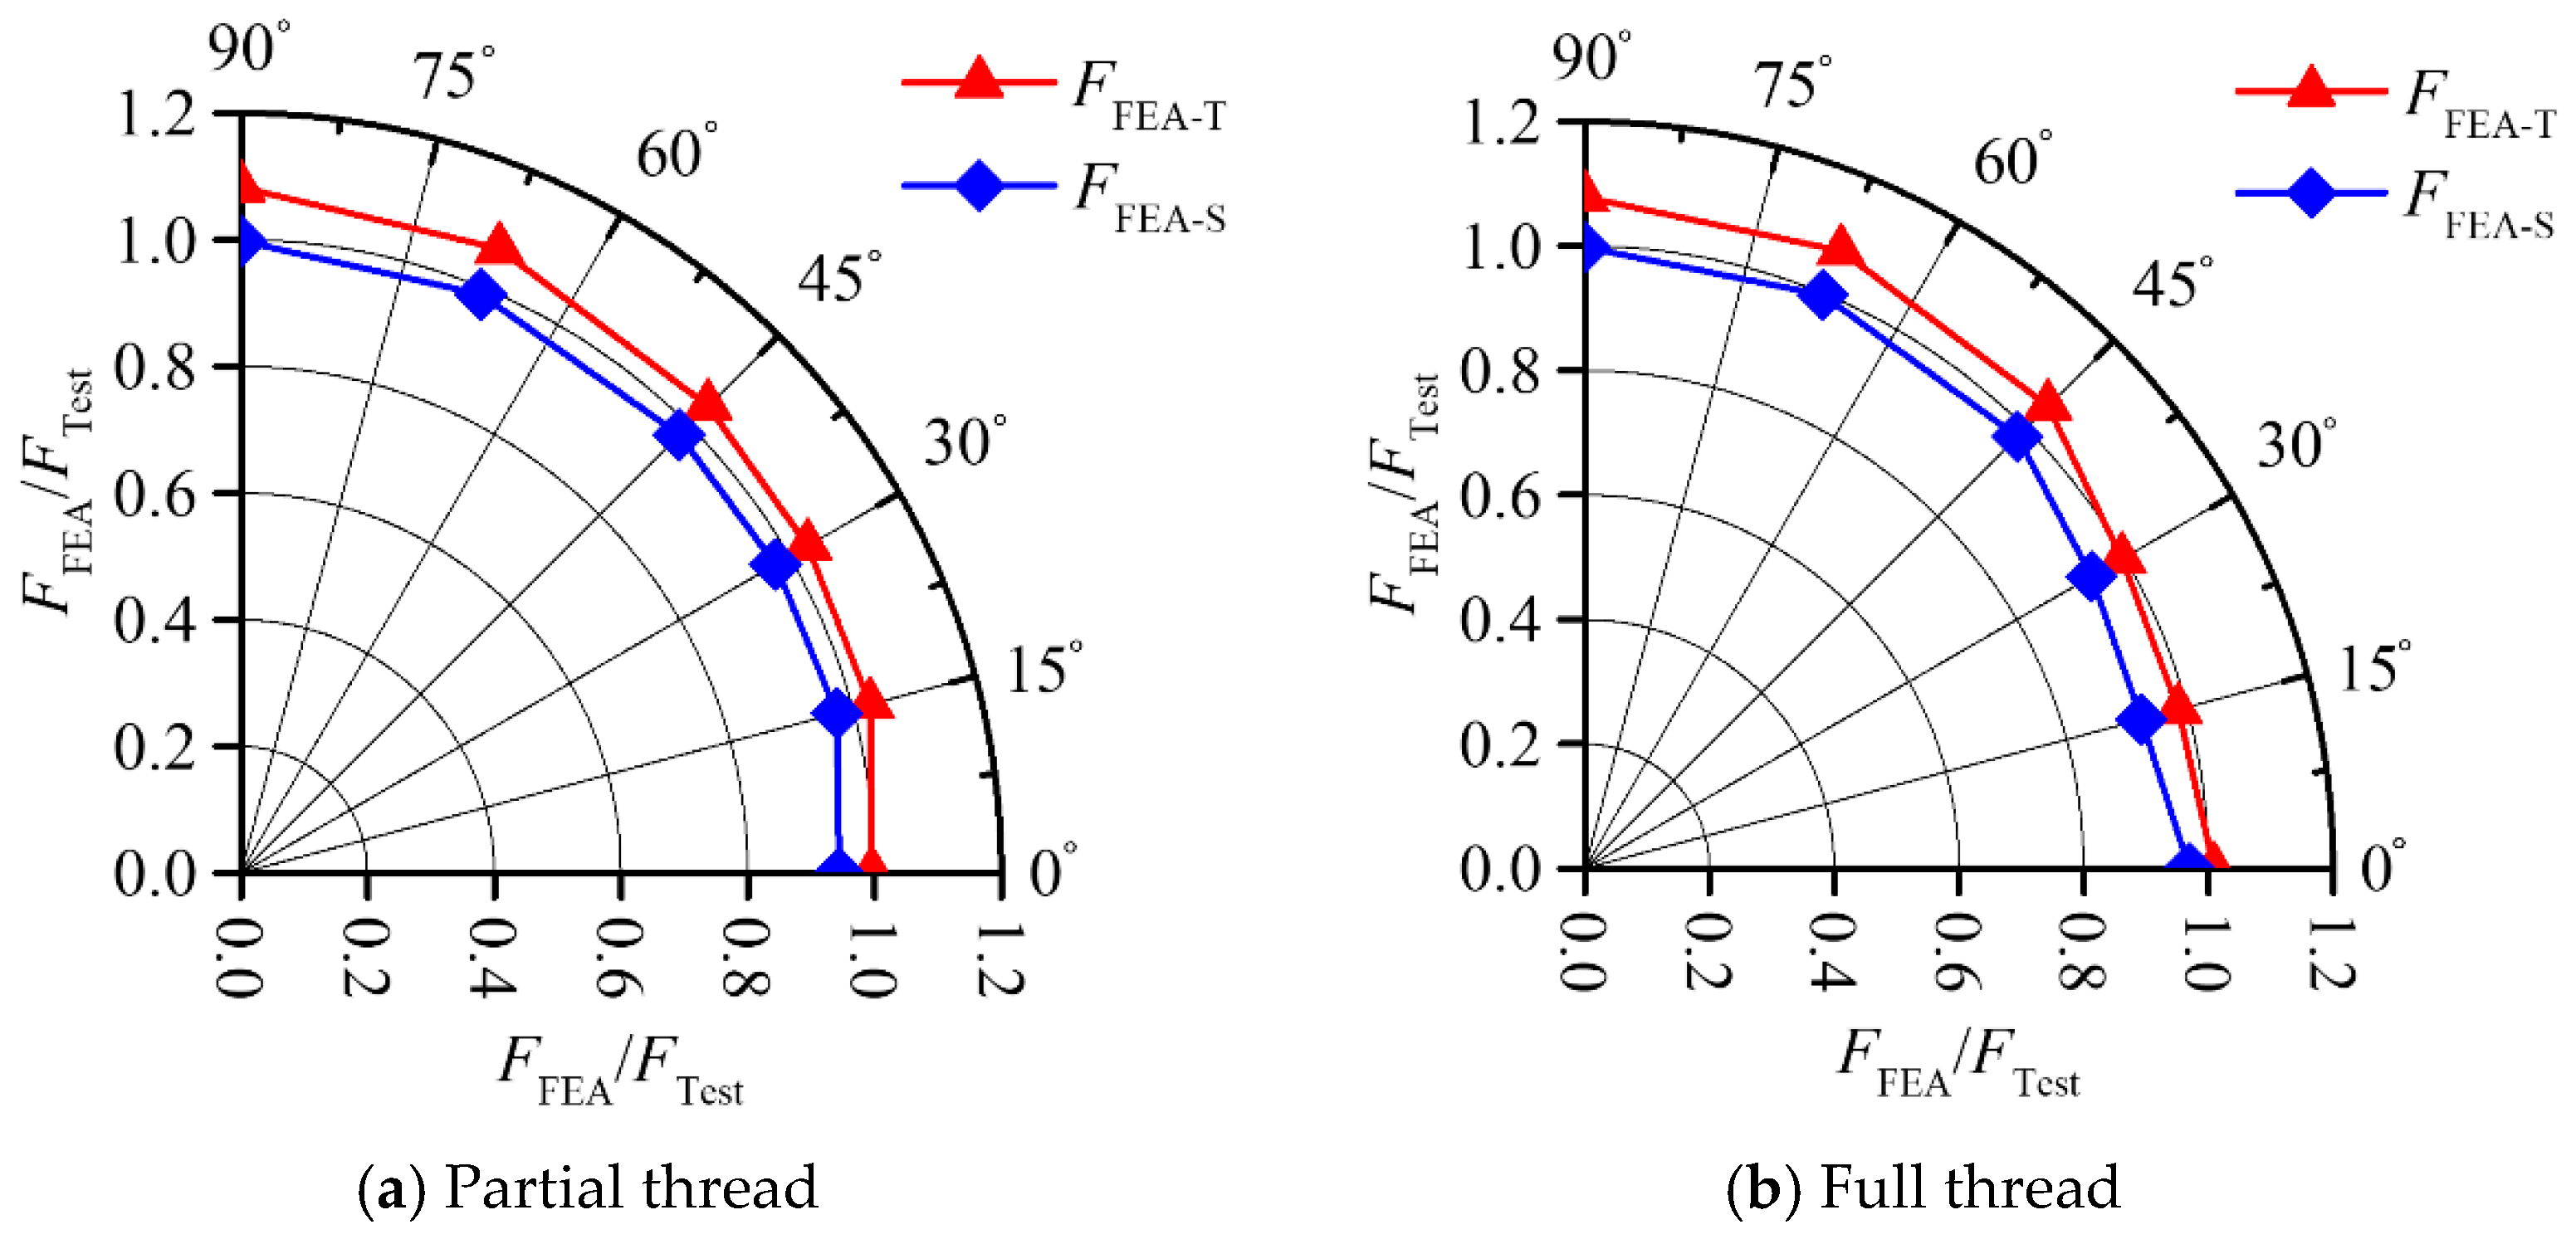
Figure 16 shows the Taylor distribution of the ultimate resistance ratio between FE and the experimental results, where the angle referring to the tension-to-shear angle
θ shown in
Figure 13 is from the literature [
30]. It is found that both types of high-strength bolt show a similar ultimate reaction under tension–shear coupling loads. For a tension-to-shear angle
θ under 30°, defined as a tension-dominated state, the tensile true stress–strain relation may overestimate the ultimate capacity of high-strength bolts with a partial thread below 3% with an average deviation of less than 1.0%, compared to the underestimation of over 8% by the shear constitutive model. Hence, the tensile true stress–strain relation with BW models can accurately predict the tensile-dominant behaviors of high-strength bolts.
When the loading angle θ is from 30° to 90°, named the shear-dominated state, the maximum deviations of the ultimate resistance, respectively, are 2.2% and 1.9% for high-strength bolts with partial and full thread based on FE simulation with a shear modified constitutive model. On the contrary, the material properties inputted into the tensile model will overestimate the ultimate resistance of high-strength bolts by over 8.3% under pure shear conditions, and the average deviation is also around 7% for the tensile–shear coupling load.
Hence, high-strength bolts under tension- and shear-dominated states can be defined as having a tension-to-shear angle θ under 30° and from 30° to 90°, respectively. To accurately evaluate the mechanical responses of high-strength bolts under a tensile–shear coupling load, the corresponding tensile and shear material models should be correctly applied in numerical models. It is noted that future studies are requested to specify high-strength bolts under tension- and shear-dominated states, respectively, corresponding to bolted connections for deciding the accurate application of material models.


