Article

Experimental and Numerical Study on the Tensile Strength of an Undisturbed Loess Based on Unconfined Penetration Test

1
School of Civil Engineering, Xi’an University of Architecture and Technology, Xi’an 710055, China
2
Shaanxi Key Laboratory of Geotechnical and Underground Space Engineering, Xi’an University of Architecture and Technology, Xi’an 710055, China
3
College of Geology and Environment, Xi’an University of Science and Technology, Xi’an 710054, China
*
Author to whom correspondence should be addressed.
Buildings 2025, 15(14), 2429; https://doi.org/10.3390/buildings15142429
Submission received: 21 May 2025 / Revised: 17 June 2025 / Accepted: 19 June 2025 / Published: 10 July 2025
(This article belongs to the Special Issue Research on Building Foundations and Underground Engineering)

Abstract

The tensile strength of loess, a key mechanical parameter for crack-related failures, has not received much attention in previous research, with the literature demonstrating a lack of systematic studies. Therefore, in this study, the variations in the tensile strength, crack distribution, crack number, and internal stress of an undisturbed loess were studied in detail by combining the unconfined penetration test (UPT) and a discrete element method (DEM)-based simulation. The tensile strengths of undisturbed loess samples with different height–diameter ratios (1, 1.5, and 2) were investigated by using the UPT with loading plates of different diameters (12.86 mm, 15.56 mm, and 19.02 mm). DEM simulation was then conducted based on the experimental results. The results showed that (1) the tensile strength of undisturbed loess decreased with increased height–diameter ratio, while it increased with an increase in the diameters of the loading plates; (2) the DEM simulation allowed us to study the tensile characteristics of the undisturbed loess, and the simulated tensile strengths obtained via DEM simulation agreed with those determined via the UPT; (3) the distribution of internal stress and crack number in the DEM model were significantly influenced by the height–diameter ratio and loading plate diameter; (4) the number of cracks in the DEM model increased with an increase in the diameter of the loading plate, while the number of cracks first increased and then decreased with an increase in the height–diameter ratio. This study helps us to understand the variation in the tensile strengths of undisturbed loess samples from both macroscopic and microscopic perspectives. It is expected to serve as a reference for design, construction, and maintenance in engineering projects hinging upon the Loess Plateau region in China.

1. Introduction

Loess is a special aeolian soil [1] covering about 6.6% (631,000 km2) of China’s land area [2,3,4,5]. With the introduction of the Belt and Road Initiative, more and more key engineering projects related to the construction of infrastructure, such as highway, railway, and high-filling loess engineering projects, are taking place in the Loess Plateau region in Northwest China. The mechanical properties of loess are of great importance for aspects related to design, construction, and maintenance in these key engineering projects [6]. In general, the compressive and shear strengths of loess samples have been investigated and studied in detail; however, research on the tensile strength of loess has been neglected and ignored, affecting engineering and design projects [7]. Field investigation and engineering practices have proved that the initiation of cracks at the trailing edge of landslides [8], in high-fill loess [9], in loess related to desiccation [10], and in dam and ground fissures is directly related to the tensile strength of loess. With the presence of cracks, the engineering properties of loess, including the compressive strength, compressive performance, and bearing capacity, can be greatly impacted. In addition, water can flow more easily into slopes that have cracks because these cracks serve as preferential paths. This significantly threatens the stability of the slopes [11,12]. These cracks are, in fact, tensile cracks, and their initiation is directly related to the tensile strength of loess. It is key to understanding that the tensile strength of loess is of great importance in preventing and controlling tensile cracks in the Loess Plateau region.
Regarding the importance of the tensile strength of loess, some significant research has been carried out to study the tensile strength of loess using direct and indirect tensile experiments. Previous research studies on the tensile strength of loess are summarized below. In the early stages of the research in this area, the tensile strengths of loess were generally measured using a self-developed uniaxial tensile apparatus. The effects of the dry density and moisture content on the tensile strengths of loess were investigated by Luo et al. (1998) using a self-developed uniaxial tensile apparatus [13]. A new apparatus that could control the strain was proposed by Dang et al. (2001) [14] to further improve the traditional apparatus. With the help of the uniaxial tensile method, Sun et al. (2016) studied the effects of fracture planes with different angles (0°, 30°, 45°, 90°) on the tensile strengths of loess, exploring the mechanisms governing the formation of loess geohazards [15]. Wei et al. (2022) studied the tensile strengths of remolded clayey soils with different water contents by using a specific self-developed apparatus, facilitating tensile loading and the measurement of global displacement [16]. Although the self-developed methods listed above can be used to directly measure the tensile strengths of loess, they face two key problems: the preparation of samples and the end fixing of the samples. This has driven engineers and scientists in the field of loess research to propose indirect tensile methods to effectively investigate and study the tensile strengths of loess. Based on the theory of elasticity, an indirect method excluding the self-weights of soil samples was proposed by Li et al. (2009) to obtain tensile strength measurements [17]. Recently, the unconfined penetration test (UPT), initially adopted in the study of concrete by Fang et al. (1970) [18], was introduced to indirectly obtain the tensile strength of loess in Lanzhou and Xi’an [19]. The obvious advantages of the UPT include the fact that it can be conducted based on traditional compressive tests. The DEM (discrete element method), proposed by Cundall et al. (1979) [20], has also been adopted to simulate the UPT, thereby revealing the evolution of internal stress in loess samples. Wu et al. (2019, 2021, 2024) investigated the tensile strengths and the tensile–shear characteristics of loess in Lanzhou China by combining the UPT and DEM simulation [21,22,23]. You et al. (2021) numerically studied the effect of different loading plate diameters (0.05 to 0.95) on the tensile strengths of loess samples [12]. Yin et al. (2024) experimentally and numerically studied the effects of loading plate diameter and sample height on the tensile strengths of remolded loess using the UPT [5].
Based on the work described above, although some meaningful results on the tensile strengths of loess have been found by previous studies, there is still room to improve with respect to measuring the tensile strengths of loess based on the UPT. The work described above mainly focused on remolded loess, and the tensile strengths of disturbed loess were seldom investigated and only studied numerically and experimentally. In addition, systematical comparisons of tensile strength results obtained via the UPT and DEM simulation for undisturbed loess have seldom been conducted.
Therefore, in this study, variations in the tensile strengths, internal stress, and cracking of undisturbed loess were studied in detail by a combined method comprising the unconfined penetration test and discrete element method simulation. The tensile strengths of undisturbed loess samples with different height-to-diameter ratios (1, 1.5, and 2; the diameter of each sample was 61.8 mm) were first investigated using the UPT with loading plates of different diameters (12.86 mm, 15.56 mm, and 19.02 mm). DEM simulation was then conducted based on the results of the UPT to numerically investigate the tensile strengths of loess samples and explore the internal stress and cracking of the undisturbed loess. Thorough comparisons of the tensile results derived from the UPT and DEM simulation were also conducted. This study is expected to improve understanding of the tensile strength of undisturbed loess from both macroscopic and microscopic perspectives, thereby providing a reference for engineering practices in the Loess Plateau region.

2. Unconfined Penetration Test (UPT)

2.1. Principle and Apparatus for UPT

Figure 1a shows the underlying principle of the UPT. Two cone-shaped soils form under the action of the two loading plates at both the top and bottom of the soil samples. These cone-shaped soils serve as rigid bodies that push against the soil sample, and the surrounding soils are thus radially displaced. Tensile cracks develop along the radial direction. Based on the law of energy conservation [18,19], the tensile strength of the soil can be calculated using the following formula [24]:
σ t = P π ( K b H a 2 )
where σ t is the tensile strength of the soil sample, P is the applied load, π is a constant (i.e., 3.14), and K = tan ( 2 α + φ ) . Depending on the types of soils and the diameter of the loading plate, α is the split angle and φ is the angle of the internal friction. K was assumed to be 1.0 in this study. b is the radius of the soil sample, H is the height of the soil sample, and a is the radius of the loading plate.
Based on the principle of the UPT, the testing apparatus was modified from that for the uniaxial compressive test, as shown in Figure 1b. The testing apparatus mainly included three parts: a loading part, a sampling part, and a monitoring part. There were two loading methods—the strain-controlled method and stress-controlled method—in the loading part. The axial forces applied on the loading plates were monitored by a force sensor, and the penetrated displacements of the loading plates were monitored by a displacement sensor. The data of the force and displacement were first recorded by a digital camera during the UPT and then read out to calculate and draw the curves of tensile stress and penetration depth. Images of undisturbed loess samples after the UPT are also presented in Figure 1c.

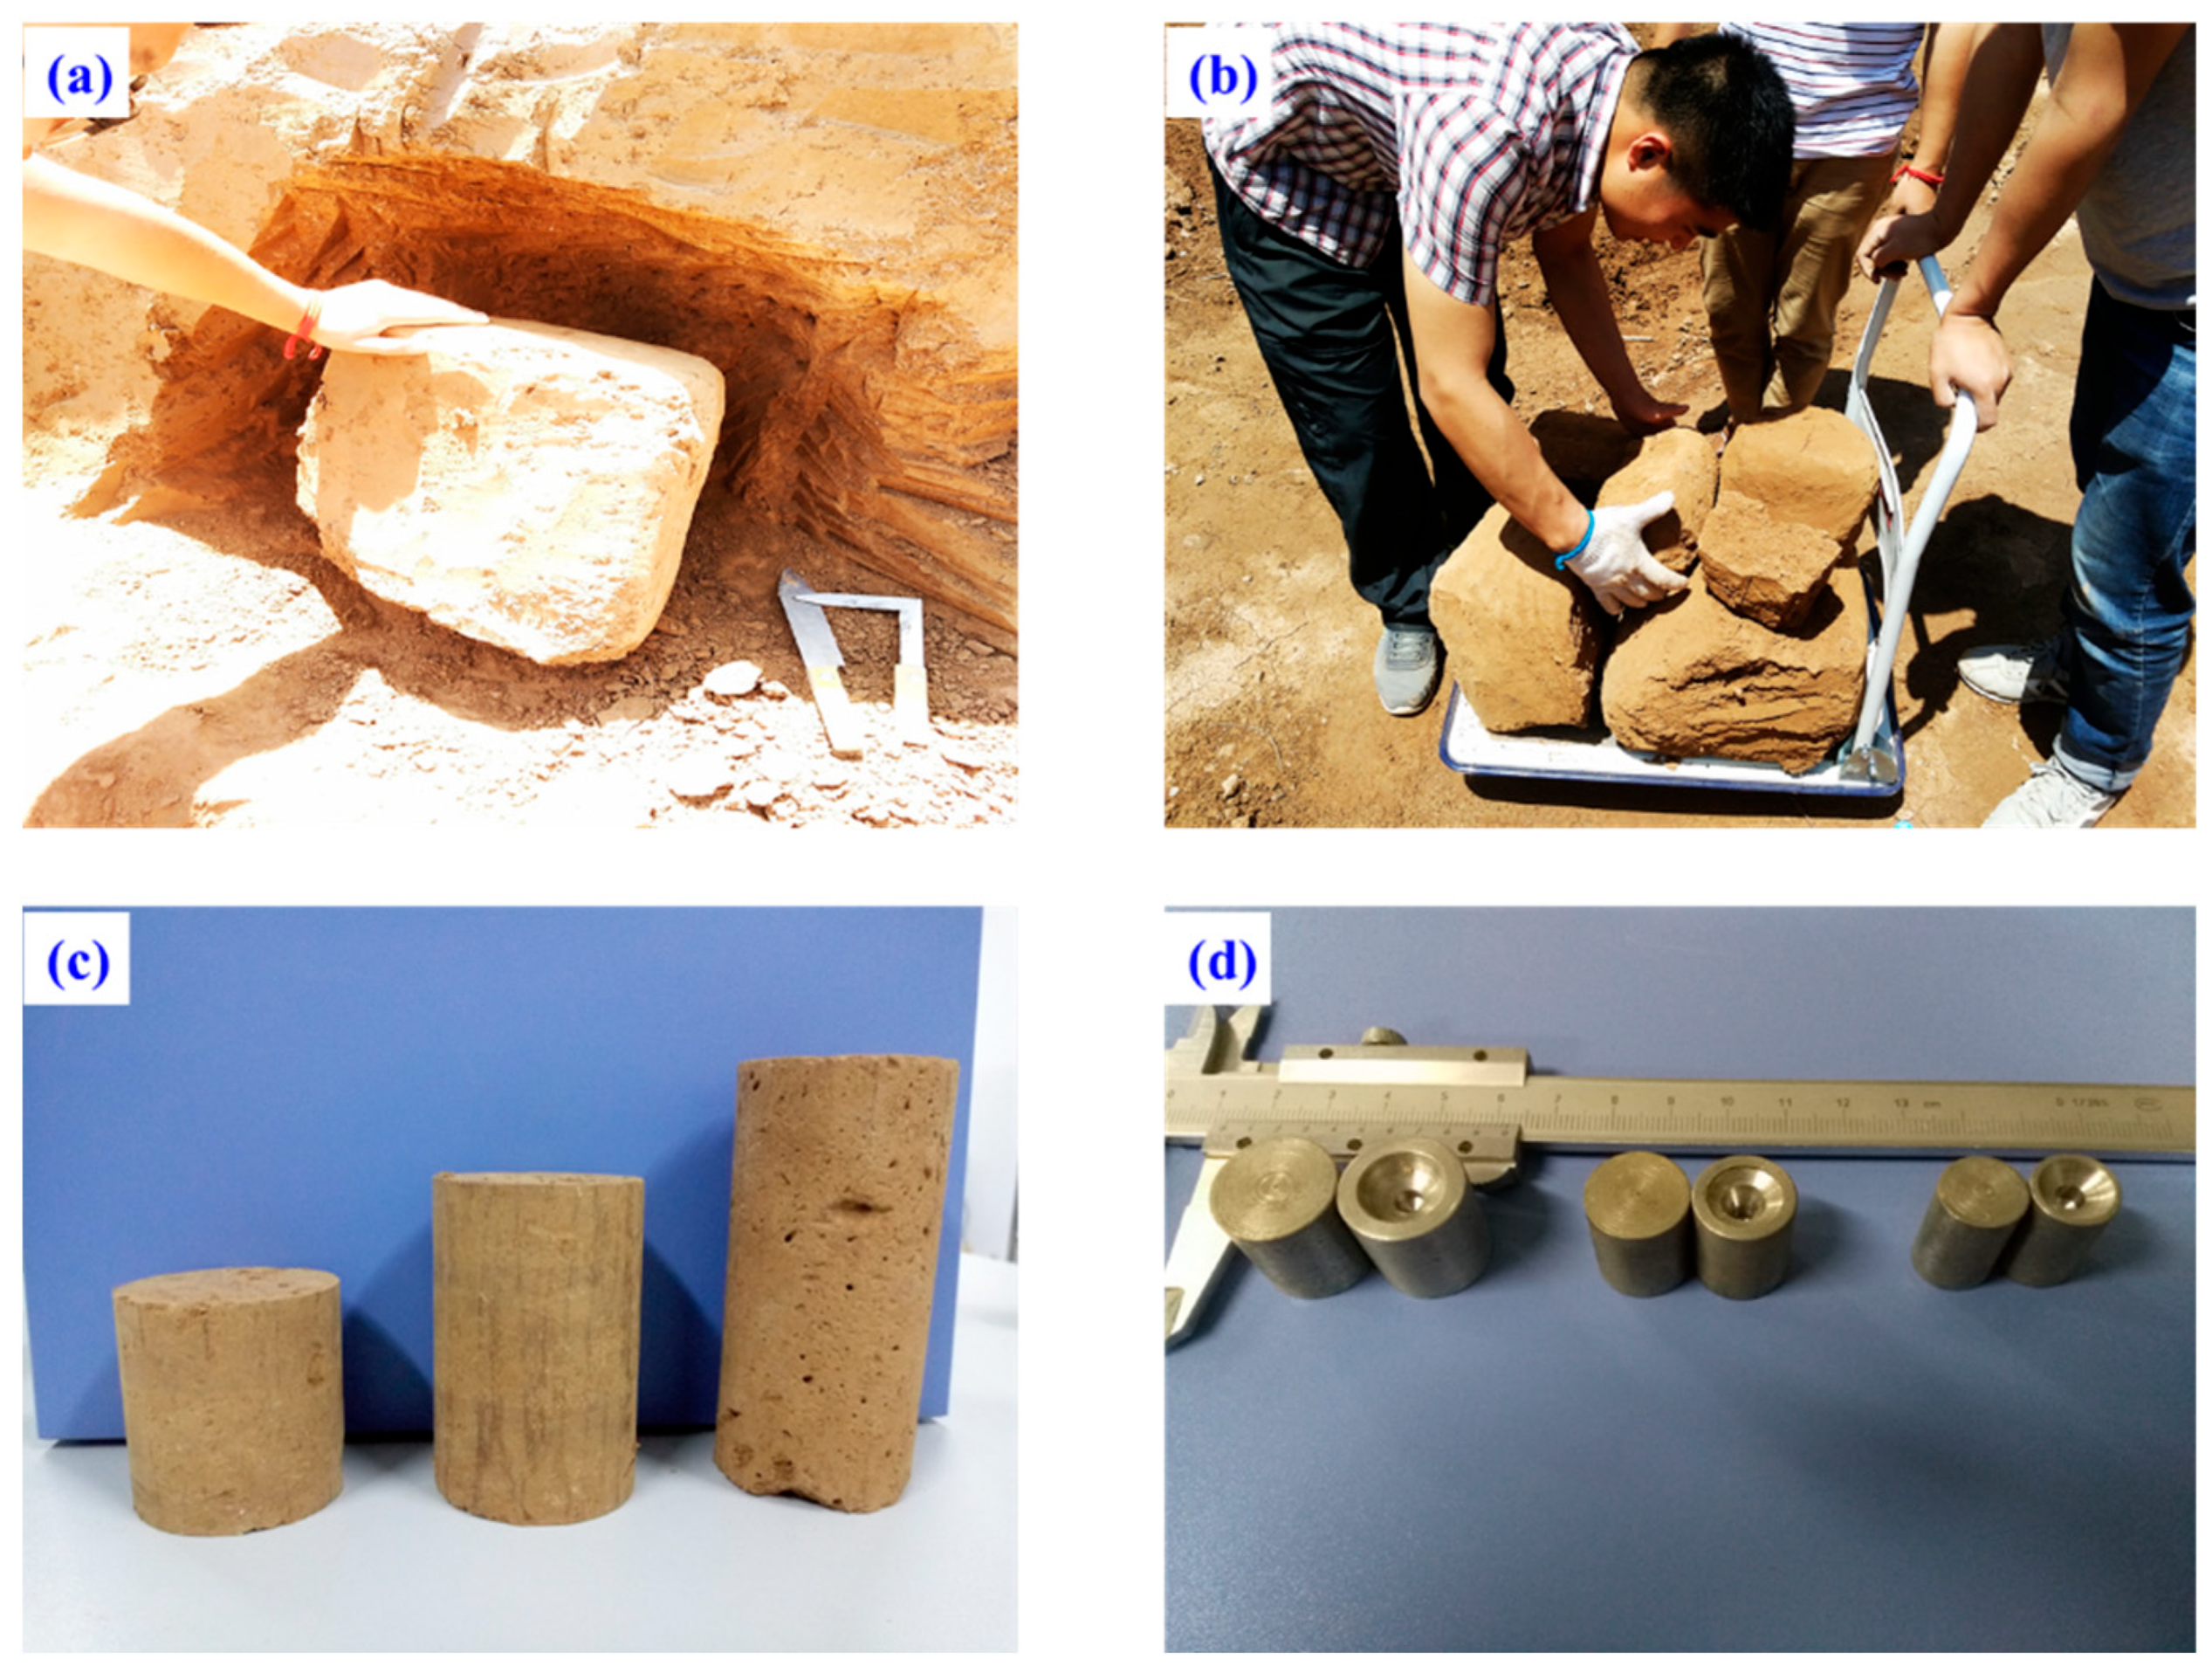
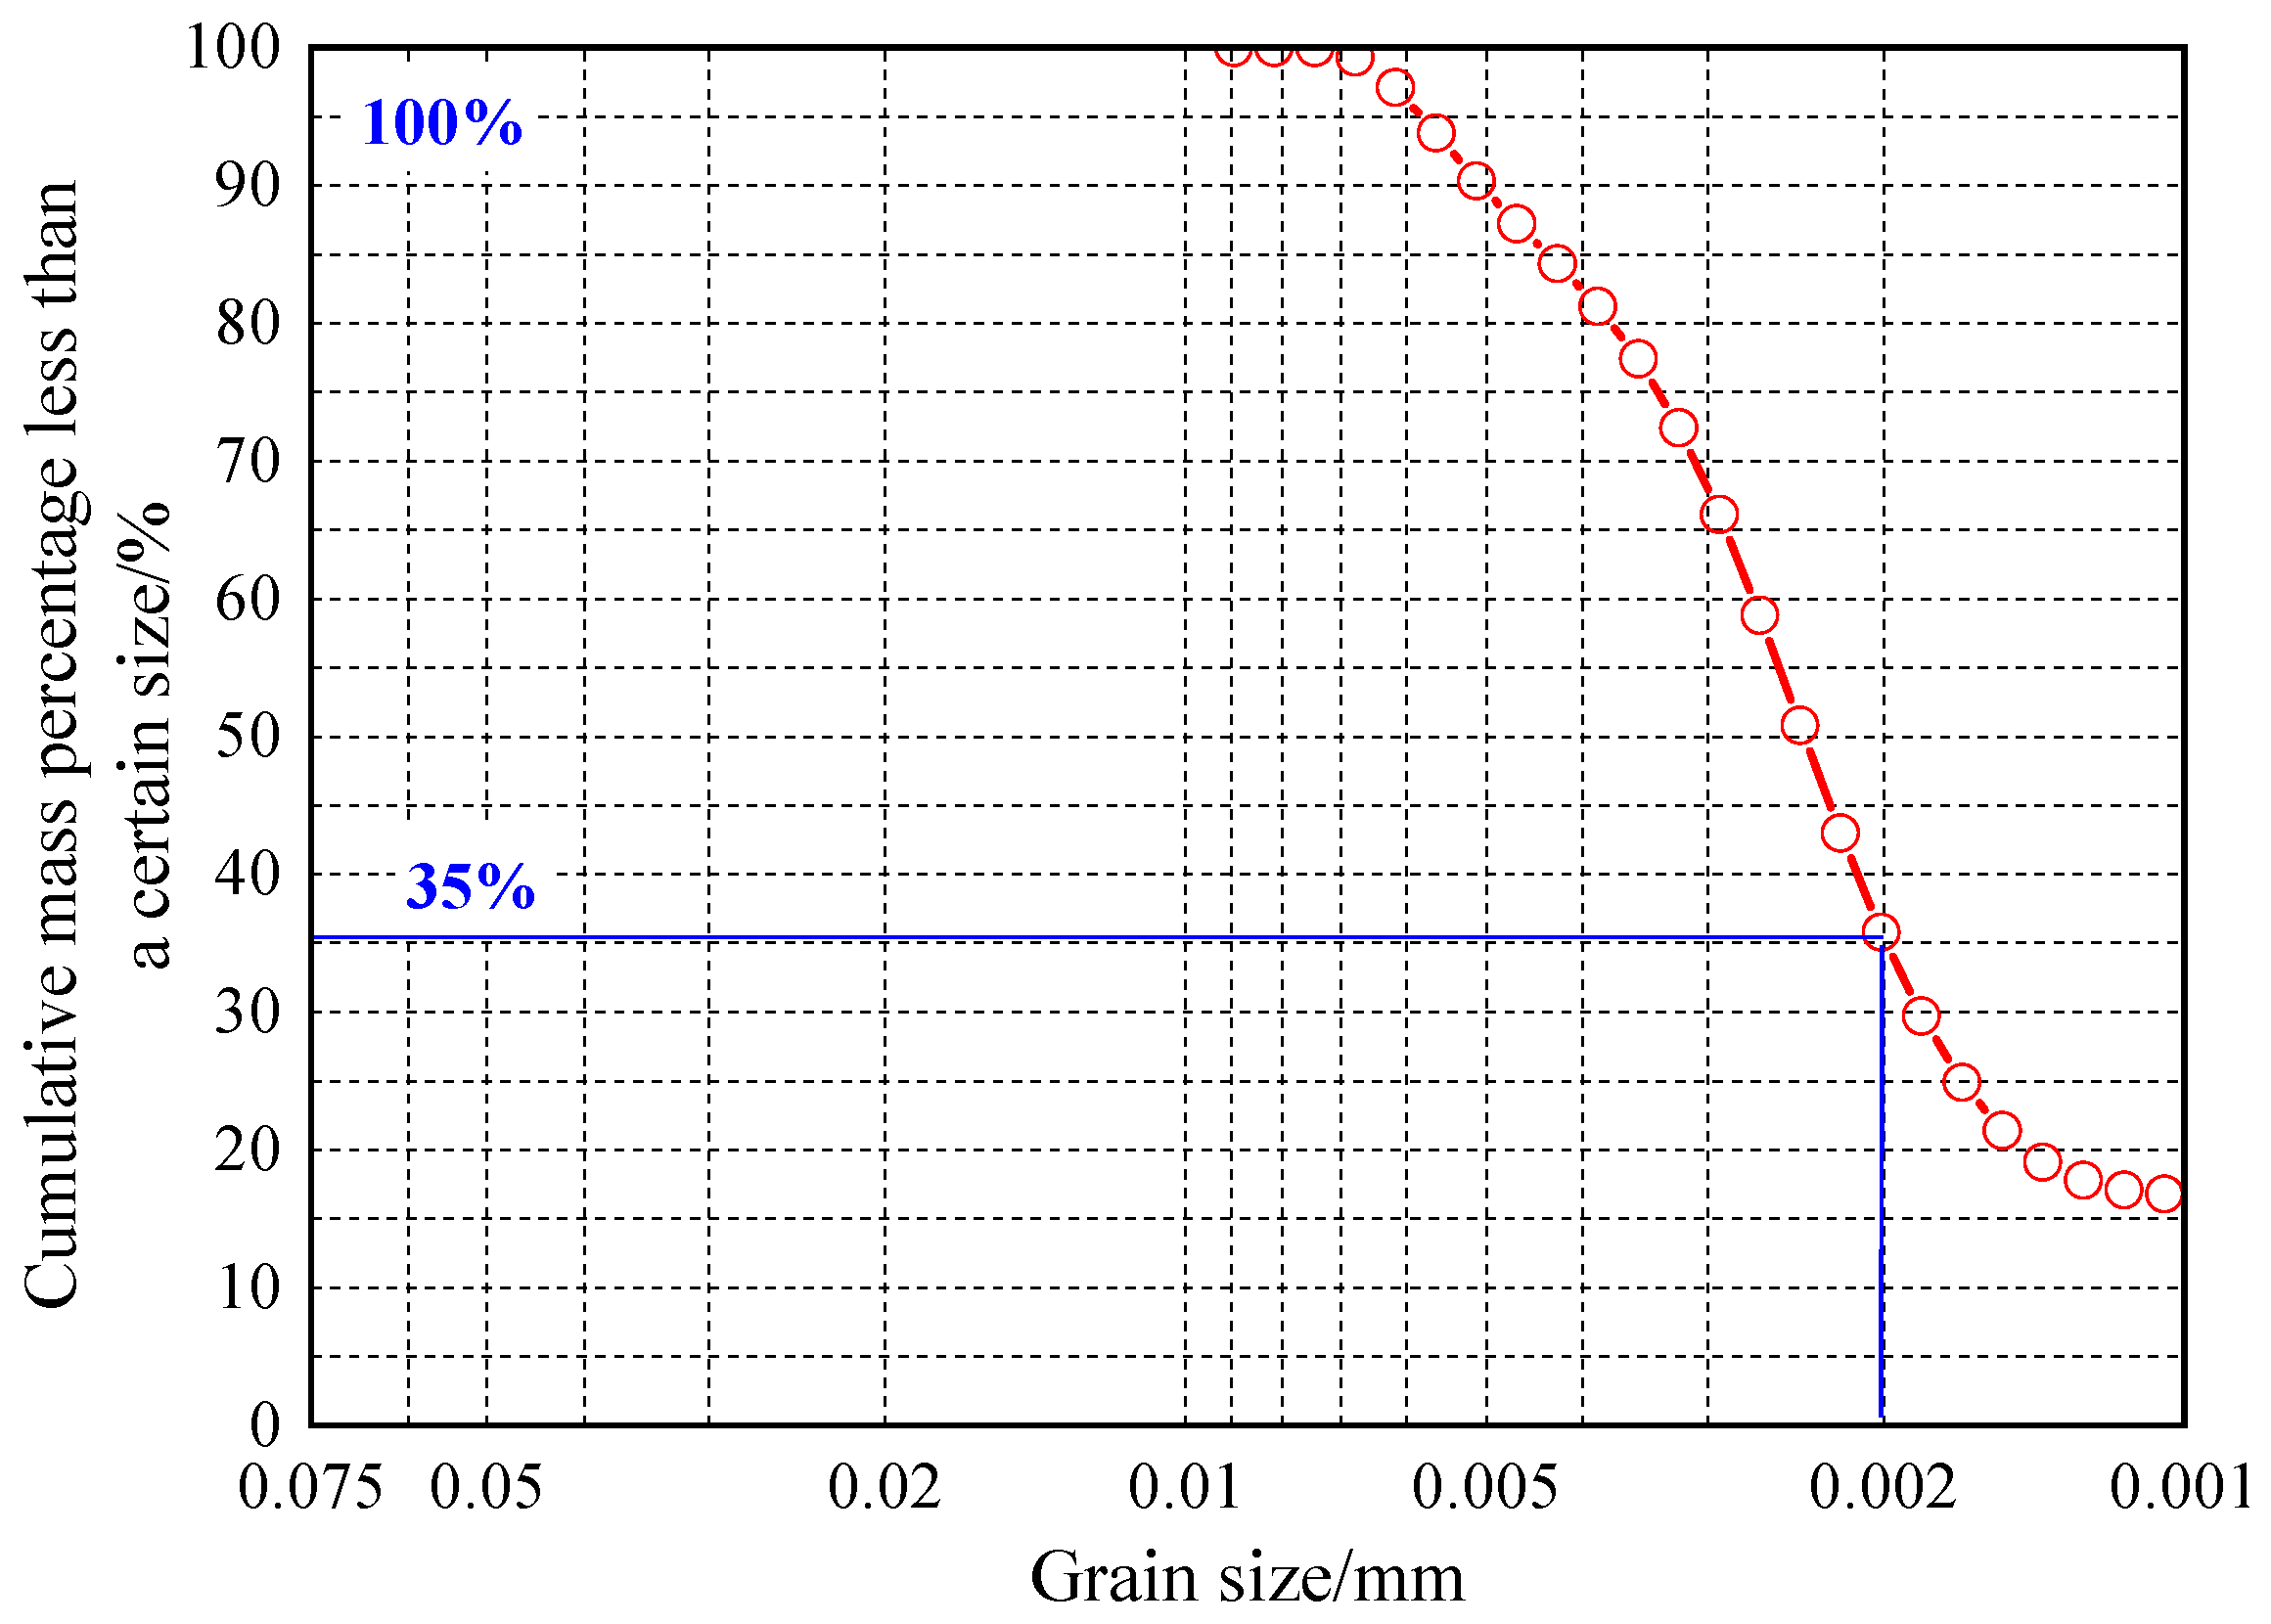
2.2. Materials for UPT

Undisturbed loess, collected from a slope in Xi’an, a city on the China Loess Plateau, was used in the UPT. The blocks of undisturbed loess were first retrieved from the slope (Figure 2a) and then transported to the laboratory carefully (Figure 2b). These blocks were finally divided and cut into undisturbed loess samples with designed height-to-diameter ratios of 1, 1.5, and 2 (Figure 2c). The diameter of each sample was 61.8 mm. To avoid large variation in the moisture of the undisturbed loess samples, the following tasks were performed: (1) the undisturbed loess blocks were retrieved at the bottom of a vertical slope on a sunny day; (2) before sampling, the surface loess was cleared to ensure the initial water contents of the retrieved blocks were evenly distributed; (3) after transporting the retrieved blocks of the undisturbed loess samples into our laboratory, the surface loess, whose moisture content was influenced by air during transportation, was removed.
We used classical methods and an apparatus (Figure 3) recommended by the code of standards for geotechnical testing in China [25]; the fundamental physical and mechanical indices applicable for this type of undisturbed loess are presented in Table 1. The density and initial water content of the undisturbed loess samples were 1.67 g/cm3 and 16.3%, respectively. The plastic and liquid limits of this type of loess were 17.4% and 37.2%, respectively. The cohesion of the loess was 60.0 kPa, and the friction angle was 31.0°. The particle size distribution of the undisturbed loess is shown in Figure 4. According to the ASTM standards [26] and Figure 4b in the referenced work of Asadoullahtabar et al. (2024) [27], the loess used in this study was clayey loess.
The loading plates used in the unconfined penetration test were made of iron, and the diameters of these loading plates were 12.86 mm, 15.56 mm, and 19.02 mm, respectively. Figure 2d shows an image of the loading plates. The loading plates were used to transfer the force to the undisturbed loess samples during the UPT.

2.3. Methods for UPT

The UPTs of the undisturbed loess samples were conducted according to previous works [5,12,18,19,23,24] describing a self-developed apparatus based on a uniaxial compressive apparatus, and the strain-controlled method was adopted. The scheme of the UPT is shown in Table 2. The loading rate during the UPT was 1 mm/min, set according to previous research [18,19,24]. To ensure the alignment of the loading plates, the following measures were taken: (1) before conducting the UPT, the loading plate was put vertically in the designated circle at both ends of loess sample; (2) during the UPT, the loading process was carefully monitored by experimental personnel. If the eccentric loading was found and determined during the experimental process, the UPT was carefully repeated. The main testing factors in this study were the height-to-diameter ratios (1, 1.5, and 2) of the undisturbed loess samples and the diameters of the loading plates (12.86 mm, 15.56 mm, and 19.02 mm). The penetration depth and axial force were recorded during the tensile process, and the tensile strengths were calculated using Formula (1).
It should be noted that internal factors such as the initial water content and density of the undisturbed loess samples with the designated height-to-diameter ratios were difficult to evenly change in the laboratory; therefore, only the external factors (i.e., height–diameter ratios of undisturbed loess samples and diameters of loading plates) were focused on in this study. We chose to focus on these external factors based on previous work centered upon determining the tensile strengths of remolded loess samples [5,19].

2.4. Results of UPT

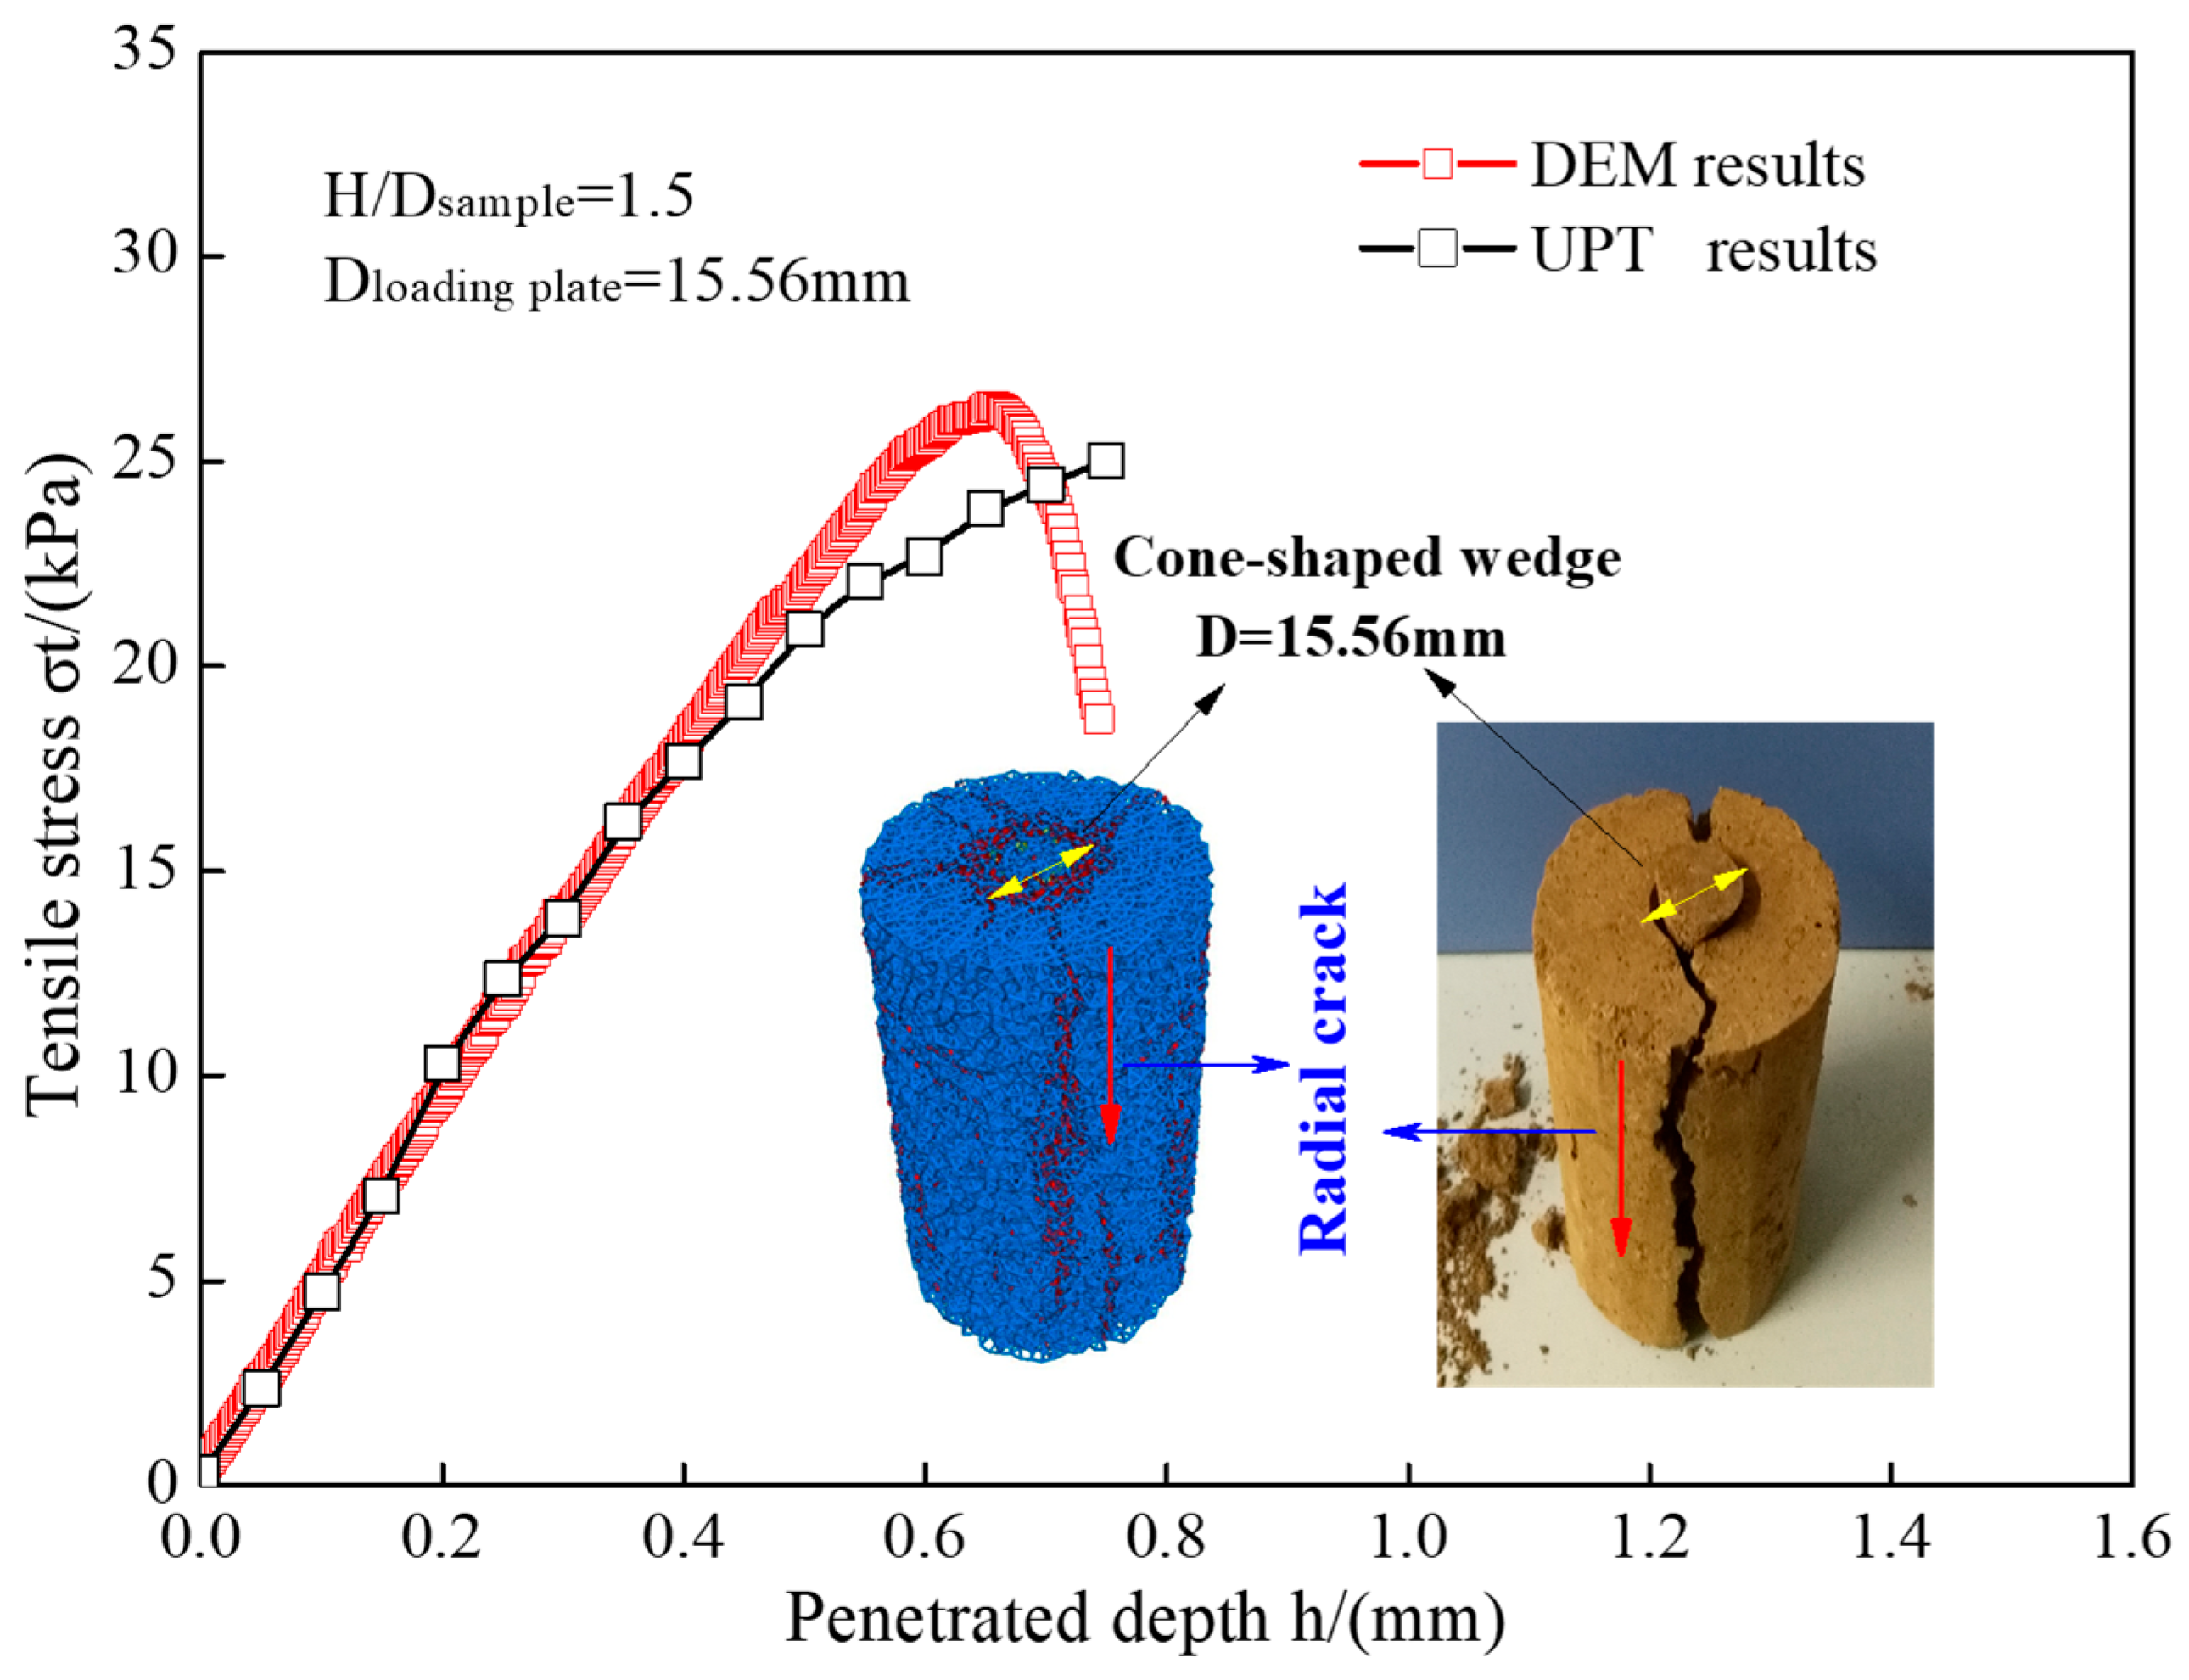
2.4.1. Tensile Failure Characteristics

Figure 5 shows images of the tensile failures of the studied undisturbed loess samples with height-to-diameter ratios of 1, 1.5, and 2.
The undisturbed loess formed conical wedge-shaped bodies (Figure 5f) at both the upper and lower ends under the action of the loading plates. The thrust of the wedge surfaces on the soil mass caused the undisturbed loess sample to experience tangential tensile stress along the concentric circles. At the same time, the specimen produced radial shear force and experienced a bending moment. As the penetration depth increased, the tensile stress also increased. When the tensile stress reached the tensile strengths of the undisturbed loess sample, the undisturbed loess sample became unstable and experienced failure. The failure of the undisturbed loess during the UPT occurred instantaneously. The undisturbed loess sample split into two or three halves along the radial direction. Cracks inclined to the axial direction were observed in the undisturbed loess samples with a higher height-to-diameter ratio (Figure 5d), while the failure mainly manifested as vertical cracks for the undisturbed loess samples with a lower height–diameter ratio (Figure 5a,b).
Given that this study did not focus on the development of microcracks using a camera monitoring device, the initiation and propagation of microcracks in the undisturbed loess samples were not monitored and recorded, and therefore, such data are not presented in this study.

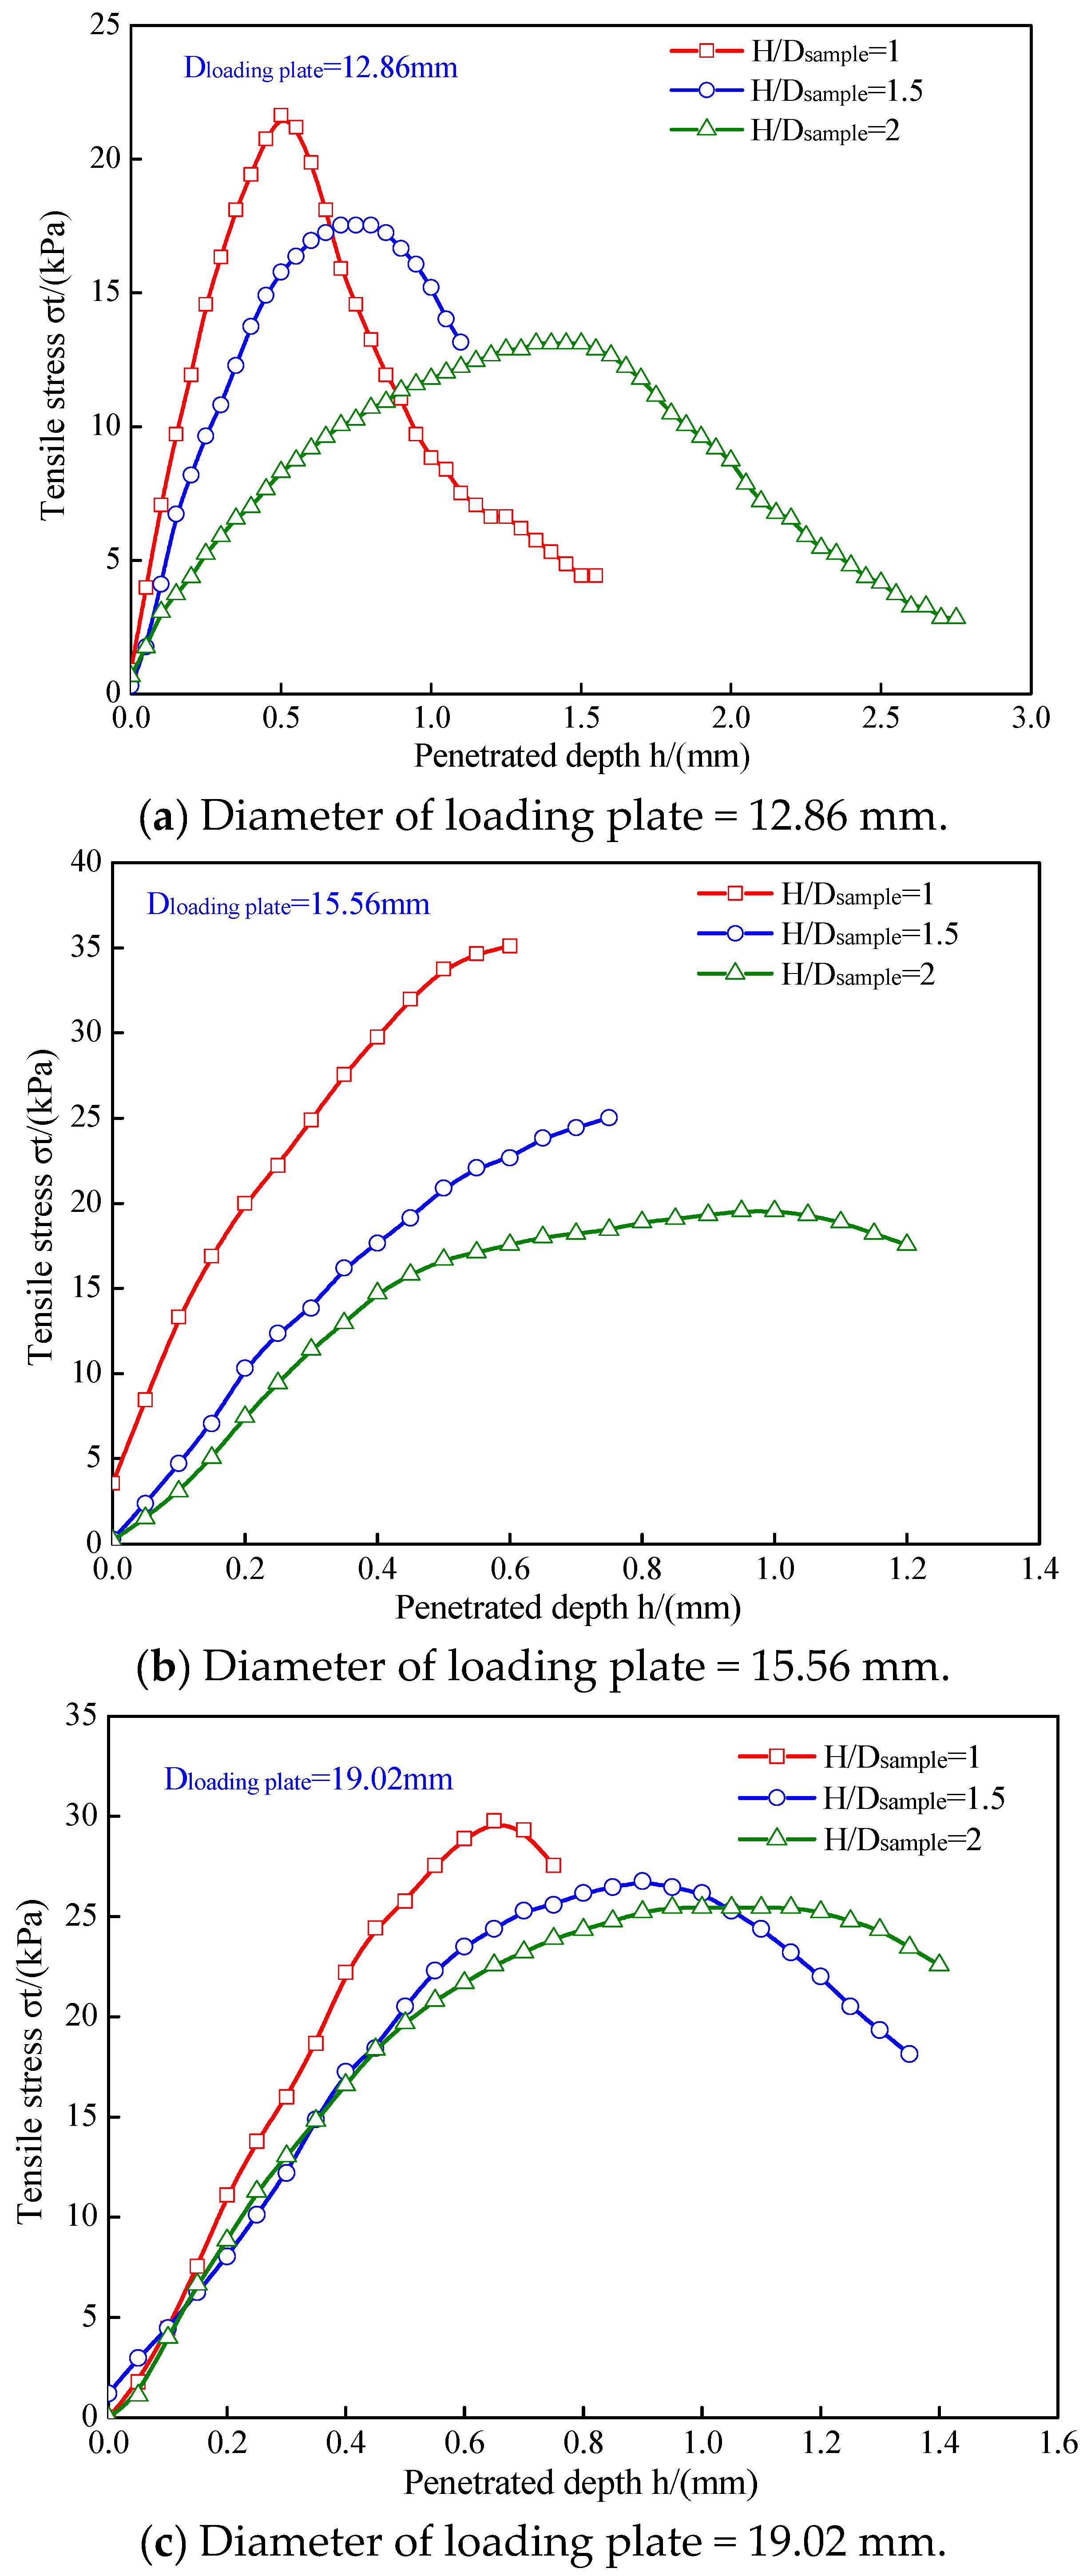
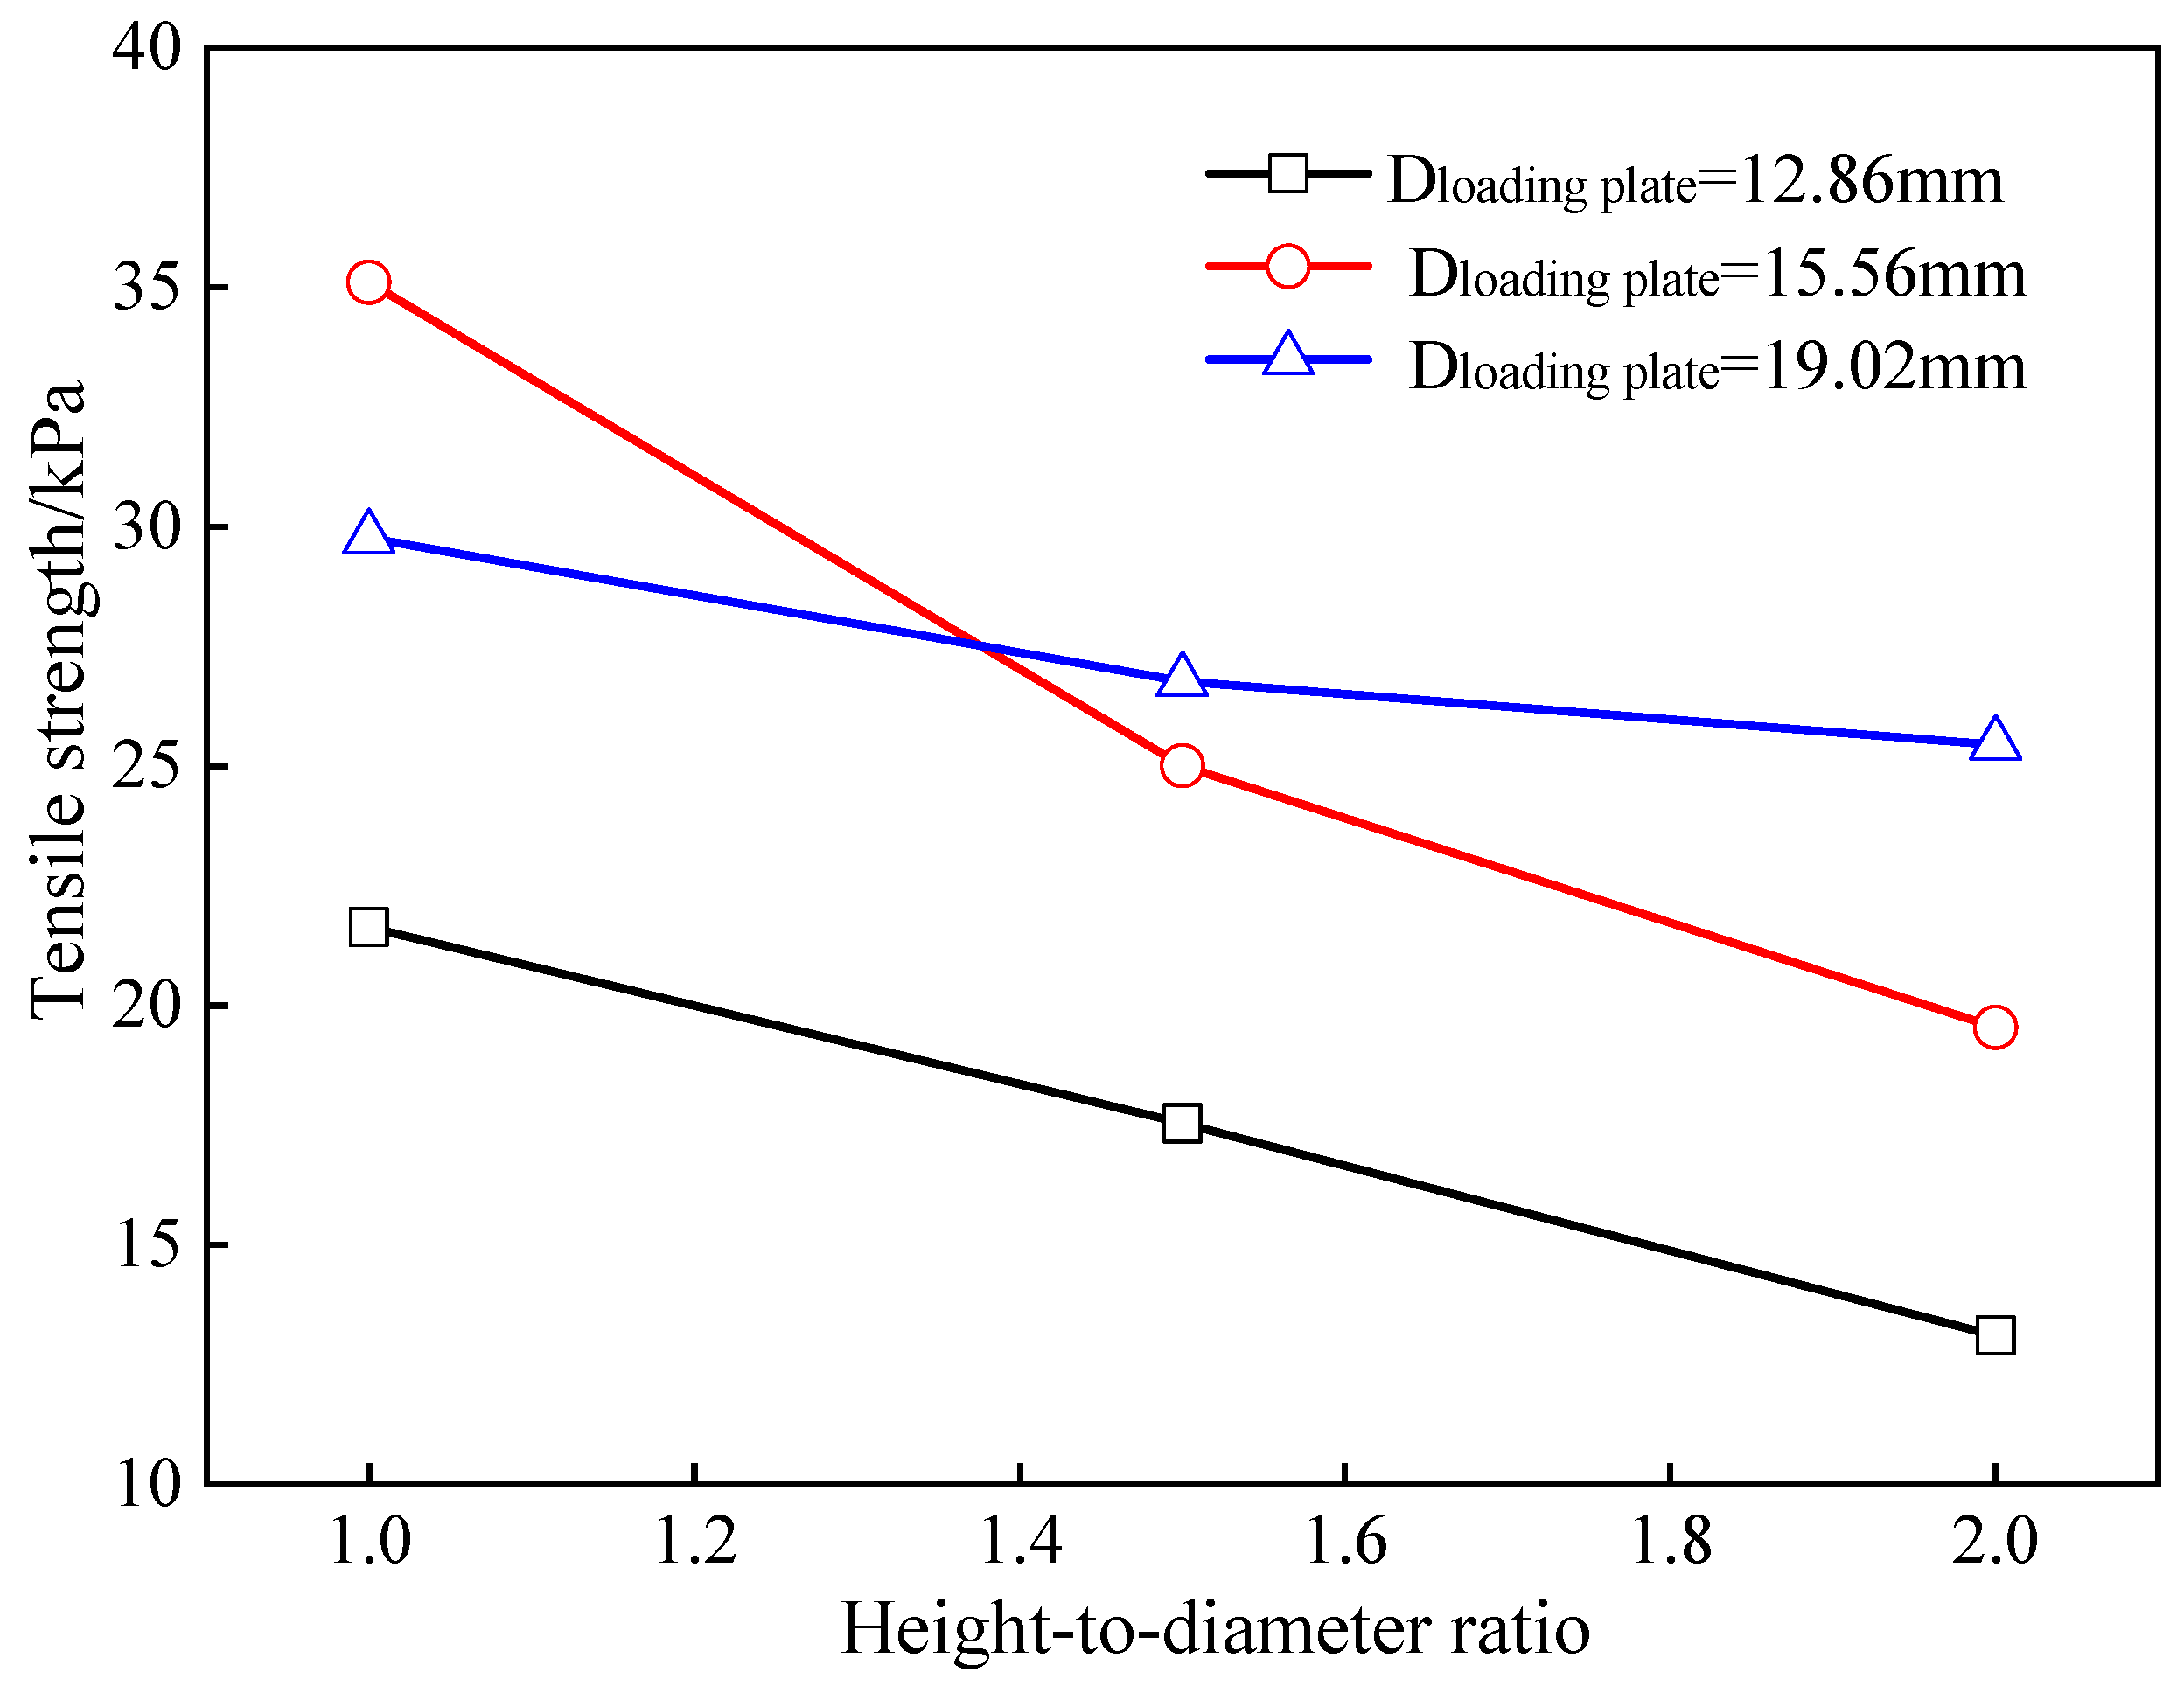
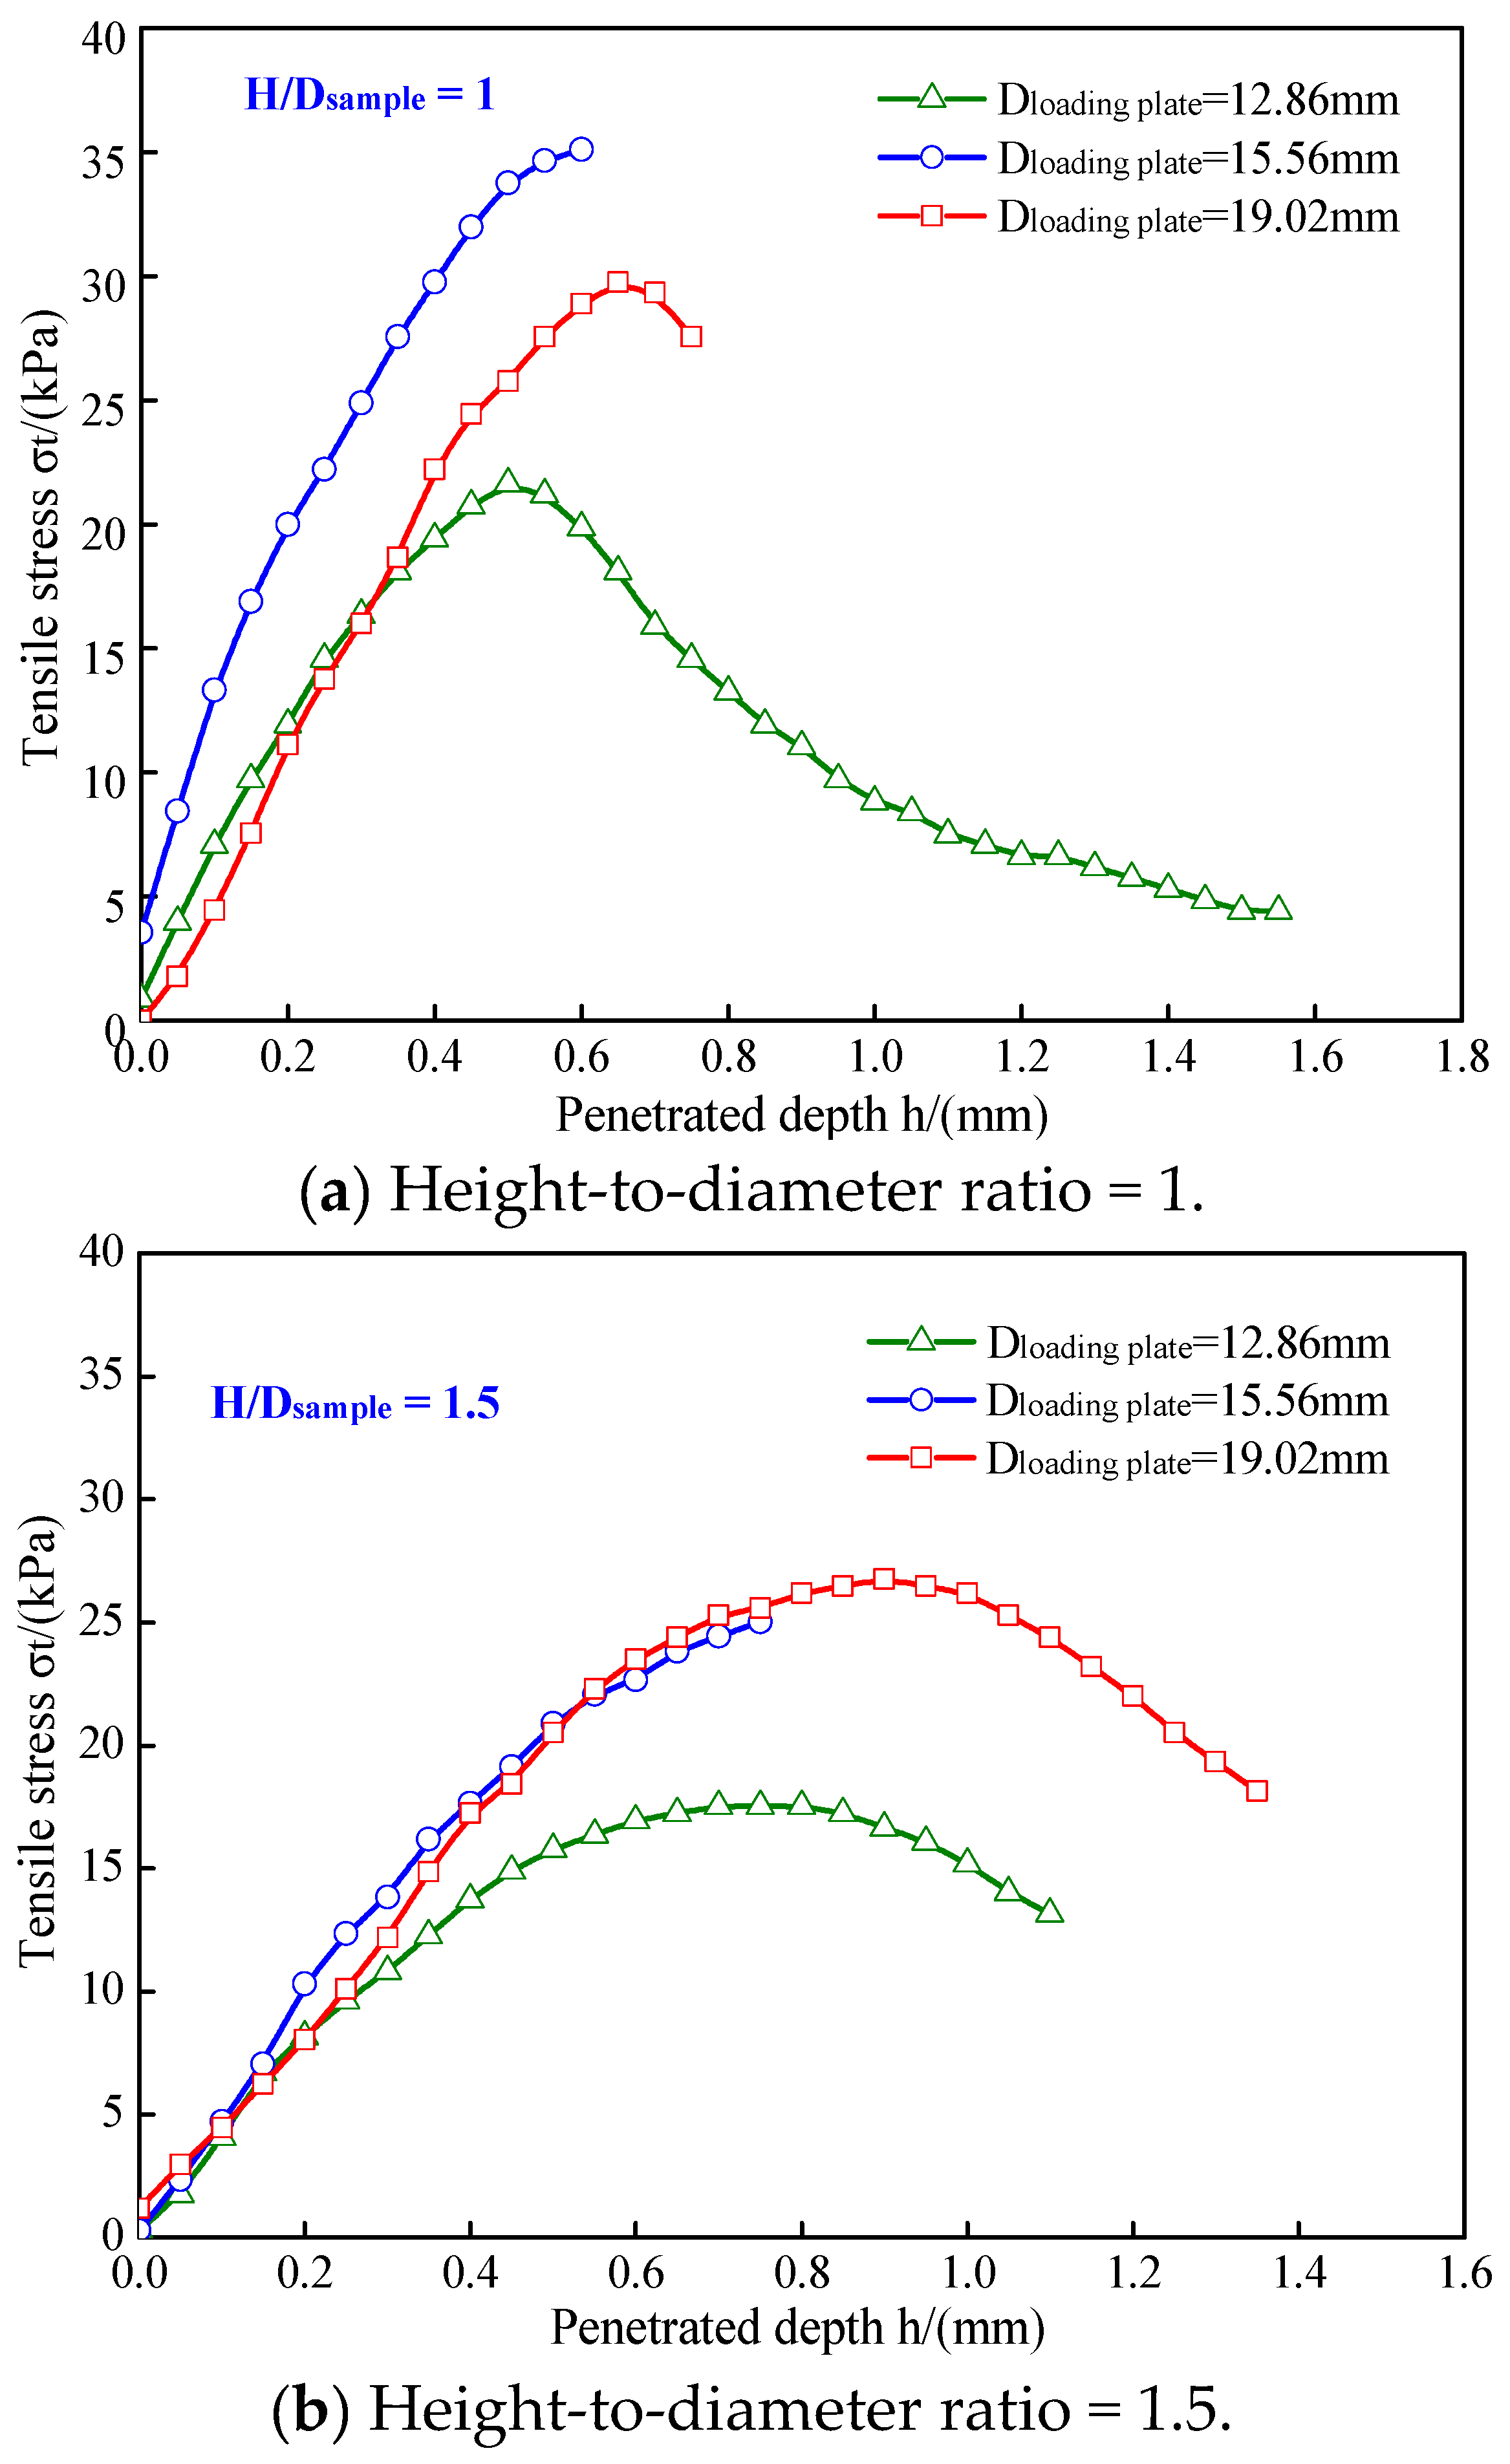
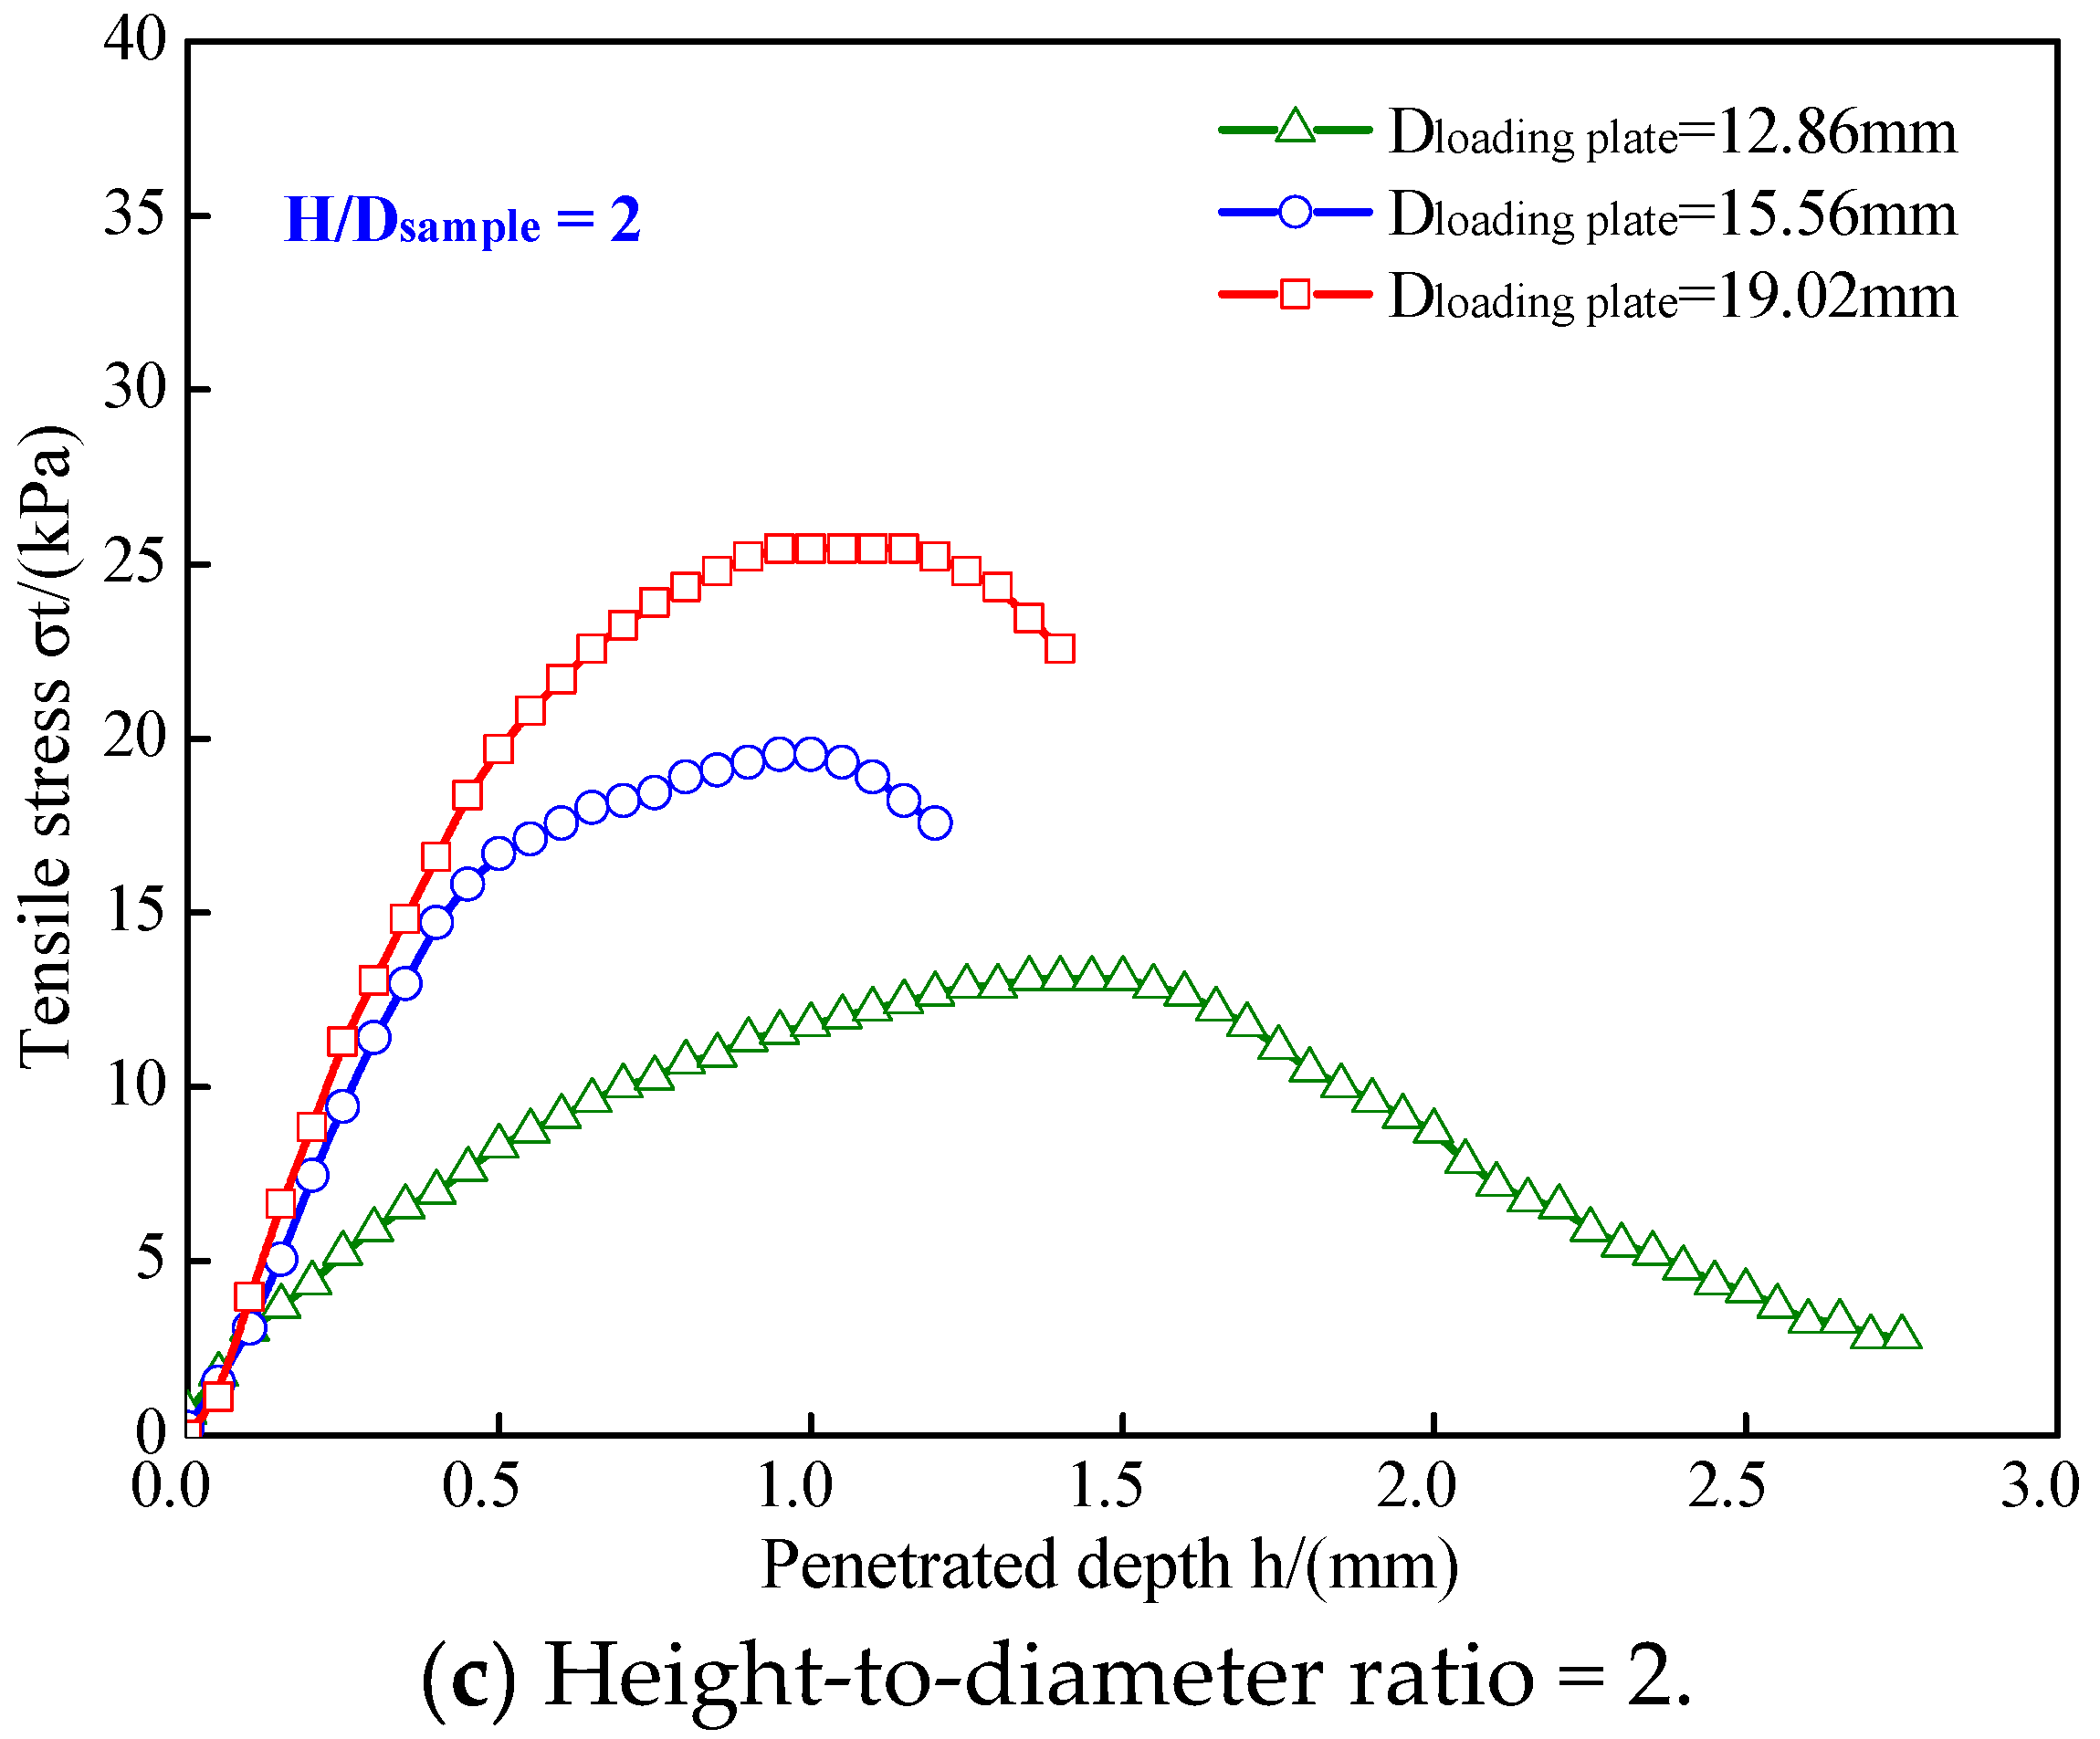
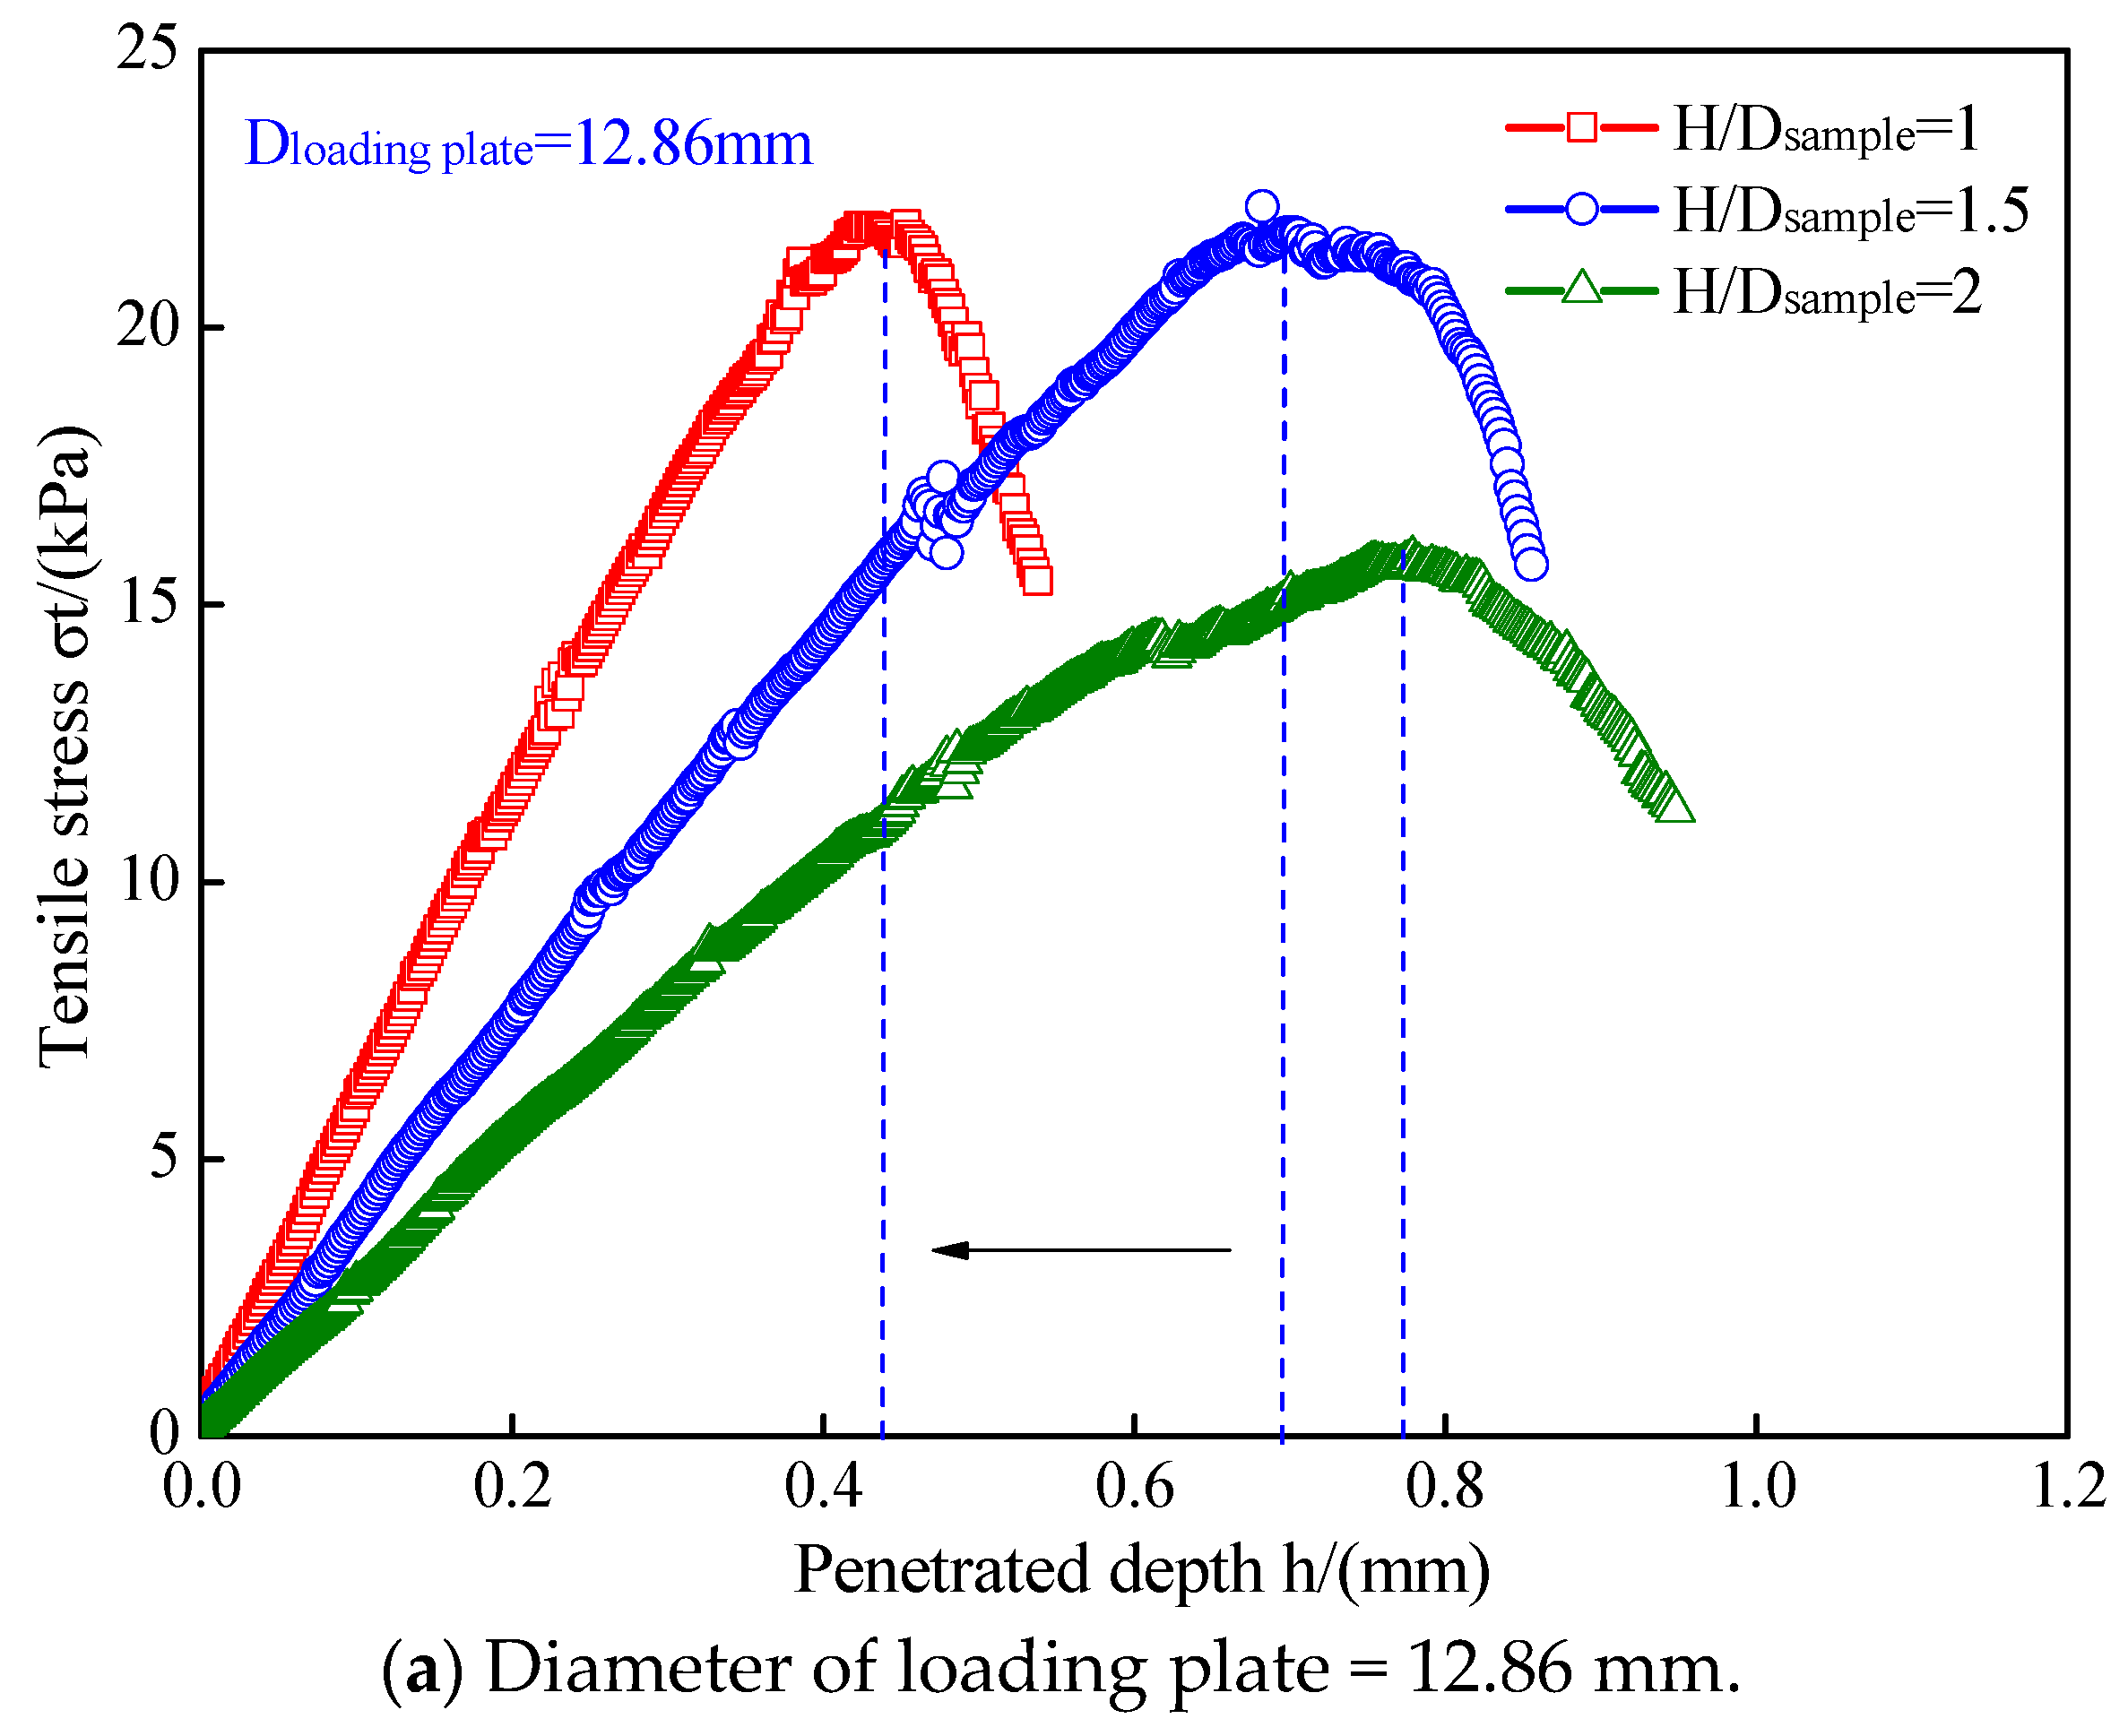
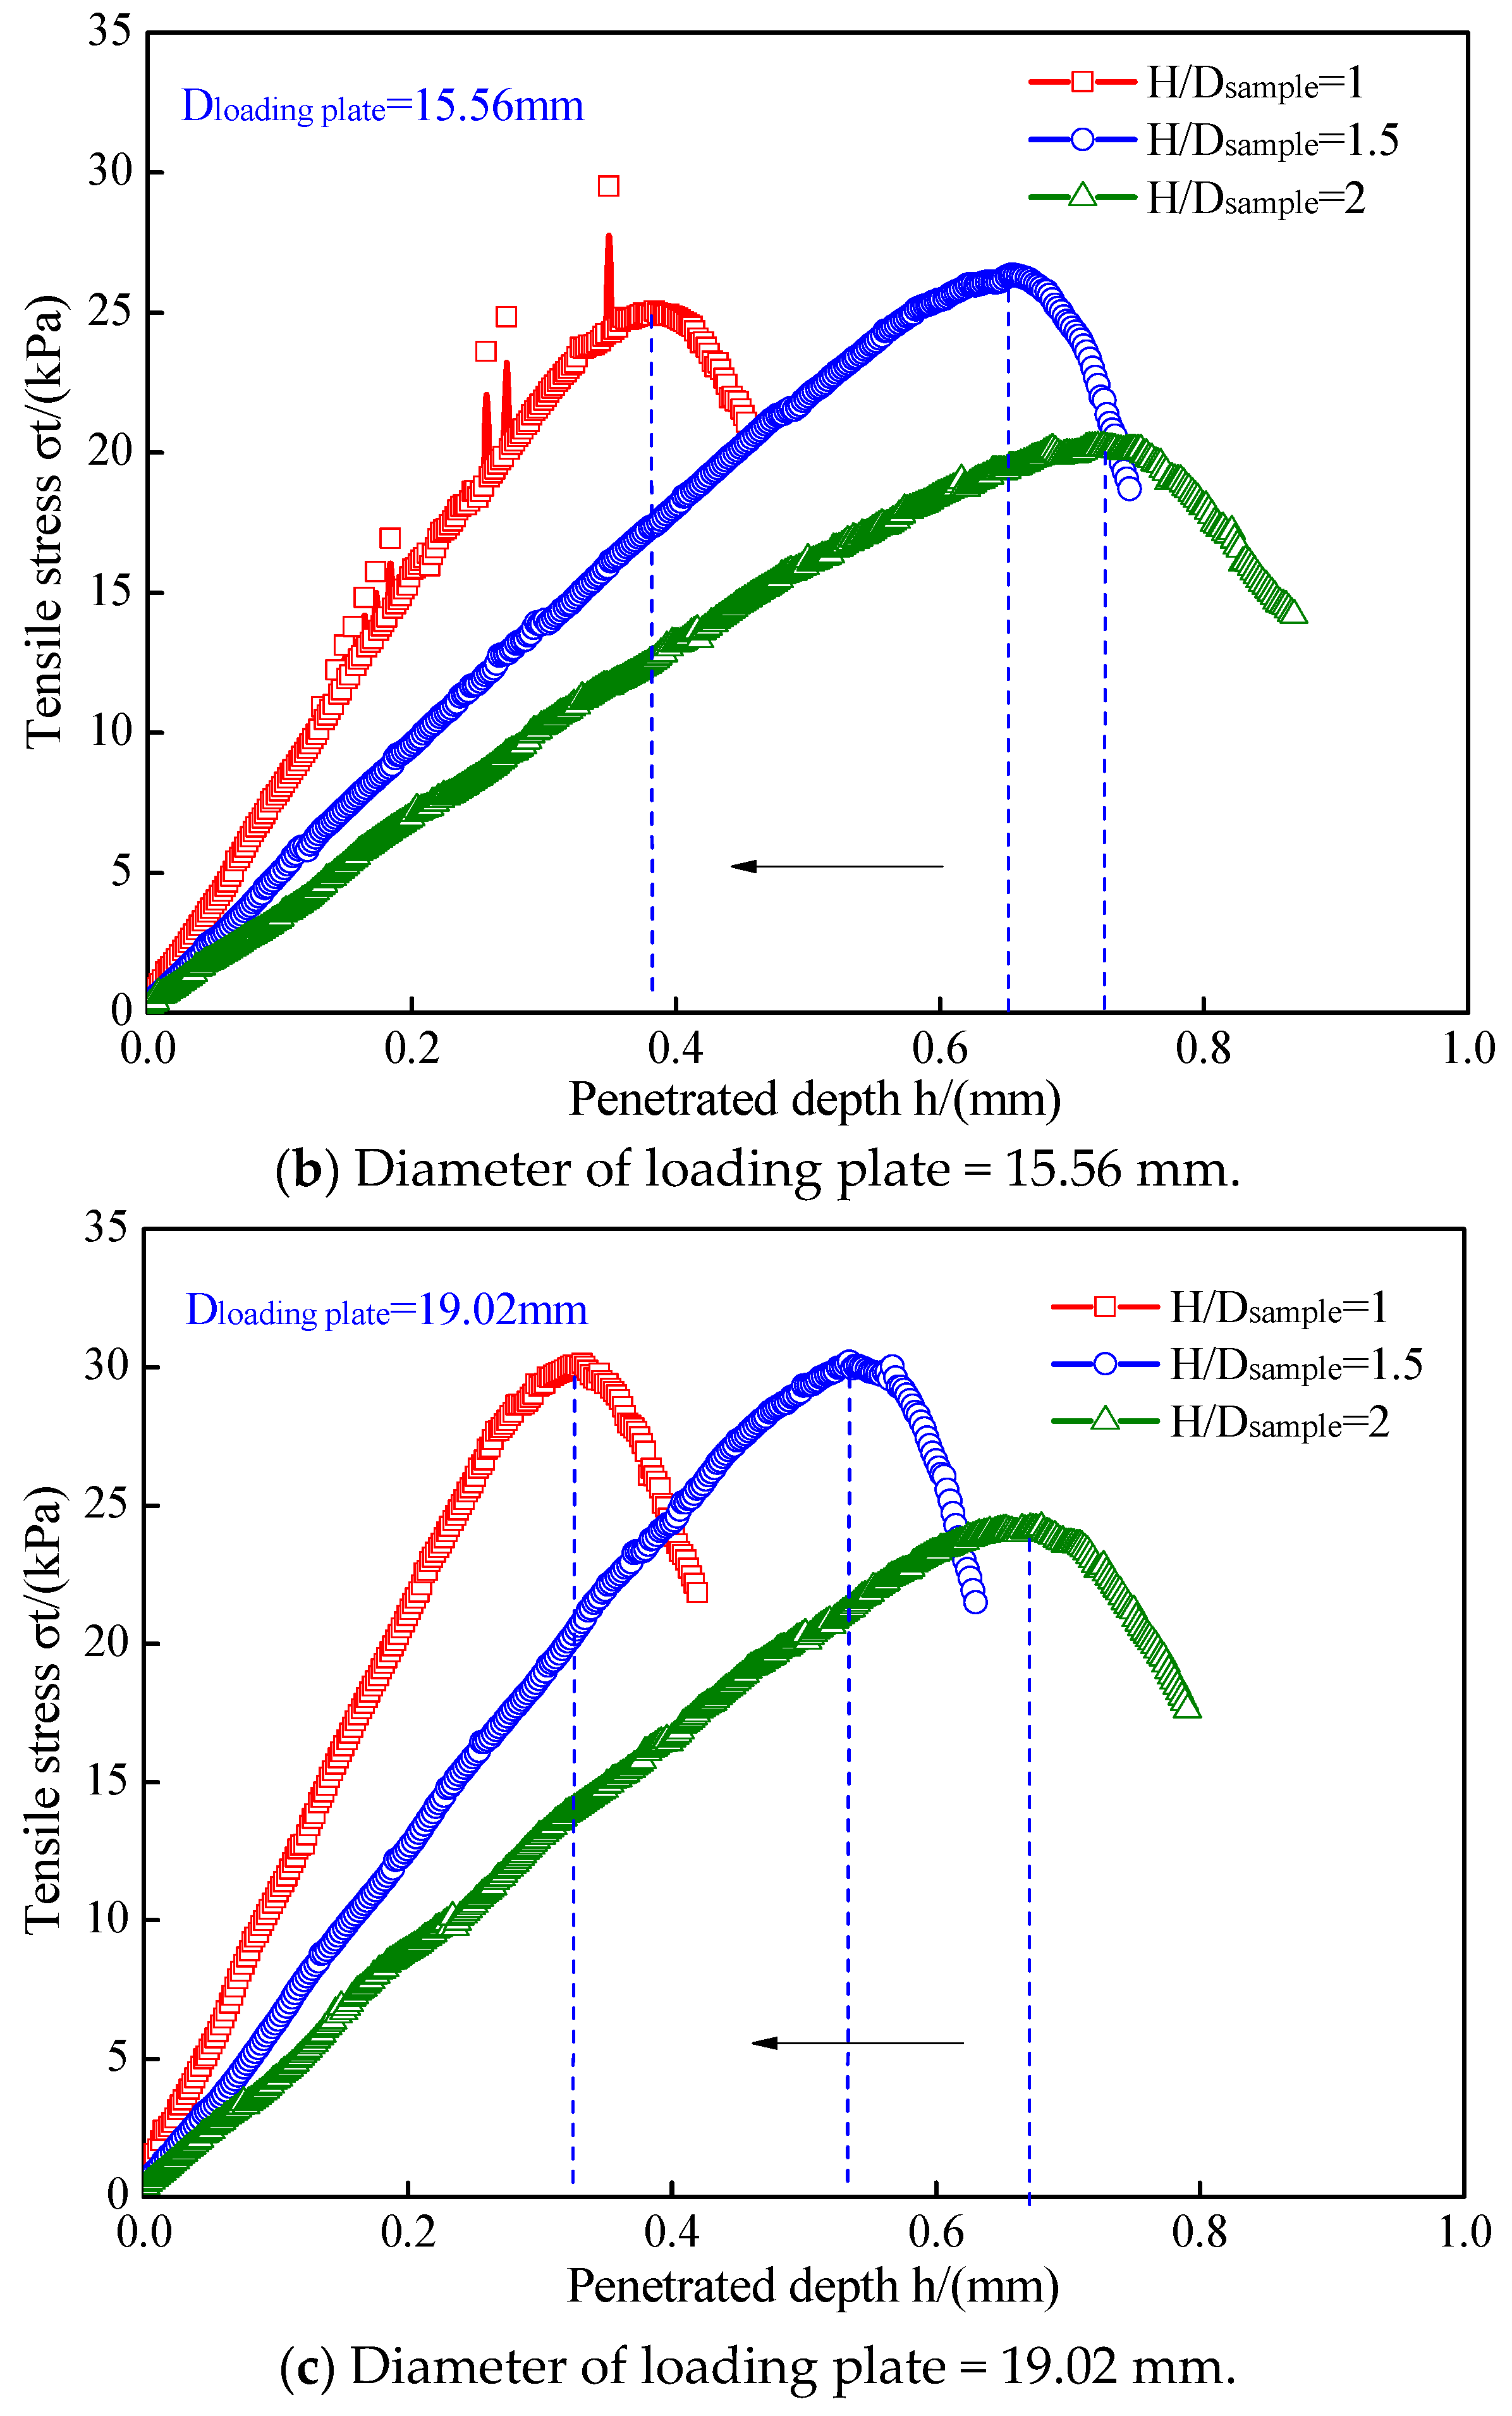
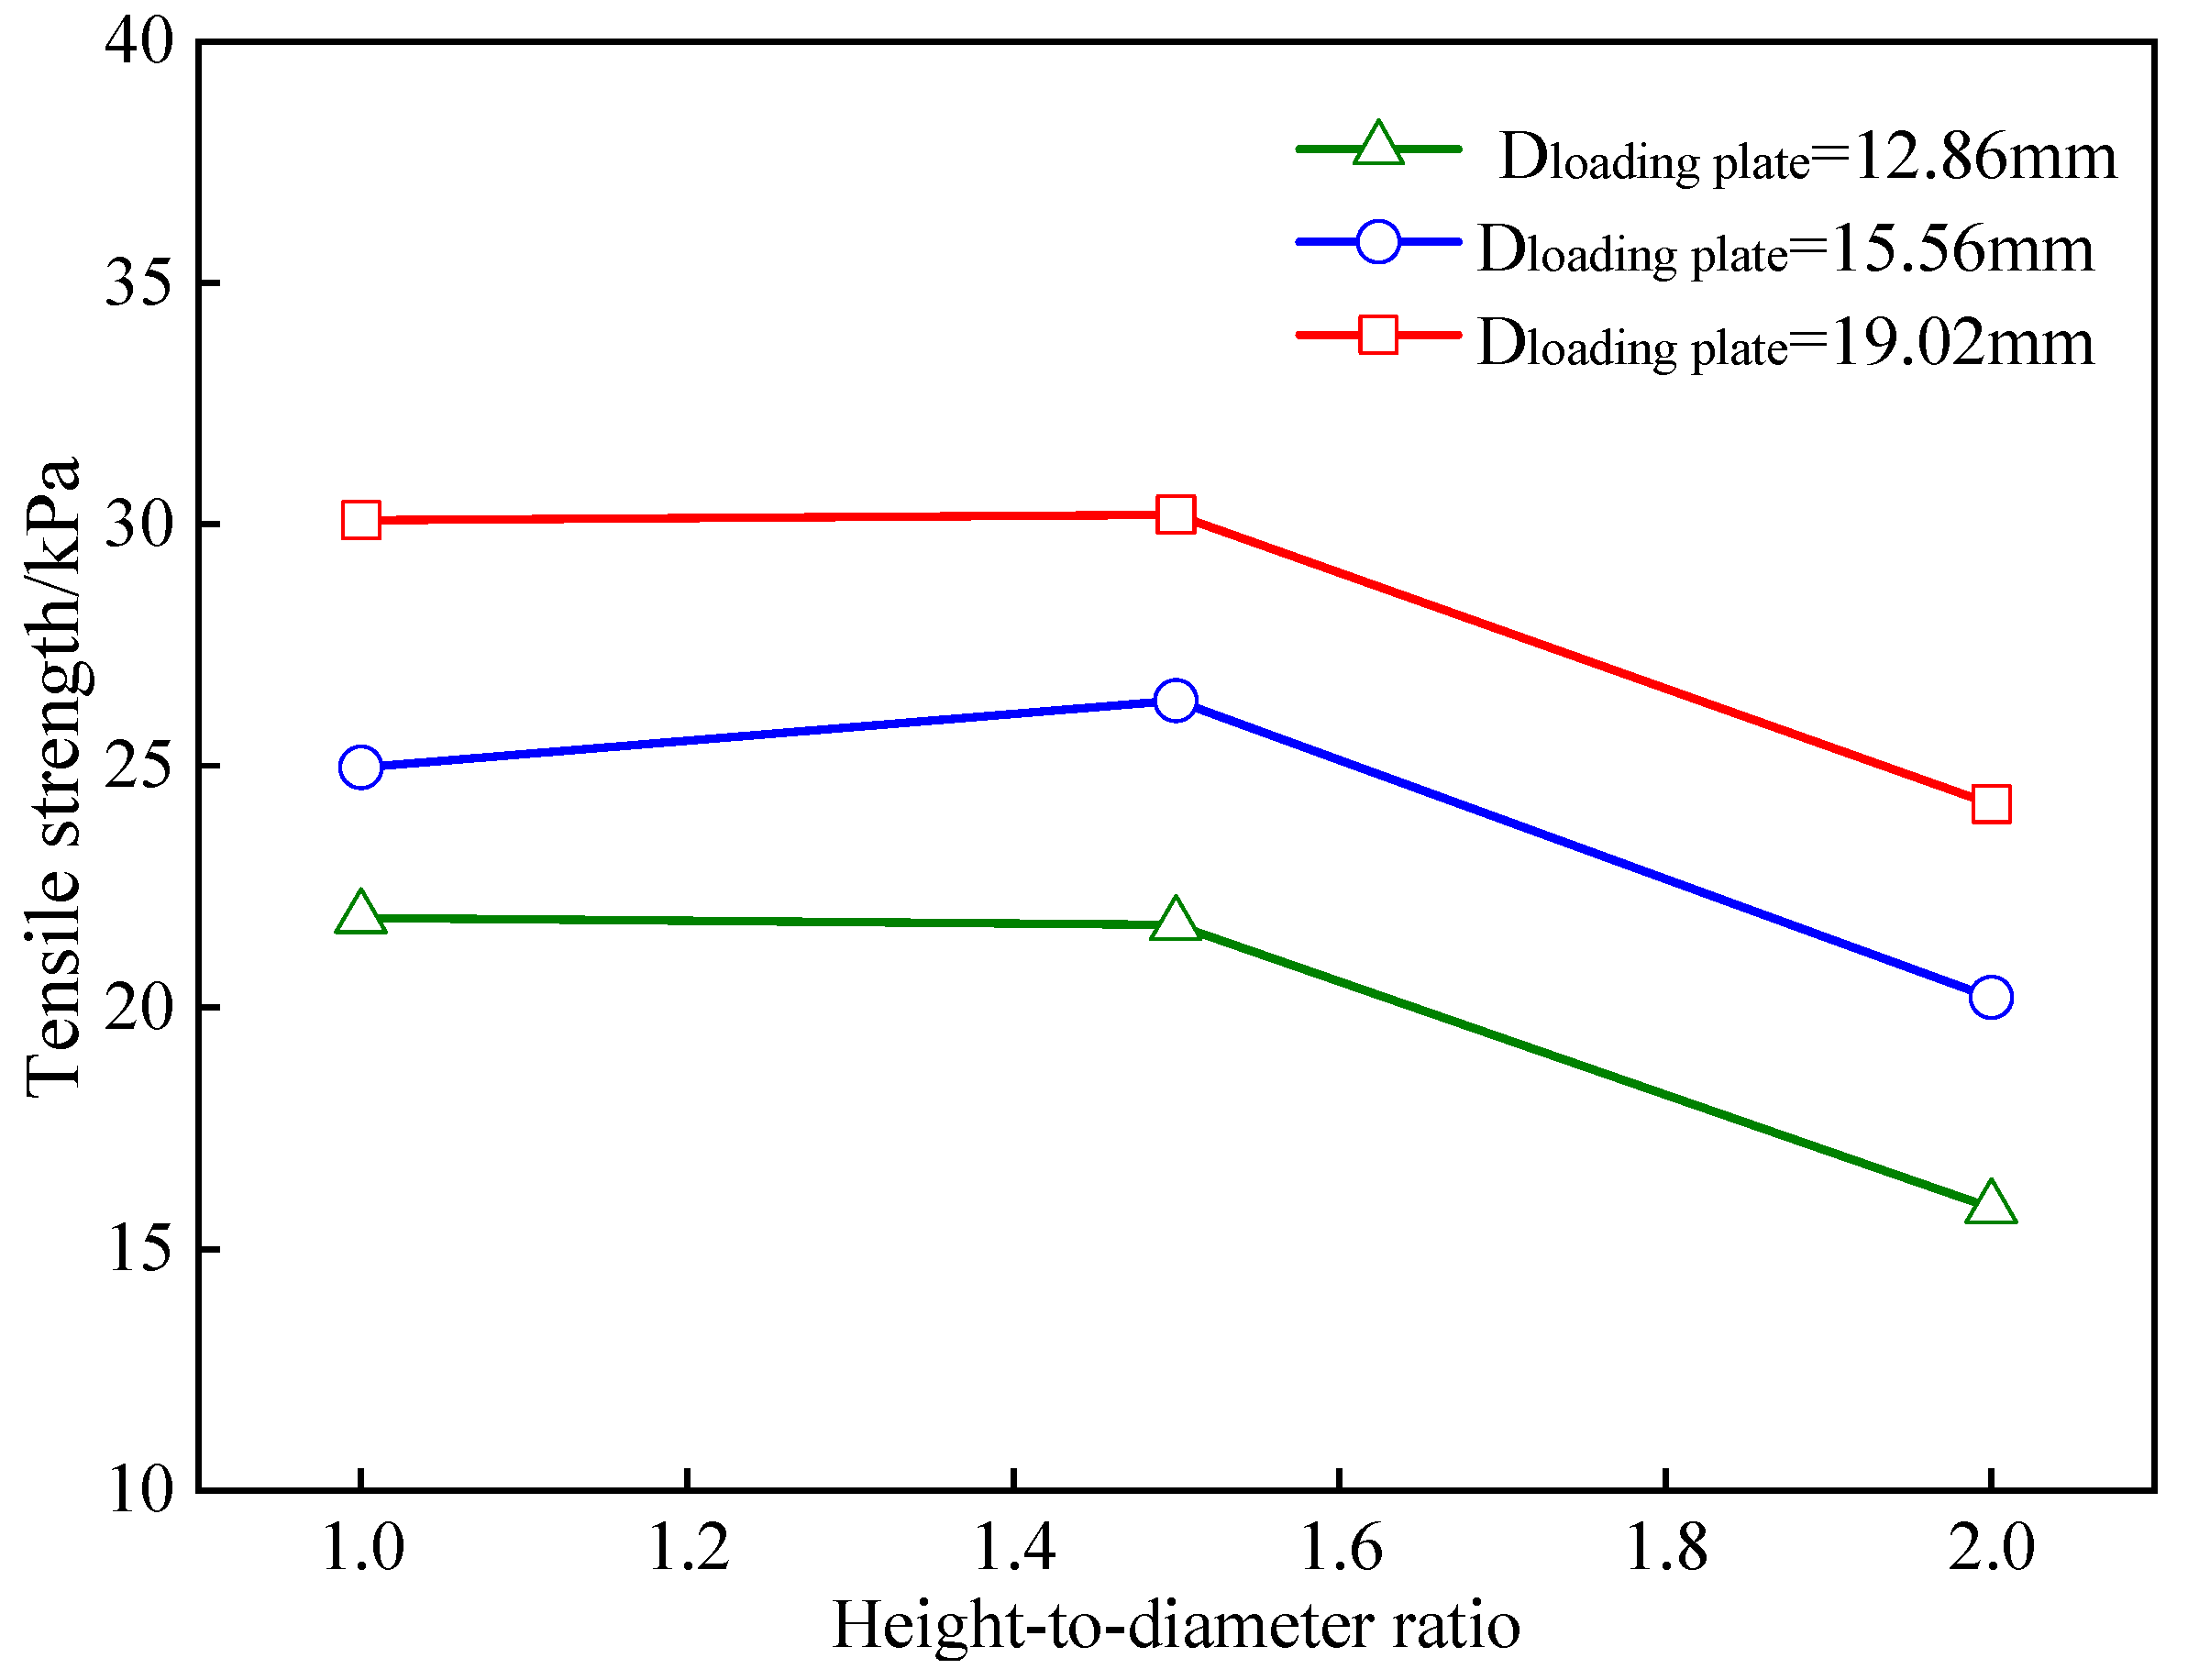
2.4.2. Effect of Height–Diameter Ratio

Figure 6 shows the tensile stress–penetration depth curves for the undisturbed loess samples with various height-to-diameter ratios. The break in the curve in Figure 6b indicates the sharp split of the sample, which indicated the obvious brittle failure characteristics. In general, under a given loading plate, the tensile failure patterns of the undisturbed loess samples were significantly influenced by the height-to-diameter ratio. The undisturbed loess samples showed a brittle failure pattern when the height-to-diameter ratios were relatively low, while this gradually changed to a plastic failure pattern when the height-to-diameter ratios were relatively high.
For example, using a loading plate with a diameter of 12.86 mm, the tensile stress rapidly increased and peaked before rapidly decreasing when the height–diameter ratio was 1, while it increased slowly to its peak and then slowly decreased when the height-to-diameter ratios were 1.5 and 2. This indicated that, with an increase in height-to-diameter ratio, the failure patterns of the undisturbed loess sample varied from brittle to plastic patterns. This change from brittle to plastic fracture patterns can be mainly explained by the following reasons: Under the action of the loading plate with a certain diameter, two cone-shaped wedges at the top and bottom of the undisturbed loess samples were formed due to the friction between the loading plate and loess surface. The thrust of the wedge surfaces on the soil mass caused the undisturbed loess samples to experience tangential tensile stress along the concentric circles. When the height-to-diameter ratio was relatively small, the tensile stress could penetrate the entire loess sample. This caused the undisturbed loess samples to be destroyed, even with a small penetration depth; thus, they showed brittle fracture behavior. When the height-to-diameter ratio was relatively high, the tensile stress could not penetrate the entire loess sample. This caused the undisturbed loess samples to be destroyed with a large penetration depth; thus, they showed plastic fracture behavior.
From Figure 6, it can be observed that the height-to-diameter ratio also significantly influenced the tensile strengths of the undisturbed loess samples. The effects of the height-to-diameter ratios on the tensile strengths of the undisturbed loess samples are shown in Figure 7. With an increase in the height–diameter ratio, for a given loading plate with a certain diameter, the tensile strengths of the undisturbed loess samples gradually decreased. This can be attributed to the following reasons: Under a loading plate with a certain diameter, the size of the conical wedge formed in the UPT was determined. As the height-to-diameter ratio increased, the position of the conical wedge approached the two ends of the undisturbed loess sample. The tensile stress in the undisturbed loess sample was therefore uneven, and the amount of soil in the ultimate state during failure was small, resulting in a small tensile strength from the theoretical Formula (1).

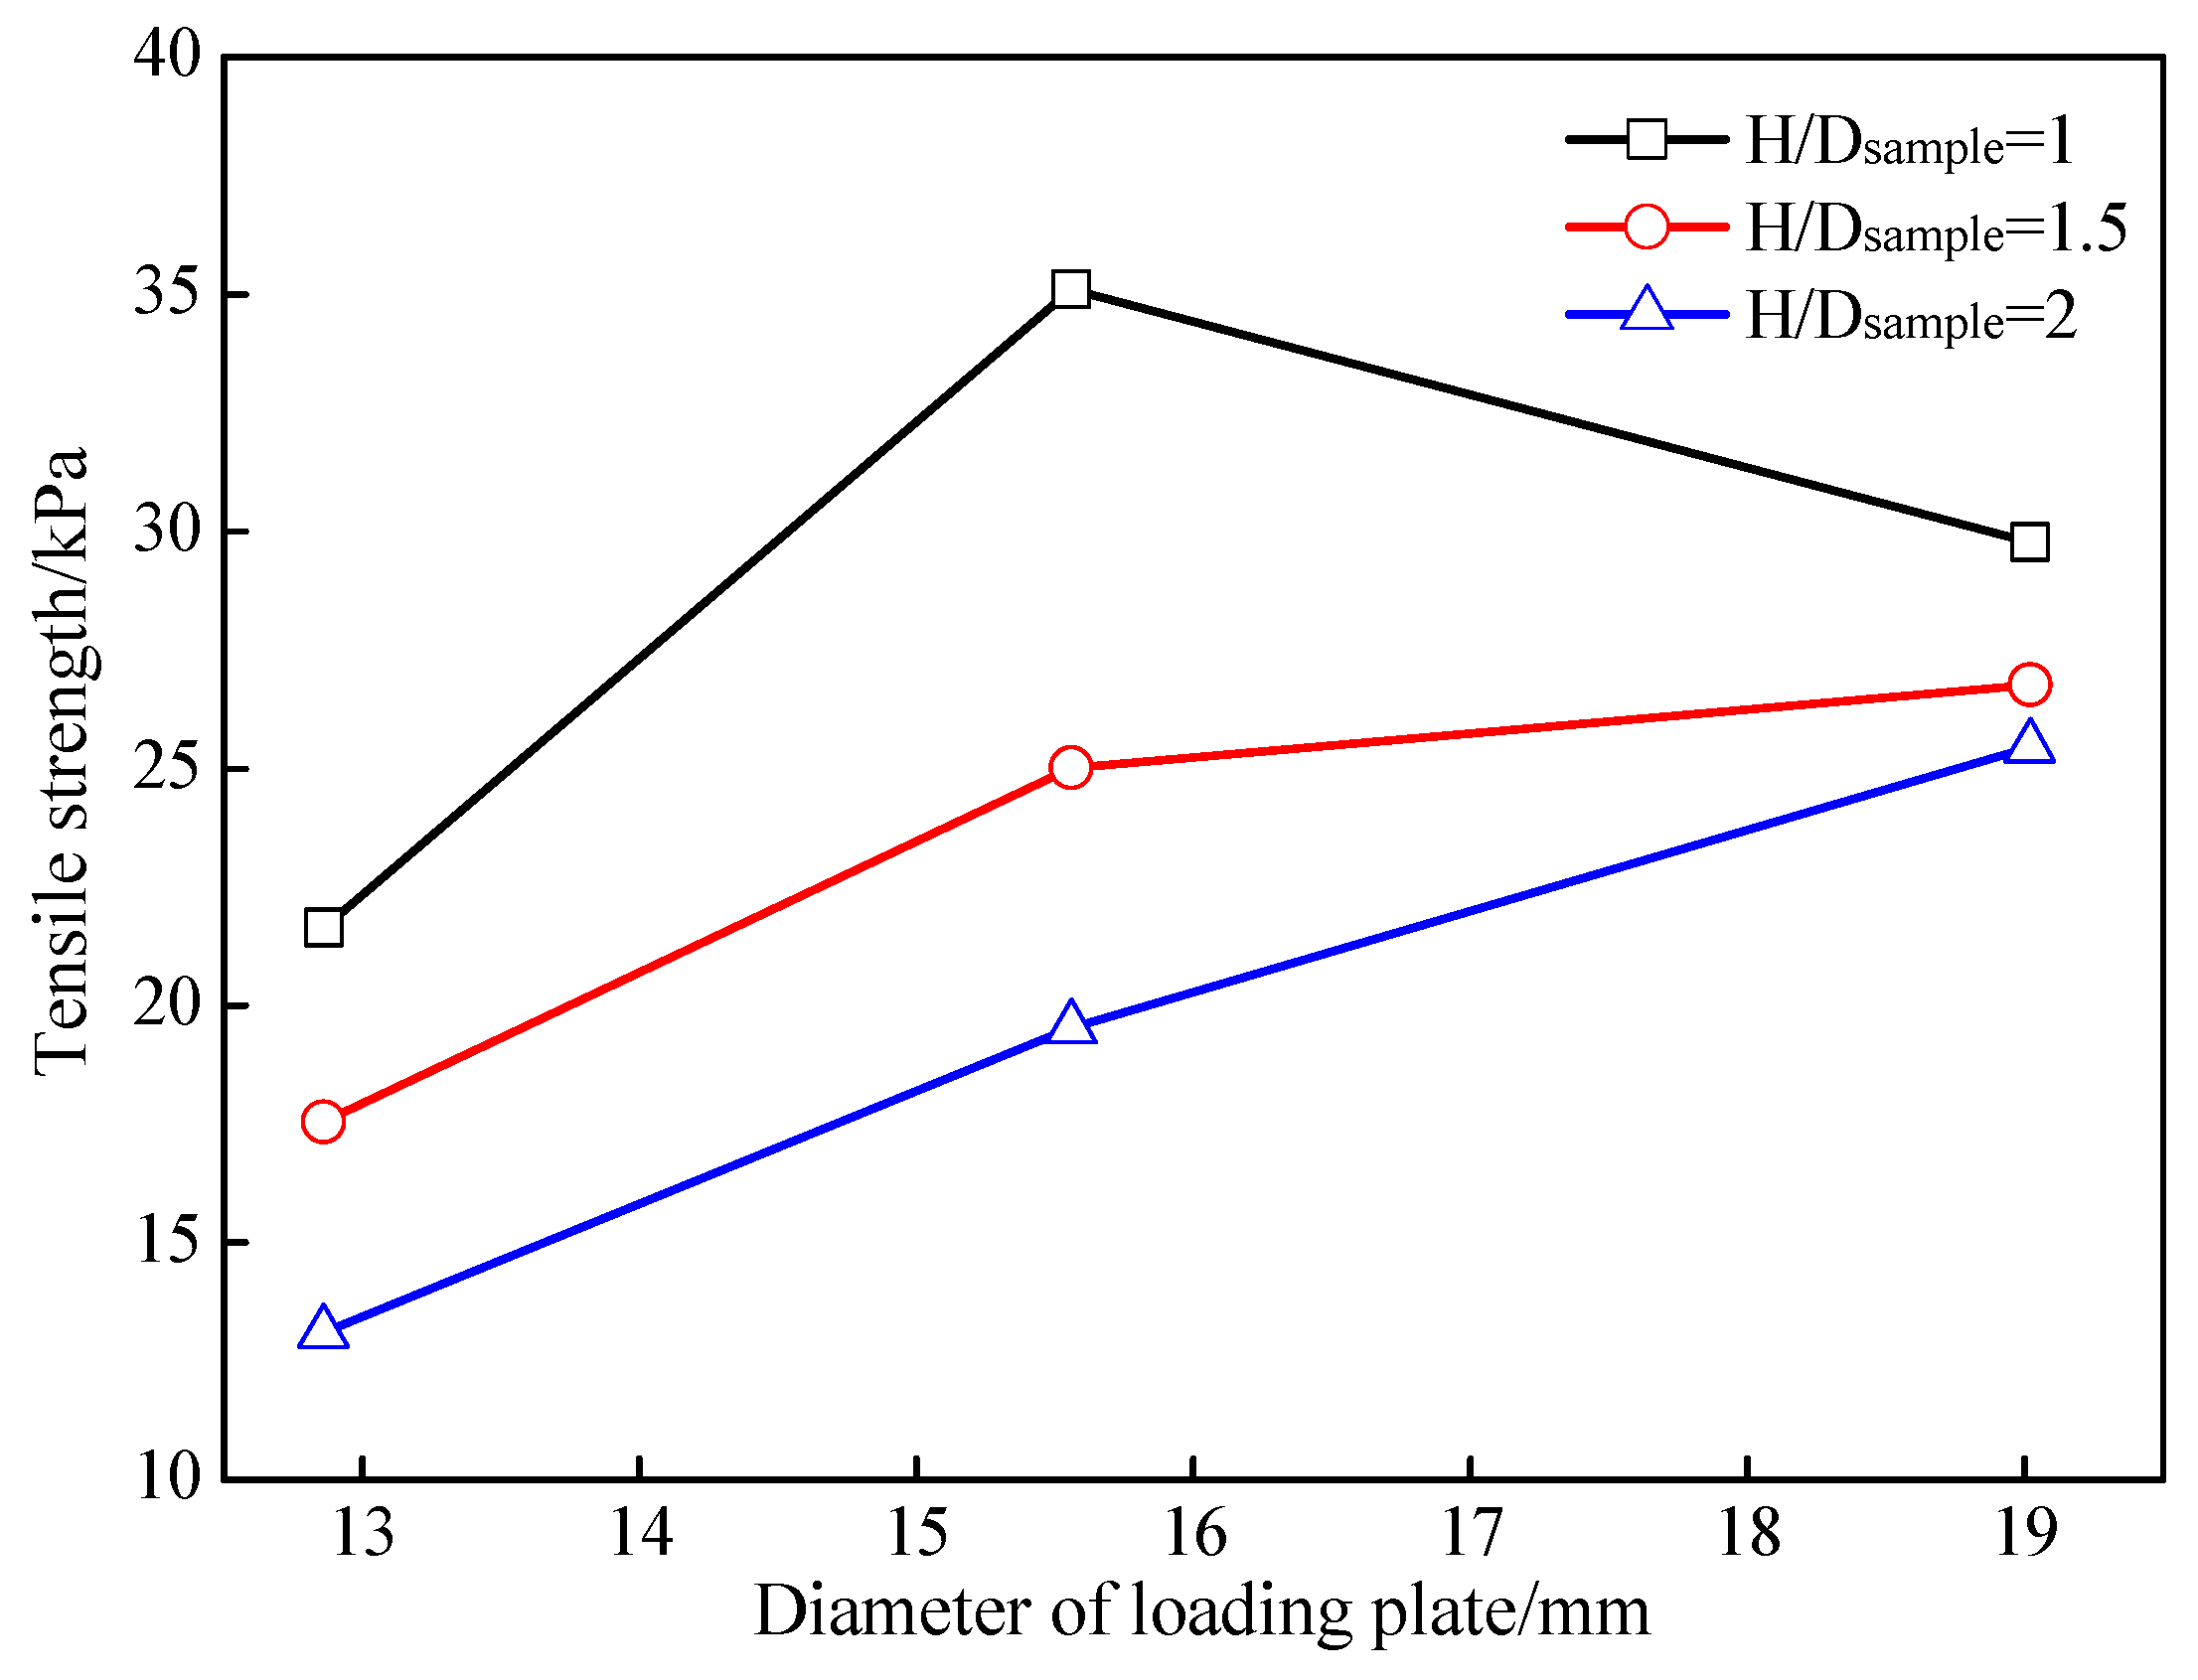
2.4.3. Effect of Loading Plate Diameter

The tensile stress–penetration depth curves of the undisturbed loess samples under loading plates with different diameters are shown in Figure 8. The loading plate diameter can influence the tensile failure pattern. Generally, for an undisturbed loess sample with a certain height-to-diameter ratio, with an increase in loading plate diameter, the tensile failure pattern changed from plastic failure to brittle failure. For example, for a given sample with a height-to-diameter ratio of 1, the tensile stress first increased to the peak value and then decreased rapidly when the loading plate diameter was 19.02 and 15.56 mm, while it increased slowly to the peak value and then slowly decreased when the loading plate diameter was 12.86 mm. This showed that, as the diameter increased, the failure pattern of the undisturbed loess samples varied from plastic to brittle.
For a given undisturbed loess sample with a certain height-to-diameter ratio, with an increase in loading plate diameter, the two cone-shaped wedges that formed in the top and bottom of the undisturbed loess sample became larger. Correspondingly, the induced tensile stress can vertically penetrate more parts of the undisturbed loess samples more easily. This causes the undisturbed loess samples to be destroyed with a small penetration depth; thus, they show brittle fracture behavior. When the diameter of the loading plate was relatively smaller, for a given undisturbed loess sample with a certain height-to-diameter ration, the two cone-shaped bodies that formed in the top and bottom of the undisturbed loess sample were also small. Correspondingly, the induced tensile stress can only penetrate a small part of the undisturbed loess samples. This causes the undisturbed loess samples to be destroyed at a higher penetration depth; thus, the samples show plastic fracture behavior.
From Figure 8, it can also be found that the loading plate diameter also significantly influenced the tensile strengths. Figure 9 shows the effects of the loading plate diameter on the tensile strengths of the undisturbed loess samples. With an increase in the loading plate diameter, for a given height-to-diameter ratio, the tensile strengths of the undisturbed loess samples gradually increased. This can be attributed to the following reasons: For an undisturbed loess sample with a certain height-to-diameter ratio, the larger the diameter of the loading plate, the larger the conical wedge formed. At this time, the acting points of the radial shear force and bending moment were closer to the middle of the undisturbed loess samples. The more soils in the ultimate state of failure, the higher the tensile strength.
Based on the UPT results, the coefficients of variation for the tensile strength are shown in Table 3. The coefficients of variation for the tensile strength further show that the tensile strength of undisturbed loess samples was significantly impacted by the height-to-diameter ratio and loading plate diameter.

3. DEM Simulation for UPT

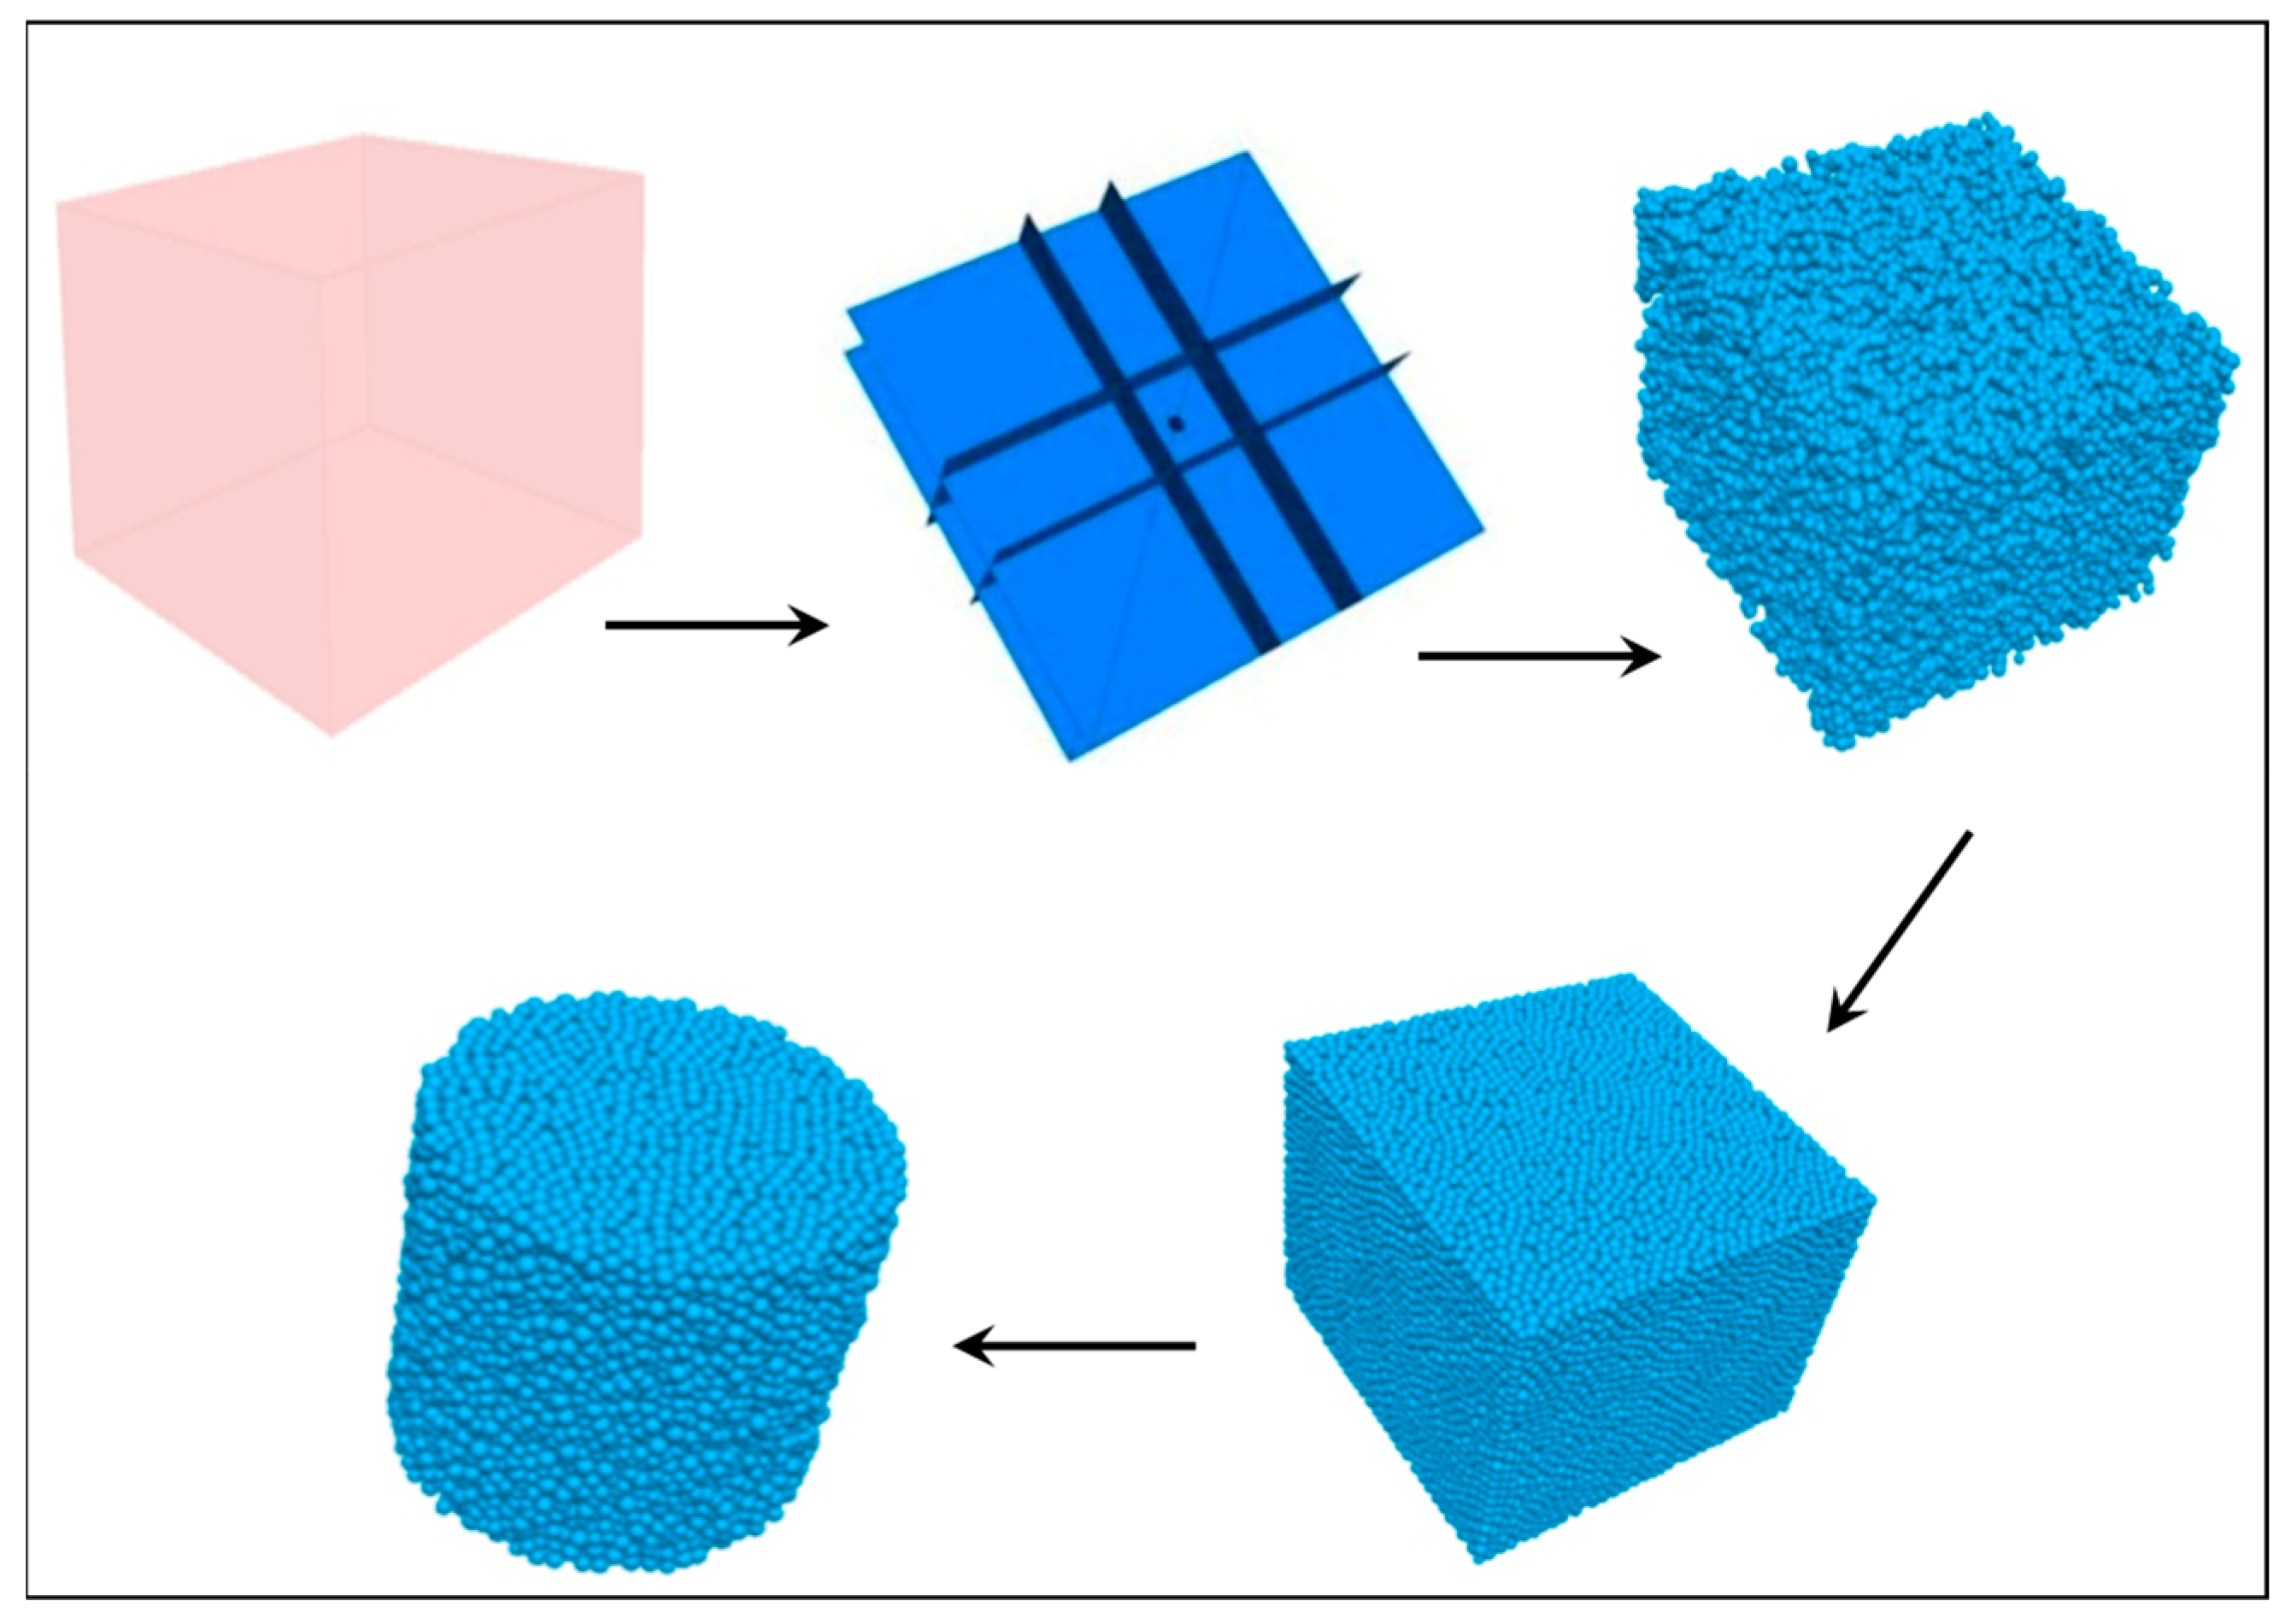
3.1. Establishment of DEM Model

Figure 10 shows the establishment of the DEM model used for simulating the unconfined penetration test (UPT). The DEM simulations for unconfined penetration tests were conducted using the commercial software PFC3D 5.0 [26]. The DEM model comprised the bodies (ball, clump, wall) and contact models. There are two types of contact in DEM modeling: ball–ball contact and ball–wall contact. The contact model used in this simulation was a linear–parallel contact model. To analyze the motion of each particle caused by the contact forces and body forces acting on it, Newton’s second law was utilized for the particles. Additionally, the force–displacement law was implemented at the contact points to update the contact forces generated by the relative motion at each contact interface [20,28]. More information can be found in previously published papers and the PFC3D 5.0 operation manual [20,28].
The DEM was established as follows: A domain where the calculations were to be conducted was first built, and the boundary of the model was then set. The bonded particles were generated within the model boundary, and it reached a balance via multiple calculations. The balanced particles’ assembly was then cut into a cylindrical model with designated dimensions. The loading plates in the UPT were simulated by setting two plates with certain diameters in both the top and bottom of the cylindrical particle model. The data of axial stress and displacement during the DEM simulation for the UPT were monitored and recorded using the FISH codes in PFC3D. By using Formula (1), tensile stress in the DEM simulation was measured.

3.2. Calibration of DEM Model

In the DEM model, meso-parameters serve as critical factors for performing numerical simulations, as they bridge the meso-mechanical and macro-mechanical properties. It is therefore necessary to conduct parameter calibration. The input meso-scopic parameters were adjusted through a trial-and-error approach to ensure the simulation results aligned with the experimental findings [29,30].
The calibration of the DEM model parameters was based on the results of the UPTs on the undisturbed loess samples with a height-to-diameter ratio of 1.5 under the action of a loading plate with a diameter of 15.56 mm. The meso-scopic parameters were determined when the simulated tensile stress–penetration depth curve precisely matched with the measured tensile stress–penetration depth curve. By adjusting multiple meso-parameters, the simulated tensile stress–penetration depth curve successfully matched the measured tensile curve, as shown in Figure 11. In addition, the simulated tensile failure pattern was also similar to the tensile failure pattern measured in the UPT. Correspondingly, the meso-parameters in this DEM simulation were adopted for the DEM simulation of the UPT in this study, as shown in Table 3. Given that this paper focuses on studying the effect of two external factors (height-to-diameter ratio of undisturbed loess and the diameter of loading plates) on the tensile strengths of undisturbed loess samples, the heights of the samples and the diameters of loading plates were only changed according the experimental scheme in Table 2 in the numerical simulation of the UPT. The other meso-parameters were the same as those in Table 4.
A series of DEM simulations for the UPT were carried out to investigate the effect of the height-to-diameter ratio (i.e., 1, 1.5, and 2) and loading plate diameter (i.e., 12.86 mm, 15.56 mm, 19.02 mm) on tensile characteristics, such as contact failure, stress, and cracking, within the undisturbed loess samples. The simulated tensile characteristics, encapsulated in the tensile stress–penetration depth curves and tensile strength values, were compared to those measured via the UPT (described in Section 2.4). Based on the simulated results, the mechanisms through which the tensile strengths of undisturbed loess samples varied with the height–diameter ratio and loading plate diameter were analyzed and discussed.

3.3. Results of DEM Simulation

3.3.1. Effect of Loading Plate Diameter

Figure 12 shows the simulated tensile stress–penetration depth curves of the undisturbed loess samples under loading plates with different diameters. Figure 13 illustrates the variation in the tensile strengths of the undisturbed loess samples. Generally speaking, the tensile stress in the sample first increased linearly and then decreased. The tensile failure patterns of the samples were between brittle failure and plastic failure patterns. There was a typical type of strain hardening. With an increase in loading plate diameter, the penetrated depth decreased. For example, for a given H/R of 1, as the loading plate diameter increased from 12.86 mm to 19.02 mm, the penetration depth decreased from 0.54 mm to 0.412 mm. This means that the tensile failure patterns of the undisturbed loess samples had changed.
It should be noted that for a given height-to-diameter ratio of 1, the tensile stress–penetration curve of the sample under a loading plate with a diameter of 15.56 mm showed a significantly local fluctuation. This can be attributed to the redistribution of internal stress. The local stress in the PFC3D model may exceed the strength limit, and the contacts between the balls were quickly rebounded; thus, the bearing capacity was re-established. During the DEM simulation, the local ball was rearranged, resulting in uneven stress distribution and, consequently, local fluctuations in the tensile curves.
The diameter of the loading plate significantly influences the tensile strengths of the undisturbed loess samples (Figure 13). The tensile strengths of the undisturbed loess samples increased with an increase in the loading plate diameter. For instance, when the height-to-diameter ratio was 2, the tensile strength of the undisturbed loess sample increased from 15.86 kPa to 24.21 kPa as the diameter of the loading plate increased from 12.86 mm to 19.02 mm. These values are similar to the results described in Section 2.4.3 and the results described in [5,12,31]. This phenomenon will be explained in more detail later based on the stress and crack within the DEM models.

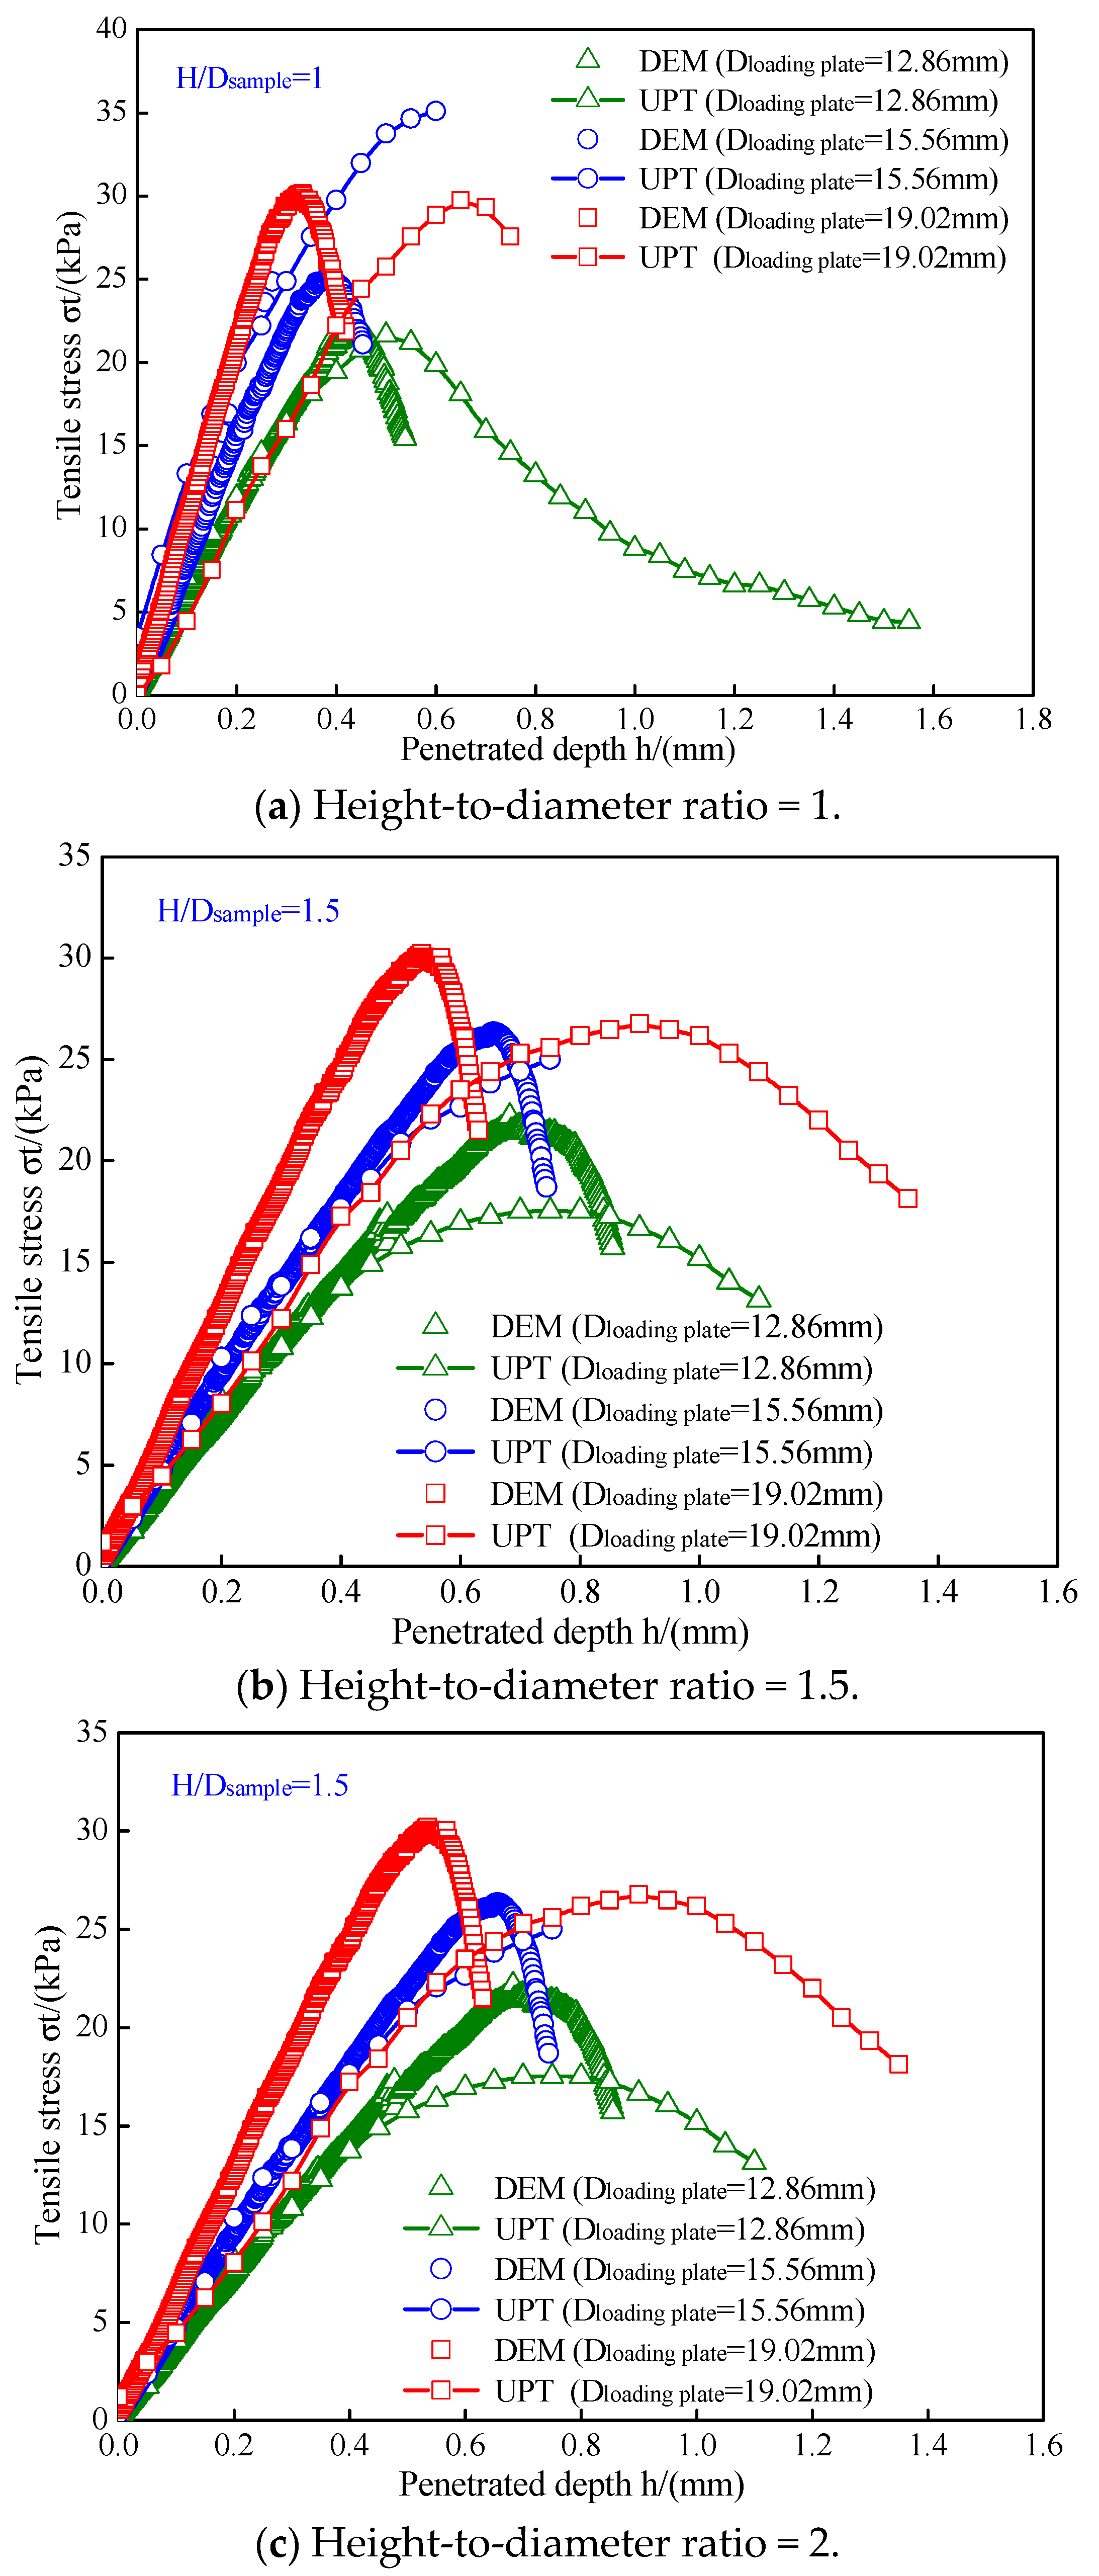
3.3.2. Effect of Height-to-Diameter Ratio

The simulated effects of changes in the height-to-diameter ratio on the tensile stress–penetration depth curves are presented in Figure 14.
We can see that the penetration depth increased as the height–diameter ratio increased. For example, for a given loading plate of 15.56 mm, as the height–diameter ratio increased from 1 to 2, the penetration depth increased from 0.45 mm to 0.87 mm. The tensile strengths of the samples were also influenced by the height–diameter ratio, which is clearly shown in Figure 15. In general, the tensile strengths of the undisturbed loess samples decreased with an increase in the height-to-diameter ratio, in alignment with the UPT-measured results described in Section 2.4.2. However, the effects of the different height-to-diameter ratios on the tensile strength were also influenced by the loading plate diameter. As the height-to-diameter ratio increases, the tensile strength of the undisturbed loess sample first shows a slightly increasing trend and then shows a rapid decreasing trend when the diameter of the loading plate is 15.56 mm, while when the diameter is 12.86 mm or 19.02 mm, almost the same trend is kept, before the onset of a rapidly decreasing trend.
This indicates that a critical loading plate diameter controlling the trend of the tensile strength in relation to the height-to-diameter ratio exists, though more DEM simulations and corresponding UPT experiments are needed to study this. This phenomenon will be explained in more detail later based on the stress and cracks within the DEM models.

3.3.3. Comparison of Results Derived from UPT and DEM Simulation

Figure 16 shows a comparison of the tensile stress–penetration depth curves obtained from DEM simulation and the UPT. Some simulated tensile stress–penetration depth curves matched perfectly with the measured tensile stress–penetration depth curves. For example, the simulated stress–penetration depth curve of the sample with a height-to-diameter ratio of 1 under a loading plate with a diameter of 12.86 mm successfully matched with the measured tensile stress–penetration depth curve. However, some of the simulated tensile curves did not match very well with the measured tensile stress–penetration depth curves. This is mainly due to the differences in the undisturbed loess samples. In the DEM models, the fundamental mechanical and deformation parameters were determined and calibrated by the UPT results of an undisturbed loess sample. Due to the slight differences in the undisturbed loess samples, the meso-parameters, such as the deformation parameter (emod) and strength parameter (pb_ten, pb_coh), measured by the performing UPT on one undisturbed loess sample could not be completely suitable for all the undisturbed loess samples. This results in the tensile stress–penetration depth curves obtained by the DEM simulation showing errors.
Although the simulated tensile stress–penetration depth curves cannot precisely match the measured tensile stress–penetration depth curves, the DEM can still successfully reflect the trends showing the variations in the undisturbed loess samples’ tensile strength with changes in the height-to-diameter ratio and loading plate diameter. Figure 17 shows a comparison of the undisturbed loess samples’ tensile strength values derived from the DEM simulation and UPT. In general, the tensile strength simulated via DEM simulation can match the tensile strength measured via UPT. The maximum absolute error of the tensile strength obtained via the DEM simulation and UPT was 10.13 kPa, and the minimum absolute error of the tensile strength obtained via the DEM simulation and UPT was 0.21 kPa. From Figure 17d, we can find that the tensile strengths simulated for the undisturbed loess sample were higher slightly than the tensile strengths measured via the UPT. In summary, DEM-based simulation can be used in addition to the unconfined penetration test to study the variation in tensile strength.
Given the tensile strength variation trends obtained via the UPT and DEM-based modeling (shown in Figure 7, Figure 9, Figure 13 and Figure 15), a linear fitting equation was used to establish the mathematical relationship of the undisturbed loess’s tensile strength with the loading plate diameter and the height-to-diameter ratio of the specimen. Table 5 and Table 6, respectively, present the mathematical relationship between the tensile strength and the loading plate diameter and height-to-diameter ratio of the undisturbed loess sample. Compared with the fitting equation for the UPT and DEM-based modeling, it can be found that the mathematical relationship of the tensile strength obtained from the UPT matches well with that obtained from DEM-based modeling, and this result can be validated.

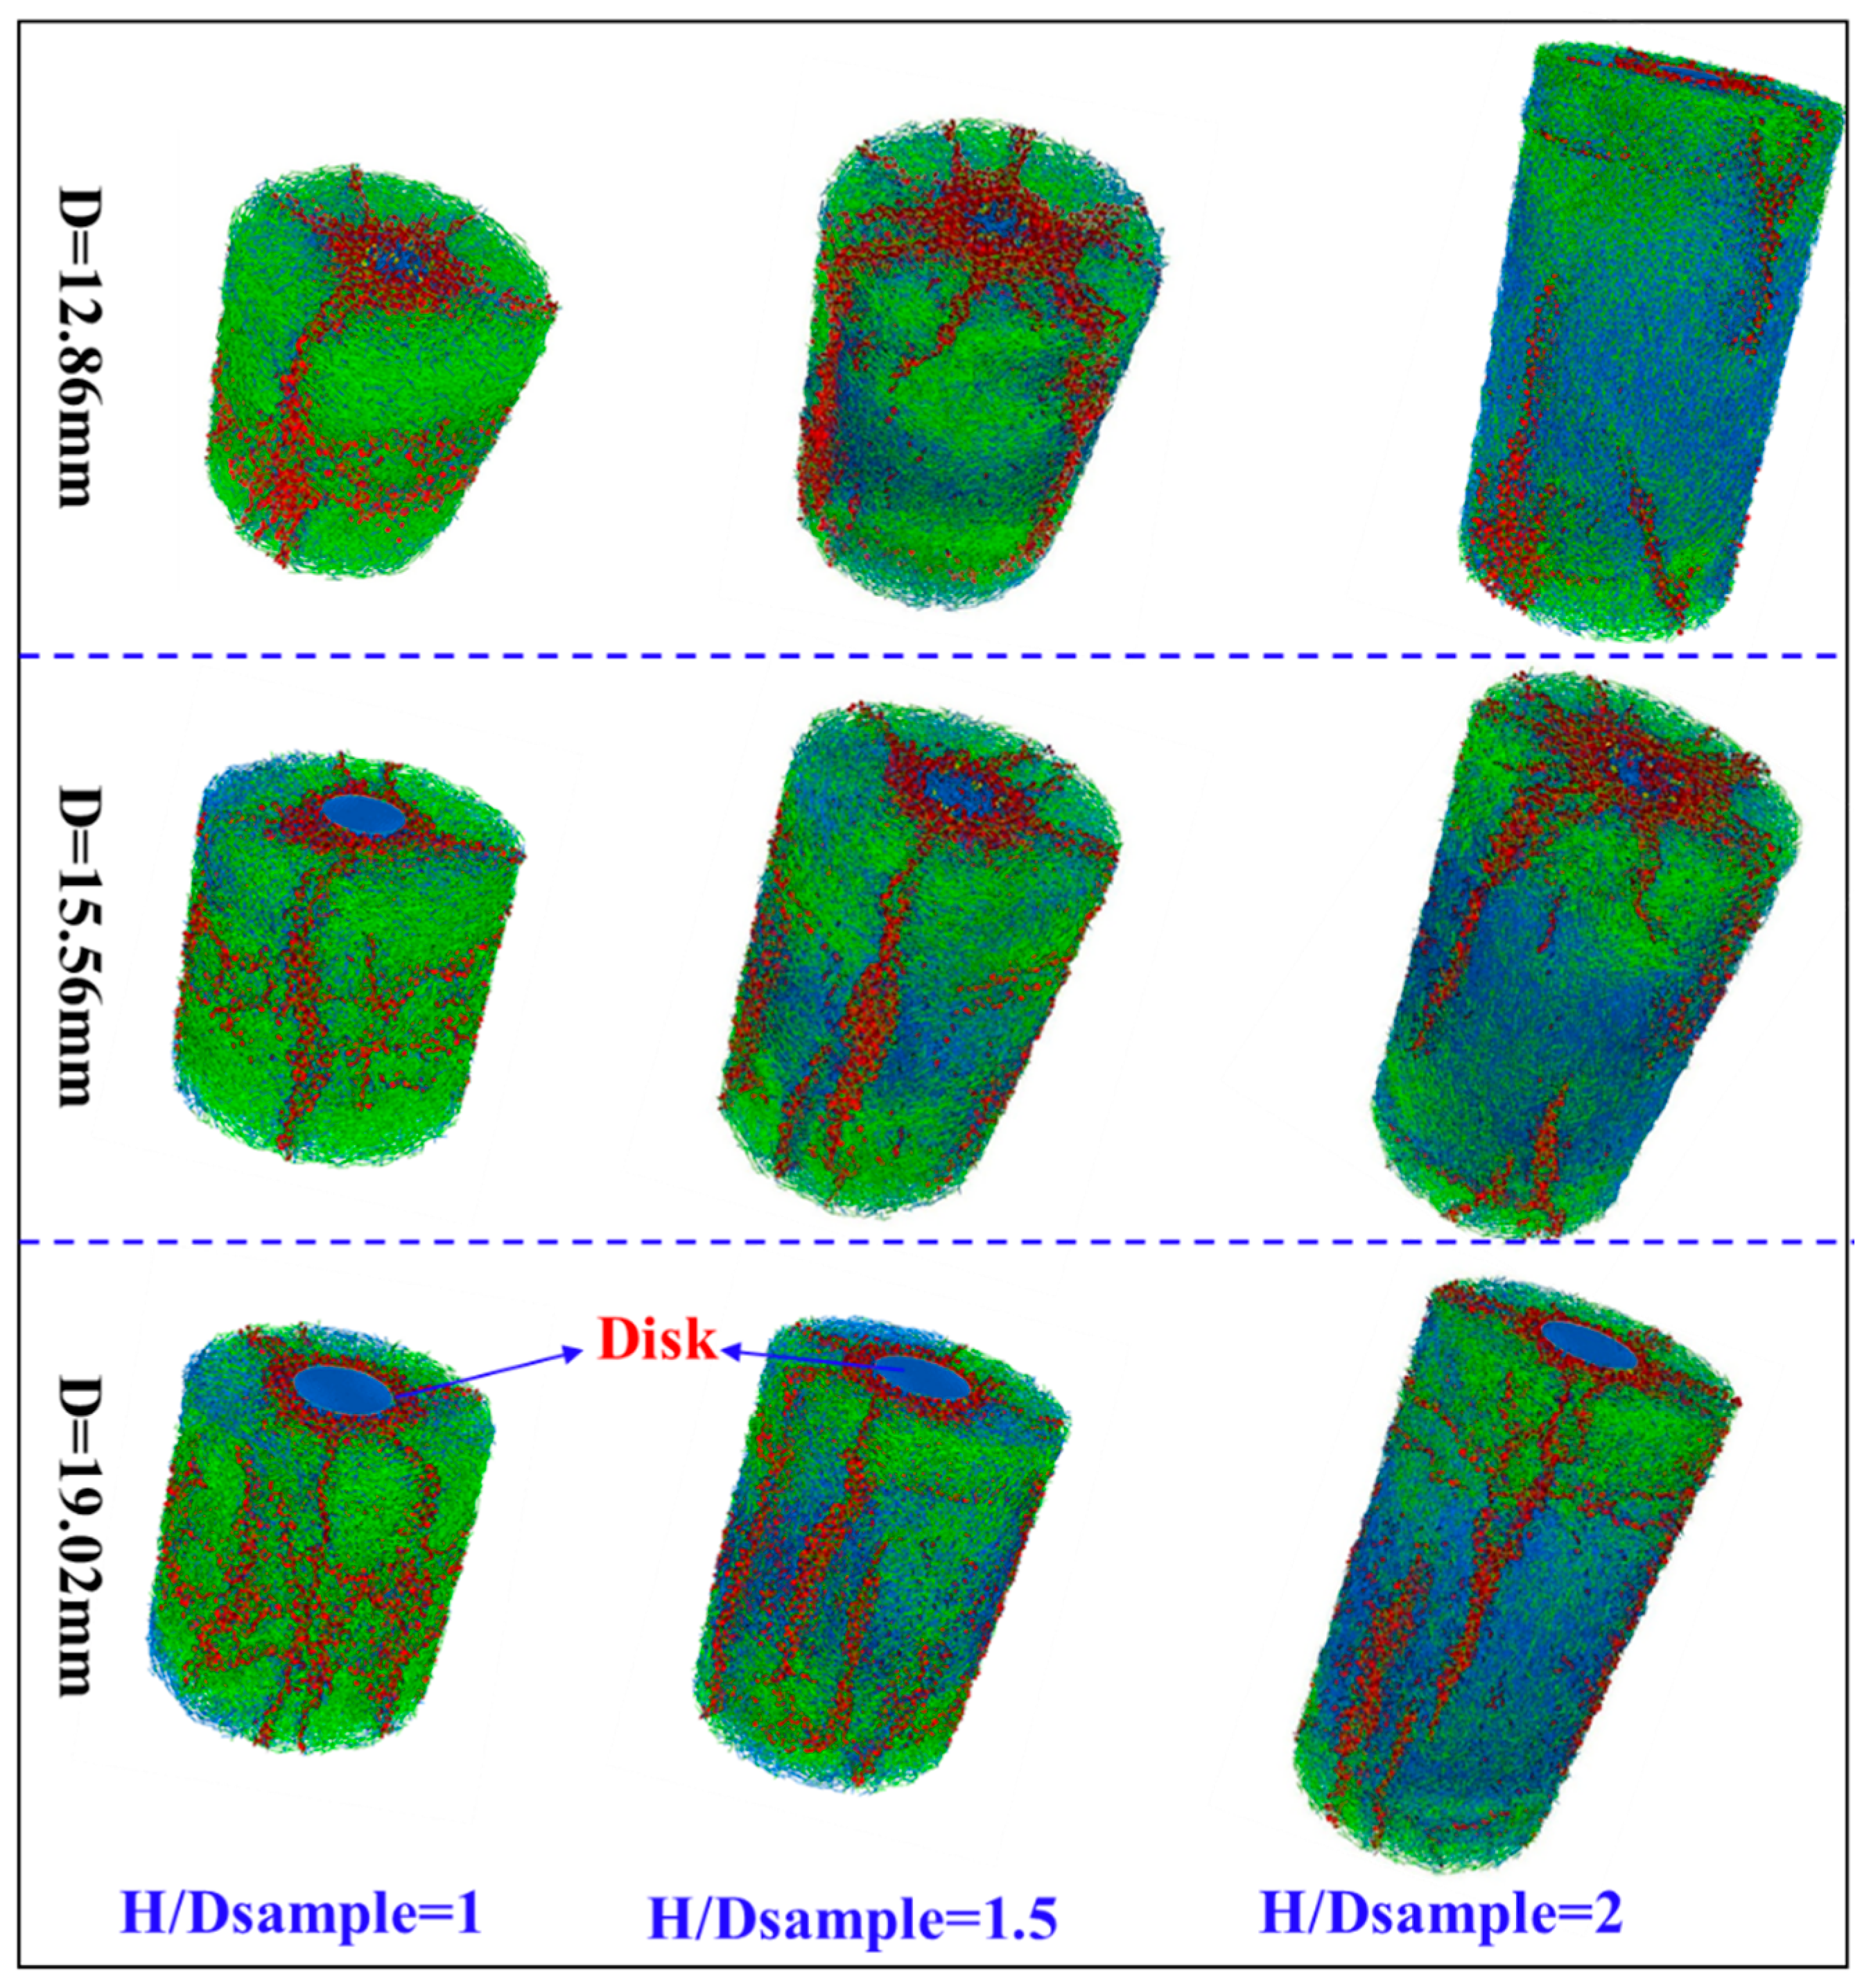
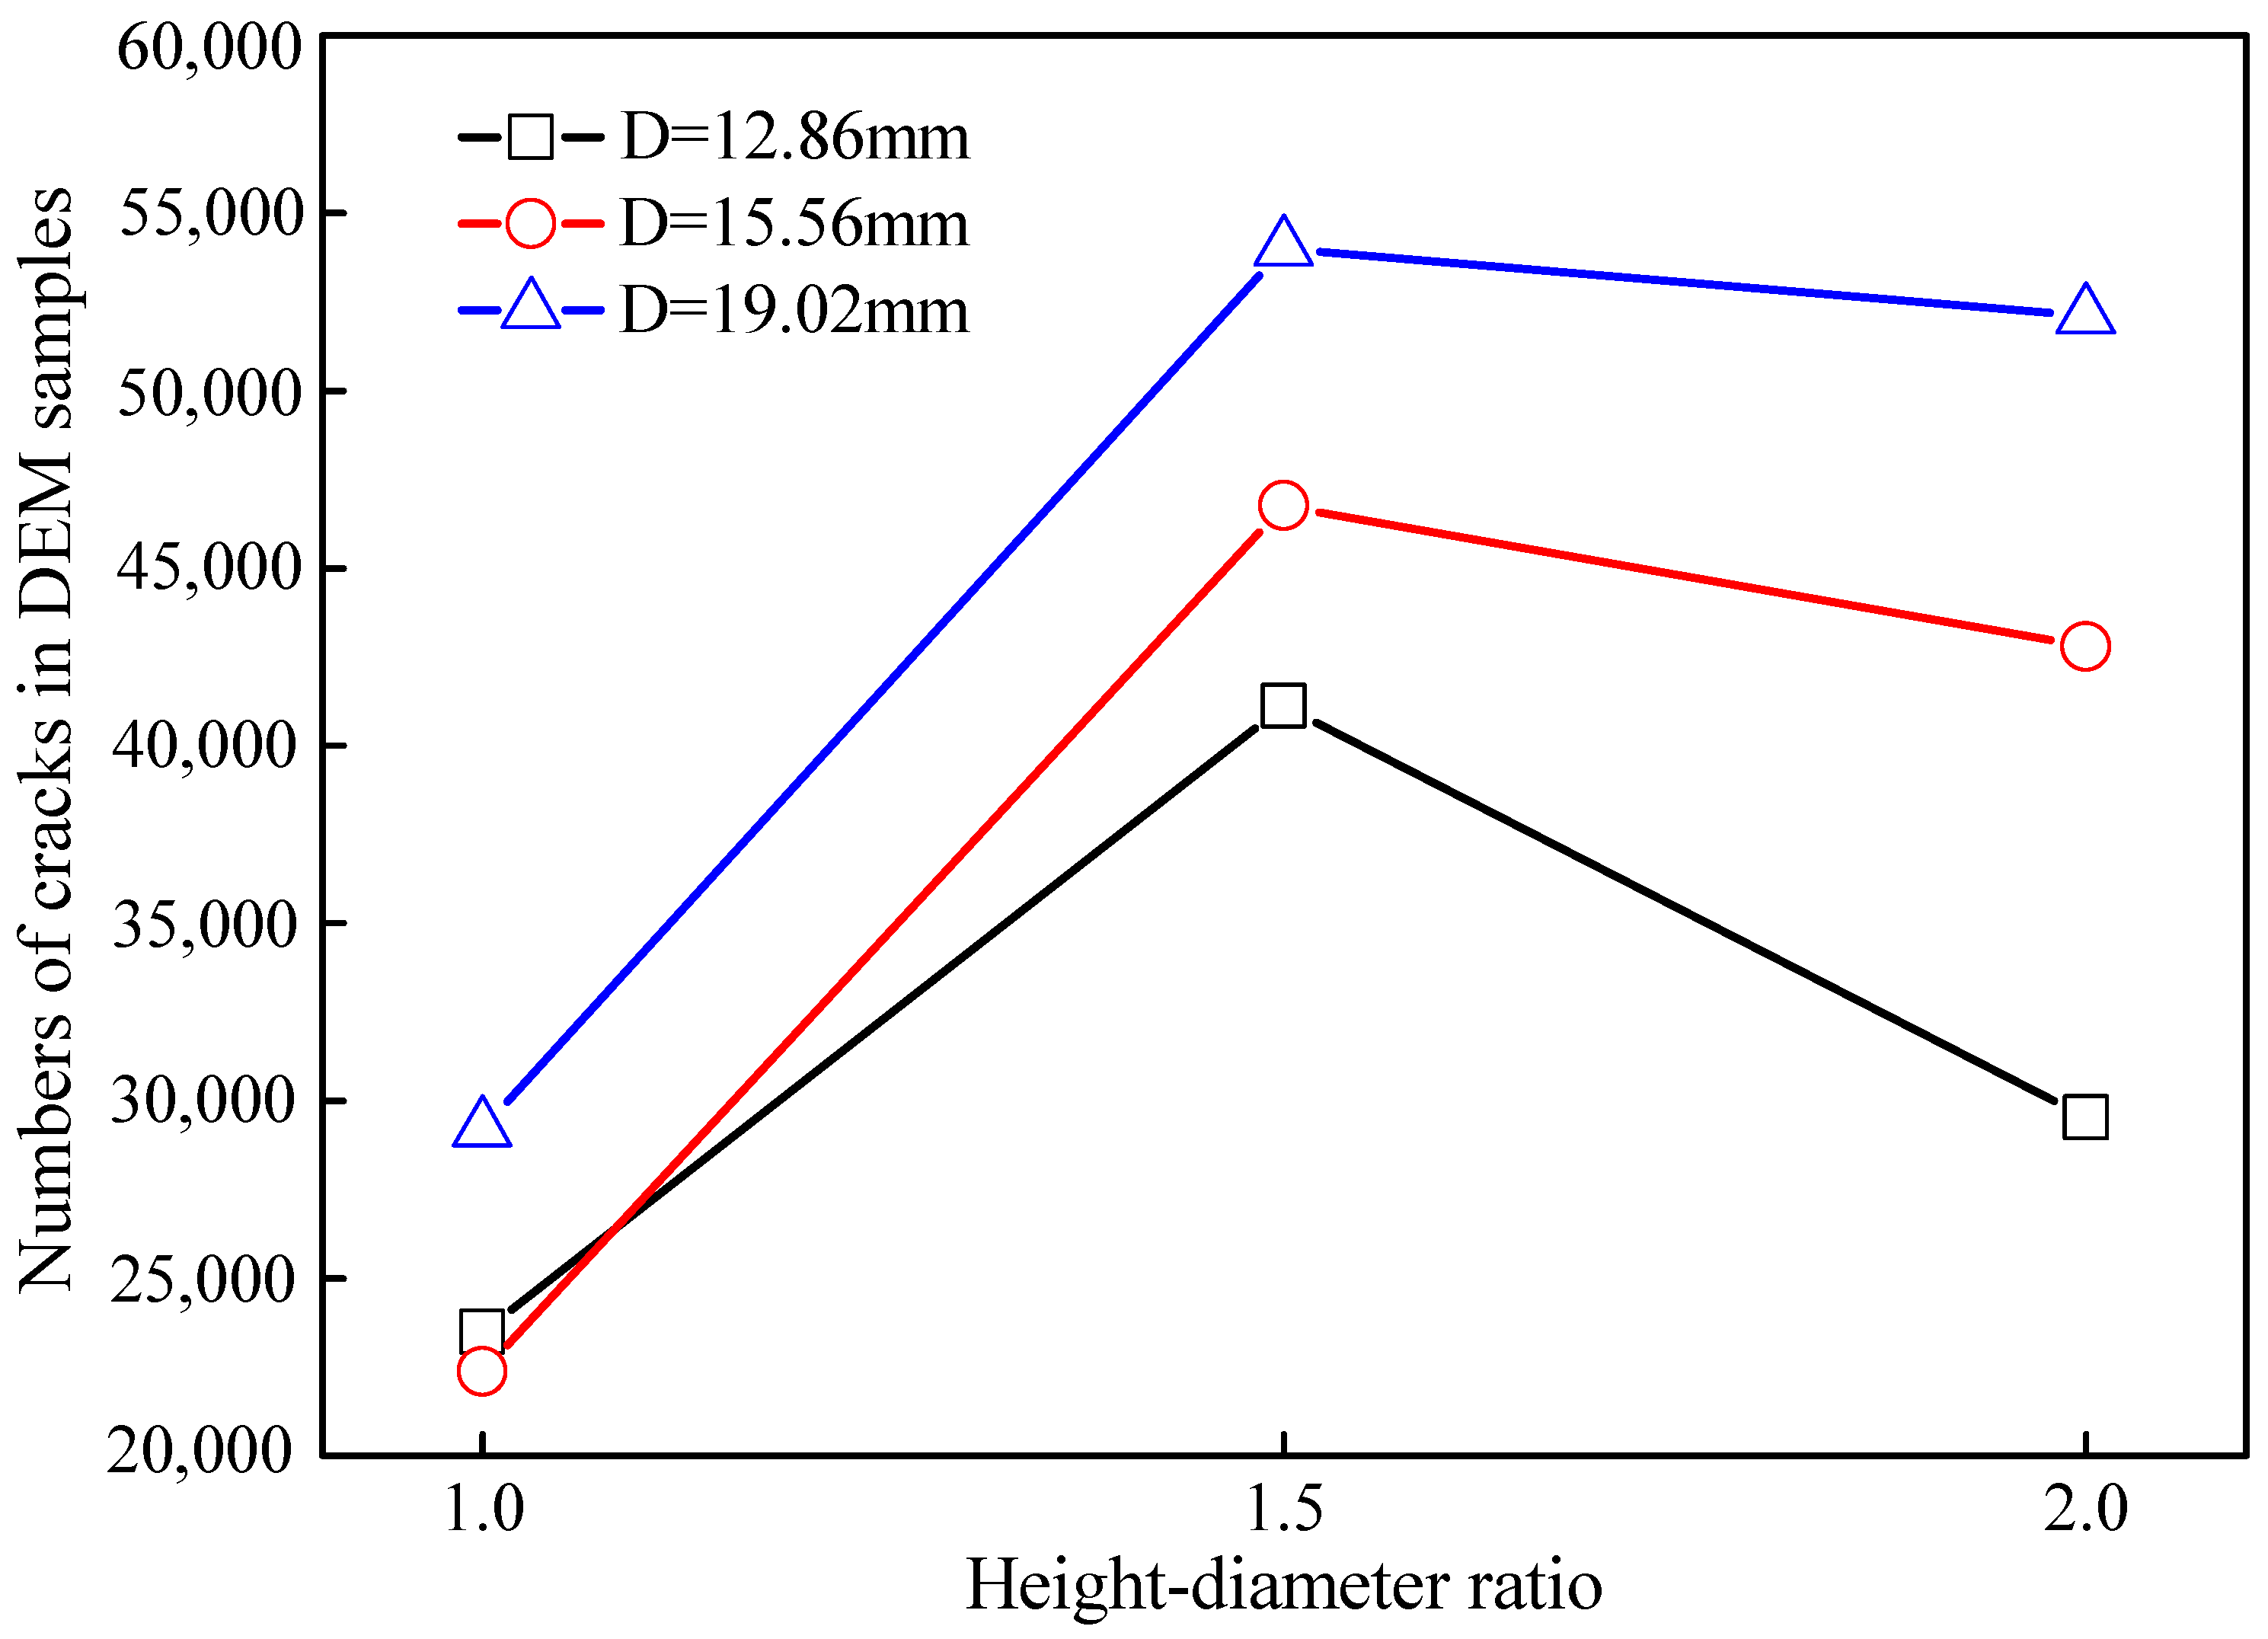
3.3.4. Variation in Contact Failure, Internal Stress Distribution, and Crack Number

Figure 18 shows two different types of cracks developed in the typical DEM simulation for the UPT. The cracks included a shear crack and tension crack, represented by the use of yellow and red in Figure 18. The blue color in Figure 18 represents the contact between the balls in PFC3D, which were damaged when the internal stress exceeded corresponding strength, thereby resulting into cracks. The cracks occurring during the DEM simulation were classified by the embedded Fish languages in PFC3D.
From Figure 18, it can be seen that the shear cracks occurred under the loading plate. Under the action of the load transferred by the loading plate, the rigid cone-shaped wedge forced its way downward. The interaction between the cone-shaped wedge and the remaining spheres induced shear stress, and shear cracks emerged once the shear stress surpassed the shear strength. These tensile cracks were radially distributed, fracturing the undisturbed loess samples into several segments. This indicates that the movement of cone-shaped wedges induces tangential tensile stress, dividing the sample into several parts radially. This is the same phenomenon experienced with the UPT described in Section 2.4.1, as well as in a similar work by Liang et al. [19]. The positioning of these two types of cracks (tensile and shear crack) in the sample follows the principle of the UPT, also indicating that the DEM-based simulation method is comparable to the UPT.
The distributions of the stress and corresponding crack are shown in Figure 19. The green and blue color, respectively, represent the tensile and compressive stress in the DEM model. Similarly to Figure 18, the red color represents tension crack and the yellow color represents shear crack. We can find that the height-to-diameter ratio and loading plate diameter have significantly impacted the distribution of the stress—and, correspondingly, that of the crack—in the DEM model. The tensile stress in the DEM model decreased with an increased height-to-diameter ratio, while the compressive stress in the DEM model increased with an increase in the height-to-diameter ratio. For example, under a loading plate with a diameter of 12.86 mm, the loess sample with a height-to-diameter ratio of 1 developed a large amount of tensile stress; however, it developed little compressive stress. As the height-to-diameter ratio increased, the compressive stress increased and gradually occurred in the central part of sample. In the loess sample with a height-to-diameter ratio of 2, the tensile stress was largely reduced and mainly distributed at the ends of the sample, while the compressive stress was largely increased and mainly distributed in the central part. The distribution of internal stress aligns well with the principle of the UPT. This could help to explain the mechanism by which the tensile strength varies with the height-to-diameter ratio. The internal stress distribution was also influenced by the loading plate diameter. The relationship between the internal stress distribution and loading plate diameter cannot be deduced from Figure 19, meaning it warrants more detailed study in the future.
The effect of the height–diameter ratio and loading plate diameter on the number of cracks is shown Figure 20.
We recorded the number of cracks in the sample by using the FISH language, including tensile cracks and shear cracks. Under a loading plate with a certain diameter, the crack number first increased and then decreased with an increase in the height–diameter ratio. For example, for a loading plate with a diameter of 12.86 mm, as the height-to-diameter ratio of the sample varied from 1 to 2, the number of cracks in the DEM model first increased from 23,485 to 41,107 and then decreased from 41,107 to 29,523. This can help explain the mechanism by which the tensile strength varies with the height–diameter ratio under a loading plate with a diameter of 15.56 mm. We also found that the crack number almost increased with the plate diameter for a given height–diameter ratio. This trend was not very present when the height–diameter ratio was 1; however, the general trend was correct. The trend of the crack number varying with the loading plate diameter matches the trend of the tensile strength varying with the diameter of the loading plate.

4. Conclusions

Based on a series of unconfined penetration tests (UPTs) and discrete element method (DEM) simulation, this study experimentally evaluated the effect of changes in the height-to-diameter ratio of undisturbed loess samples and the diameter of loading plates on the samples’ tensile strength and numerically explored the distribution of stress and cracks within each sample, qualitatively revealing the tensile strength variation mechanism. From this research, some preliminary conclusions can be drawn:
(1)
The undisturbed loess samples’ tensile strengths decreased with an increased height-to-diameter ratio, while the tensile strengths increased with an increased loading plate diameter.
(2)
The testing results (tensile stress–penetration curve and tensile strength) obtained via DEM simulation agreed well with those obtained via UPT, indicating that the DEM simulation adequately facilitates the study of the tensile properties of undisturbed loess.
(3)
The distribution of the contact failure, stress, and cracks within the undisturbed loess significantly varied with the height–diameter ratio and loading plate diameter.
(4)
The number of internal cracks increased with an increase in the loading plate diameter, while it first increased and then decreased with an increase in the height–diameter ratio.
These findings could help engineers better understand the tensile strength variations experienced by undisturbed loess. This study serves as a reminder to engineers that they should carefully consider tensile strength during design, construction, and maintenance projects in the Loess Plateau.

Author Contributions

Conceptualization, F.L.; methodology, F.L. and Z.Y.; software, Z.Y.; validation, F.L. and Z.Y.; formal analysis, Z.Y. and F.L.; investigation, Z.Y.; resources, F.L.; data curation, Z.Y.; writing—original draft preparation, Z.Y.; writing—review and editing, F.L.; visualization, Z.Y.; supervision, F.L.; project administration, Z.Y. and F.L.; funding acquisition, Z.Y. All authors have read and agreed to the published version of the manuscript.

Funding

This research was funded by the Natural Science Basic Research Program of Shaanxi (2024JC-YBQN-0497), the Youth Innovation Team of Shaanxi Universities (2023–2026), the Shaanxi Postdoctoral Fund Project (2023BSHEDDZZ271), and Research Starting Funds for Imported Talents, Xi’an University of Architecture and Technology.

Data Availability Statement

The data sets generated during the current study are available from the corresponding author on reasonable request.

Acknowledgments

This research was funded by the Natural Science Basic Research Program of Shaanxi (2024JC-YBQN-0497), the Youth Innovation Team of Shaanxi Universities (2023-2026), the Shaanxi Postdoctoral Fund Project (2023BSHEDDZZ271), and Research Starting Funds for Imported Talents, Xi’an University of Architecture and Technology.

Conflicts of Interest

The authors declare no conflicts of interest.

References

  1. Fan, W.; Deng, L.S.; Yuan, W.N. Double parameter binary-medium model of fissured loess. Eng. Geol. 2018, 236, 22–28. [Google Scholar] [CrossRef]
  2. Wen, B.P.; Yan, Y.J. Influence of structure on shear characteristics of the unsaturated loess in Lanzhou China. Eng. Geol. 2014, 168, 46–58. [Google Scholar] [CrossRef]
  3. Shao, X.X.; Zhang, H.Y.; Tan, Y. Collapse behavior and microstructural alteration of remolded loess under graded wetting tests. Eng. Geol. 2018, 233, 11–22. [Google Scholar] [CrossRef]
  4. Peng, J.; Wang, S.; Wang, Q.; Zhuang, J.; Huang, W.; Zhu, X.; Leng, Y.; Ma, P. Distribution and genetic types of loess landslides in China. J. Asian Earth Sci. 2019, 170, 329–350. [Google Scholar] [CrossRef]
  5. Yin, S.; Yang, Z.; Liu, F.; Dang, Y. Numerical investigation of failure modes and mechanical characteristics of remolded loess using unconfined penetration test. Comput. Part. Mech. 2024, 11, 295–312. [Google Scholar] [CrossRef]
  6. Juang, C.H.; Dijkstra, T.; Wasowski, J.; Meng, X. Loess geohazards research in China: Advances and challenges for mega engineering projects. Eng. Geol. 2019, 251, 1–10. [Google Scholar] [CrossRef]
  7. Li, Y.R. A review of shear and tensile strengths of the Malan Loess in China. Eng. Geol. 2018, 236, 4–10. [Google Scholar] [CrossRef]
  8. Xu, L.; Dai, F.C.; Tham, L.G.; Zhou, Y.F.; Wu, C.X. Investigating landslide-related cracks along the edge of two loess platforms in northwest China. Earth Surf. Proc. Land 2012, 37, 1023–1033. [Google Scholar] [CrossRef]
  9. Yu, Y.T.; Zheng, J.G.; Zhang, J.W.; Liu, Z. Development and distribution characteristics of ground fissures in high loess filled ground. Chin. J. Geol. Hazard Control 2021, 32, 85–92. (In Chinese) [Google Scholar]
  10. Wei, X.; Gao, C.Y.; Liu, K. A review of cracking behavior and mechanism in clayey soils related to desiccation. Adv. Civ. Eng. 2020, 2020, 8880873. [Google Scholar] [CrossRef]
  11. Wei, X.; Gao, C.; Yan, D.; Liu, K. Experimental Study on Cracking Behavior and Mechanism in Desiccating Soils in Xi’an, Shaanxi Province, China. Adv. Civ. Eng. 2020, 2020, 8874986. [Google Scholar] [CrossRef]
  12. You, Z.L.; Zhang, M.Y.; Liu, F.; Ma, Y.W. Numerical investigation of the tensile strength of loess using discrete element method. Eng. Fract. Mech. 2021, 247, 107610. [Google Scholar] [CrossRef]
  13. Luo, Y.S.; Xing, Y.C. Tensile strength characteristics of loess. J. Shaanxi Water Power 1998, 14, 6–10. (In Chinese) [Google Scholar]
  14. Dang, J.Q.; Hao, Y.Q.; Li, J. Study on tensile strength of unsaturated loess. J. Hohai Univ. 2001, 29, 106–108. (In Chinese) [Google Scholar]
  15. Sun, P.; Peng, J.; Chen, L.; Lu, Q.; Igwe, O. An experimental study of the mechanical characteristics of fractured loess in western China. Bull. Eng. Geol. Environ. 2016, 75, 1639–1647. [Google Scholar] [CrossRef]
  16. Wei, X.; Yang, Z.T.; Fleureau, J.M. Tensile strength identification of remolded clayey soils. Bull. Eng. Geol. Environ. 2022, 81, 405. [Google Scholar] [CrossRef]
  17. Li, X.J.; Wang, G.R.; Zhang, X.L. Development and utilization of indirect tensile strength tester for geomaterial. Hydrogeol. Eng. Geol. 2009, 44, 27–30. (In Chinese) [Google Scholar]
  18. Fang, H.Y.; Chen, W.F. New Method for Determination of Tensile Strength of Soils; Fritz Engineering Laboratory Report No. 348.5; Highway Research Board: Washington, DC, USA, 1970. [Google Scholar]
  19. Liang, Q.; Wu, X.; Li, C.; Wang, L. Mechanical analysis using the unconfined penetration test on the tensile strength of Q3 loess around Lanzhou city. Eng. Geol. 2014, 183, 324–329. [Google Scholar] [CrossRef]
  20. Cundall, P.A.; Strack, O.D. A discrete numerical model for granular assemblies. Geotechnique 1979, 29, 47–65. [Google Scholar] [CrossRef]
  21. Wu, X.; Niu, F.; Liang, Q.; Li, G. Study on tensile strength and tensile-shear coupling mechanism of loess around Lanzhou and Yanan city in China by unconfined penetration test. KSCE J. Civ. Eng. 2019, 23, 2471–2482. [Google Scholar] [CrossRef]
  22. Wu, X.; Bao, Y.; Ren, M.; Liang, Q.; Zhang, P. The tensile strength of loess in northwest China by unconfined penetration test and the distinct element simulation. Adv. Civ. Eng. 2021, 2021, 1484078. [Google Scholar] [CrossRef]
  23. Wu, X.; Niu, F.; Liang, Q.; Li, C.; Shang, Y.; Lin, Z. The tensile–shear behavior of loess and the mechanism of the tensile strength measured by the unconfined penetration test. Int. J. Geomech. 2024, 24, 04024217. [Google Scholar] [CrossRef]
  24. Fang, H.Y.; Daniels, J. Introductory Geotechnical Engineering: An Environmental Perspective; Taylor & Francis: Abingdon, UK, 2006. [Google Scholar]
  25. GB/T 50123-2019; Standard for Geotechnical Testing Method. National Standards of the People’s Republic of China: Beijing, China, 2019.
  26. ASTM. Annual Book of ASTM Standards; ASTM International (American Society for Testing Materials): West Conshohocken, PA, USA, 2009. [Google Scholar]
  27. Asadoullahtabar, S.R.; Asgari, A.; Tabari, M.M.R. Assessment, identifying, and presenting a plan for the stabilization of loessic soils exposed to scouring in the path of gas pipelines, case study: Maraveh-Tappeh city. Eng. Geol. 2024, 342, 107747. [Google Scholar] [CrossRef]
  28. Itasca Consulting Group Inc. Itasca’s Particle Flow Code Documentation. Available online: https://docs.itascacg.com/pfc600/contents.html (accessed on 19 November 2021).
  29. Chen, R.; Ding, X.; Ramey, D.; Lee, I.; Zhang, L. Experimental and numerical investigation into surface strength of mine tailings after biopolymer stabilization. Acta Geotech. 2016, 11, 1075–1085. [Google Scholar] [CrossRef]
  30. Shi, C.; Zhang, Q.; Wang, S.N. The Technology and Application of the Particle Flow (PFC5.0) Numerical Simulation; China Architecture & Building Press: Beijing, China, 2018. [Google Scholar]
  31. Li, C.Q.; Liang, Q.G.; Wu, X.Y.; Wang, L.L.; Xu, S.C. Study on the test of tensile strength of remolded loess. China Earthq. Eng. J. 2014, 36, 233–248. (In Chinese) [Google Scholar]
Figure 1. Principle of and apparatus for UPT: (a) principle of UPT; (b) apparatus for UPT; (c) failure images.
Buildings 15 02429 g001
Figure 2. Images of undisturbed loess preparation and loading plates: (a) slotting method for sampling undisturbed loess; (b) transportation of loess blocks; (c) undisturbed loess samples; (d) loading plates.
Buildings 15 02429 g002
Figure 3. Tests for fundamental physical and mechanical properties: (a) density; (b) water content; (c) liquid and plastic limit; (d) cohesion and angle of internal friction.
Buildings 15 02429 g003
Figure 4. Particle size distribution of undisturbed loess.
Buildings 15 02429 g004
Figure 5. Images of tensile failures of undisturbed loess samples with height-to-diameter ratios of 1 (a), 1.5 (b), and 2 (c). (a,b) show three-part radial failure, (c,e) show two-part radial failure. (d) shows an inclined failure, and (f) shows a cone-shaped wedge failure.
Buildings 15 02429 g005
Figure 6. Tensile stress–penetration depth curves of undisturbed loess samples with different height-to-diameter ratios.
Buildings 15 02429 g006
Figure 7. Effects of height-to-diameter ratios on tensile strengths of undisturbed loess samples.
Buildings 15 02429 g007
Figure 8. Tensile stress–penetration depth curves of undisturbed loess samples under loading plates with different diameters.
Buildings 15 02429 g008aBuildings 15 02429 g008b
Figure 9. Effects of loading plate diameter on tensile strength of undisturbed loess samples.
Buildings 15 02429 g009
Figure 10. Establishment of DEM for UPT.
Buildings 15 02429 g010
Figure 11. Comparison of tensile stress–penetration depth curves derived from DEM simulation and UPT.
Buildings 15 02429 g011
Figure 12. Simulated tensile stress–penetration depth curves of undisturbed loess samples under loading plates with different diameters.
Buildings 15 02429 g012
Figure 13. Simulated effects of changes in loading plate diameter on tensile strengths of undisturbed loess samples.
Buildings 15 02429 g013
Figure 14. Simulated tensile stress–penetration depth curves of undisturbed loess samples with various height-to-diameter ratios.
Buildings 15 02429 g014aBuildings 15 02429 g014b
Figure 15. Simulated effects of height-to-diameter ratios on tensile strengths of samples.
Buildings 15 02429 g015
Figure 16. Comparison of tensile stress–penetration depth curves obtained from DEM and UPT.
Buildings 15 02429 g016
Figure 17. Comparison of tensile strength values of undisturbed loess derived from DEM and UPT.
Buildings 15 02429 g017aBuildings 15 02429 g017b
Figure 18. Two different types of cracks (yellow for shear crack and red for tensile crack).
Buildings 15 02429 g018
Figure 19. Distribution of stress and corresponding cracks in DEM model.
Buildings 15 02429 g019
Figure 20. Number of cracks in DEM samples with different height–diameter ratios under loading plates of various diameters.
Buildings 15 02429 g020
Table 1. Fundamental physical and mechanical indices of loess.
Density
(g/cm3)
Moisture Content
(%)
Plastic Limit
(%)
Liquid Limit
(%)
Cohesion
(kPa)
Angle of Internal Friction
(°)
1.6716.317.437.260.031.0
Table 2. Scheme of unconfined penetration test.
Factor
Level
Factor AFactor BFactor C
Height–Diameter RatioDiameter of Plate/(mm)Loading Rate (mm/min)
1112.861
21.515.561
3219.021
Table 3. The coefficient of variation for the tensile strength in the UPT.
Diameter of Loading Plate/mm
Height-to-Diameter Ratio
12.8615.5619.02Coefficient of Variation
121.64 kPa35.1 kPa29.77 kPa23.5%
1.517.54 kPa25.01 kPa26.77 kPa21.2%
213.11 kPa19.54 kPa25.45 kPa31.9%
Coefficient of Variation24.5%29.7%8.1%
Table 4. Meso-parameters in DEM simulation for UPT.
Particle DensityPorosityParticle Size RegionDeformation ParametersStrength Parameters
(g/cm3)(%)(m)emodkratiopb_ten/Papb_coh/Papb_fa/(°)
1.63200.001~0.0159.5 × 1060.661.4 × 1042.3 × 10518
Table 5. Mathematical relationship between tensile strength and loading plate diameter.
Type
Height-to-Diameter Ratio (H/Ds)
Unconfined Penetration TestDEM Modeling
Fitting EquationR2Fitting EquationR2
1σt = 4.07 × (Dp) + 20.710.40σt = 4.12 × (Dp) + 17.400.98
1.5σt = 4.62 × (Dp) + 13.890.89σt = 4.23 × (Dp) + 17.600.99
2σt = 6.17 × (Dp) + 7.030.99σt = 4.18 × (Dp) + 11.730.99
Table 6. Mathematical relationship between tensile strength and height-to-diameter ratio of undisturbed loess sample.
Type
Diameter of Loading Plate (Dp)
Unconfined Penetration TestDEM Modeling
Fitting EquationR2Fitting EquationR2
12.86 mmσt = −4.27 × (H/Ds) + 25.960.99σt = −3.00 × (H/Ds) + 25.800.77
15.56 mmσt = −7.78 × (H/Ds) + 42.110.97σt = −2.39 × (H/Ds) + 28.610.55
19.02 mmσt = −2.16 × (H/Ds) + 31.650.95σt = −2.94 × (H/Ds) + 34.050.74
Disclaimer/Publisher’s Note: The statements, opinions and data contained in all publications are solely those of the individual author(s) and contributor(s) and not of MDPI and/or the editor(s). MDPI and/or the editor(s) disclaim responsibility for any injury to people or property resulting from any ideas, methods, instructions or products referred to in the content.

