Article

Micromechanical Fracture Model of High-Strength Welded Steel Under Cyclic Loading

1
Department of Materials Science and Engineering, College of Aerospace Science and Engineering, National University of Defense Technology, Changsha 410073, China
2
State Key Laboratory for Tunnel Engineering, China University of Mining and Technology (Beijing), Beijing 100083, China
3
Department of Civil Engineering, Tsinghua University, Beijing 100084, China
4
School of Mechanics and Civil Engineering, China University of Mining and Technology (Beijing), Beijing 100083, China
*
Author to whom correspondence should be addressed.
Buildings 2025, 15(8), 1218; https://doi.org/10.3390/buildings15081218
Submission received: 23 February 2025 / Revised: 20 March 2025 / Accepted: 26 March 2025 / Published: 8 April 2025

Abstract

To investigate the micromechanical fracture behavior of high-strength steel, an integrated experimental and numerical study was conducted on Q460C steel and its welded joints, with specimens extracted from the base metal, weld metal, and the heat-affected zone (HAZ). Eighteen smooth round bars were tested under monotonic and cyclic loading to analyze mechanical performance and stress–strain curves. A constitutive model was developed based on the experimental results and numerical simulations. Additionally, eighteen notched round bars with three different notch sizes and three different zones were tested under monotonic loading, and thirty-six notched round bars with three different notch sizes, three different zones, and two loading protocols were tested under cyclic loading. The stress-modified critical strain model (SMCS) and void growth model (VGM) were calibrated and validated using the test results. The study reveals that the HAZ is more susceptible to cracking under cyclic loading. A positive correlation between toughness parameters and plasticity was discovered. The validated VGM and SMCS provide a reliable tool for predicting ductile fracture in Q460C steel and its welds, offering significant insights for the design and safety assessment of high-strength steel structures.

1. Introduction

High-strength steel can effectively reduce the component section, thus decreasing the structural deadweight as well as the amount of steel, with such benefits on economy and society. In recent years, it has been widely used in practical engineering [1,2]. The strength of high-strength steel is superior to conventional-strength steels [3,4,5], but from the perspective of fracture mechanics [6], high-strength steel structures will be more susceptible to crack defects and more prone to brittle fracture damage [7,8,9]. At the same time, the effect of welding on the fracture behavior of high-strength steels is significant [10].
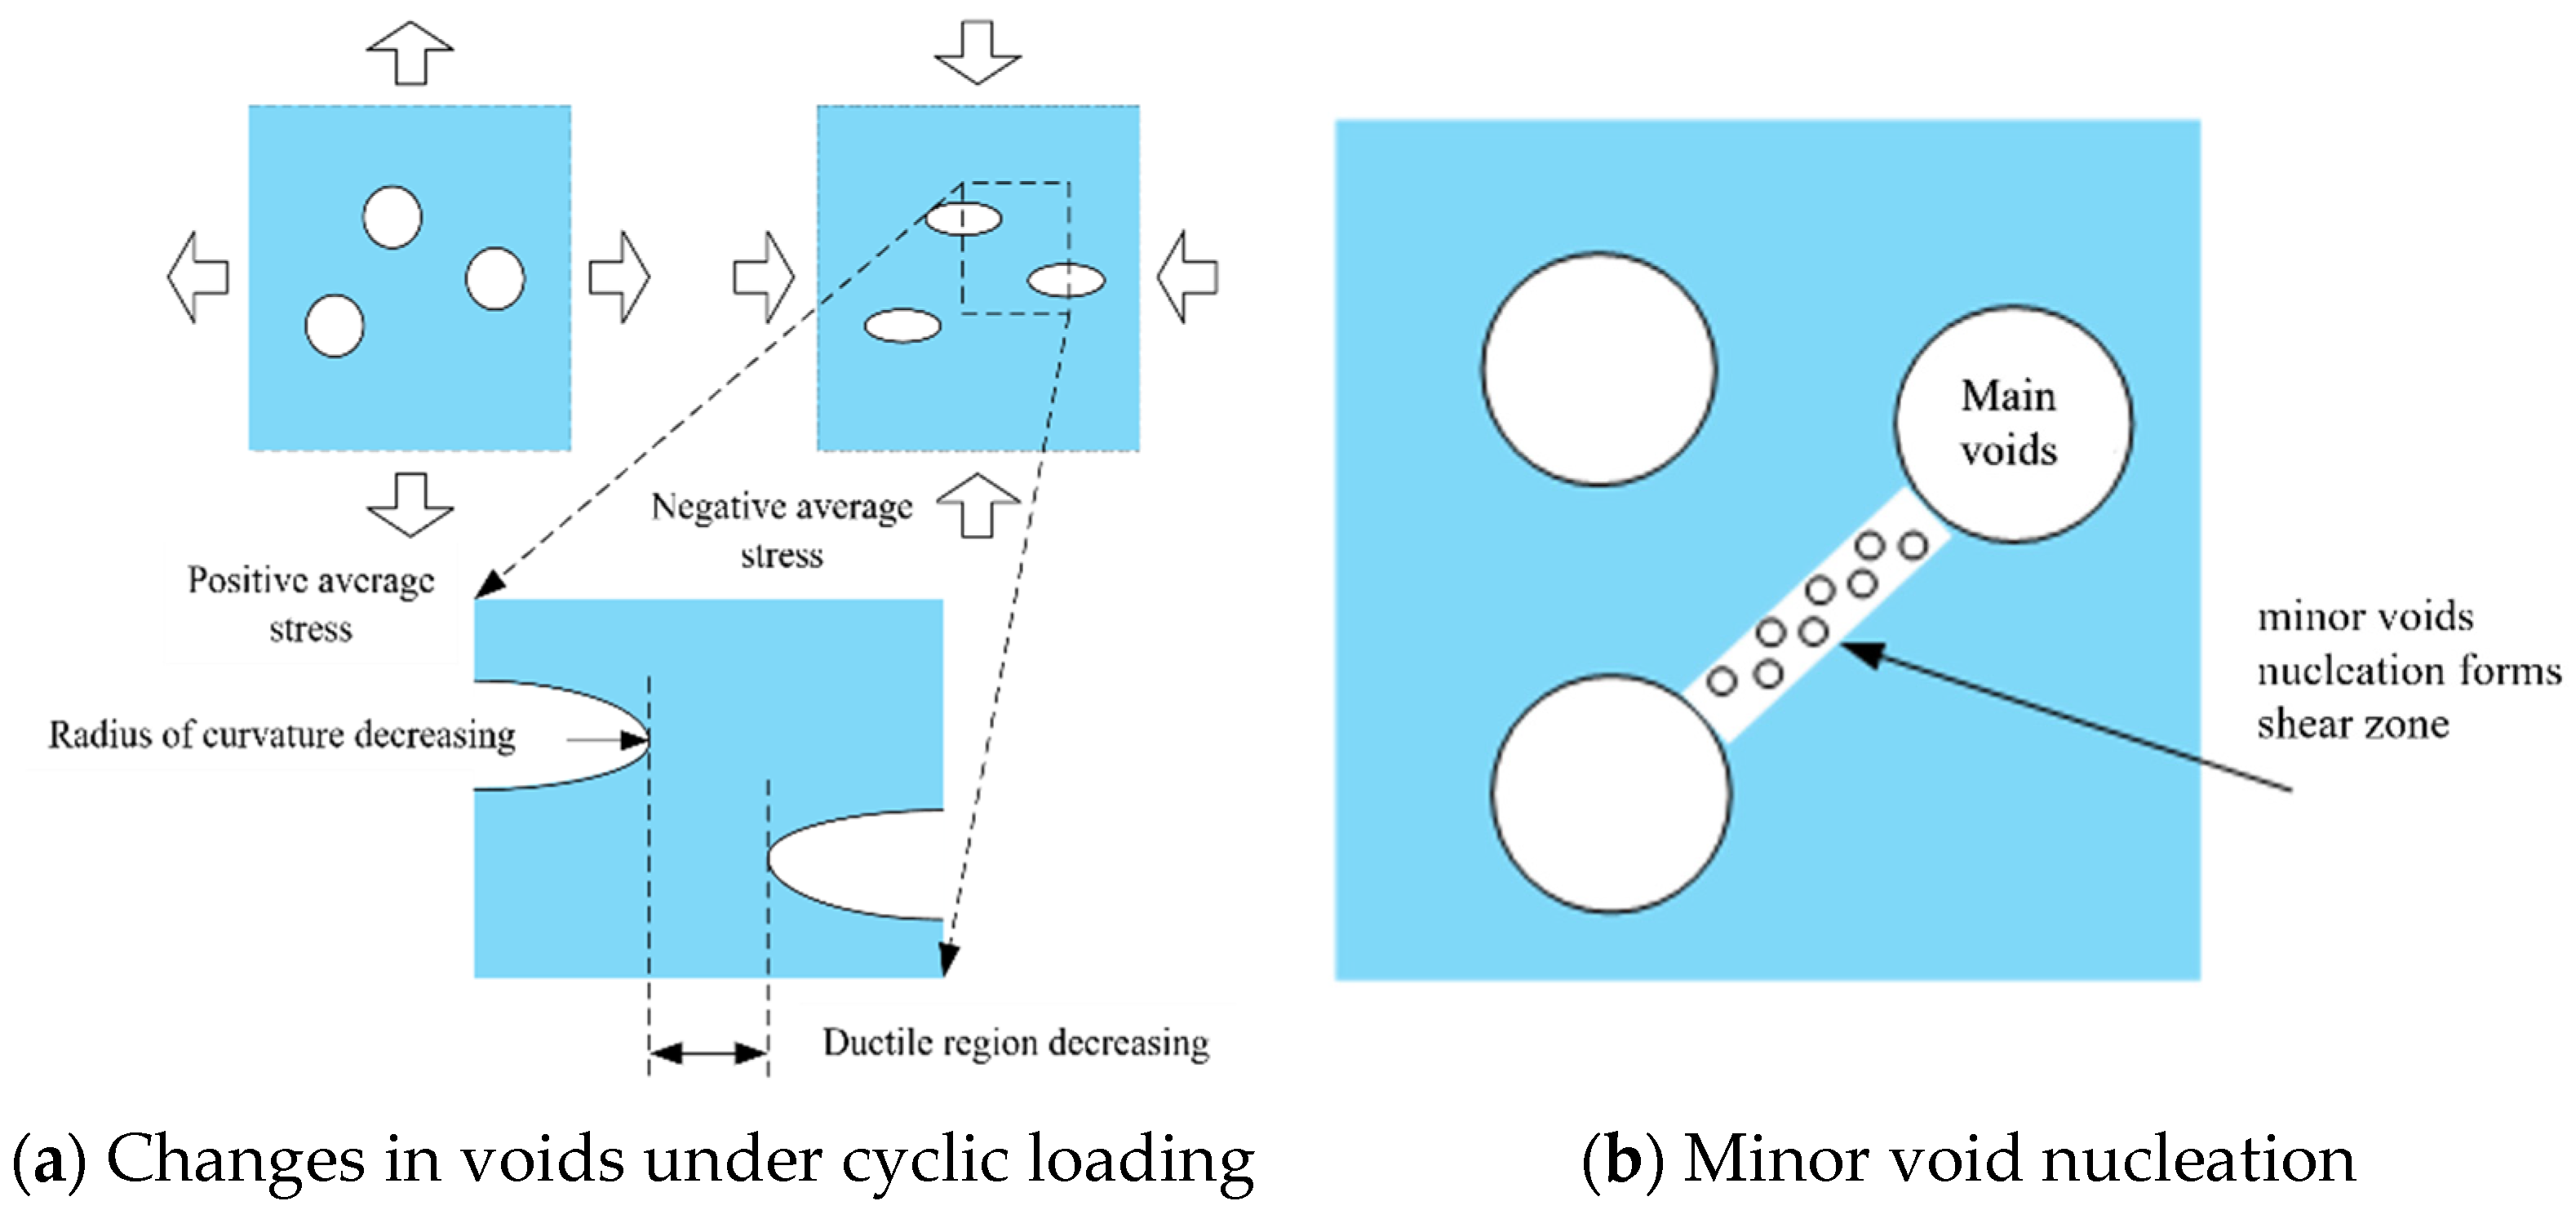
Recently, the fracture mechanism of structural steel has been studied, and good progress has been made. The fracture process of structural steel primarily involves two stages: crack nucleation and crack propagation. During the crack nucleation stage, internal defects within the metal, such as dislocations and second-phase particles, lead to localized stress concentration. In the crack propagation stage, plastic deformation occurs at the crack tip, accompanied by the formation of microvoids [11]. The crack propagation process can be divided into the following steps: (i) void nucleation, (ii) void growth, and (iii) void coalescence, as illustrated in Figure 1. The mechanism of fracture under cyclic loading is shown in Figure 2. The fracture mechanism under low-cycle fatigue loading is similar to that under monotonic loading [12,13] but with the following two differences: (i) voids experience alternating expansion and contraction after nucleation due to cyclic tensile and compressive stresses; (ii) due to the accumulation of damage under cyclic loading, aggregation can occur even at a lower percentage of void volume.
The fracture initiation mechanisms can be captured by micromechanical facture models, and therefore, these models can be used for figuring out the fracture behavior of steel materials as well as to predict their service life [14,15,16,17,18]. Guo et al. [19] and Chi et al. [20], based on Rice and Tracey [21] and Hancock and Mackenzie [22], systematically developed a stress-modified critical strain model (SMCS) and a void growth model (VGM) to predict monotonic loading fracture. Furthermore, the degeneration effective plastic strain model (DSPS) and cyclic void growth model (CVGM) were developed to predict fracture under low cyclic loading. Two types of structural steel, A572-Grade 50 (345 MPa grade) and HPS70W (480 MPa grade), were subjected to 12 tensile plate tests and finite element analyses by Kanvinde and Deierlein [12,23], and the validity and accuracy of the SMCS and VGM for predicting ductile cracking of structural steel joints under monotonic loading were verified. Meanwhile, some scholars [24,25,26] also calibrated the CVGM and DSPS models for predicting fractures under ultra-low cyclic fatigue and verified the accuracy of the CVGM and DSPS models for predicting fractures under ultra-low cyclic fatigue based on cyclic loading tests and finite element analyses. In addition, Liao et al. [27,28] and Zhou et al. [13] calibrated the toughness parameters of the SMCS, VGM, DSPS, and CVGM for three types of materials, namely the base material, weld metal, and heat-affected zone of Q345 steel, using the weldment as specimens. Their models have been applied in the prediction of ductile crack initiation in the welded joints of steel structures.
The aim of this paper is to validate the applicability of the VGM, SMCS, and CVGM micromechanical fracture models for the high-strength steel Q460C and its butt-welded joints, which are widely used in engineering. The hysteretic behavior, damage degradation mechanisms, failure progression, and cyclic material hardening models were systematically investigated through a comprehensive experimental program involving tensile and cyclic loading tests on smooth round bar specimens, complemented by detailed finite element analyses. Subsequently, the micromechanical fracture mechanisms were systematically investigated through a series of notched round bar specimens subjected to monotonic and cyclic loading, complemented by scanning electron microscopy (SEM) characterization and computational fracture mechanics simulations. The calibrated micromechanical models were then implemented to predict the fracture behavior of welded steel joints under low-cycle fatigue (LCF) loading conditions, demonstrating excellent predictive capability through comprehensive experimental validation.

2. Methodology and Materials

2.1. Tensile and Cyclic Loading Tests of Smooth Round Bar

2.1.1. Specimen Design

In this paper, Q460C (the structural steel is produced at Anyang Iron & Steel Inc. in Anyang City, Henan Province, China), a structural steel commonly used in China, is investigated. All specimens were taken from 24 mm cold-rolled plates conforming to GB/T 1591-2008 [29] and were joined by full-penetration V-groove weld. The rolling direction is perpendicular to the weld. As shown in Figure 3, sampling location of specimens included base metal and weld metal. The chemical composition of the base metal and the corresponding welding process parameters are summarized in Table 1 and Table 2, respectively.
The dimensions of the smooth round bar specimen are shown in Figure 4. The gauge length was taken as 12.5 mm for all the specimens. For each type of the specimens, three repetitive tests were carried out. A total of 12 specimens were subjected to tensile and cyclic loading tests, and the types and numberings of the specimens are listed in Table 3.

2.1.2. Experiment Procedure

The experiments were conducted in the School of Aerospace Engineering laboratory at Tsinghua University. The loading device was INSTRON8801, a low-cycle fatigue testing machine with electro-hydraulic servo. The specimens were subjected to monotonic tensile loading at a constant crosshead displacement rate of 2.0 mm/min until complete fracture occurred, and the tensile process was carried out in full compliance with “Metallic materials-Tensile testing-Part 1: Method of test at room temperature” GB|T228.1-2010 [30]. The cyclic loading regime is shown in Figure 5 and featured a displacement amplitude ranging from −0.125 mm to 2.000 mm. Since high-strain low-cycle fatigue fracture in standard and notched round bar specimens occurs under higher tensile stress, the tensile stress in the loading regime is set at a higher level. Conversely, to prevent specimen buckling, the compressive stress level is maintained at a lower value. In accordance with many international standards (e.g., ASTM, ISO), low-frequency cyclic loading (typically between 0.1 Hz and 1 Hz) is recommended for fatigue tests. To better observe the plastic deformation behavior and accurately measure the crack propagation rate under cyclic loading, a loading frequency of 0.3 Hz was selected in this study.

2.2. Tensile and Cyclic Loading Tests of Notched Round Bar

2.2.1. Specimen Design

Consistent with the experimental methodology employed for smooth round bar specimens, representative samples were extracted from three distinct microstructural regions: the base metal (BM), weld metal (WM), and heat-affected zone (HAZ). The plates, each with a thickness of 24 mm, were joined by full-penetration butt welding using a single V groove. The specimens’ positions were selected so that the notched area is in the considered part, as shown in Figure 3.
The detailed dimensions of the notched round bars are shown in Figure 6. Three different notch radii (1.25 mm, 2.50 mm, and 5.00 mm) were machined for each type of specimens. In total, 18 notched specimens were tested, considering three different parts of the welded metal and three different notch radii, as listed in Table 4.

2.2.2. Experiment Procedure

The dimensions and sampled location of the specimens are the same as the monotonic tensile tests. For these tests, two loading regimes were designed. The first regime involves cyclic loading with an amplitude range from −0.125 mm to δf/2, where δf is elongation at fracture point in monotonic tensile tests, continuing until fracture failure occurs. The second regime started with cyclic loading 5 times, with same amplitude between −0.125 mm and δf/3, and then pulling the specimens off to simulate seismic loading. The two loading regimes are shown in Figure 7. 36 specimens were tested with 2 specimens for one certain condition.

3. Test Results Analysis

3.1. Smooth Round Bar

3.1.1. Monotonic Tensile Tests

The engineering stress–strain curves of specimens are shown in Figure 8. The main mechanical properties of each specimen obtained from the monotonic tensile tests, including the yield strength σy, ultimate strength σu, elastic modulus E, specimen fracture diameter df, fracture load Pf, stress at fracture σf, and strain at fracture εf, are listed in Table 5.
In the tests, a large plastic deformation was observed following the necking of the specimen, and the extensometer was removed when the strain exceeded its extensometer range. However, substantial deformation continued until the final fracture occurred. Consequently, in the subsequent finite element analysis, the constitutive relationship should be extended to the moment of fracture. Given the difficulty in accurately measuring the actual stress and strain at the fracture moment, based on the assumption that the volume of the material remains constant, the stress and strain at the fracture moment can be calculated according to Equation (1):
σ f = P f / ( π d f 2 / 4 )         ε f = ln [ ( d 0 / d f ) 2 ]
where Pf is the fracture load, d0 is the primary diameter before fracture, and df is the diameter of the fracture surface. The stress σf and strain εf at the fracture are calculated and listed in Table 5.
The stress–strain curve is the basis of a finite element analysis, and the calibration of toughness parameters in the micromechanical model necessitates an accurate stress–strain full curve. However, during the loading process, as the load increased, the specimen’s cross-sectional area decreased, and the engineering stress–strain cannot accurately reflect the actual stress and strain of the material, and the actual stress and strain of the material is calculated by Equation (2):
ε t r u e = ln ( 1 + ε e n g )         σ t r u e = σ e n g ( 1 + ε e n g )
For ABAQUS analysis, to define the plastic parameters, the plastic strain is calculated by Equation (3):
ε p l = ε t r u e σ t r u e / E
Based on the experimental data, the actual stress–strain curves for both the base metal and weld metal were derived through a computational analysis. The Ramberg–Osgood constitutive model [31] was employed to characterize the mechanical behavior, with the stress–strain relationships measured by the extensometer being fitted using this model. The constitutive parameters, including the strain hardening coefficient (Kn) and strain hardening exponent (n), were determined through a regression analysis, with their mean values being utilized to establish the material’s stress–strain relationship under uniaxial tension, as mathematically expressed in Equation (4).
ε = σ E + σ K n 1 n
Transforming Equation (4), the correlation between stress and plastic strain can be effectively characterized through the constitutive relationship expressed in Equation (5):
σ = K n ε p n
The stress–strain relationship from removing the extensometer to the fracture of the specimen is presumed to increase linearly, as shown in Figure 9. Test results for the base metal BM-2 and weld metal WM-3 were employed to calibrate the stress–plastic strain relationship of the material under monotonic tension; the key points of the plastic parameters of the material were input in a subsequent ABAQUS finite element analysis according to the curves shown in Figure 9, and the key parameters in the material constitutive relationship are listed in Table 6.

3.1.2. Cyclic Loading Tests of Smooth Round Bar

According to the research [32,33,34,35], a hybrid hardening model was selected to fit the cyclic constitutive model of Q460C high-strength steel and its welds using the von Mises flow rule. This model accounts for the translation and expansion of the yield surface of the material under cyclic loading and has the characteristics of the isotropic model and the kinematic hardening model.
The yield surface σ0 in the reinforced part of isotropic model is defined as shown in Equation (6):
σ 0 = σ | 0 + Q 1 exp b ε p
where σ|0 is the size of the primary yield surface, which takes the value of the yield strength σy in this paper; Q is the maximum value of the yield surface change; and b is the rate of increase in the yield surface with the equivalent plastic strain. The values of Q and b are obtained by fitting according to the experimental data, and the isotropic hardening part is set up in *Cyclic Hardening of ABAQUS material property module.
The back stress in the kinematic hardening model is defined as follows:
α = k = 1 4 α k = k = 1 4 C k γ k 1 exp γ k ε p
where the ratio of Ck and γk is the maximum value of the change on back stress, γk is the rate of change of back stress with the increase in equivalent plastic strain, and four back stresses are selected to be superimposed to estimate the total back stress α in the model.
According to the data points (σi, εp,i) on the half cyclic stress–plastic strain relationship curve obtained from the test, the corresponding back stress αi is calculated according to Equation (8):
α i = σ i σ i 0
where σi0 calculated from Equation (6) is the yield surface in isotropic model with an equivalent plastic strain εp,i. The data points (αi, εp,i) were used to fit the parameters Ck and γk according to Equation (7), with the results tabulated in Table 7. Based on these fitting results, the hybrid model parameters were configured within the *Plastic option of the ABAQUS material properties module. Subsequent finite element simulation was used for the aforementioned cyclic loading test. The material stress–strain curve was calculated and compared with the test curve, as shown in Figure 10.

3.2. Notched Round Bar

3.2.1. Monotonic Tensile Tests

The load–deformation curves of specimens with different notch radii were obtained from the tests, and the typical load–deformation curves of the base material specimens are shown in Figure 11. The point where the slope of the curve decreases signifies the ductile cracking point of the material. The fracture elongation δf corresponding to the ductile cracking point of the material can be chosen to control deformation in the finite element analysis. This approach allows the material to reach its critical fracture state and thus to calculate the toughness parameters η and γ in the micromechanical model.

3.2.2. Calibration of Characteristic Length

In the micromechanical model, the fracture mechanism is characterized by the coalescence of adjacent voids. The characteristic length parameter is defined with a lower bound of twice the mean dimple diameter and an upper bound determined by the maximum dimension of surface irregularities (e.g., humps and dents) observed via scanning electron microscopy (SEM) [12]. These methods for determining the characteristic length explain the variations in toughness measurements. The average characteristic length is calculated from the lengths of 10 humps or dents. Figure 12 illustrates a typical fracture micro-morphology and characteristic length values. Table 8 presents the statistical distribution of characteristic length parameters, including upper bound, lower bound, and mean values, for both the base metal and weld metal. The mean characteristic length values range from 0.27 mm to 0.33 mm.

3.2.3. Cyclic Loading Tests

The typical load–deformation curves of base material under two different loading regimes are shown in Figure 13. The discontinuity point of the slope in the last tensile cyclic curve in the hysteresis curve indicates the crack initiation point, and its corresponding deformation δf can be used as the control deformation in the numerical simulation of the finite element. According to the number of fracture failures Nf to load the specimen until destruction, the stress–strain history of the fracture part was recorded to compute the toughness parameter, i.e., damage factor λ. The notched round bar cyclic loading regime and the key results are listed in Table 9.

4. Fracture Behavior Analysis Based on Micromechanical Model

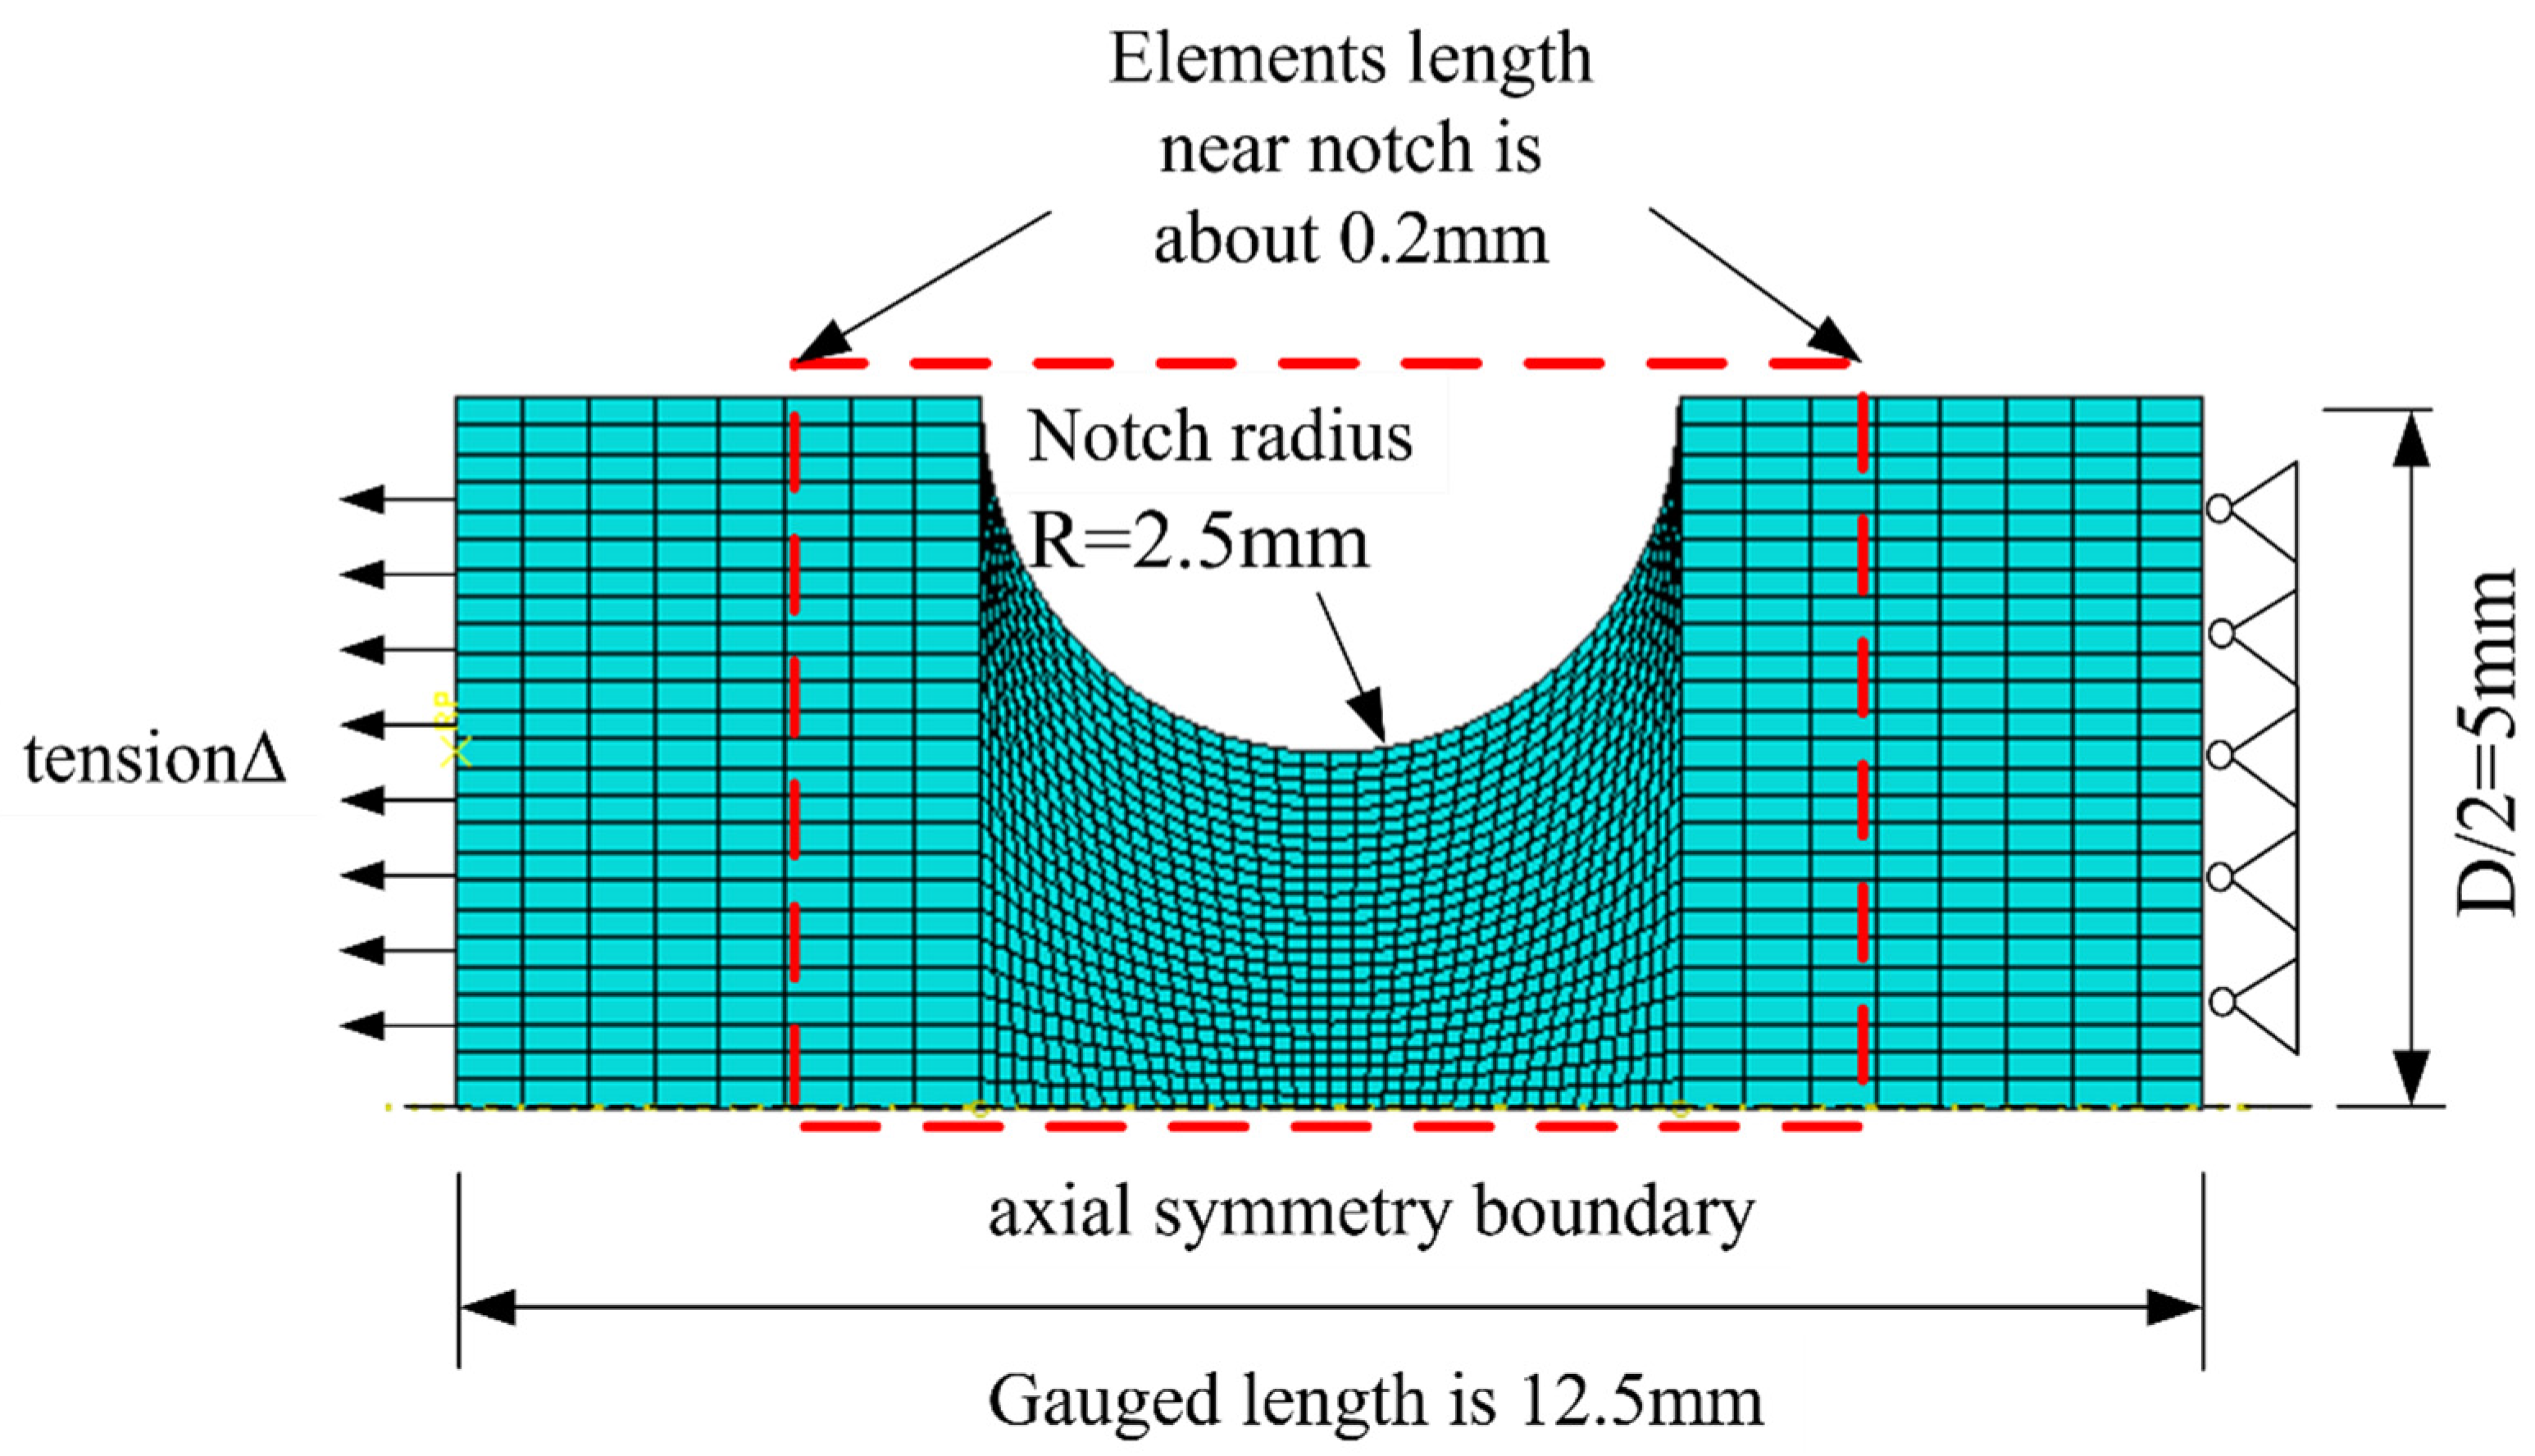
Based on the results from the notched round bar tests and corresponding finite element numerical simulations, the micromechanical fracture model parameters for the monotonic tensile fracture of each material were calibrated. This provides a foundation for calibrating the micromechanical fracture model under cyclic loading. Using the symmetry of the specimens, the finite element software ABAQUS 6.14 is used to establish an axisymmetric finite element model of the gauged part of the specimen, as shown in 
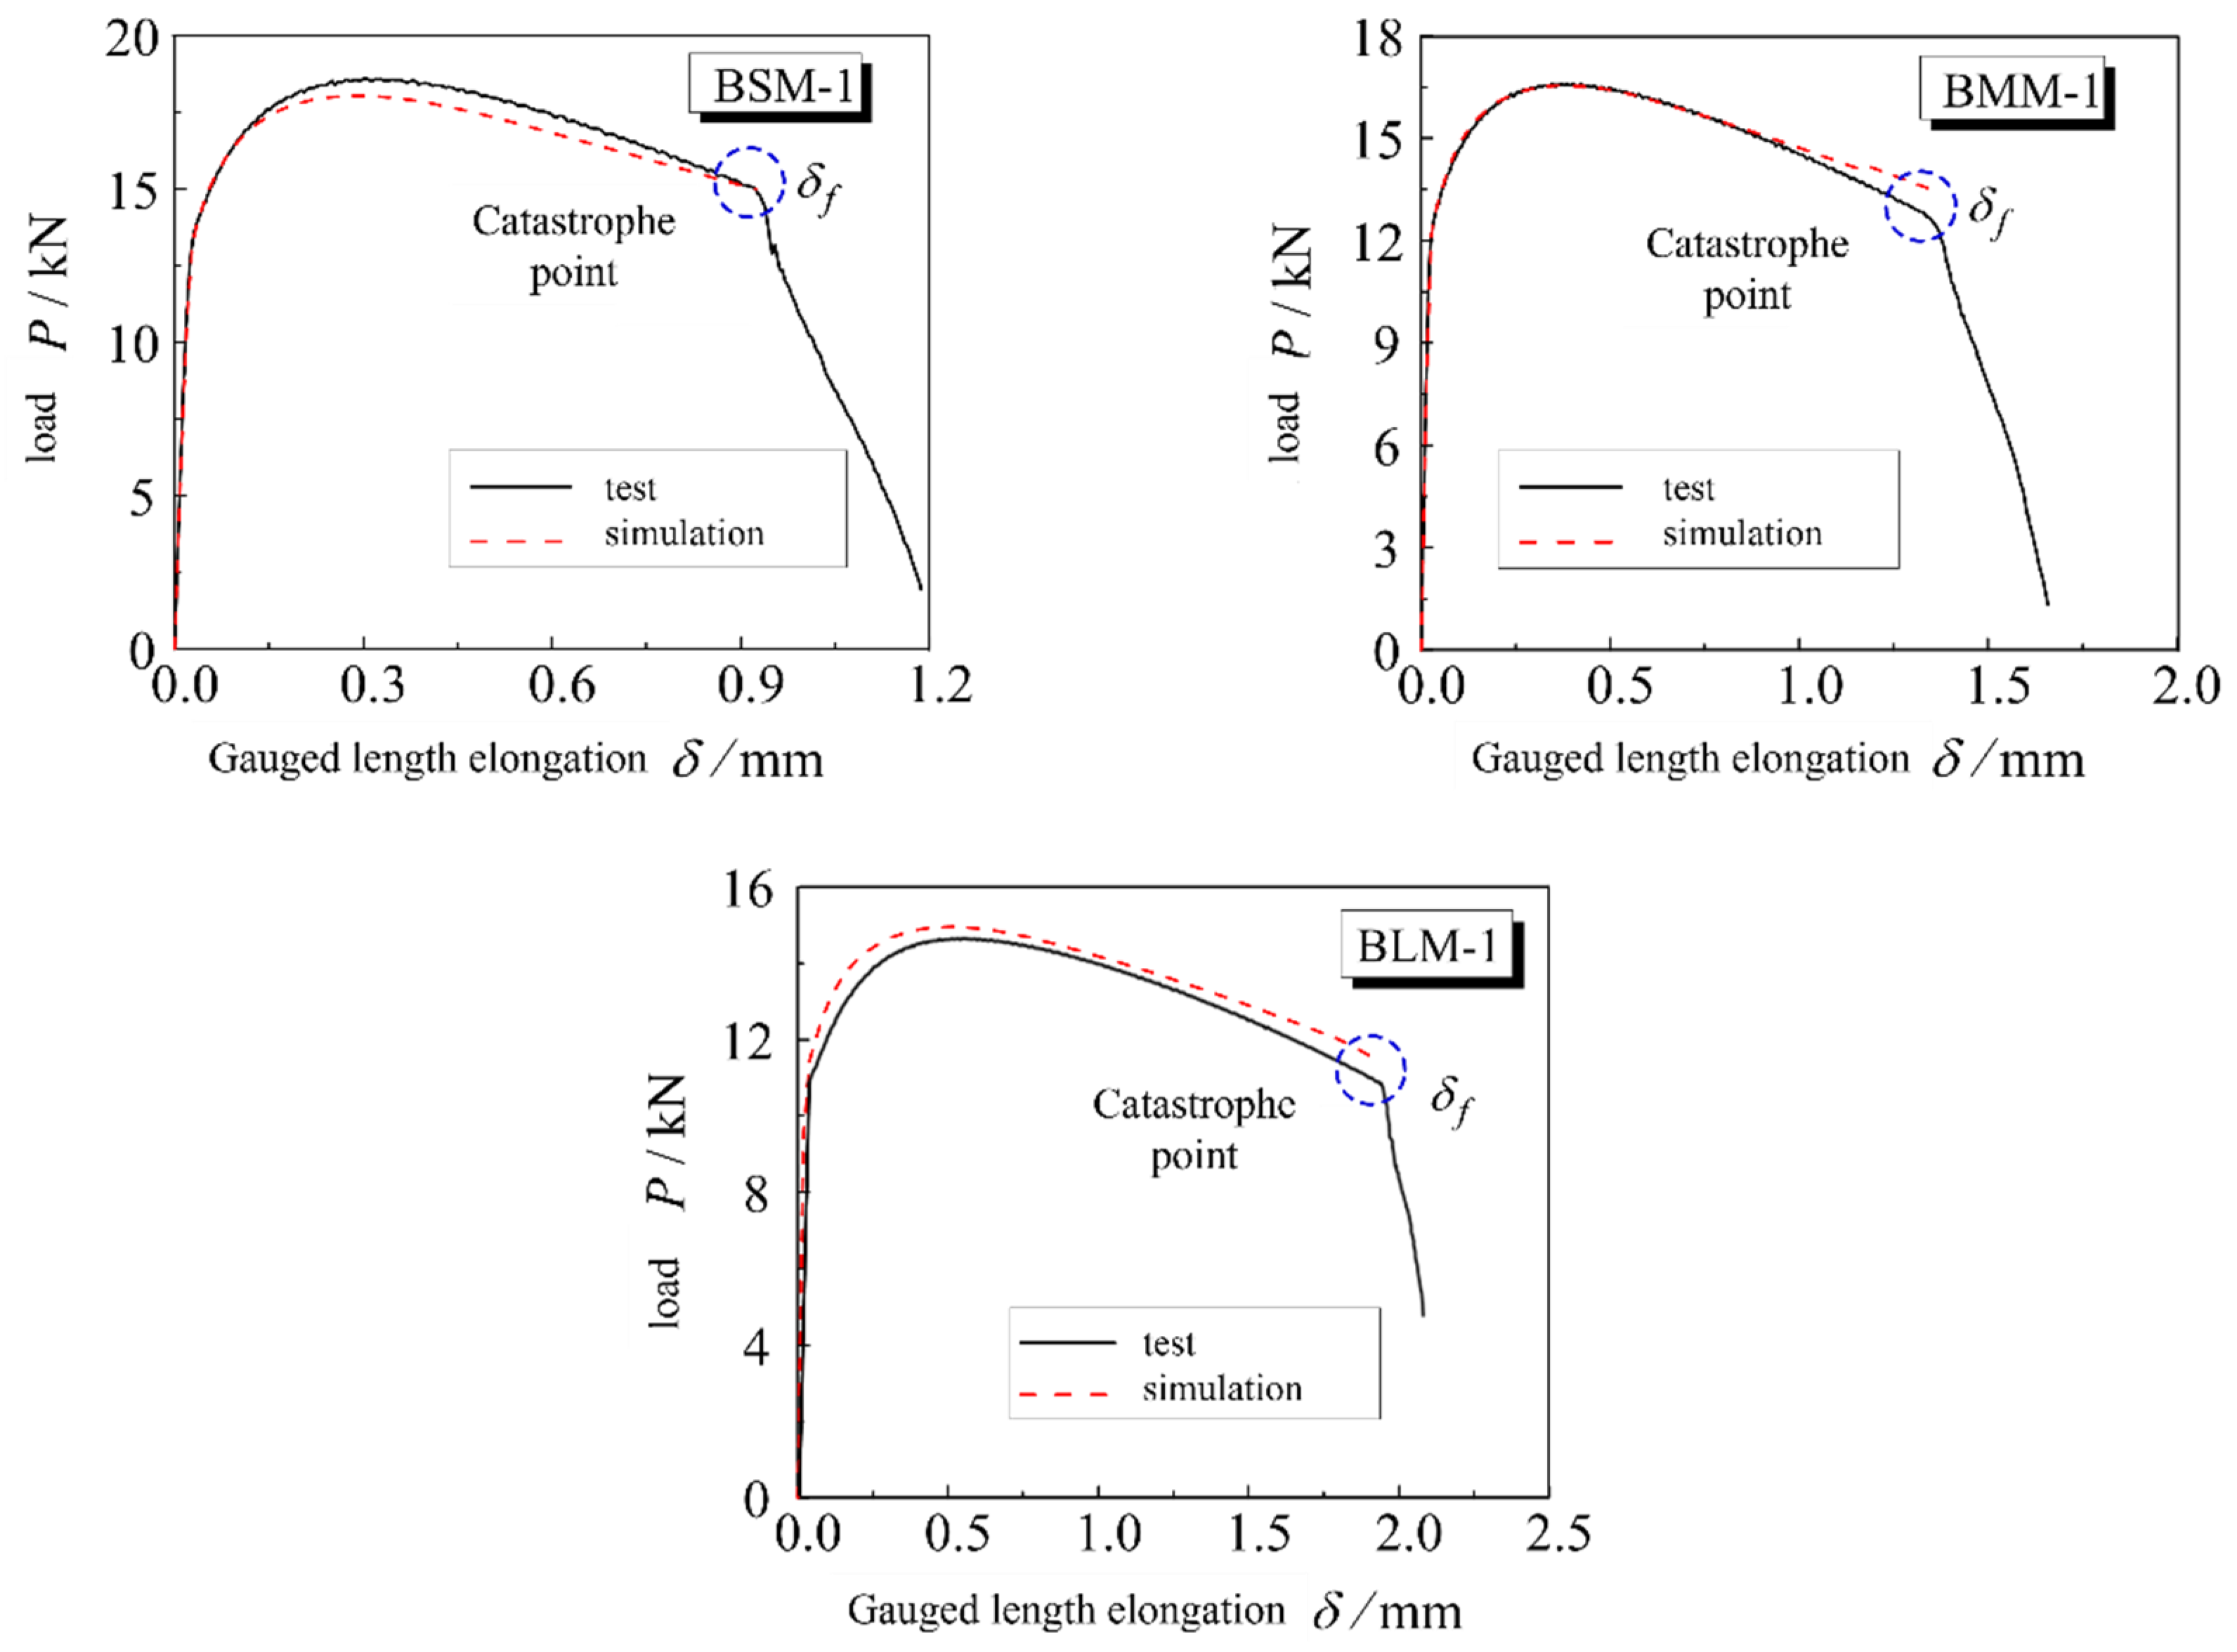
Figure 14. The selected element type is CAX4, with reference to the characteristic length, and the element size in the region near the notch is approximately 0.2 mm. Axisymmetric boundary conditions are applied at the center axis of the round bar; one end is set as hinged joint, and the other end is subjected to displacement load. Material property data obtained from the standard round bar’s monotonic tensile test were utilized to simulate the loading process through the finite element model. The load–deformation curves of the specimens obtained were in good agreement with the test results, and the results of the typical base material specimens are shown in Figure 13.
The finite element loading simulation of the specimen was analyzed, and based on the test results, the fracture elongation δf corresponding to the ductile initial fracture point of the material shown in Figure 13 is used as the control deformation to ensure that the material reaches the critical state of fracture, and the toughness parameters η and 
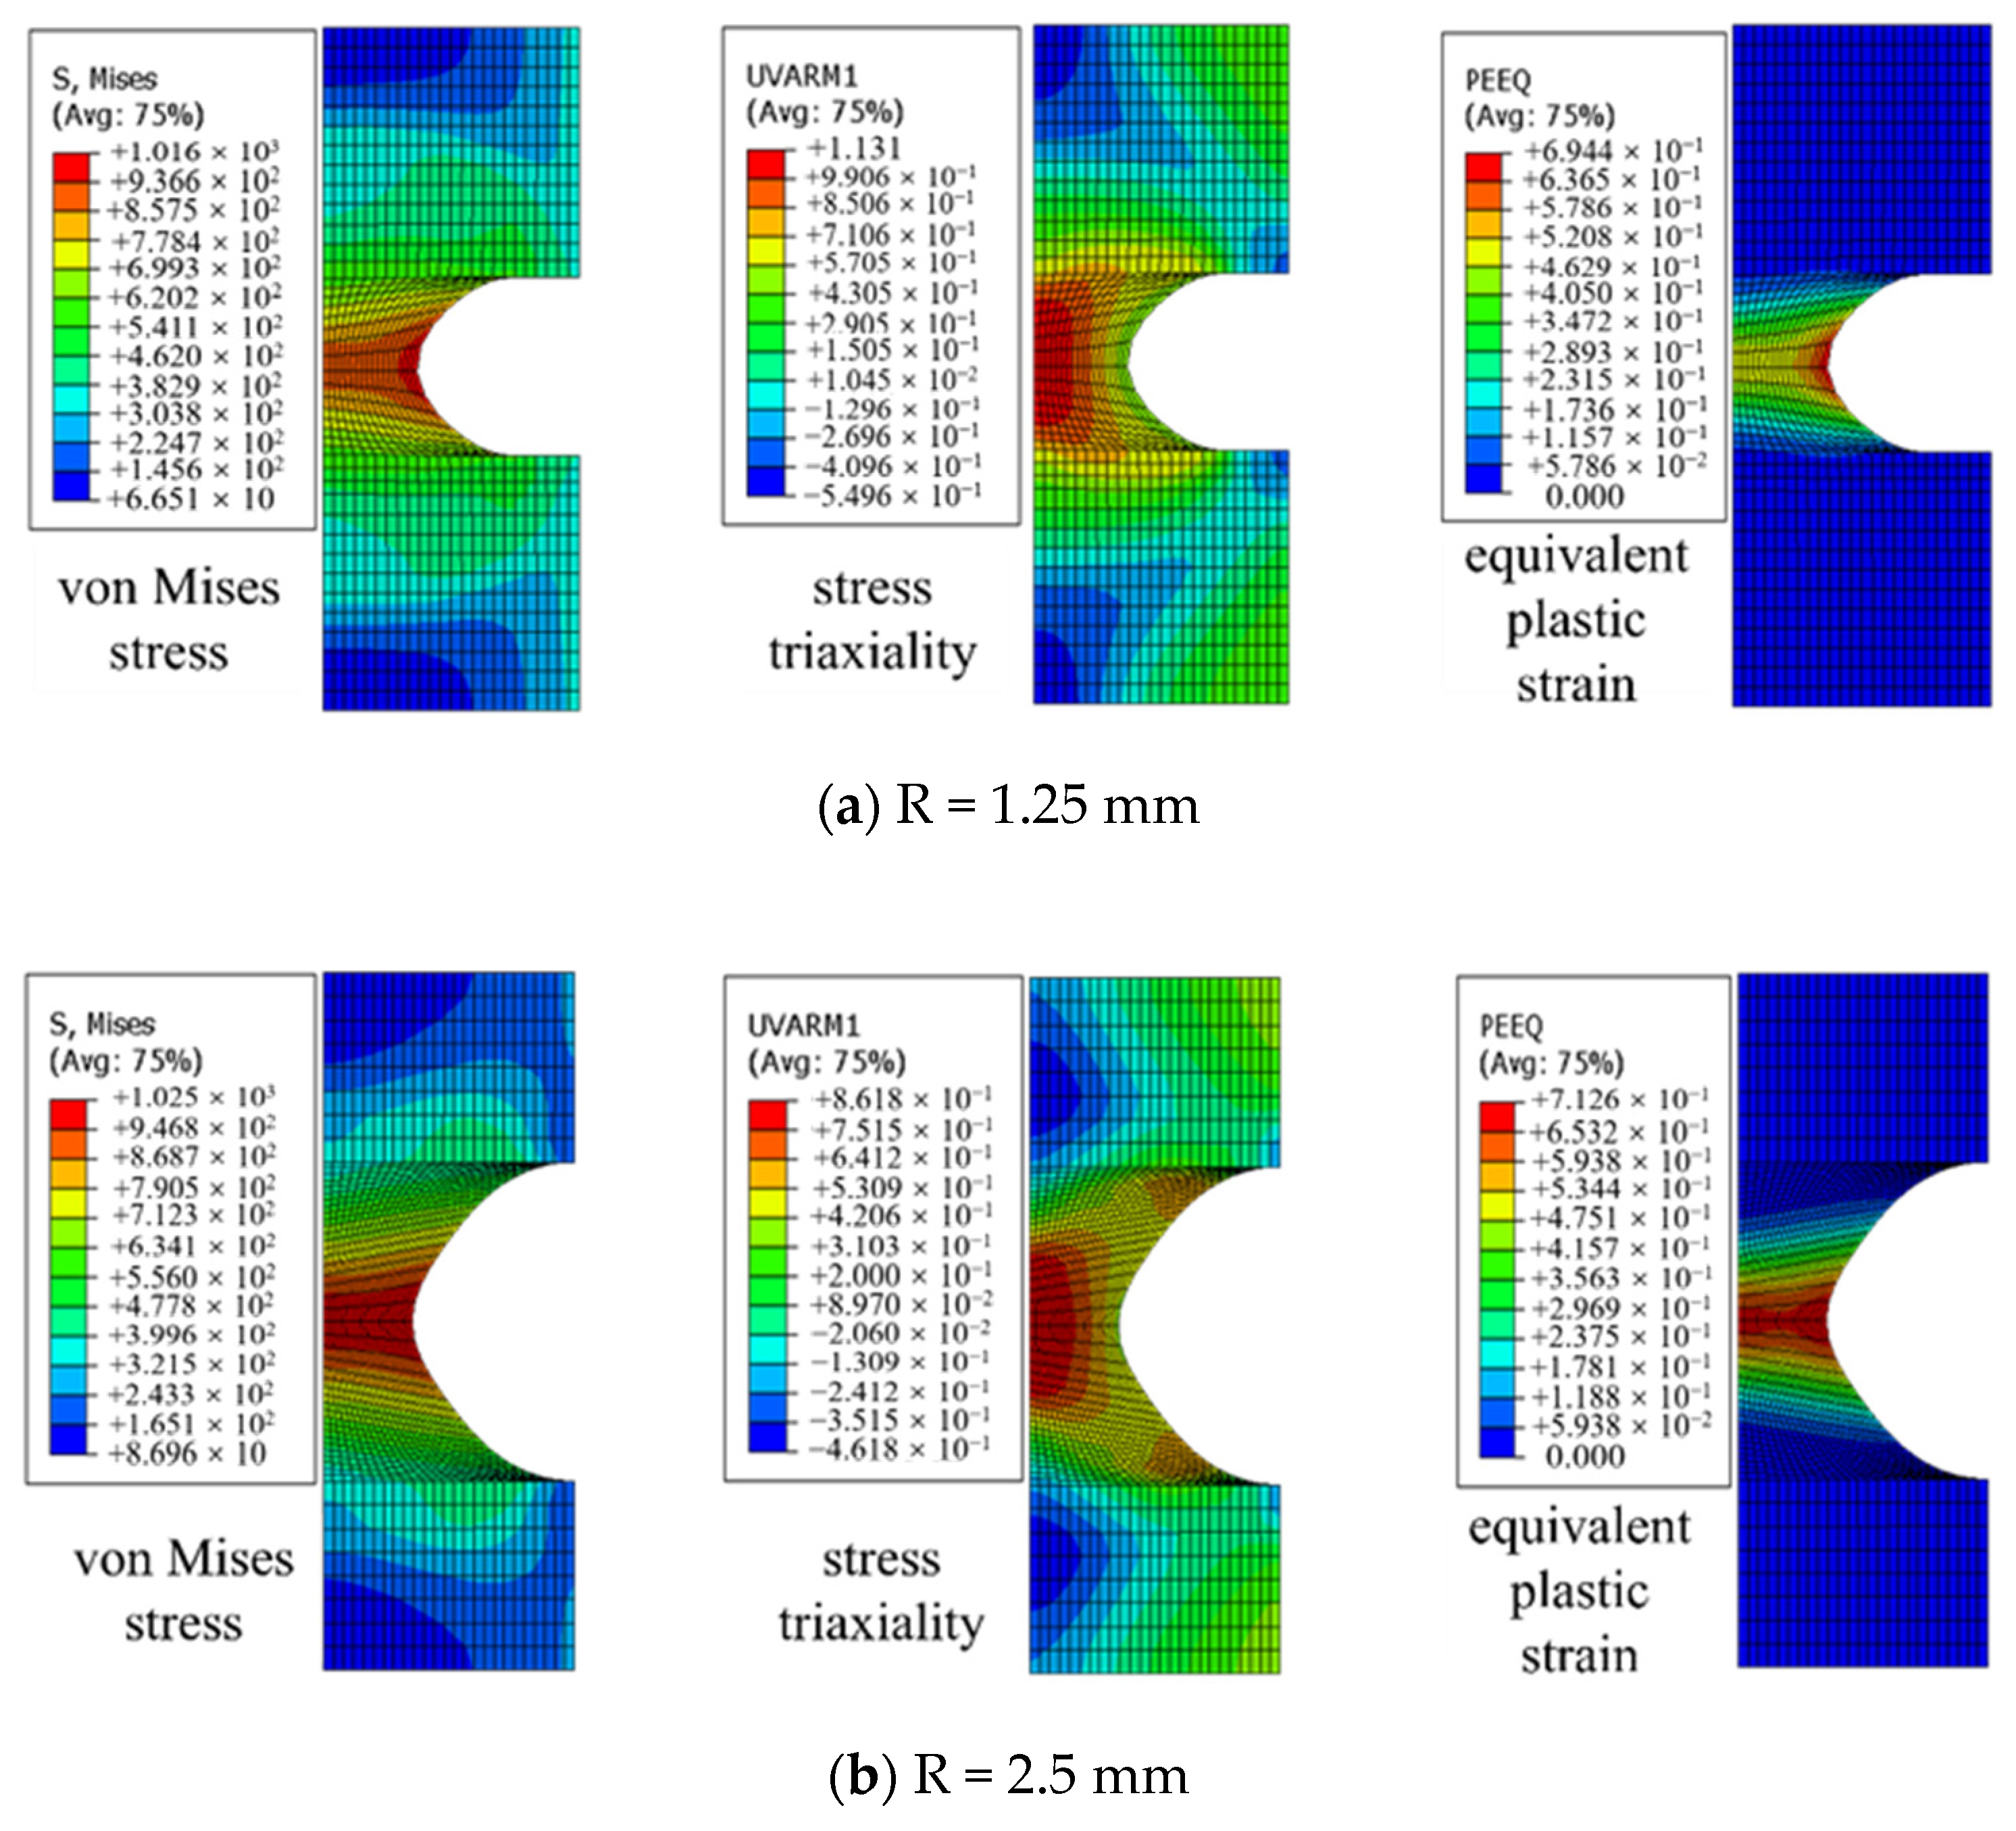
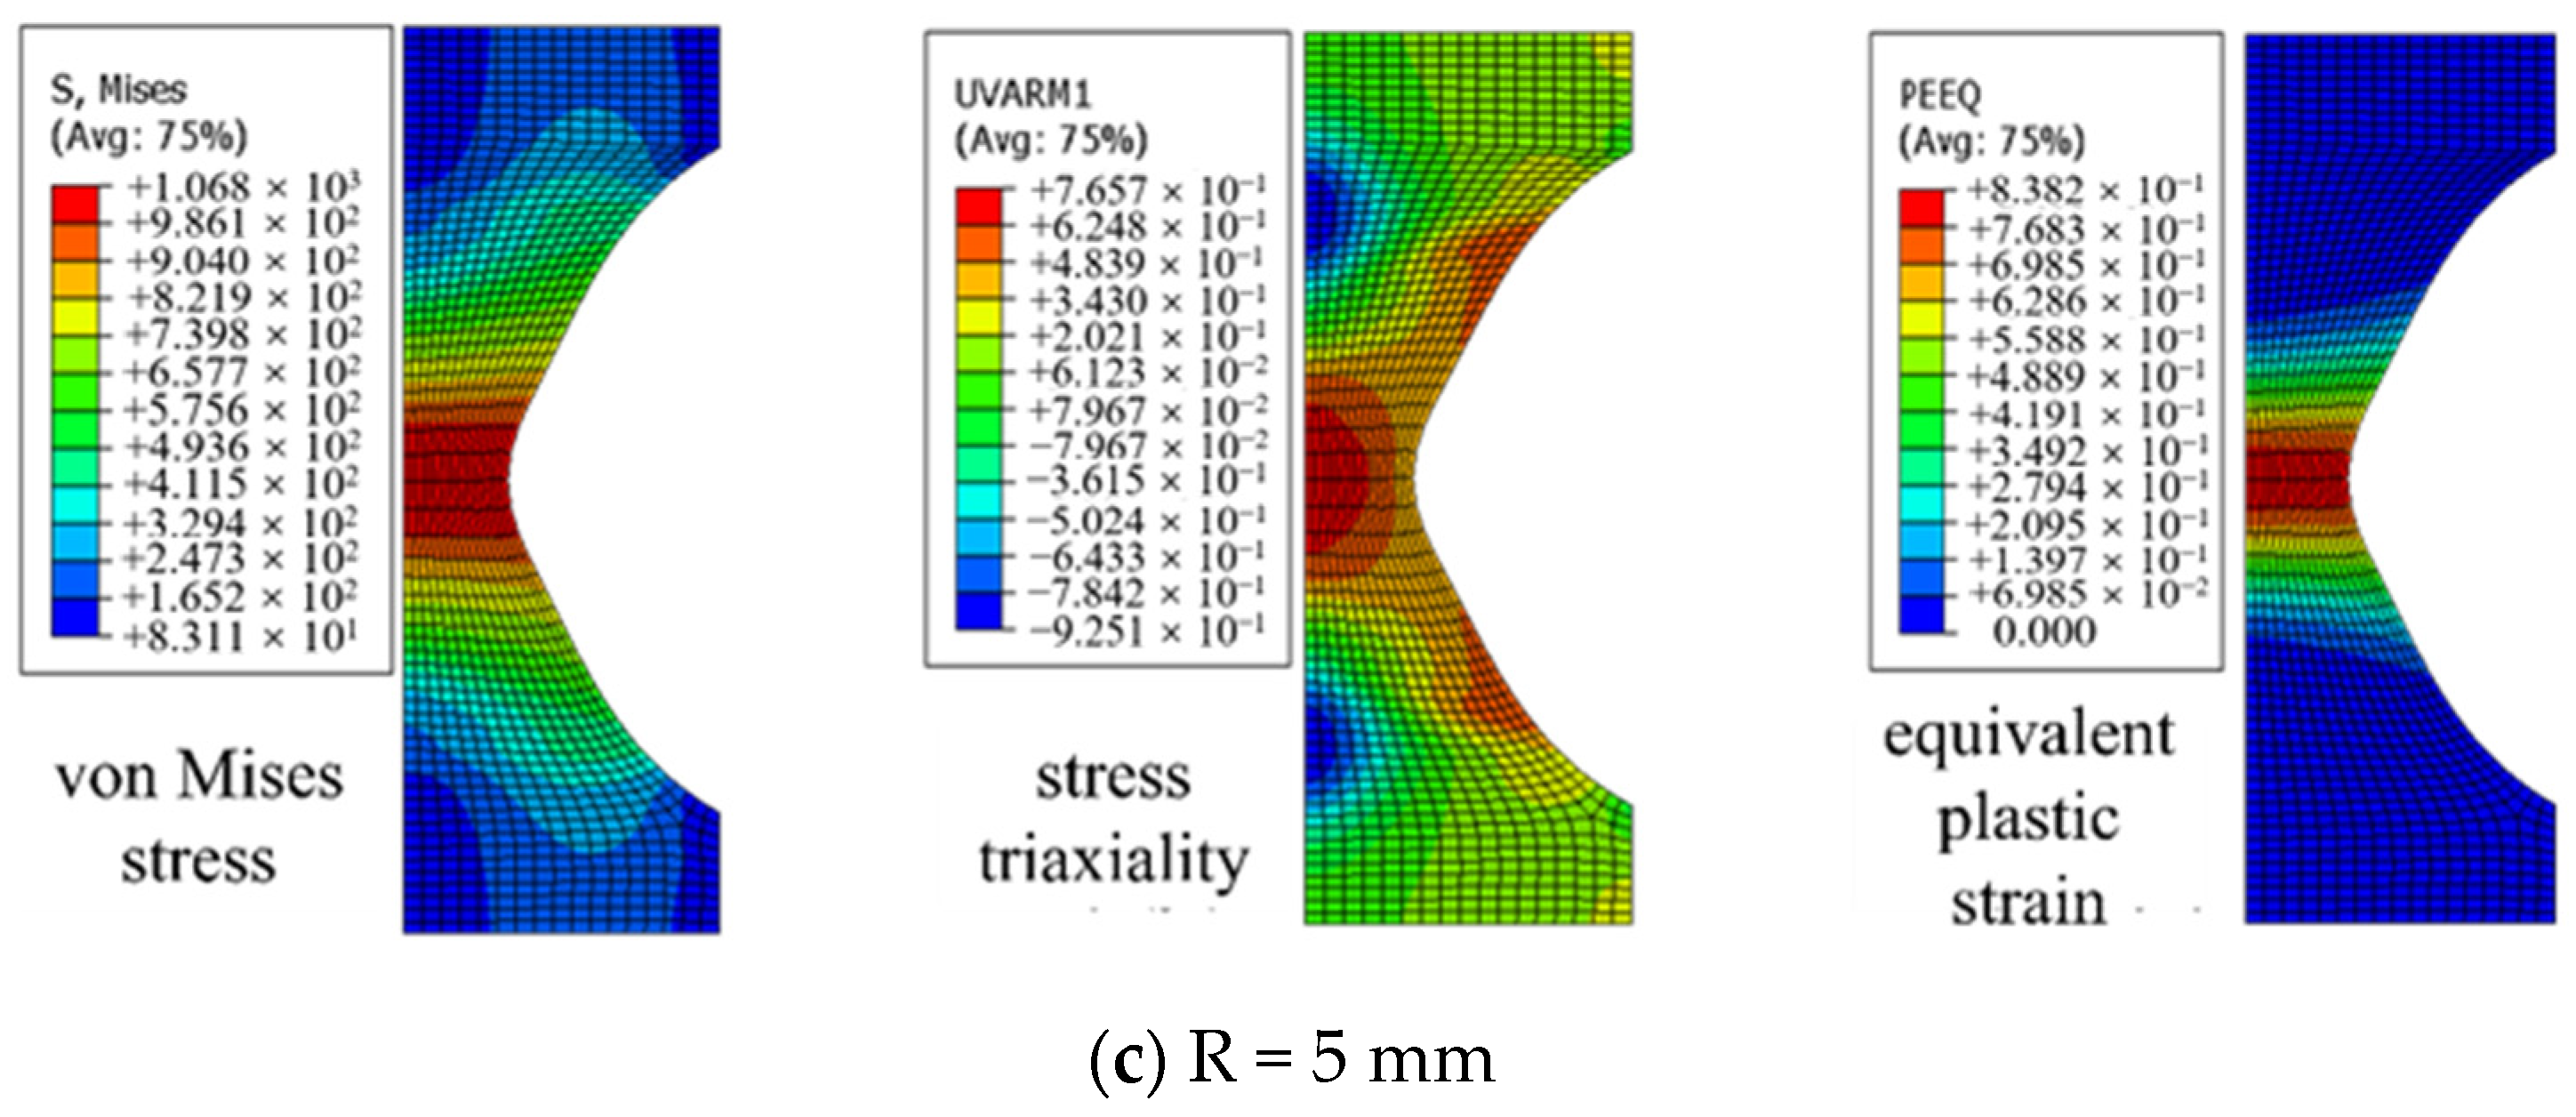
γ for both the VGM and the SMCS were calculated. The distribution of the local stress–strain field of the section with different notch radii when the specimen reaches the critical elongation is shown in Figure 15.
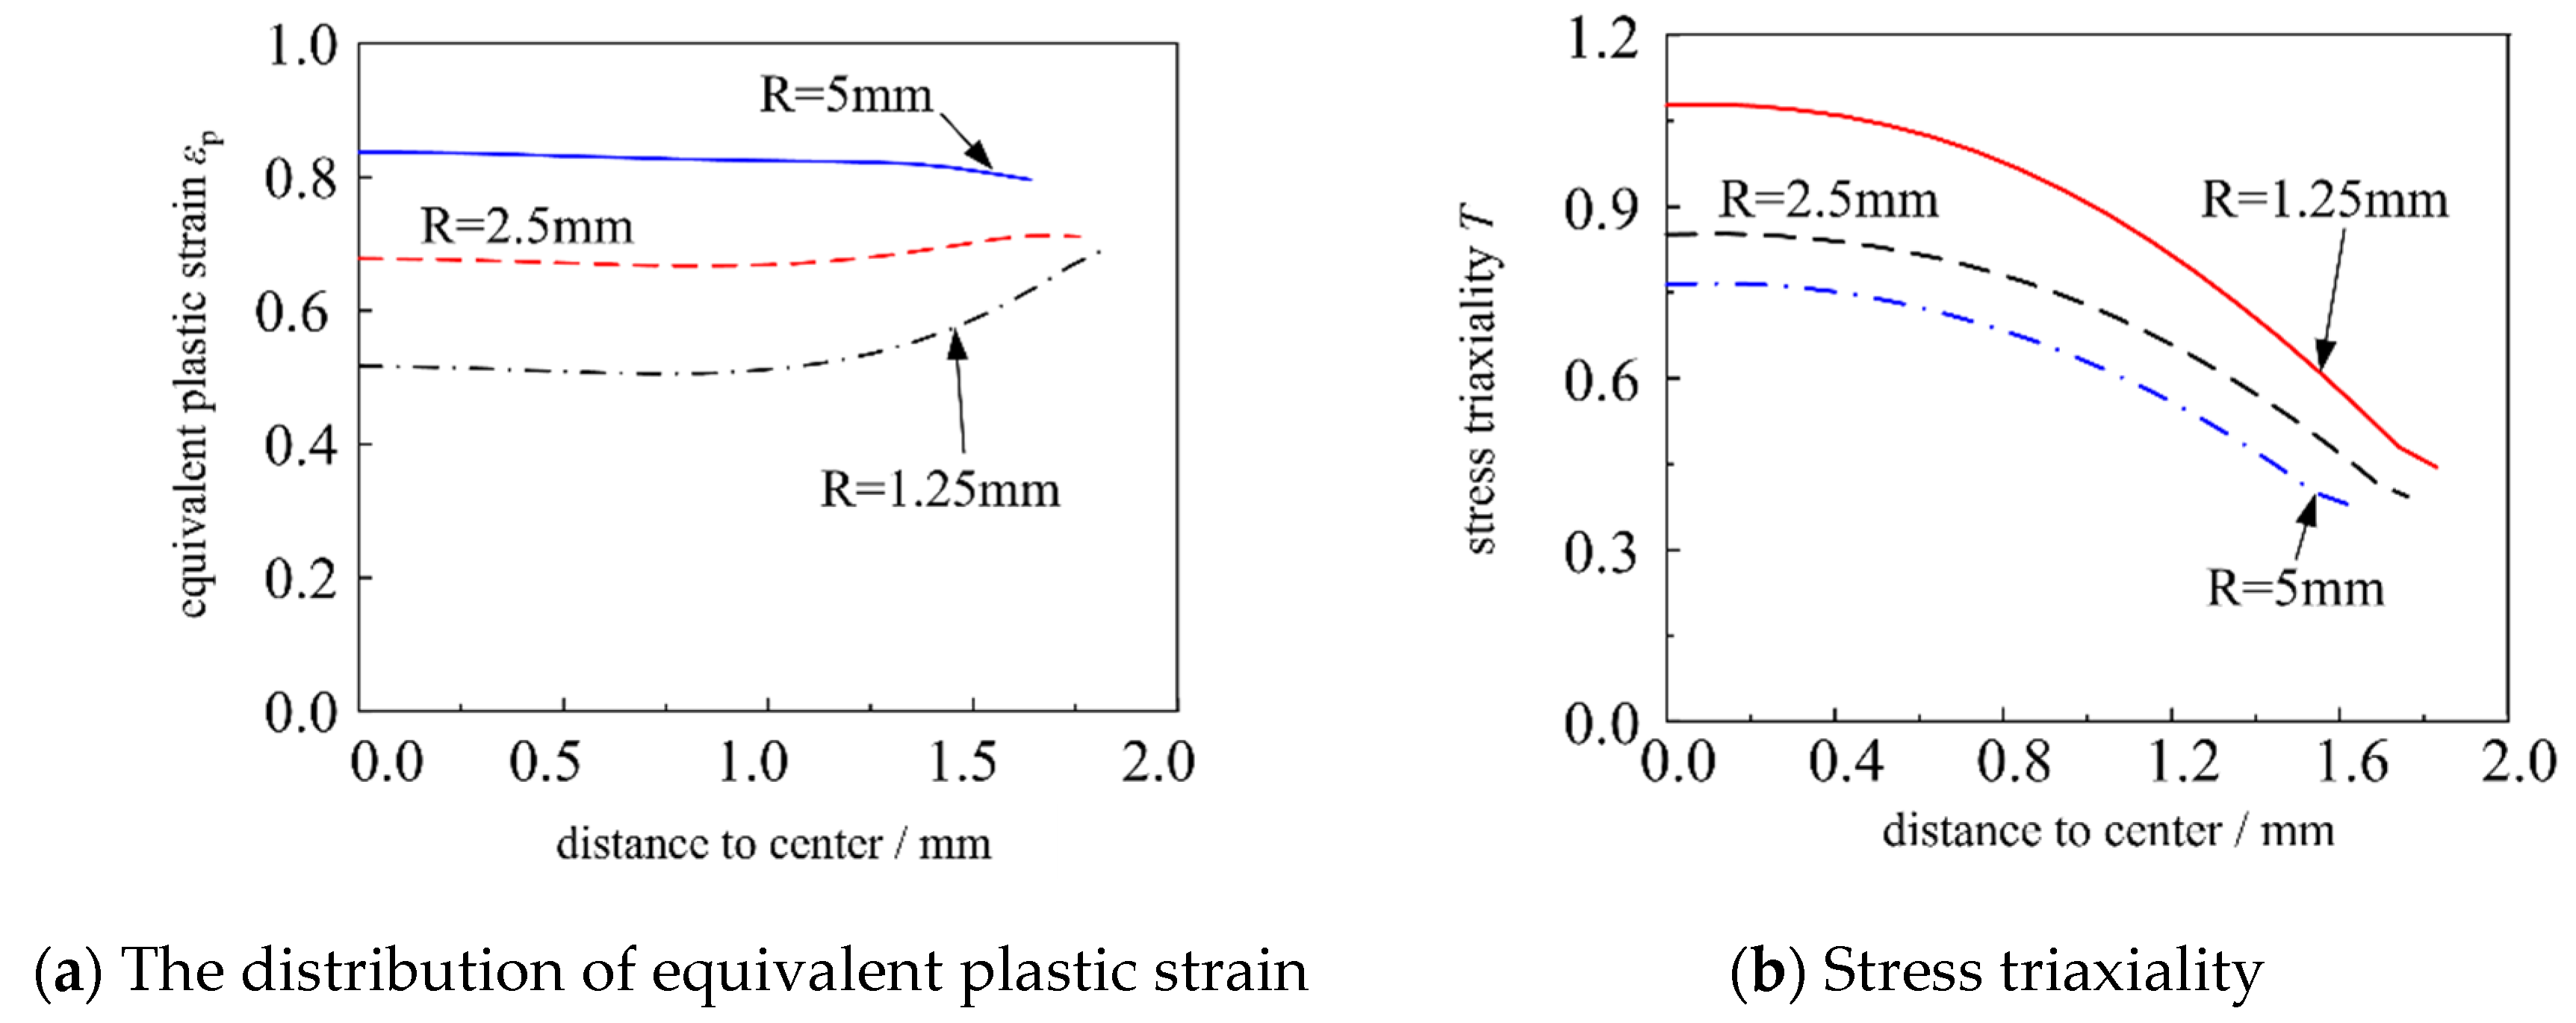
Figure 16 shows the distribution of equivalent plastic strain and stress triaxiality along the notched section of the specimen. The results indicate that for a notch radius of R = 5 mm, its equivalent plastic strain εp is nearly uniformly distributed along this section. However, for smaller notch radii (R = 2.5 mm or 1.25 mm), the equivalent plastic strain reaches its maximum at the notched surface. The larger the notch radius is, the smaller the stress triaxiality T is, with the maximum stress triaxiality value appearing at the center of the specimen, contrary to the distribution law of equivalent plastic strain, while the fracture index in the micromechanical model depends on both the stress triaxiality and equivalent plastic strain. Consequently, under a triaxial stress state, the fracture prediction cannot be made to only rely on the plastic strain index.
When the specimen reaches the critical elongation of initial fracture, the stress–strain state or history of the center point was input into Equations (9) and (10), so the toughness parameters ηmon and γ in the VGM and the SMCS were calculated, as listed in Table 10.
η m o n = ln ( r c r / r 0 ) m o n C = 0 ε P , c r exp ( 1.5 T ) d ε p
ε p , c r = ln ( r c r / r 0 ) m o n C exp ( 1.5 T ) = γ exp ( 1.5 T )
When the toughness index was determined, the fracture indexes of the VGM and SMCS can be calculated according to Equation (11) and Equation (12), respectively, and the output variables were recorded through a subroutine.
F I V G M = 0 ε p exp ( 1.5 T ) d ε p η m o n 0
F I S M C S = ε p ε p , c r = ε p γ exp ( 1.5 T ) 0
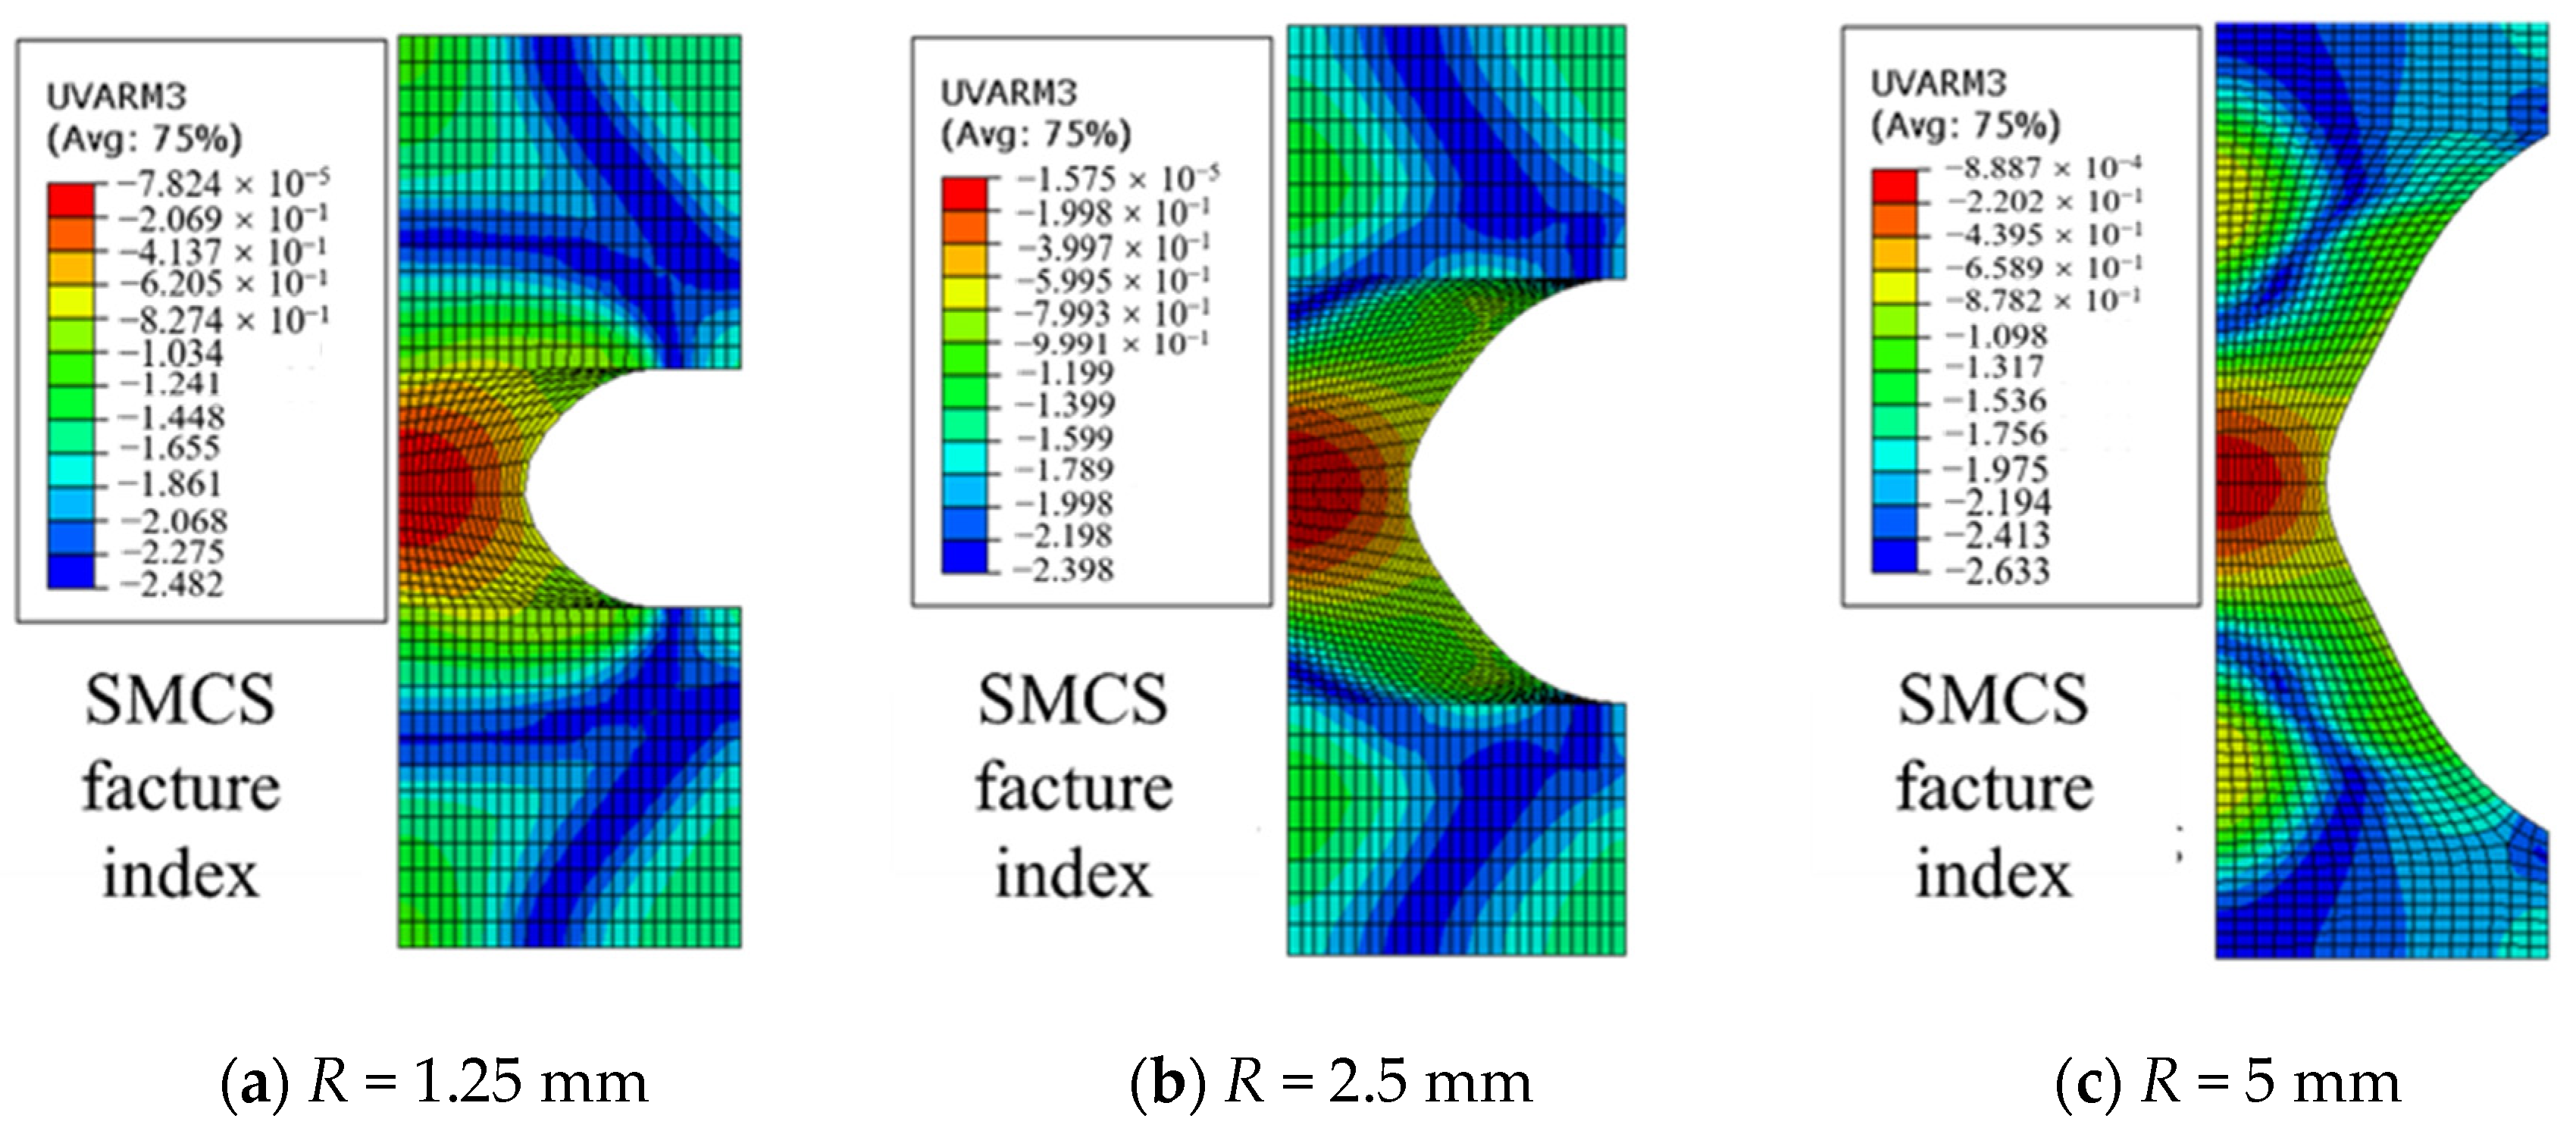
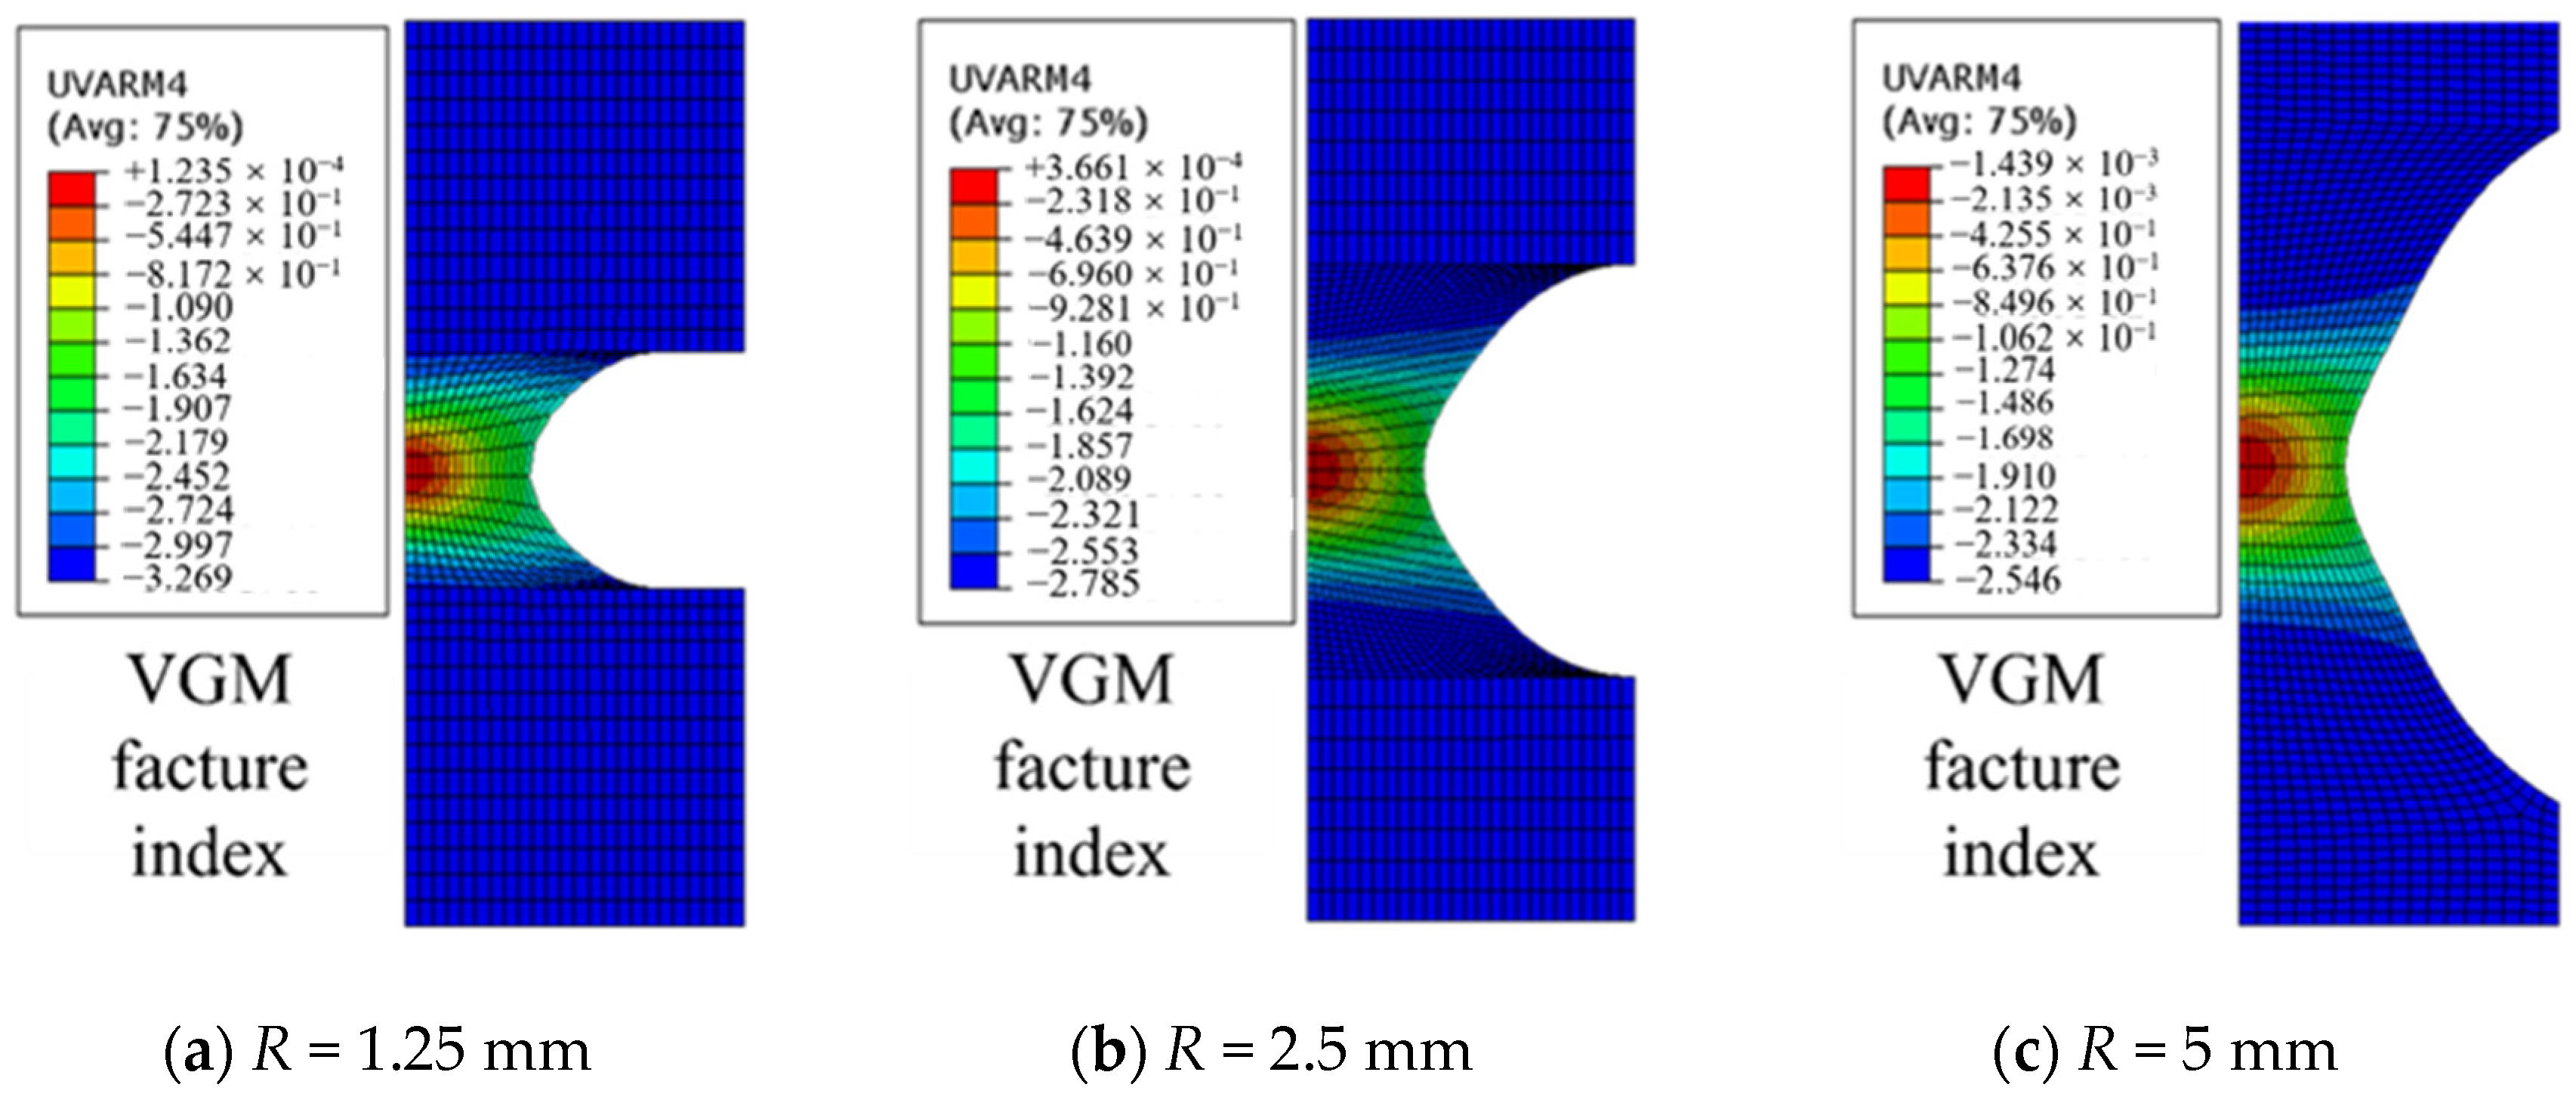
The distribution of fracture index when the elongation of the specimen is δf is shown in Figure 17 and Figure 18. As can be seen from the figures, the fracture index reaches maximum at the center of the specimen, indicating that the specimens’ initial fracture at the center point, which is consistent with the test phenomenon.
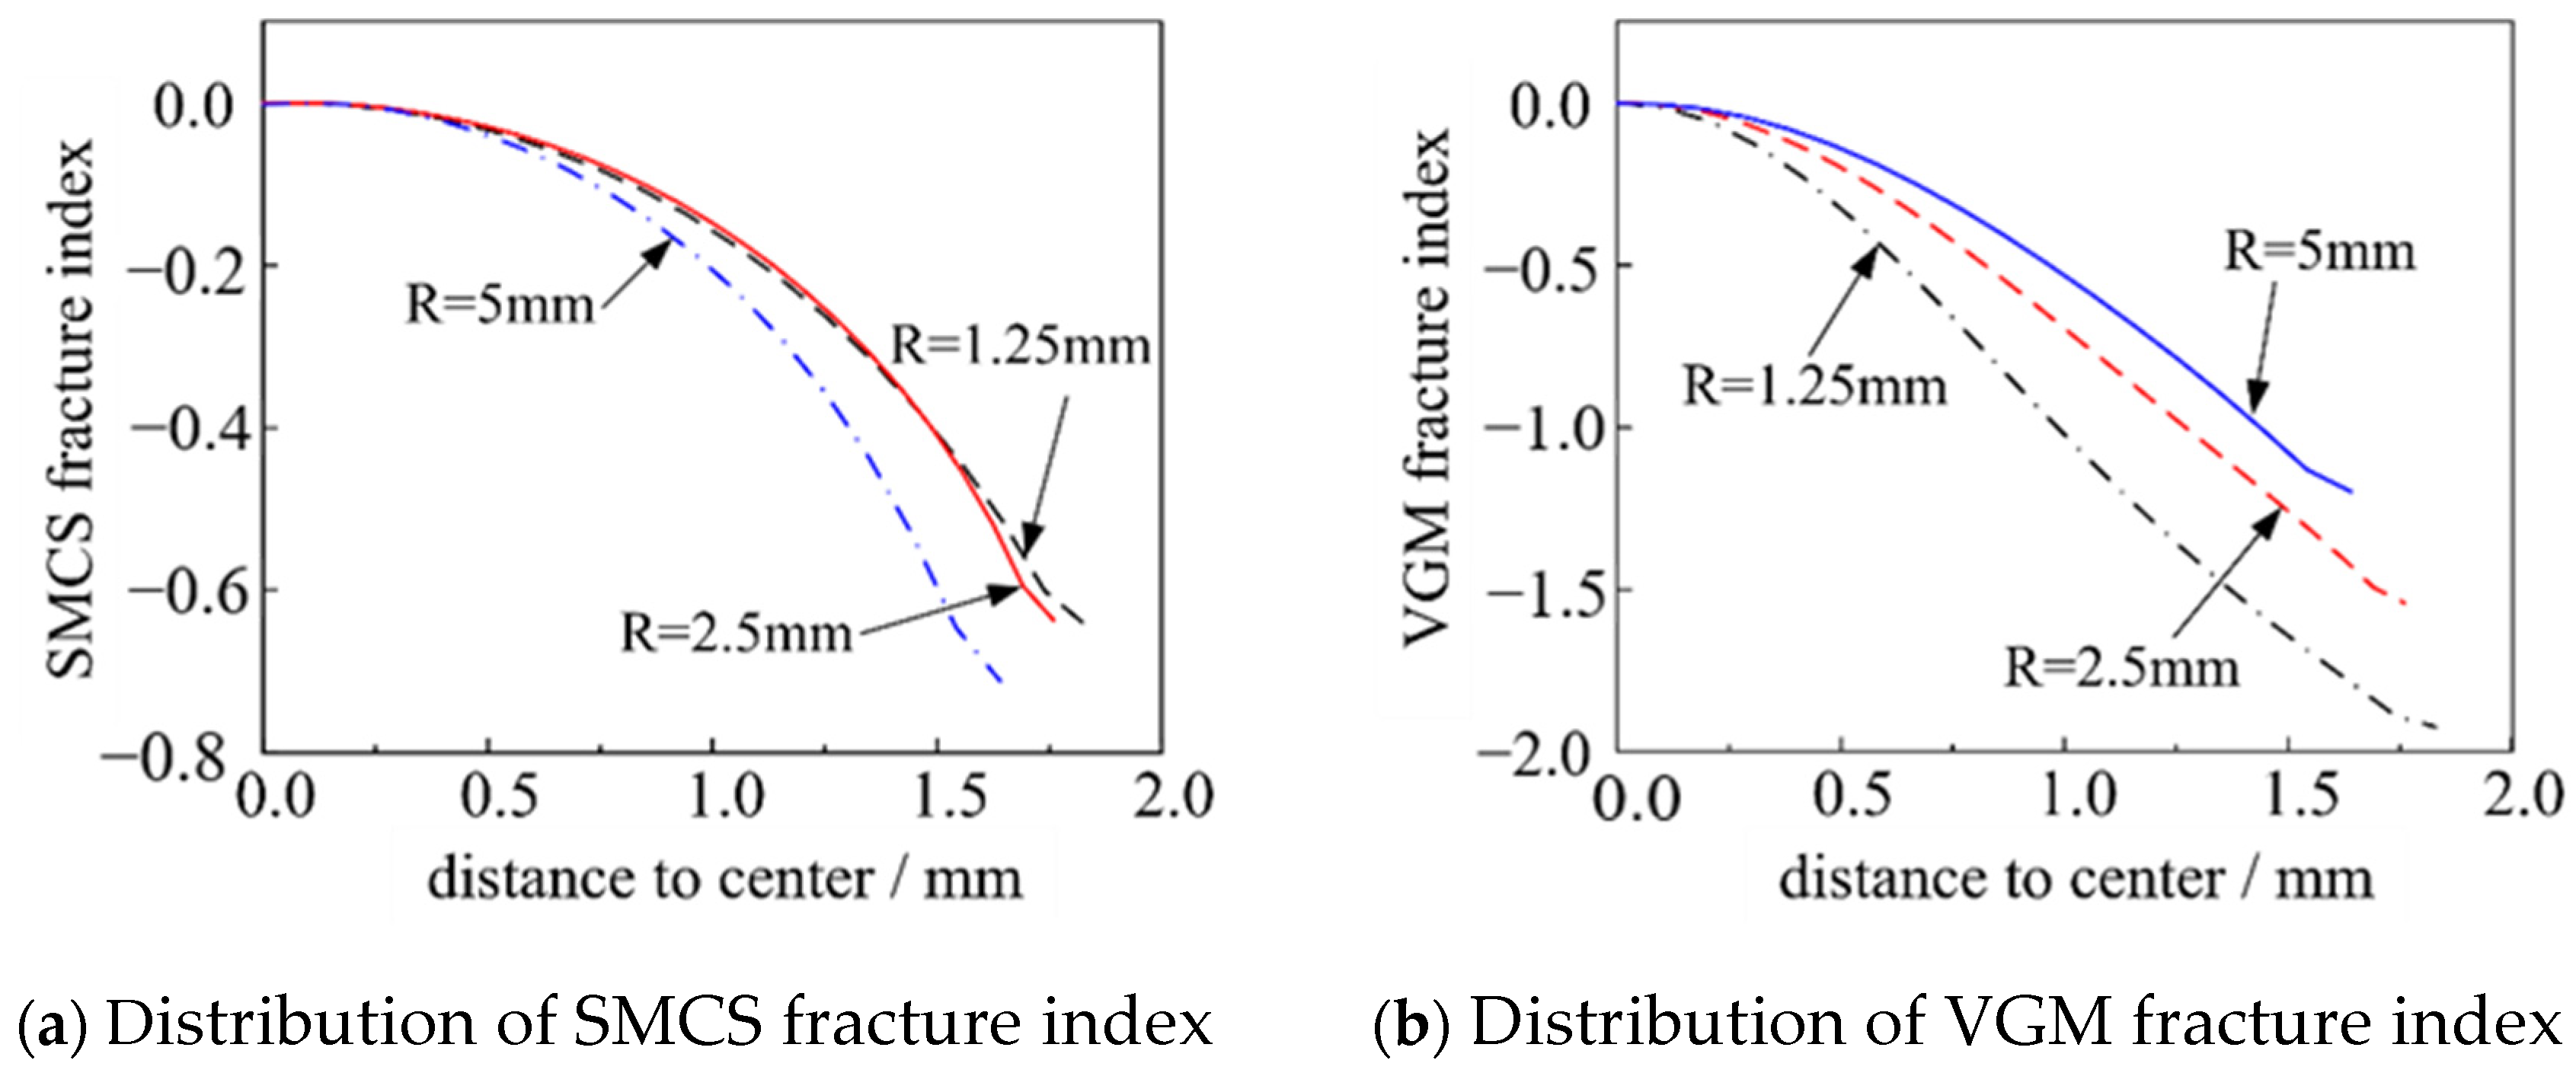
Figure 19 shows the distribution curves of the fracture indexes in the notched section for three specimens with different notched radii. For each of the three different stress states, the distribution patterns of fracture indexes along the notched section are consistent between the SMCS and the VGM. Both show a decreasing trend from the center of the specimen to the notched surface, with only minor gradient changes observed within certain ranges. This indicates that the characteristic length based on the material’s microstructure does not significantly influence fracture prediction for the notched round bar specimens. Furthermore, there is an absence of evident correlation between the characteristic length and toughness indexes. The consistency on the distribution pattern of fracture indexes for the SMCS and the VGM also verifies their applicability to high-strength steels under various stress states.
Through the monotonic tensile test of the notched round bar specimens, corresponding finite element numerical simulations were conducted to obtain the toughness parameters ηmon, γ and other relevant parameters during the calibration process for the microfracture model, as listed in Table 10. In the table, the equivalent plastic strain εp,cr, the equivalent stress σe, the average stress σm, and the stress triaxiality T are the stress–strain values corresponding to the critical elongation δf. Comparing the calibrated toughness parameters for the base material, weld metal, and heat-affected zone, it was observed that the toughness parameters of the heat-affected zone are somewhat lower. However, the average values of the three materials are similar, and the low coefficient of variation (COV) of the calibrated results indicates that the VGM and the SMCS are suitable for the prediction of the ductile fracture of high-strength steels and their weld materials under different stress states.
For the calibration of CVGM model parameters under large-strain low-cycle fatigue loading, the stress–strain history at the fracture hazardous point of the notched round bar specimen undergoing cyclic loading is monitored up to failure. Using the number of cycles Nf and the critical elongation δf obtained from notched round bar cyclic loading test at the time of the initial fracture via the Equation (13), the critical expansion of the material voids of the specimen at the point of cracking under cyclic loading is calculated as ηcyc, i.e., the demanded toughness under cyclic loading.
η c y c = ln ( r c r / r 0 ) c y c C = t e n s i l e ε 1 ε 2 exp ( | 1.5 T | ) d ε p c o m p r e s s i v e ε 1 ε 2 exp ( | 1.5 T | ) d ε p
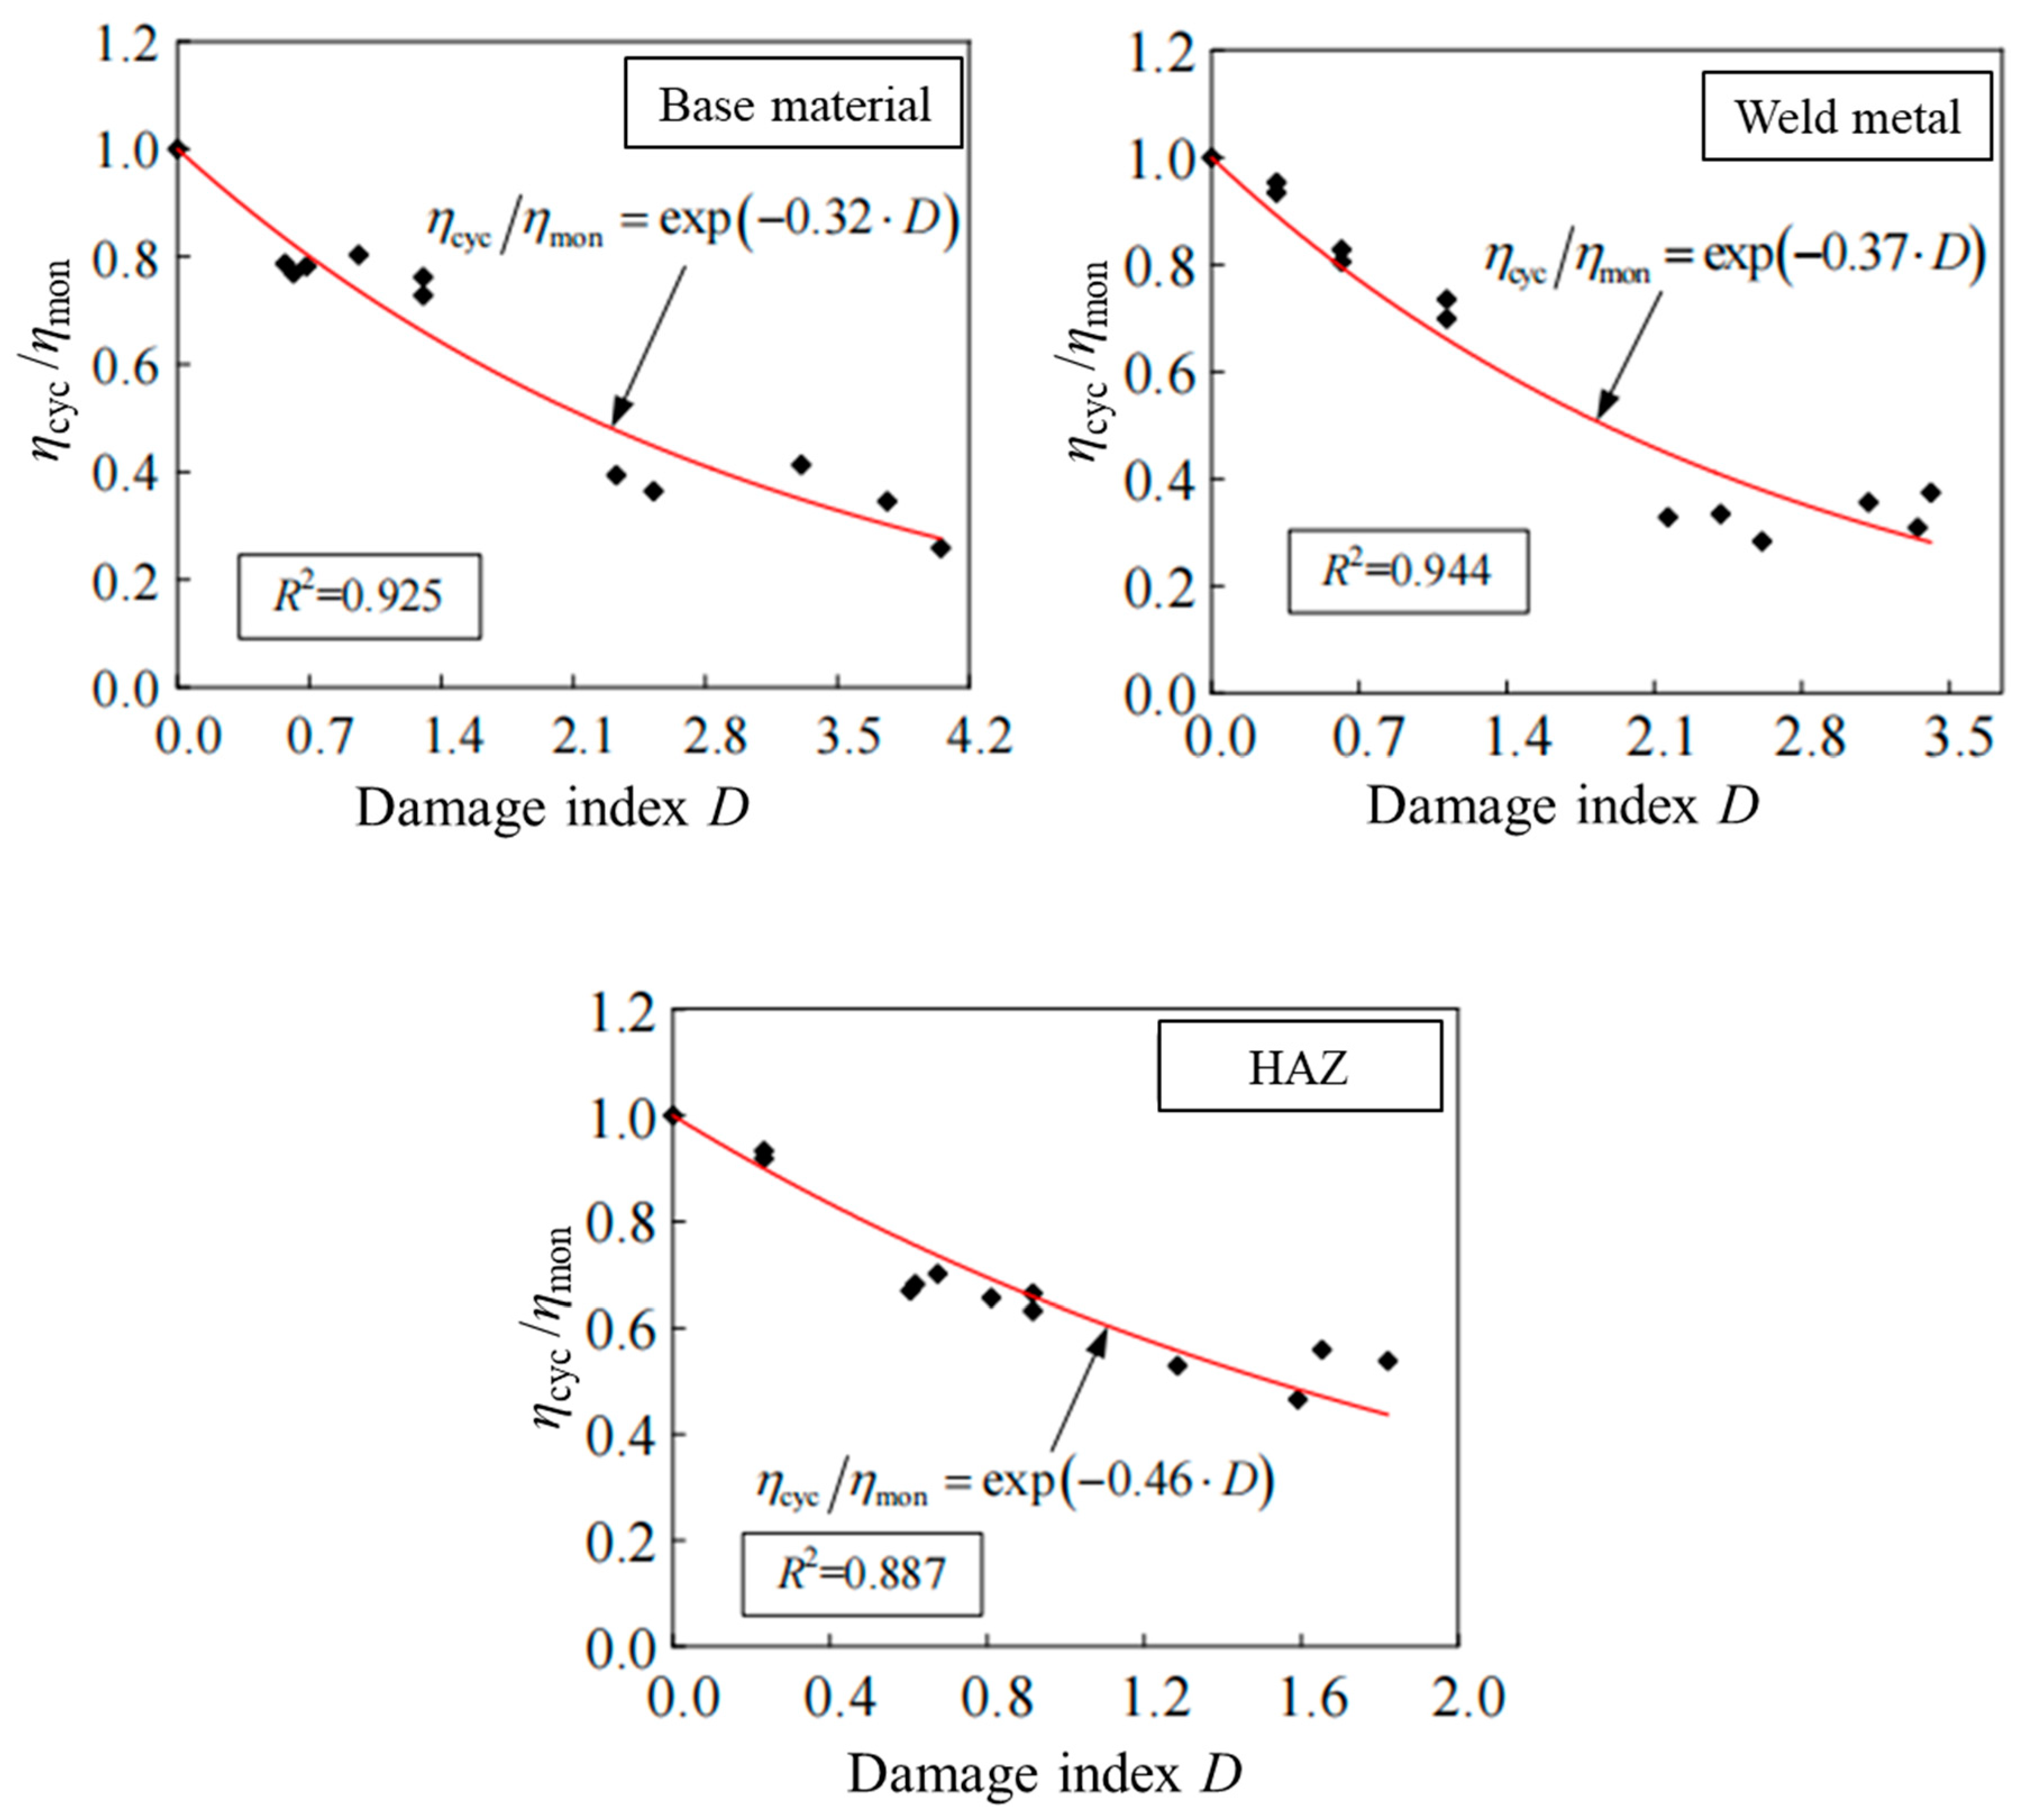
The material damage ratio is obtained by comparing it with the toughness index ηmon under monotonic loading, as mentioned above. The equivalent plastic strain εp at the beginning of the last tensile cycle of the specimen is employed as the damage variable D. An exponential function fit, detailed in Equation (14), establishes the relationship between the damage ratio and damage variable and obtains the damage coefficient λ.
η c y c = f ( D ) η m o n = exp ( λ ε p ) η m o n
The material damage coefficient λCVGM obtained from the fitting data of Q460C base material, weld seam, and heat-affected zone are shown in Table 11, while the damage coefficient fitting curve is shown in Figure 20.
The fracture toughness parameters of Q460C high-strength steel and its welded joints were comparatively analyzed with reference to Q345 steel [28] and seven structural steels from American and Japanese sources [12], as detailed in Table 12.
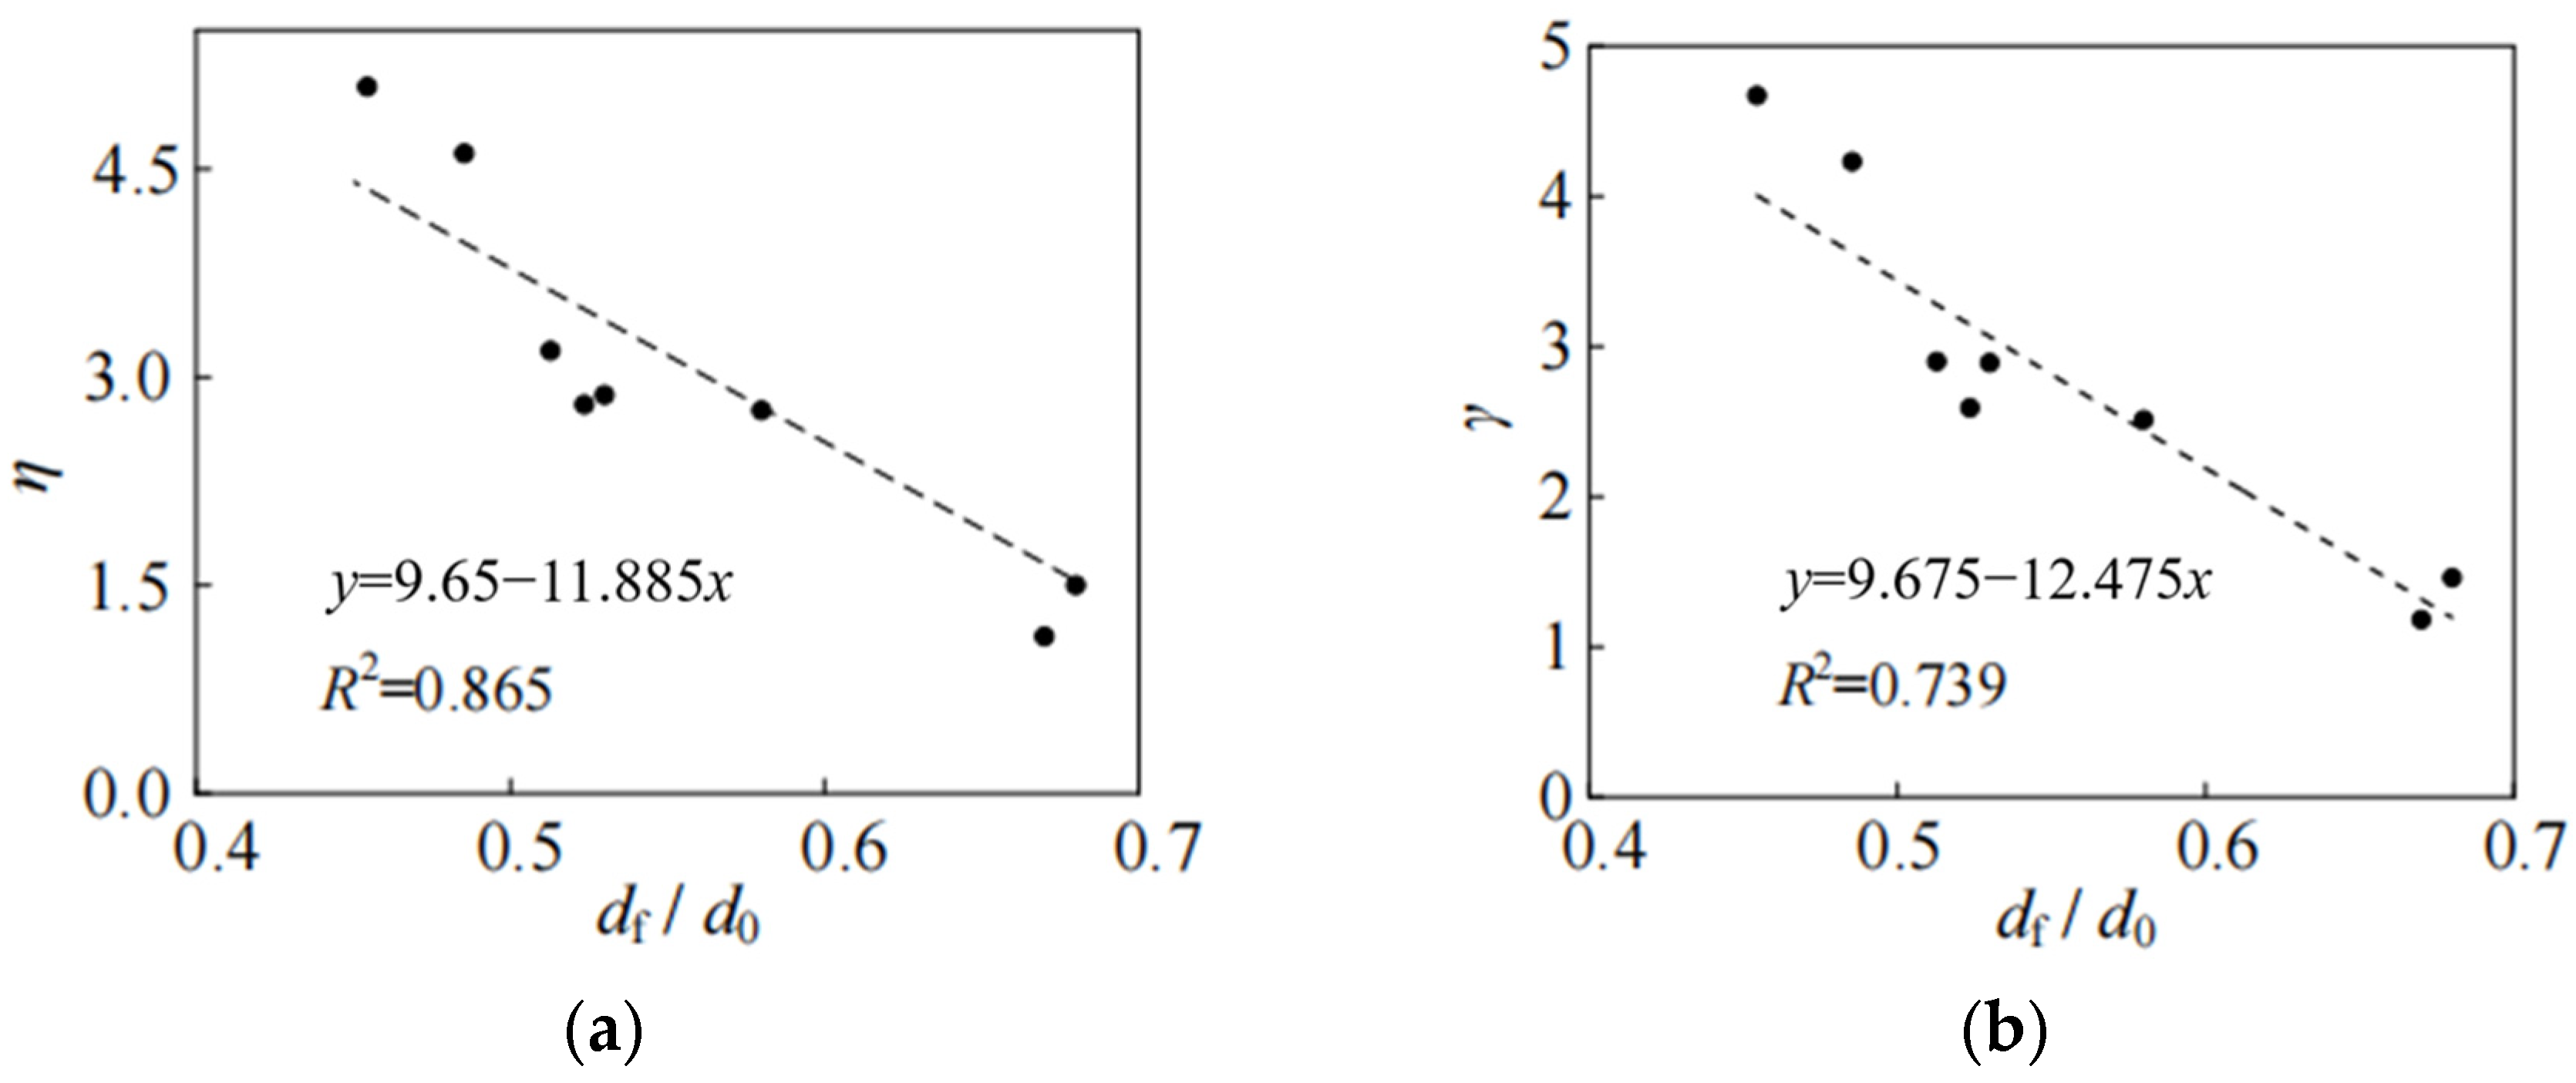
The comparison results of toughness parameters of steel with different strengths show that the toughness parameters γ and ηmon of the material under monotonic tensile do not exhibit a significant correlation with material strength index and yield ratio. However, there is a certain relationship with the specimen plasticity index, i.e., the section shrinkage ratio. The better the plasticity is, the greater the toughness parameters is. The damage degradation coefficient λCVGM under cyclic loading shows little relationship with the material mechanical property index. Figure 21 illustrates the correlation between toughness and plasticity indexes across various fracture prediction models. The micromechanical toughness parameter exhibits an inverse correlation with section shrinkage, demonstrating a strong dependence (R2 = 0.865) between the η parameter in the VGM and experimental measurements, as determined by the regression analysis. Therefore, when the micromechanical model calibration is limited by the actual conditions, the formula in Figure 21 can be used to make an approximate conversion of the plasticity indexes, such as the elongation after the fracture.

5. Conclusions

The fracture prediction model for Q460C high-strength steel and its welds under both monotonic loading and cyclic loading were established based on fracture micromechanism, taking into account material reactance and load effects, which combine the ductile fracture micromechanism and stress–strain fields. Constitutive models for Q460C high-strength steel and its welds under the monotonic tension and cyclic loading were established using test results and a finite element analysis. Toughness parameters ηmon and γ were calibrated for the void growth model (VGM) and stress-modified critical strain model (SMCS) in the Q460C base material, its weld metal, and the heat-affected zone. Additionally, the material damage degradation coefficient λCVGM was calibrated based on fatigue test results and the finite element analysis of round bars with different notch radii and different cyclic loading regimes, thereby providing a necessary basis for the subsequent analysis of the fracture performance of high-strength structural steel joints. The main conclusions are as follows:
(i)
The toughness parameters γ and ηmon for the weld zone are greater than those for the base material and the heat-affected zone. Heat-affected zone toughness parameters are relatively small, and the damage degradation coefficient λCVGM is relatively large, indicating that the heat-affected zone is more susceptible to cracking under cyclic loading.
(ii)
The coefficient of variation (COV) of the toughness parameter ηmon of the void growth model (VGM) for the Q460C steel base material, its weld, and heat-affected zone materials were 4.3~19.4%, and the coefficient of variation (COV) of the toughness parameter γ of the stress-modified critical strain model (SMCS) was 5.2~14.9%, which was within the acceptable range of variation, and validates the void growth model (VGM) and stress-modified critical strain model (SMCS) micromechanism models for predicting the ductile fracture of Q460C steel and its welds.
(iii)
The appropriate increase in the strength of steel has little effect on the toughness parameter in the void growth model (VGM) and stress-modified critical strain model (SMCS) micromechanism models as well as the material damage degradation coefficient λCVGM in the cyclic void growth model (CVGM). The toughness parameters in both the void growth model (VGM) and stress-modified critical strain model (SMCS) demonstrate negligible dependence on steel strength and yield ratio, while exhibiting a positive correlation with material plasticity, where increased plastic deformation capacity corresponds to higher toughness values.
(iv)
While the validity of the void growth model (VGM) and stress-modified critical strain model (SMCS) for predicting ductile fracture in Q460C steel and its welds has been confirmed, this study adopted a simplification by assuming isotropic stress conditions in the necking region. Specifically, the influence of dimple shape anisotropy was not explicitly considered. Future investigations will incorporate advanced characterization of dimple morphology evolution states to refine the predictive accuracy of these micromechanical models for Q460C steel.

Author Contributions

Conceptualization, X.L. and Y.W.; Methodology, X.L. and Y.W.; Validation, Y.W.; Formal analysis, X.Z.; Investigation, Y.Y. (Yilin Yue) and Y.Y. (Yicong Ye); Resources, X.L.; Data curation, X.Z. and Y.Y. (Yilin Yue); Writing—original draft, Y.Y. (Yilin Yue); Writing—review & editing, Y.Y. (Yilin Yue); Visualization, X.Z.; Supervision, X.L., Y.W. and M.H.; Project administration, X.L.; Funding acquisition, X.L. All authors have read and agreed to the published version of the manuscript.

Funding

This research was funded by National Natural Science Foundation of China (grant number 52178178).

Data Availability Statement

The raw data supporting the conclusions of this article will be made available by the authors on request.

Conflicts of Interest

The authors declare no conflict of interest.

References

  1. Luo, R. Study on Mechanical Properties of Q460 and Q690 High-Strength Steels After Fatigue Damage. Master’s Thesis, Southwest University of Science and Technology, Mianyang, China, 2022. (In Chinese). [Google Scholar] [CrossRef]
  2. Qiu, L.B.; Liu, Y.; Hou, Z.X.; Chen, S.R.; Zhong, G.H. The application research of high-strength structural steel in construction. Ind. Constr. 2014, 44, 1–5+47. (In Chinese) [Google Scholar]
  3. Fan, Z.J.; Gui, L.J.; Su, R.Y. Research and progress of automotive lightweight technology. J. Automot. Saf. Energy 2014, 1, 1–16. (In Chinese) [Google Scholar] [CrossRef]
  4. Li, S.H.; Li, K.J.; Zhang, L.Z.; Feng, Y.; Liu, Z.Q.; Cao, P.J.; Liu, B.; Dong, J.L. Characterization of retained austenite in advanced high-strength steel. Scanning 2023, 2023, 9565903. [Google Scholar] [CrossRef] [PubMed]
  5. Zhu, P.X.; Li, Y.; Feng, K.; Wang, X. Research on microstructure and mechanical properties of high strength steel. IOP Conf. Ser. Mater. Sci. Eng. 2019, 493, 012147. [Google Scholar] [CrossRef]
  6. Barsom, J.M.; Rolfe, S.T. Fracture and Fatigue Control in Structures: Applications of Fracture Mechanics, 3rd ed.; ASTM: West Conshohocken, PA, USA, 1999. [Google Scholar]
  7. Ilyin, A.V.; Lavrentiev, A.A.; Mizetsky, A.V. On the formulation of local brittle fracture criterion for predicting crack resistance of high-strength steel. Inorg. Mater. Appl. Res. 2021, 12, 1628–1641. [Google Scholar] [CrossRef]
  8. Lavrentiev, A.A.; Golosienko, S.A.; Ilyin, A.V.; Mikhailov, M.S.; Motovilina, G.D.; Petrov, S.N.; Sadkin, K.E. Resistance of high-strength medium-alloy steel to brittle fracture and its connection to the structural state parameters. Inorg. Mater. Appl. Res. 2020, 11, 1447–1461. [Google Scholar] [CrossRef]
  9. Charpentier, P.L. Post-forming room temperature brittle fracture in a high-strength low-alloy steel sheet after various forming modes. J. Mater. Eng. Perform. 2019, 28, 7119–7140. [Google Scholar] [CrossRef]
  10. Yao, L.P.; Lu, B.H.; Wang, X.Z. Fracture performance testing and modeling of butt weld metal. Eng. Fail. Anal. 2022, 139, 106489. [Google Scholar] [CrossRef]
  11. Chabok, A.; Cao, H.; van der Aa, E.; Pei, Y. New insights into the fracture behavior of advanced high-strength steel resistance spot welds. J. Mater. Process. Technol. 2022, 301, 117433. [Google Scholar] [CrossRef]
  12. Kanvinde, A.M.; Deierlein, G.G. Micromechanical Simulation of Earthquake-Induced Fracture in Steel Structures; Report No.145, the John A.; Blume Earthquake Engineering Center, Stanford University: Stanford, CA, USA, 2004. [Google Scholar]
  13. Zhou, H. Investigations on Fracture and Fatigue Behaviours of Steel Connections Based on Global-Local Models. Ph.D. Thesis, Tsinghua University, Beijing, China, 2013. (In Chinese). [Google Scholar]
  14. Łagoda, T.; Głowacka, K. Fatigue life prediction of welded joints from nominal system to fracture mechanics. Int. J. Fatigue 2020, 137, 105647. [Google Scholar] [CrossRef]
  15. Park, S.J.; Cerik, B.C.; Choung, J. Comparative study on ductile fracture prediction of high-tensile strength marine structural steels. Ships Offshore Struct. 2021, 15, s208–s219. [Google Scholar] [CrossRef]
  16. Peshekhodov, I.; Dykiert, M.; Vucetic, M.; Behrens, B.A. Evaluation of common tests for fracture characterization of advanced high-strength sheet steels with the help of the FEA. IOP Conf. Ser. Mater. Sci. Eng. 2016, 159, 012014. [Google Scholar] [CrossRef]
  17. Schreiber, J.M.; Smid, I.; Eden, T.J.; Jann, D. Prediction of fragmentation and experimentally inaccessible material properties of steel using finite element analysis. Finite Elem. Anal. Des. 2015, 104, 72–79. [Google Scholar] [CrossRef]
  18. Yescas, M.; Le Gloannec, B.; Roch, F. Prediction of mechanical properties of PWR vessel steel heads containing residual carbon macrosegregation using Artificial Neural Networks. J. Nucl. Mater. 2022, 106, 72–79. [Google Scholar] [CrossRef]
  19. Guo, S.C. Fracture and Low Cycle Fatigue Evaluation of Beam-Column Joints based on Stress-Modified Critical Strain Model. Master’s Thesis, Lanzhou University of Technology, Lanzhou, China, 2021. (In Chinese). [Google Scholar] [CrossRef]
  20. Chi, W.M.; Kanvinde, A.M.; Deierlein, G.G. Prediction of ductile fracture in steel connections using SMCS criterion. J. Struct. Eng. 2006, 132, 171–181. [Google Scholar] [CrossRef]
  21. Rice, J.R.; Tracey, D.M. On the ductile enlargement of voids in triaxial stress fields. J. Mech. Phys. Solids 1969, 17, 201–217. [Google Scholar] [CrossRef]
  22. Hancock, J.W.; Mackenzie, A.C. On the mechanics of ductile failure in high-strength steel subjected to multi-axial stress-states. J. Mech. Phys. Solids 1976, 24, 147–169. [Google Scholar] [CrossRef]
  23. Kanvinde, A.M.; Deierlein, G.G. Void growth model and stress-modified critical strain model to predict ductile fracture in structural steels. J. Struct. Eng. 2006, 132, 1907–1918. [Google Scholar] [CrossRef]
  24. Myers, A.T. Testing and Probabilistic Simulation of Ductile Fracture Initiation in Structural Steel Components and Weldments; Stanford University: Stanford, CA, USA, 2009. [Google Scholar]
  25. Fell, B.V. Large-Scale Testing and Simulation of Earthquake-Induced Ultra Low Cycle Fatigue in Bracing Members Subjected to Cyclic Inelastic Buckling; Stanford University: Stanford, CA, USA, 2010. [Google Scholar]
  26. Kiran, R.; Khandelwal, K. A micromechanical cyclic void growth model for ultra-low cycle fatigue. Int. J. Fatigue 2015, 70, 24–37. [Google Scholar]
  27. Liao, F.; Wang, W. Parameter Calibrations of Micromechanics-Based Fracture Models of Q345 Steel. Science 2010. Available online: http://www.paper.edu.cn/releasepaper/content/201007-457 (accessed on 22 February 2025). (In Chinese).
  28. Liao, F. Research on Microfracture Criterion of Steel and Its Application in Prediction of Nodal Ductile Fracture; Tongji University: Shanghai, China, 2012. [Google Scholar]
  29. GB/T 1591-2018; High Strength Low Alloy Structural Steels. Standards Press of China: Beijing, China, 2018.
  30. GB/T228.1-2010; Metallic Materials-Tensile Testing-Part1: Method of Test at Room Temperature. Standards Press of China: Beijing, China, 2018.
  31. Ramberg, W.; Osgood, W.R. Description of Stress-Strain Curves by Three Parameters; National Advisory Committee for Aeronautics; University of Washington: Seattle, WA, USA, 1943; p. 15. [Google Scholar]
  32. Chaboche, J.L. Time-independent constitutive theories for cyclic plasticity. Int. J. Plast. 1986, 2, 149–188. [Google Scholar] [CrossRef]
  33. Shi, Y.; Wang, M.; Wang, Y. Experimental Study of Structural Steel Constitutive Relationship under Cyclic Loading. J. Build. Mater. 2012, 15, 1185–1197. [Google Scholar]
  34. Nip, K.H.; Gardner, L.; Davies, C.M.; Elghazouli, A.Y. Extremely low cycle fatigue tests on structural carbon steel and stainless steel. J. Constr. Steel Res. 2010, 66, 96–110. [Google Scholar] [CrossRef]
  35. Shi, G.; Wang, M.; Bai, Y.; Wang, F.; Shi, Y.; Wang, Y. Experimental study of high strength structural steel Q460D under cyclic loading. China Civ. Eng. J. 2012, 45, 1–13. [Google Scholar]
Figure 1. Schematic of void growth micromechanism.
Buildings 15 01218 g001
Figure 2. Micromechanism of fracture under cyclic loading.
Buildings 15 01218 g002
Figure 3. Sampling location of specimens.
Buildings 15 01218 g003
Figure 4. Geometrical configurations of standard round bar specimens extracted from both base metal and weld metal regions (mm).
Buildings 15 01218 g004
Figure 5. Cyclic loading regime.
Buildings 15 01218 g005
Figure 6. Dimensions of notched round bars (mm).
Buildings 15 01218 g006
Figure 7. Cyclic loading regimes.
Buildings 15 01218 g007
Figure 8. Engineering stress–strain curve in monotonic tensile tests.
Buildings 15 01218 g008
Figure 9. Actual stress–plastic strain curve.
Buildings 15 01218 g009
Figure 10. Comparison between test results and finite element results.
Buildings 15 01218 g010
Figure 11. Load–deformation curve in monotonic tensile tests.
Buildings 15 01218 g011
Figure 12. Fracture surface morphology and characteristic length in the necking part.
Buildings 15 01218 g012
Figure 13. Load–deformation curves under cyclic loading.
Buildings 15 01218 g013
Figure 14. Finite element model of gauged part.
Buildings 15 01218 g014
Figure 15. Stress–strain distribution of notch section.
Buildings 15 01218 g015aBuildings 15 01218 g015b
Figure 16. The distribution of equivalent plastic strain and stress triaxiality along the notched section of the specimen.
Buildings 15 01218 g016
Figure 17. Distribution of SMCS fracture index.
Buildings 15 01218 g017
Figure 18. Distribution of VGM fracture index.
Buildings 15 01218 g018
Figure 19. Distribution of SMCS and VGM fracture index under critical elongation.
Buildings 15 01218 g019
Figure 20. Fitting curves of the damage coefficient.
Buildings 15 01218 g020
Figure 21. Relationship between toughness parameters and plastic parameter. (a) Section shrinkage ratio and toughness parameter η; (b) section shrinkage ratio and toughness parameter γ.
Buildings 15 01218 g021
Table 1. Chemical compositions of Q460C (%).
CSPMnSiVNb
0.080.020.021.420.150.100.03
Table 2. Welding parameters.
Welding MethodPositionWire NumberWire Diameter/mmGasCurrent/AVoltage
/V
Preheat Temperature/°CWelding Speed cm/min
Gas shieldedDownhandER55-D2φ1.2CO2260306020–35
Table 3. The type and number of specimens.
Sampling LocationTypeMonotonic TensileCycle ICycle IIQuantity
Weld metalSmooth round barWMWC16
Base metalSmooth round barBMBC16
Table 4. List of test specimens.
SpecimensTypeMonotonic TensileCycle ICycle IIQuantity
Base materialNotch radius d/8BSMBSC1BSC26
Notch radius d/4BMMBMC1BMC26
Notch radius d/2BLMBLC1BLC26
Weld metalNotch radius d/8WSMWSC1WSC26
Notch radius d/4WMMWMC1WMC26
Notch radius d/2WLMWLC1WLC26
HAZNotch radius d/8HSMHSC1HSC26
Notch radius d/4HMMHMC1HMC26
Notch radius d/2HLMHLC1HLC26
Table 5. Monotonic tensile test results.
Labelσy/MPaσu/MPaE/MPadf/mmPf/kNσf/MPaεf
Base metalBM-1453.83600.49194,600.325.85 37,716.661403.211.07
BM-2461.25603.27189,200.176.06 38,332.311329.001.00
BM-3455.53599.03203,100.265.72 38,359.241492.741.12
mean456.87600.93196,000.585.88 38,136.461405.991.06
Weld metalWM-1592.41673.15187,500.397.00 42,088.321093.630.71
WM-2592.20665.39198,100.416.10 35,649.681219.830.99
WM-3603.48671.06166,300.116.40 37,347.741160.930.89
mean596.03669.87184,000.876.50 38,361.511158.130.84
Table 6. The key parameters in the material constitutive relationship.
σy/MPaε1σ1/MPaε2σ2/MPaεfσf/MPaKn/MPan
Base metal461.30.01484.40.30771.30.781329.0925.50.1514
Weld metal603.50.03652.20.30830.00.891160.9939.70.1031
Table 7. Cyclic constitutive model parameters.
σ|0/MPaQ/MPabC1γ1C2γ2C3γ3C4γ4
Base metal461251.251231543101120273031145026
Weld metal603231.516,3494507038185619546329039
Table 8. List of characteristic length.
Characteristic Length/mm
Lower LimitUpper LimitMean
Base metal0.0650.4360.325
Weld metal0.0420.5810.273
Table 9. Cyclic loading test results of Q460C.
MaterialR/mmLoading RegimeSpecimensDisplacement ControlNfδf/mm
Base material1.25C-PTFBSC1-15(−0.125↔0.6)60.822
BSC1-25(−0.125↔0.6)60.823
CTFBSC2-1(−0.125↔0.4)210.401
BSC2-2(−0.125↔0.4)210.403
2.50C-PTFBMC1-15(−0.125↔0.6)61.141
BMC1-25(−0.125↔0.6)61.118
CTFBMC2-1(−0.125↔0.5)260.458
BMC2-2(−0.125↔0.5)250.409
5.00C-PTFBMC1-15(−0.125↔0.6)61.746
BMC1-25(−0.125↔0.6)61.796
CTFBMC2-1(−0.125↔0.75)150.345
BMC2-2(−0.125↔0.75)190.308
Weld metal1.25C-PTFWSC1-15(−0.125~0.35)60.725
WSC1-25(−0.125~0.35)60.826
CTFWSC2-1(−0.125~0.4)230.397
WSC2-2(−0.125~0.4)250.399
2.50C-PTFWMC1-15(−0.125~0.35)61.281
WMC1-25(−0.125~0.35)61.325
CTFWMC2-1(−0.125~0.5)230.445
WMC2-2(−0.125~0.5)220.395
5.00C-PTFWMC1-15(−0.125~0.6)61.713
WMC1-25(−0.125~0.6)61.613
CTFWMC2-1(−0.125~0.75)140.685
WMC2-2(−0.125~0.75)120.672
HAZ1.25C-PTFHSC1-15(−0.125~0.35)60.635
HSC1-25(−0.125~0.35)60.591
CTFHSC2-1(−0.125~0.4)130.335
HSC2-2(−0.125~0.4)120.401
2.50C-PTFHMC1-15(−0.125~0.3)60.896
HMC1-25(−0.125~0.3)60.800
CTFHMC2-1(−0.125~0.5)80.501
HMC2-2(−0.125~0.5)70.503
5.00C-PTFHMC1-15(−0.125~0.6)60.906
HMC1-25(−0.125~0.6)60.917
CTFHMC2-1(−0.125~0.75)80.653
HMC2-2(−0.125~0.75)90.453
Table 10. Ductile parameter calibration of VGM and SMCS.
MaterialR/mmSpecimenδf/mmεp,crσm/MPaσe/MPaTγηmon
Base material1.25BSM-10.9010.67391139.41003.51.142.5653.192
BSM-20.9250.69441149.11016.31.132.6043.269
2.50BMM-11.3850.7329889.61038.10.862.4872.847
BMM-21.4080.7457892.41045.60.852.5212.885
5.00BLM-11.9060.8291809.81070.30.762.5792.518
BLM-21.9230.8382817.81068.20.772.6422.546
Mean2.5102.760
COV5.2%9.6%
Weld metal1.25WSM-10.8450.63091120.8976.31.152.4833.023
WSM-20.8700.64771127.8986.71.142.5163.090
2.50WMM-11.4290.7650898.21057.00.852.5732.943
WMM-21.4130.7521894.41049.00.852.5382.904
5.00WLM-12.0630.9217904.01071.00.843.2662.828
WLM-22.0210.8980881.61071.00.823.0852.744
Mean2.7442.922
COV12.4%4.3%
HAZ1.25HSM-10.7160.50081083.2908.01.192.2502.535
HSM-20.7300.50211086.1915.01.192.2762.589
2.50HMM-11.0250.6017840.0940.80.892.0692.350
HMM-20.9950.5928800.4859.10.931.9502.071
5.00HLM-11.2570.6225663.1908.00.731.6621.713
HLM-21.1350.6083646.4868.50.741.5801.610
Mean1.9652.145
COV14.9%19.4%
Table 11. The material damage coefficient λCVGM.
Base MetalWeld MetalHAZ
λCVGM0.320.370.46
Table 12. Comparison of micromechanical parameters between different steels.
Steelσy/MPaσu/MPaσy/σudf/d0γηmonλCVGM
Q460C456.9600.90.760.582.512.760.30
Q345320.8522.90.610.512.442.550.20
A572-Gr. 50388.2588.10.660.671.181.130.32
A572-Gr. 50422.7494.40.860.522.592.800.11
A514- Gr. 110799.1851.50.940.681.461.500.37
JIS-SN490B Gr. 50338.5475.80.710.494.234.610.31
JIS-SN490B Gr. 50328.2515.10.640.532.892.870.71
HPS70W586.8694.30.850.512.903.190.31
JIS-SM490YB Gr. 50413.0516.40.800.454.675.090.20
Disclaimer/Publisher’s Note: The statements, opinions and data contained in all publications are solely those of the individual author(s) and contributor(s) and not of MDPI and/or the editor(s). MDPI and/or the editor(s) disclaim responsibility for any injury to people or property resulting from any ideas, methods, instructions or products referred to in the content.

