Article

Spatio-Temporal Coupling and Forecasting of Construction Industry High-Quality Development and Human Settlements Environmental Suitability in Southern China: Evidence from 15 Provincial Panel Data

1
School of Civil and Environmental Engineering, Hunan University of Technology, Zhuzhou 412007, China
2
School of Architecture, Changsha University of Science and Technology, Changsha 410076, China
*
Author to whom correspondence should be addressed.
Buildings 2025, 15(14), 2425; https://doi.org/10.3390/buildings15142425
Submission received: 9 June 2025 / Revised: 30 June 2025 / Accepted: 9 July 2025 / Published: 10 July 2025

Abstract

High-quality growth of the construction industry and an improved human settlements environment are essential to sustainable urbanization. Existing studies have paid limited systematic attention to the spatial and temporal dynamics of the coordinated development between the construction industry and human settlements, as well as the underlying factors driving regional disparities. This gap restricts the formulation of precise, differentiated sustainable policies tailored to regions at different development stages and with varying resource endowments. Southern China, characterized by pronounced spatial heterogeneity and unique development trends, offers a natural laboratory for examining the spatio-temporal interaction between these two dimensions. Using panel data for 15 southern provinces (2013–2022), we applied the entropy method, coupling coordination model, Dagum Gini coefficient, spatial trend surface analysis, gravity model, and grey forecasting to evaluate current conditions and predict future trends. The main findings are as follows. (1) The coupling coordination degree rose steadily, forming a stepped spatial pattern from the southwest through the center to the southeast. (2) The coupling coordination degree appears obvious polarization effect, presenting a spatial linkage pattern with Jiangsu-Shanghai-Zhejiang, Hubei-Hunan-Jiangxi, and Sichuan-Chongqing as the core of the three major clusters. (3) The overall Dagum Gini coefficient declined, but intra-regional disparities persisted: values were highest in the southeast, moderate in the center, and lowest in the southwest; inter-regional differences dominated the total inequality. (4) Forecasts for 2023–2027 suggest further improvement in the coupling coordination degree, yet spatial divergence will widen, creating a configuration of “eastern leadership, central catch-up acceleration, and differentiated southwestern development.” This study provides an evidence base for policies that foster high-quality construction sector growth and enhance the living environment. The findings of this study indicate that policymaking should prioritize promoting synergistic regional development, enhancing the radiating and driving role of core regions, and establishing a multi-level coordinated governance mechanism to bridge regional disparities and foster more balanced and sustainable development.

1. Introduction

Amid accelerating global urbanization and the mainstreaming of sustainable development principles, the construction industry—a cornerstone of the national economy—is shifting from quantity-driven expansion to quality-oriented growth [1]. Its development model and construction quality directly determine resource and energy use, environmental outcomes, and the human settlements environment of urban spaces. The former extensive model, marked by high energy demand and emissions, produced sharp spatial disparities and time lags in human settlements’ environmental suitability [2]. In rapidly urbanizing areas, the tension between building density and ecological carrying capacity has become acute. Responding to these challenges, China’s 14th Five-Year Plan (2022) [3] sets the strategic target of “promoting high-quality development of the construction industry” and calls for a low-carbon, circular sector anchored in green, intelligent, and industrialized practices. Concurrently, human settlements’ environmental suitability—an index of a city’s capacity for sustainable development—has become a core benchmark for the new phase of urbanization.
The connotation of high-quality development in the construction industry is inherently multidimensional and requires a comprehensive perspective. From the perspective of endogenous momentum, green development and technological innovation have become the primary drivers of the industry’s high-quality growth. In terms of shared development, the industry must accurately address societal demands, particularly by improving living spaces and infrastructure to ensure that the benefits of development are widely distributed. Regarding scale efficiency, while maintaining stable industrial growth, it is essential to enhance the sector’s contribution to the broader economy and generate employment to support overall social development [4]. In summary, high-quality development in the construction industry demands not only the steady expansion of industrial scale—ensuring that the benefits are equitably shared—but also the construction of a green industrial system and the strengthening of technological leadership. This dual approach can effectively sustain the healthy operation of the national economy and advance social progress. Human Settlements Environment constitutes the fundamental space for human existence and serves as the carrier of social, economic, and environmental development. Broadly defined, the human habitat environment includes the physical space where people live, as well as the surrounding regional environment related to production and daily life. It encompasses not only the physical environment but also factors such as population, resources, ecology, social policies, and economic development [5,6]. Human Settlements Environmental Suitability refers to the extent to which a given area meets the needs of human settlement, fundamentally shaping behavioral patterns, development processes, and the intensity of human activities.
Amid ongoing industrial upgrading, the construction sector’s transition toward high-quality growth has attracted sustained scholarly attention. Most studies build multidimensional indicator systems to quantify development quality in the construction industry [7,8,9,10] and explore its driving mechanisms. Evidence shows that technological innovation [11], regional economic strength [12], and ecological carrying capacity [13] are positively associated with the high-quality development index, although their interactive effects vary by region. The construction sector and the human settlement environment are linked by a “demand-driven–supply-responsive” equilibrium: construction supplies the material space that meets societal demand, and its development model, therefore, shapes spatial-environmental quality. Conversely, the pursuit of a better human settlement environment—guided by policy, technology, and social demand—stimulates industrial upgrading. Research on the human settlement environment has centered on suitability-evaluation frameworks [14,15,16], spatial-distribution analyses [17,18,19], and governance or renewal strategies [20,21,22]. Environmental quality [23], regional industrial economies [24], and spatial design [25] jointly determine the quality of the human settlement environment. These factors not only form the core evaluation dimensions but also transmit quality effects to the construction industry, influencing its future trajectory.
Although recent studies have advanced our understanding of the co-evolution between the construction sector and human settlement systems, important theoretical gaps remain. First, coupling research has typically assessed the coordination between the construction industry subsystem and single dimensions, such as ecological resilience [26], technological innovation [27], or economic development [28], or between human settlements and indicators of economic growth [29,30] and urbanization [31,32]. A systematic framework that captures the two-way interaction between high-quality construction development and settlement quality has yet to be established. Second, most quantitative analyses rely on cross-sectional data and static models, which cannot reveal the temporal dynamics or spatial heterogeneity of the joint evolution of “construction industry transformation” and “human settlement improvement.”
Amid rapid urbanization, promoting the high-quality development of the construction industry alongside the synergistic improvement of human habitat suitability is a critical objective for achieving regional sustainable development. The 15 provinces of southern China exhibit a distinct development gradient: affluent coastal provinces in the east (e.g., Guangdong, Zhejiang), rapidly developing central provinces (e.g., Hubei, Hunan), and less developed western provinces (e.g., Yunnan, Guizhou). This diversity offers an ideal context for analyzing the spatio-temporal coupling between construction industry transformation and human settlement environments. However, existing studies lack a systematic analysis of the spatio-temporal dynamics of the coupling and coordination between the construction industry and human habitat systems in this region. Furthermore, there is insufficient exploration of the deep spatial correlation structures and the mechanisms driving regional disparities. This gap hampers the accurate identification of differentiated challenges and policy needs faced by regions at varying levels of development in advancing sustainable practices. Therefore, based on data availability and prior research, this study selected 15 provinces in southern China as the research scope. Using panel data from 2013 to 2022, it applied the entropy method, the coupling coordination degree model, trend surface analysis, spatial gravity model, Dagum Gini coefficient, and grey forecasting model. These methods are employed to analyze the spatial and temporal variation characteristics of the coupling coordination degree between the high-quality development of the construction industry and human habitat suitability, as well as to explore interaction patterns and their evolutionary trends. The aim was to provide a robust theoretical foundation for promoting high-quality development in the construction industry and enhancing the quality of human settlements.

2. Indicator System Construction and Data Sources

2.1. Study Area

This study focused on 15 provincial-level administrative regions in southern China—including provinces, autonomous regions, and municipalities with provincial status—namely Jiangsu, Zhejiang, Anhui, Fujian, Jiangxi, Hubei, Hunan, Guangdong, Guangxi Zhuang Autonomous Region, Hainan, Chongqing, Sichuan, Guizhou, Yunnan, and Shanghai (Figure 1). The total area of the study region is approximately 2.51 million square kilometers, accounting for 26.2% of China’s land area. As of the end of 2023, the region has a population of 837 million, representing 59.4% of the national population. It is recognized as a strategic region with the highest population density and the most dynamic economic activity in China [33,34]. Focusing on these provinces yields several advantages for analyzing the spatio-temporal coupling between high-quality construction sector growth and living environment suitability. First, the area spans China’s full elevation gradient—from the third step (middle- and lower-Yangtze River plain) to the first step (Yunnan–Guizhou Plateau)—forming a composite “plain–hill–mountain” topography. This spatial heterogeneity imposes different constraints on human settlement construction, providing an ideal research platform to uncover the coupling mechanisms between construction industry development patterns and natural baseline conditions. Second, pronounced stage differences—developed, developing, and less-developed economies—offer multidimensional scenarios for coupling analysis. Third, the region anchors major national strategies such as the Belt and Road Initiative, the Yangtze River Economic Belt, and the Guangdong–Hong Kong–Macao Greater Bay Area; thus, empirical insights can inform national policy optimization.

2.2. Indicator System Construction

Following the principles of systematicity, scientific rigor, and operability, this study constructed a comprehensive evaluation system focused on the interaction between the high-quality development of the construction industry and the suitability of the human habitat. Based on authoritative sources such as the China Statistical Yearbook and the China Construction Industry Statistical Yearbook, the framework and indicator selection drew on methodologies proposed in References [24,26,29,35,36]. After rigorous screening, a dual-system evaluation model comprising 30 indicators was established. The entropy method was employed to determine the weight of each indicator. The selection of specific indicators adhered to the following criteria: (1) systematicity—ensuring coverage of the core dimensions of interaction between the two systems; (2) scientific validity—ensuring that indicators are theoretically grounded and effectively capture the core characteristics of the target dimensions; and (3) operability—prioritizing indicators that are either directly obtainable from authoritative statistical sources or calculable via reliable methods, thereby ensuring data accessibility and both horizontal and vertical comparability (see Table 1).
Based on the principles of sustainable development in the construction industry [26] and the concept of high-quality development [37], the evaluation system for the construction industry’s high-quality development was structured into five dimensions: industrial scale, technological level, economic efficiency, harmonious sharing, and green development. These dimensions, respectively, represent the industry’s fundamental support capacity (industrial scale), innovation-driven capability (technological level), market vitality and operational efficiency (economic efficiency), social inclusiveness and residents’ well-being (harmonious sharing), and the commitment to resource conservation and environmental protection (green development). The habitat suitability evaluation system was divided into four dimensions—social development, living environment, public services, and infrastructure—based on the theory of the Science of Human Settlement [6]. These dimensions were designed to comprehensively capture the region’s social and economic vitality (social development), the quality of residents’ living conditions and ecological environment (living environment), the availability and quality of public services (public services), and the infrastructure that supports the functioning of the system (infrastructure). This dimensioning strategy not only follows a clear theoretical logic and systematically presents the internal structure of the system but also facilitates in-depth analysis of the contribution of each sub-dimension to the overall evaluation and its evolutionary trends.

2.3. Data Sources

This study examined 15 provincial-level units in southern China and systematically analyzed the coupling and coordination between high-quality construction industry development and regional human settlement environment systems in the area. Based on their geographical characteristics, the provinces were grouped into three subregions: the southeastern coast, the central inland belt, and the southwestern highlands. Data were drawn from the China Statistical Yearbook, the China Construction Industry Statistical Yearbook, and provincial statistical reports from 2013 to 2022. Standard interpolation was used to impute the few missing values, ensuring a complete and reliable dataset.

3. Methods

3.1. Entropy Method

When evaluating the coupling characteristics between two complex systems—the high-quality development of the construction industry and the suitability of the human settlement environment—it is necessary to comprehensively consider multiple indicators, which often differ in scale and information value. Although the entropy weight method has limitations, such as an overreliance on the statistical characteristics of the data while neglecting the practical significance and contextual meaning of certain indicators, it was adopted in this study to objectively determine indicator weights. This approach minimizes subjective bias and ensures a more reliable evaluation of the overall performance of the multi-indicator system. As an objective weighting method based on the information entropy theory, the core idea of the entropy method is to use the calculation results of information entropy to measure the variation range of the evaluation results of various indicators and the degree of contribution of the effective information they provide, thereby determining the relative importance of the indicator in the comprehensive evaluation system. According to information entropy theory, if the numerical differences in evaluation objects for a particular indicator are more significant, the corresponding entropy value is smaller, indicating that the indicator conveys more effective information, and its weight allocation should accordingly increase. Conversely, if the observed values for a particular indicator are more convergent, the entropy value is larger, reflecting that the indicator has lower discriminative power and provides limited information, so its weight should also be reduced. This objective weighting method, based on the statistical characteristics of the data, is particularly suitable for comprehensive evaluations involving multiple indicators. It effectively captures the actual informational contribution of each indicator. The specific steps are as follows:
  • Standardize the indicators;
Positive indicator:
y i j = x i j m i n x i j m a x x i j m i n x i j
Negative indicator:
y i j = m a x x i j x i j m a x x i j m i n x i j
In the formula, y i j is the jth indicator after standardization, and m a x x i j and m i n x i j represent its maximum and minimum values.
2.
Calculate the proportion of the standardized value of indicator j;
P i j = y i j i = 1 m y i j
3.
Calculate information entropy e j and information utility value d j ;
e j = 1 ln n i = 1 n P i j ln P i j
d j = 1 e j
4.
Calculate the weightings of each indicator;
ω j = d j i = 1 n d j

3.2. Coupling Coordination Model

The coupling coordination degree model emphasizes the comprehensive and intrinsic development convergence and hierarchical structure of systems and can reveal the coordination status of interactions between systems [38]. This study uses the coupling coordination degree model to analyze the coordination relationship between high-quality development in the construction industry and the human settlement environmental suitability, referring to the methods in [39] and [29]. The calculation formula is as follows:
  • Calculate the comprehensive evaluation value of high-quality development in the construction industry and the human settlement environmental suitability:
U j = j = 1 n ω j Y j
Y j is the standardized value of the jth indicator, and ω j is the weight of each indicator.
2.
Calculate the coupling degree:
C = 2 × U 1 U 2 U 1 + U 2 2
U 1 and U 2 represent the comprehensive evaluation value of high-quality development in the construction industry and the human settlement environmental suitability. The value range of C is 0 to 1. The larger the value of C, the higher the degree of coupling is between the two indicators and the stronger their mutual interaction.
3.
Calculate the coordination degree:
T = α U 1 + β U 2
D = C × T
In the formula, C represents the coupling degree, and T represents the comprehensive coordination index between systems. This study considered that high-quality development in the construction industry and the human settlement environmental suitability interact with each other and hold equal status; therefore, α = β = 0.5. Referring to relevant studies [40], the coupling coordination degree classification standards are established as shown in Table 2.

3.3. Spatial Trend Surface Analysis

Trend surface analysis applies smooth mathematical surfaces to model the spatial distribution of observed values, thereby revealing their geographic trends. In this study, it is employed to examine the overall spatial divergence in the coupling coordination degree between high-quality development of the construction industry and the human settlement environmental suitability.

3.4. Gravity Model

The gravity model, a mathematical tool for analyzing and predicting spatial interaction, is widely applied across various research domains. Building on previous studies [41], this study employed the gravity model to quantify the spatial linkage strength of the coupling coordination degree between high-quality development in the construction industry and the suitability of the human living environment, as expressed in the following formula.
R i j = K × E i × E j T i j 2
R i j represents the spatial connection of the coupling coordination between provinces i and j. Variables E i and E j denote the coupling coordination degrees of high-quality development in the construction industry and suitability of human settlements for provinces i and j, respectively. T i j is the spatial distance between provinces i and j. K denotes the gravitational constant.

3.5. Daugm Gini Coefficient

The Dagum Gini coefficient method and its subgroup decomposition method were used to calculate and decompose regional differences in the level of coupling and coordination between high-quality development of the construction industry and the human settlement environmental suitability in southern China from 2013 to 2022. The calculation results can reflect the relative differences in the degree of coupling and coordination and the sources of these differences.
G = j = 1 k j = 1 k i = 1 n j r = 1 n k y i j y h r 2 n 2 y
G w = j = 1 k G j j q j l j
G b = j = 2 k h = 1 j 1 G j h q j l h + q h l j D j h
G t = G j h q j l h + q h l j 1 D j h
In the formula, G is the overall Gini coefficient, n is the number of provinces, k is the number of regions, and y i j is the coupling coordination degree of the ith province in region j.

3.6. Grey Forecasting GM(1,1) Model

As a classic forecasting method for handling small sample data, the grey forecasting model systematically mines and deeply develops the intrinsic evolutionary laws of limited information to construct a dynamic evolutionary model with exponential characteristics, demonstrating significant advantages in short-term forecasting [42]. This study employs the model to predict the coupling coordination degree between the high-quality development of the construction industry and human habitat suitability in the southern region.
Let the original sequence be X 0 , and accumulate to generate a new sequence X 1 .
X 0 = X 0 1 ,   X 0 2 ,   ,   X 0 n ,     X 0 k 0 , k = 1,2 , , n
X 1 = X 1 1 , X 1 2 , , X 1 n ,   X 1 k = i = 0 k X 0 i , k = 1,2 , , n
a , b T = B T B 1 B T Y is obtained by least squares fitting, Y = X 0 2 , X 0 3 , , X 0 n 2 , and B is a constructed data matrix.
Substitute a and b into the time response equation to obtain the predicted value X ¯ 1 k + 1 .
X ¯ 1 k + 1 = X 0 1 b a a k + b a
Take the derivative of the predicted value of the cumulative value obtained from X ¯ 1 k + 1 to obtain the predicted value of the original data in period k + 1 , and finally perform residual testing and post-residual testing.

4. Results and Discussion

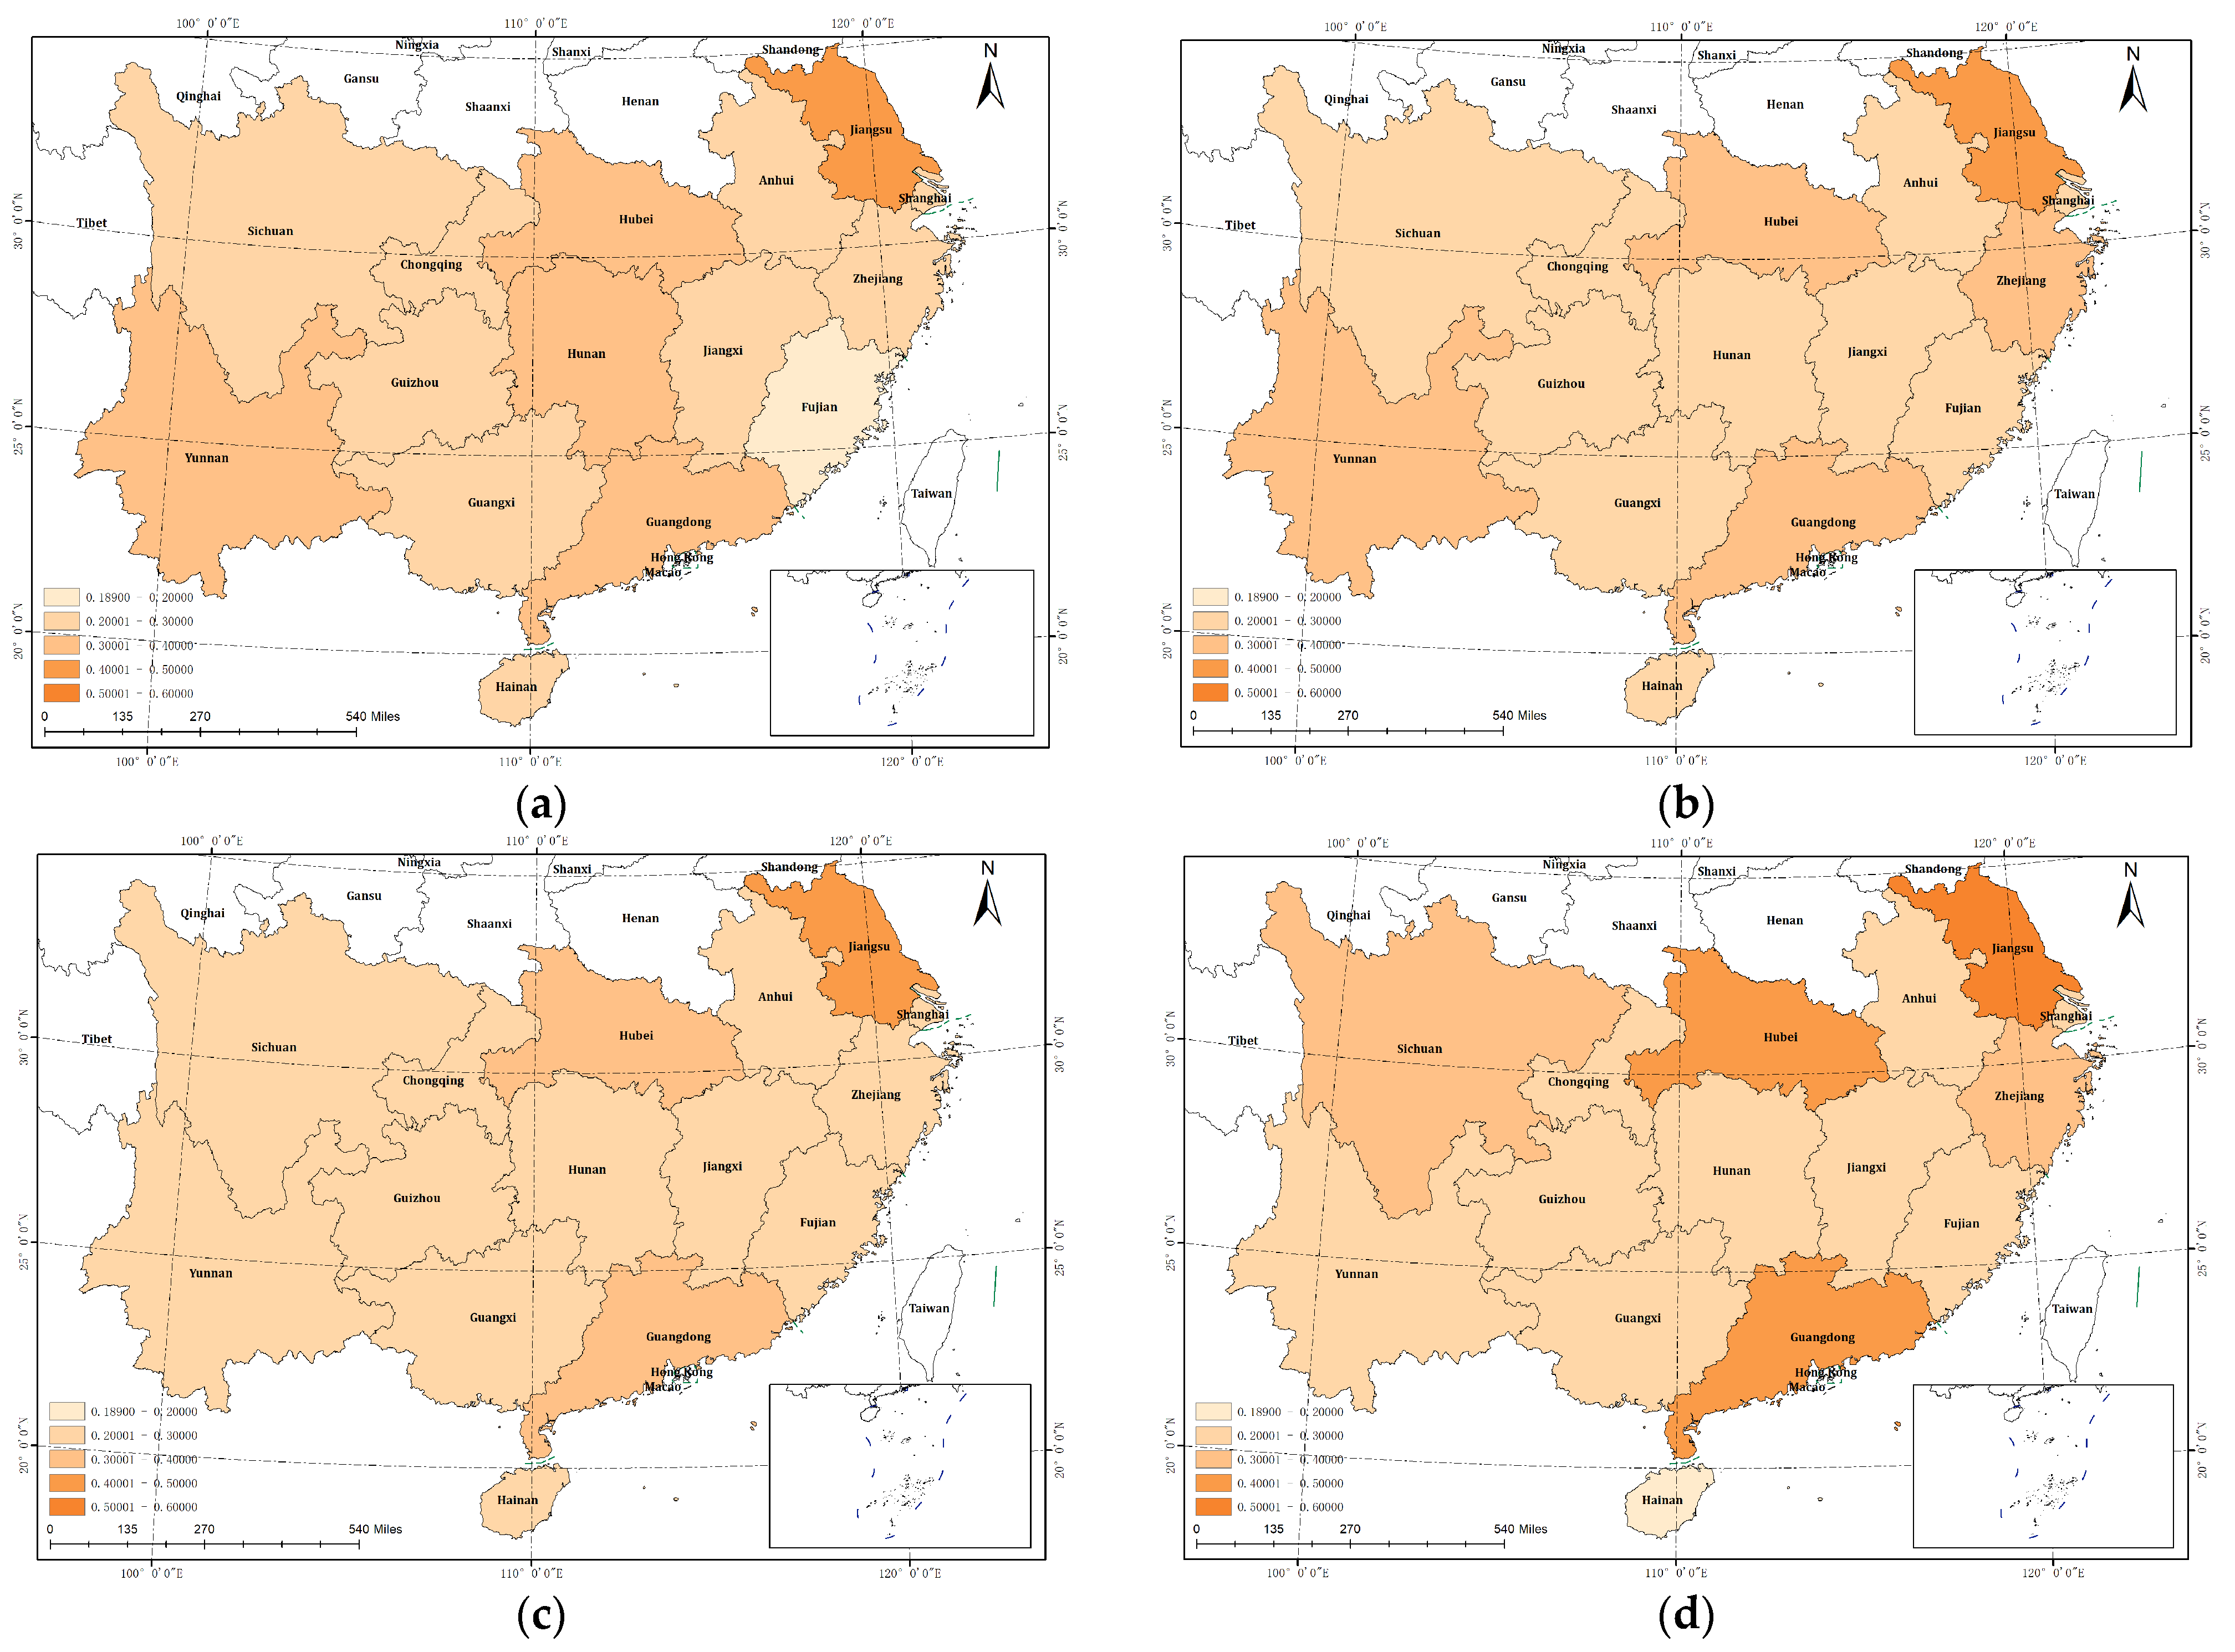
4.1. Analysis of the Spatio-Temporal Evolution of High-Quality Development in the Construction Industry and the Human Settlement Environmental Suitability

Using the previously constructed indicator system for high-quality construction development and human settlement environmental suitability, we analyzed panel data for 15 southern Chinese provinces (2013–2022). We computed composite scores and coupling coordination indices with the entropy-weighting method and the coupling coordination model. To capture spatial dynamics, we visualized results for four benchmark years—2013, 2016, 2019, and 2022.
Based on the calculation results of the comprehensive evaluation value of the construction industry in 15 southern provinces of China from 2013 to 2022 (Figure 2) and its spatial distribution (Figure 3), it can be seen that the development levels of the construction industry vary markedly in both space and time. From a temporal perspective, the overall trend of the comprehensive value of the construction industry in each province shows a fluctuating upward trend, albeit unevenly. Among them, Jiangsu and Guangdong recorded the fastest gains, reaching 0.517 and 0.423 in 2022—up 19.6% and 31.5% from 2013. This rapid growth is deeply intertwined with the ongoing optimization of local economic structures and robust policy support. Zhejiang dipped briefly between 2017 and 2019 but recovered to 0.317 by 2022. Compared with the southeastern coastal regions, most central and southwestern provinces lagged, with some provinces seeing slight declines in their composite values. Yunnan and Guizhou posted scores of only 0.274 and 0.236 in 2022, less than half that of Jiangsu, highlighting the severity of regional development imbalances. In terms of spatial distribution, the comprehensive evaluation value of the construction industry exhibits a pattern of “high levels in the east, slow development in the west, and prominent advantages in coastal regions.” The Yangtze River Delta (Jiangsu, Zhejiang, Shanghai) and the Pearl River Delta (Guangdong) form the high-value core, whereas Yunnan, Guizhou, and Guangxi remain in the low-value range, reflecting limited infrastructure and slower industrial upgrading.
According to the evaluation results (Figure 4 and Figure 5), human settlement environmental suitability improved steadily in all 15 southern provinces between 2013 and 2022. Jiangsu recorded the largest gain in its human settlement environment suitability level, with its index rising from 0.402 to 0.723, a result of strong policy guidance and investments in human settlement environment construction. Guangdong followed, reaching 0.634 in 2022—an 82.1% increase since 2013—illustrating the Pearl River Delta’s exemplary role in fostering livable cities. Spatially, human settlement environmental suitability exhibits a “multi-centre, co-evolutionary” pattern: the eastern coastal provinces (Jiangsu, Zhejiang, Guangdong) and the central inland provinces (Hubei, Hunan) form two high-value growth hubs. By contrast, although Guizhou and Yunnan grew quickly, their 2022 scores remained below 0.500, underscoring the persistent challenges that remote southwestern areas face in upgrading the living environment.

4.2. Coupling Coordination Temporal Evolution

Building on the 2013–2022 dataset of construction industry quality and human settlement environmental suitability assembled in the preceding study, we applied the coupling coordination model to examine their interaction. We analyzed the synergistic interaction between the two systems from the dual dimensions of temporal dynamics and spatial heterogeneity and, by incorporating regional economic strength, policy orientation, and resource endowment, identified the internal driving mechanisms of their spatio-temporal evolution.
During the observation period, coordination efficiency across the 15 southern provinces rose steadily. Its evolution trajectory exhibited a phased characteristic of “stable accumulation in the early stage and accelerated breakthrough in the later stage.” The mean coupling coordination index increased from 0.507 in 2013 to 0.622 in 2022, signifying a shift from low to moderate coordination and a clear enhancement in the performance of the construction–human settlement environment system. A period-by-period analysis reveals that growth between 2018 and 2022 outpaced that of 2013 to 2017, highlighting the combined impetus of policy guidance and technological innovation (Figure 6).
When viewed by region, the three major regions follow markedly different trajectories. The south-eastern coast continues to lead in terms of coupling coordination, advancing on a consistently stable path. Flagship provinces—Jiangsu and Guangdong—lifted their indices from 0.646 and 0.579 to 0.782 and 0.720, respectively, and crossed into the favorable coordination tier after 2017, a transition underpinned by deep industrial bases and sustained investment in technological innovation. The central belt displays a more erratic but upward course: Hubei and Hunan raised their indices from 0.545 and 0.497 to 0.679 and 0.620, whereas resource-constrained Jiangxi remained low coordinated in 2022, exposing intra-regional imbalance. In the south-west, coupling coordination improved markedly, yet from a low starting point. Sichuan and Yunnan progressed from low to moderate coordination, but Guizhou and Guangxi, hampered by ecological carrying capacity limits, reached only 0.569 in 2022—still below the threshold for coordinated development.

4.3. Coupling Coordination Spatial Differentiation

Building on the temporal analysis of coupling coordination evolution, we combined spatial visualization and regional comparison to dissect the spatial heterogeneity in the interaction between high-quality construction industry development and human settlement environmental suitability for 2013–2022. Four benchmark years—2013, 2016, 2019, and 2022—were visualized (Figure 7). The analysis indicates that, during the study period, the spatial distribution of the coupling coordination between the two systems exhibited the characteristics of a “stable gradient pattern” and a prominent core-periphery structure.
The level of coordination among the three major regions follows a distinct hierarchy—south-eastern coast > central inland belt > south-western fringe. By 2022, the south-eastern mean coupling coordination index had reached 0.646. Within this zone, Jiangsu and Guangdong function as twin growth poles, already in the intermediate-coordination stage; through technological diffusion and industrial-chain spillovers, they propel neighboring provinces such as Zhejiang and Fujian, thereby shaping a “coastal innovation corridor.” The central and south-western belts remain largely at the primary-coordination stage. In the center, Hunan and Hubei act as focal nodes, whereas Jiangxi and Anhui display weak momentum that demands reinforcement. In the south-west, peripheral provinces such as Guizhou and Guangxi have long stagnated at low coordination, revealing a structural mismatch in which improvements in the human settlement environment lag behind industrial transformation. Strong spatial lock-in—rooted in fragile infrastructure, limited economic resilience, and sustained out-migration—continues to hamper their progress.

4.4. Coupled Coordination of Spatial Connections

Spatial trend surface analysis was employed to examine the overall spatial evolution of the coupling coordination degree between high-quality development in the construction industry and the suitability of the human living environment (Figure 8). The X-, Y-, and Z-axes represent the eastward direction, the northward direction, and the value of the coupling coordination degree, respectively. The analysis reveals that, overall, the spatial trend in the east-west direction evolves from a “U”-shaped pattern to a diagonal orientation, with a narrowing gap between the lowest and highest values. In the north–south direction, the trend transitions from an inverted “U” shape to a diagonal form and shows a potential tendency to shift toward a regular “U” shape. Notably, both directional trends exhibit considerable volatility, indicating pronounced regional disparities in the spatial distribution of the coupling coordination between construction industry development and the suitability of the human environment in southern China. Overall, spatial equilibrium remains low.
To further elucidate the characteristics of spatial linkages, the gravity model was employed to assess the spatial connection strength of the coupling coordination degree between high-quality development in the construction industry and the suitability of the human habitat. The connection strength was classified into five levels using the natural breaks (Jenks) classification method: strong, good, moderate, low, and weak (Figure 9). Overall, the spatial connection strength in southern China exhibits a clear polarization effect. The spatial distribution forms a chain-like structure centered around three major clusters: Jiangsu–Shanghai–Zhejiang, Hubei–Hunan–Jiangxi, and Sichuan–Chongqing. These clusters consistently maintained strong connections throughout the period from 2013 to 2022.
In 2013, Jiangsu exhibited the strongest spatial linkage between high-quality development in the construction industry and the coordination with human habitat suitability. The most robust interprovincial linkages were observed between Shanghai–Zhejiang and Jiangsu–Anhui, with Hubei and Chongqing also maintaining relatively strong connections with adjacent provinces. By 2016, the spatial linkage network had expanded, and interprovincial linkage strength generally increased, forming three major regional clusters: Jiangsu–Zhejiang–Shanghai–Anhui, Hunan–Hubei–Jiangxi, and Sichuan–Chongqing–Guizhou. In both 2019 and 2022, the chain-like network pattern of strong linkages remained largely stable, with Jiangsu–Anhui and Shanghai–Zhejiang continuing to exhibit the strongest connections. Overall, the formation and evolution of spatial linkage patterns are strongly influenced by geographic proximity. The southeastern coastal cluster (Jiangsu–Shanghai–Zhejiang), the central cluster (Hubei–Hunan–Jiangxi), and the southwestern cluster (Sichuan–Chongqing) consistently demonstrate strong internal and inter-cluster synergies due to locational advantages. Conversely, Yunnan and Guangxi, located on the southwestern periphery, along with Hainan in the far south, exhibit weaker spatial linkages with other provinces, primarily due to geographic isolation and limited transportation accessibility. This pronounced disparity in interregional linkage strength presents a significant challenge to fostering coordinated development between high-quality construction industry growth and habitat suitability in southern China.

4.5. Coupling Coordination Regional Differences

Building on the preceding analysis of spatio-temporal patterns and dynamic evolution in the coupling coordination between high-quality construction industry development and human settlement environmental suitability, we employed the Dagum Gini coefficient to track shifts in regional inequality. Specifically, Gini values were calculated for the entire southern area and for each of its three major regions over 2013–2022 (Table 3).
Overall, the Gini coefficient for southern China exhibited a downward trend, decreasing from 0.068 to 0.058. This decline clearly indicates a gradual narrowing of regional disparities in the coupling coordination between high-quality construction industry development and human settlement suitability.
The evolution of internal regional disparities exhibits a significant gradient pattern. The south-eastern coast posts the highest mean Dagum Gini coefficient (0.071) during 2013–2022, far above the central (0.0366) and south-western (0.0361) belts. The coupling coordination of the south-east not only exceeds that of the other two regions, but this trend is expanding. The differences in coupling coordination degree between the central and southwestern regions are not significant. Specifically, the Gini coefficient in the southeastern region fluctuated slightly during the study period, rising from 0.063 to 0.082 overall. Central-region inequality traces an inverted-U path: it edged up through 2016, then declined each year to 2022. The south-west shows the sharpest convergence, its Gini coefficient dropping from 0.058 to 0.025. This pattern of differences indicates that the gap in coupling coordination between the high-quality development of the construction industry and the suitability of the living environment in the southeastern coastal region is widening annually, while the gap in the central and southwestern regions is narrowing. Among these, the reduction in internal differences within the southwestern region is greater than that in the central region.
From a regional perspective, substantial disparities exist in the coordination levels among the three major regions. The average inter-regional Gini coefficient is highest between the southeast–southwest regions (0.0807) and lowest between the central–southwest regions (0.0431). Over time, the Gini coefficients for the southeast–southwest and central–southwest regional pairs have shown a declining trend, whereas the disparity between the southeast–central regions has exhibited minor fluctuations and remained relatively stable.
In terms of contribution rate, group-group differences had the highest average contribution rate to overall coupling coordination. Although showing a downward trend, they remained the dominant factor influencing differences in regional overall coupling coordination. Conversely, the contribution rate attributable to intra-group disparities edged upward, implying that coupling coordination gaps within individual regions were widening. Finally, the steady increase in the contribution of the super-variable-density component indicates that spatial polarization intensified over the study horizon.

4.6. Coupled Coordinated Development Forecast

Drawing on time series data of the coupling coordination degree for 15 southern provinces from 2013 to 2022, derived from the previously established evaluation system, this study applied the GM(1,1) model to forecast the dynamic evolution of the coordination level between high-quality development in the construction industry and the suitability of the living environment for the period 2023–2027 (results shown in Figure 10). Empirical validation demonstrates that the model maintains an average relative error below 5%, a posterior error ratio (C) consistently under 0.5, and a probability of small error (p) exceeding 0.95, indicating strong statistical reliability. These results offer forward-looking insights to inform regional sustainable development policymaking.
According to the results of the grey forecasting model, the overall trajectory of high-quality development in the construction industry—and its coordination with the suitability of the living environment—in 15 southern Chinese provinces is expected to continue rising from 2023 to 2027, albeit with marked interprovincial disparities. During the forecast period, the coupling coordination degree in all provinces is projected to increase steadily, reflecting a generally positive trend in the integrated development of construction and human settlement systems. By 2027, Jiangsu and Guangdong are anticipated to reach the “favorable coordination” level, with Jiangsu approaching the threshold for “excellent coordination.” Zhejiang, Hubei, and Sichuan are expected to achieve the “favorable coordination” level, while the remaining provinces are likely to remain in the low or moderate stages of coordinated development.
From the perspective of spatial pattern evolution, provincial coupling coordination and integration levels exhibit the typical pattern of “eastern provinces leading development, central provinces accelerating catch-up, and southwestern provinces experiencing internal differentiation.” The southeastern region continues to dominate in overall coordination. Jiangsu and Guangdong, leveraging their strengths in export-oriented economies and technological innovation, have established a dual-core model of “high-quality coordination and high growth,” thereby sustaining their developmental leadership. Zhejiang and Fujian are steadily progressing toward the favorable coordination level. Hainan, despite showing improvement, remains the only province in the region at a low coordination level due to geographical constraints and the limited effectiveness of policy implementation. In the central region, Hubei and Hunan, benefiting from their strategic locations within the Yangtze River Economic Belt, are actively absorbing industrial transfers from eastern provinces, which has led to rapid enhancements in their coordination levels. By 2027, they are projected to approach the upper thresholds of the favorable and moderate coordination levels, respectively. Anhui and Jiangxi demonstrate a “low initial value but high growth rate” development trajectory, contributing to improved internal regional balance. The southwestern region continues to lag in overall coordination. Among its provinces, only Sichuan is expected to reach the favorable coordination level by 2027. Guizhou, Yunnan, and Guangxi are projected to remain in the moderate coordination range, constrained by persistent challenges to regional integration and development.

5. Conclusions

5.1. Research Conclusions

This study focused on 15 provinces in southern China and constructed an evaluation index system for the high-quality development of the construction industry and the suitability of the living environment, drawing on established research. The entropy method was employed to determine comprehensive weights, and the temporal and spatial characteristics of the two systems were analyzed. The coupling coordination degree between the two systems was calculated using the coupling coordination degree model, enabling the exploration of spatio-temporal disparities in their development across southern China. To assess regional variation, the Dagum Gini coefficient and its subgroup decomposition were applied to measure and decompose disparities in the coordination level between the construction industry and the living environment. Finally, the GM(1,1) grey forecasting model was used to predict future trends in coupling coordination for each province, aiming to provide practical and actionable recommendations for promoting sustainable development in both the construction sector and the living environment. The following key conclusions were drawn:
  • The overall trend for both systems is positive: comprehensive evaluation scores for the high-quality development of the construction industry and the suitability of the human environment increased throughout the study period. The construction industry’s evaluation scores significantly surpass those of the southeastern coastal provinces, particularly in the Yangtze River Delta and Pearl River Delta, underscoring the leadership of these developed regions. Meanwhile, the human environment suitability exhibits a “multi-center synergistic enhancement” pattern. However, some remote areas lag due to weaker foundational conditions.
  • The degree of coupling coordination between the high-quality development of the construction industry and the suitability of the human environment has steadily improved, though significant regional disparities persist. It has progressed from a barely coordinated stage to primary coordination. Spatially, a developmental gradient is evident, spanning the southeast, central, and southwest regions. The southeast has experienced the fastest improvement, benefiting from multiple advantages, while the central and western regions lag behind due to foundational limitations and weaker innovation capacity.
  • Spatial connectivity and polarization coexist in the coupling coordination between high-quality development of the construction industry and habitat suitability, exhibiting significant volatility in spatial trends. The spatial distribution reveals three major linkage clusters centered on Jiangsu-Shanghai-Zhejiang, Hubei-Hunan-Jiangxi, and Sichuan-Chongqing, while pronounced regional polarization remains evident.
  • Overall disparities are narrowing, yet relative regional differences are increasing. The overall Dagum Gini coefficient shows a downward trend, indicating a gradual reduction in coupling coordination disparities. While intergroup differences previously dominated regional disparities, by 2022, the contribution of hypervariance density surpassed that of intergroup differences, signaling an increase in relative regional inequality.
  • Future improvements are expected, but divergence will persist. From 2023 to 2027, the overall coupling coordination degree is projected to increase, with all provinces experiencing varying degrees of growth. However, significant regional differentiation remains, characterized by a pattern of “eastern China leading development, central China accelerating its catch-up, and southwestern China experiencing internal divergence”.

5.2. Suggestion

There remains substantial potential to enhance the coordination between high-quality development in the construction industry and the suitability of the living environment. Based on the research findings, the following measures can be implemented to further improve the level of integration between these two systems.
  • Implementation of Differentiated Synergistic Strategies: Policy design should emphasize regional heterogeneity and narrow the coordination gap between the southeastern coast and the central and western provinces. Specifically, the southeastern region should promote upgrading the construction industry toward intelligent, green, and low-carbon technologies, accelerating the adoption of cutting-edge innovations. The southwestern region requires increased financial transfers and industrial support to encourage local initiatives tailored to low-carbon building systems suited to regional characteristics. The central region should prioritize accepting technology transfers from the east, cultivating local innovation capacity, establishing regional science and technology innovation platforms, and optimizing the business environment to attract construction industry investments.
  • Strengthen the radiation-driven role of core regions: Leveraging the economic influence, technical resources, and capital advantages of the Yangtze River Delta, Guangdong, and the Hong Kong-Macao Bay Area, promote the establishment of a cross-provincial cooperation mechanism linking the construction industry and human habitat. Encourage leading enterprises and research institutions in the east to provide targeted support to the central and western provinces to address their technological, talent, and capital constraints.
  • Establish a multi-level coordination and governance mechanism: At the national level, a coordinated action program has been formulated to promote the high-quality development of the construction industry and improve human habitat, featuring clear key indicators and assessment mechanisms. At the provincial level, detailed implementation plans integrate the strengths of housing and construction, development and reform, natural resources, and ecological environment departments. At the municipal level, a government-led coordination mechanism is encouraged, involving enterprises, communities, and the public to promote green building adoption, enhance public participation in habitat governance projects, and ensure effective policy implementation at the grassroots.

5.3. Shortcomings and Outlook

This study constructed a multidimensional evaluation system to reveal the spatial and temporal variations and developmental patterns in the coupling between high-quality development of the construction industry and human habitat suitability in southern China. However, data and methodological limitations present several shortcomings: spatial and temporal constraints in data acquisition (panel data do not capture the most recent conditions and obscure differences at the municipal level); insufficient analysis of driving mechanisms (emphasis on spatial-temporal patterns and forecasting but lacking in-depth exploration of key interactions); and forecasting model limitations (the grey forecasting model inadequately accounts for exogenous policy impacts, such as carbon neutrality and new urbanization). Future research should adopt finer spatial scales to examine regional disparities more thoroughly, integrate multiple models to systematically analyze key driving factors, and enhance decision-making foundations. Additionally, developing a multi-scenario forecasting framework combining various models will improve forecast reliability and decision-support capabilities, thereby advancing research and providing robust scientific guidance for promoting high-quality construction industry development and sustainable human habitats.

Author Contributions

Conceptualization, K.C. and B.C.; methodology, K.C. and B.C.; software, W.C. and B.C.; validation, K.C., B.C. and W.C.; writing—original draft preparation, B.C.; writing—review and editing, K.C.; visualization, W.C.; funding acquisition, K.C. All authors have read and agreed to the published version of the manuscript.

Funding

This research was funded by the Hunan Provincial and Municipal Joint Fund (grant number 2023JJ50170).

Data Availability Statement

The raw data used or analyzed during this study are available from the authors on reasonable request.

Conflicts of Interest

The authors declare no conflicts of interest.

References

  1. Ministry of Housing and Urban-Rural Development of the People’s Republic of China. The “14th Five-Year Plan” for the Development of the Construction Industry. Available online: https://www.mohurd.gov.cn/gongkai/zc/wjk/art/2022/art_17339_764285.html (accessed on 9 May 2025).
  2. Liu, S.; Kwok, Y.T.; Ren, C. Investigating the impact of urban microclimate on building thermal performance: A case study of dense urban areas in Hong Kong. Sustain. Cities Soc. 2023, 94, 104509. [Google Scholar] [CrossRef]
  3. The State Council of the People’s Republic of China. Outline of the Fourteenth Five-Year Plan for the National Economic and Social Development of the People’s Republic of China and the Vision 2035. Available online: https://www.gov.cn/xinwen/2021-03/13/content_5592681.htm (accessed on 9 May 2025).
  4. Li, Y.F.; Zhang, W.C. Evaluation of High Quality Development Level of Construction Industry Based on Entropy Weight-Topsis Method:—A Case Study of Anhui Province. J. Hebei Inst. Archit. Civ. Eng. 2024, 42, 198–203. [Google Scholar]
  5. Wu, L.Y. Search for the theory of Science of Human Settlement. Planners 2001, 17, 5–8. [Google Scholar]
  6. Wu, L.Y. Introduction to Sciences of Human Settlements; China Architecture & Building Press: Beijing, China, 2001. [Google Scholar]
  7. Wang, D.; Cheng, X. Study on the path of high-quality development of the construction industry and its applicability. Sci. Rep. 2024, 14, 14727. [Google Scholar] [CrossRef]
  8. Shan, C.; Zhou, Q.; Gao, W.C. Analysis of Hot Spots and Trends in Research of High-quality Development of Construction Industry in China. J. Putian Univ. 2024, 31, 23–28. [Google Scholar]
  9. Hu, S.L.; Shi, L.; Zheng, X.X.; Zhang, G.X.; Pu, Y.N. Evaluation of High Quality Development of the Construction Industry Based on Cloud Element Model. Archit. Des. Manag. 2023, 40, 8–15. [Google Scholar]
  10. Wu, X.H.; Zhang, L.T. Research on Comprehensive Evaluation of the High-quality Development of Construction Industry: Take Jiangsu Province as an Example. Constr. Econ. 2021, 42, 20–26. [Google Scholar]
  11. Zhng, L.X.; Zhang, J.R. Evolution and Influencing Factors of High-quality Development of Construction Industry in China. Areal Res. Dev. 2024, 43, 1–8. [Google Scholar]
  12. Chen, T.; Zhang, Y.; Ma, T.T.; Liu, S.Y. Research on the Coupling and Coordination between Yunnan Province’s Construction Industry and High Quality Economic Development. Constr. Econ. 2024, 45, 50–55. [Google Scholar]
  13. Duan, Z.Z.; Wang, H.Y.; Zhou, W.W. Study on Coordinated Development of Construction, Economy, Resource Environment in Anhui Province. J. Tangshan Univ. 2022, 35, 79–86. [Google Scholar]
  14. Cheng, S.J.; Wang, L.L.; Zhu, Z.L. Satisfaction and influencing factors of rural human settlement environment in ecological immigrant areas: A case study of 65 villages in Hongsibu District. J. Agric. Resour. Environ. 2025, 42, 1–16. [Google Scholar] [CrossRef]
  15. Zhen, J.H.; Tian, T.Y. Assessment of Human Settlement Environmental Suitability for Inner Mongolia Pastoral Areas—Taking Xilingol as an Example. Res. Soil Water Conserv. 2024, 31, 384–394. [Google Scholar]
  16. Zhu, T.Y.; Jiang, G.H.; Cao, J.W. Evaluation of Rural Human Settlement Resilience and Analysis of Barrier Factors in China. Ecol. Econ. 2024, 40, 89–96. [Google Scholar]
  17. Chen, H.; Ren, X. Research on the Temporal-Spatial Evolution and Obstacle Factors of the Coordinated Development of Rural Human Settlements and Economy. Ecol. Econ. 2024, 40, 184–195. [Google Scholar]
  18. Chen, X.X.; He, J.C.; Lu, J.; Duan, J.H. Characteristics of Habitat Environment and Comprehensive Protection Strategy of Traditional Villages in Chongqing. J. Resour. Ecol. 2024, 15, 1607–1617. [Google Scholar]
  19. Zhang, Z.H.; Wu, H. Spatial characteristics and influencing factors of living environment in Cave River Basin. Landscape Archit. 2025, 32, 1–15. [Google Scholar]
  20. Li, B.H.; Zou, L.; Cheng, B.; Dou, Y.D. Cognitive reconstruction and practical exploration of the renewal of traditional village residential environ-ment: Taking Gaoyi Village as an example. Geogra. Sci. 2025, 45, 315–325. [Google Scholar]
  21. Mao, P.J. Function Orientation and Construction Path of a Long-Term Management and Protection Mechanism for Rural Living Environment. Southeast Acad. Res. 2024, 37, 149–159. [Google Scholar] [CrossRef]
  22. Zhang, L.; Zuo, Y.; Liu, B.Y. Evolution Mechanisms and Development Strategies of Local Human Residential Environment Landscape in the Jiangnan Canal Basin. Chin. Landscape Archit. 2025, 41, 31–38. [Google Scholar]
  23. Ren, L.; Dong, X.; Xu, Y.Y.; Yang, S.Z. Study on the Spatial and Temporal Evolution Characteristics of the Resilience of Rural Habitat System in Ecologically Fragile Areas and Mechanism of Influence—Taking the Loess Plateau of Northern Shaanxi as an Example. Chin. J. Agri. Resour. Reg. Plann. 2024, 45, 1–20. [Google Scholar]
  24. Cong, X.P.; Wang, Y.X.; Yang, J.; Tian, S.Z. Coordinated relationship between tourism economy and human settlements resilience in the Bohai Rim cities. J. Chin. Ecotourism 2024, 14, 1086–1102. [Google Scholar]
  25. Cai, J.; Shen, Y.X.; Liu, Z.A. Research on the Design of Rural Public Spaces Based on Environmental Behavior Theory—Taking Fumin Lengfanqiao Village as an Example. Ind. Des. 2025, 21, 73–76. [Google Scholar]
  26. Wang, J.; Bai, W.C.; Wei, X.S. Spatial-temporal Distribution Pattern and Dynamic Evolution of the Coupling Coordination Degree between High-quality Development of the Construction Industry and Ecological Resilience. Environ. Sci. 2025, 50, 1–20. [Google Scholar] [CrossRef]
  27. Zhang, A.A.; Wang, Z.Y. Evaluation and Regional Difference Analysis of the Coupling and Coordinated Development of New Quality Productivity and Construction industry. J. Green Sci. Technol. 2025, 27, 274–280. [Google Scholar] [CrossRef]
  28. Liu, Y.; Cheng, W.J. The coupling and coordination relationship of digital economy and high-quality development of the construction industry from the perspective of Yangtze river delta region. J. Fuyang Norm. Univ. (Nat. Sci.) 2025, 42, 72–79. [Google Scholar] [CrossRef]
  29. Wei, H.Q.; Wu, L.; Zhang, L. Spatial Relationship of Coupling Coordination between Human Settlement Environment and Digital Economy: A Case Study of Urban Agglomeration and Surrounding Cities in the Middle Reaches of the Yangtze River. Resour. Environ. Yangtze Basin 2024, 33, 2112–2126. [Google Scholar]
  30. Zou, L.; Shi, D.; Guang, J.W. Research on Coupling and Coordination of Urban Human Settlements and Economic Resilience: A Case Study of Jilin Province. Areal Res. Dev. 2024, 43, 89–95. [Google Scholar]
  31. Han, L.; Ding, L.J. Coupling Coordination of Urbanization and Living Environment in the Yellow River Basin: A Case Study of Seven Major Urban Agglomerations. J. Shandong Univ. Finance Econ. 2023, 35, 52–62+85. [Google Scholar]
  32. Ma, M.Y.; Tang, J.X. Coupling coordination and driving force of tourism urbanization and human settlements in the western China. Geogr. Sci. 2024, 44, 463–473. [Google Scholar]
  33. Li, F.B.; Cheng, W.H.; Chen, Q.; Zhang, B.C. Evolution Characteristics and Convergence Evaluation of Economic Disparity in Northern and Southern Regions of China. Econ. Geogr. 2024, 44, 1–11. [Google Scholar]
  34. Ministry of Civil Affairs of the People’s Republic of China. Statistical Tables of Administrative Divisions of the People’s Republic of China. Available online: http://xzqh.mca.gov.cn/statistics/2022.html (accessed on 9 May 2025).
  35. Peng, K.J.; Hu, Q.S.; Xu, C.X.; He, X.R. Coordination Effect and Interactive Response Between the Tourism Industry and Urban Human Settlement Environment Along Yangtze River Economic Belt. Resour. Environ. Yangtze Basin 2022, 31, 1426–1440. [Google Scholar]
  36. Chen, T.; Tian, Y.; Zhang, Z.; Yu, J. Study on the Coupling and Coordination Relationship Between Urban Living Environment and Economic Development. Buildings 2024, 14, 3914. [Google Scholar] [CrossRef]
  37. National Development and Reform Commission of the People’s Republic of China. Systematic Interpretation of High-Quality Development. Available online: https://www.ndrc.gov.cn/wsdwhfz/202403/t20240301_1364325.html (accessed on 9 May 2025).
  38. Wang, S.J.; Kong, W.; Ren, L.; Zhi, D.D.; Dai, B.T. Research on misuses and modification of coupling coordination degree model in China. J. Nat. Resour. 2021, 36, 793–810. [Google Scholar] [CrossRef]
  39. Deng, Z.B.; Zong, S.W.; Su, C.W.; Chen, Z. Research on Coupling Coordination Development between Ecological CivilizationConstruction and New Urbanization and Its Driving Forcesin the Yangtze River Economic Zone. Econ. Geogr. 2019, 39, 78–86. [Google Scholar]
  40. Tang, X.H.; Zhang, X.Y.; Li, Y. Dynamic Coordination Development in China’s Manufacturing and Manufacturing-related Service Industries. Econ. Res. J. 2018, 53, 79–93. [Google Scholar]
  41. Xu, W.X.; Zhang, L.Y.; Liu, C.J.; Yang, L.; Huang, M.J. The Coupling Coordination of Urban Function and Regional Innovation: A Case Study of 107 Cities in the Yangtze River Economic Belt. Sci. Geogr. Sin. 2017, 37, 1659–1667. [Google Scholar]
  42. Yin, K.D.; Zhang, K.; Yang, W.D. A discrete GM (1, 1) model based on probabilistic accumulationand its application to offshore gas production forecasting. Syst. Eng.-Theory Prac. 2024, 44, 2733–2748. [Google Scholar]
Figure 1. Map of the study area.
Buildings 15 02425 g001
Figure 2. Comprehensive evaluation value of high-quality development of the construction. (a) Southeast region, (b) Central Region, (c) Southwest region.
Buildings 15 02425 g002
Figure 3. Spatial evolution pattern of high-quality development in the construction industry. (a) 2013; (b) 2016; (c) 2019; (d) 2022.
Buildings 15 02425 g003
Figure 4. Comprehensive evaluation of the value of human settlement environmental suitability. (a) Southeast region, (b) Central region; (c) Southwest region.
Buildings 15 02425 g004
Figure 5. Spatial evolution pattern of human settlement environmental suitability. (a) 2013; (b) 2016; (c) 2019; (d) 2022.
Buildings 15 02425 g005
Figure 6. Values and grades of the degree of harmonization of the coupling of high-quality development of the construction industry and the human settlement environmental suitability. (a) Values. (b) Grades.
Buildings 15 02425 g006
Figure 7. Spatial evolution pattern of the coupling coordination degree. (a) 2013; (b) 2016; (c) 2019; (d) 2022.
Buildings 15 02425 g007
Figure 8. Spatial trend surface variation of the coupling coordination degree. (a) 2013; (b) 2016; (c) 2019; (d) 2022.
Buildings 15 02425 g008
Figure 9. Evolution of the spatial structure of the strength of coupled coordination links. (a) 2013; (b) 2016; (c) 2019; (d) 2022.
Buildings 15 02425 g009
Figure 10. Projected coupling harmonization, 2023–2027.
Buildings 15 02425 g010
Table 1. Evaluation index system for high-quality development of the construction industry and Human settlement environmental suitability.
SystemDimensionIndicatorPropertyWeight
High-quality development of construction industryIndustrial scaleGross value of construction output+0.08826
Number of construction firms+0.07572
Average number of persons engaged in construction activities+0.09656
Technical levelTechnical equipment rate+0.11480
Power equipment rate+0.06953
labor productivity+0.06155
Percentage of senior title personnel in survey and design units+0.06579
Economic benefitTotal profit of construction enterprises+0.09673
Profitability of output+0.03127
Value-added tax rate+0.03078
Harmony and sharingBuilt-up area+0.08240
Percentage of completed commercial and service housing space+0.05113
Percentage of completed area of housing for science, education, medical care, culture, sports and recreation+0.10617
Green developmentSteel consumption for gross output value of 100 million yuan-0.00407
Timber consumption per billion dollars of gross output-0.01221
Cement consumption for gross output value of 100 million yuan-0.01303
Human settlement environmental suitabilitySocial developmentgross regional product (GDP)+0.12582
Per capita disposable income+0.10553
Road mileage+0.08042
Civilian car ownership+0.12340
Living environmentSulfur dioxide emissions-0.03598
Non-hazardous treatment rate of domestic waste+0.01763
Greening coverage in built-up areas+0.03236
Public servicePublic transportation vehicles per 10,000 population+0.07583
Health technicians per 1000 population+0.04975
Average number of students enrolled in higher education per 100,000 population+0.04975
Public library space per 10,000 population+0.12461
InfrastructureUrban road space per capita+0.04781
Green space per capita in parks+0.04178
Public toilets per 10,000 population+0.08935
Table 2. Criteria for classifying the degree of coupling coordination.
LevelDegree
(0, 0.1]Extreme incoordination
(0.1, 0.2]High incoordination
(0.2, 0.3]Moderate incoordination
(0.3, 0.4]Mild incoordination
(0.4, 0.5]Basic coordination
(0.5, 0.6]Low coordination
(0.6, 0.7]Moderate coordination
(0.7, 0.8]Favorable coordination
(0.8, 0.9]Excellent coordination
(0.9, 1]High-quality coordination
Table 3. Dagum Gini coefficient and contribution rate results table.
YearGini CoefficientContribution RateIntra-Group Gini CoefficientGroup-Group Gini Coefficient
OverallIntal-GroupGroup-GroupSuper-
Variable-Density
SoutheastCentr-alSouthwestSoutheast-CentralSoutheast-
Southwest
Central-Southwest
20130.06828.249%55.727%16.025%0.0630.0350.0580.0690.0920.054
20140.06728.090%57.897%14.013%0.0690.0390.0420.0680.0920.053
20150.06829.076%52.638%18.287%0.0750.0420.0370.0770.0880.045
20160.06429.131%52.715%18.154%0.0720.0410.0320.0750.0820.041
20170.06228.473%54.229%17.299%0.0690.0330.0340.0740.0810.040
20180.06230.924%42.072%27.004%0.0700.0420.0420.0690.0750.045
20190.05829.779%49.869%20.352%0.0680.0390.0290.0680.0730.037
20200.05831.588%42.113%26.300%0.0750.0380.0300.0660.0710.038
20210.06030.217%48.448%21.335%0.0730.0320.0320.0640.0770.042
20220.05830.811%33.382%35.807%0.0820.0250.0250.0640.0760.036
Disclaimer/Publisher’s Note: The statements, opinions and data contained in all publications are solely those of the individual author(s) and contributor(s) and not of MDPI and/or the editor(s). MDPI and/or the editor(s) disclaim responsibility for any injury to people or property resulting from any ideas, methods, instructions or products referred to in the content.

