
Research on the Deformation Laws of Adjacent Structures Induced by the Shield Construction Parameters

Abstract
1. Introduction
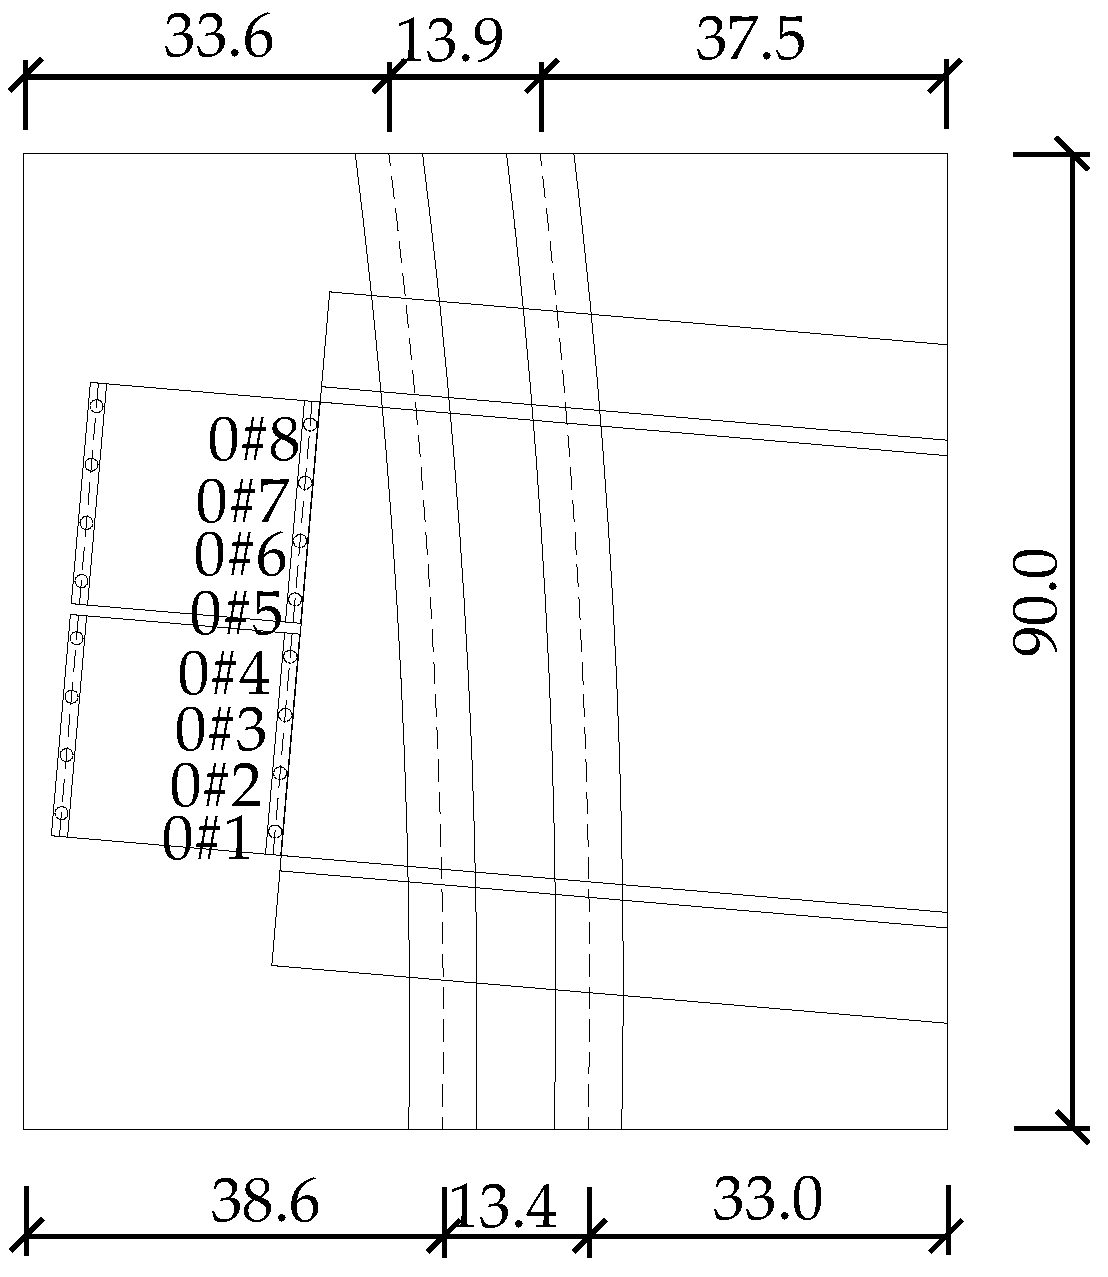
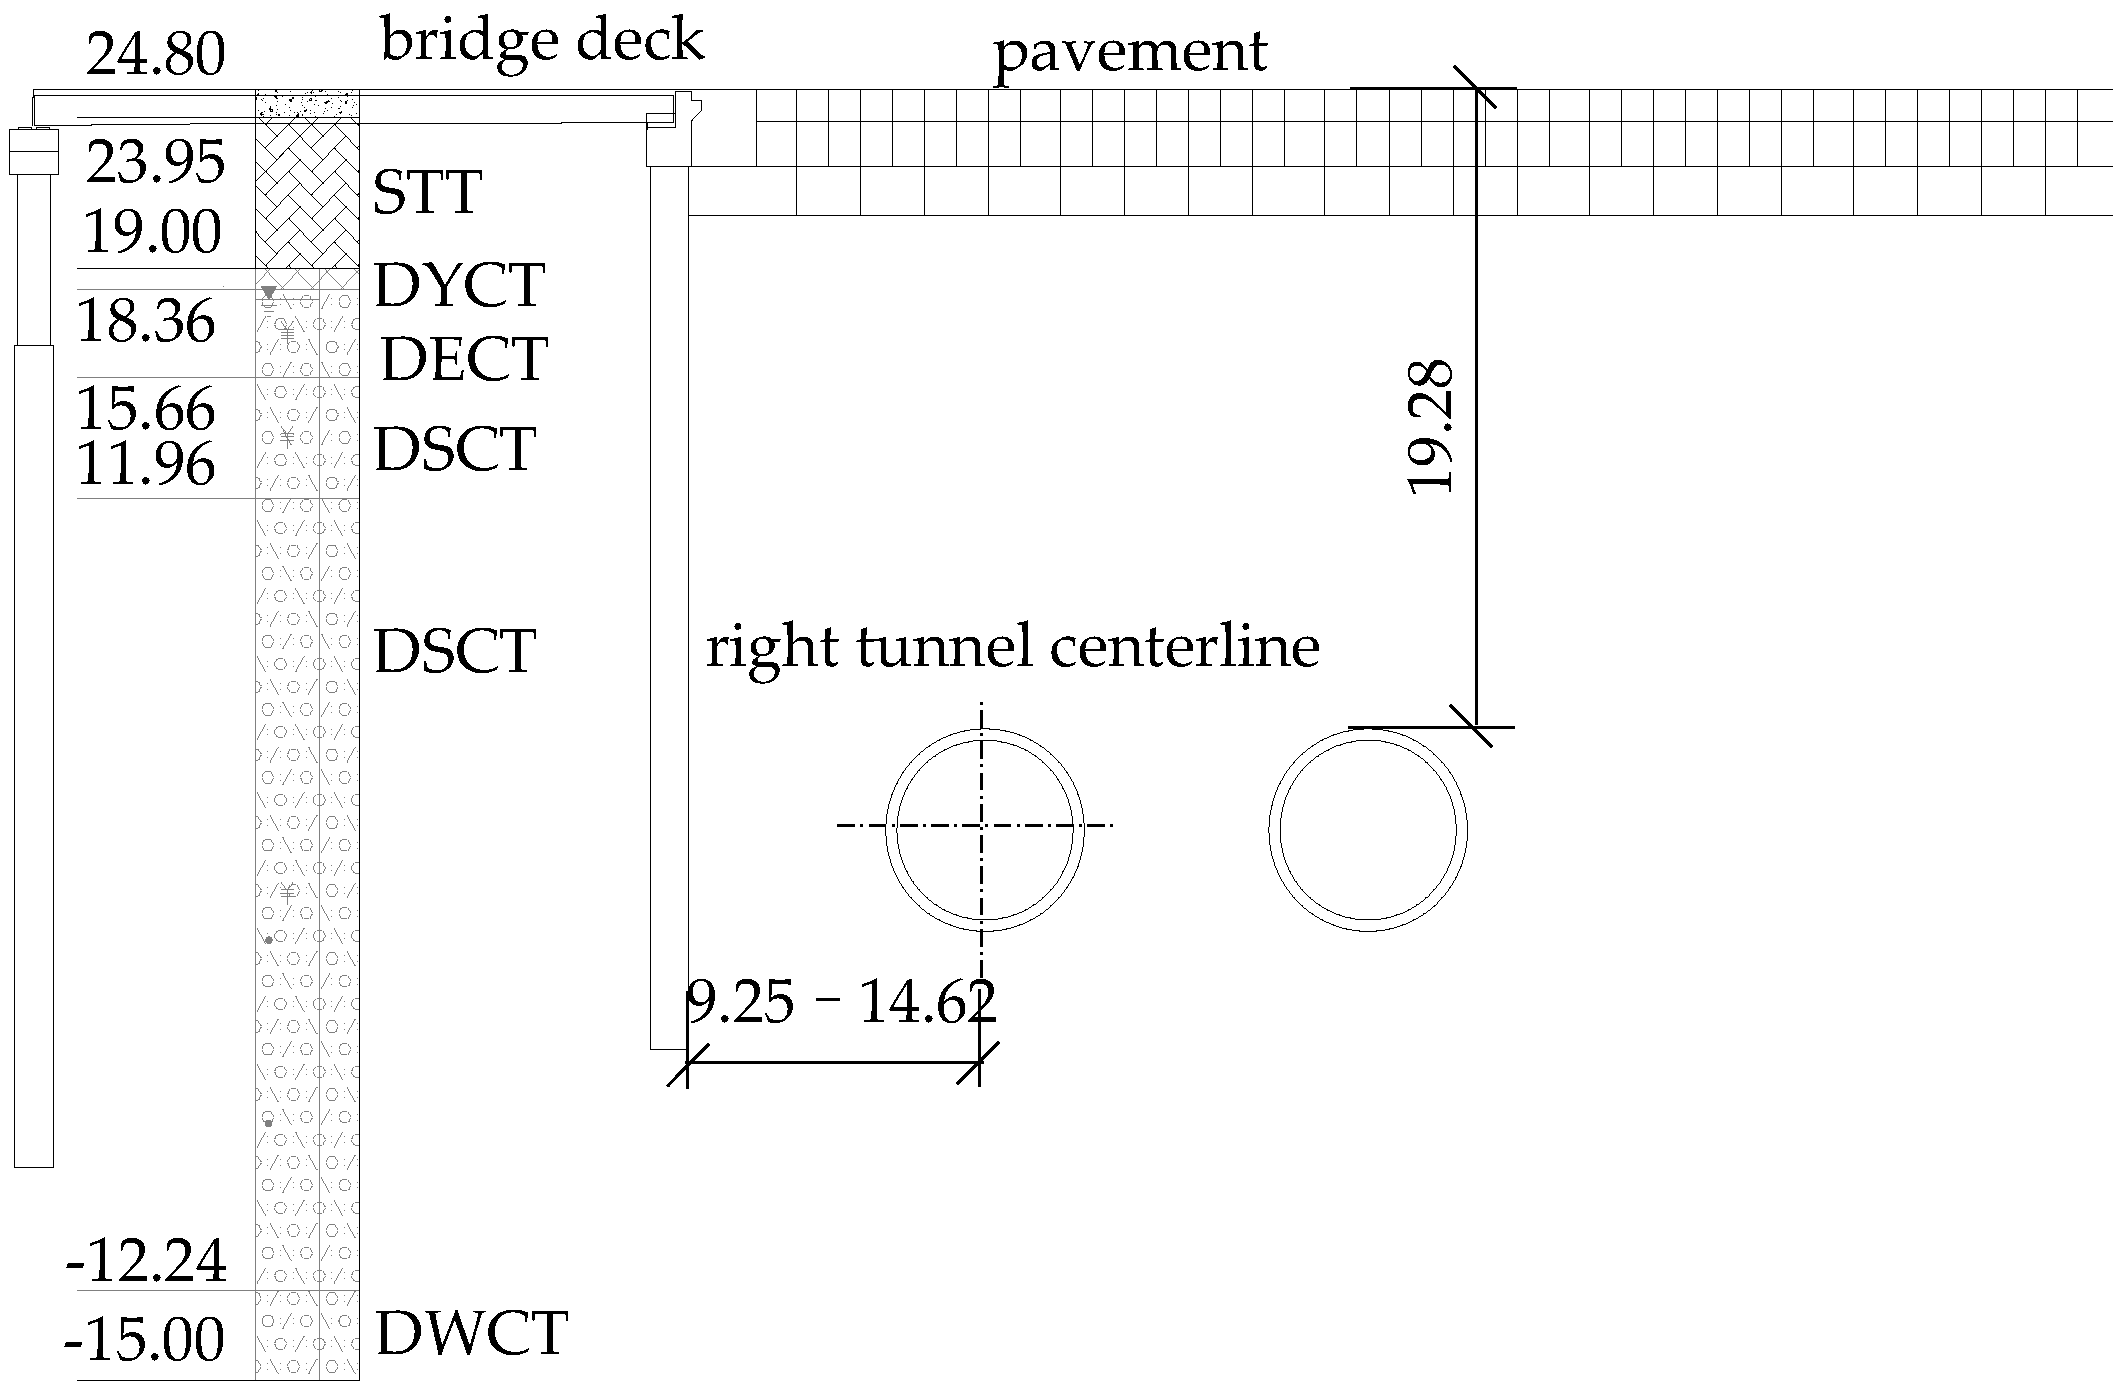
2. Project Overview
3. The Deformation Laws of Adjacent Structures by the Shield Construction Parameters
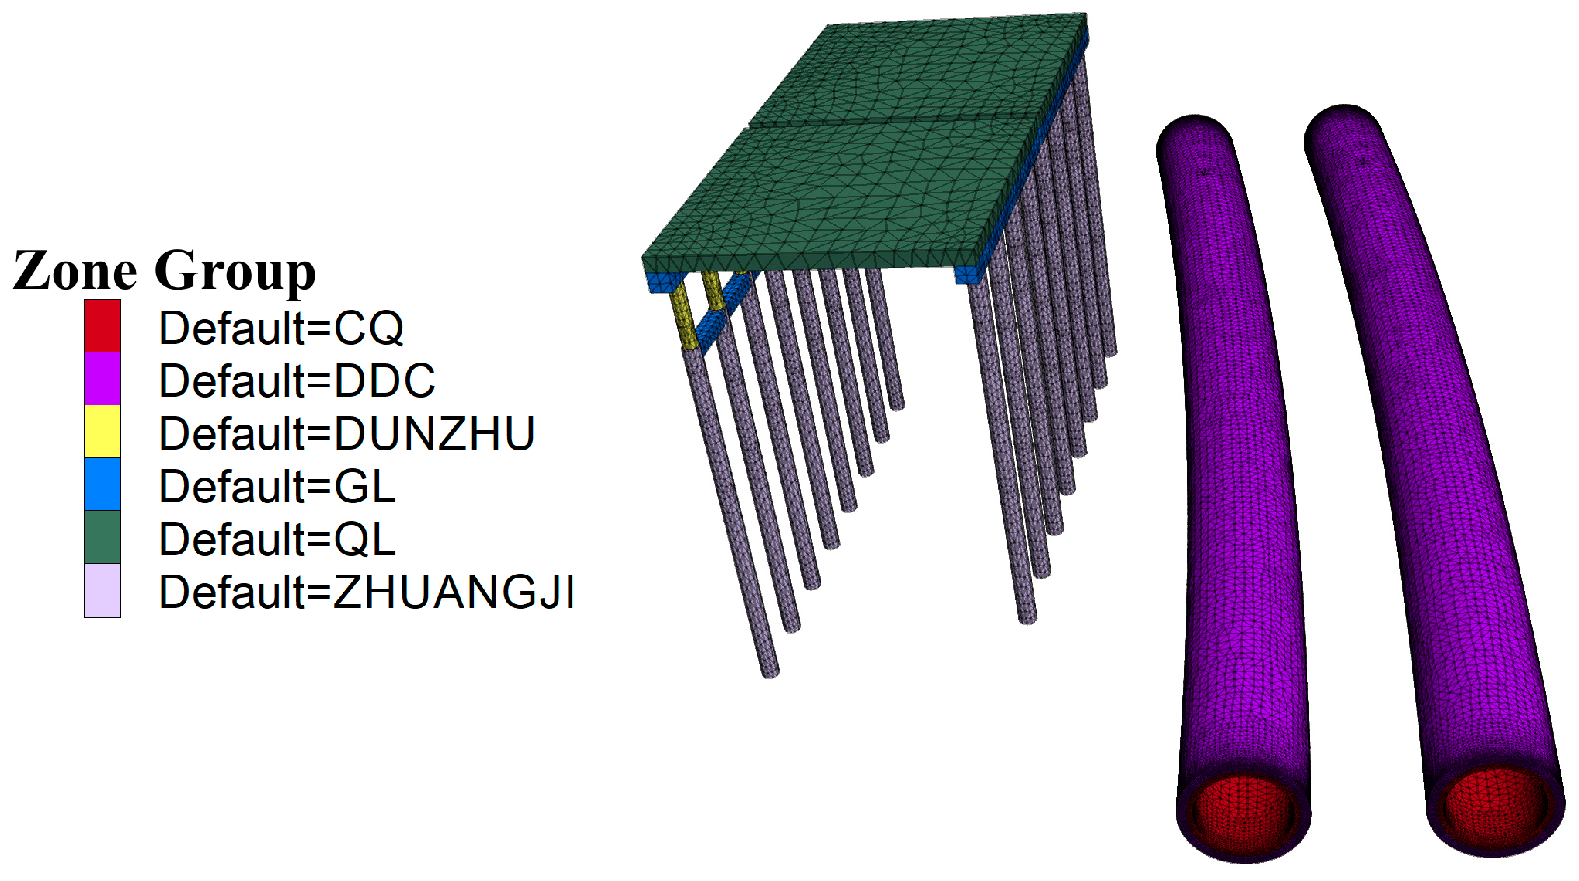
3.1. Numerical Modeling
3.2. The Deformation Laws of Pile Foundations and Pavements Under Varying Soil Bin Pressure
3.3. The Deformation Laws of Pile Foundations and Pavements Under Varying Grouting Layer Thickness
3.4. The Deformation Laws of Pile Foundation and Pavement Under Varying Stress Release Coefficient
4. Risk Prevention and Control Measures for Shield Structure Side-Crossing Tianzhushan Overpass
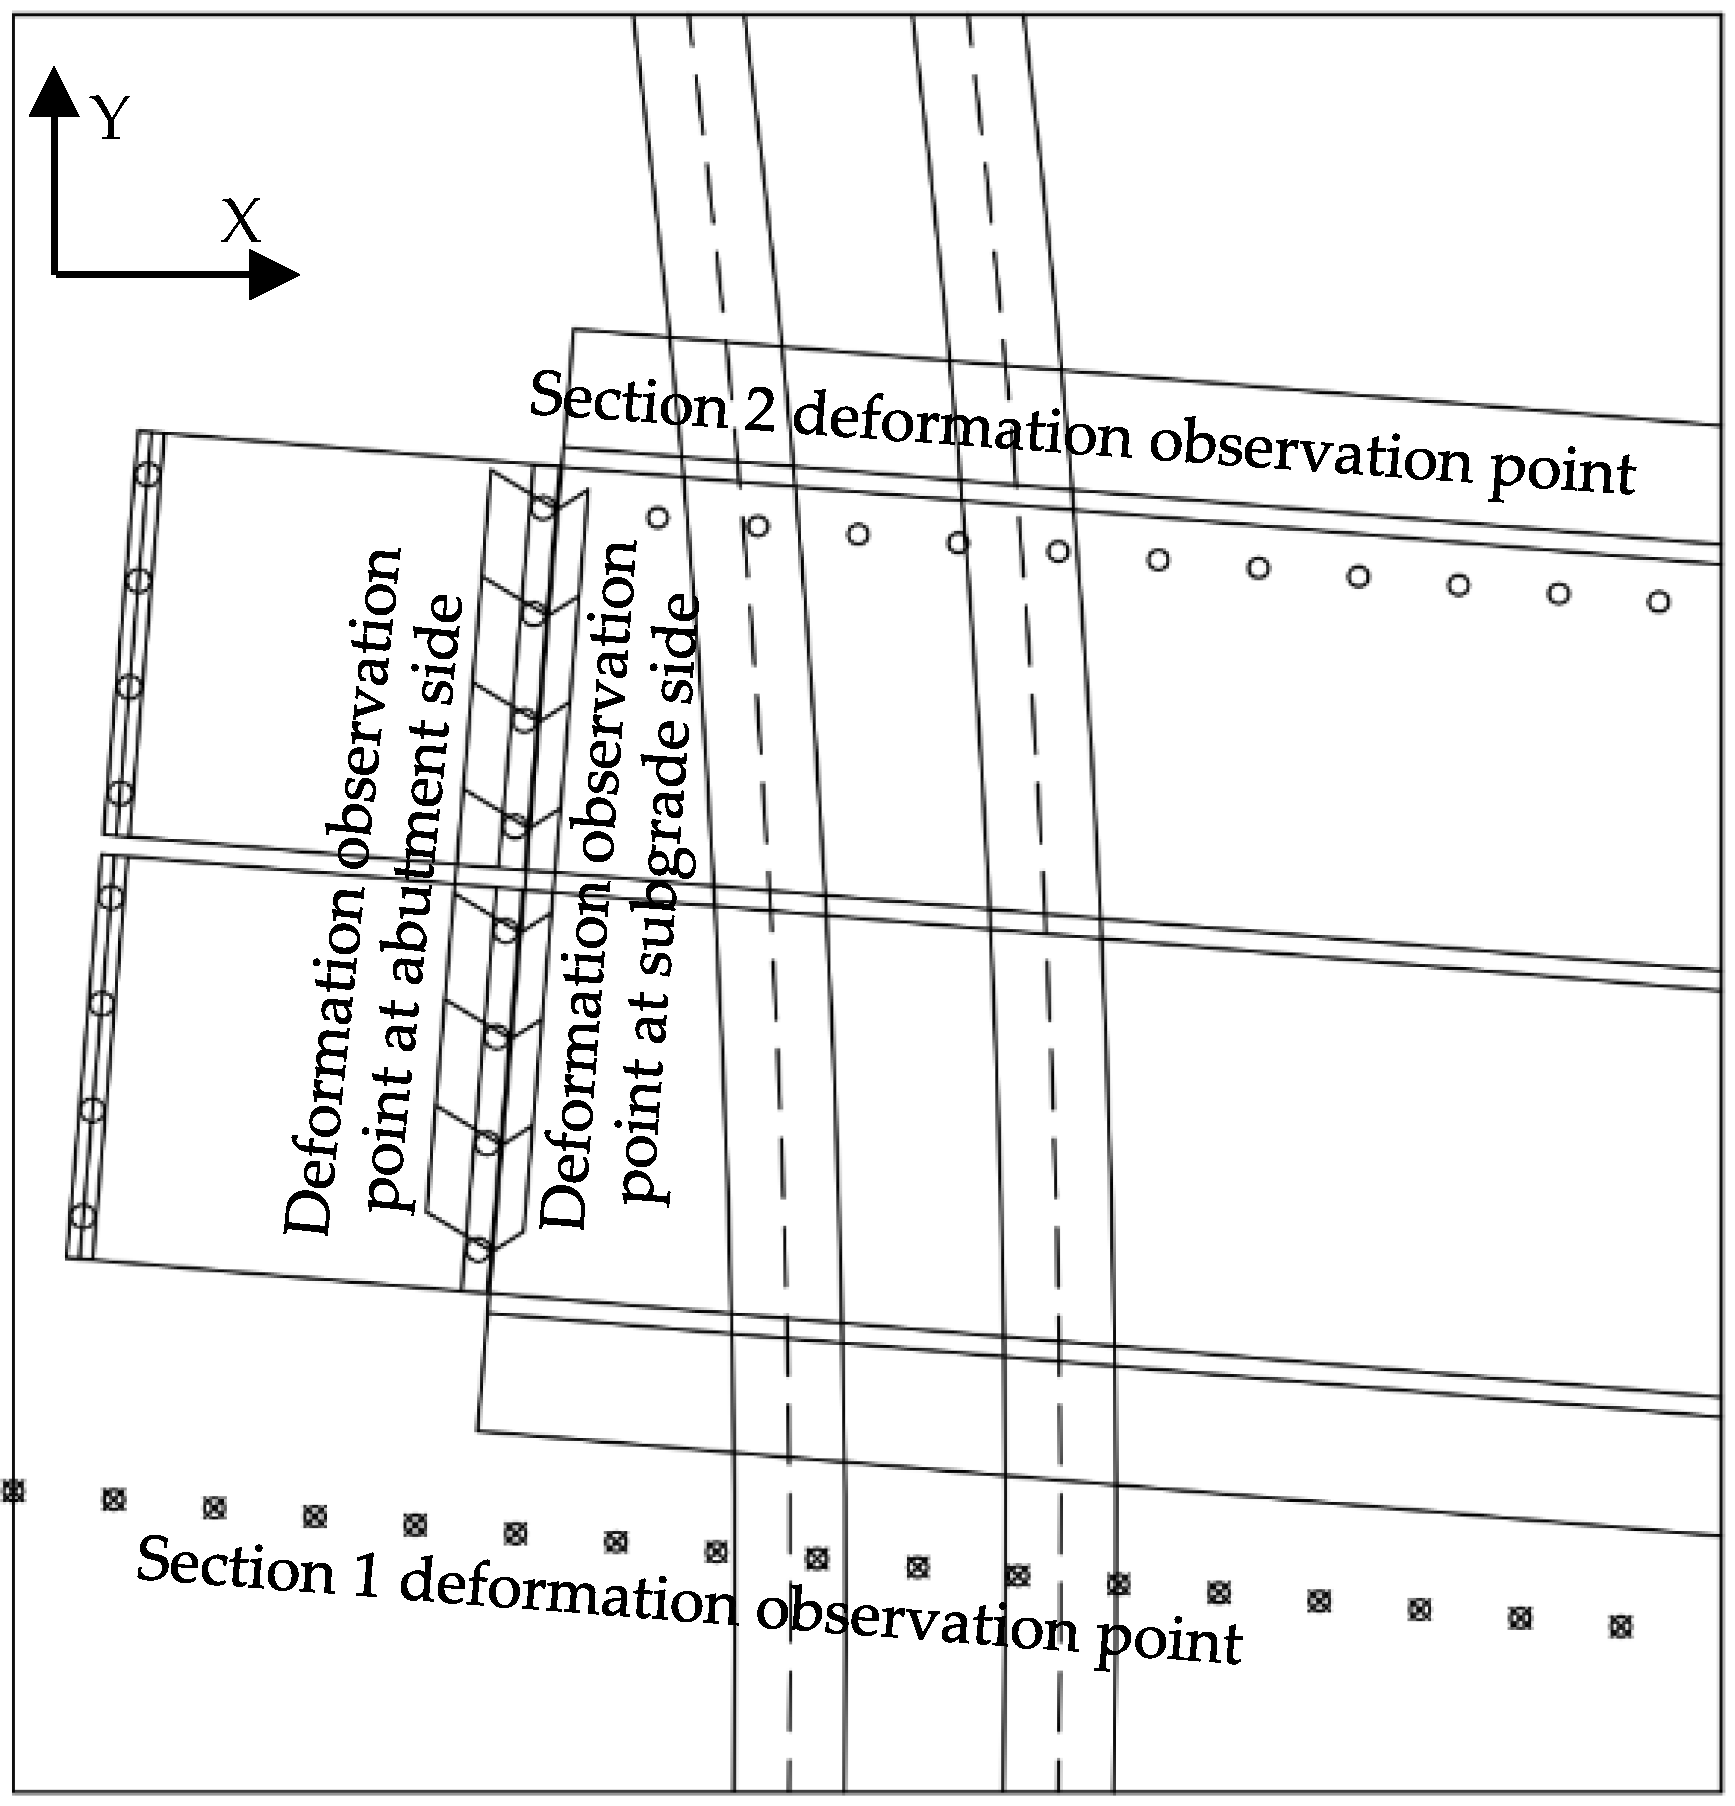
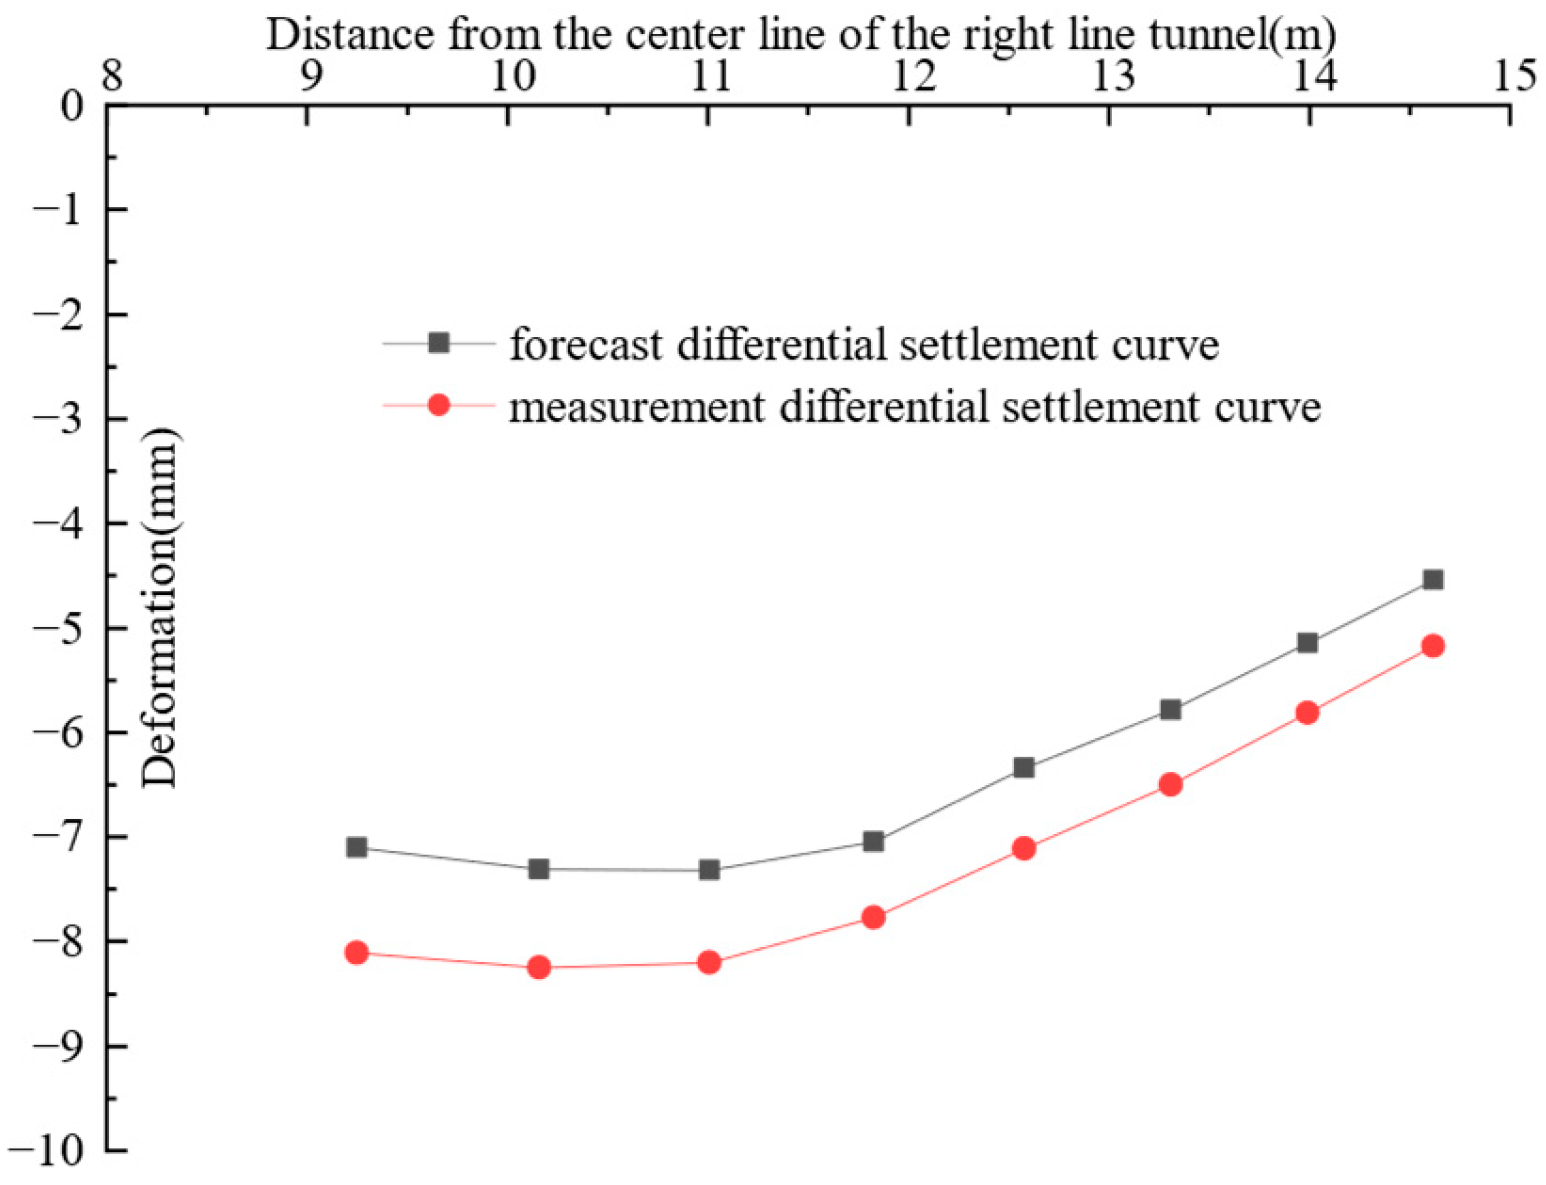
5. Validation of Numerical Simulation Accuracy
6. Conclusions
- (1)
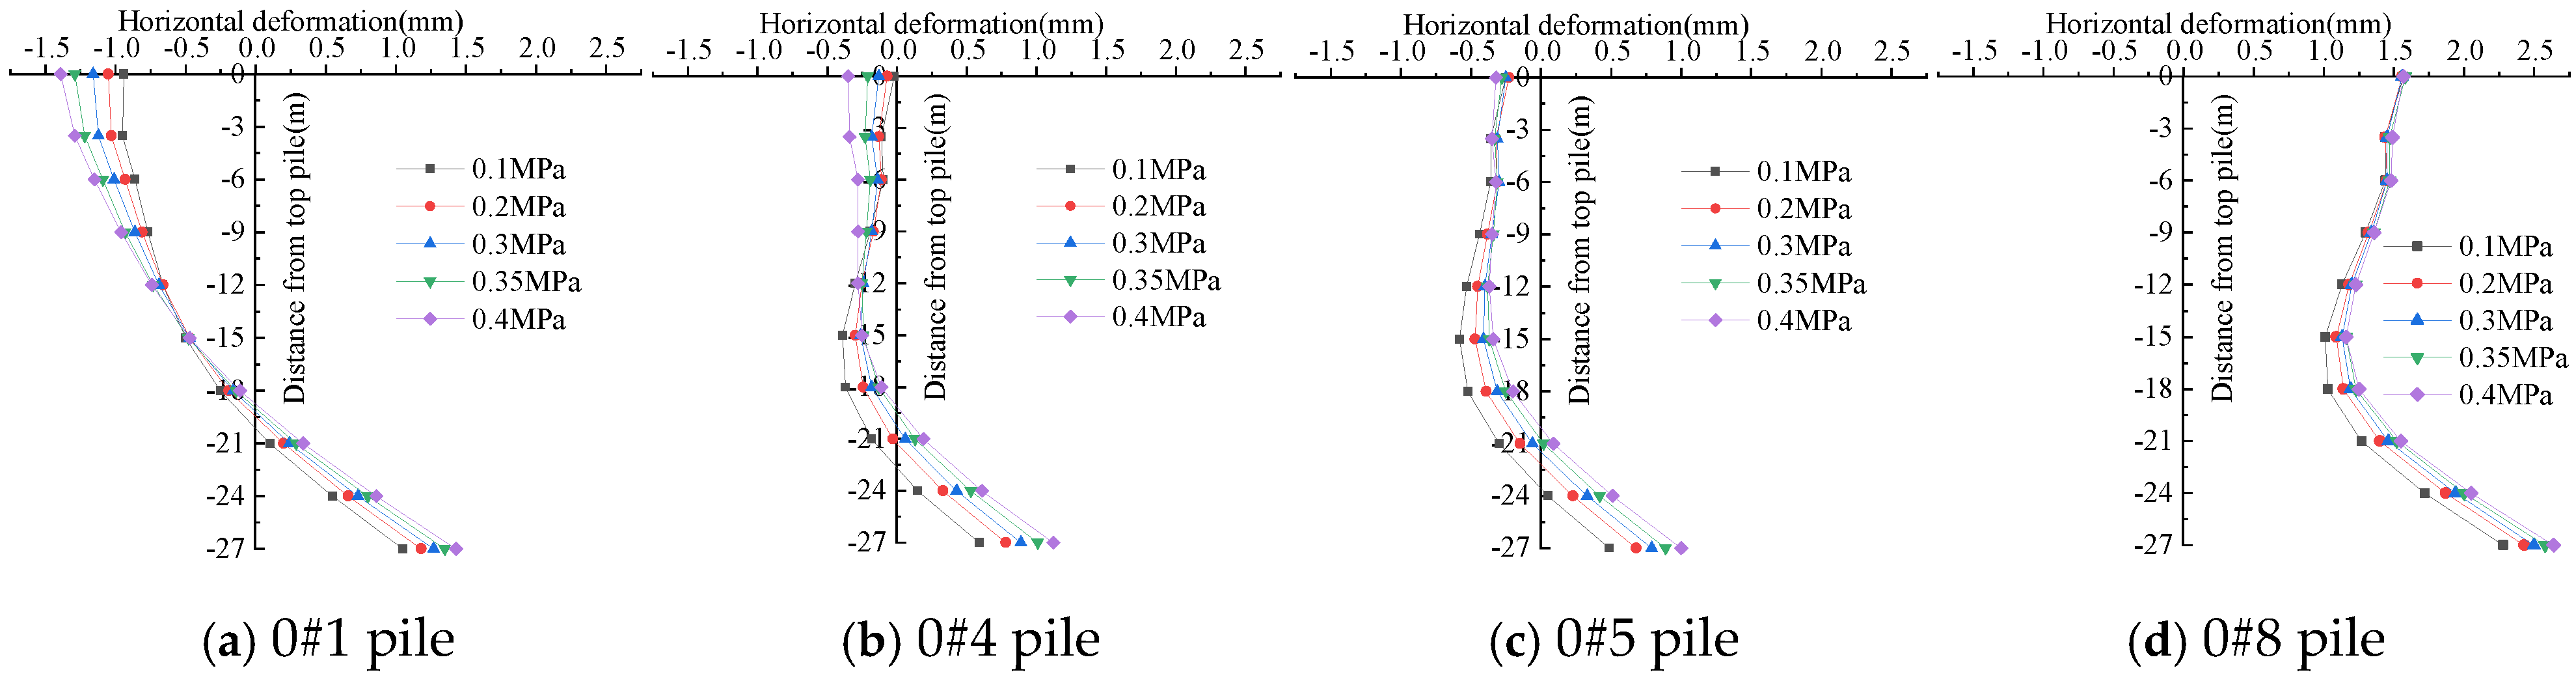
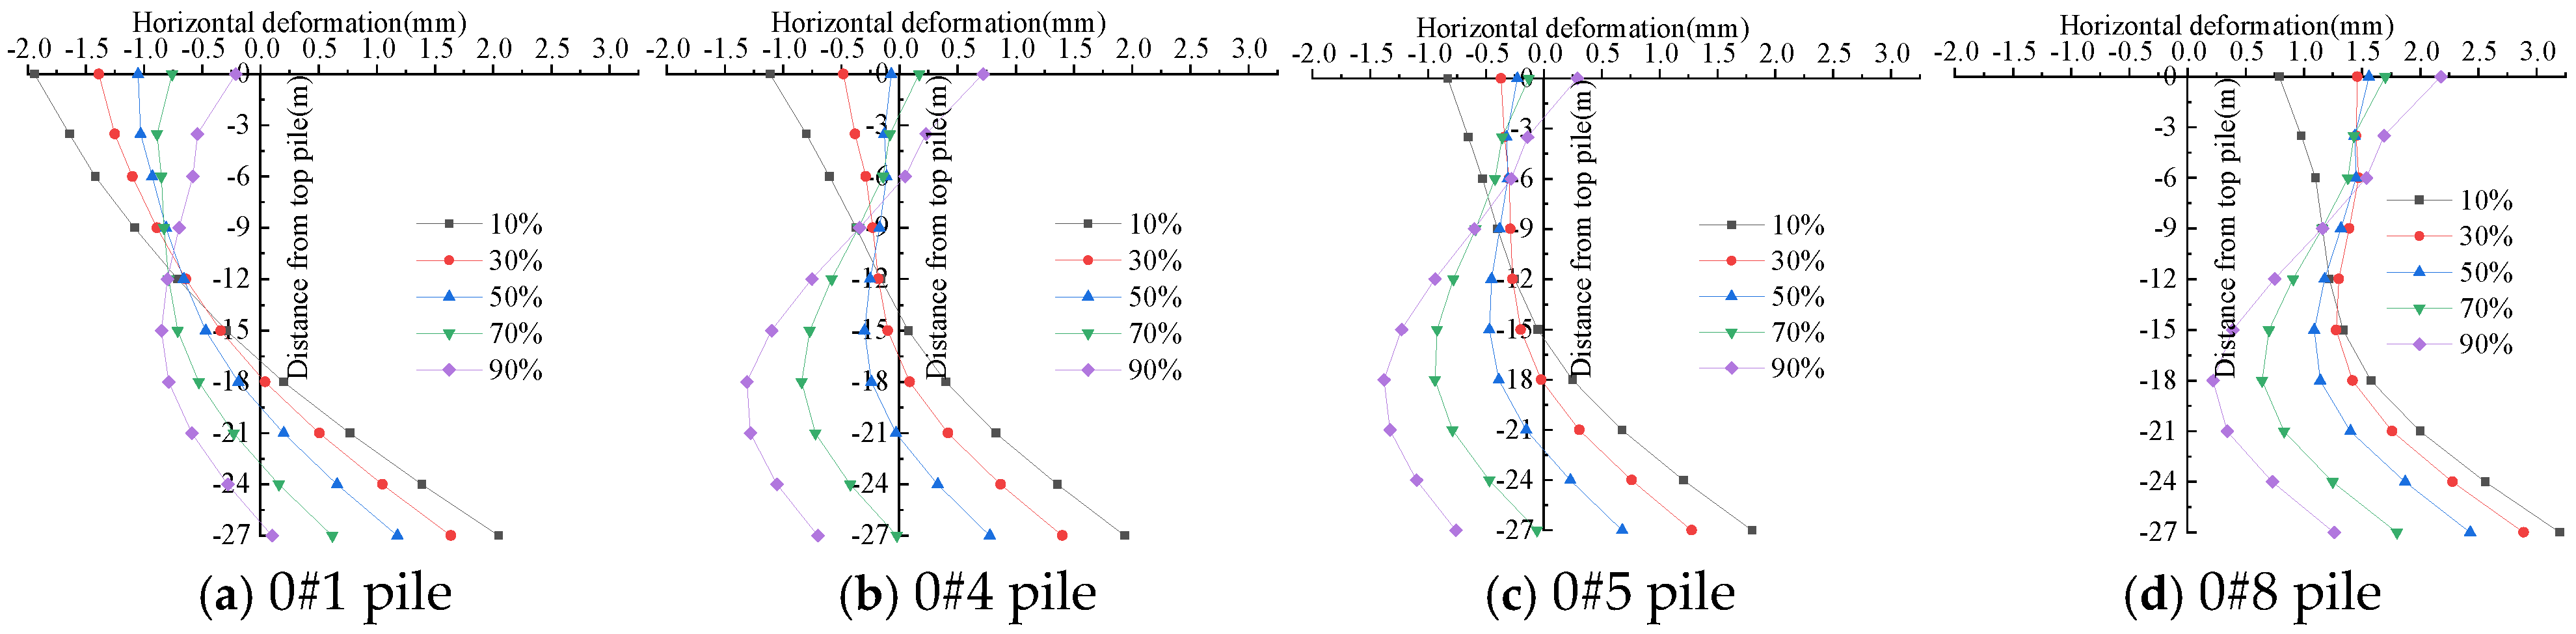
- During tunnel shield construction, adjacent pile foundations will deform. The pile deformation curve’s shape is closely linked to the distance between the pile foundation and the adjacent tunnel’s centerline. When the pile foundation is within 11.01 m of the adjacent tunnel’s centerline, the pile body deforms positively along the X-axis. The top and bottom of the pile exhibit greater deformation than the middle, while deformation in depth first decreases and then increases. When the pile foundation is outside 11.83 m of the adjacent tunnel’s centerline, the top of the pile deforms toward the negative X-axis direction, while the bottom deforms toward the positive X-axis direction. Both top and bottom deformations increase with distance.
- (2)
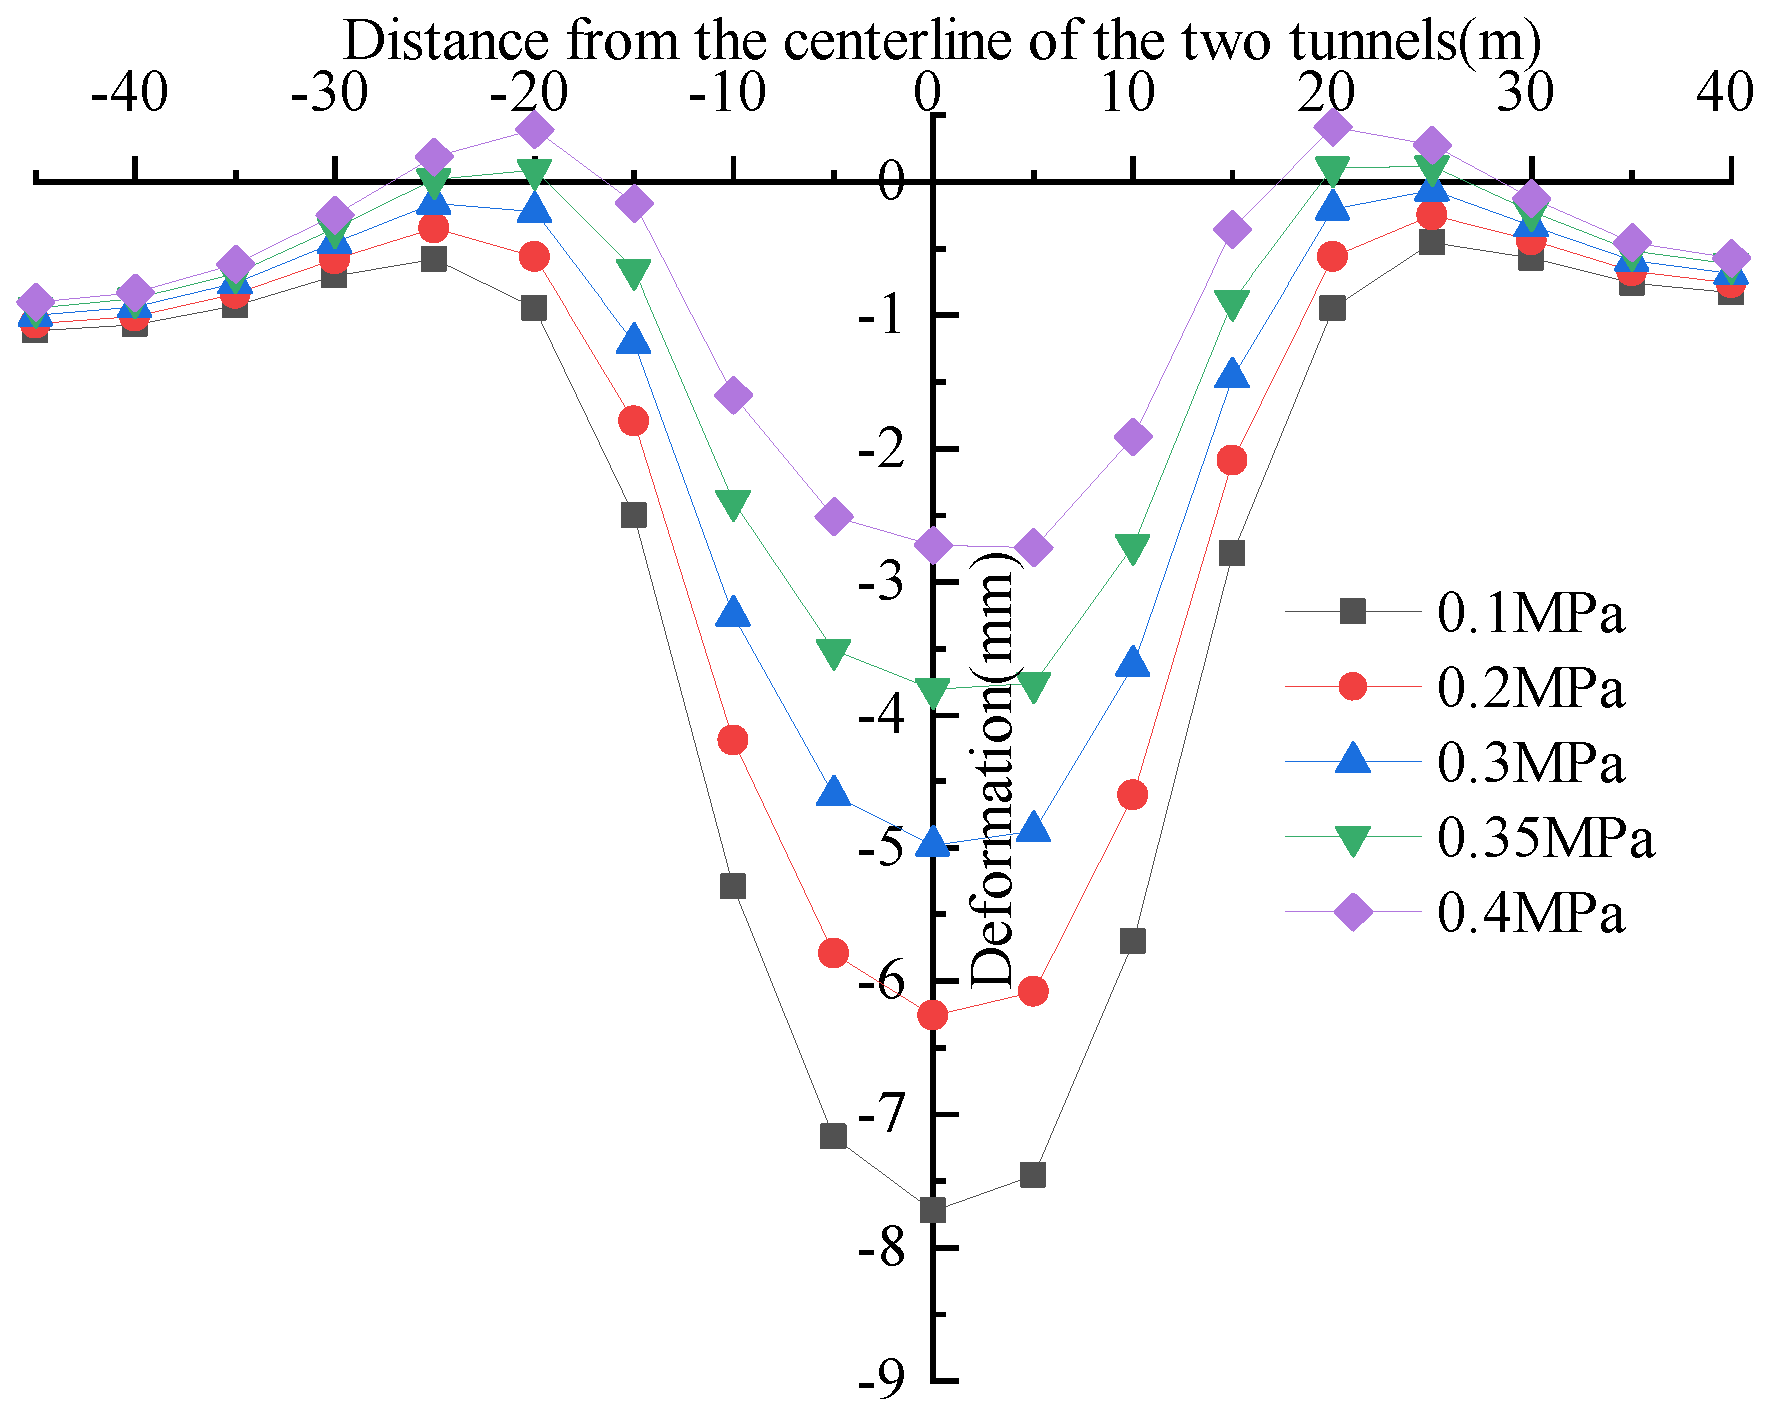
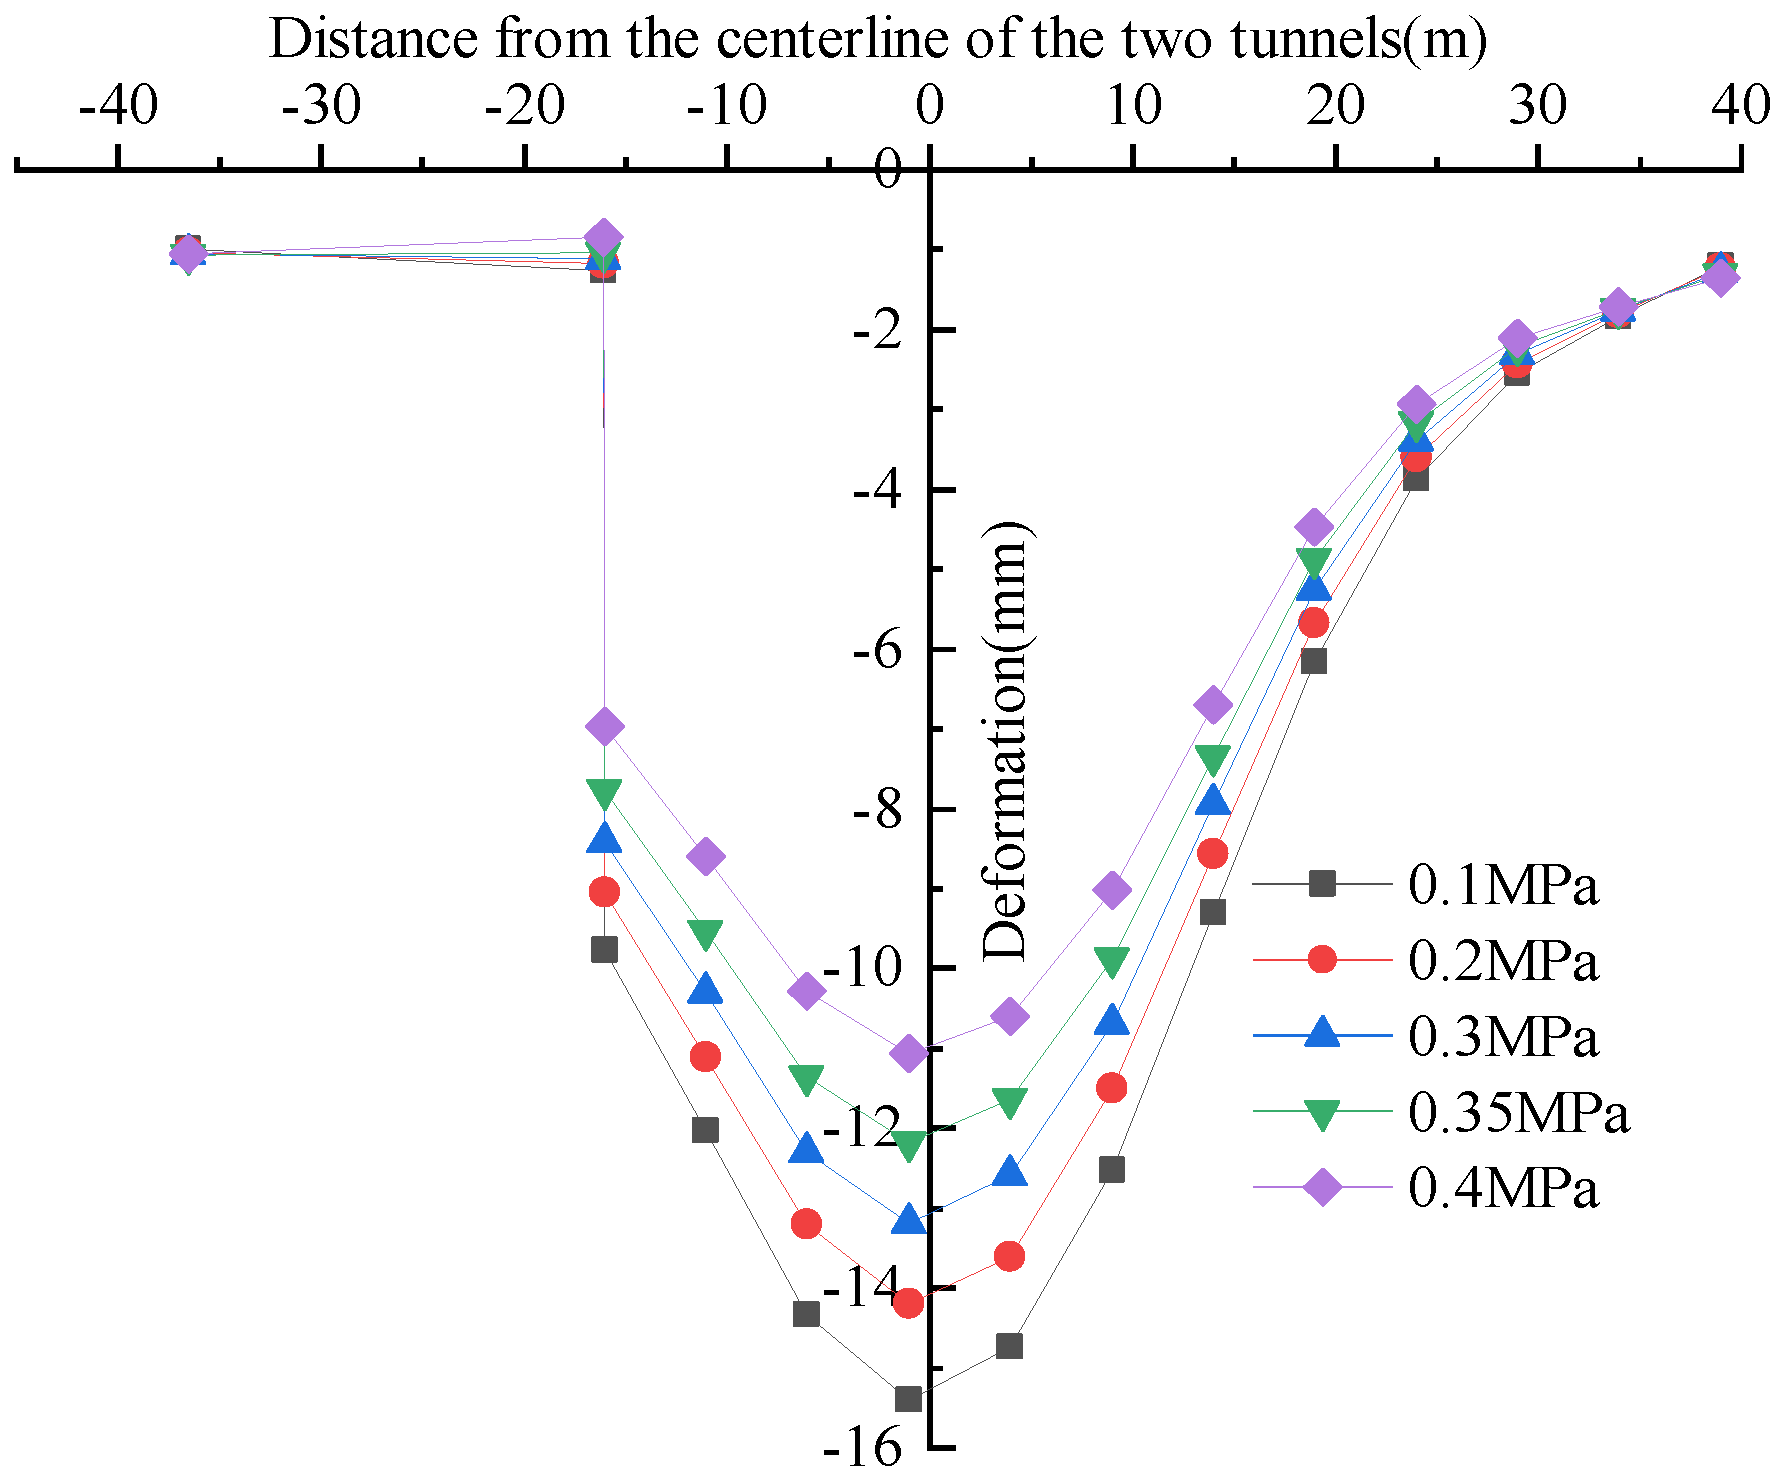
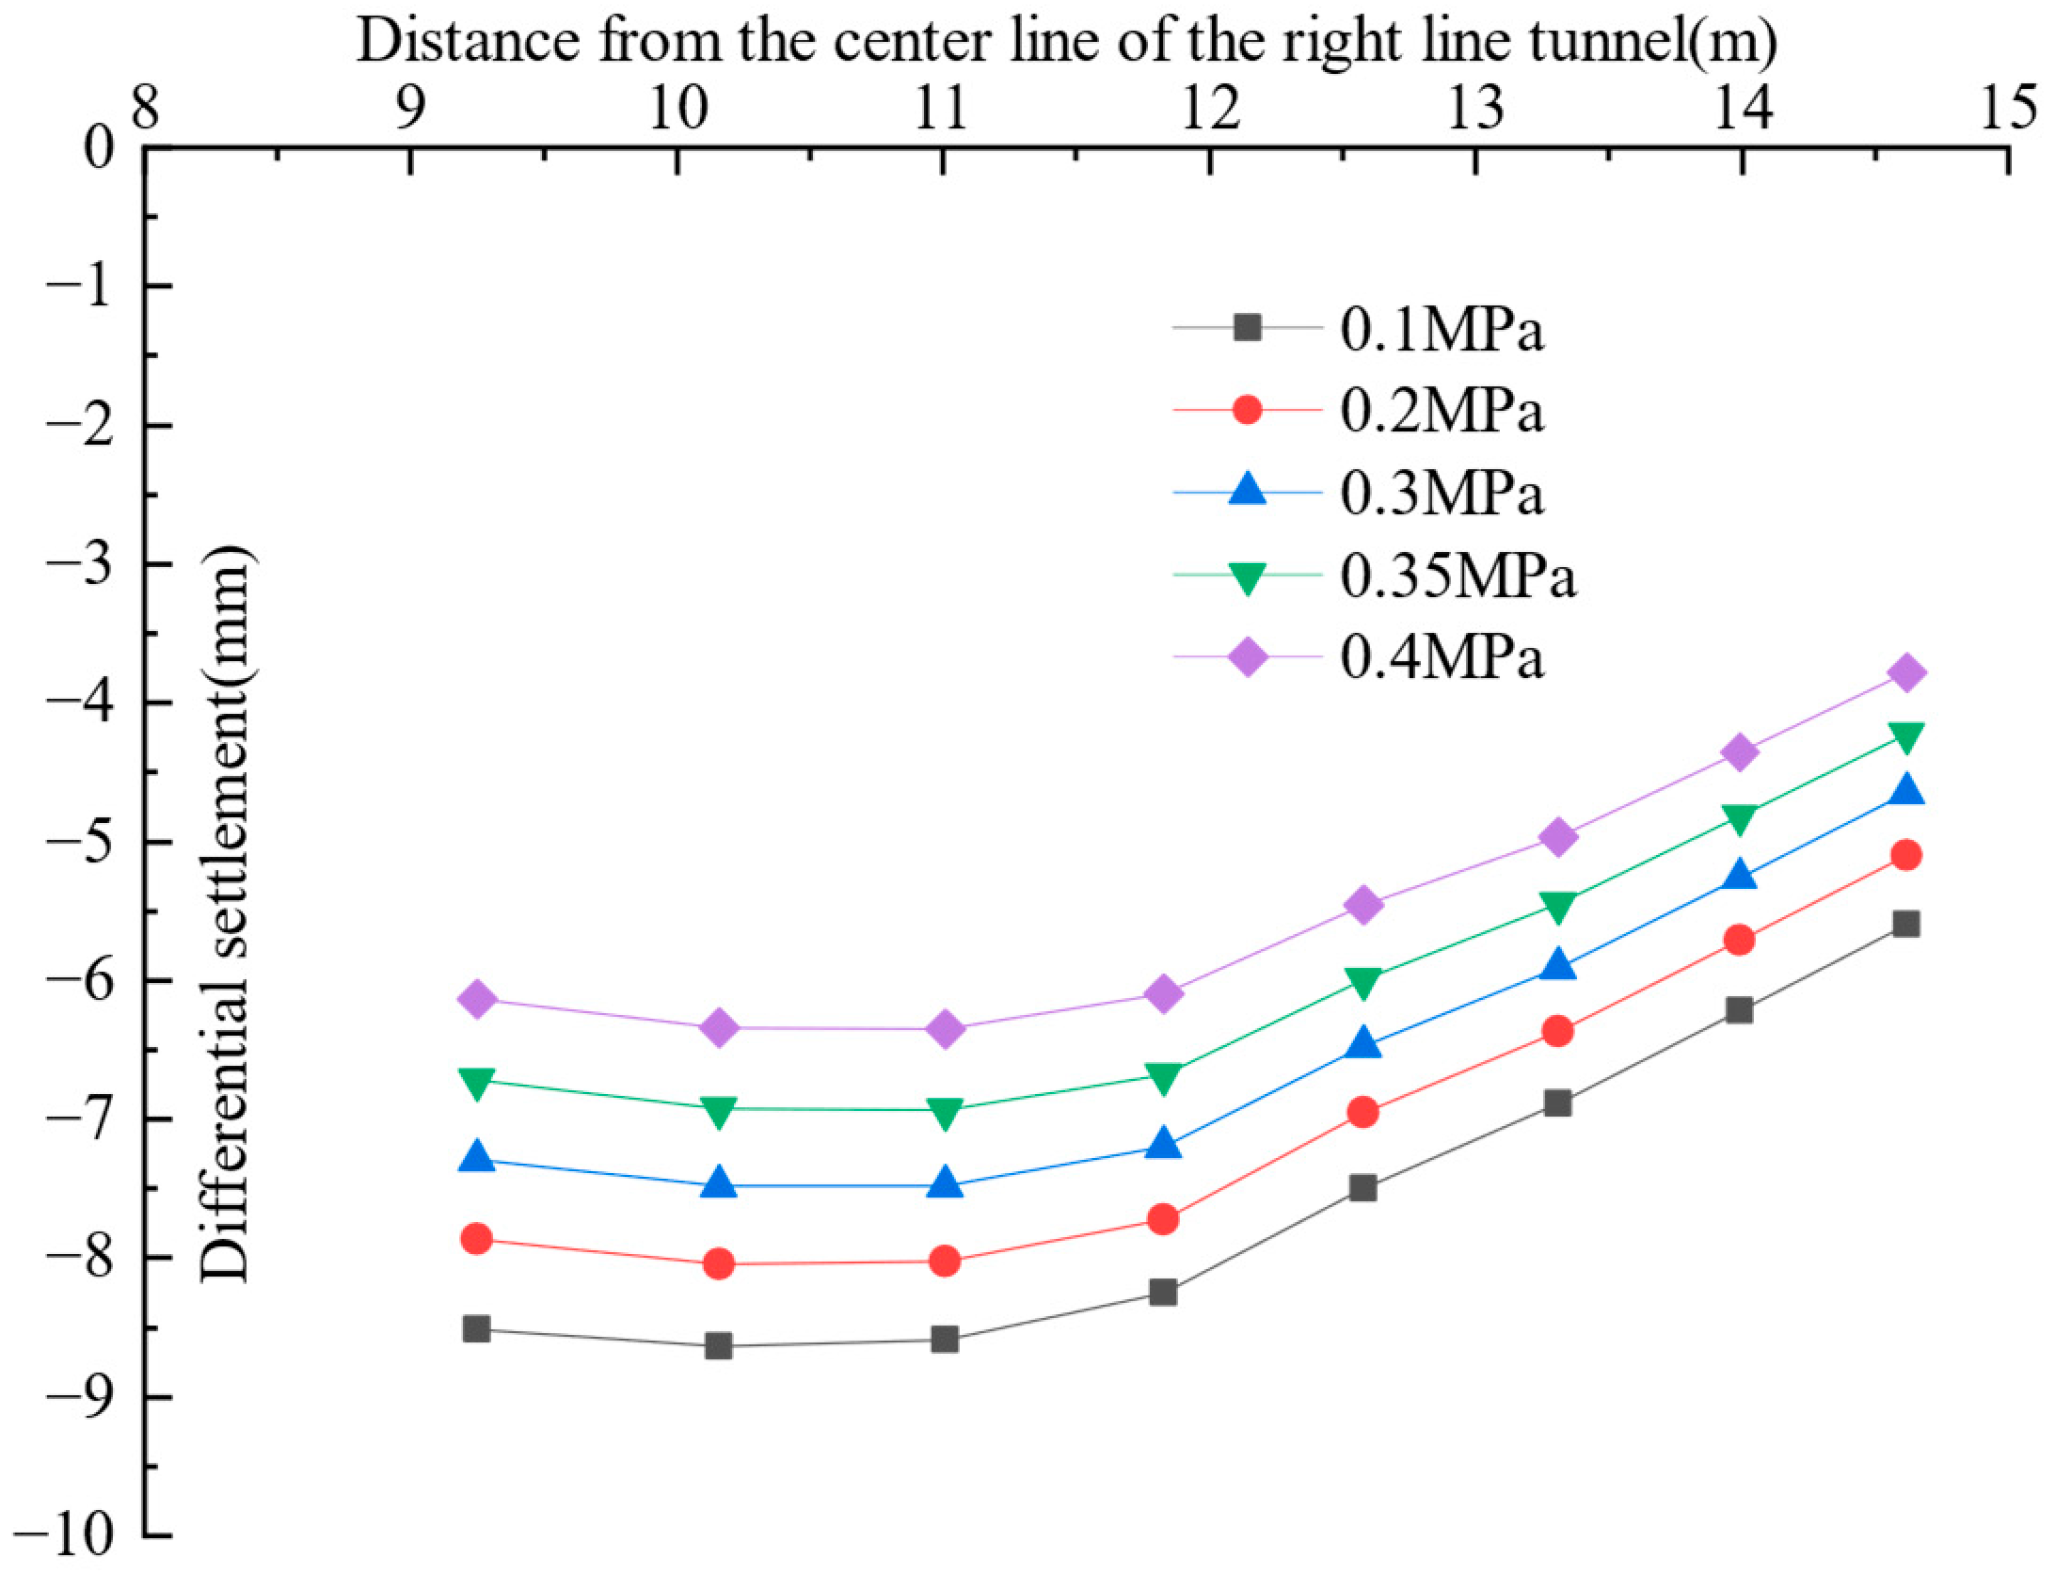
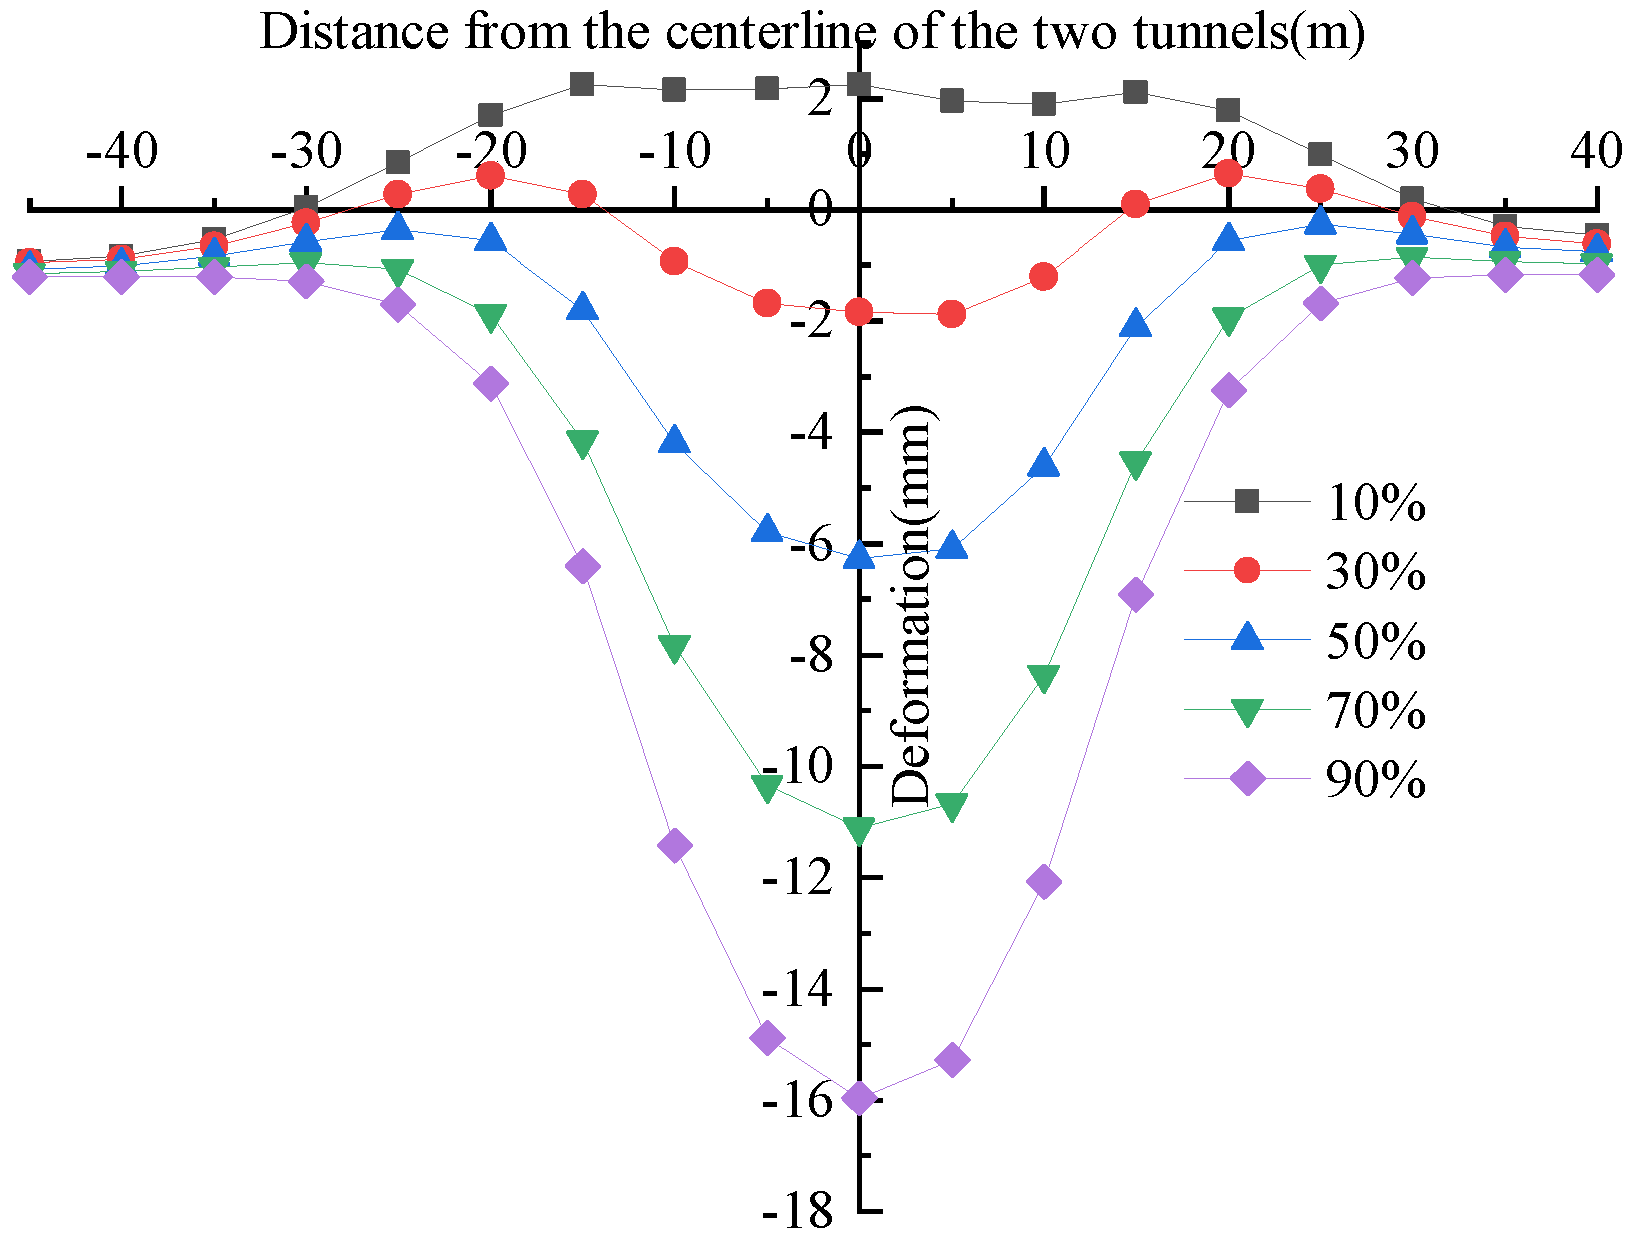
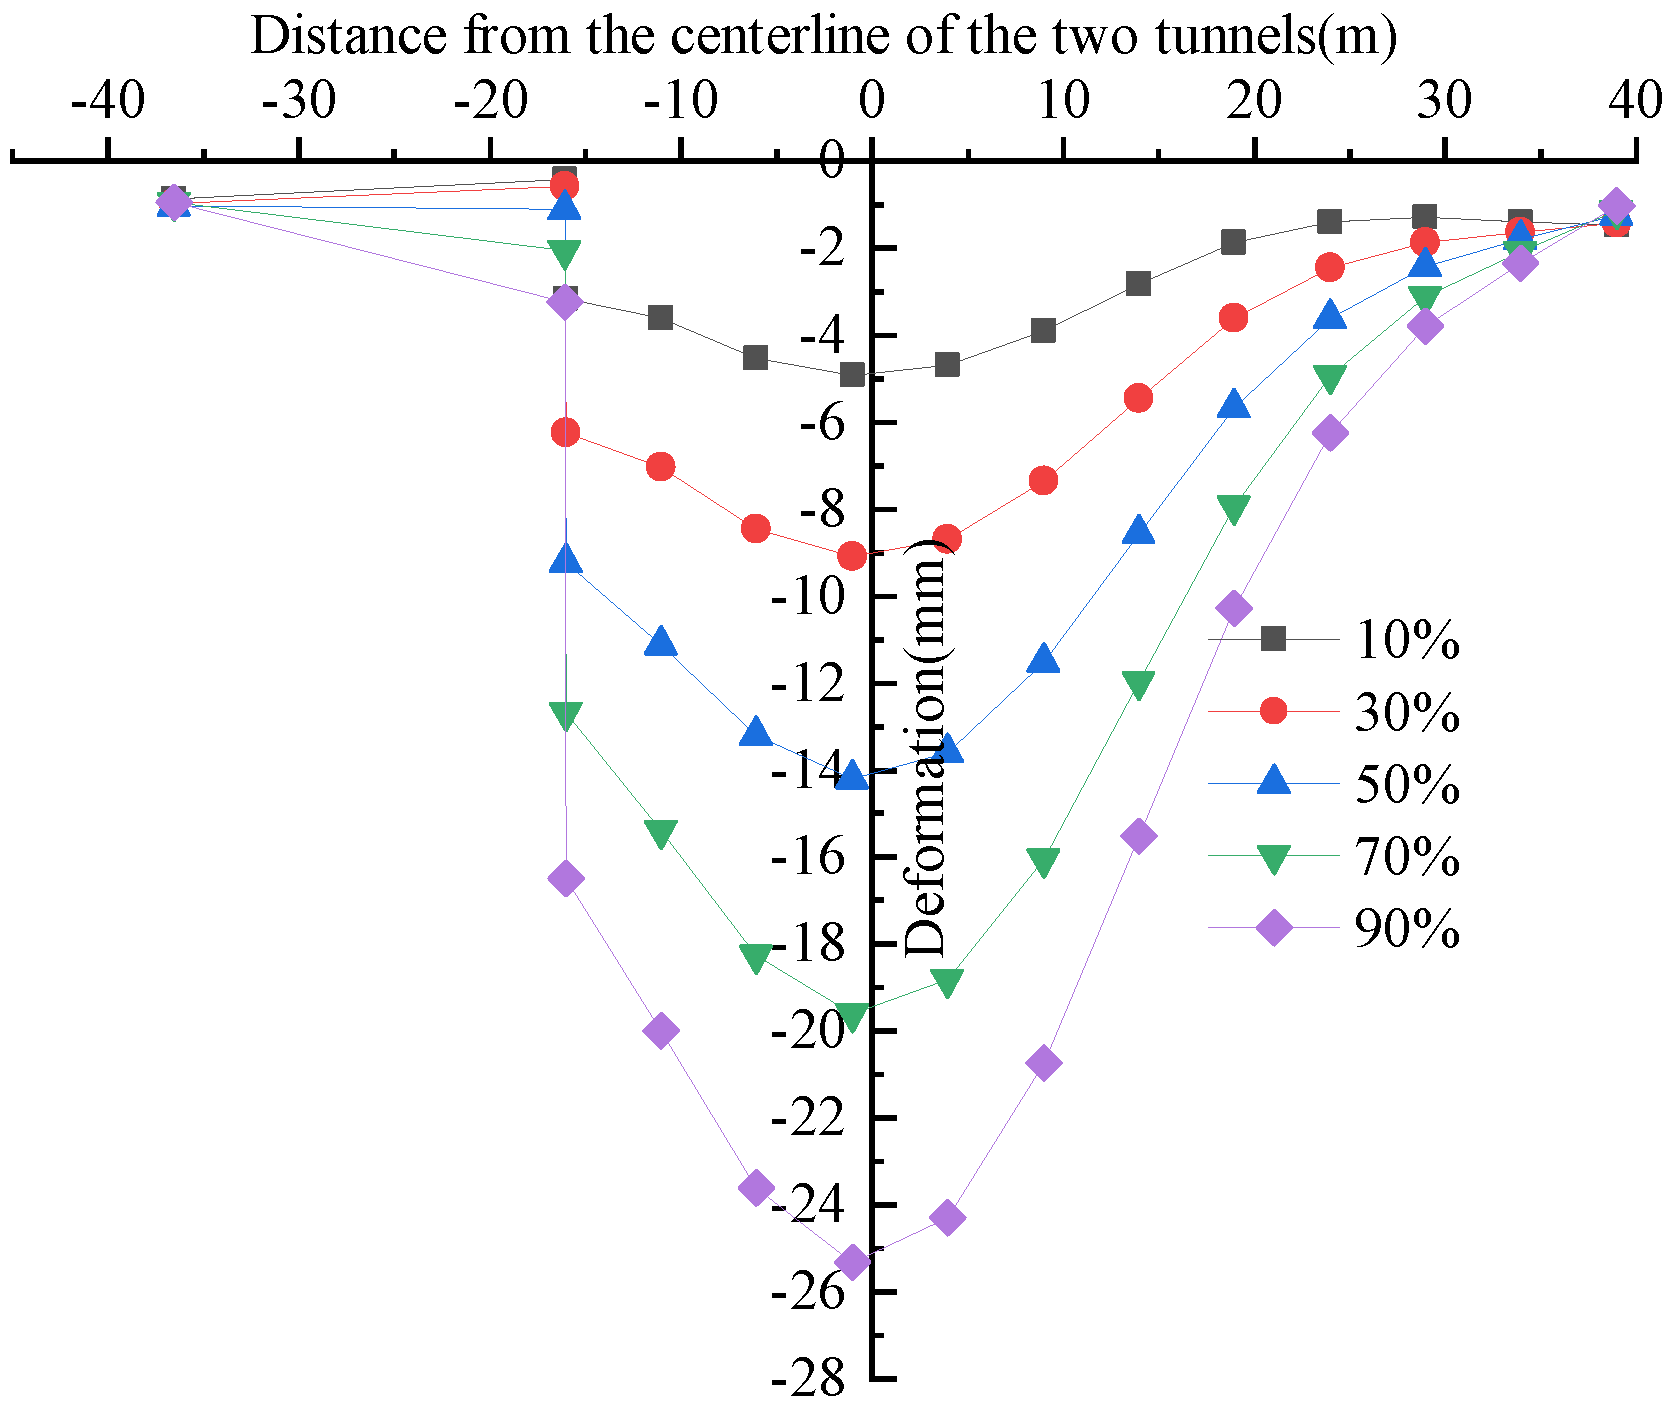
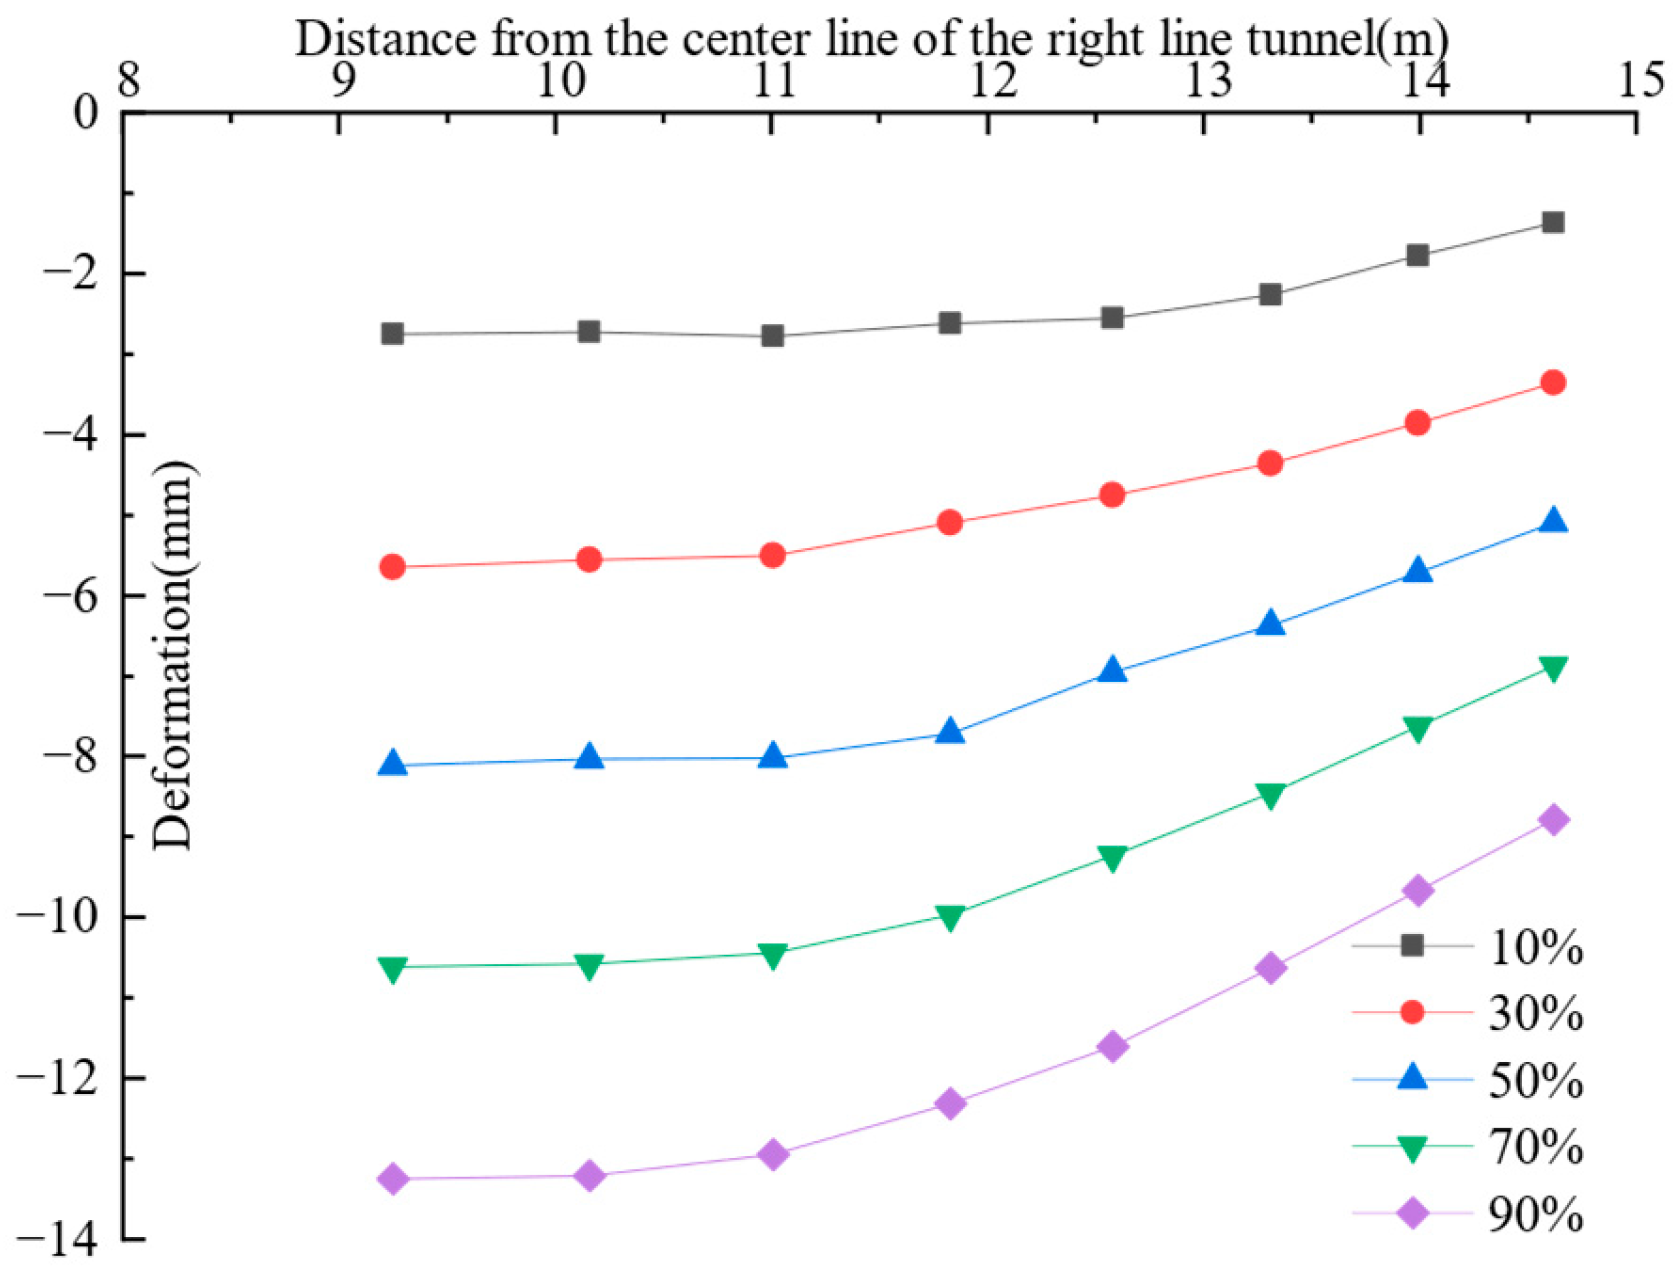
- When the distance from the pile foundation to the adjacent tunnel’s centerline varies, the impact of soil bin pressure on pile deformation differs. When the pile foundation is within 11.01 m of the adjacent tunnel’s centerline, the pile foundation deformation toward the positive X-axis increases with soil bin pressure, while the differential deformation of the pile body at varying depths decreases as soil bin pressure increases. When the pile foundation is outside 11.83 m of the adjacent tunnel’s centerline, the deformation of the upper section of the pile toward the negative X-axis direction decreases as the soil bin pressure increases, and its differential deformation also decreases with increasing soil bin pressure. In contrast, the deformation of the lower section of the pile toward the positive X-axis direction increases with increasing soil bin pressure. When the pile foundation is outside 12.58 m of the adjacent tunnel’s centerline, the deformation of the upper and lower sections of the pile body increases with soil bin pressure. Increasing soil bin pressure effectively decreases surface deformation and differential deformation at the deformation joint between the bridge and roadbed.
- (3)
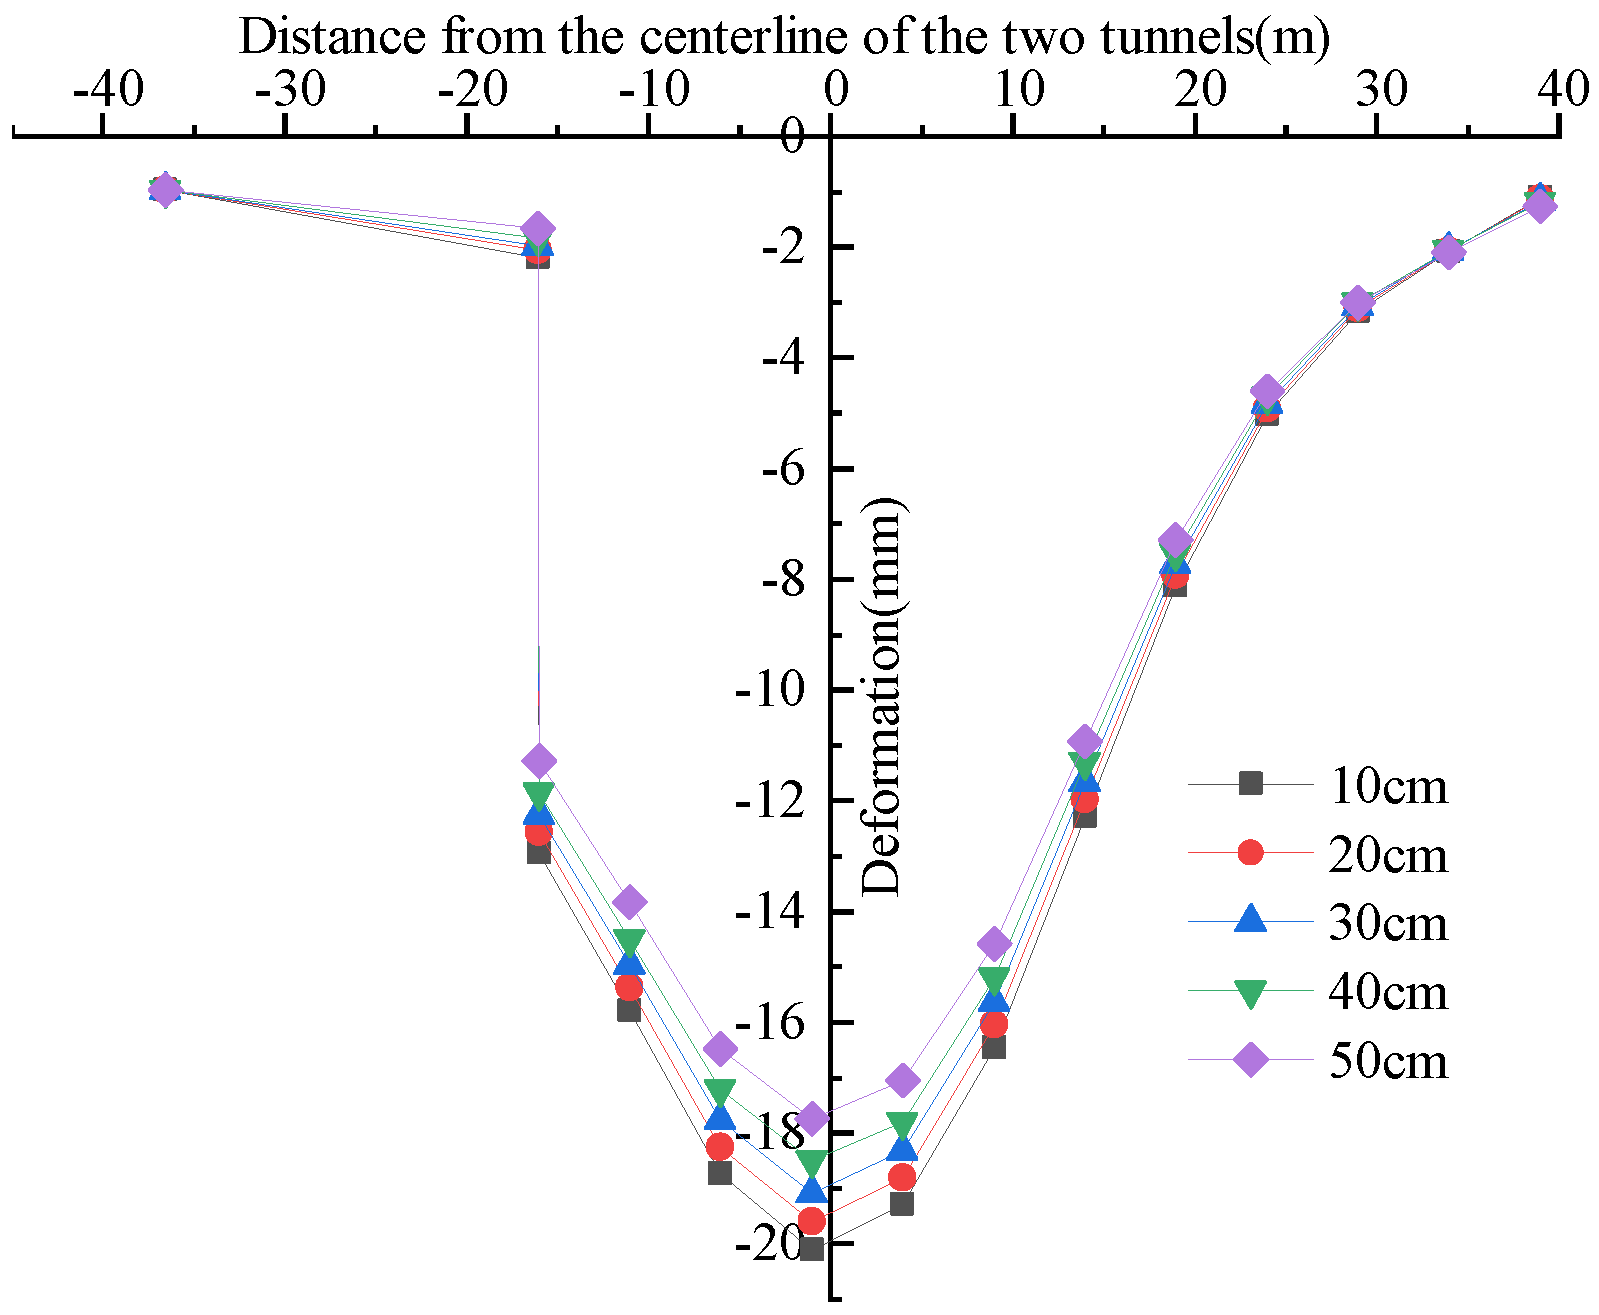
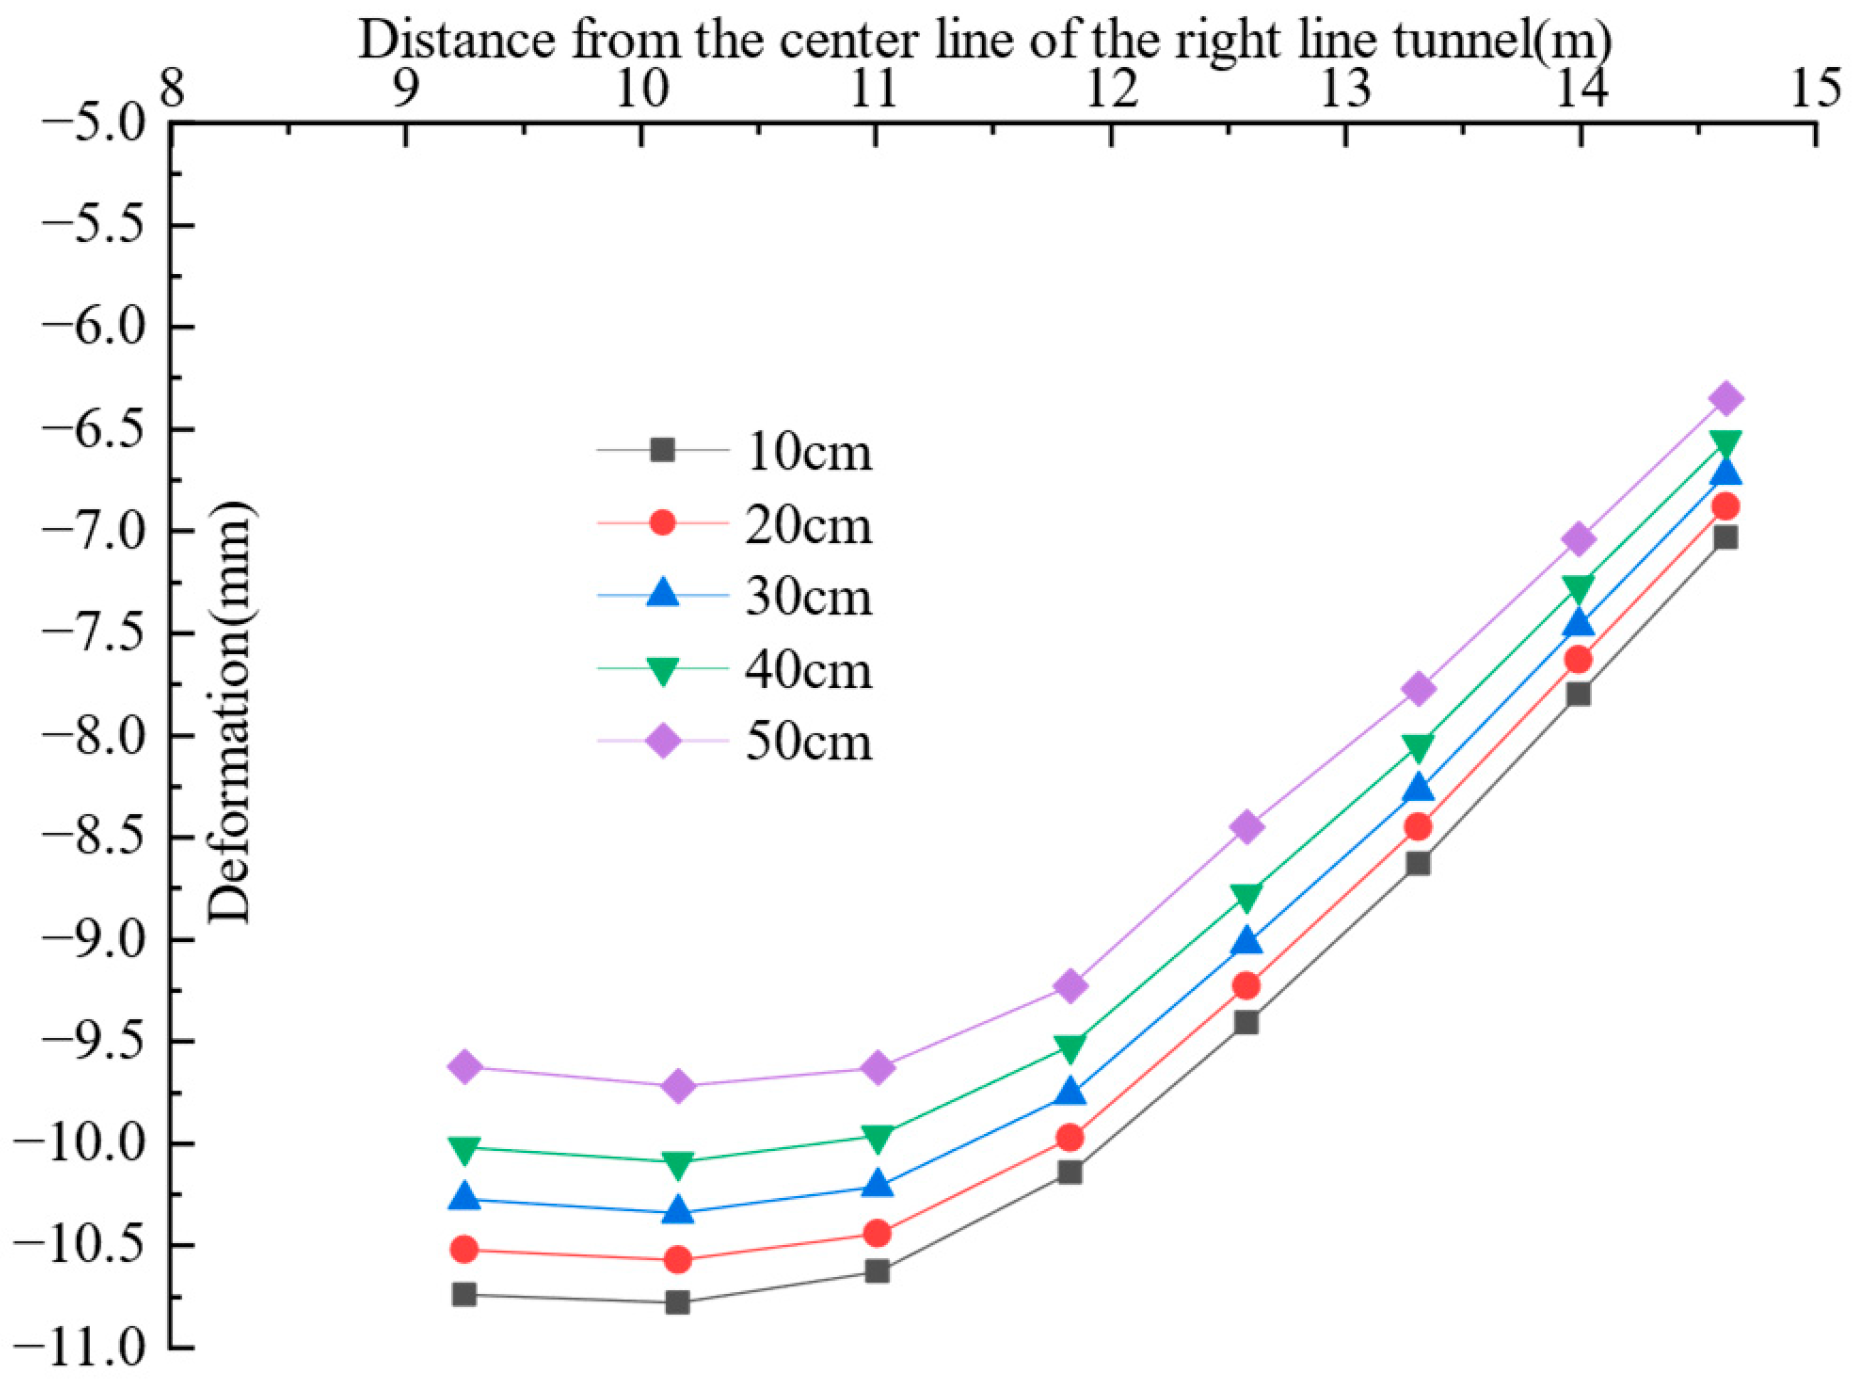
- When the pile foundation is within 11.01 m of the adjacent tunnel’s centerline, the pile body deformation increases with grouting layer thickness, while the differential deformation decreases. When the pile foundation is outside 11.83 m of the adjacent tunnel’s centerline, the deformation of the upper section of the pile body decreases as the grouting layer thickness increases, while the deformation of the lower section increases with increasing grouting layer thickness. Increasing the grouting layer thickness can significantly mitigate surface deformation and diminish the differential deformation on either side of the deformation joint between the bridge and the roadbed. However, as the grouting layer thickness increases, its effectiveness in reducing surface deformation gradually decreases.
- (4)
- The deformation curve’s shape along the pile’s depth is closely related to the stress release coefficient. When the pile foundation is within 11.01 m of the adjacent tunnel’s centerline, the deformation of the upper section of the pile body toward the negative X-axis decreases as the stress release coefficient increases. When the pile foundation is nearer to the adjacent tunnel’s centerline and the stress release coefficient is higher, the pile top deforms positively toward the X-axis. As the stress release coefficient increases, the lower section of the pile body gradually deforms in the negative X-axis direction. When the distance from the pile foundation to the adjacent tunnel’s centerline is less than 11.0 m, the pile top deformation initially increases and then decreases as the stress release coefficient increases. Reducing the stress release coefficient effectively minimizes surface deformation from tunnel shield construction and differential deformation at the bridge–roadbed joint.
- (5)
- For upper-soft and lower-hard strata, controlling surface deformation and adjacent structures within allowable limits can be achieved by optimizing shield construction parameters. This is significant for reducing construction time and project costs.
Author Contributions
Funding
Data Availability Statement
Conflicts of Interest
References
- Liu, W.; Zhao, L.; Yao, X.-C.; Zheng, H.-A.; Liu, W.-L. Impact of Shield Tunnel Construction on Adjacent Railway Bridge: Protective Measures and Deformation Control. Buildings 2024, 14, 3024. [Google Scholar] [CrossRef]
- Kanagaraju, R.; Krishnamurthy, P.; Ramanagouda, D.G.; Velusamy, S. Numerical Analysis of Displacements in Concrete Pile Foundationsinduced by Adjacent Tunnel Excavation in Sandy Soils. Matéria (Rio J.) 2024, 29, e20240391. [Google Scholar] [CrossRef]
- Phutthananon, C.; Lertkultanon, S.; Jongpradist, P.; Duangsano, O.; Likitlersuang, S.; Jamsawang, P. Numerical Investigation on the Responses of Existing Single Piles Due to Adjacent Twin Tunneling Considering the Lagging Distance. Undergr. Space 2023, 11, 171–188. [Google Scholar] [CrossRef]
- Du, Y.; Zhang, P.; Zhang, J. Mechanical Response and Control Measures of Pile Foundations under Close-Range Shield Tunneling in Water-Rich Sandy Pebble Strata. Adv. Civ. Eng. 2024, 2024, 4364716. [Google Scholar] [CrossRef]
- Wu, N. Environmental Engineering Deformation Control of High-Speed Railway Shield Tunnel Under-crossing Bridge Piles. J. Phys. Conf. Ser. 2021, 2029, 012133. [Google Scholar] [CrossRef]
- Zhang, S.; Zhang, X.; Ning, X.; Lu, H.; Jiang, M.; Wei, S.; Xiao, X. Effect of Shield-Tunnel Construction on the Horizontal Response of Adjacent Piles in a Silty Layer. Buildings 2023, 13, 2455. [Google Scholar] [CrossRef]
- Li, P.; Lu, Y.; Lai, J.; Liu, H.; Wang, K. A Comparative Study of Protective Schemes for Shield Tunneling Adjacent to Pile Groups. Adv. Civ. Eng. 2020, 2020, 6964314. [Google Scholar] [CrossRef]
- Zhang, J.X.; Wu, T.L. Numberical Analysis in the Deformation of Adjacent Buildings and Underground Pile Caused by Tunnel Shield Construction. Appl. Mech. Mater. 2012, 170–173, 1444–1449. [Google Scholar] [CrossRef]
- Zhao, Z.-F. Numerical Study on Effect of Shield Tunneling to Adjacent Pile Foundation of Overpass. J. Wuhan Univ. Technol. 2010, 32, 47–50. [Google Scholar] [CrossRef]
- Hu, X.Y.; He, C.; Jiang, Y.C.; Wang, J.; Zheng, H.L. Research on the Impact of Shield Tunneling on Adjacent Pile Foundation Using FEM. In ICPTT 2013; American Society of Civil Engineers: Reston, VA, USA, 2013; pp. 651–658. [Google Scholar] [CrossRef]
- Wei, Y.-H.; Wang, Y.; Mao, Y.; Chen, L.; Wang, M. Effect of Shield-Tunnel Excavation on Adjacent-Pile Foundation Based on Modified Cam-Clay Model. J. Expressway Transp. Res. Dev. (Engl. Ed.) 2020, 14, 84–92. [Google Scholar] [CrossRef]
- Xin, L.; Ye, S.; Wang, D. Numerical Analysis of the Impact of Excavation for Undercrossing Yellow River Tunnel on Adjacent Bridge Foundations. Appl. Rheol. 2023, 33, 20230104. [Google Scholar] [CrossRef]
- Kun, P.; Lianjin, T.; Yuchun, G.; Feng, W.; Jun, H. Numerical Analysis of Bridge Pile Deformation Caused by Shield Tunnel Construction underneath. Chin. J. Undergr. Space Eng. 2012, 8, 485–489. [Google Scholar] [CrossRef]
- Gao, E.; Chen, Z.; Li, L.; Jiao, T. Effects of Soil Displacement Induced by Subway Shield Tunneling Excavation on Bridge Pile Foundations. Sci. Technol. Rev. 2007, 19, 53–56. [Google Scholar]
- Huang, K.; Sun, Y.; Yang, J.; Li, Y.; Jiang, M.; Huang, X. Three-Dimensional Displacement Characteristics of Adjacent Pile Induced by Shield Tunneling under Influence of Multiple Factors. J. Cent. S. Univ. 2022, 29, 1597–1615. [Google Scholar] [CrossRef]
- Wei, Z. Analytical Solution for Evaluating the Responses of Existing Pile Caused by Adjacent Tunnel Excavation. Environ. Earth Sci. 2024, 83, 495. [Google Scholar] [CrossRef]
- Lei, M.; Shi, Y.; Tang, Q.; Sun, N.; Tang, Z.; Gong, C. Construction Control Technology of a Four-Hole Shield Tunnel Passing through Pile Foundations of an Existing Bridge: A Case Study. J. Cent. S. Univ. 2023, 30, 2360–2373. [Google Scholar] [CrossRef]
- Gu, X.; Chen, F.; Zhang, W.; Wang, Q.; Liu, H. Numerical Investigation of Pile Responses Induced by Adjacent Tunnel Excavation in Spatially Variable Clays. Undergr. Space 2022, 7, 911–927. [Google Scholar] [CrossRef]
- Huang, K.; Sun, Y.; Zhou, D.; Li, Y.; Jiang, M.; Huang, X. Influence of Water-Rich Tunnel by Shield Tunneling on Existing Bridge Pile Foundation in Layered Soils. J. Cent. S. Univ. 2021, 28, 2574–2588. [Google Scholar] [CrossRef]
- Liu, W.; Wang, M.; Luo, G.; Lu, W.; Xiao, H. Horizontal Response of Existing Pile Induced by Adjacent Shield Tunnelling with Large Longitudinal Slope. Tunn. Undergr. Space Technol. 2024, 153, 106036. [Google Scholar] [CrossRef]
- Ng, C.W.W.; Lu, H.; Peng, S.Y. Three-Dimensional Centrifuge Modelling of the Effects of Twin Tunnelling on an Existing Pile. Tunn. Undergr. Space Technol. 2013, 35, 189–199. [Google Scholar] [CrossRef]
- Zhang, Y.; Ding, C.; Lu, H.; Ji, W. Effects of Large-Scale Twin Tunnel Excavation on an Existing Pile Group: Three-Dimensional Centrifuge Modeling. Soil Mech. Found. Eng. 2022, 58, 500–506. [Google Scholar] [CrossRef]
- Song, G.; Marshall, A.M. Centrifuge Study on the Influence of Tunnel Excavation on Piles in Sand. J. Geotech. Geoenviron. Eng. 2020, 146, 04020129. [Google Scholar] [CrossRef]
- Ng, C.W.W.; Lu, H. Effects of the Construction Sequence of Twin Tunnels at Different Depths on an Existing Pile. Can. Geotech. J. 2014, 51, 173–183. [Google Scholar] [CrossRef]
- He, S.; Lai, J.; Li, Y.; Wang, K.; Wang, L.; Zhang, W. Pile Group Response Induced by Adjacent Shield Tunnelling in Clay: Scale Model Test and Numerical Simulation. Tunn. Undergr. Space Technol. 2022, 120, 104039. [Google Scholar] [CrossRef]
- Su, J.; Pan, Y.; Niu, X.; Zhang, C. Effect of Shield Tunneling on Adjacent Pile Foundations in Water-Rich Strata. Transp. Geotech. 2025, 52, 101557. [Google Scholar] [CrossRef]
- Wu, X.; Xu, J.; Wang, S.; Sha, P.; Han, Z.; Chen, X.; Shu, S.; Qiao, W.; Zeng, X. Ground Deformation of Shield Tunneling through Composite Strata in Coastal Areas. Buildings 2024, 14, 1236. [Google Scholar] [CrossRef]
- Wang, Y.; Zhang, Y.; Zhu, Z.; Du, M.; Qi, Y.; Tao, Z. A Novel Method for Analyzing the Factors Influencing Ground Settlement during Shield Tunnel Construction in Upper-Soft and Lower-Hard Fissured Rock Strata considering the Coupled Hydromechanical Properties. Geofluids 2020, 2020, 6691157. [Google Scholar] [CrossRef]
- Ding, J.; Zhang, S.; Zhang, Z.L.H. Ground Settlement Caused by Shield Tunneling in Soil-Rock Composite Strata. J. Perform. Constr. Facil. 2021, 35, 7. [Google Scholar] [CrossRef]
- Li, J.; Liu, A.; Xing, H. Study on Ground Settlement Patterns and Prediction Methods in Super-Large-Diameter Shield Tunnels Constructed in Composite Strata. Appl. Sci. 2023, 13, 10820. [Google Scholar] [CrossRef]
- Liu, C.; Wang, Z.; Jiang, Y. Settlement Prediction of Double Line Shield Tunnel in Upper-soft and lower-hard Stratas. Soil Mech. Found. Eng. 2022, 59, 385–393. [Google Scholar] [CrossRef]
- Liu, C.; Zhang, S.; Zhang, D.; Zhang, K.; Wang, Z. Model tests on progressive collapse mechanism of a shallow subway tunnel in soft upper and hard lower composite strata. Tunn. Undergr. Space Technol. 2023, 131, 104824. [Google Scholar] [CrossRef]
- Jiao, N.; Sun, S.; Liu, J.W.X. Analysis of existing railway deformation caused by double shield tunnel construction in soil-rock composite strata. Energy Rep. 2023, 9 (Suppl. 2), 159–165. [Google Scholar] [CrossRef]
- Jiao, N.; Wan, X.; Ding, J.; Zhang, S.; Liu, J. Pipeline deformation caused by double curved shield tunnel in soil-rock composite strata. Geomech. Eng. 2024, 36, 131–143. [Google Scholar] [CrossRef]
- Feng, J.; Yang, H.J.; Zhang, Y. A Study on Excavation Characteristics of Tunnel with Upper-Soft Lower-Hard Strata. Geofluids 2022, 2022, 1094281. [Google Scholar] [CrossRef]
- Li, L.; Du, X.; Zhou, J. Numerical Simulation of Site Deformation Induced by Shield Tunneling in Typical Upper-Soft-Lower-Hard Soil-Rock Composite Strata Site of Changchun. KSCE J. Civ. Eng. 2020, 24, 3156–3168. [Google Scholar] [CrossRef]


| Name of Soil Layer | Code | Density (kg/m3) | Elastic Modulus (E/MPa) | Force of Cohesion (c/kPa) | Angle of Internal Friction (°) | Poisson Ratio | Lamination Thickness (m) |
|---|---|---|---|---|---|---|---|
| Plain fill | STT | 1870 | 12 | 15.0 | 10.0 | 0.35 | 2.87 |
| Miscellaneous fill | DYCT | 1850 | 10 | 12.5 | 8.0 | 0.36 | 0.64 |
| Fully weathered tuff lava | DECT | 1920 | 80 | 25.0 | 19.0 | 0.32 | 2.70 |
| Granular strongly weathered tuff lava | DSCT | 2000 | 500 | 28.0 | 25.0 | 0.31 | 3.70 |
| Fragmented strongly weathered tuff lava | DSICT | 2050 | 800 | 35.00 | 28.0 | 0.29 | 24.20 |
| Medium-weathered tuff lava | DWCT | 2200 | 1000 | 50.00 | 32.0 | 0.28 | 2.76 |
| Monitoring Projects | Allowable Settlement of Bridge Piers (mm) | Differential Settlement Between Longitudinal Adjacent Bridge Piers (mm) | Settlement Between Transverse Adjacent Pier Abutments (mm) | Horizontal Displacement of Bearing Abutment (mm) | Surface Vertical Displacement (mm) |
|---|---|---|---|---|---|
| Allowable deformation | 25 | 2 | 3 | 3 | Sedimentation: 30 Swell: 10 |
| Name | Code | Density (kg/m3) | Elastic Modulus (E/MPa) | Poisson Ratio | Name | Code | Density (kg/m3) | Elastic Modulus (E/MPa) | Poisson Ratio |
|---|---|---|---|---|---|---|---|---|---|
| Lining | CQ | 2500 | 210,000 | 0.2 | Pile foundation | ZHUANGJI | 2350 | 270,000 | 0.2 |
| Grouting layer | DDC | 2400 | 2500 | 0.23 | Pier column | DUNZHU | 2450 | 270,000 | 0.2 |
| Pavement structure | LMJG | 2450 | 5000 | 0.22 | Bridge deck system | QL | 2500 | 270,000 | 0.2 |
| Cover (tie) beam | GL | 2500 | 270,000 | 0.2 |
| Pile Number | 0#1 | 0#2 | 0#3 | 0#4 | 0#5 | 0#6 | 0#7 | 0#8 | |
|---|---|---|---|---|---|---|---|---|---|
| Deformation (mm) | |||||||||
| Predicted deformation (mm) | −1.19 | −0.87 | −0.55 | −0.24 | −0.15 | 0.42 | 1.00 | 1.58 | |
| Measured deformation (mm) | −1.02 | −0.75 | −0.48 | −0.21 | −0.06 | 0.49 | 1.05 | 1.61 | |
| Differential deformation (mm) | −0.17 | −0.12 | −0.07 | −0.03 | −0.09 | 0.07 | 0.05 | 0.03 | |
| Pile Number | 1#-1 | 0#-1 | 1#-2 | 0#-2 | 1#-3 | 0#-3 | 1#-4 | 0#-4 |
|---|---|---|---|---|---|---|---|---|
| Predicted deformation (mm) | −0.62 | −0.60 | −0.80 | −0.80 | −0.98 | −1.01 | −1.15 | −1.22 |
| Measured deformation (mm) | −0.61 | −0.79 | −0.80 | −1.00 | −0.98 | −1.21 | −1.16 | −1.40 |
| Differential deformation (mm) | 0.00 | −0.19 | 0.00 | −0.20 | 0.00 | −0.20 | −0.01 | −0.18 |
| Pile number | 1#-5 | 0#-5 | 1#-6 | 0#-6 | 1#-7 | 0#-7 | 1#-8 | 0#-8 |
| Predicted deformation (mm) | −0.98 | −1.06 | −1.00 | −1.07 | −1.02 | −1.08 | −1.05 | −1.09 |
| Measured deformation (mm) | −1.01 | −1.27 | −1.02 | −1.26 | −1.02 | −1.25 | −1.03 | −1.25 |
| Differential deformation (mm) | −0.03 | −0.21 | −0.02 | −0.19 | 0.00 | −0.17 | 0.02 | −0.16 |
Disclaimer/Publisher’s Note: The statements, opinions and data contained in all publications are solely those of the individual author(s) and contributor(s) and not of MDPI and/or the editor(s). MDPI and/or the editor(s) disclaim responsibility for any injury to people or property resulting from any ideas, methods, instructions or products referred to in the content. |
© 2025 by the authors. Licensee MDPI, Basel, Switzerland. This article is an open access article distributed under the terms and conditions of the Creative Commons Attribution (CC BY) license (https://creativecommons.org/licenses/by/4.0/).
Share and Cite
Wang, J.; Lei, N.; Tang, X.; Wang, Y. Research on the Deformation Laws of Adjacent Structures Induced by the Shield Construction Parameters. Buildings 2025, 15, 2426. https://doi.org/10.3390/buildings15142426
Wang J, Lei N, Tang X, Wang Y. Research on the Deformation Laws of Adjacent Structures Induced by the Shield Construction Parameters. Buildings. 2025; 15(14):2426. https://doi.org/10.3390/buildings15142426
Chicago/Turabian StyleWang, Jinhua, Nengzhong Lei, Xiaolin Tang, and Yulin Wang. 2025. "Research on the Deformation Laws of Adjacent Structures Induced by the Shield Construction Parameters" Buildings 15, no. 14: 2426. https://doi.org/10.3390/buildings15142426
APA StyleWang, J., Lei, N., Tang, X., & Wang, Y. (2025). Research on the Deformation Laws of Adjacent Structures Induced by the Shield Construction Parameters. Buildings, 15(14), 2426. https://doi.org/10.3390/buildings15142426