Article

Effects of Thermostat Control on Energy Use and Thermal Comfort in Office Rooms Under Different Glazing Ratio

1
School of Environment and Municipal Engineering, Qingdao University of Technology, No. 11 Fushun Road, Qingdao 266520, China
2
International Centre for Indoor Environment and Energy, Department of Environmental and Resource Engineering, Technical University of Denmark, Nils Koppels Allé, Building 402, 2800 Kongens Lyngby, Denmark
*
Author to whom correspondence should be addressed.
Buildings 2025, 15(14), 2422; https://doi.org/10.3390/buildings15142422
Submission received: 29 April 2025 / Revised: 27 June 2025 / Accepted: 8 July 2025 / Published: 10 July 2025
(This article belongs to the Section Building Energy, Physics, Environment, and Systems)

Abstract

Thermal comfort of occupants is characterized by operative temperature (Top), while thermal environment is usually controlled by air temperature (Ta). For perimeter areas in buildings, the use of Ta in the control may lead to uncomfortable conditions. In this paper, thermostat controls based on air (TC-Ta) and Top (TC-Top) were compared in an office module based on different glazing ratio (GR) and indoor units. The results showed that, for a fan–coil system, with TC-Top, thermal comfort can be better, while for a ceiling panel system thermal comfort was similar with both controls. For fan coils, with TC-Top, Ta in offices became higher in the winter and lower in the summer, which improved thermal comfort along with increased energy use. For both GR conditions, the radiant panel could compensate for the presence of cold/warm surfaces, and it decreased the differences between the two controls, especially during cooling, which made the radiant system more suitable in large GR condition. With TC-Top, for the ceiling panel system, the increment of energy use was quite small. According to the results, under large GR, TC-Top was better for the fan–coil system to assure thermal comfort, and both control methods could be used in ceiling panel system. This study presents a comprehensive comparison of the two control strategies for both convective and radiant systems, highlighting their performance under varying GR conditions. The results also provide guidance for the optimal control of different indoor units under different GR conditions.

1. Introduction

Much energy has been used in heating, ventilating, and air-conditioning (HVAC) systems of buildings to keep thermal comfort [1,2]. The choice of heating system can significantly affect thermal comfort, especially in the case of dual heating systems, where maintaining uniform temperature distribution across different zones becomes a challenge. In such systems, balancing the heating output between the air and radiant components is crucial for achieving optimal thermal comfort [3]. There are six main parameters affecting thermal comfort including two individual parameters and four environmental parameters. The two individual parameters are clothing insulation and metabolic rate. The four environmental parameters include air temperature (Ta), mean radiation temperature (Tr), relative humidity, and air velocity [4]. In offices, occupants’ metabolic rate is generally within a small range (from 1.0 to 1.2 met). People usually wear typical clothes in air-conditioned space, and the clothing insulation in offices is generally 0.5 clo in the summer and 1.0 clo in the winter. Of the four environmental parameters, relative humidity is commonly kept in the range from 30 to 70%, which has little effect on thermal comfort. Air velocity in occupant zone is usually lower than 0.2 m/s [5]. Tr is dependent on the structure and temperatures of internal surfaces. There are requirements about the allowable radiant temperature asymmetry when radiant cooling/ heating is used [5]. In practice, the control of Tr is rare. In HVAC systems, Ta is the most commonly used parameter to control indoor thermal environment.
Thermostat control based on Ta (TC-Ta) is reliable to keep thermal comfort for spaces where the difference between Tr and Ta is small. However, when the difference becomes larger, especially in highly glazed buildings, the use of TC-Ta may become unreliable and lead to discomfort for the occupants [6]. This issue becomes more critical in modern buildings, which are designed with large windows to enhance aesthetics and natural lighting. The increased glazing ratio (GR) significantly amplifies the impact of radiant temperature variations, making it more difficult to maintain thermal comfort using TC-Ta. For spaces with external windows, the internal surface temperature of windows would be quite different from Ta during cold and hot seasons. During winter, the lower temperature of the inner surface of the translucent structure makes three effects of uncomfortable feeling appear, which included cold down draft at the glazing area and along the floor, radiant asymmetry due to low surface temperatures, and condensate formation on the internal glazing surface [7]. In the summer, the window surface may lead to radiant asymmetry due to warm surface temperature. Furthermore, solar radiation through windows affects the surface temperature of internal walls and the direct exposure of occupants. This may cause occupants to feel hot or cold irrespective of comfortable Ta [8]. In such conditions, it is possible that the space might use more energy due to overregulation by uncomfortable occupants [9,10,11]. This could be more significant in highly glazed buildings [12,13,14]. To keep thermal comfort and energy saving, the effect of Tr should be considered in the control.
Researchers have extensively studied the influence of thermal radiation on thermal comfort. Hardy [15] and Gagge et al. [16] quantified these effects by using operative temperature (Top), which is the combination of Ta and Tr. According to standards [4,5,17], thermal comfort of an occupant is characterized by Top, which is an average of Ta and Tr (if air speed is less than 0.2 m/s). According to these standards, appropriate Top must be assured in buildings.
In modern buildings with higher GR, the disparity between Ta and Top is more pronounced, necessitating a reevaluation of existing thermostat controls. Experience in existing buildings shows that high GR is accompanied by decreasing Tr to be counterbalanced with higher indoor Ta in order to keep the prescribed Top in the winter. It is the opposite in the summer: high Tr should be compensated with lower indoor Ta unless radiant systems are used [18]. Under such situation, TC-Ta was not sufficient especially for perimeter areas of buildings [19]. The idea of thermostat control based on Top (TC-Top) was proposed to offer a possible solution in keeping indoor thermal comfort. Thereby, a few questions about TC-Top appeared. How does the use of TC-Top affect the thermal environment in different systems? How about the effects on energy use? What are the differences between TC-Ta and TC-Top under different GR?
Some of the questions have been studied by a few researchers. By means of simulations, Jain et al. compared the effects of two controls on energy use of highly glazed buildings in New Delhi (India) [20]. Their results stated that energy use in such buildings can be underestimated because of the use of TC-Ta. In another simulation study, Julien et al. found an increase in heating energy when TC-Top was adopted [21]. According to these references, the application of TC-Ta or TC-Top influences the heating/cooling energy supplied by HVAC systems.
In a study by Kontes et al., two buildings were simulated to compare the impact of TC-Ta and TC-Top on thermal comfort [22]. The authors found that the widely used Ta was unable to be a representative and controlling parameter for thermal comfort in a systematic way in buildings. Their study also showed that due to the diversity of buildings and HVAC systems, the simple adoption of Top in the control cannot guarantee thermal comfort. Wang et al. compared the effects of the two control methods on energy use and thermal comfort [23]. Their results showed that TC-Top had different effects on thermal comfort and energy saving for different HVAC indoor units. A recent study about thermal environment in a library reading room also showed that there were large differences in Top distribution across the space [24]. In this study, the use of TC-Ta and TC-Top was compared for fan–coil units, and an optimized control combining TC-Ta and TC-Top based on outdoor air temperature was recommended.
These simulations show that the two control methods have certain influence on energy use and thermal comfort in buildings. However, these studies were based on different indoor units and buildings. Therefore, the conclusions may vary accordingly. For different HVAC indoor units, further study is necessary to make clear the influence of the two control methods. Furthermore, with increased GR, it is expected that the use of TC-Top may provide an effective solution. However, few studies discussed this by comparing the effect of TC-Top under different GR conditions. The influence and applicability of the two control modes on the thermal environment and energy use are not clear under different GR. As an important factor that affects the perimeter thermal environment and energy use, the effect of GR should also be considered [25,26,27].
In the present study, simulations were carried to compare the effects of the two controls on energy use and thermal comfort considering the factor of GR. The simulation would be based on an office module with two different GR (30% and 100%) construct. A fan–coil system representing convective system and a radiant ceiling panel system representing radiant system would be also investigated.
Generally, this study aims to address the gap in current research by comparing TC-Ta and TC-Top thermostat controls considering the effect of GR, particularly focusing on the impact on thermal comfort and energy use. The comparison of convective and radiant systems can also give better understanding about the applicability of two control methods under varying GR conditions, which would clarify the applicability and differences of the two control modes under small and large GR conditions. This study can also provide more comprehensive insights about the control methods and complement the deficiencies of the current studies.

2. Methods

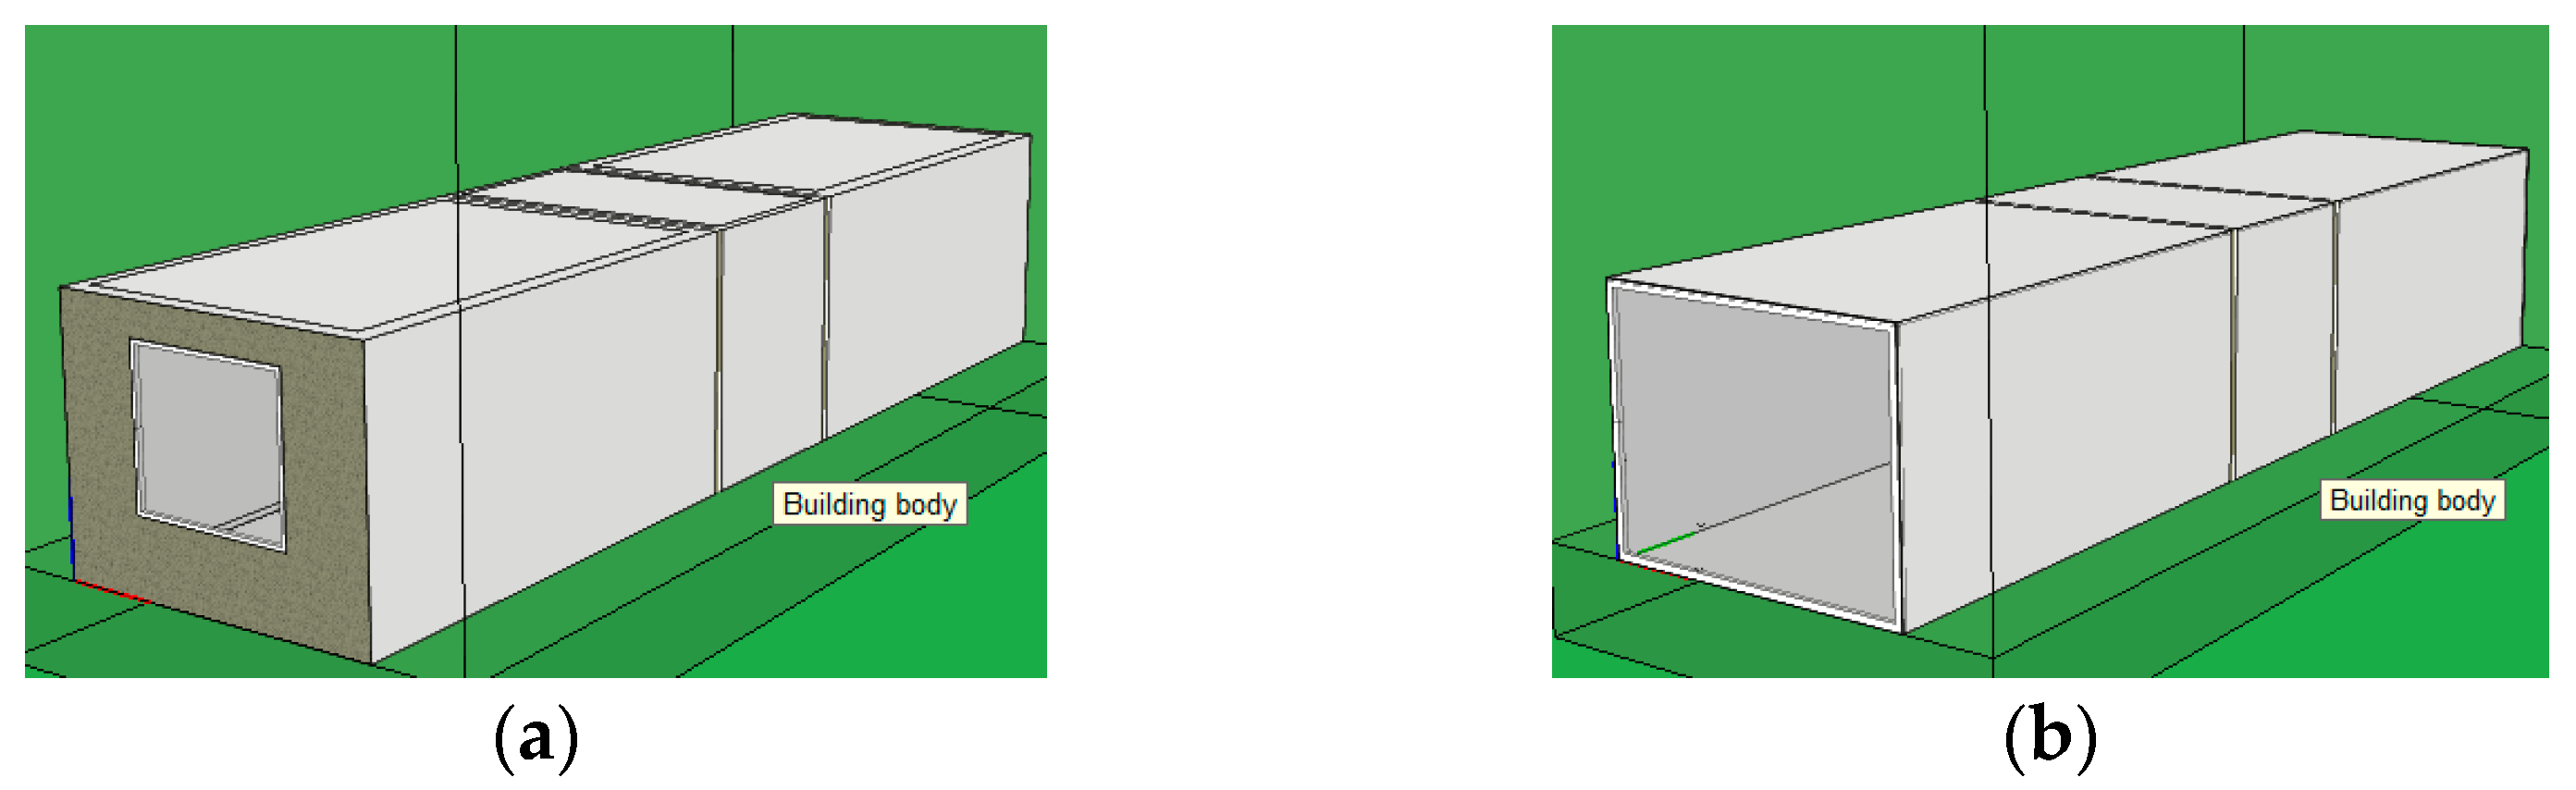
The simulations were conducted with IDA ICE (version 4.8, EQUA Simulation AB, Solna, Sweden) building simulation tool. The selected building module was used in previous studies [23,28], which is a central module of typical office building with two offices (facing north and south) separated by a corridor. The size of two offices are the same, each measure 5.5 m in length, 3.6 m in width, and 2.8 m in height. The size of corridor is 2.4 m in width and 3.6 m in length. Each office has an external wall/ window, and adjacent rooms to the module are set to the same temperature as the simulated zones. The building envelope is a light construction type. The ceiling/floor has a U-value of 1.24 W/(m2·K), the exterior wall has a U-value of 0.38 W/(m2·K), the internal wall has a U-value of 0.48 W/ (m2·K), and the windows have a U-value of 2.09 W/(m2·K). Details about the module can be found in references [23,28]. The two models in the simulation are shown in Figure 1. It should be noticed that for the 100% GR, the actual installing structure of glass curtain wall would make the GR less than 100%, which was not considered in the module.
In the simulations, climate data input of typical meteorological year was from ASHRAE Fundamentals 2013, which was the built-in meteorological parameters in the simulation software. The building was assumed to be located in Paris, France. The cooling season was from 1 June to 31 August, and the heating season was from 1 November to 31 March. The months in between were transition periods. The natural infiltration of offices was set to 0.5 ACH under the pressure difference of 50 pa, which would change according to the outdoor climate condition and was much smaller most of the time.
The internal heat gains and settings for occupants were exactly the same as those in reference [23]. Occupants were assumed to stay in the offices from 8:00 to 12:00 and 13:00 to 17:00. There was an hour of lunch break from 12:00 to 13:00. The office zones have internal heat load of 630 W/zone (32 W/m2) including heat load from occupants, lighting, computers and other office facilities. During lunch break, all the facilities were off and no occupants were in the offices. Windows of the offices were equipped with internal solar shadings (light woven drape), which had simple two-position (on/off) control. The internal drape would be activated when the solar radiation intensity on inside glass pane exceeded 200 W/m2. When the shading was activated, the total shading coefficient of the window would be multiplied by a factor of 0.71 and a coefficient of 0.87 would be considered for the U-value of the window. External shadings were not considered in the simulations. Windows could be opened by using temperature and schedule control during transition periods. Sensors of Ta or Top were set in each zone to achieve individual zone control.
For the fan–coil system, there was a fan–coil unit in each zone including the corridor. The fan–coil unit had constant air volume rate of 5 L/(s·m2). The temperature of each zone was set to 25 ± 1 °C during cooling and 21 ± 1 °C during heating. The supply water temperature was set to 15 °C for cooling and 40 °C for heating. The temperature difference between the supply and return water flows was 5 °C for cooling and 10 °C for heating under design power. The supply Ta of fan–coil unit would be adjusted separately based on the difference between the controlled temperature and the set point in each zone. The fan–coil units operated from 8:00 to 17:00.
For the radiant ceiling panel system, the ceiling consisted of radiant panels in each zone. There were water pipes running through the ceiling panels below the ceiling. In this system, the panel was not embedded in the building construction. Considering the direct contact of cooling panel with air, to avoid condensation the supply water temperature for cooling was set to 19 °C. The supply water temperature was 40 °C for heating. The temperature difference between the supply and return water flows was 3 °C for cooling and 10 °C for heating at the designed power. The ceiling panels were operating from 7:00 to 17:00.
A ventilation system with heat recovery (effectiveness was 0.6) would be running together with the fan–coil system or the radiant ceiling system. The supply airflow rate of the ventilation system was 2 L/(m2·s) and the supply temperature was constant (18 °C). The ventilation system operated from 8:00 to 17:00 on weekdays.

3. Results

3.1. Energy Use

3.1.1. Energy Use on Typical Days

In order to show more details about the effect of relevant factors on energy use, both heating and cooling energy use on typical days were firstly compared. According to the climate data, the mean monthly outdoor temperature of February was the lowest and the mean monthly outdoor temperature of August was the highest. The two typical days were selected in the two months: 14 February and 1 August. 14 February was the middle weekday in the coldest week, and 1 August was the middle weekday in the hottest week. The middle of weekdays were selected as thermal parameters could be more stable during intermittent operation. The outdoor Ta was ranging from −1.1 °C to 6 °C on 14 February, and 16 °C to 31.3 °C on 1 August as shown in Figure 2.
Figure 3 shows the hourly supplied energy use for heating and cooling (per unit area) of the simulated module on typical days during heating and cooling seasons. On 14 February, at the beginning of the day the heating load was quite large. It then decreased gradually. In later hours of the afternoon, the energy use for heating was almost unchanged. This part of energy was used practically for ventilation. On 1 August, the outdoor temperature was quite low in the morning, and cooling load increased during almost the whole day. In the winter, outdoor temperature increased during noon, which lowered the heating load. Besides, heat dissipated from occupants and equipment decreased the heating load too. These became unfavorable factors in the summer and increased the cooling load during afternoon.
There were some differences in the hourly energy supply between the two controls. On 14 February, for fan coils, when GR was 30%, the energy use of heating under TC-Top was much higher than that of TC-Ta during start up; when GR increased to 100%, the difference became smaller. For ceiling panels, for 30% GR, the energy use of heating between the two controls was also different during start up. The difference was much smaller when GR was 100%. On 1 August, for the fan coils, compared to TC-Ta, the energy used for cooling with TC-Top became higher for both GR. For 30% GR, the difference was quite obvious during later afternoon. For ceiling panels, the difference between the two controls was much smaller compared to the fan coils.
The hourly heating/cooling load of 100% GR was much higher than that of 30% GR. It can be noticed that the peak loads of heating and cooling increased significantly for both systems when GR increased. The peak value of heating was more than doubled in most cases when GR increased to 100%, while for cooling, the peak value increased approximately 30 to 40%.
As to the two HVAC systems, during cooling, the peak load of the ceiling panels was almost the same with the fan coils. During heating, the peak value of the ceiling panels became higher than that of the fan coils when GR increased to 100%. During the start of heating, when GR was 100%, the peak load of ceiling panels was approximately twice that of the fan coils. The heating load of the ceiling panels then deceased more quickly than the fan coils.

3.1.2. Energy Use in a Year

The total energy use (thermal energy supplied to the offices) of per unit area of the whole module in the simulated year is shown in Figure 4. From the figure, heating energy use was much smaller than cooling energy use. One reason was that the offices had internal heat gains, which decreased heating energy use in the winter and increased cooling energy in the summer. It could be noticed that control methods, GR, and types of system had impact on energy use for both heating and cooling.
For the two HVAC systems, the two control methods showed similar impact on energy use of heating. The energy use was increased when TC-Top was used compared to TC-Ta. For the ceiling panels, the increment was approximately 14% when GR was 30%, and 4% when GR was 100%. For the fan coils, the increment of heating energy use was 12% for 30% GR and 7% for 100% GR.
For energy use of cooling, when GR was 30%, the ceiling panels used more energy with TC-Ta. When GR increased to 100%, the ceiling panels used more energy with TC-Top. By contrast, the effect of the two control methods on the ceiling panels was quite limited as the difference was only about 3% for the 30% GR condition, and it was less than 1% when GR was 100%. For the fan coils, the energy use for cooling increased more obviously when TC-Top was used. The increment was 13% for 30% the GR condition and 7% for the 100% GR. This had been reported in reference [17,22], in which convective system uses more energy when TC-Top was applied.
As expected, the effect of GR on energy use was the most prominent that both energy use of cooling and heating increased significantly when GR increased. Compared with the 30% GR condition, when TC-Ta was used, energy use for heating increased 173% for the ceiling panel system and 181% for the fan–coil system in the 100% GR condition. For energy use of cooling, the increment was 48% for the ceiling panels and 59% for the fan coils. Similarly, compared with the 30% GR condition, when TC-Top was used, the energy used in heating increased 142% for the ceiling panels and 169% for the fan coils, while energy use for cooling increased 43% and 56%, respectively. In general, the increment of energy use of heating was more significant than that of cooling when GR increased.
It can be noticed that the energy use for cooling and heating of the two systems was slightly different. The average difference of energy use between the two systems was approximately 4% for heating and less than 2% for cooling.
The results of total energy use were basically consistent with those of typical days in heating and cooling seasons (as shown in Figure 3).

3.2. Thermal Environment

3.2.1. Indoor Temperatures on Typical Days

The effects of control method and GR on indoor temperatures in the two systems are shown in Figure 5. It is the hourly change of Top and Ta on the two typical days.
During heating (Figure 5a,b), Ta was slightly higher than Top. This was due to the low surface temperature of external facade in the winter. When TC-Top was used, the two temperatures of both the north and south offices would be a little higher than those of TC-Ta. However, the indoor temperature difference between the two controls was negligible in most conditions, except for one condition of the north office when GR was 100% and the fan coils were used. In this condition, the maximum difference between Top and Ta was about 1 °C. When TC-Ta was used, Ta was kept at 21 °C, while Top was lower than 21 °C. When TC-Ta was used, Top was around 21 °C, while Ta was higher.
For the north office with 100% GR, when the ceiling panels were used, the maximum difference between Ta and Top was about 0.4 °C. The effect of control methods on indoor temperatures became smaller. The heating surfaces of ceiling panels compensated the low temperature of surfaces in such conditions, and decreased the difference between Ta and Tr.
For the south office, when GR was 100%, the temperature difference was much smaller, and the control methods showed little influence on indoor temperatures. This was because the south office had more solar radiation, which increased the temperature of the external surfaces during the winter.
From Figure 5a,b, on 14 February, it could be also noticed that the variation of indoor temperatures during the day with 100% GR became higher than that of 30% GR. For the north office, the maximum temperature drift for the 100% GR was approximately 5 °C for the two systems. For the 30% GR, it was about 2 to 3 °C. For the south office, the temperature changes were similar to those of the north office, except for that the temperatures of the south office were a little higher than that of the north office under the corresponding conditions. For both offices, the starting temperatures for the 100% GR were approximately 3 to 4 °C lower than that of the 30% GR. Furthermore, when GR was 100%, the office temperatures were lower than that of 30% GR during afternoon, and the difference was approximately 1 to 1.5 °C. There were internal heat gains in the offices, which decreased the energy used for heating and made the room temperatures increased in the afternoon, and for 30% GR this effect was more significant as it had less heat loss.
Figure 5c,d show the indoor temperatures on summer day. The effect of control methods on indoor temperature was more significant for the fan–coil systems, while for the ceiling panel system the effect was much smaller.
For the fan coils, Ta was lower than Top in all conditions due to higher external surface temperatures in the summer. The difference between Top and Ta increased during the afternoon. With 100% GR, the difference was higher than that of 30% GR, especially for the south office. For the south office, the maximum difference between Ta and Top was 0.8 °C for 100% GR and 0.5 °C for 30% GR. For the north office, it was 0.4 °C and 0.3 °C, respectively. With TC-Top, Ta was lower than that of TC-Ta. This caused the small increase in cooling energy use when TC-Ta was used.
For the ceiling panels, for 30% GR, Ta was just slightly higher than Top in most conditions. This was due to the use of cooling panels, which had low temperature surfaces and compensated for the increased internal surface temperatures of the external building structures. Thus, the Tr was lowered and would become close to Ta. As GR increased, the temperature difference between Top and Ta did not change much during the morning, while the two temperatures became almost the same in the afternoon. During the afternoon, the ceiling panels supplied more energy to cool the offices, and the surface temperature of the panels might be low enough to just compensate the high temperature of external surfaces. In such conditions, the difference between Ta and Top would be zero, and the two controls would have same effect on energy use and thermal conditions.

3.2.2. Surface Temperatures on Typical Days

On the typical days, the influence of the control method and type of system on indoor temperatures was more significant for the north office during heating, while the south office was affected more during cooling. The surface temperatures on typical days are shown in Figure 6. The data of north office on 14 February and south office on 1 August were selected. The surface temperatures of window, ceiling, floor, and external wall (only for 30% GR) were compared. For the ceiling panels, the surface temperature of ceiling was actually the surface temperature of panel.
On 14 February, for the north office, the surface temperatures of the window and floor of 30% GR were higher than those of 100% GR for both systems. For 30% GR, these temperatures at the beginning hours were approximately 2 °C higher than those of 100% GR.
For the ceiling panels, for both GR, the surface temperatures of floor, window, and external wall were almost the same for the two control methods. The change of surface temperature of the ceiling was slightly different for the change of control methods and GR. On 14 February, the maximum surface temperature of ceiling was approximately 31 °C for both GR. When GR was 30%, the ceiling temperature increased to 31 °C quickly during start up, and then dropped to approximately 22 °C. The duration of 31 °C was about an hour when TC-Ta was used, which became shorter when TC-Top was used. When GR was 100%, the duration was almost the same for both controls, while the change of the ceiling temperature with TC-Top was smaller than that of TC-Ta during 9:00 to 13:00. It can be noticed that during lunch break, the surface temperature of the ceiling decreased slightly when GR was 30%, while it increased when GR was 100%. In the simulation, it was assumed that there were no occupants, and all the office facilities were turned off during lunch break. There were no internal heat gains any more. For 100% GR, in order to ensure that the temperature was within the set range, heating was necessary during this time. For 30% GR, the room temperatures were higher than that of 100% GR (Figure 5a), and there was no need of heating. The ceiling temperature represented the amount of the heat supplied by the panel. The results were accordant with results of energy use on typical days (Figure 4).
For the ceiling panels, on 1 August, the minimum surface temperature of the ceiling was approximately 21 °C for both GR. For 30% GR, when TC-Top was used the surface temperature of ceiling was slightly higher than that of TC-Ta almost all the time, except during the lunch hour. For 100% GR, the difference became smaller. On summer days, the temperature of ceiling represented the energy used for cooling, and the changes of ceiling temperature in different conditions were coincident with the previous results (Figure 4).
For the fan coils, the effect of two control methods on surface temperatures was negligible when GR was 30%. On 14 February, when GR was 100%, the corresponding surface temperatures of north office under TC-Top were slightly higher than that of TC-Ta. On 1 August, for the south office, the corresponding surface temperatures under TC-Top were slightly lower her than that of TC-Ta.

3.3. Thermal Comfort

The statistics of thermal comfort were based on international standards ISO 17772 and EN 16789-1 [29,30]. Thermal comfort conditions were classified into four levels: Cat. I (−0.2 ≤ PMV ≤ 0.2), Cat. II (−0.5 ≤ PMV ≤ 0.5), Cat. III (−0.7 ≤ PMV ≤ 0.7), and Cat. IV (−1.0 ≤ PMV ≤ 1.0). For office activity, the correlated ranges of Top for the four levels are 21–23 °C, 20–24 °C, 19–25 °C, and 17–25 °C, respectively with clothing insulation of 1.0 clo in the winter; and 23.5–25.5 °C, 23–26 °C, 22–27 °C, and 21–28 °C with clothing insulation of 0.5 clo in the summer. Besides the four levels, Cat. V was defined as unacceptable conditions where PMV was lower than −1.0 or higher than 1.0. The results of thermal comfort conditions are shown in Figure 7. The proportion of the number of hours corresponding to each level in the total hours during cooling and heating was counted.
In general, thermal comfort conditions of the south office were better than those of the north office. There was more percent of Cat. I for south office than the north office in most cases.
From Figure 7, TC-Top tended to be better in that the percent of Cat. I was higher than that of TC-Ta in all cases for the fan coils. It can be noticed that, in the condition of the north office, when GR was 100% and the fan coils was used, the percent of Cat. I increased approximately 15% when TC-Top was used.
For the ceiling panels, thermal comfort was improved with TC-Top for the north office, not for the south office. Thermal comfort of the north office was more influenced by the winter condition, while the south office was more affected by the summer condition. During heating, because of the internal heat gains, the ceiling panel was heated mainly in the beginning hours of a day. During later hours, the ceiling panels did not supply heat, and the surface temperature of panels was close to the room temperature (see Figure 6). Under such conditions, the influence of the two controls would be similar to that of the fan–coil system. During summer, the ceiling panel of south office supplied cooling for all the time, and the surface temperature of panel was kept low, which compensated the warm glazing. The temperature difference between Ta and Top became negligible. This explained the difference between the two offices about the effect of control methods on thermal comfort.
Moreover, the thermal condition of the ceiling panels seemed to be slightly better than that of the fan coils, as there was more percent of Cat. I when the ceiling panels were used. However, the difference of the thermal conditions between the two systems was not significant.
The impact of GR on thermal comfort was significant. When GR increased to 100%, the thermal comfort of both offices became worse in that there was less percent of Cat. I, Cat. II and Cat. III, and more percent of Cat. IV compared to 30% GR. The percent of Cat. V was zero for 30% GR. When GR was 100%, there were 2 to 5 h (less than 1%) of Cat. V for different conditions. Although the percent of Cat. V was quite small considering the total occupancy hours, this indicated that with 100% GR, the thermal conditions of offices might be unacceptable sometimes.

4. Discussion

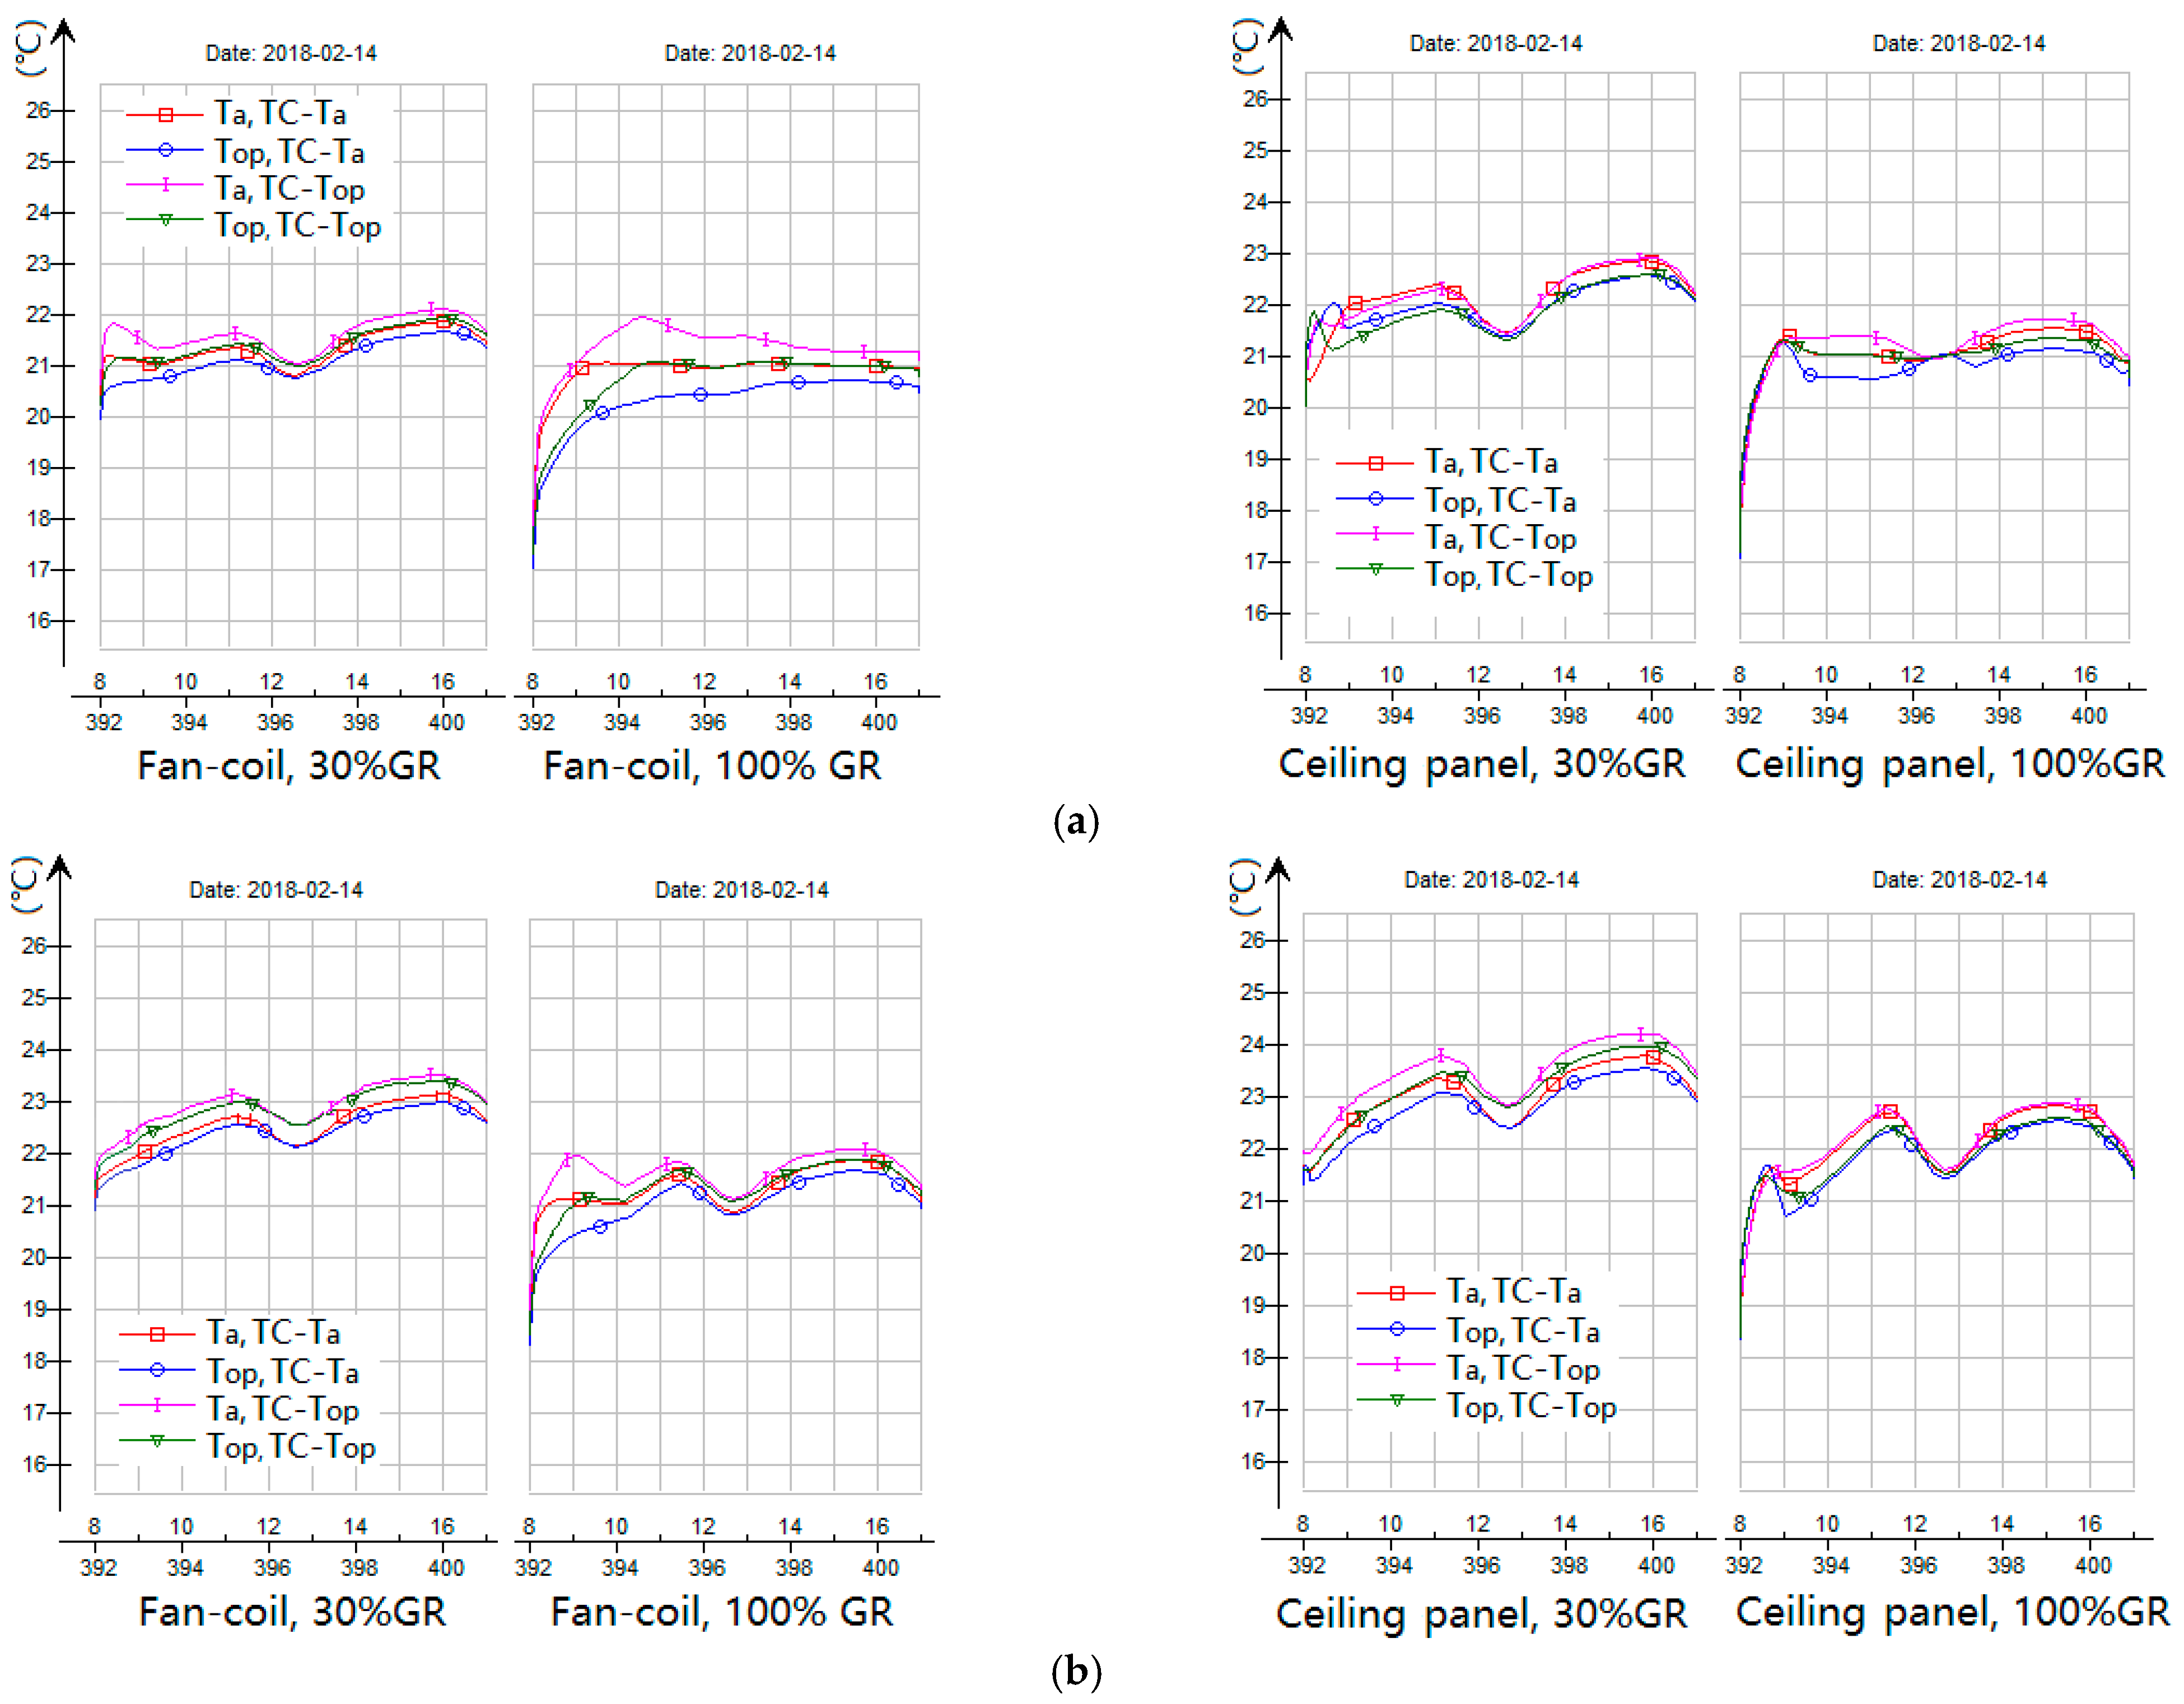
In the simulations, two kinds of thermostat controls were compared under different conditions. For the fan–coil system, thermal comfort conditions would be improved when TC-Top was used. This result was similar to what had been reported in previous studies [23]. For the ceiling panel system, the thermal conditions were also improved a little when TC-Top was used. Although the energy use increased slightly with TC-Top, it was advantageous from the perspective of improving thermal comfort, especially for highly glazed buildings. In modern buildings, most HVAC systems are equipped with Ta sensors to monitor and control the operation of systems. The use of Top sensors should also be considered for perimeter areas. Although Top sensors may not be as common as Ta sensors, there are different choices on the market now. Simone et al. tested several types of Top sensors and provided suggestions about the selection of Top sensors. The use of Top sensors in HVAC systems should be promoted [31].
When the ceiling panels were used, the temperature difference between Ta and Top became smaller for both the 30 and 100% GR condition. The ceiling panels could compensate for the presence of cold or warm surfaces in the room with large GR. This has been reported in previous studies of the 30% GR condition [22]. In this study, the results showed that with the 100% GR, the compensating effect was still remarkable. For highly glazed buildings, radiant systems would be a better choice, considering the compensating effect of radiant surfaces. Moreover, TC-Top would be recommended to reduce energy use for radiant systems. It should be noted that, in the simulation, the supply water temperature during heating and cooling was set to be constant. The surface temperatures of the ceiling panels during heating and cooling were almost unchanged. If the surface temperature was lower or higher, the compensating effect may be different. For the radiant systems, this effect should be studied further.
In the analysis, the thermal comfort of offices was evaluated based on Top. For ceiling panels, the unfavorable effect of asymmetric radiation was not considered. According to ASHRAE Standard 55 [5], this asymmetry may cause local discomfort and reduce the thermal acceptability of the space. In general, people are more sensitive to asymmetric radiation caused by a warm ceiling than that caused by hot and cold vertical surfaces. The 32 °C warm ceiling in the winter may raise the unsatisfied rate up to 20% in the winter in the simulated cases. The effect of asymmetric radiation was neglected in analysis of thermal comfort in this paper. To evaluate thermal conditions under the two GR conditions more comprehensively, further analysis may be needed.
Furthermore, the energy use for cooling and heating was compared based on the direct thermal energy used. The ceiling panels system uses high temperature cooling water, which can be supplied by high performance chillers. During heating, the water temperature can be lower for the ceiling panels to avoid discomfort from asymmetry radiation. The decreased supply water temperature makes it possible to take full advantage of low temperature heating resources, and it can also improve the heating performance if heat pumps are used. The results would be more rational, if the energy use of the two systems was compared based on running cost of heating and cooling plants.
It should be noted that the climate data used in this study were based on ASHRAE TMY weather files (2013), which were included in the IDA ICE version 4.8. This may bring potential concerns about their representativeness given climate changes in recent years. To address this, the climate data of the two typical days in Paris between 2013 and 2021 were compared [32,33]. The comparison showed that there was little difference between the climate data of 2013 and 2021. The outdoor temperature in the two selected days were also compared. The outdoor temperature of 14 February 2021 was almost the same with those in 2013. For 1 August 2021, the maximum outdoor temperature was approximately the same with that of 2013, while the outdoor temperature during the night increased slightly. This change in climate data will surely affect the HVAC energy use. Although the old climate data were used in simulation, the simulation and comparison of different control methods, GR, and indoor HVAC units were based on the same climate data. Therefore, the results about effect of GR, control methods, and indoor HVAC units on thermal comfort and energy use are still reliable. Nonetheless, future studies might benefit from incorporating the updated climate data to make the results reflecting the current situation.
When GR increased to 100%, both energy use for heating and cooling increased dramatically, while thermal comfort conditions became less satisfying. The temperature drift during cold days was also increased, which leads to uncomfortable conditions during the startup of the HVAC systems. Measures should be taken to decrease energy use and improve thermal comfort in buildings with large glazing. In the simulations, only internal shading was considered. The internal shading was mainly used to prevent uncomfortable glare and cannot block out the heat from solar radiation. If external solar shading was considered, the influence of GR could be smaller. This had been studied by researchers. They found that implementing an optimized external shading system enhanced indoor visual comfort by reducing glare and improving daylight distribution and significantly reduced cooling energy demand and peak cooling load [34,35]. Karthick, S et al. showed that if window shading was included, cooling loads could be reduced by 35.9% annually for a building using a passive cooling system in the warm and humid climate of Chennai [36]. Kolokotsa et al. emphasized the effectiveness of passive solar design strategies in controlling solar heat gain and improving building energy performance [37]. Such methods should be considered in the designing of highly glazed buildings considering improving thermal environment and energy saving.
In the simulation, the energy use of indoor facilities in the two offices was set to be the same under the 30% and 100% GR condition both in the summer and winter. Given the substantial differences in daylight available between the summer and winter in Paris, artificial lighting usage and consequently internal heat gains will vary over the year. The ignoring of this variation may lead to overestimation of energy use in the summer and underestimation in the winter. Moreover, the lighting energy use can be different with different GR. In the 100% GR condition, usually less lighting energy is needed as natural lighting can be fully used. To make the results more accurate, dynamic or seasonally adjusted lighting/internal gain profiles should be adopted. Although the lighting energy use is relatively small in the total energy consumption, this influence still needs to be considered in future studies.

5. Conclusions

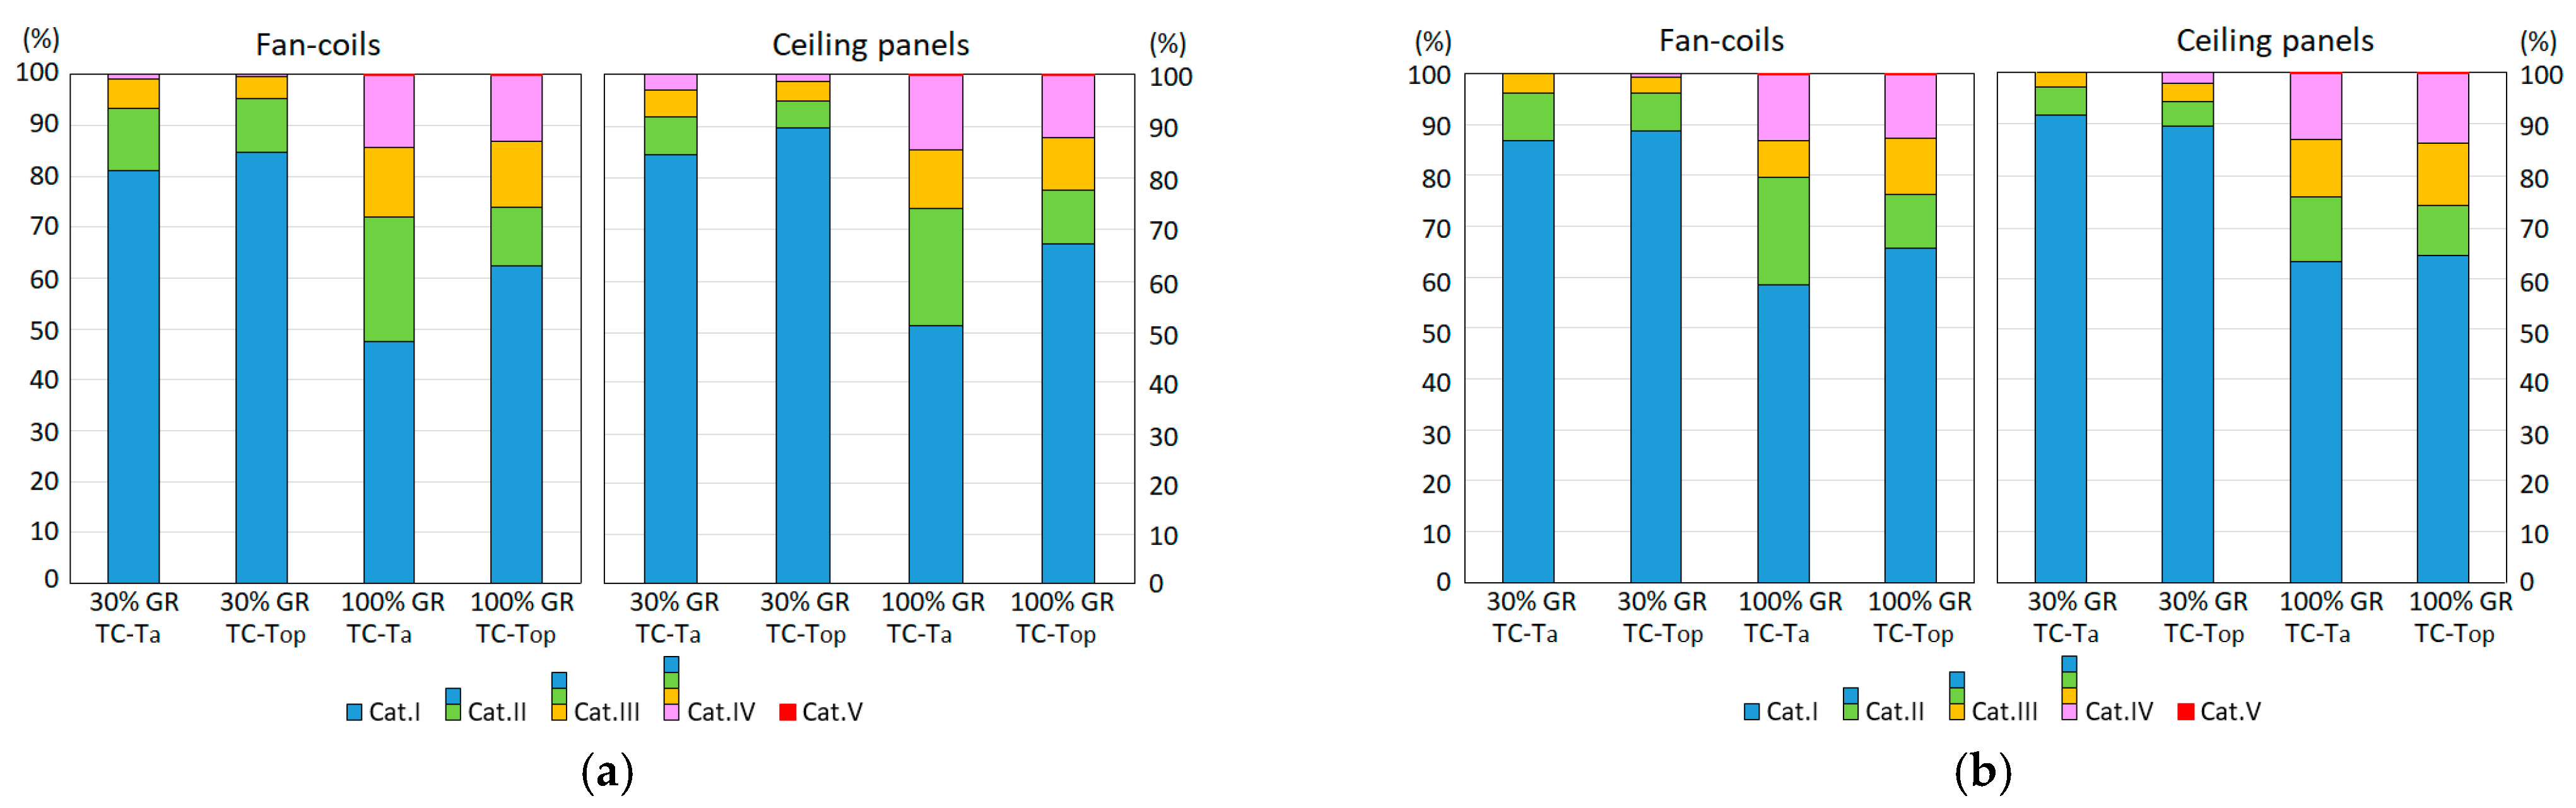
In this paper, thermostat controls based on Ta and Top were compared under different conditions, and the effect of two control methods was analyzed under different GR conditions. The results showed that thermal comfort and thermal energy use of the offices were different in the simulated cases under the two control methods.
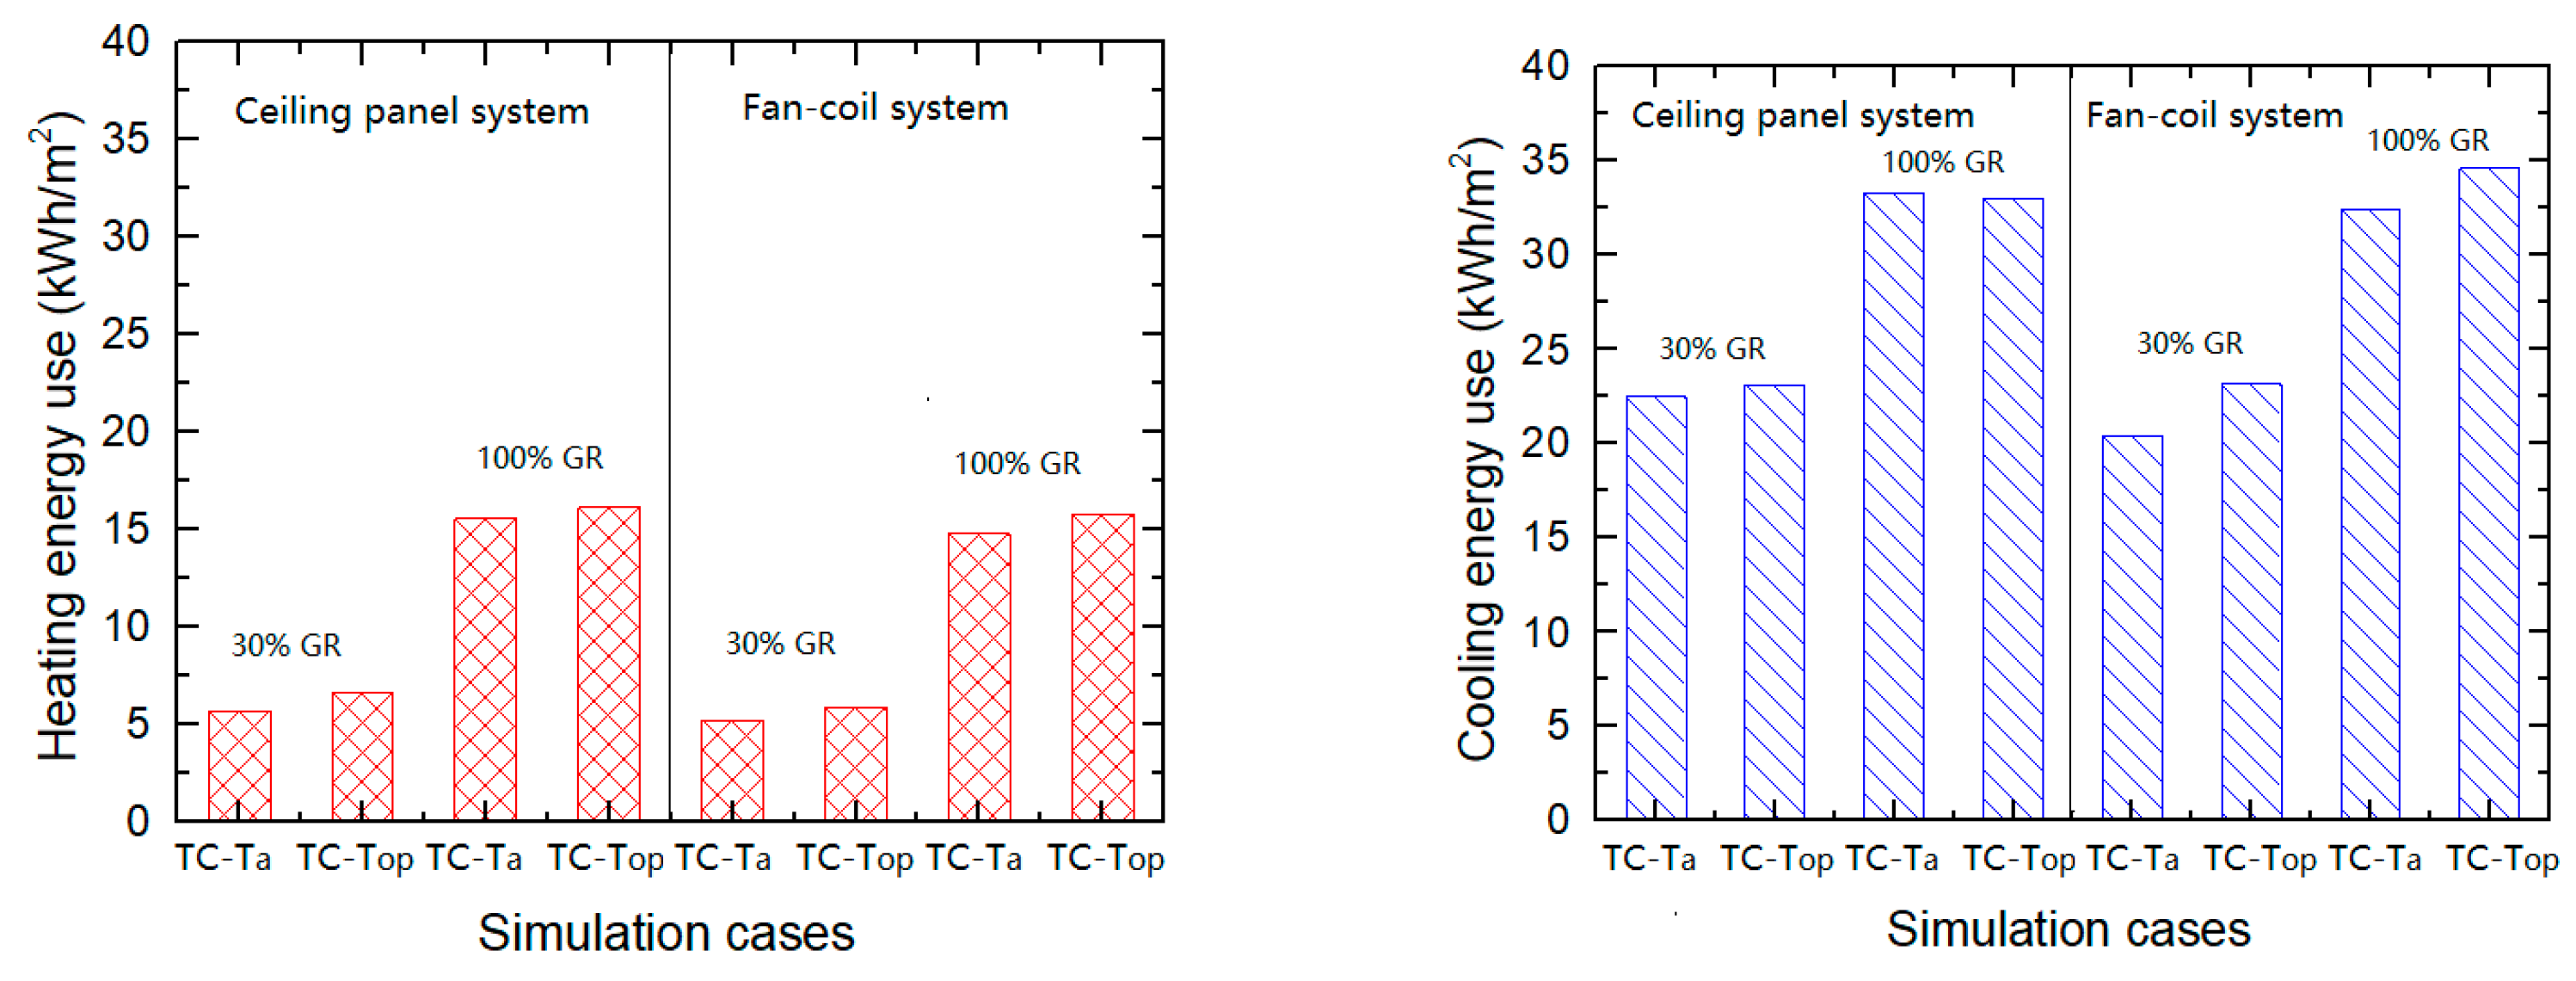
For the fan–coil system, Ta was lower than Top in the summer, while in the winter it was the opposite. Therefore, under the same set point, when Top was used in the control, Ta became lower in the summer and higher in the winter. The thermal comfort was thus improved, and energy use was increased a little. This effect was consistent for both offices and the two GR conditions. Both the cooling and heating energy increased when TC-Top was used. The increment was approximately 12 to 13% for the 30% GR condition, and 7% for the 100% GR condition. These findings are consistent with prior studies, confirming that TC-Top is more effective for thermal comfort improvement.
When the ceiling panel system was used, the radiant surfaces compensated the surface temperature of glazing, which made the difference between Ta and Top much smaller both in the summer and winter under the two GR conditions. Therefore, the impact of the control method became smaller for the ceiling panel system, especially for the 30% GR condition. For the 100% GR condition, when TC-Top was used, the energy use of heating increased approximately 4% compared with that of TC-Ta, while the energy use of cooling did not change much. These indicates that for the radiant system, the two controls have smaller effect on thermal comfort and energy use in both GR conditions.
When the office was highly glazed, the energy use increased significantly, while thermal comfort became less favorable. The use of radiant system can be better in improving thermal comfort under a large GR condition. Based on the results, it was recommended that TC-Top should be used for the fan–coil system to improving thermal comfort. The traditional TC-Ta would be fine for the radiant system to reduce energy use while keeping thermal comfort. Due to the compensating effect of radiant surfaces, for highly glazed buildings, radiant system would be recommended to keep comfortable thermal environment.

Author Contributions

Conceptualization, H.W. and B.W.O.; Methodology, H.W. and B.W.O.; Validation, O.B.K. and H.L.; Formal analysis, H.W. and O.B.K.; Data curation, H.W., R.H., O.B.K. and H.L.; Writing—original draft, R.H. and H.L.; Writing—review & editing, R.H.; Funding acquisition, H.W. All authors have read and agreed to the published version of the manuscript.

Funding

This research was funded by the National Natural Science Foundation of Shandong province, China under contract number of ZR2022ME035.

Data Availability Statement

The original contributions presented in the study are included in the article, further inquiries can be directed to the corresponding author.

Conflicts of Interest

The authors declare no conflict of interest.

References

  1. Vallianos, C.; Candanedo, J.; Athienitis, A. Thermal modeling for control applications of 60,000 homes in North America using smart thermostat data. Energy Build. 2024, 303, 113811. [Google Scholar] [CrossRef]
  2. Nateghi, S.; Kaczmarczyk, J. Multi-objective optimization of window opening and thermostat control for enhanced indoor environment quality and energy efficiency in contrasting climates. J. Build. Eng. 2023, 78, 107617. [Google Scholar] [CrossRef]
  3. Szczepanik-Scislo, N.; Scislo, L. Dynamic real-time measurements and a comparison of gas and wood furnaces in a dual-fuel heating system in order to evaluate the occupants’ safety and indoor air quality. Buildings 2023, 13, 2125. [Google Scholar] [CrossRef]
  4. ISO/DIS 7730:2023; Ergonomics of the Thermal Environment—Analytical Determination and Interpretation of Thermal Comfort Using Calculation of the PMV and PPD Indices and Local Thermal Comfort Criteria; German and English Version prEN ISO 7730:2023. International Organization for Standardization (ISO): Geneva, Switzerland, 2023.
  5. ANSI/ASHRAE Standard 55; Thermal Environmental Conditions for Human Occupancy. ASHRAE: Atlanta, GA, USA, 2023.
  6. Oliveira, A.; Pedrini, A. Thermal performance of highly glazed office buildings in the tropics: Contradicting architects’ expectations. Energy Build. 2023, 296, 113344. [Google Scholar] [CrossRef]
  7. Pourghorban, A.; Asoodeh, H. The impacts of advanced glazing units on annual performance of the Trombe wall systems in cold climates. Sustain. Energy Technol. Assess. 2022, 51, 101983. [Google Scholar] [CrossRef]
  8. Lee, S.J.; Song, S.Y. Energy efficiency, visual comfort, and thermal comfort of suspended particle device smart windows in a residential building: A full-scale experimental study. Energy Build. 2023, 298, 113514. [Google Scholar] [CrossRef]
  9. Singh, D.; Chaudhary, R.; Karthick, A. Review on the progress of building-applied/integrated photovoltaic system. Environ. Sci. Pollut. Res. 2021, 28, 47689–47724. [Google Scholar] [CrossRef] [PubMed]
  10. Hwang, R.L.; Chen, W.A. Identifying relative importance of solar design determinants on office building façade for cooling loads and thermal comfort in hot-humid climates. Build. Environ. 2022, 226, 109684. [Google Scholar] [CrossRef]
  11. Brackley, C.; O’Brien, W.; Trudel, C.; Bursill, J. The in-situ implementation of a feature-rich thermostat: A building engineering and human factors approach to improve perceived control in offices. Build. Environ. 2021, 199, 107884. [Google Scholar] [CrossRef]
  12. Ahmed, A.E.; Suwaed, M.S.; Shakir, A.M.; Ghareeb, A. The impact of window orientation, glazing, and window-to-wall ratio on the heating and cooling energy of an office building: The case of hot and semi-arid climate. J. Eng. Res. 2023, 13, 409–422. [Google Scholar] [CrossRef]
  13. Qahtan, A.M. Aesthetic and Thermal Suitability of Highly Glazed Spaces with Interior Roller Blinds in Najran University Buildings, Saudi Arabia. Sustainability 2024, 16, 2030. [Google Scholar] [CrossRef]
  14. Li, X.; Wu, Y. A review of complex window-glazing systems for building energy saving and daylight comfort: Glazing technologies and their building performance prediction. J. Build. Phys. 2025, 48, 496–540. [Google Scholar] [CrossRef]
  15. Hardy, J.D. Physiological effects of high intensity infrared heating. ASHRAE J. 1962, 4, 36–42. [Google Scholar]
  16. Gagge, A.P. The effective radiant field and operative temperature necessary for comfort with radiant heating. ASHRAE J. 1967, 9, 63–70. [Google Scholar]
  17. EN 15251:2007; Indoor Environmental Input Parameters for Design and Assessment of Energy Performance of Buildings Addressing Indoor Air Quality, Thermal Environment, Lighting and Acoustics. European Committee for Standardization: Brussels, Belgium, 2007.
  18. Cherier, M.K.; Hamdani, M.; Kamel, E.; Guermoui, M.; Bekkouche, S.M.E.A.; Al-Saadi, S.; Djeffal, R.; Bashir, M.O.; Elshekh, A.E.A.; Drozdova, L.; et al. Impact of glazing type, window-to-wall ratio, and orientation on building energy savings quality: A parametric analysis in Algerian climatic conditions. Case Stud. Therm. Eng. 2024, 61, 104902. [Google Scholar] [CrossRef]
  19. Atmaca, I.; Kaynakli, O.; Yigit, A. Effects of radiant temperature on thermal comfort. Build. Environ. 2003, 42, 3210–3220. [Google Scholar] [CrossRef]
  20. Jain, V.; Garg, V.; Mathur, J.; Dhaka, S. Effect of operative temperature based thermostat control as compared to air temperature based control on energy consumption in highly glazed buildings. In Proceedings of the Building Simulation 2011, Sydney, Australia, 14–16 November 2011. [Google Scholar]
  21. Caillet, J.; Adnot, J.; Rivière, P. Simulation of control options for HVAC management of a typical office building. In Proceedings of the 5th CLIMAMED’09–Miditerranean Climatization Congress, Lisbon, Portugal, 16–18 April 2009. [Google Scholar]
  22. Kontes, G.D.; Giannakis, G.I.; Horn, P.; Steiger, S.; Rovas, D.V. Using Thermostats for Indoor Climate Control in Office Buildings: The Effect on Thermal Comfort. Energies 2017, 10, 1368. [Google Scholar] [CrossRef]
  23. Wang, H.; Olesen, B.W. Using thermostats for indoor climate control in offices: The effect on thermal comfort and heating/cooling energy use. Energy Build. 2019, 188–189, 71–83. [Google Scholar] [CrossRef]
  24. Wang, H.; Zhang, F.; Li, J.; Hang, H.; Lin, H. Effects of different zoning thermostat controls on thermal comfort and cooling energy consumption in reading rooms of a library. Energy 2024, 292, 130507. [Google Scholar]
  25. Potočnik, J.; Cadena, J.D.B.; Košir, M.; Poli, T. Occupant perception of spectral light content variations due to glazing type and internal finish. IOP Conf. Ser. Earth Environ. Sci. 2019, 296, 012033. [Google Scholar] [CrossRef]
  26. Bessoudo, M.; Tzempelikos, A.; Athienitis, A.K.; Zmeureanu, R. Indoor thermal environmental conditions near glazed facades with shading devices—Part I: Experiments and building thermal model. Build. Environ. 2010, 45, 2506–2516. [Google Scholar] [CrossRef]
  27. Alwetaishi, M.; Taki, A. Investigation into energy performance of a school building in a hot climate: Optimum of window-to-wall ratio. Indoor Built Environ. 2019, 29, 24–39. [Google Scholar] [CrossRef]
  28. Kolarik, J.; Toftum, J.; Olesen, B.W.; Jensen, K.L. Simulation of energy use, human thermal comfort and office work performance in buildings with moderately drifting operative temperatures. Energy Build. 2015, 43, 2988–2997. [Google Scholar] [CrossRef]
  29. ISO 17772-1; Energy Performance of Buildings—Indoor Environmental Quality—Part 1: Indoor Environmental Input Parameters for the Design and Assessment of Energy Performance of Buildings. International Standard Organization for Standardization: Geneva, Switzerland, 2017.
  30. EN 16798-1; Indoor Environmental Input Parameters for Design and Assessment of Energy Performance of Buildings Addressing Indoor Air Quality, Thermal Environment, Lighting and Acoustics-Module M1–6. European Committee for Standardization: Brussels, Belgium, 2019.
  31. Simone, A.; Olesen, B.W.; Babiak, J.; Bullo, M.; Langkilde, G. Operative Temperature Control of Radiant Surface Heating and Cooling Systems. In Event 62nd Congresso Nazionale ATI, Proceedings of the Clima 2007 Wellbeing Indoors, Salerno, Italy, 11–14 September 2007; University of Salerno: Salerno, Italy, 2007; Volume 1, pp. 233–237. [Google Scholar]
  32. ASHRAE Handbook Fundamentals 2013: SI Edition; ASHRAE: Atlanta, GA, USA, 2013.
  33. ASHRAE Handbook: HVAC Fundamentals 2021; ASHRAE: Atlanta, GA, USA, 2021.
  34. Stratiy, P.; Klykov, I. Vacuum glazed units—Energy efficient glazing. IOP Conf. Ser. Mater. Sci. Eng. 2018, 365, 032013. [Google Scholar] [CrossRef]
  35. Sorooshnia, E.; Rashidi, M.; Rahnamayiezekavat, P.; Rezaei, F.; Samali, B. Optimum external shading system for counterbalancing glare probability and daylight illuminance in Sydney’s residential buildings. Eng. Constr. Archit. Manag. 2023, 30, 296–320. [Google Scholar] [CrossRef]
  36. Karthick, S.; Sivakumar, A.; Bhanu Chander, S.; Bharathwaj, S.; Nagendra Kumar, B.V.V. Effect of Building Orientation, Window Glazing, and Shading Techniques on Energy Performance and Occupant Comfort for a Building in Warm-Humid Climate. In Recent Advances in Energy Technologies: Select Proceedings of ICEMT 2021, Proceedings of the first International Conference on Energy and Materials Technologies (ICEMT) 2021, Sepang, Malaysia, 5–8 November 2021; Springer Nature: Singapore, 2022; pp. 289–310. [Google Scholar]
  37. Kolokotsa, D.; Santamouris, M.; Yun, G.Y. 3.19—Passive solar architecture. In Comprehensive Renewable Energy, 2nd ed; Elsevier: Amsterdam, The Netherlands, 2022; Volume 1–9, pp. 725–741. [Google Scholar]
Figure 1. Building modules with different GR: (a) 30% GR; (b) 100% GR.
Buildings 15 02422 g001
Figure 2. Outdoor air temperature on selected days.
Buildings 15 02422 g002
Figure 3. Comparison of total energy use for heating and for cooling on typical days.
Buildings 15 02422 g003
Figure 4. Comparison of energy use for heating and cooling.
Buildings 15 02422 g004
Figure 5. Comparison of indoor temperatures on typical days: (a) On 14 February, north office; (b) On 14 February, south office; (c) On 1 August, north office; (d) On 1 August, south office.
Buildings 15 02422 g005aBuildings 15 02422 g005b
Figure 6. Comparison of surface temperatures on typical days: (a) 14 February (North office); (b) 1 August (South office).
Buildings 15 02422 g006
Figure 7. Thermal comfort conditions of two offices: (a) North office; (b) South office.
Buildings 15 02422 g007
Disclaimer/Publisher’s Note: The statements, opinions and data contained in all publications are solely those of the individual author(s) and contributor(s) and not of MDPI and/or the editor(s). MDPI and/or the editor(s) disclaim responsibility for any injury to people or property resulting from any ideas, methods, instructions or products referred to in the content.

