
One-Part Alkali-Activated Slag/Fly Ash for Soft Soil Stabilization: Freeze-Thaw Durability Assessment and Mechanism Elucidation


Abstract
1. Introduction
2. Materials and Methods
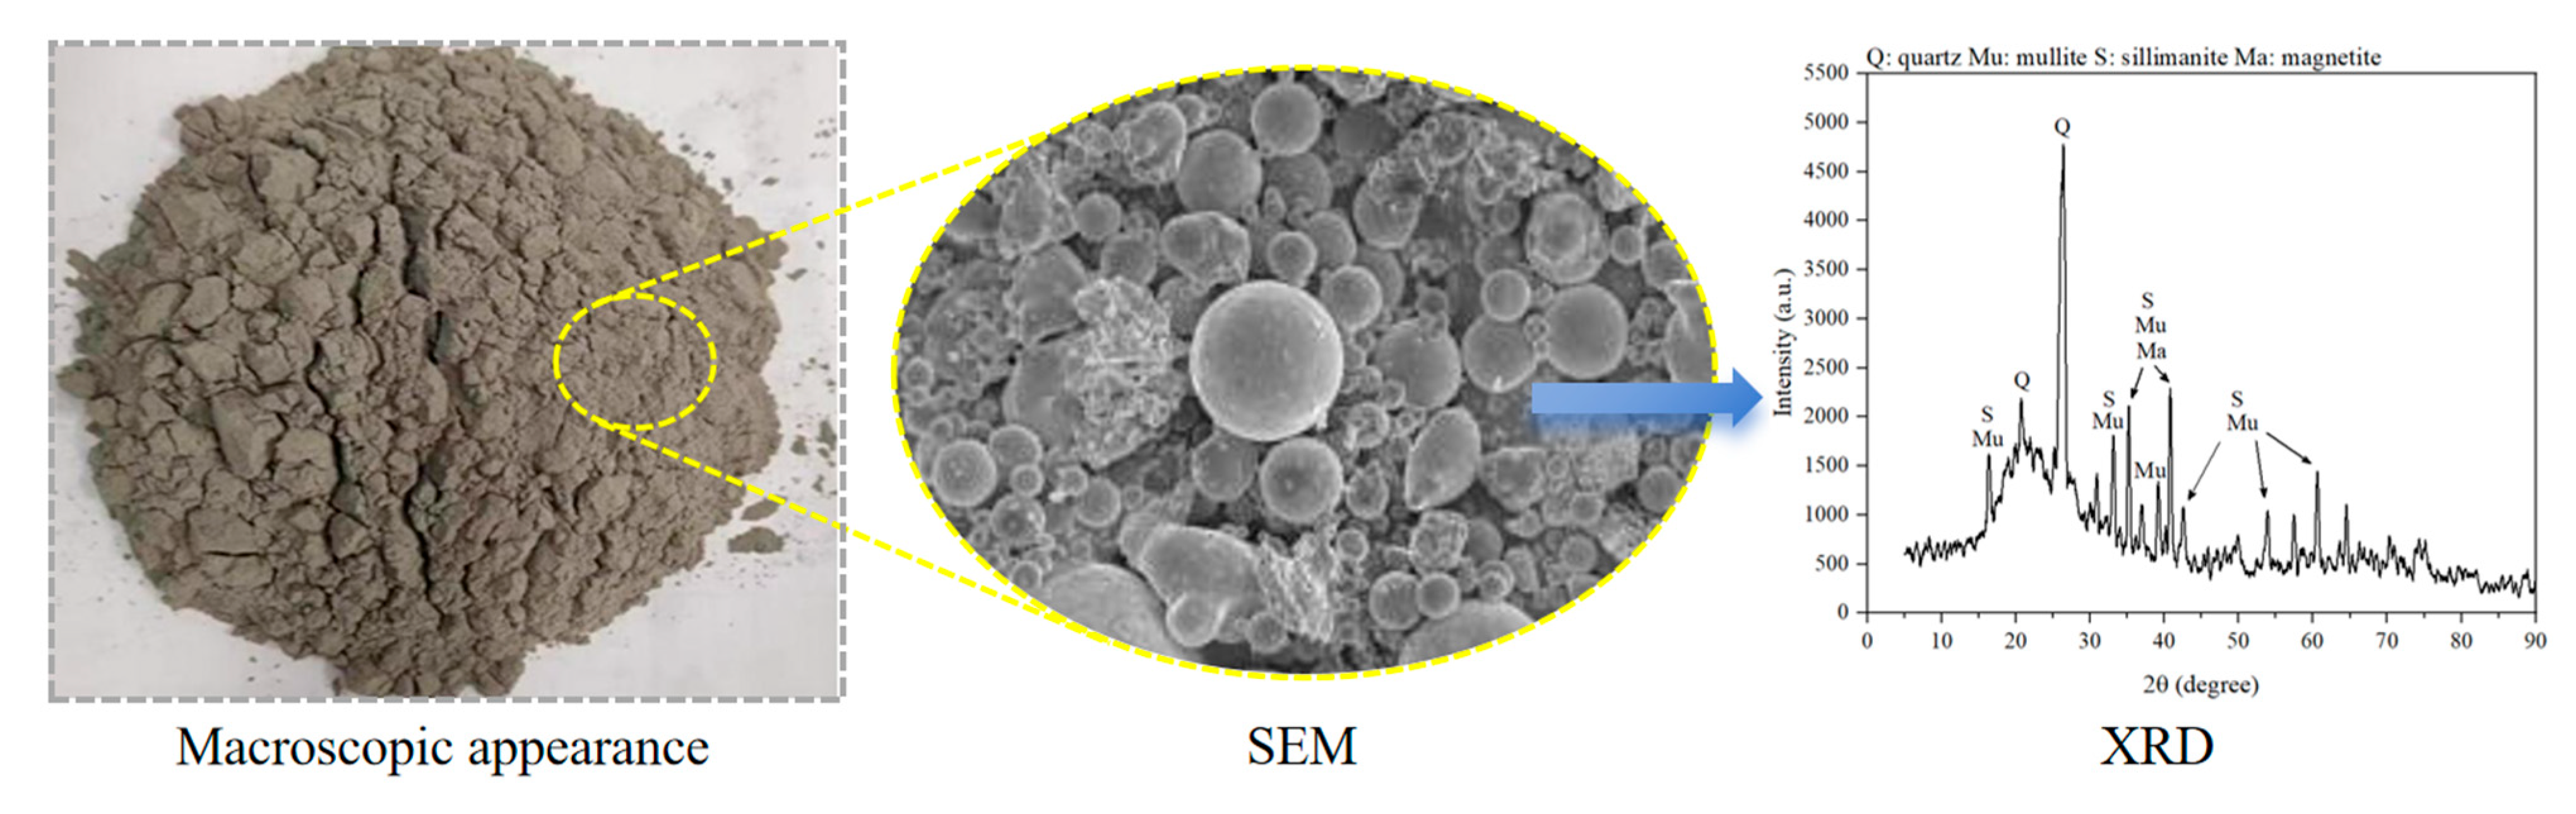
2.1. Soft Soil
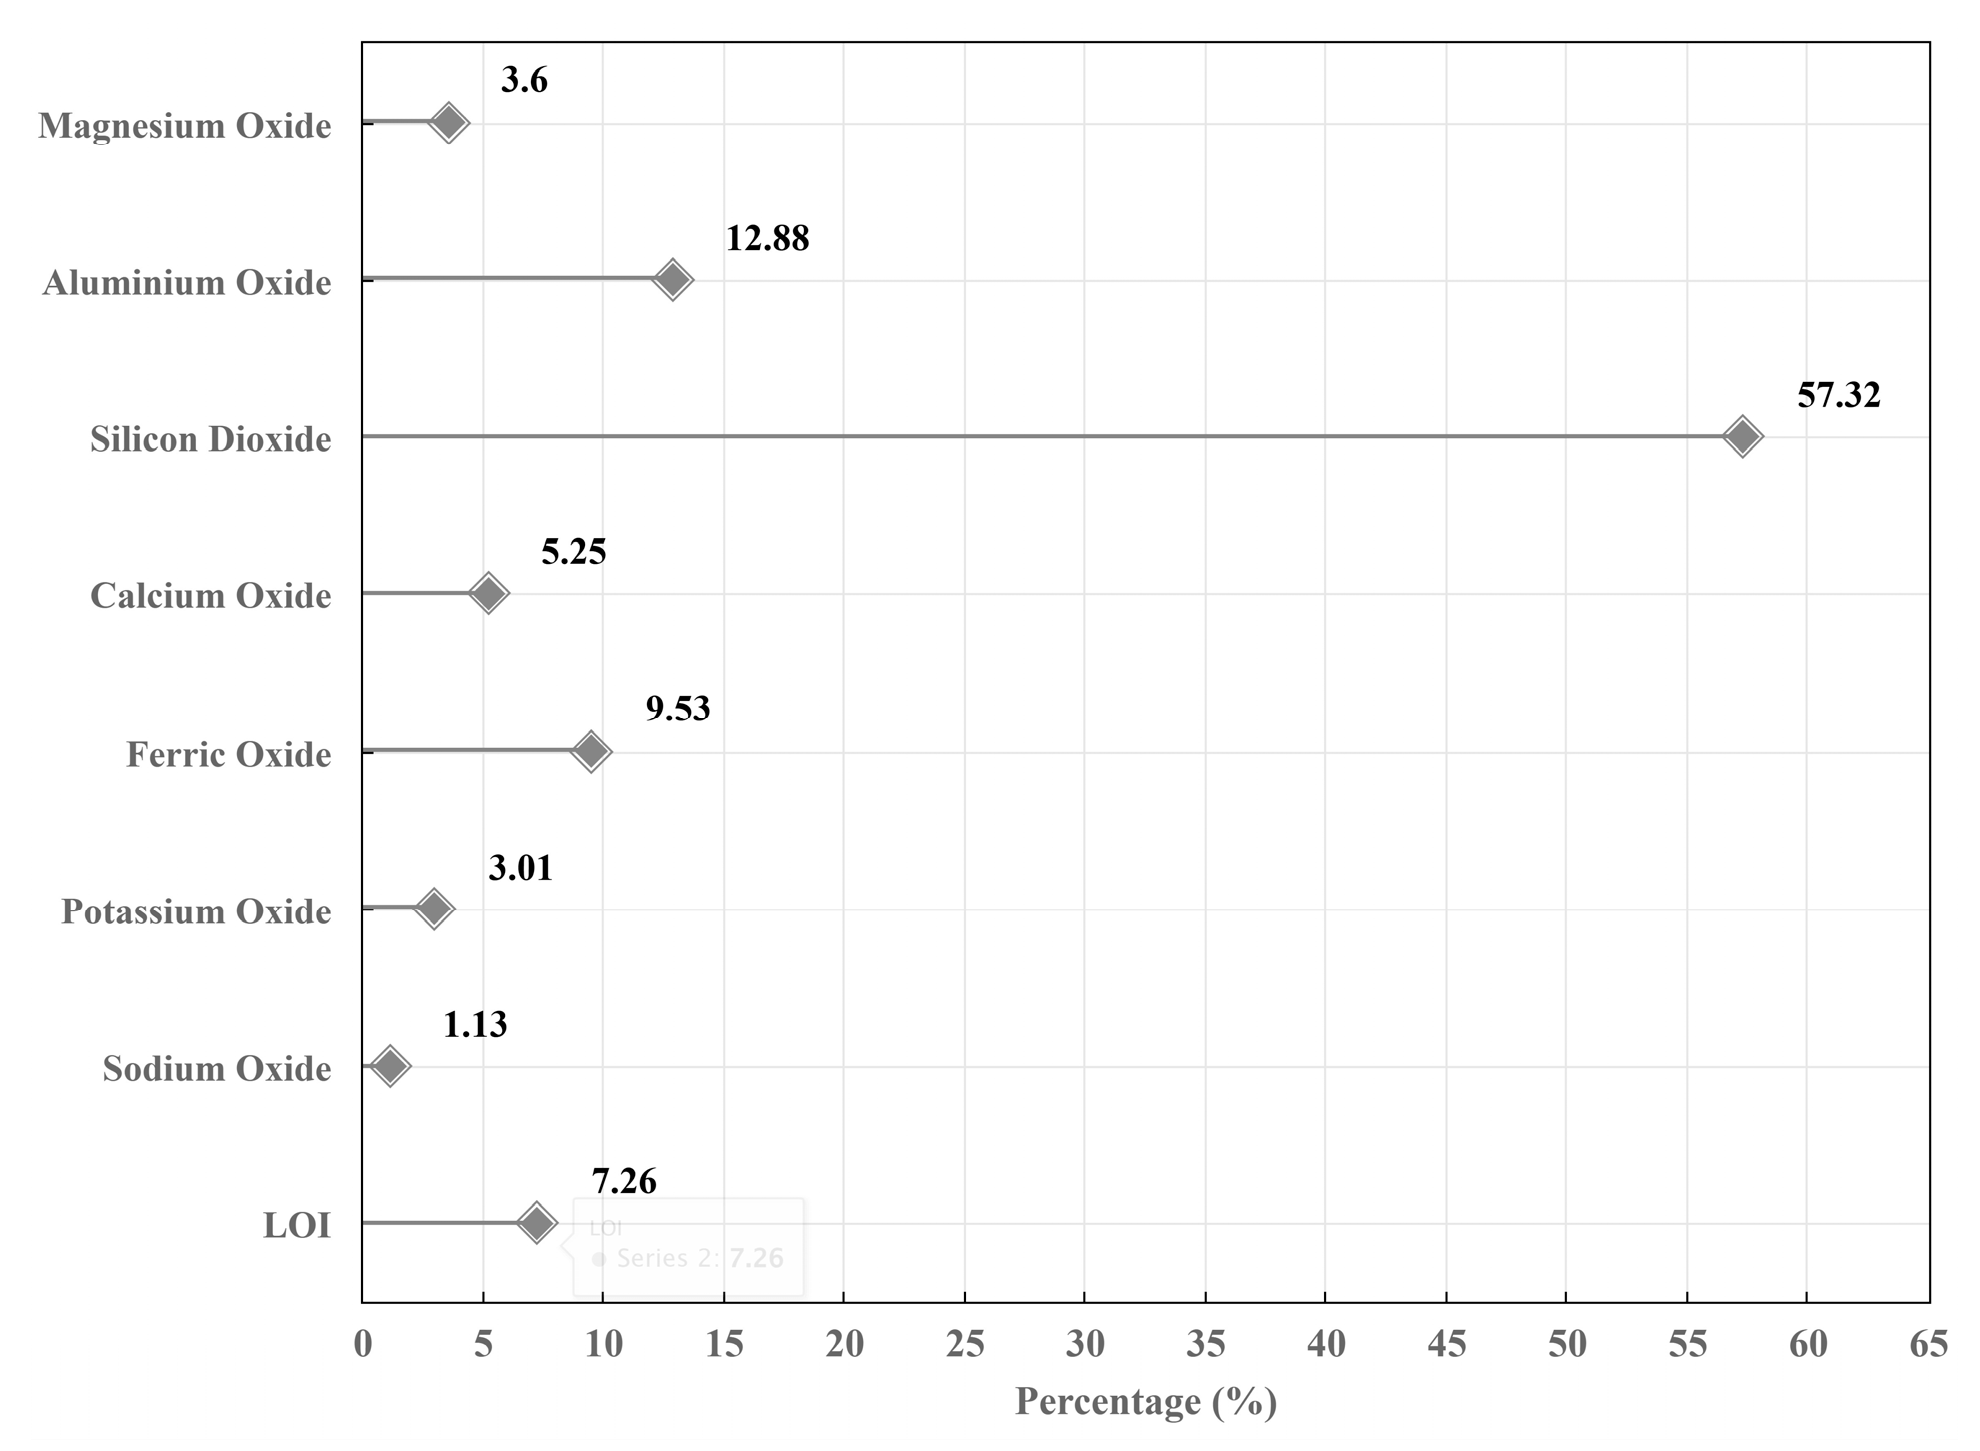
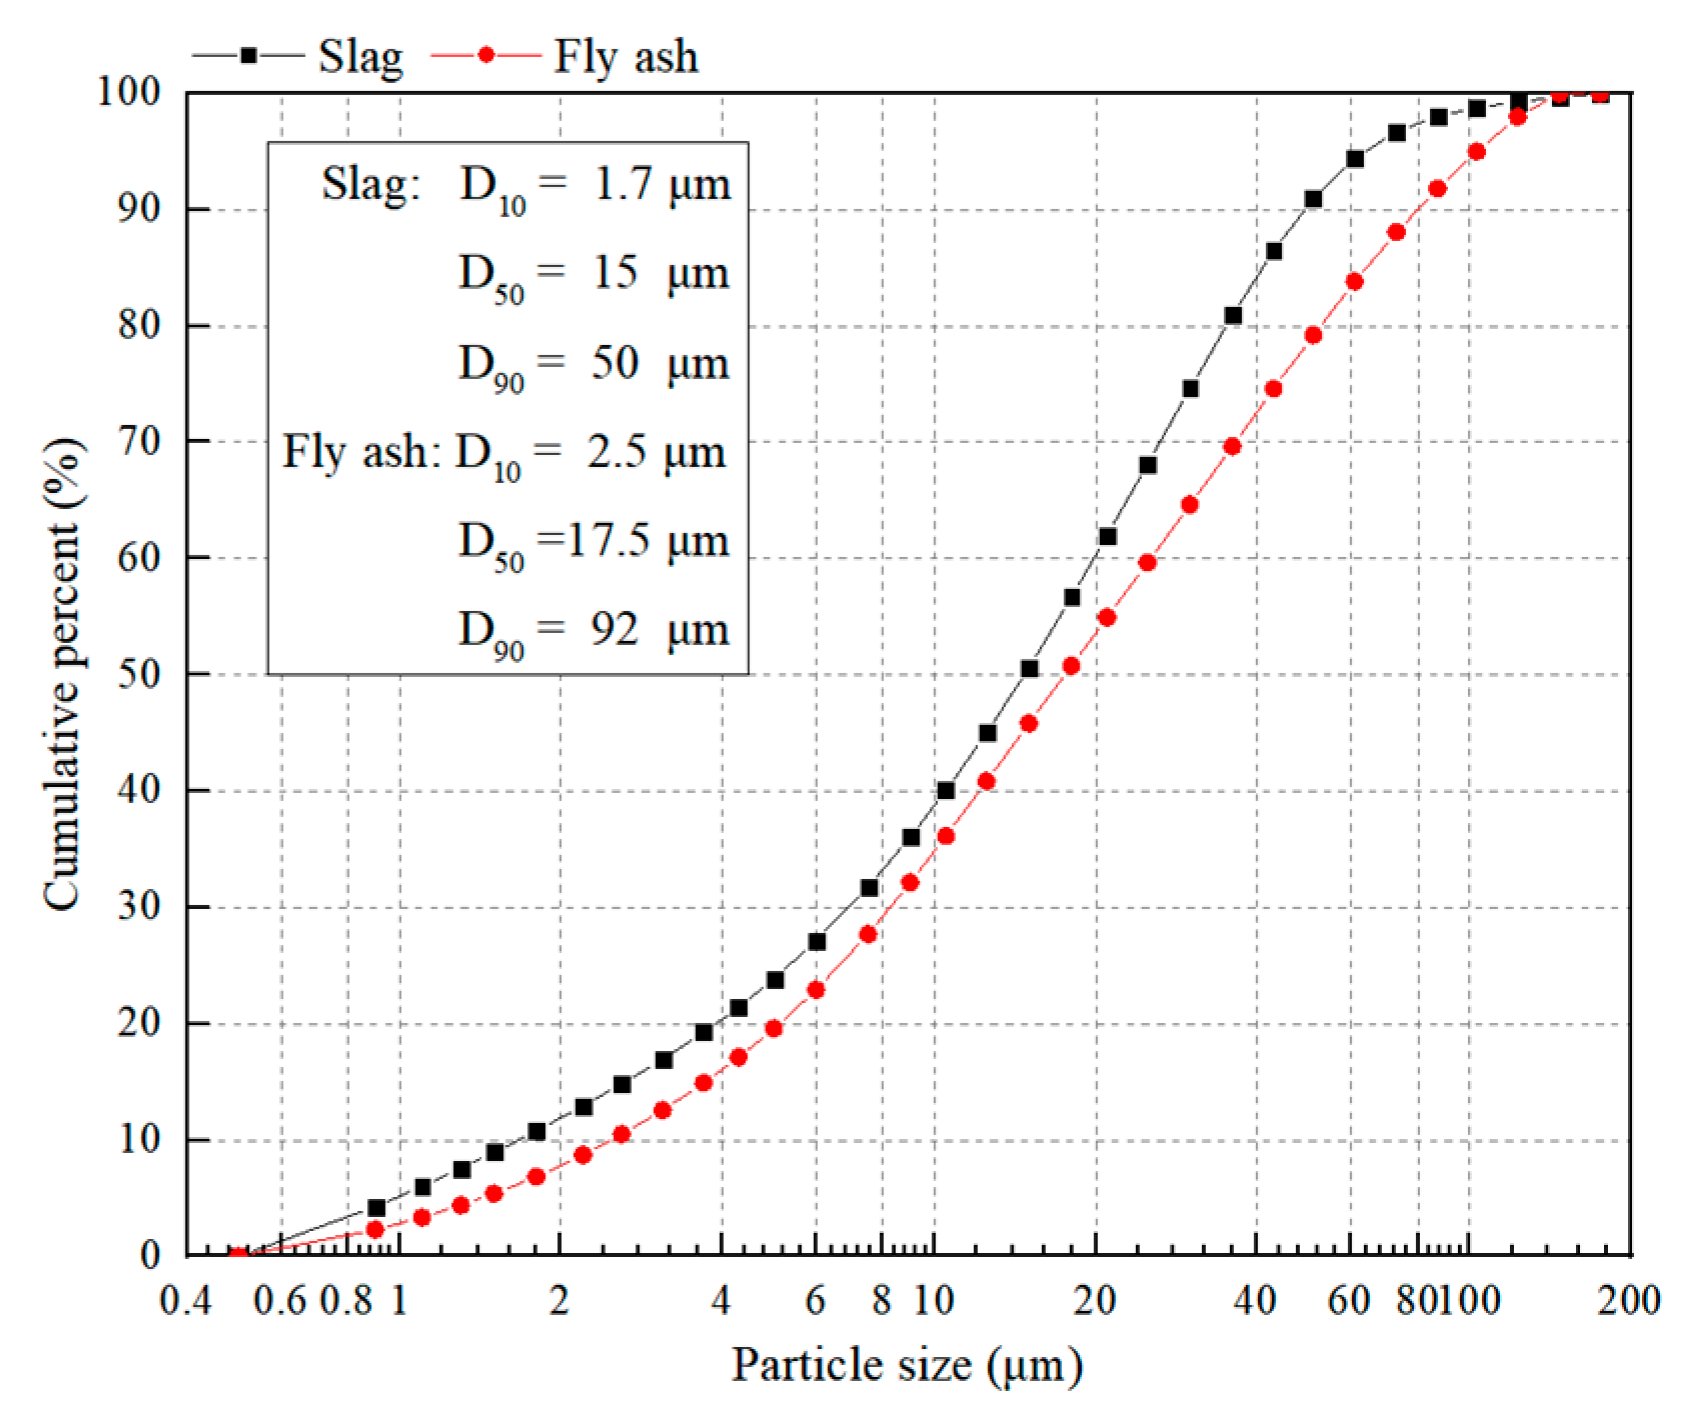
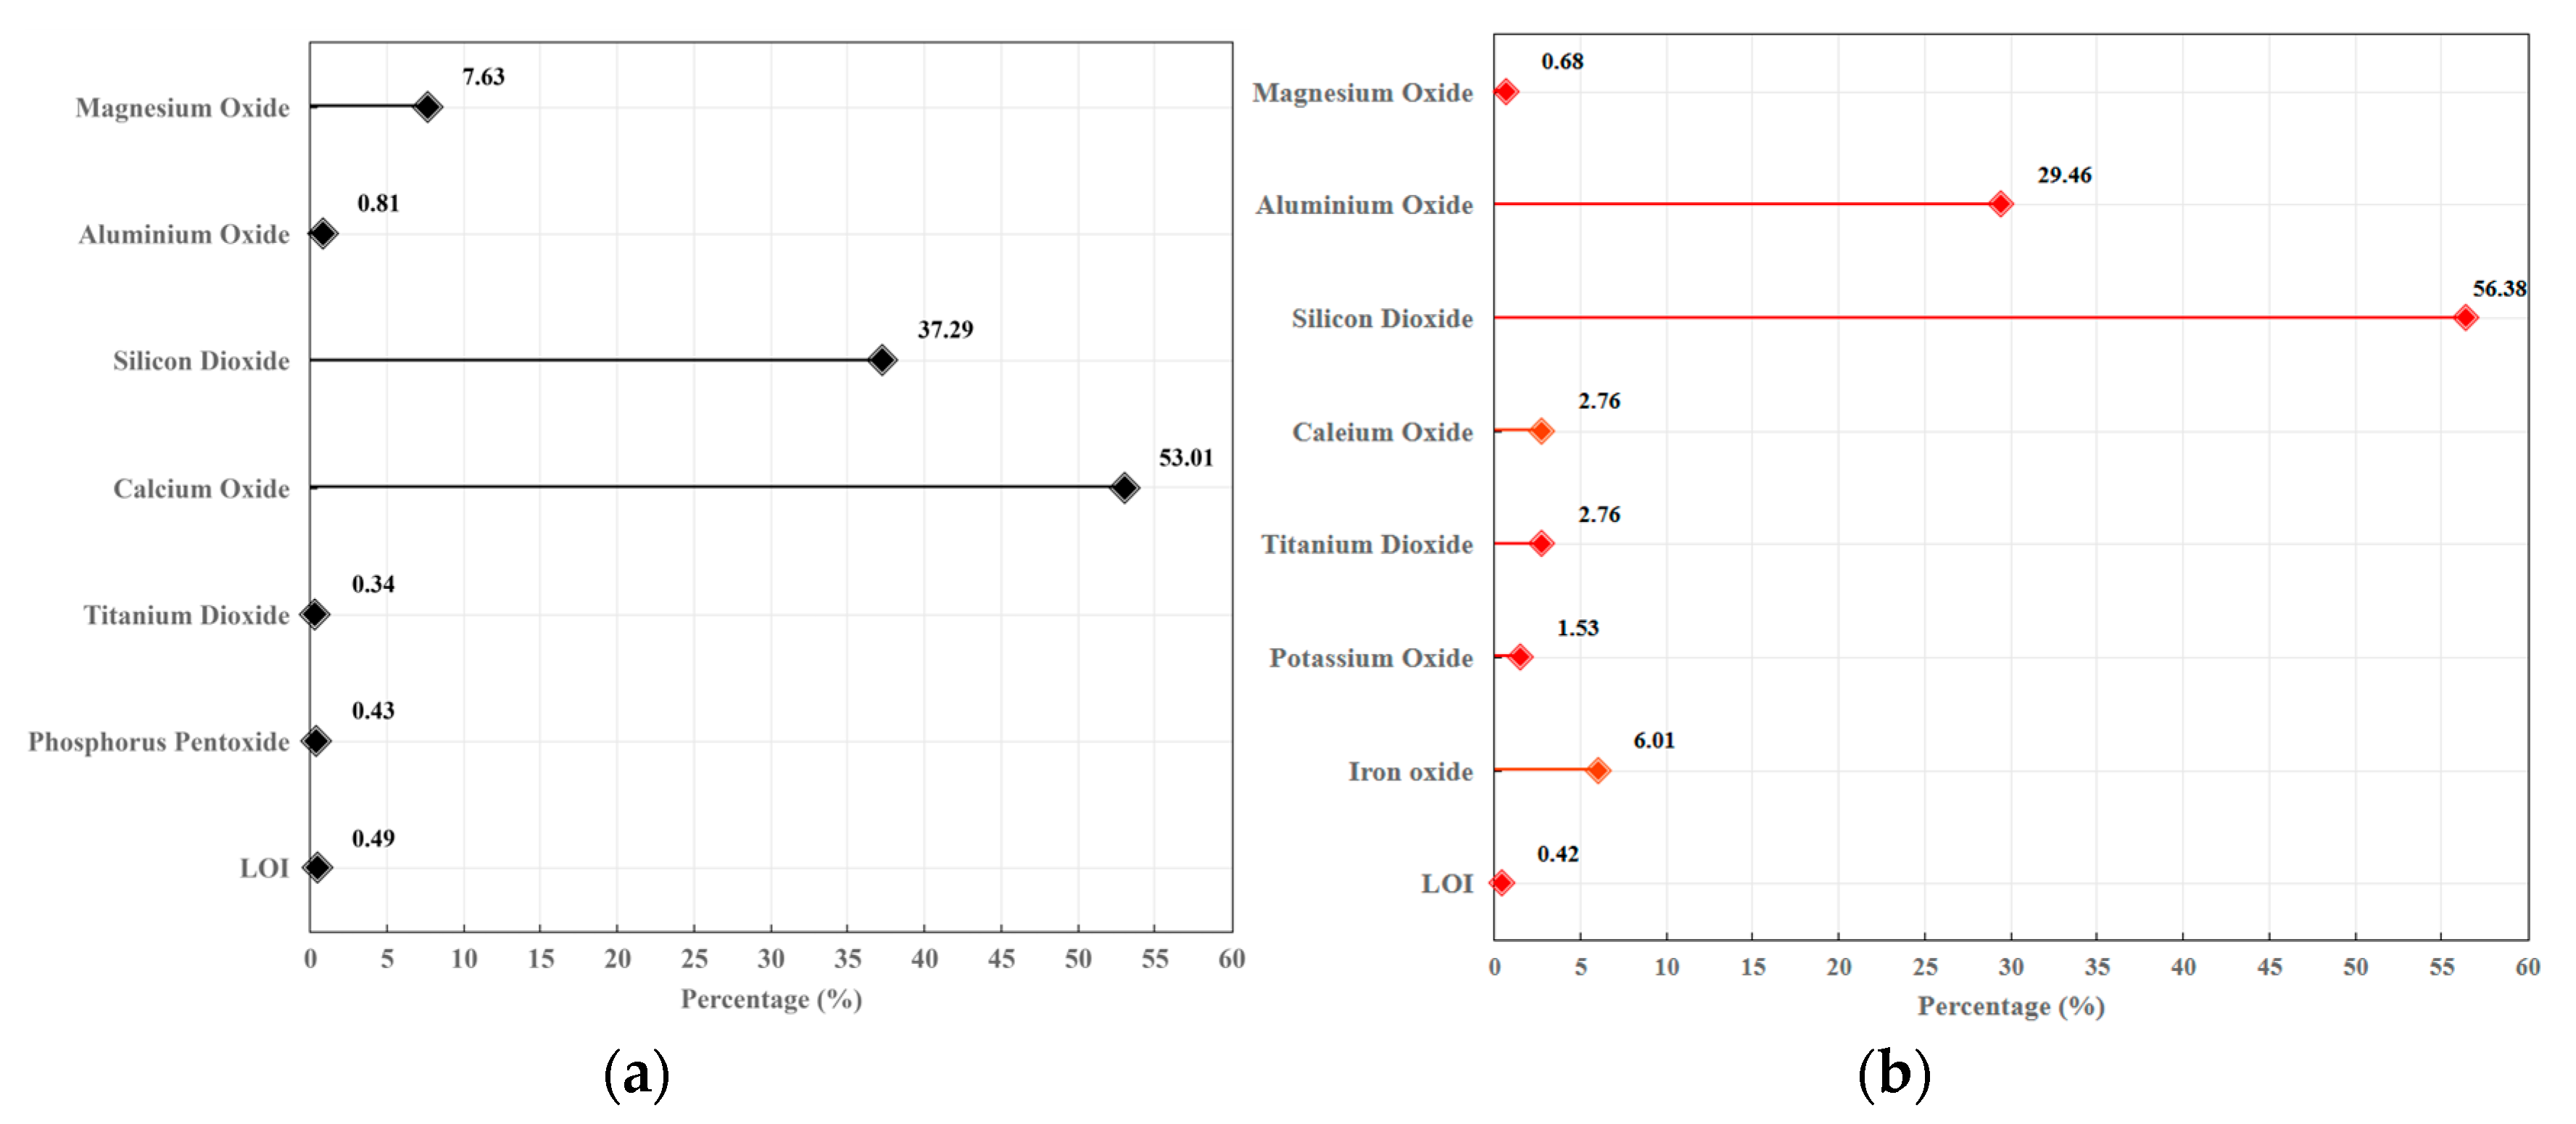
2.2. Alkali-Activated Raw Materials
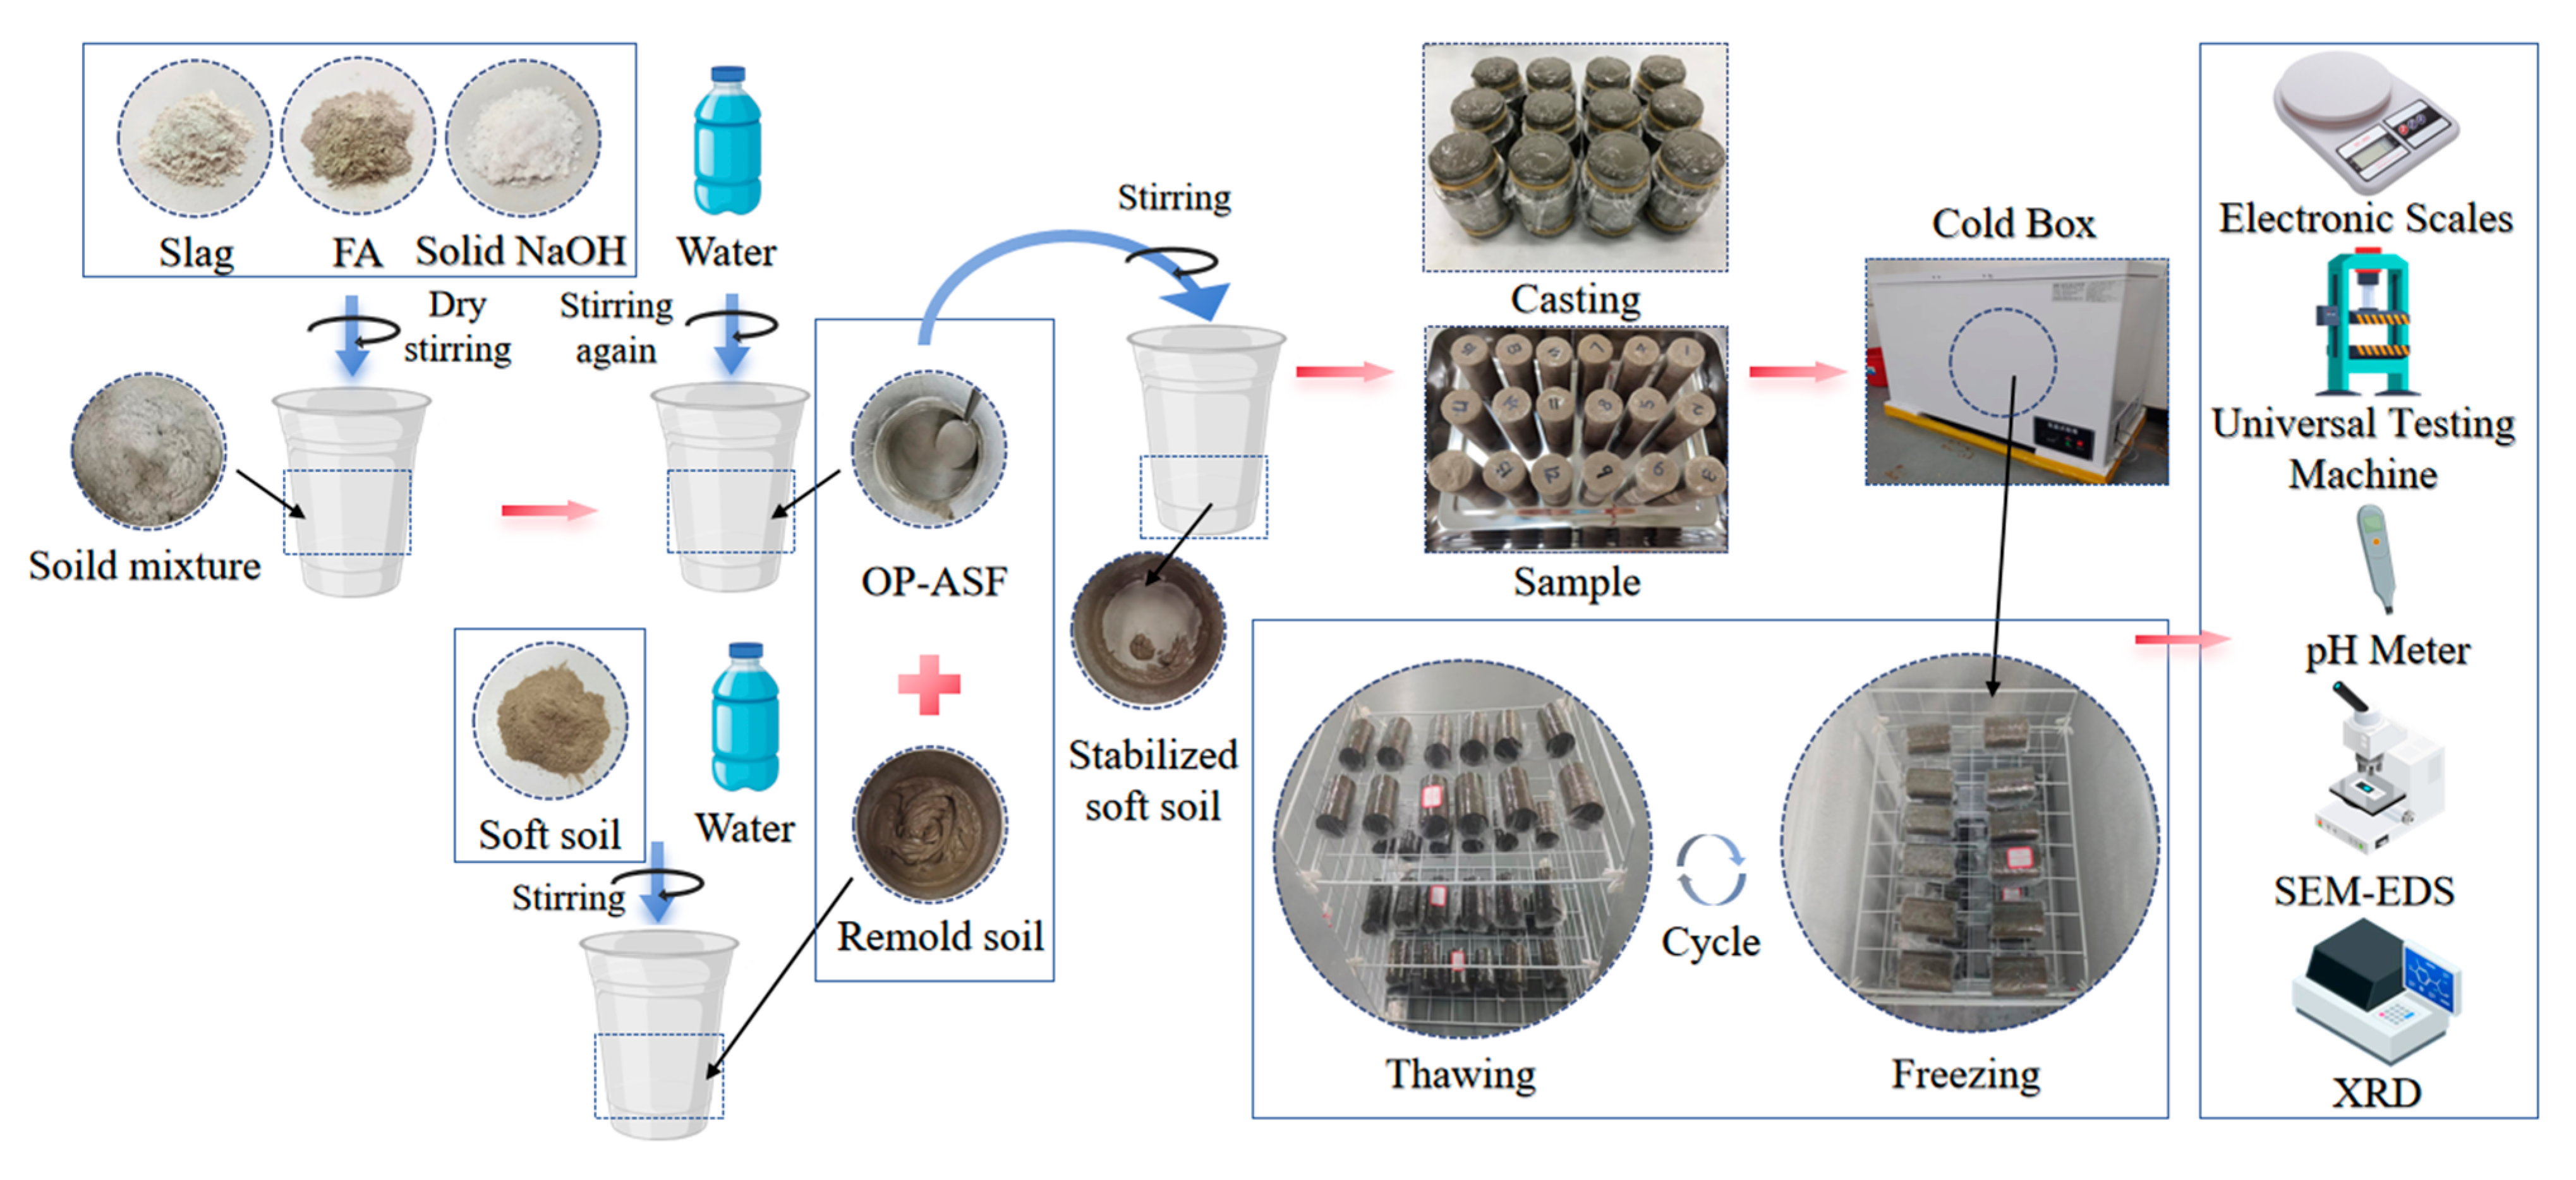
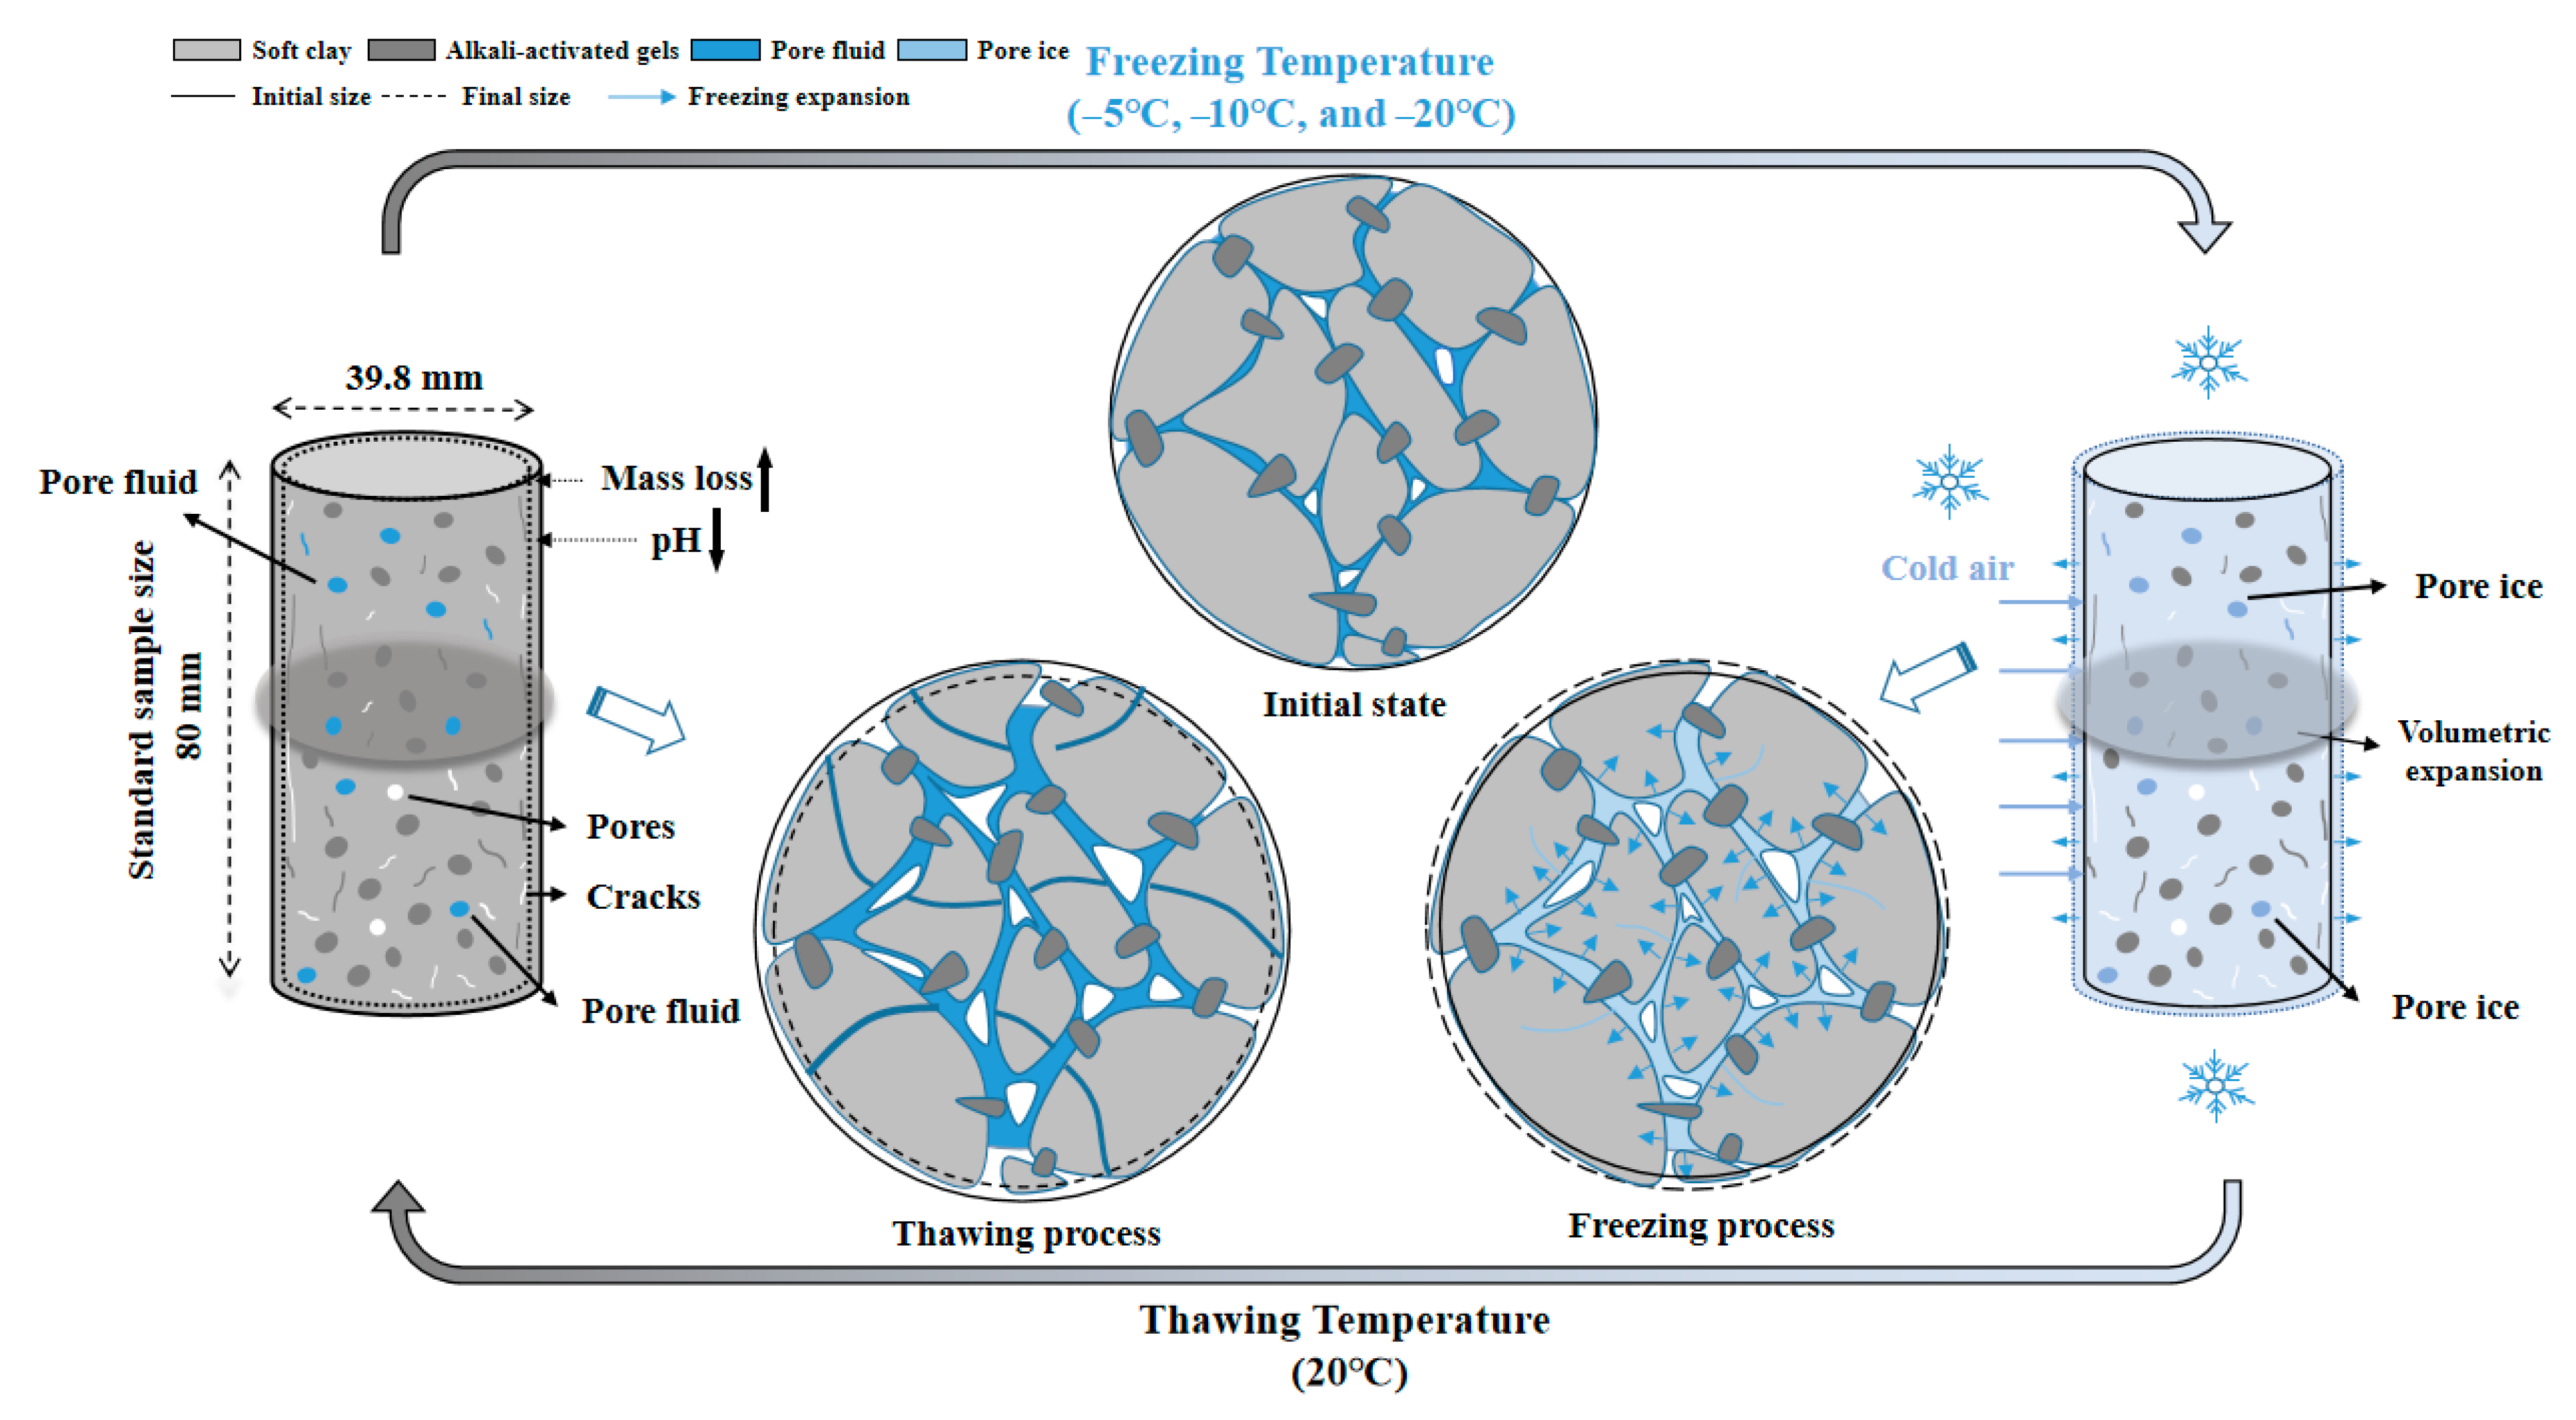
2.3. ACM Stabilization Technology and F-T Condition
2.4. Test Design
3. Results
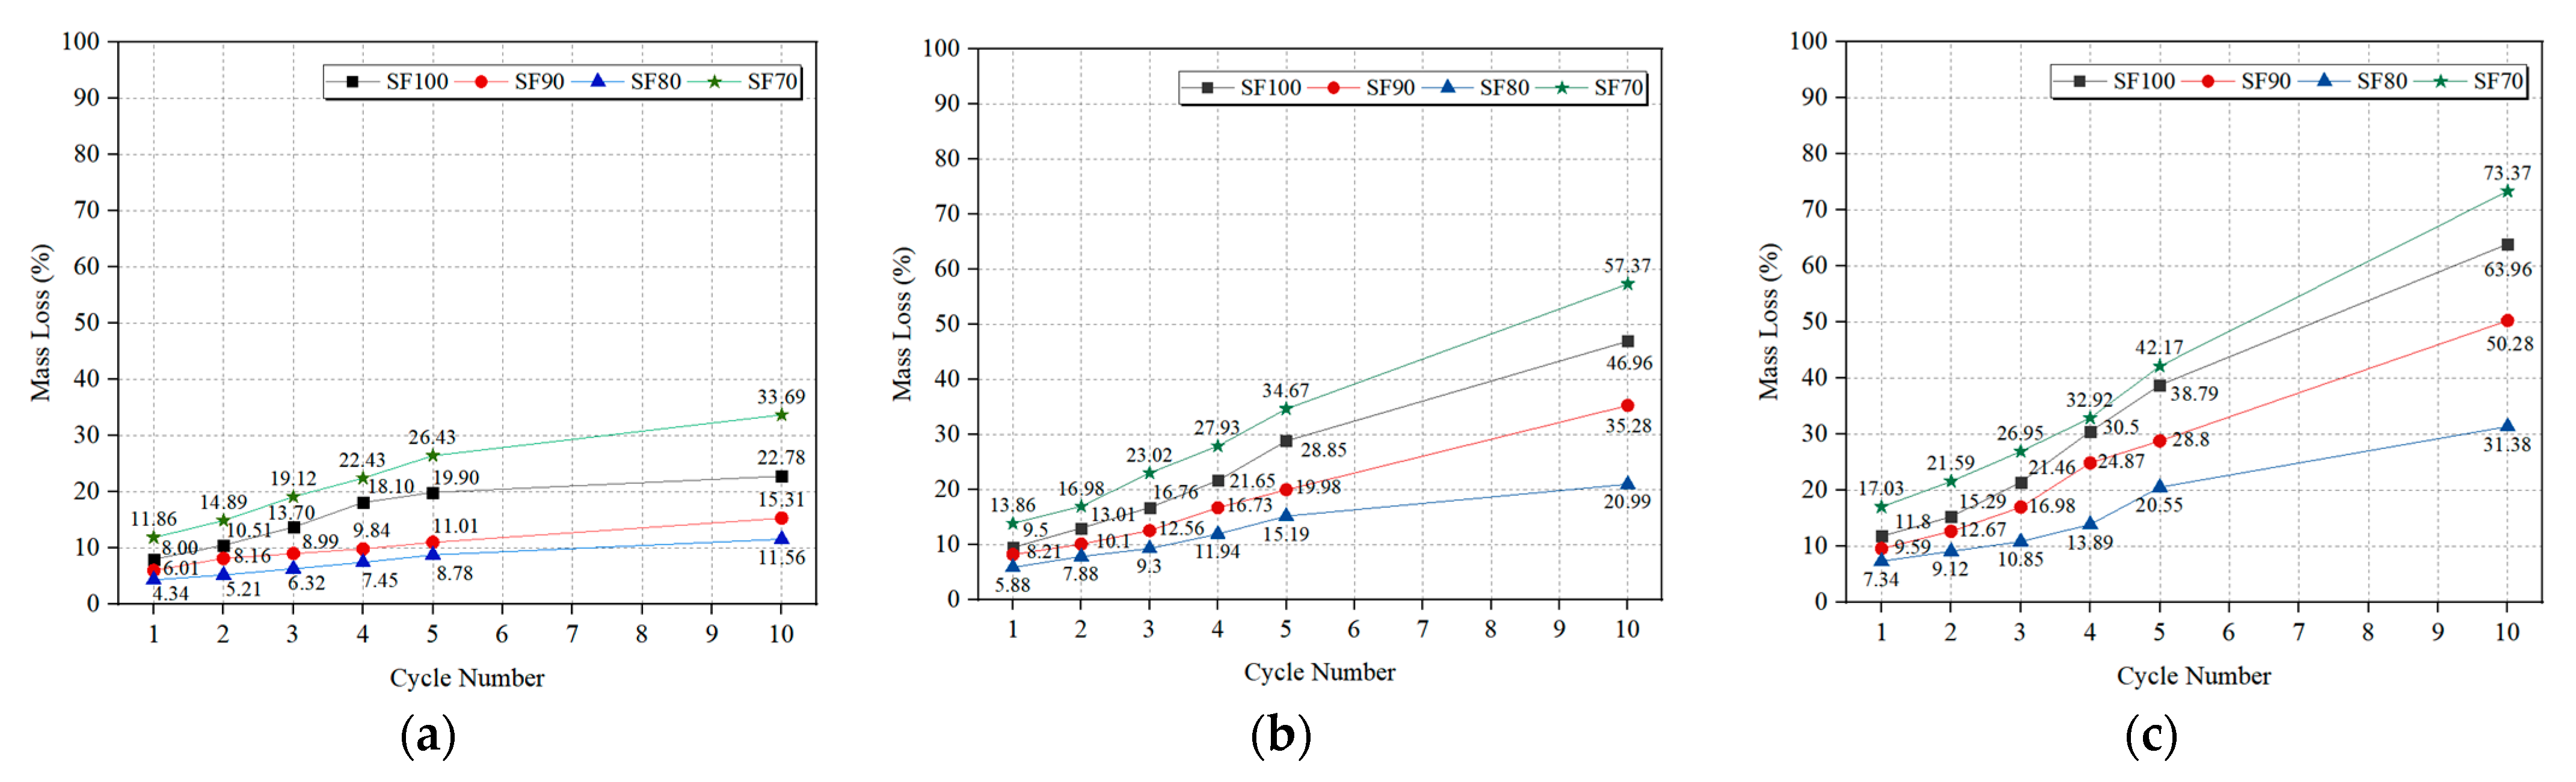
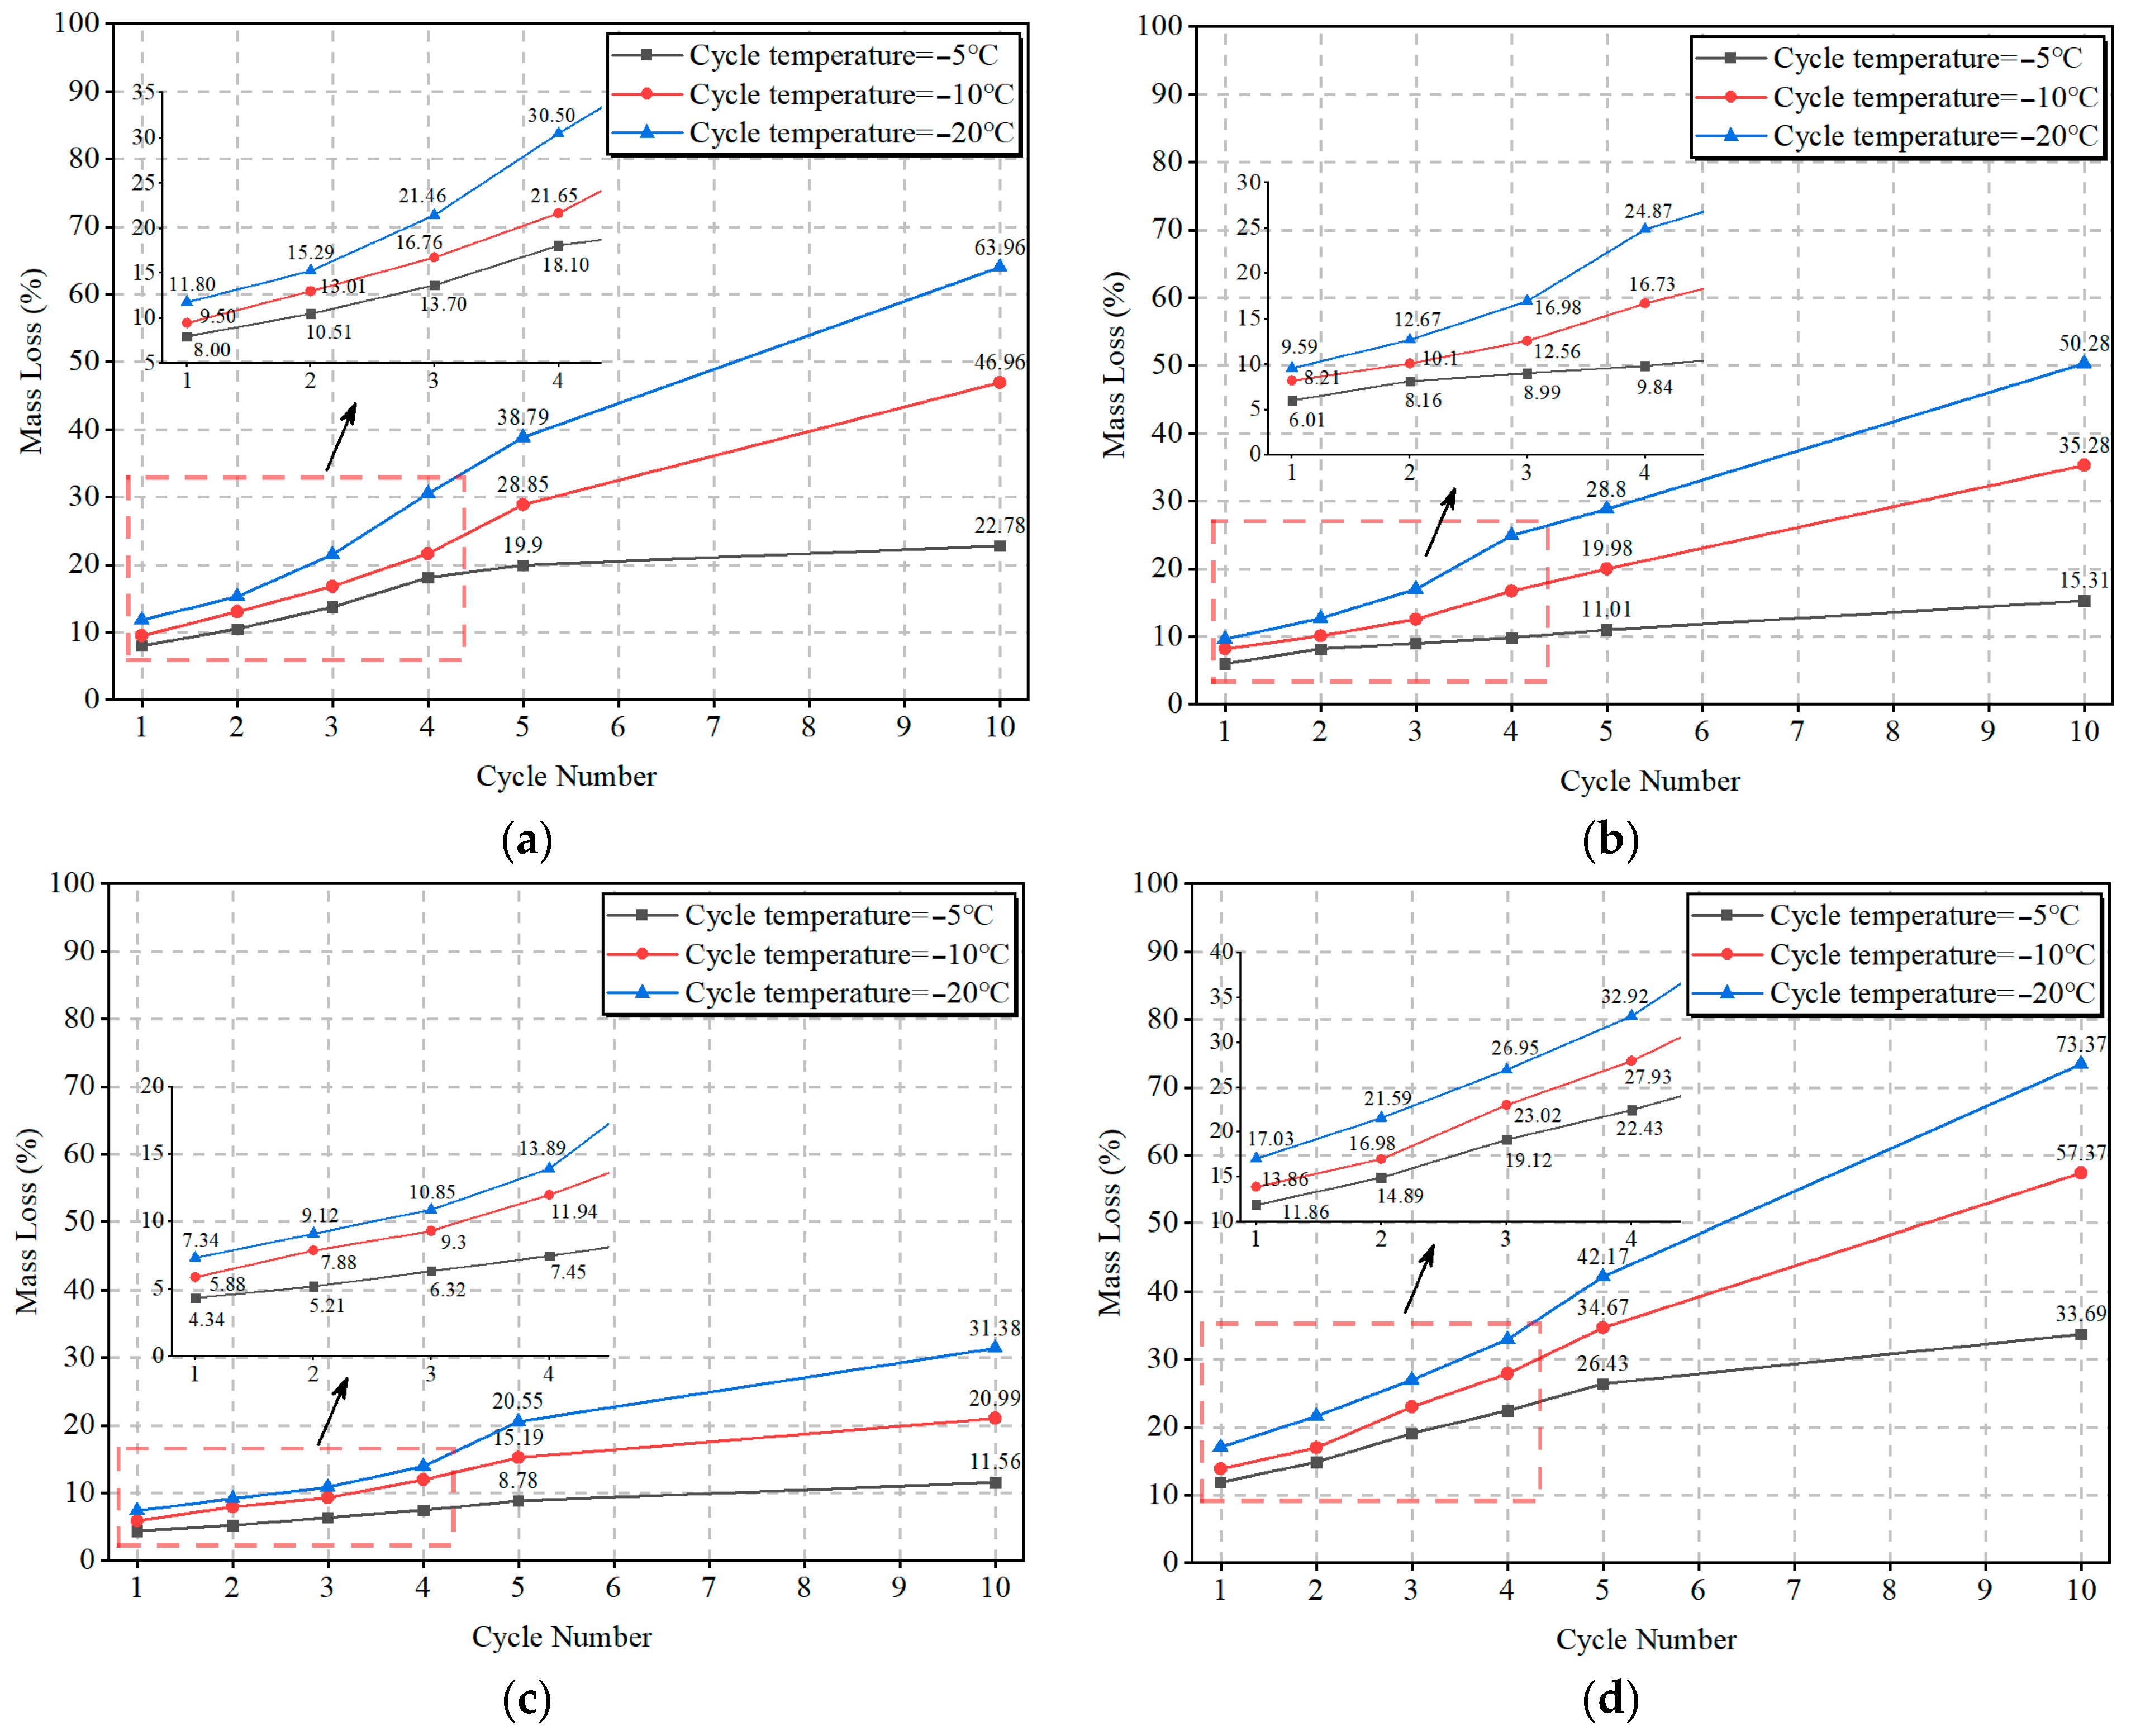
3.1. Mass Loss Results
3.1.1. Effect of Slag to Fly Ash Ratio
3.1.2. Effect of Cycle Temperature and Number
3.2. UCS Results
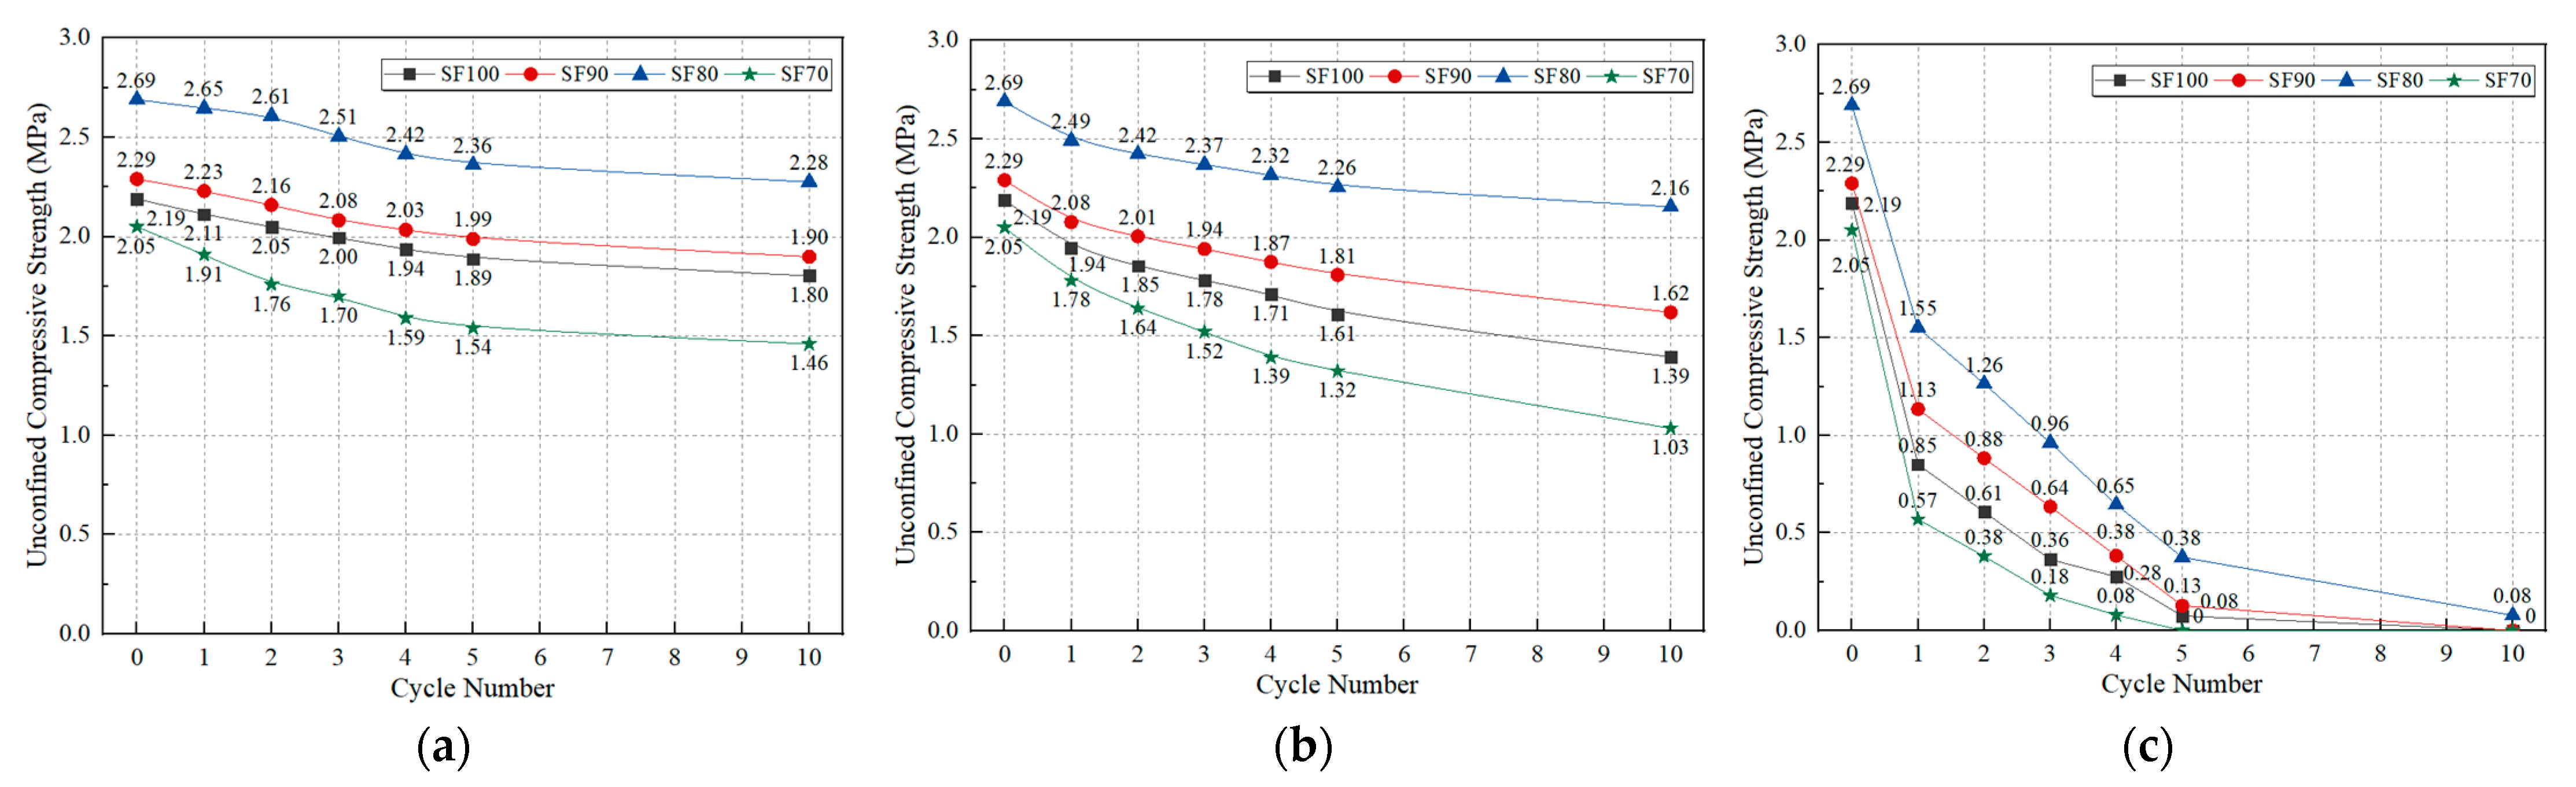
3.2.1. Effect of Slag to Fly Ash Ratio
3.2.2. Effect of Cycle Temperature and Number
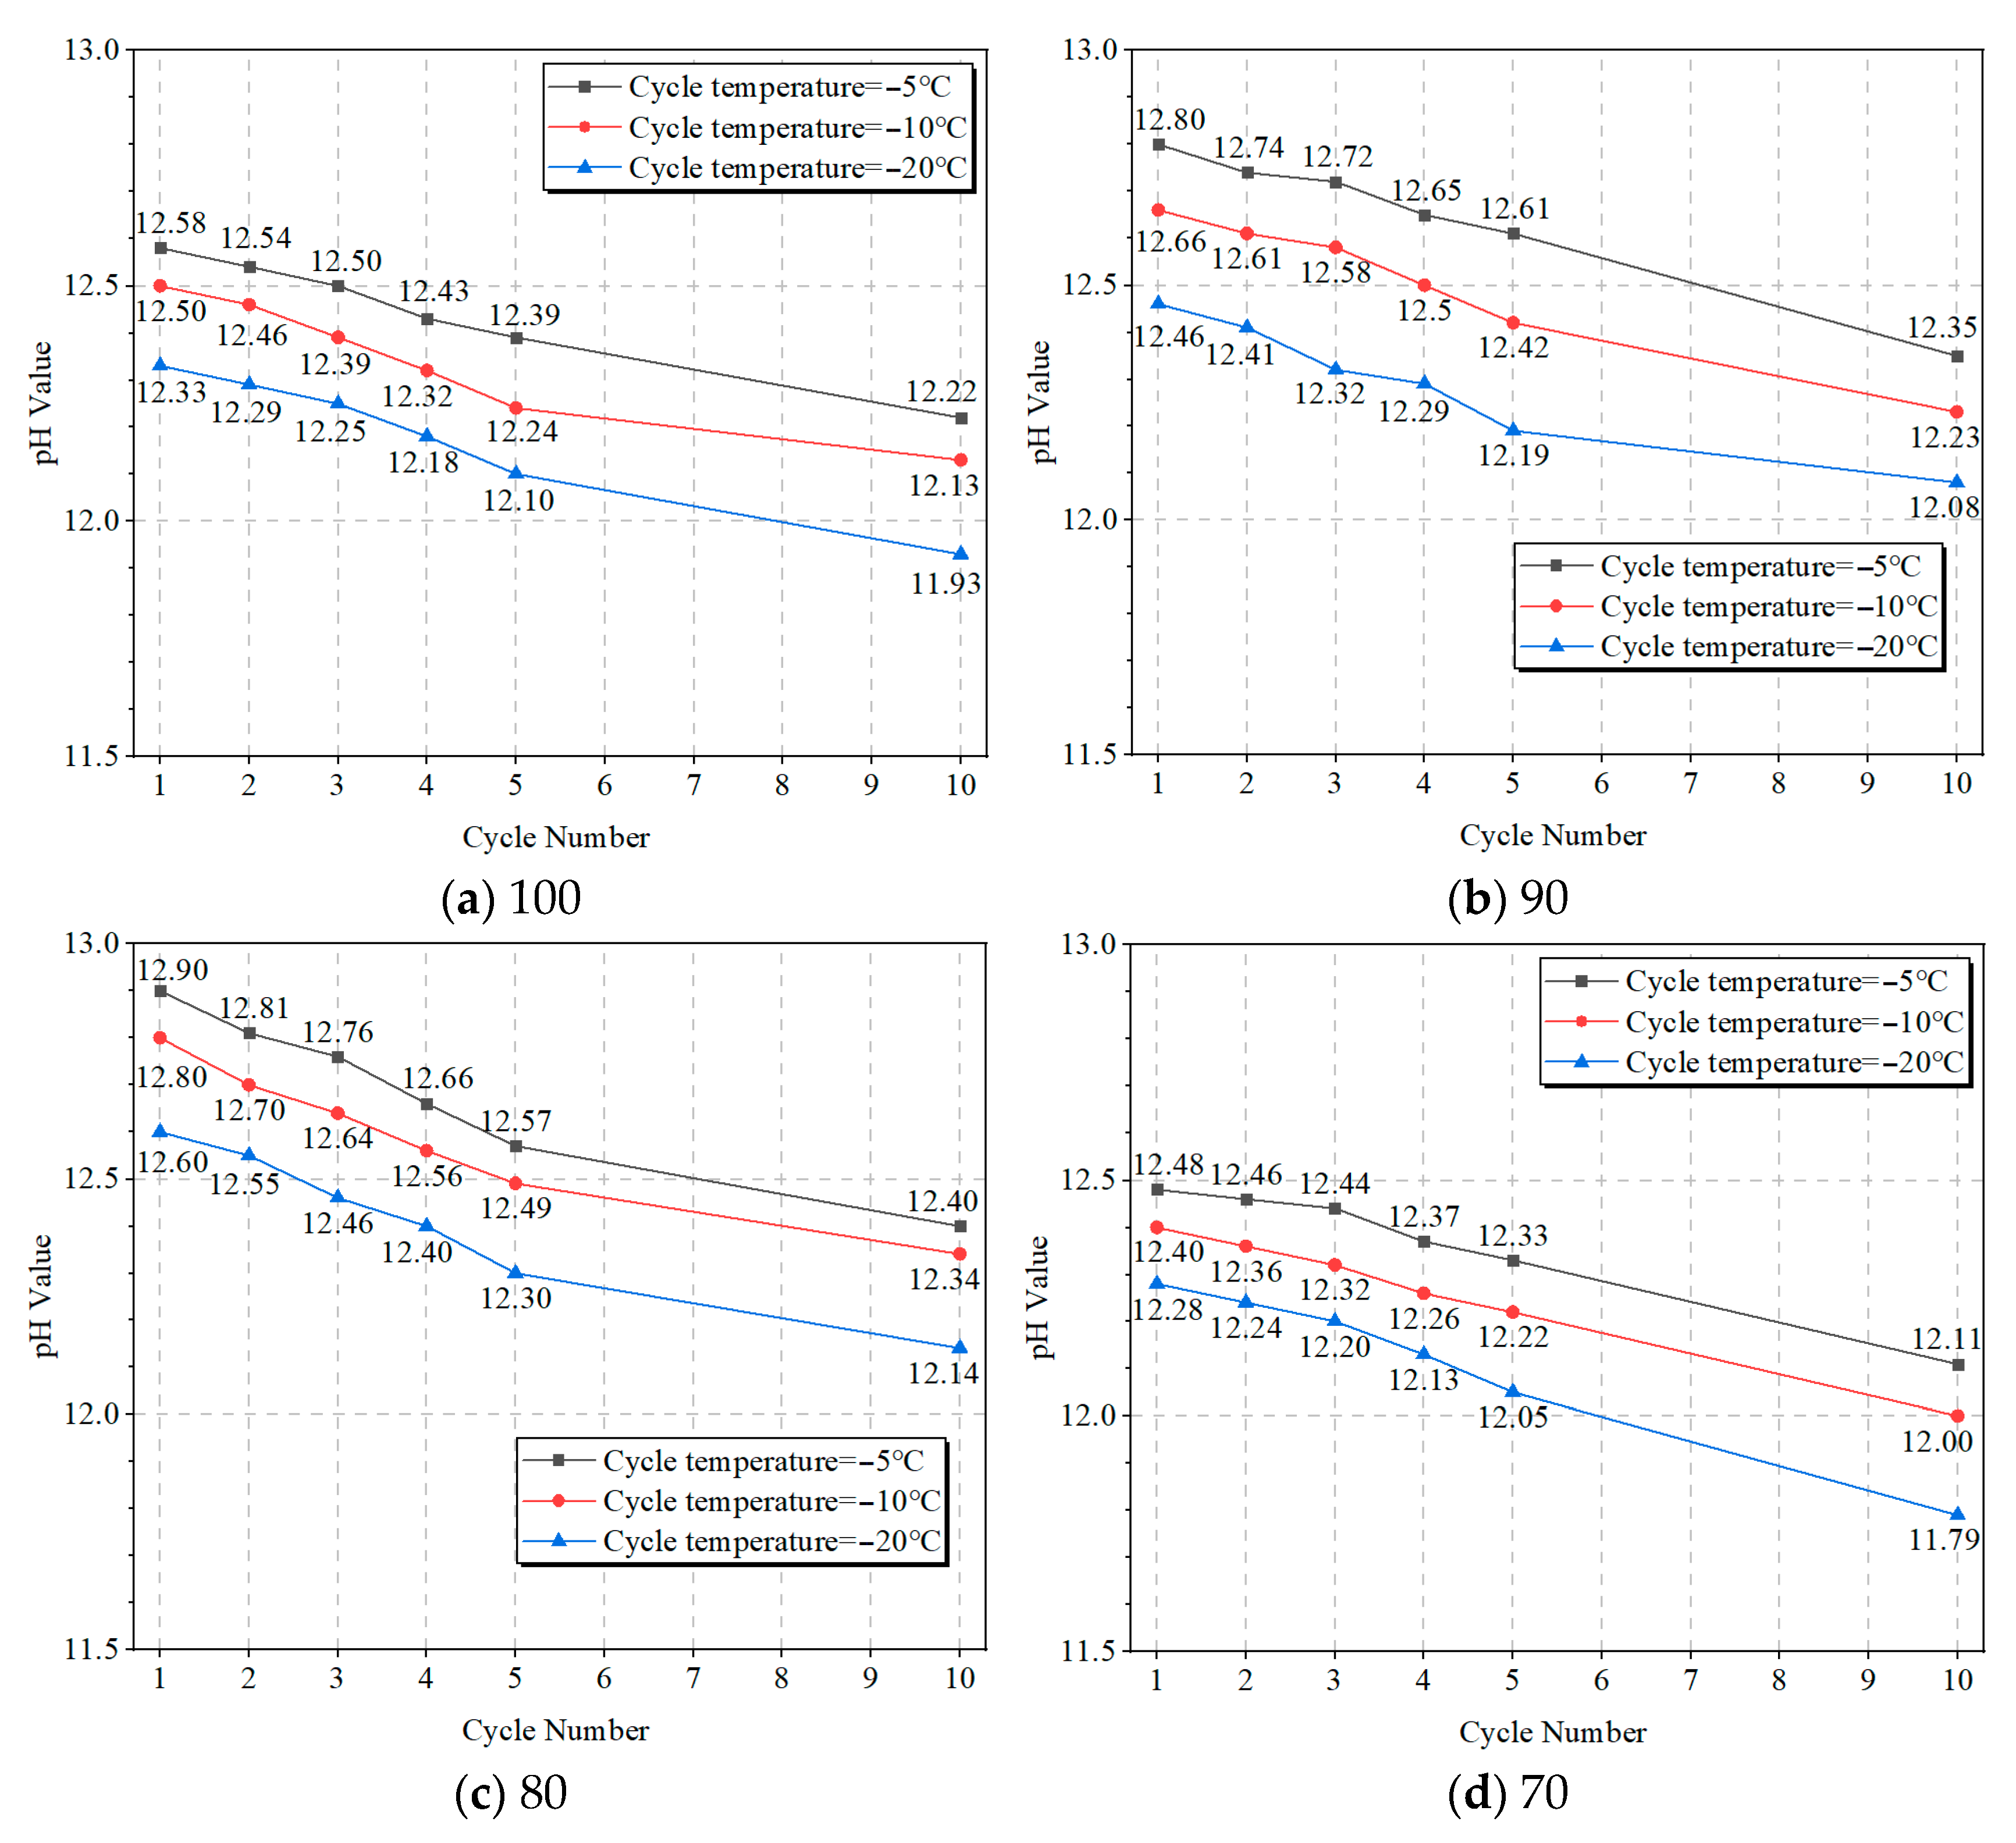
3.2.3. pH Value Results
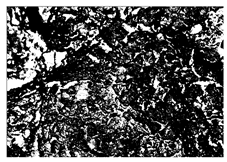
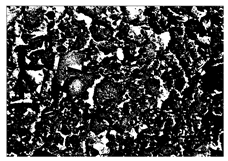
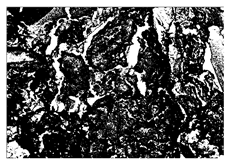
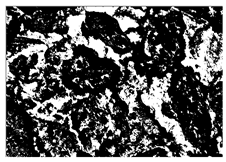
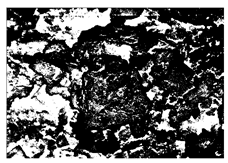
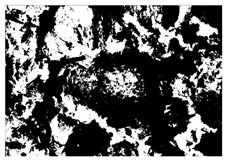
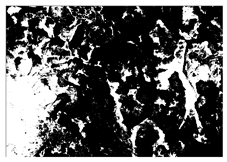
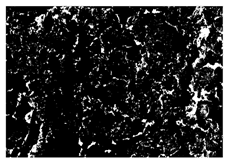
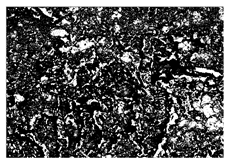
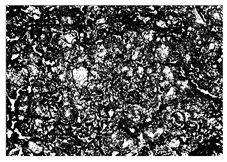
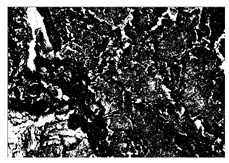
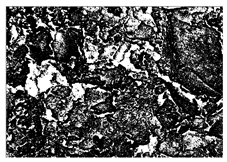
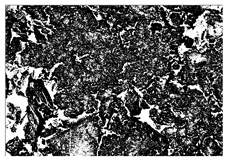
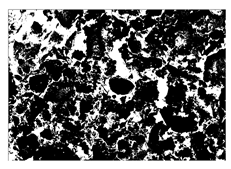
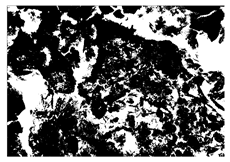
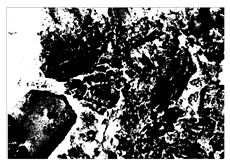
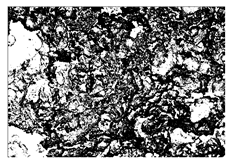
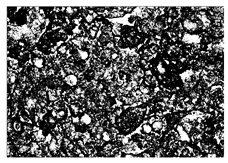
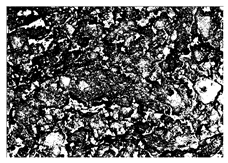
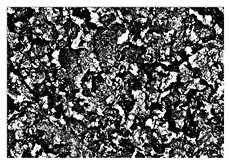
3.3. Microstructure Analysis
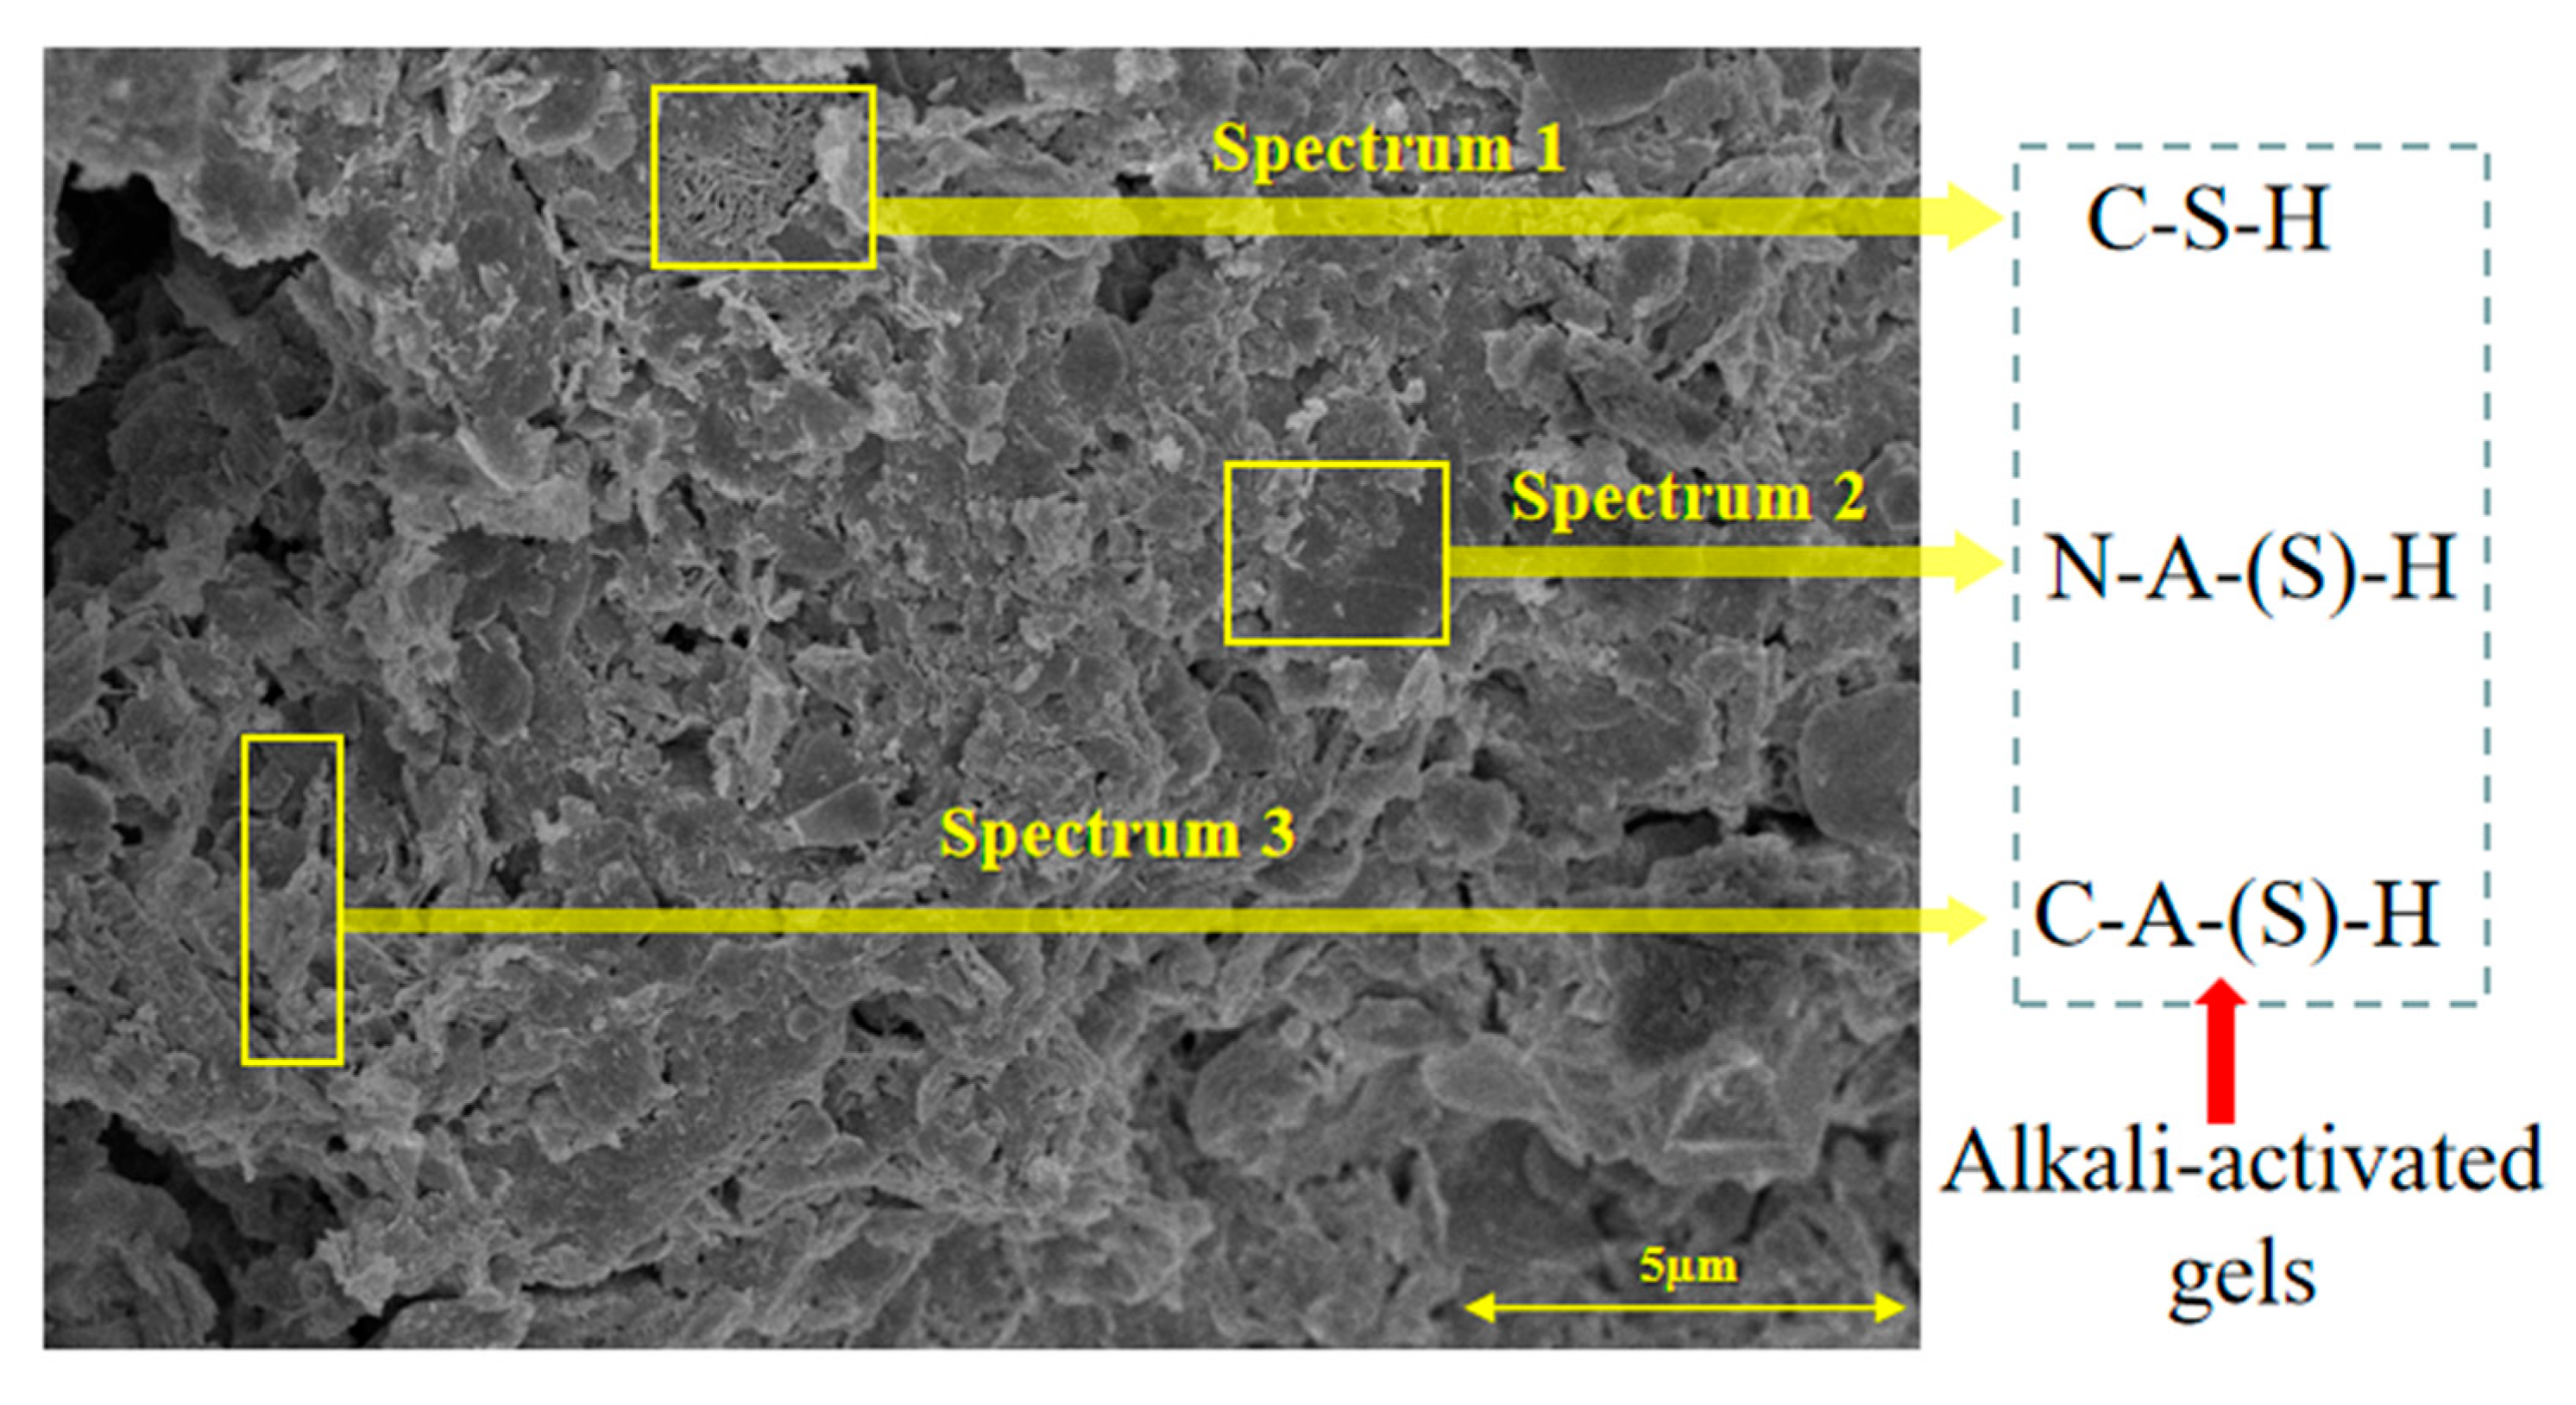
SEM-EDS and IPP Results
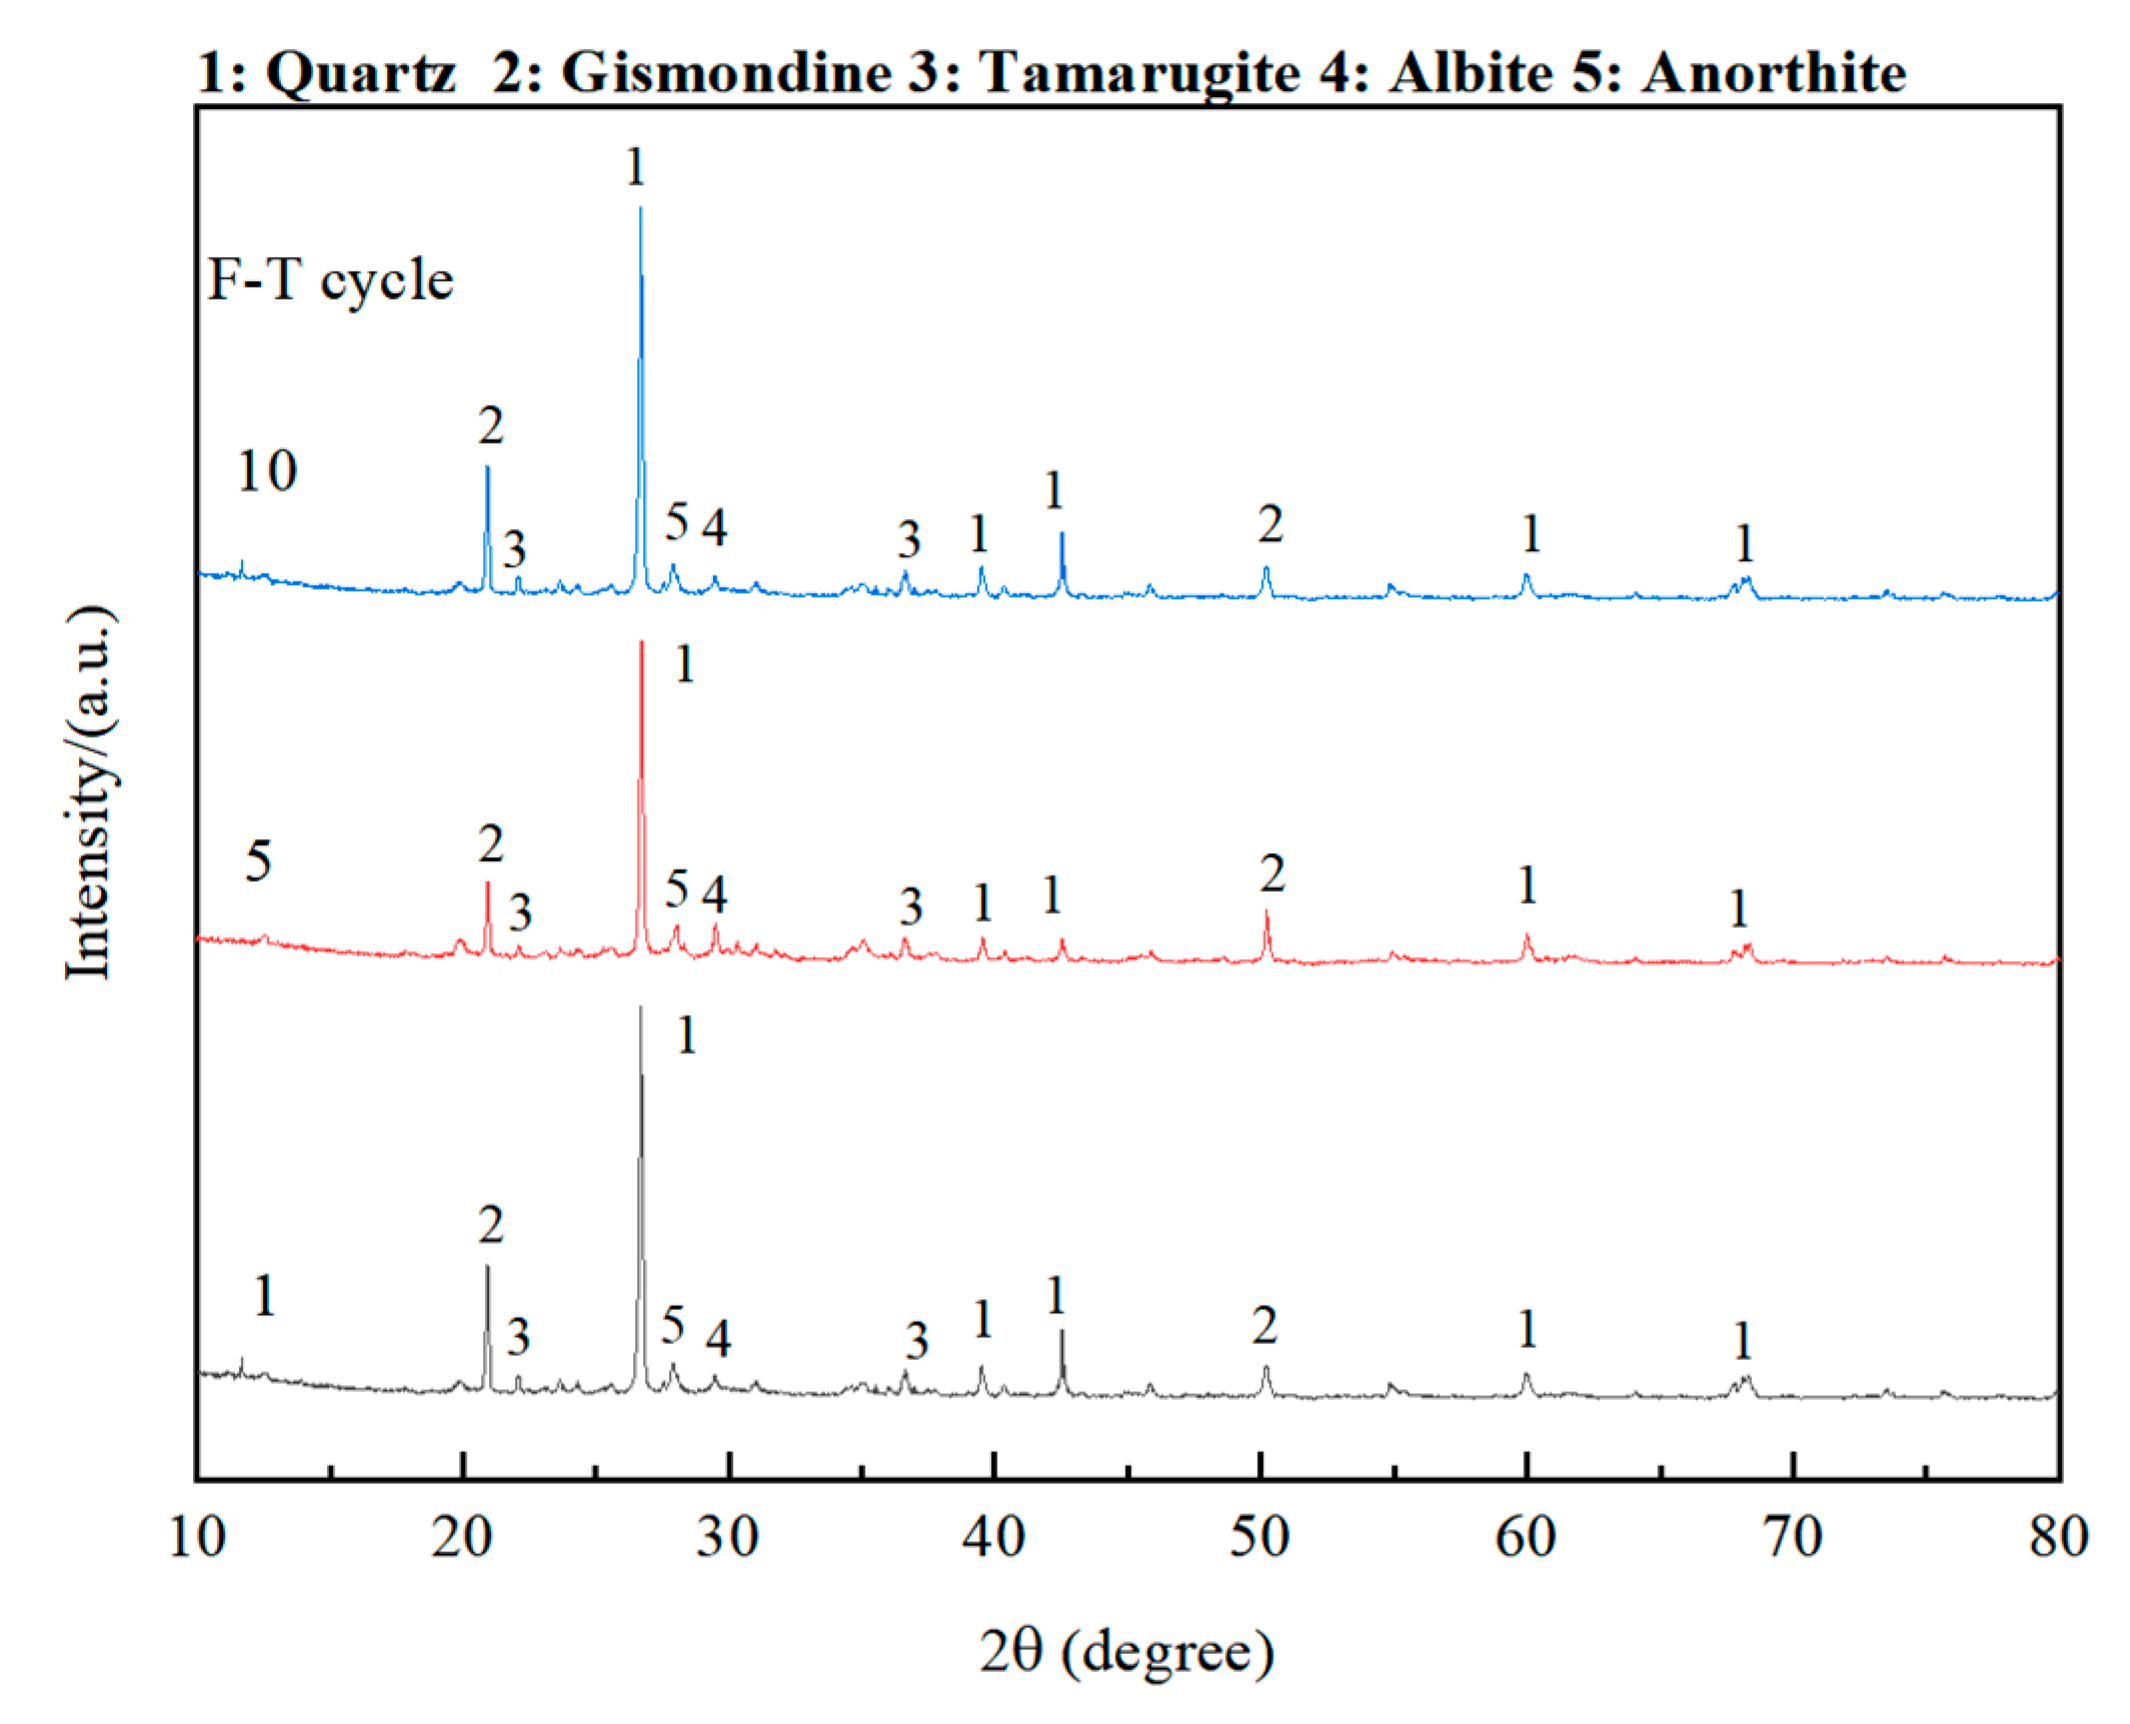
3.4. XRD Results
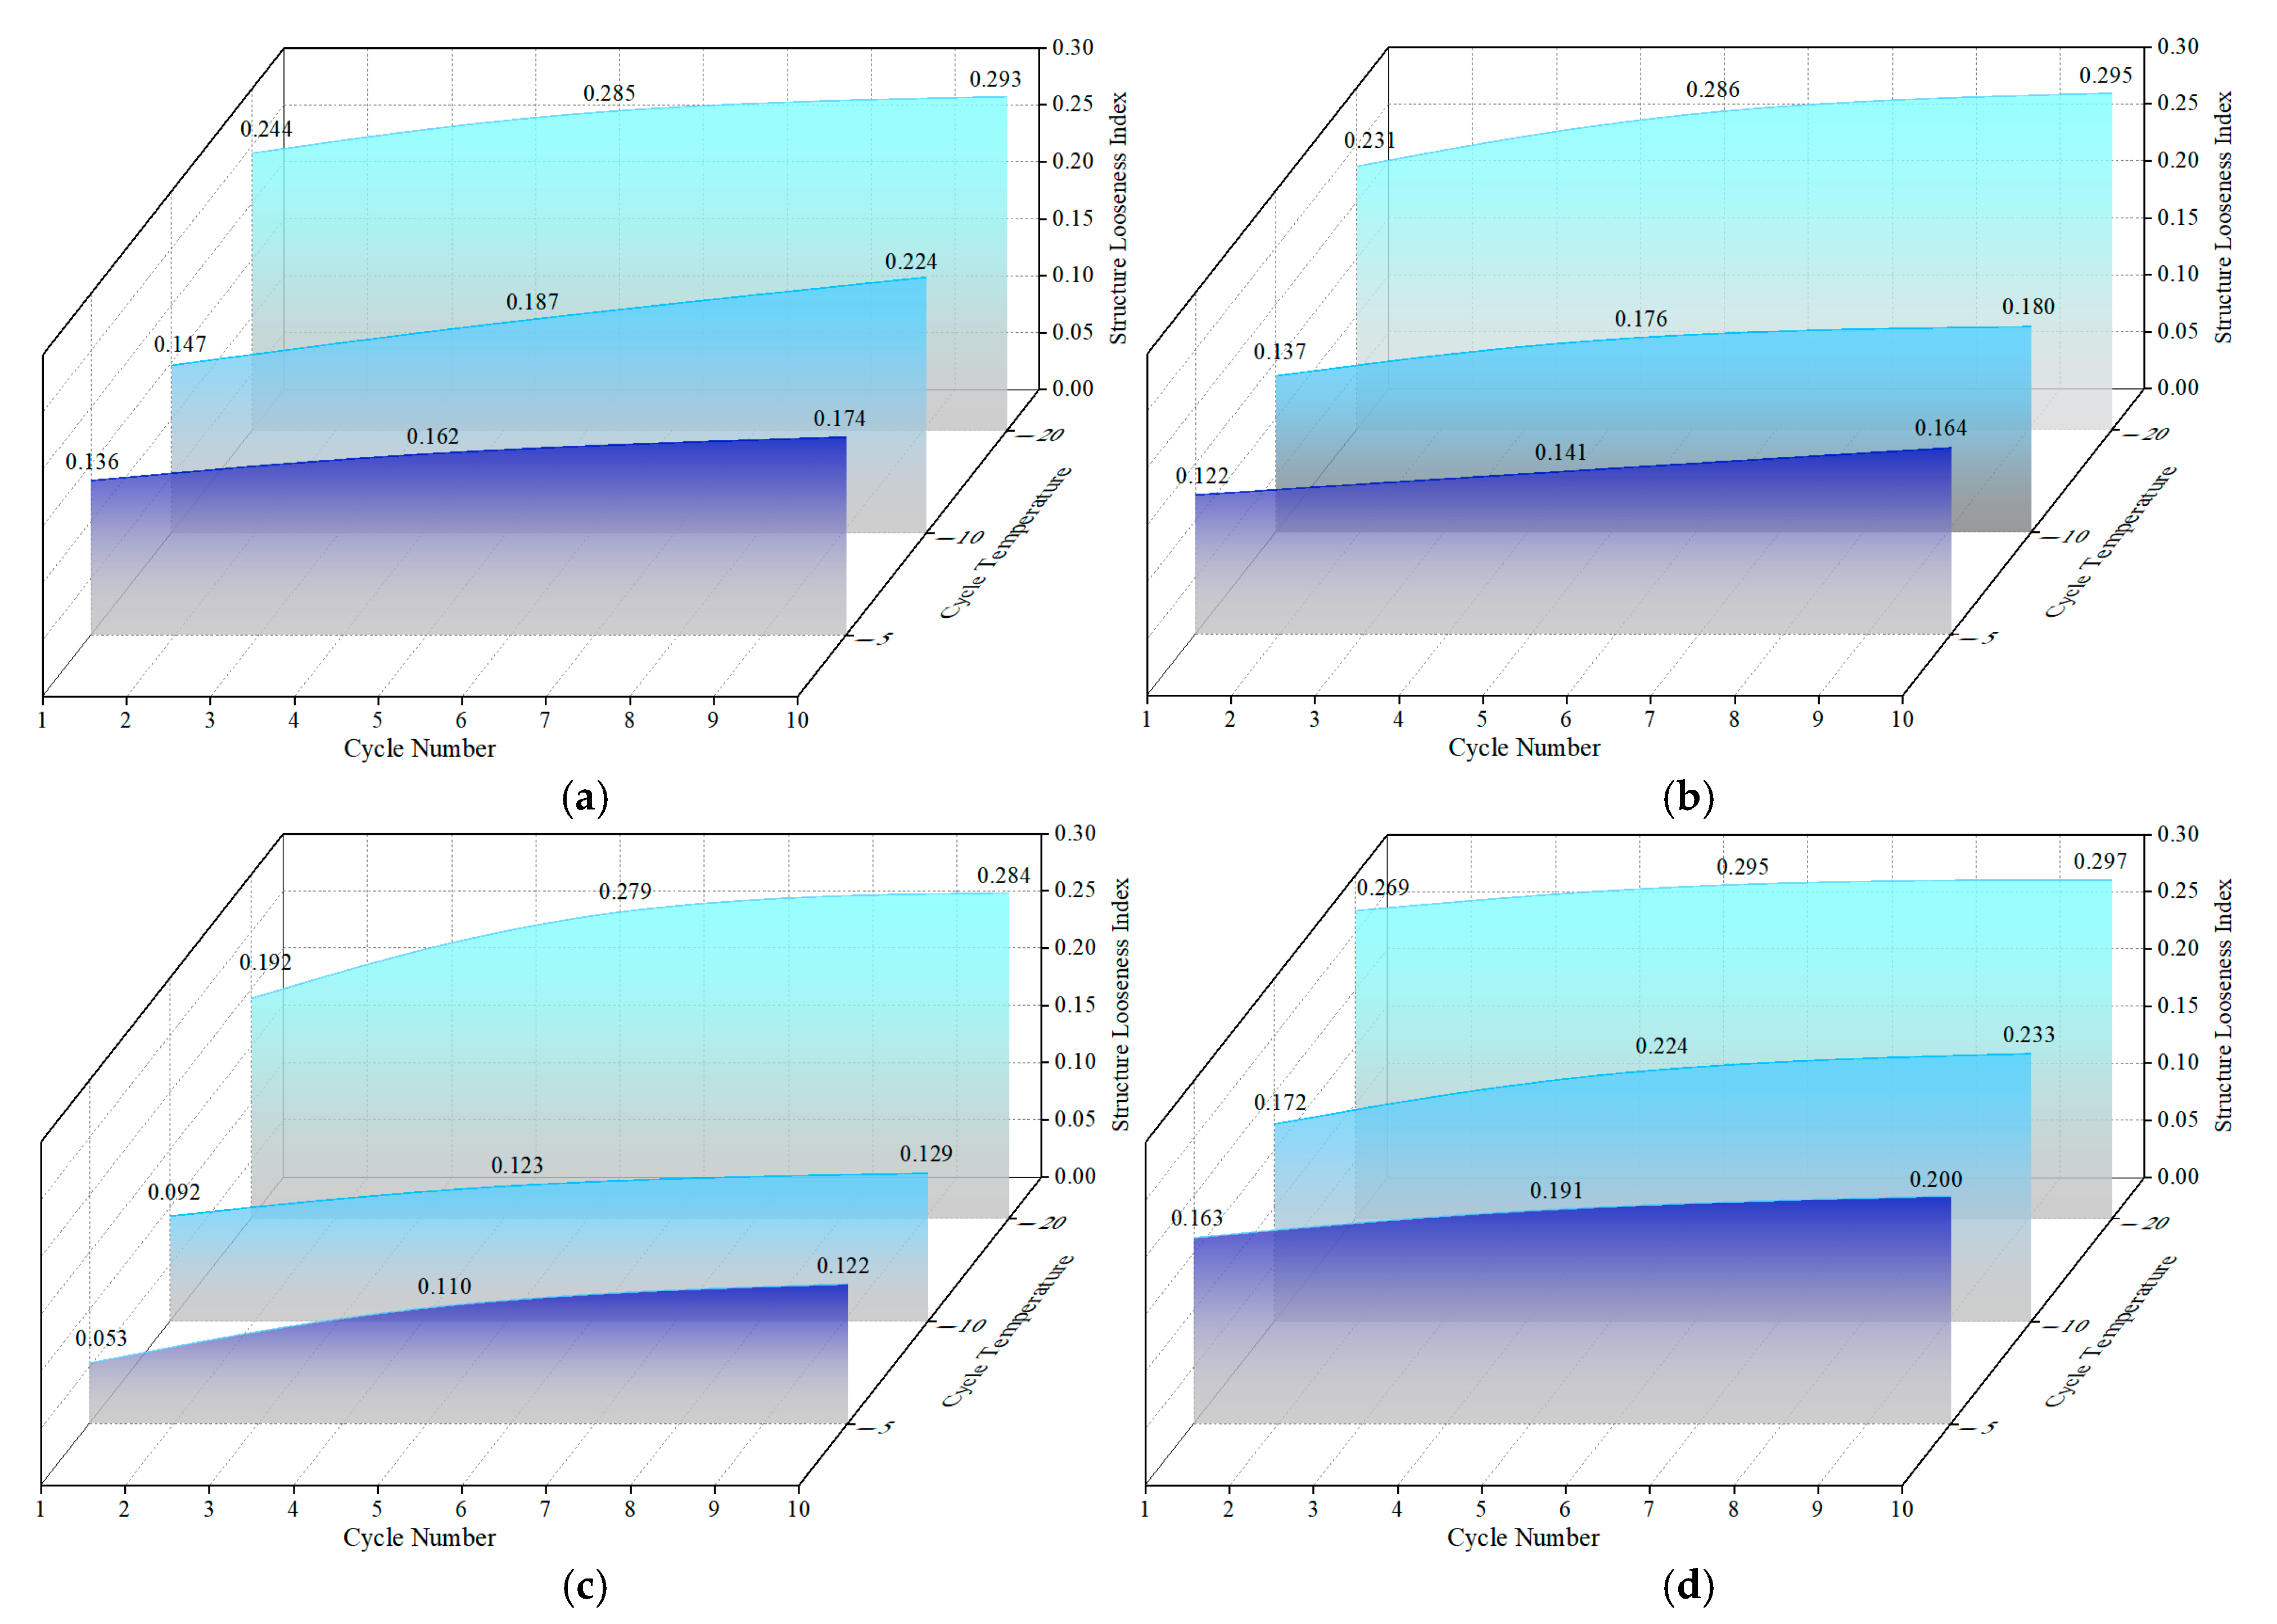
3.5. Freezing Resistance Mechanism
4. Conclusions
- The freezing resistance of OP-ASF stabilized soft soil varies with the ratio of slag to FA. When the ratio of slag to FA is 80:20, the stabilized soil exhibits the best performance in terms of mass loss, UCS, and pH value. A ratio of 70:30 leads to the worst freezing resistance, as excessive FA increases structure looseness, promotes water diffusion, and forms pores during freeze-thaw cycles.
- The mass loss and UCS loss increase with the number of freeze-thaw cycles. After 10 cycles, both reach their highest values. Additionally, as the freezing temperature decreases, the mass loss and UCS loss increase, with the maximum mass loss occurring at −20 °C. The pH value also decreases over time, indicating a weakening of the alkalinity in the stabilized soft soil, especially at lower temperatures.
- SEM-EDS analysis revealed that the SF80 sample (with a slag to FA ratio of 80:20) contained more alkali-activated gels filling the pores and cracks, which contributed to better performance. These findings highlight the importance of structure looseness in determining the mechanical properties of the stabilized soil.
- The freezing resistance mechanism of OP-ASF stabilized soft soil involves the formation of alkali-activated gels that fill pores and cracks, establishing a dense structure. This prevents pore fluid within the soil from freezing, thereby reducing the impact of multiple freeze-thaw cycles.
Author Contributions
Funding
Data Availability Statement
Acknowledgments
Conflicts of Interest
References
- Li, J.; Shan, Y.; Ni, P.; Cui, J.; Li, Y.; Zhou, J. Mechanics, durability, and microstructure analysis of marine soil stabilized by an eco-friendly calcium carbide residue-activated coal gangue geopolymer. Case Stud. Constr. Mater. 2024, 20, e02687. [Google Scholar] [CrossRef]
- Qin, J.; Yi, Y. Use of gasification fly ash, sodium carbonate, and ground granulated blast-furnace slag for soft clay stabilization. Constr. Build. Mater. 2024, 426, 136072. [Google Scholar] [CrossRef]
- Yu, W.; Zhu, Z.; Zhang, D.; Sun, H.; Li, Y. Research on strength and deformation properties of high moisture soft soils stabilized by GGBS, cement, fly ash, and sodium silicate. Constr. Build. Mater. 2024, 448, 138244. [Google Scholar] [CrossRef]
- Du, C.; Yang, Q. Freeze-thaw behavior of calcium carbide residue-plant ash stabilized marine soft clay. Cold Reg. Sci. Technol. 2022, 193, 103432. [Google Scholar] [CrossRef]
- Rikhtehgar, Y.A.; Teymür, B. Effect of magnesium chloride solution as an antifreeze agent in clay stabilization during freeze-thaw cycles. Appl. Sci. 2024, 14, 4140. [Google Scholar] [CrossRef]
- Zhang, X.; Guo, Z.; Liu, S.; Wu, K.; Yuan, Z.; He, H. Durability against dry-wet and freeze-thaw cycles of carbon sequestration foamed concrete utilizing abandoned soil and waste serpentine. J. Build. Eng. 2024, 95, 110194. [Google Scholar] [CrossRef]
- Yang, H.; Lei, B.; Xie, L.; Hu, C.; Liu, J. Experimental study on water and salt migration and the aggregate insulating effect in coarse-grained saline soil subgrade under freeze-thaw cycles. Appl. Sci. 2024, 14, 8970. [Google Scholar] [CrossRef]
- Zhan, Y.; Zhao, M.; Lan, B.; Liu, G.; Lu, Z.; Yao, H. Study on stability of soil slope in seasonally frozen region based on water transfer and strength deterioration under freeze-thaw cycles. J. Cold Reg. Eng. 2025, 39, 04024035. [Google Scholar] [CrossRef]
- Samaptika, M.; Nagendra, R.; Prasad, S.S.; Parveen, S. Strength and durability of fly ash, GGBS and cement clinker stabilized dispersive soil. Cold Reg. Sci. Technol. 2021, 191, 103358. [Google Scholar]
- Salih, R.S.; Shafiqu, M.S.Q. The effect of adding mixture of gypsum-lime with geopolymer on the properties of swelling soil. Civ. Environ. Eng. 2024, 20, 978–992. [Google Scholar] [CrossRef]
- Yilmaz, F.; Fidan, D. Influence of freeze-thaw on strength of clayey soil stabilized with lime and perlite. Geomech. Eng. 2018, 14, 301–306. [Google Scholar]
- Zhang, M.; Feng, C.; Xu, P.; Chen, C. The effect of freeze-thaw cycles and wind erosion on the characteristics of microbial solidified engineering residue. Constr. Build. Mater. 2024, 418, 135374. [Google Scholar] [CrossRef]
- Sorensen, P.O.; Finzi, A.C.; Marc-André, G.; Reinmann, A.B.; Templer, P.H. Winter soil freeze-thaw cycles lead to reductions in soil microbial biomass and activity not compensated for by soil warming. Soil Biol. Biochem. 2018, 116, 39–47. [Google Scholar] [CrossRef]
- Nasiri, H.; Khayat, N.; Nazarpour, A. Utilization of the oil-contaminated soil as a sustainable resource in rural road construction and rehabilitation in oil-producing countries. J. Clean Prod. 2024, 483, 144175. [Google Scholar] [CrossRef]
- Xue, Z.; Zhang, W.; Zhao, X.; Meng, F.; Qin, F.; Xiao, G.; Chen, J. Utilization of cement deep mixing pile for soft soil foundation: A malaysian case study. Front. Mater. 2024, 11, 1484228. [Google Scholar] [CrossRef]
- Zhang, B.; Xu, R.; Yan, Z.; Zhang, G.; Wu, M.; Yu, T. Study on mixing cement-waste by-product to stabilize soft marine clay. Int. J. Geosynth. Ground Eng. 2023, 9, 20. [Google Scholar] [CrossRef]
- Abdolvand, Y.; Sadeghiamirshahidi, M. Soil stabilization with gypsum: A review. J. Rock Mech. Geotech. Eng. 2024, 16, 5278–5296. [Google Scholar] [CrossRef]
- Barcelos, P.J.; Rodríguez, S.R.A.; Bargiela, R.; Mariano, E.; Gloyshina, V.O.; Jones, L.D.; Rosolem, A.C. Lime, gypsum, and nitrogen as drivers to increase the abundance of soil fungi and N-cycling microorganisms in integrated agricultural systems. Appl. Soil Ecol. 2024, 202, 105549. [Google Scholar] [CrossRef]
- Sajad, S.; Hossein, A.V.; Mehdi, M. Effects of freeze-thaw cycles on the characteristics of the expansive soils treated by nanosilica and Electric Arc Furnace (EAF) slag. Cold Reg. Sci. 2021, 182, 103216. [Google Scholar]
- Lu, J.; Tan, L.; Yang, H.; Wan, X.; Wang, Y.; Yan, Z. Experimental study on the hydro-thermal-deformation characteristics of cement-stabilized soil exposed to freeze-thaw cycles. Front. Earth Sci. 2023, 10, 1041249. [Google Scholar] [CrossRef]
- Mansour, E.; John, K.; Jonathan, O. Role of gypsum content on the long-term performance of lime-stabilised soil. Materials 2022, 15, 5099. [Google Scholar]
- Scrivener, K.L.; Matschei, T.; Georget, F.; Juilland, P.; Mohamed, A.K. Advances in hydration and thermodynamics of cementitious systems. Cem. Concr. Res. 2023, 174, 107332. [Google Scholar] [CrossRef]
- Bakharev, T.; Sanjayan, J.G.; Cheng, Y.B. Resistance of alkali-activated slag concrete to alkali-aggregate reaction. Cement Concr. Res. 2001, 31, 331–334. [Google Scholar] [CrossRef]
- Du, Y.J.; Bo, Y.L.; Jin, F.; Liu, C.Y. Durability of reactive magnesia-activated slag-stabilized low plasticity clay subjected to drying-wetting cycle. Eur. J. Environ. Civ. Eng. 2016, 20, 215–230. [Google Scholar] [CrossRef]
- Du, Y.J.; Wei, M.L.; Jin, F. Laboratory investigation on strength properties of cement stabilized zinc-contaminated clay. Eng. Geol. 2013, 167, 20–26. [Google Scholar] [CrossRef]
- Tao, D.; Chen, S.; Parekh, B.; Hepworth, M.T. An investigation of a thermochemical process for conversion of gypsum and pyrite wastes into useful products. Adv. Environ. Res. 2001, 5, 277–284. [Google Scholar] [CrossRef]
- Hou, W.; Ye, F.; Yu, Y.; Chen, D.; Wang, J.; Liu, F.; Feng, D.; Liang, S. Experimental study on the strength characteristics and seawater degradation resistance of sandy silt solidified with alkali-activated slag. Constr. Build. Mater. 2025, 458, 139610. [Google Scholar] [CrossRef]
- Hunar, M.D.; Yavuz, O.B.; Ali, Ö.; Gökhan, K. Sustainable use of waste tire rubbers in eco-friendly and lightweight alkali-activated slag-silica fume mortars. J. Mater. Civ. Eng. 2024, 36, 04024432. [Google Scholar]
- Xiao, R.; Nie, Q.; Dai, X.; Wan, Z.; Zhong, J.; Ma, Y.; Huang, B. Developing alkali-activated controlled low-strength material (CLSM) using urban waste glass and red mud for sustainable construction. J. Build. Eng. 2024, 98, 111202. [Google Scholar] [CrossRef]
- Yang, T.; Yang, S.; Sun, Z.; Wang, S.; Pang, R. Deterioration mechanism of alkali-activated slag and fly ash blended recycled aggregate concrete under freeze-thaw cycle. J. Build. Eng. 2025, 99, 111555. [Google Scholar] [CrossRef]
- Kamakshi, T.A.; Ramagiri, K.K.; Subramaniam, K.V.L. Fly ash-based aqueous nanosilica enhanced activator for efficient production of room temperature-cured concrete with two-part alkali-activated binders. J. Mater. Civ. Eng. 2024, 36, 04024312. [Google Scholar] [CrossRef]
- Wang, H.; Wang, L.; Lin, J.; Li, Y.; Lu, Z.; Jiang, J. Target dispersion of pozzolanic materials nearby hydration-released calcium hydrates to improve the pozzolanic reaction degree. Cement Concr. Res. 2024, 153, 105741. [Google Scholar] [CrossRef]
- Zhao, Q.; Ma, C.; Huang, B.; Lu, X. Development of alkali activated cementitious material from sewage sludge ash: Two-part and one-part geopolymer. J. Clean Prod. 2023, 384, 135547. [Google Scholar] [CrossRef]
- Min, Y.; Wu, J.; Li, B.; Zhang, J. Effects of Fly ash content on the strength development of soft clay stabilized by one-part geopolymer under curing stress. J. Mater. Civ. Eng. 2021, 33, 04021274. [Google Scholar] [CrossRef]
- ASTM C618-15; Standard Specification for Coal Fly Ash and Raw or Calcined Natural Pozzolan for Use as a Mineral Admixture in Concrete. ASTM International: West Conshohocken, PA, USA, 2015.
- Zheng, X.; Wu, J. Early strength development of soft clay stabilized by one-part ground granulated blast furnace slag and fly ash-based geopolymer. Front. Mater. 2021, 8, 616430. [Google Scholar] [CrossRef]
- Li, L.; Zheng, X.; Wu, J.; Zhang, J.; Li, P.; Wei, X. Performance of the one-part geopolymer stabilized soft clay under acids attack. J. Clean. Prod. 2024, 452, 142183. [Google Scholar] [CrossRef]
- ASTM C666/C666M-03; Standard Test Method for Resistance of Concrete to Rapid Freezing and Thawing. ASTM International: West Conshohocken, PA, USA, 2003.
- ASTM D4972-19; Standard Test Methods for pH of Soils. ASTM International: West Conshohocken, PA, USA, 2019.
- ASTM C267-20; Standard Test Methods for Chemical Resistance of Pastes, Grouts, and Monolithic Surfacings and Polymer Concretes. ASTM International: West Conshohocken, PA, USA, 2020.
- ASTM C109/C109M-21; Standard Test Method for Compressive Strength of Hydraulic Cement Pastes (Using 2-in. or [50-mm] Cube Specimens). ASTM International: West Conshohocken, PA, USA, 2021.
- ASTM C1365-18; Standard Test Method for Determination of the Proportion of Phases in Portland Cement and Portland-cement Clinker Using X-Ray Powder Diffraction Analysis. ASTM International: West Conshohocken, PA, USA, 2018.
- ASTM C1723-16; Standard Guide for Examination of Hardened Concrete Using Scanning Electron Microscopy. ASTM International: West Conshohocken, PA, USA, 2016.
- Akagawa, S. Experimental study of frozen fringe characteristics. Cold Reg. Sci. Technol. 1988, 15, 209–223. [Google Scholar] [CrossRef]
- Harlan, R.L. Analysis of coupled heat-fluid transport in partially frozen soil. Water Resour. Res. 1973, 9, 1314–1323. [Google Scholar]
- Adesanya, E.; Ohenoja, K.; Maria, D.A.; Kinnunen, P.; Illikainen, M. Alternative alkali-activator from steel-making waste for one-part alkali-activated slag. J. Clean. Prod. 2020, 274, 123020. [Google Scholar] [CrossRef]
- Min, Y.; Wu, J.; Li, B.; Zhang, M.; Zhang, J. Physicochemical and mechanical behavior of the one-Part Geopolymer paste exposed to hydrochloric and sulfuric acids. J. Mater. Civ. Eng. 2023, 35, 04022456. [Google Scholar] [CrossRef]
- Sturm, P.; Gluth, G.J.G.; Brouwers, H.J.H.; Kühne, H.C. Synthesizing one-part geopolymers from rice husk ash. Constr. Build. Mater. 2016, 124, 961–966. [Google Scholar] [CrossRef]
- Richard, C.; Ravi, A.P.; Frank, D. Activation kinetic model and mechanisms for alkali-activated slag cements. Constr. Build. Mater. 2022, 323, 126577. [Google Scholar]
- Yao, C.; Shen, A.; Lyu, Z.; Zeng, G. Mitigating freeze-thaw deterioration of pavement concrete under multi-field coupling by superabsorbent polymers. Constr. Build. Mater. 2024, 414, 134726. [Google Scholar] [CrossRef]
- Zhang, X.; Ding, Z.; He, S.; Zhang, G.; Sun, M.; Xia, T. An experimental study on the microstructure evolution of soil under lateral consolidation compression. Appl. Sci. 2022, 16, 8331. [Google Scholar] [CrossRef]


| Remold Soil | Binder a | ||||
|---|---|---|---|---|---|
| Soil | Water: Soft soil b | OP-ASF | |||
| Soft soil | 0.5 | Slag: FA b | NaOH: Precursor b,c | Water: Solid mixture b,d | |
| SF100 | 100:0 | 0.15 | 0.7 | ||
| SF90 | 90:10 | ||||
| SF80 | 80:20 | ||||
| SF70 | 70:30 | ||||
| Parameter | Series |
|---|---|
| Freeze-thaw cycle number | 1, 2, 3, 4, 5, and 10 |
| Freezing temperature | −5, −10, −20 °C |
| Freezing time | 12 h |
| Thawing temperature | Room temperature (20 ± 1 °C) |
| Thawing time | 12 h |
| Test Content | Test Standard And Detail | Symbol and Test Description |
|---|---|---|
| For mass loss test | ASTM C267-20 [40]: | m∆: mass loss; m0: mass before freeze-thaw cycles; mt: mass after freeze-thaw cycles. |
| For UCS test | ASTM C109/C109M-21 [41]: | Ft: axial pressure; A: compression area of the sample (39.8 mm in diameter). P∆: UCS value loss; P0: UCS value before freeze-thaw cycles; Pt: UCS value after freeze-thaw cycles. |
| For pH value test | ASTM D4972-19 [39] |  pH meter |
| For XRD analysis | ASTM C1365-18 [42] |  D2-PHASER from Bruker company in Karlsruhe, Germany |
| For SEM-EDS analysis | ASTM C1723-16 [43] |  Nova NanoSEM 450 and AZtec X-Max N80 from FEI company in Hillsboro, OR, USA |
| Alkali-Activated Gels | Ca | O | Na | Mg | Al | Si | Fe |
|---|---|---|---|---|---|---|---|
| C-S-H | 17.38 | 59.63 | 2.21 | 1.12 | 1.80 | 16.81 | 1.05 |
| C-A-(S)-H | 16.85 | 57.53 | 1.91 | 1.75 | 8.07 | 11.96 | 1.93 |
| N-A-S-H | 2.12 | 59.65 | 0.73 | 9.73 | 7.80 | 18.64 | 1.53 |
| Total: 100 (%) | |||||||
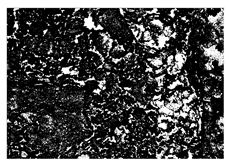
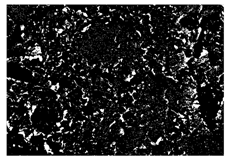
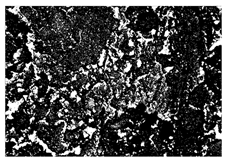
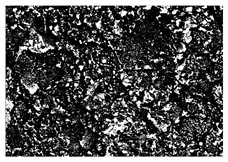
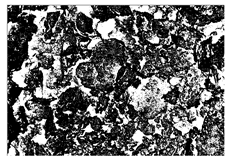
| F-T Cycle Number | 1 | 5 | 10 |
|---|---|---|---|
| SF100 −5 °C | 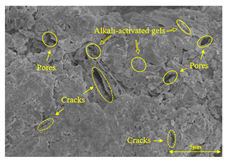 | 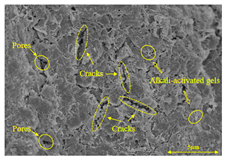 | 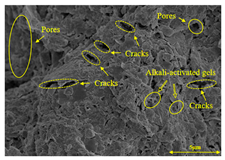 |
 |  |  | |
| SF100 −10 °C | 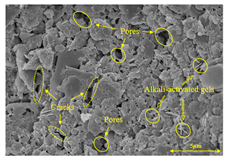 |  |  |
 |  |  | |
| SF100 −20 °C | 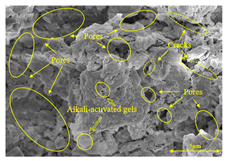 | 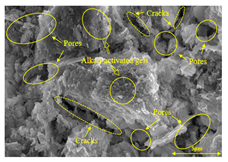 | 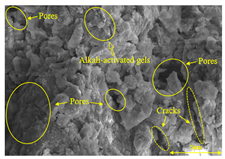 |
 |  |  | |
| SF90 −5 °C | 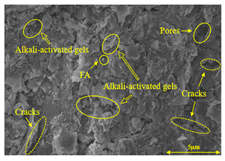 | 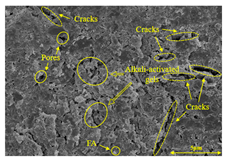 |  |
 |  |  | |
| SF90 −10 °C | 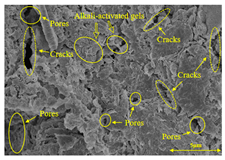 |  | 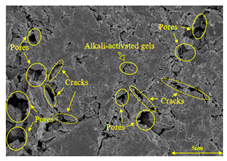 |
 |  |  | |
| SF90 −20 °C | 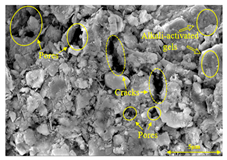 | 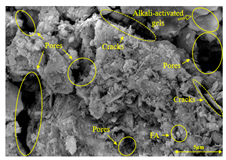 | 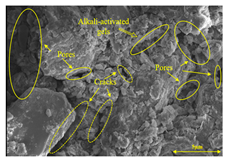 |
 |  |  | |
| SF80 −5 °C | 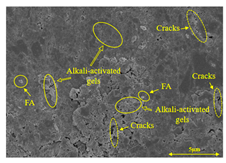 | 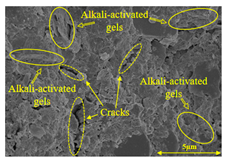 | 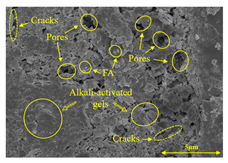 |
 |  |  | |
| SF80 −10 °C | 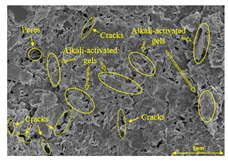 | 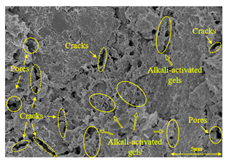 | 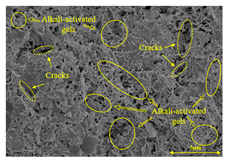 |
 |  |  | |
| SF80 −20 °C | 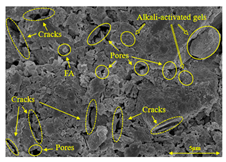 | 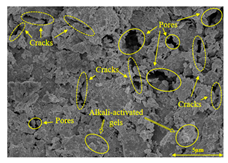 | 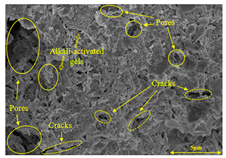 |
 |  |  | |
| SF70 −5 °C | 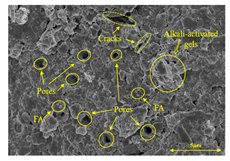 | 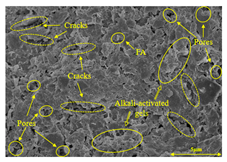 | 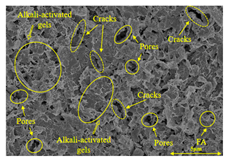 |
 |  |  | |
| SF70 −10 °C | 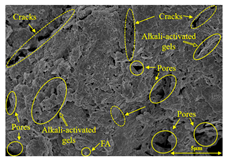 | 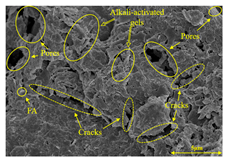 | 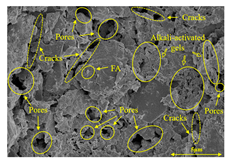 |
 |  |  | |
| SF70 −20 °C | 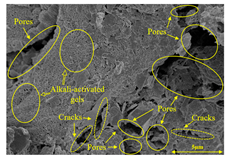 | 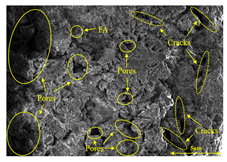 | 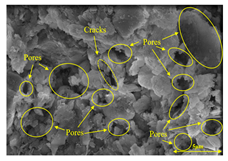 |
 |  |  |
Disclaimer/Publisher’s Note: The statements, opinions and data contained in all publications are solely those of the individual author(s) and contributor(s) and not of MDPI and/or the editor(s). MDPI and/or the editor(s) disclaim responsibility for any injury to people or property resulting from any ideas, methods, instructions or products referred to in the content. |
© 2025 by the authors. Licensee MDPI, Basel, Switzerland. This article is an open access article distributed under the terms and conditions of the Creative Commons Attribution (CC BY) license (https://creativecommons.org/licenses/by/4.0/).
Share and Cite
Liu, L.; Yuan, M.; Zheng, X.; Wu, J. One-Part Alkali-Activated Slag/Fly Ash for Soft Soil Stabilization: Freeze-Thaw Durability Assessment and Mechanism Elucidation. Buildings 2025, 15, 2386. https://doi.org/10.3390/buildings15142386
Liu L, Yuan M, Zheng X, Wu J. One-Part Alkali-Activated Slag/Fly Ash for Soft Soil Stabilization: Freeze-Thaw Durability Assessment and Mechanism Elucidation. Buildings. 2025; 15(14):2386. https://doi.org/10.3390/buildings15142386
Chicago/Turabian StyleLiu, Li, Mengjie Yuan, Xiyao Zheng, and Jun Wu. 2025. "One-Part Alkali-Activated Slag/Fly Ash for Soft Soil Stabilization: Freeze-Thaw Durability Assessment and Mechanism Elucidation" Buildings 15, no. 14: 2386. https://doi.org/10.3390/buildings15142386
APA StyleLiu, L., Yuan, M., Zheng, X., & Wu, J. (2025). One-Part Alkali-Activated Slag/Fly Ash for Soft Soil Stabilization: Freeze-Thaw Durability Assessment and Mechanism Elucidation. Buildings, 15(14), 2386. https://doi.org/10.3390/buildings15142386