Article

Seismic Damage Mechanism of Five-Story and Three-Span Underground Complex in Soft Soil Site

Department of Disaster Mitigation for Structures, Tongji University, Shanghai 200092, China
*
Author to whom correspondence should be addressed.
Buildings 2025, 15(14), 2380; https://doi.org/10.3390/buildings15142380
Submission received: 4 June 2025 / Revised: 1 July 2025 / Accepted: 3 July 2025 / Published: 8 July 2025
(This article belongs to the Section Building Structures)

Abstract

Investigating the seismic damage mechanism of large underground complexes is essential for the safe development of urban underground space. This paper examines a five-story and three-span underground complex situated in a soft soil site. Shaking table tests were designed and conducted on both the free field and the soil–underground complex interaction system. The time–frequency evolution of the free field under various seismic motions was investigated. A combined experimental and numerical simulation approach was employed to examine the seismic response of the soil–underground complex interaction system. The structural deformation evolution, stress distribution, and development process of plastic damage under different seismic motions were analyzed. The results reveal that soft soil exhibits a significant energy amplification effect under far-field long-period ground motions. Structural deformation is mainly governed by horizontal shear. Under strong seismic excitation, plastic damage first initiates at the end of the bottom-story columns and extends to column-to-slab and wall-to-slab connections, where abrupt stiffness changes occur. Under the far-field long-period ground motion, the structural deformation, stress distribution, and plastic damage are significantly greater than those under the Shanghai artificial wave. These findings provide valuable insights for the seismic design of large underground complexes in soft soil sites.

1. Introduction

With rapid economic development, traditional monofunctional public buildings in urban areas are gradually developing towards multifunctional and integrated complexes. Underground complexes incorporate functions such as subway transit, commercial activities, parking, and municipal services, thereby promoting more intensive and efficient use of urban underground space [1,2,3]. It is generally believed that underground structures exhibit better seismic performance compared to aboveground structures. However, the collapse of the Daikai subway station during the 1995 Kobe earthquake [4], along with subsequent reports of underground structure damage in recent domestic and international earthquakes [5,6,7], has drawn scholars’ attention to the seismic performance of underground structures [8,9,10,11]. As an integral component of the urban underground space system, damage to an underground complex can be difficult and time-consuming to repair, significantly impairing urban functionality and resulting in substantial economic losses. Therefore, it is crucial to investigate the seismic damage mechanisms of underground complexes.
At present, research on the seismic performance of large underground complexes remains at a preliminary stage. Existing studies primarily focus on subway stations with single functions and simple configurations, exemplified by the Daikai station damaged in the 1995 Kobe earthquake. According to existing studies on the seismic damage mechanisms of subway stations, structural failure is primarily initiated by the collapse of central columns [4,12,13,14]. This explanation is attributed to insufficient shear and bending capacity of the central columns [15,16,17], as well as their limited horizontal deformation capacity [18,19,20]. In addition, some researchers have suggested that inadequate deformation capacity of structural slabs and walls may also be a major cause of damage in underground stations [21,22]. Regarding seismic motions, some studies argue that the horizontal ground motion is the primary factor responsible for the damage to subway stations [18,19]. Others contend that the combined action of horizontal and vertical ground motions plays a dominant role in inducing such damage [15,20]. They further suggest that vertical seismic motion significantly increases axial force in the columns, thereby reducing their horizontal deformation capacity and ultimately contributing to failure under horizontal loading. According to previous studies, no consensus has been achieved on the understanding of the seismic damage mechanism of underground structures.
To investigate the seismic damage mechanisms of underground complexes, a five-story and three-span underground complex located in a soft soil site was taken as the background. This paper designs and conducts systematic shaking table tests on both the free field and the soil–underground complex interaction system. Three ground motions were selected as seismic excitations, including the Shanghai artificial wave SHW, the common record El Centro, and the far-field long-period record HKD095. The soft soil responses were evaluated based on acceleration magnification factor (AMF), response spectrum evolution, and time–frequency evolution derived from the shaking table test result. By integrating shaking table tests with numerical simulations, the seismic response characteristics of the soil–underground complex interaction system are further examined. The structural deformation evolution, stress distribution, and development process of plastic damage under different seismic motions are analyzed, revealing the potential seismic damage mechanisms of the underground complex in soft soil sites. This paper provides a reference for the seismic design of similar large-scale underground complex structures.

2. Experimental Investigation

This paper takes a five-story and three-span underground complex situated in a soft soil site as the basis for the shaking table model test and analytical investigation. The underground complex integrates a subway station, an underground commercial street, and an underground parking garage, representing a typical urban underground complex designed to provide transportation linkage and transfer services. Considering the feasibility of the model test and analysis, this paper focuses on the main structure for analysis.

2.1. Facility and Scaling Laws

The tests were conducted in the shaking table laboratory of Shanghai Jiao Tong University (SJTU), China. The shaking table measured 2 m × 2 m and had maximum load, acceleration, and displacement capacities of 5 t, 1.5 g, and ±125 mm, respectively. A rectangular laminar shear box was used to simulate soil deformation [23], with internal dimensions of 1.6 m × 1.2 m × 1.15 m. Horizontal seismic excitation was applied at the base of the container by a shaker, simulating bedrock input. The similarity design of the model soil and the model structure was jointly designed to ensure that their similarity ratios were as consistent as possible. The gravity distortion model, which is commonly used in soil–structure interaction studies [24,25], was employed to determine the similarity ratios of the soil–structure interaction system. Table 1 summarizes the key similarity ratios in the main physical parameters between the model and the prototype structure. The model soil used in the test was prepared through artificial synthesis. Its similarity ratios of length and acceleration were kept identical to those of the model structure, while the similarity ratios of density and shear modulus were designed to satisfy the following relational expression:
S G / S l × S ρ = S a
where S l , S ρ , S G , and S a are the similarity ratios of length, density, shear modulus, and acceleration, respectively.

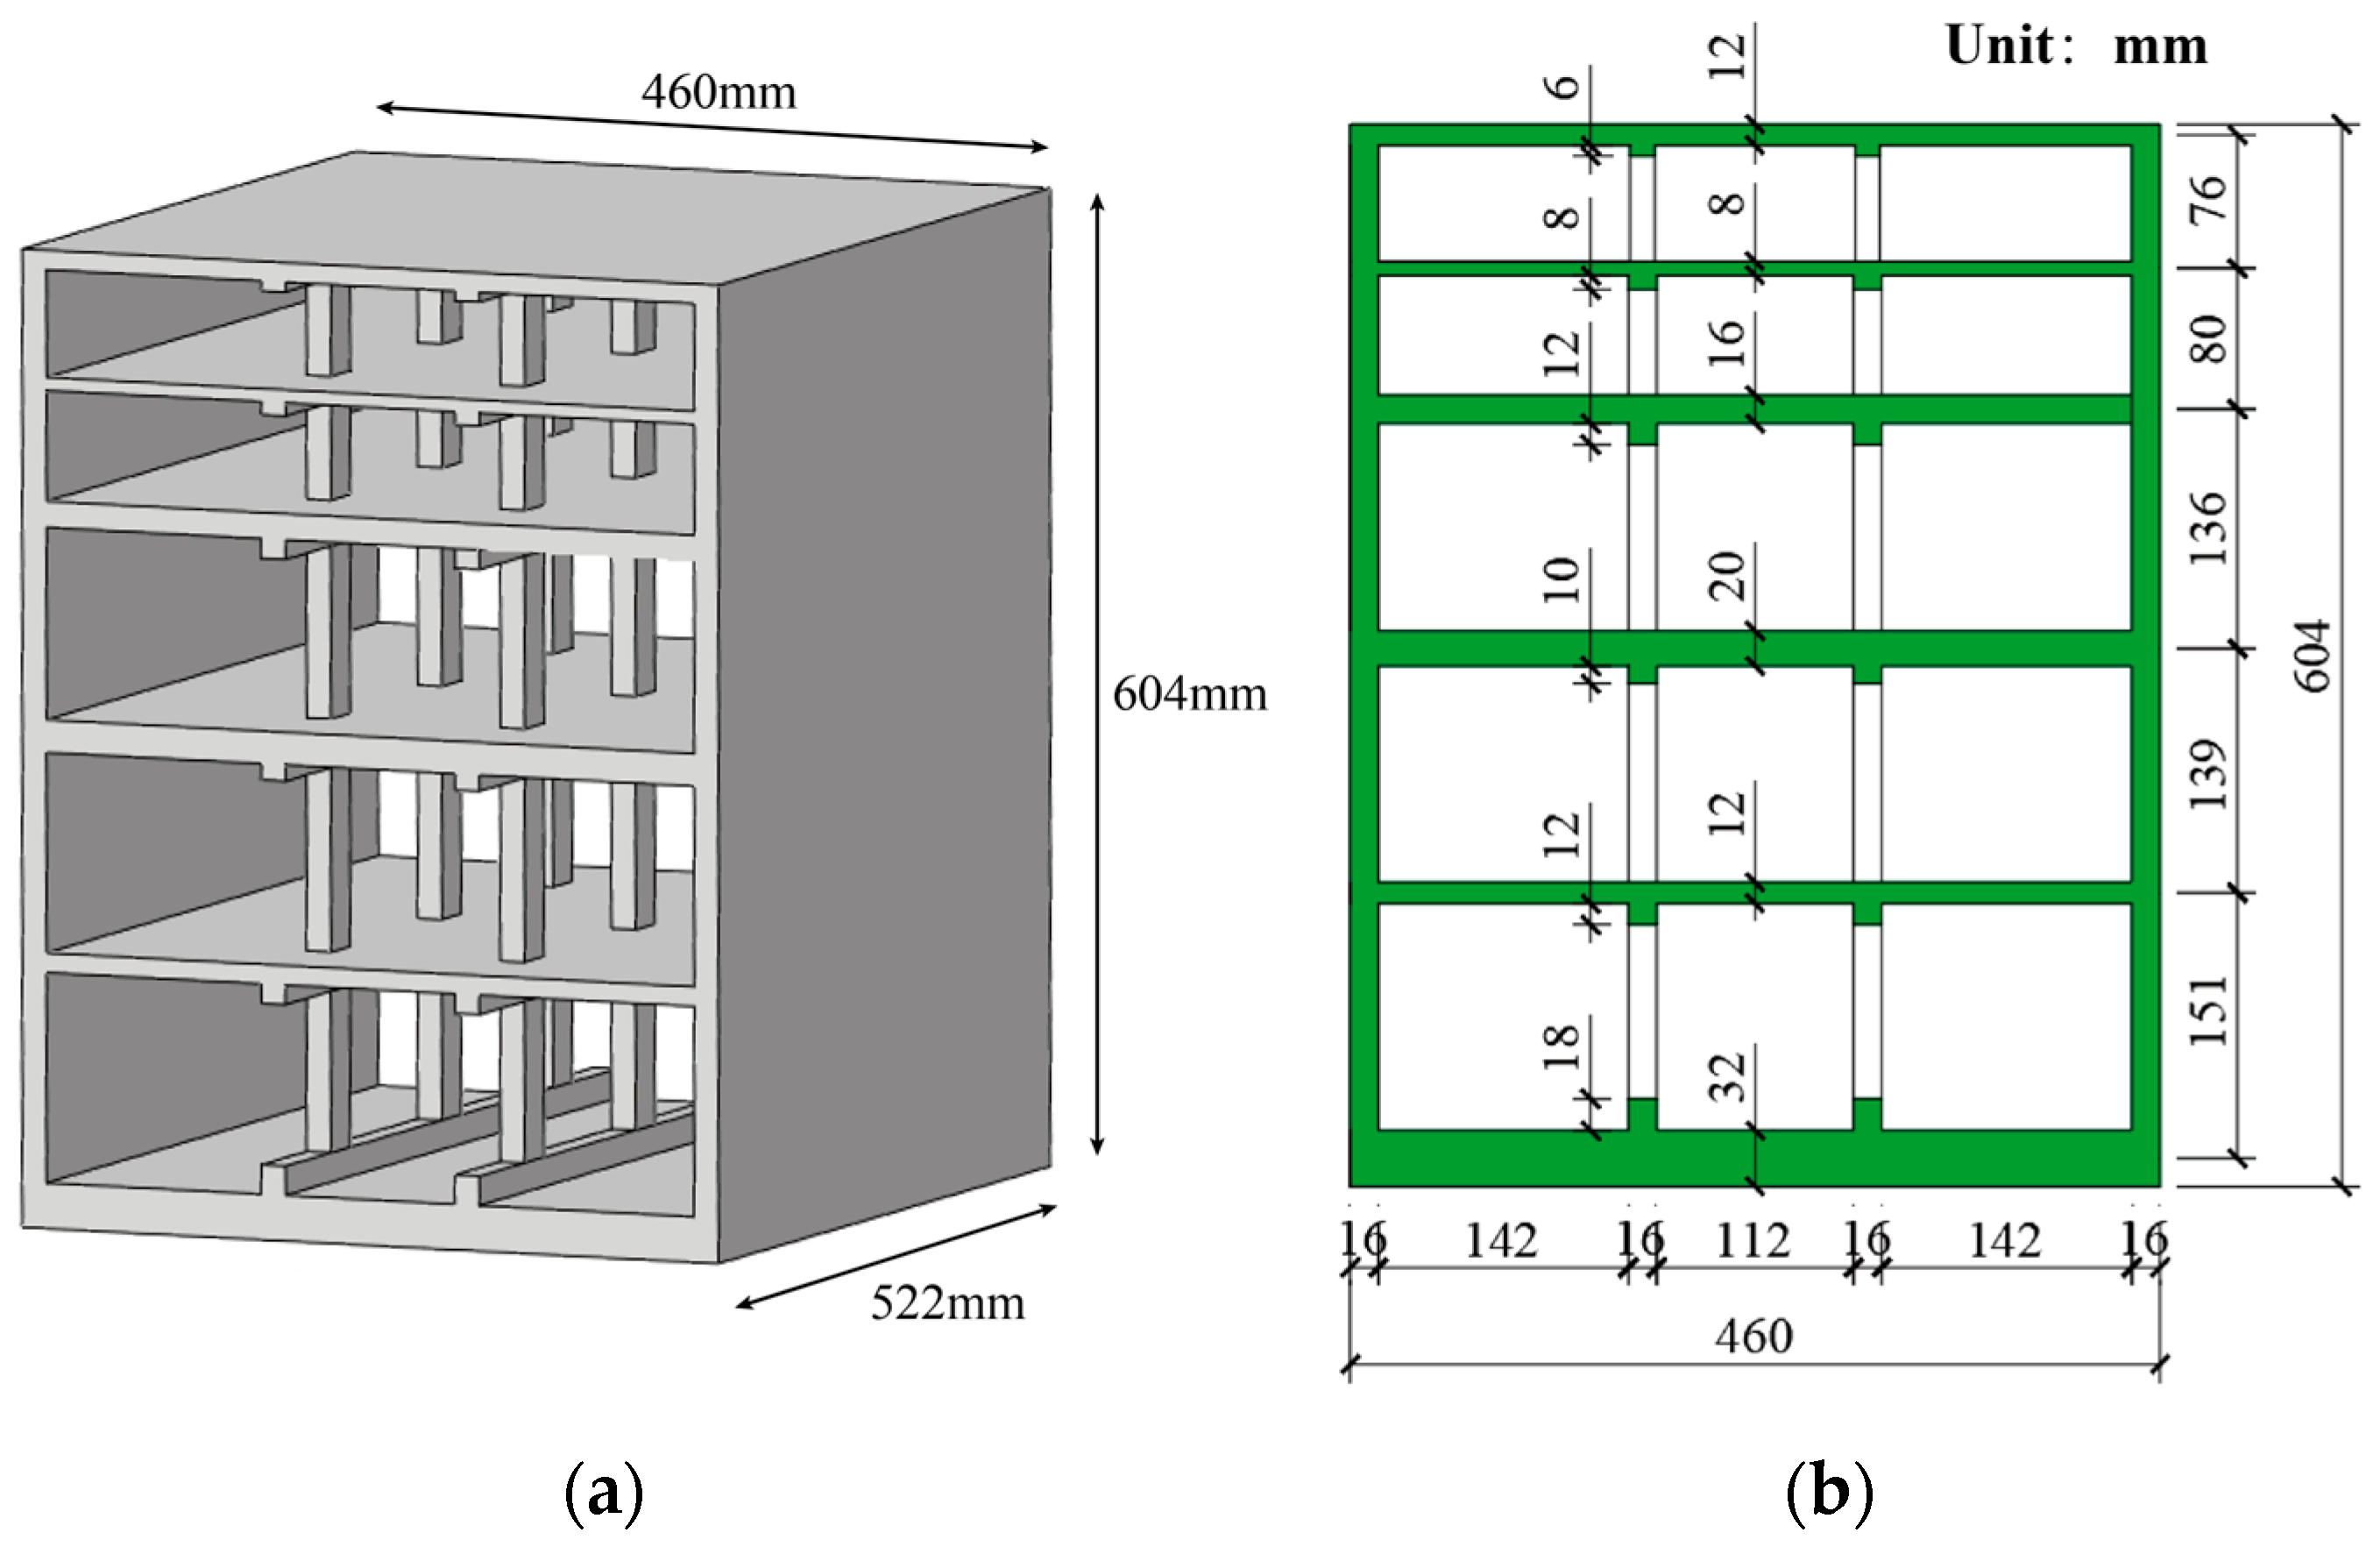
2.2. Model Soil and Model Structure

The use of sawdust mixed with medium sand is a common approach for preparing model soil [26,27]. To simulate the typical soft soil conditions, this paper adopts a 1:2.5 mass ratio of sawdust and medium sand for the shaking table model. The model soil has a density of approximately 700 kg/m3 and a shear modulus of about 2.8 MPa. Its G / G max γ curves and ξ γ curves show good agreement with those of the prototype soil. Here, G , G max , ξ , and γ represent the dynamic shear modulus, maximum shear modulus, damping ratio, and shear strain of the soil, respectively. A series of cyclic dynamic triaxial tests were conducted to characterize the dynamic properties of the model soil [28]. The curves of the dynamic shear modulus and damping ratio with respect to shear strain are shown in Figure 1.
A five-story and three-span underground complex from an engineering project was taken as the prototype for the model design. The model structure has a height of 604 mm, a width of 460 mm, and a length of 522 mm. It was fabricated from organic glass. To satisfy the density similarity requirement, a total of 177.08 kg of additional mass was uniformly distributed among all stories. The model structure is illustrated in Figure 2.

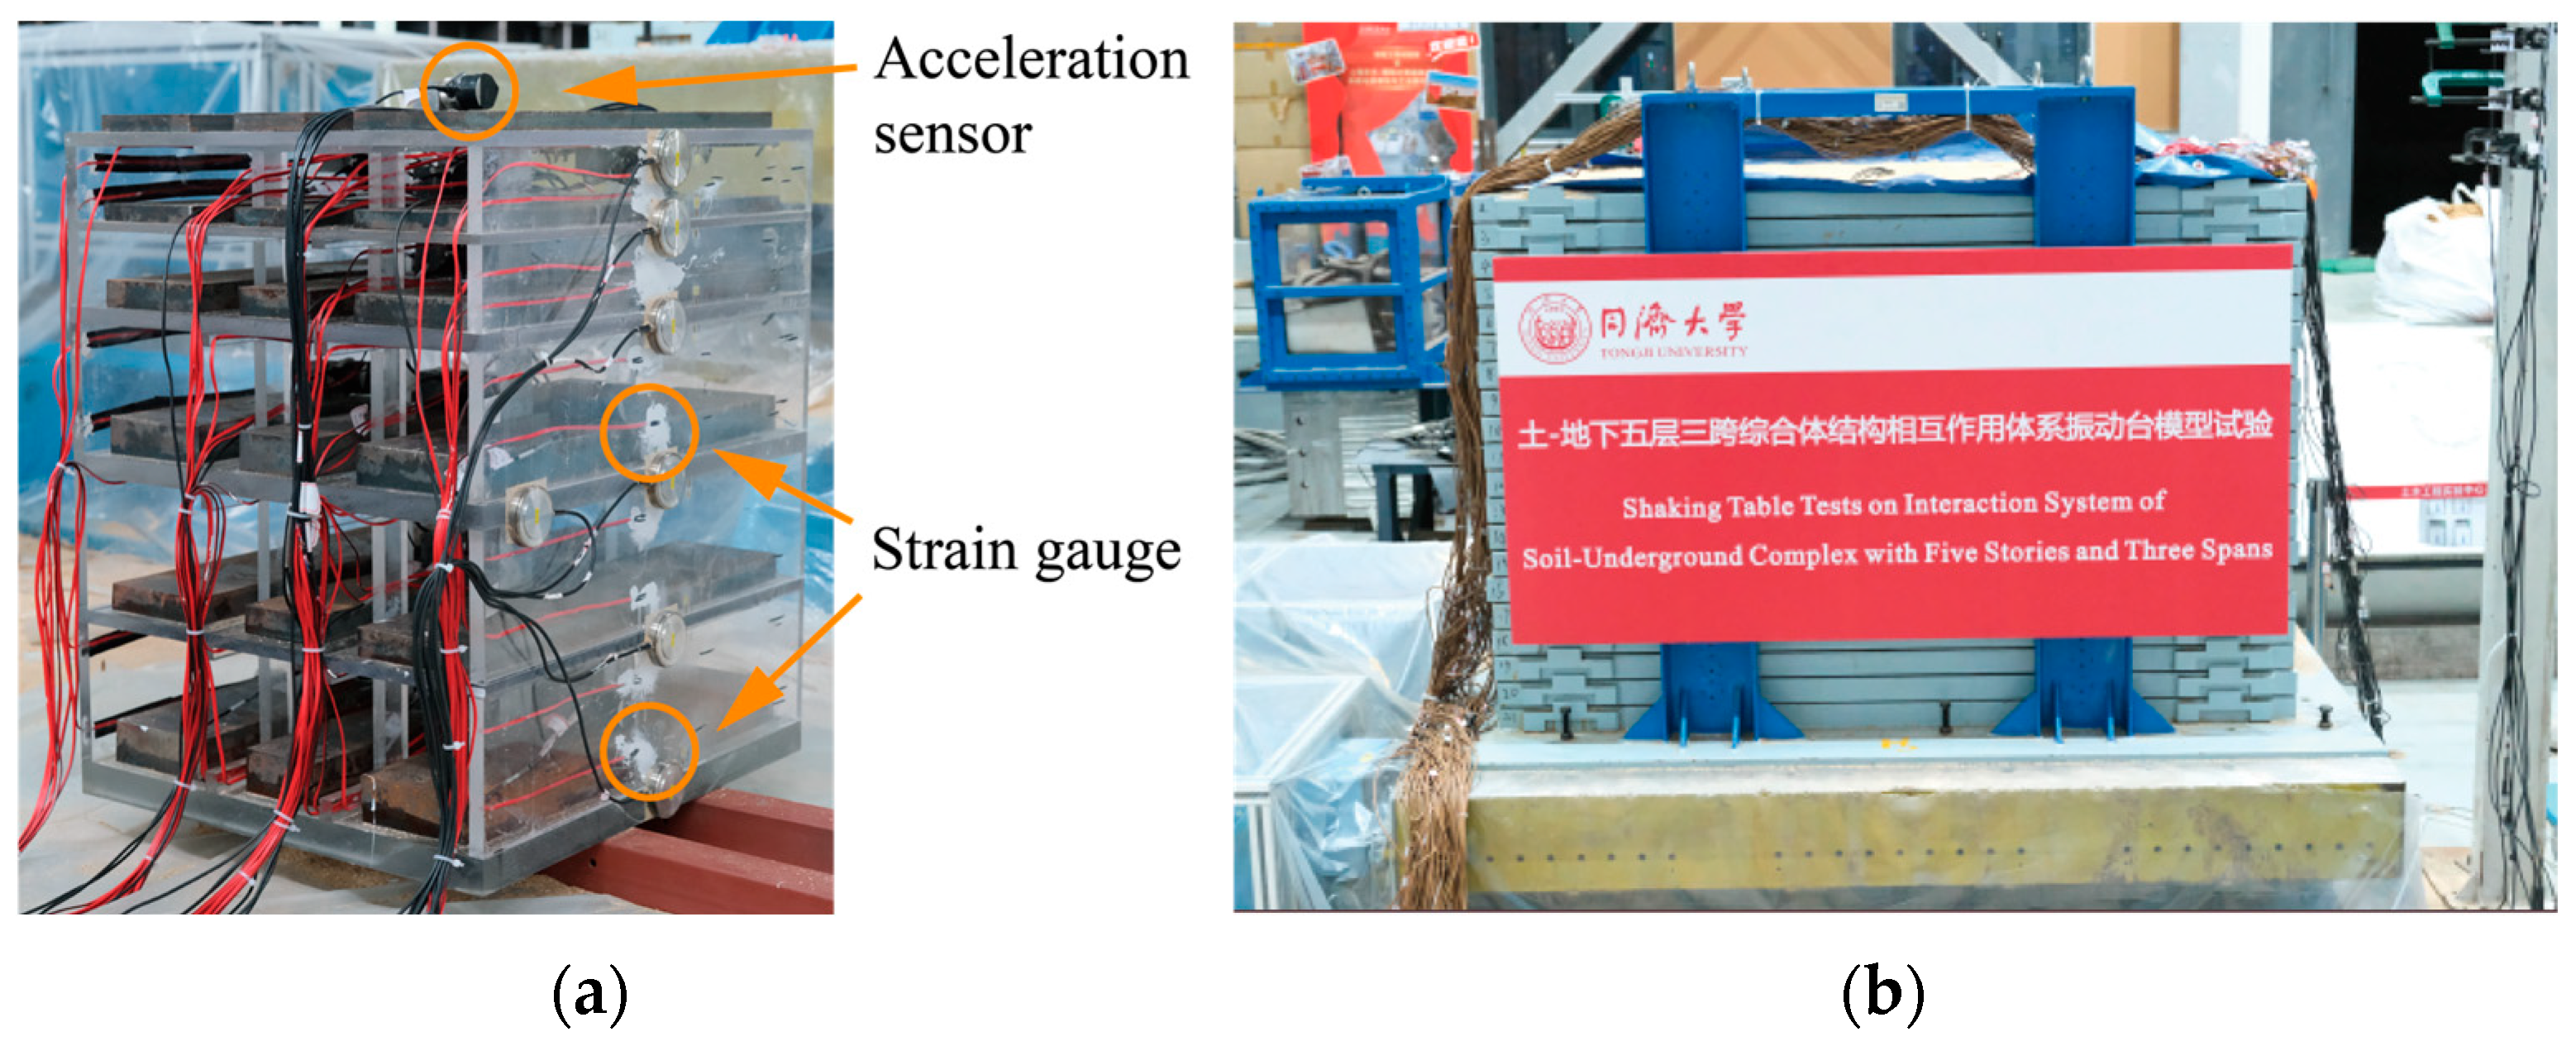
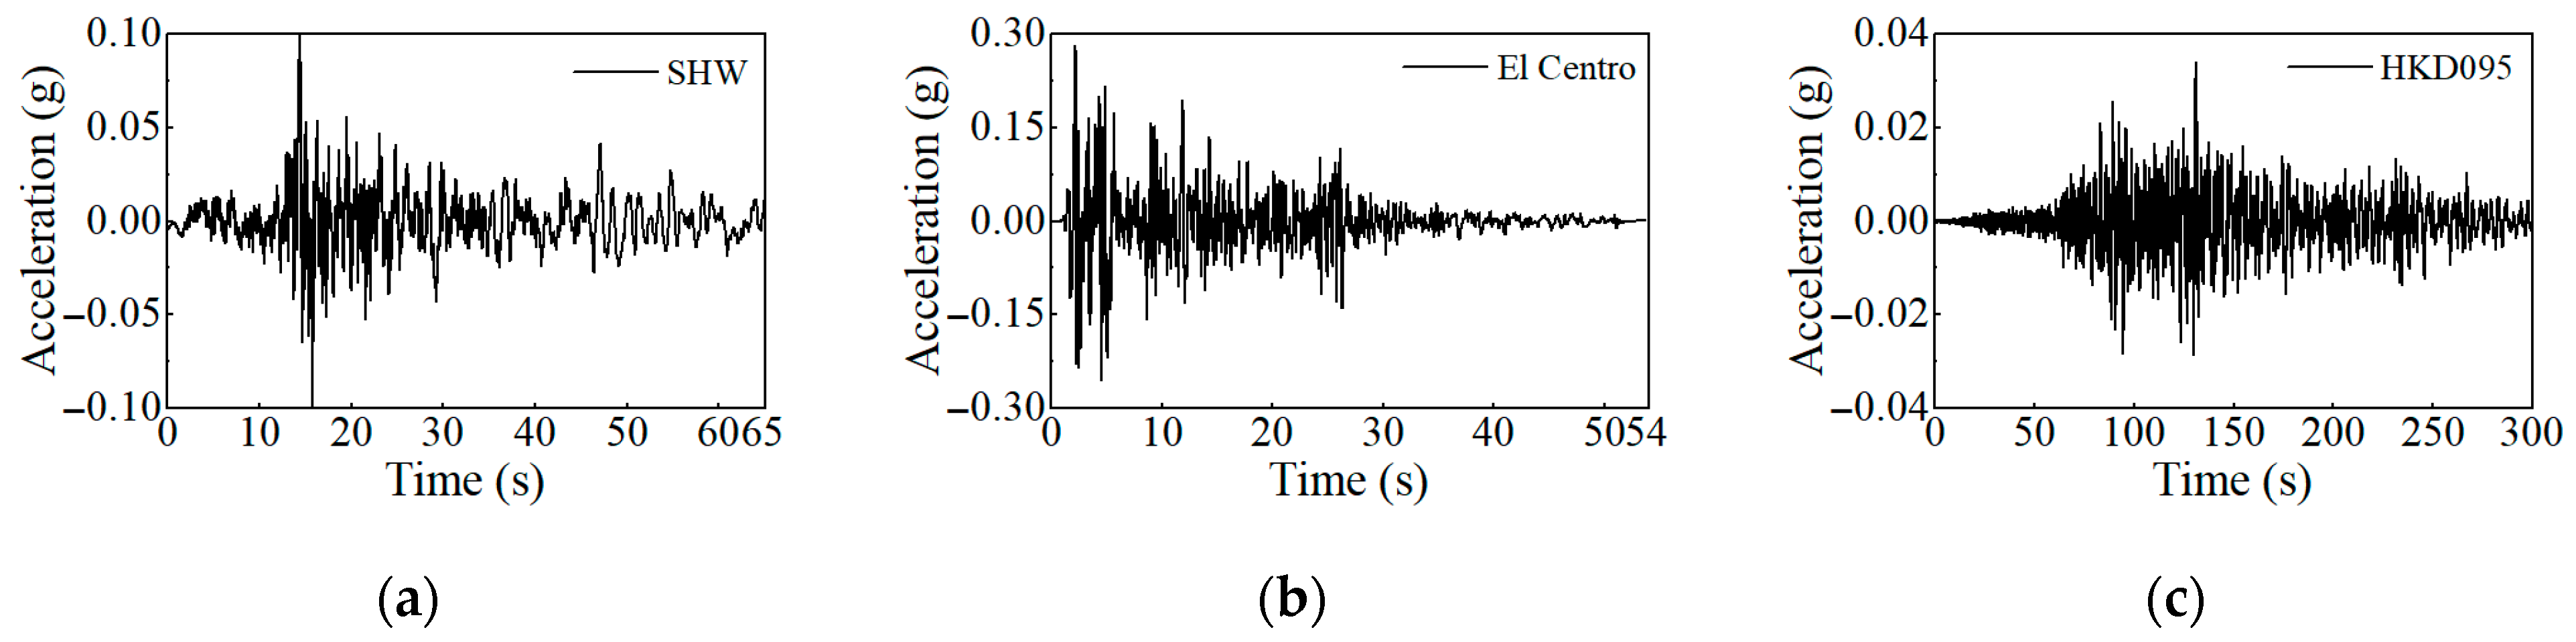
2.3. Sensor Scheme and Loading Cases

In this paper, two shaking table model tests were conducted: one for the free field and the other for the soil–underground complex interaction system. The observation plane was located at the mid-section between the soil and the model structure. The model configuration and sensor layout are shown in Figure 3. Accelerometers A0, AS1–AS8, and AU1–AU6 were installed on the shaking table, within the model soil, and inside the model structure, respectively. Strain gauges SC1–SC5 and SW1–SW5 were affixed to the bottom of the columns and walls of the model structure. In Figure 3b, VL1 and VL2 denote vertical reference lines where accelerometers were placed. By comparing acceleration recordings at corresponding depths along these lines, the influence of soil on the seismic response of the model structure can be assessed. The experimental configuration for the soil–underground complex interaction system is illustrated in Figure 4.
In selecting seismic motions, this paper first considers the seismic environment of the site of the underground complex, including the potential threat of far-field long-period strong ground motion. In addition, this paper aims to investigate the differences in the site seismic response under an artificial seismic motion compared to the common record El Centro. Therefore, in the free-field seismic response shaking table model test, the Shanghai artificial wave SHW [29], the widely used record El Centro, and the far-field long-period record HKD095 were selected as input motions. The acceleration time histories of these three seismic motions are shown in Figure 5, and their Fourier amplitude spectra and response spectra are presented in Figure 6a,b.
During the test, the seismic motions for the shaking table were processed as follows: the original ground motion records were scaled according to the time similarity ratio and adjusted to peak ground accelerations (PGAs) of 0.2 g, 0.3 g, and 0.4 g. The seismic motions were applied in a single horizontal direction, parallel to the laminar shear deformation direction of the soil container. White noise excitation was conducted before the test and after each PGA level to monitor changes in the dynamic characteristics of the system. The test loading conditions are summarized in Table 2.
Before the formal test, the boundary effects of the soil container and the reasonableness of the experimental setup were verified. SHW4, EL4, HKD4, and white noise were selected as test conditions. The boundary effect indices for measurement points AS5 and AS8, relative to AS1, were calculated using the method proposed in Ref. [30]. Under the SHW4, EL4, and HKD4 cases, the boundary effect indices at AS8 were 8.58%, 9.33%, and 4.92%, respectively, all of which are below 10%, indicating a relatively minor boundary effect that meets the required accuracy of the test [30]. Figure 7a presents the acceleration time histories of AS1, AS5, and AS8 in the EL4 case, showing that their waveforms and peak values are highly consistent, confirming that boundary effects can be neglected. Figure 7b compares the transfer function obtained under white noise excitation with the theoretical solution [31], showing good agreement and validating the reasonableness of the shaking table test.

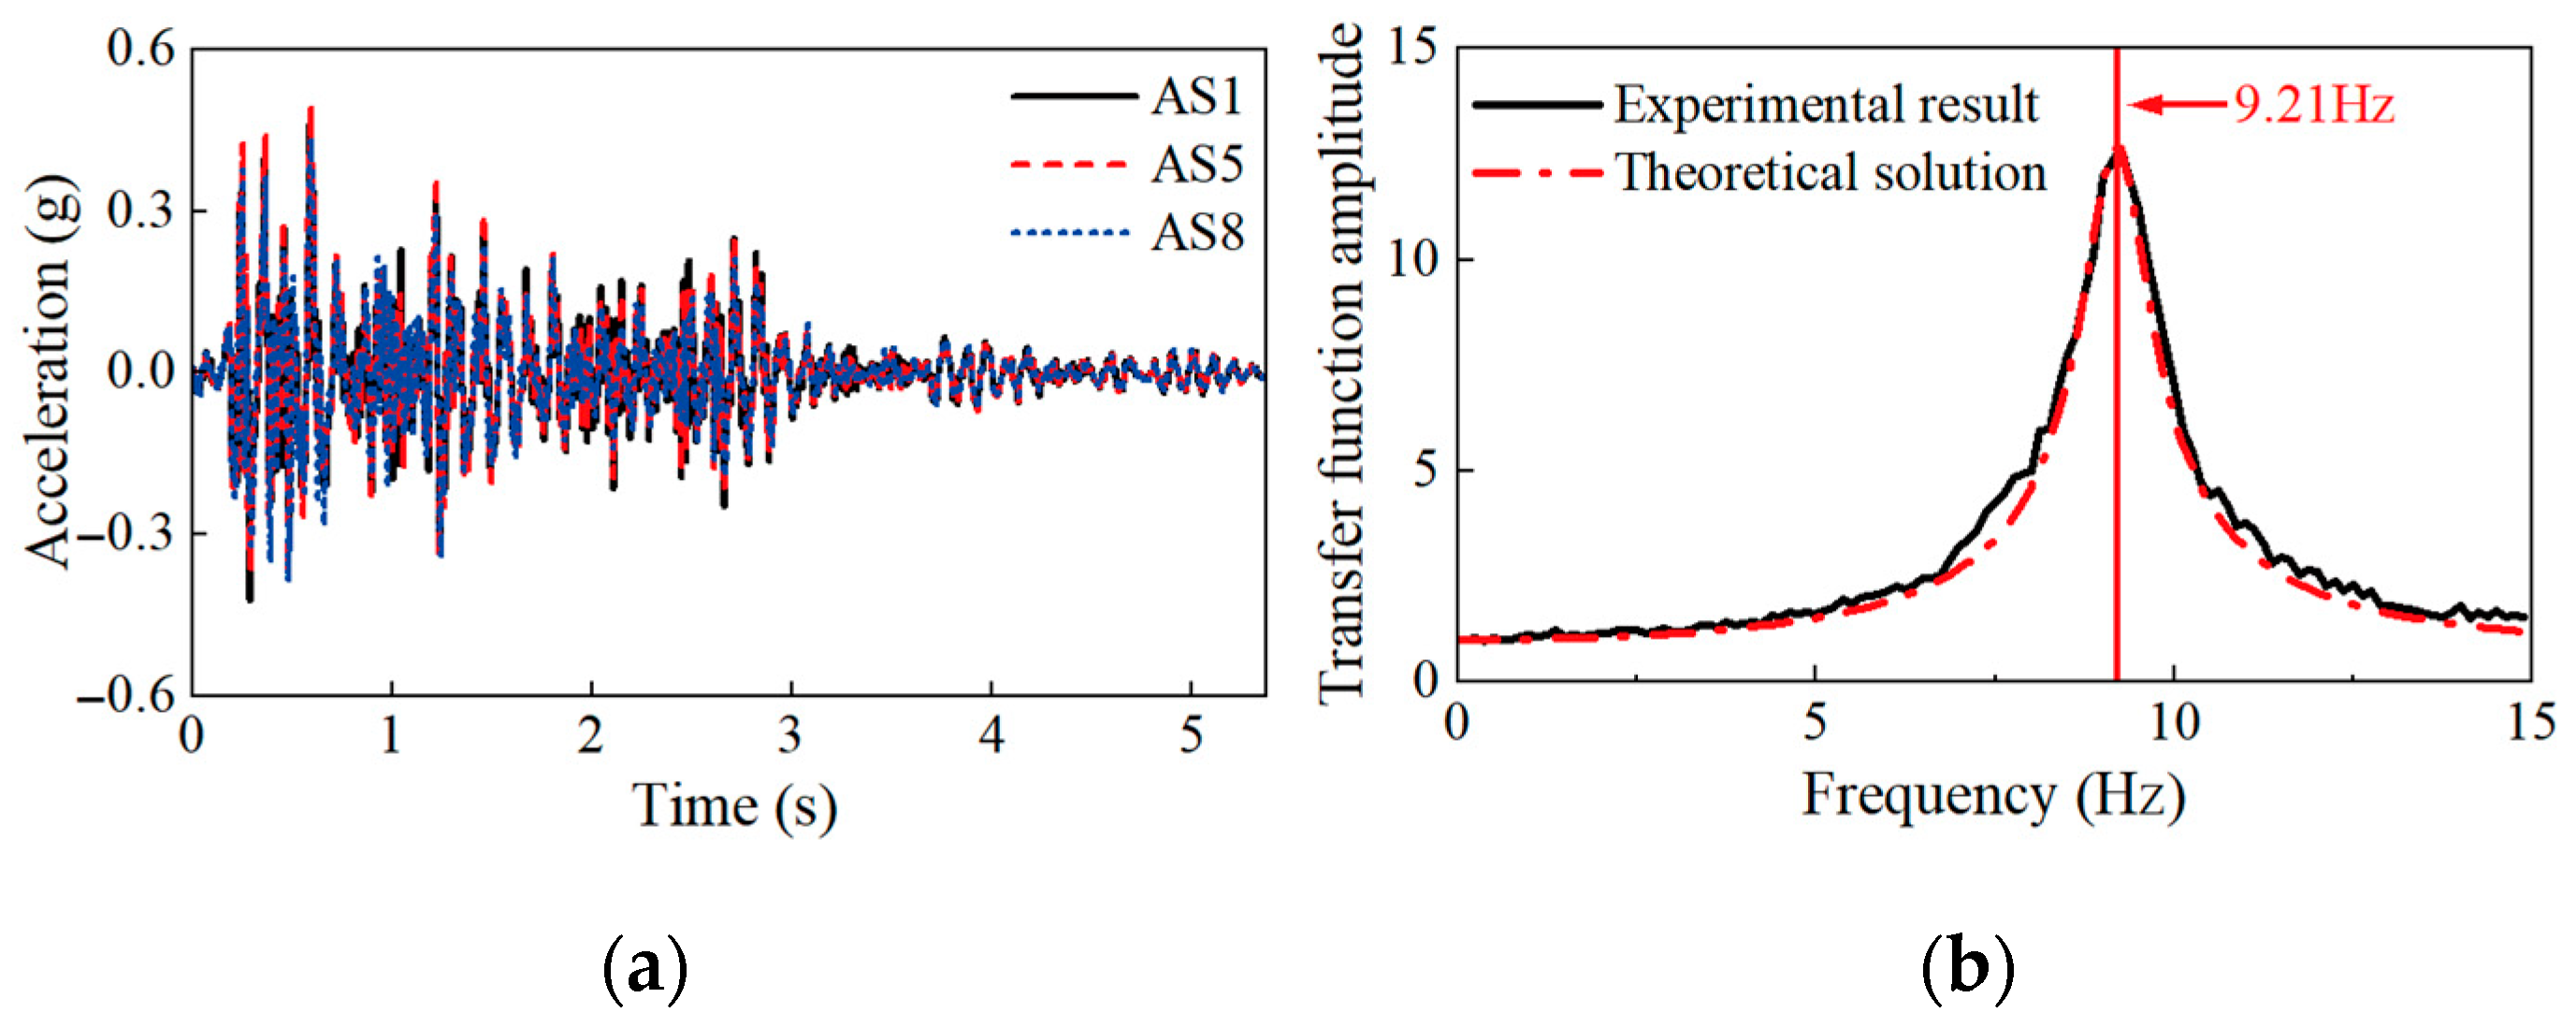
3. Time-Frequency Evolution Analysis of the Free Field Experiments

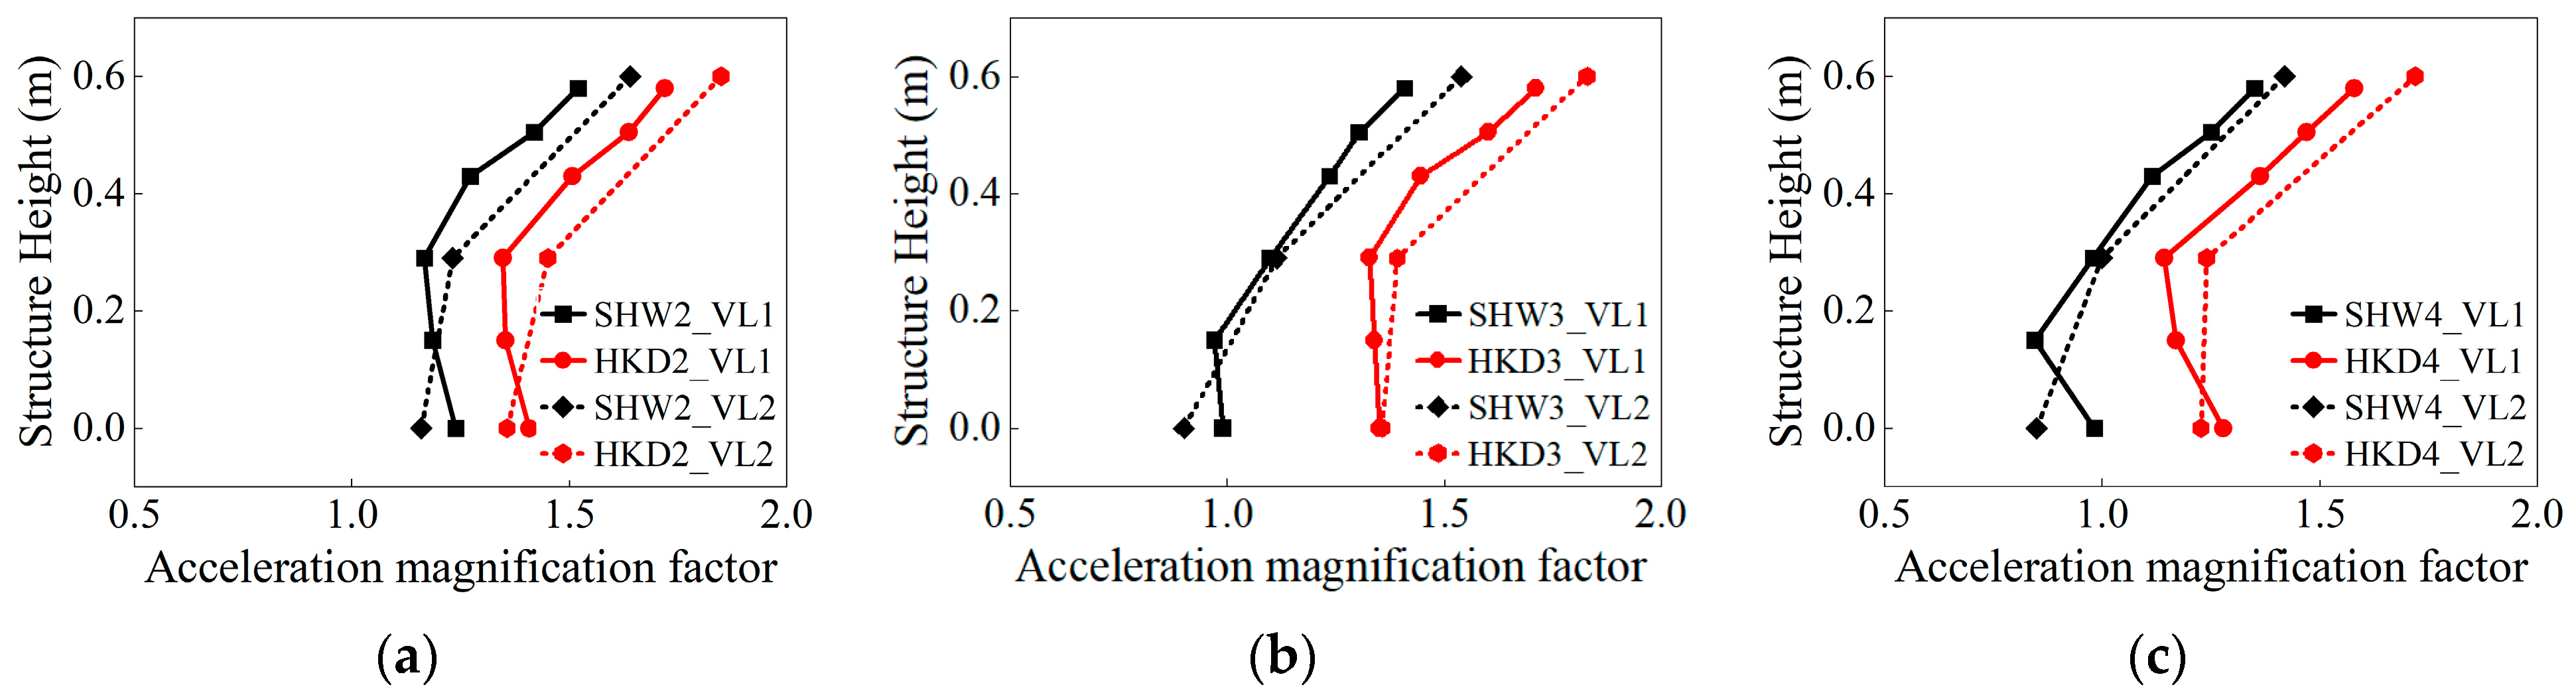
3.1. Acceleration Magnification Factor Analysis

The ratio of peak soil acceleration at each measurement point to the input peak acceleration from the shaking table is defined as the acceleration magnification factor (AMF) [32]. Figure 8 illustrates the trend of AMFs of soil across soil layer height under the three ground motion inputs. In general, the AMFs under the Shanghai artificial wave SHW and El Centro are highly similar, particularly at an input PGA of 0.2 g, where they are essentially identical. The difference between them increases with higher input acceleration levels, with the maximum difference only reaching 9.92%, primarily due to the nonlinear behavior of the soil. Under the far-field long-period ground motion HKD095, the AMF reaches up to 1.59 times that of SHW, indicating a significant deviation. This difference is attributed to the much lower long-period spectral content in SHW compared to HKD095. Additionally, AMFs in soft soil are strongly influenced by the long-period content of seismic motions, resulting in significantly lower site response under SHW compared to far-field long-period seismic motions.

3.2. Response Spectra Evolution Analysis

Figure 9 presents the acceleration response spectra of the three ground motions across soil layer height under an input PGA of 0.4 g. The results show significant amplification of spectral response near the site’s dominant period of approximately 0.11 s as the motions propagate from the base to the surface. At the soil surface, the peak spectral responses of SHW and El Centro are comparable in magnitude, while that of the far-field long-period ground motion HKD095 is significantly higher, reaching 1.26 times the peak value of SHW. This indicates that soft soil sites are particularly sensitive to long-period components of ground motion, which can further amplify spectral responses near the site’s dominant period.

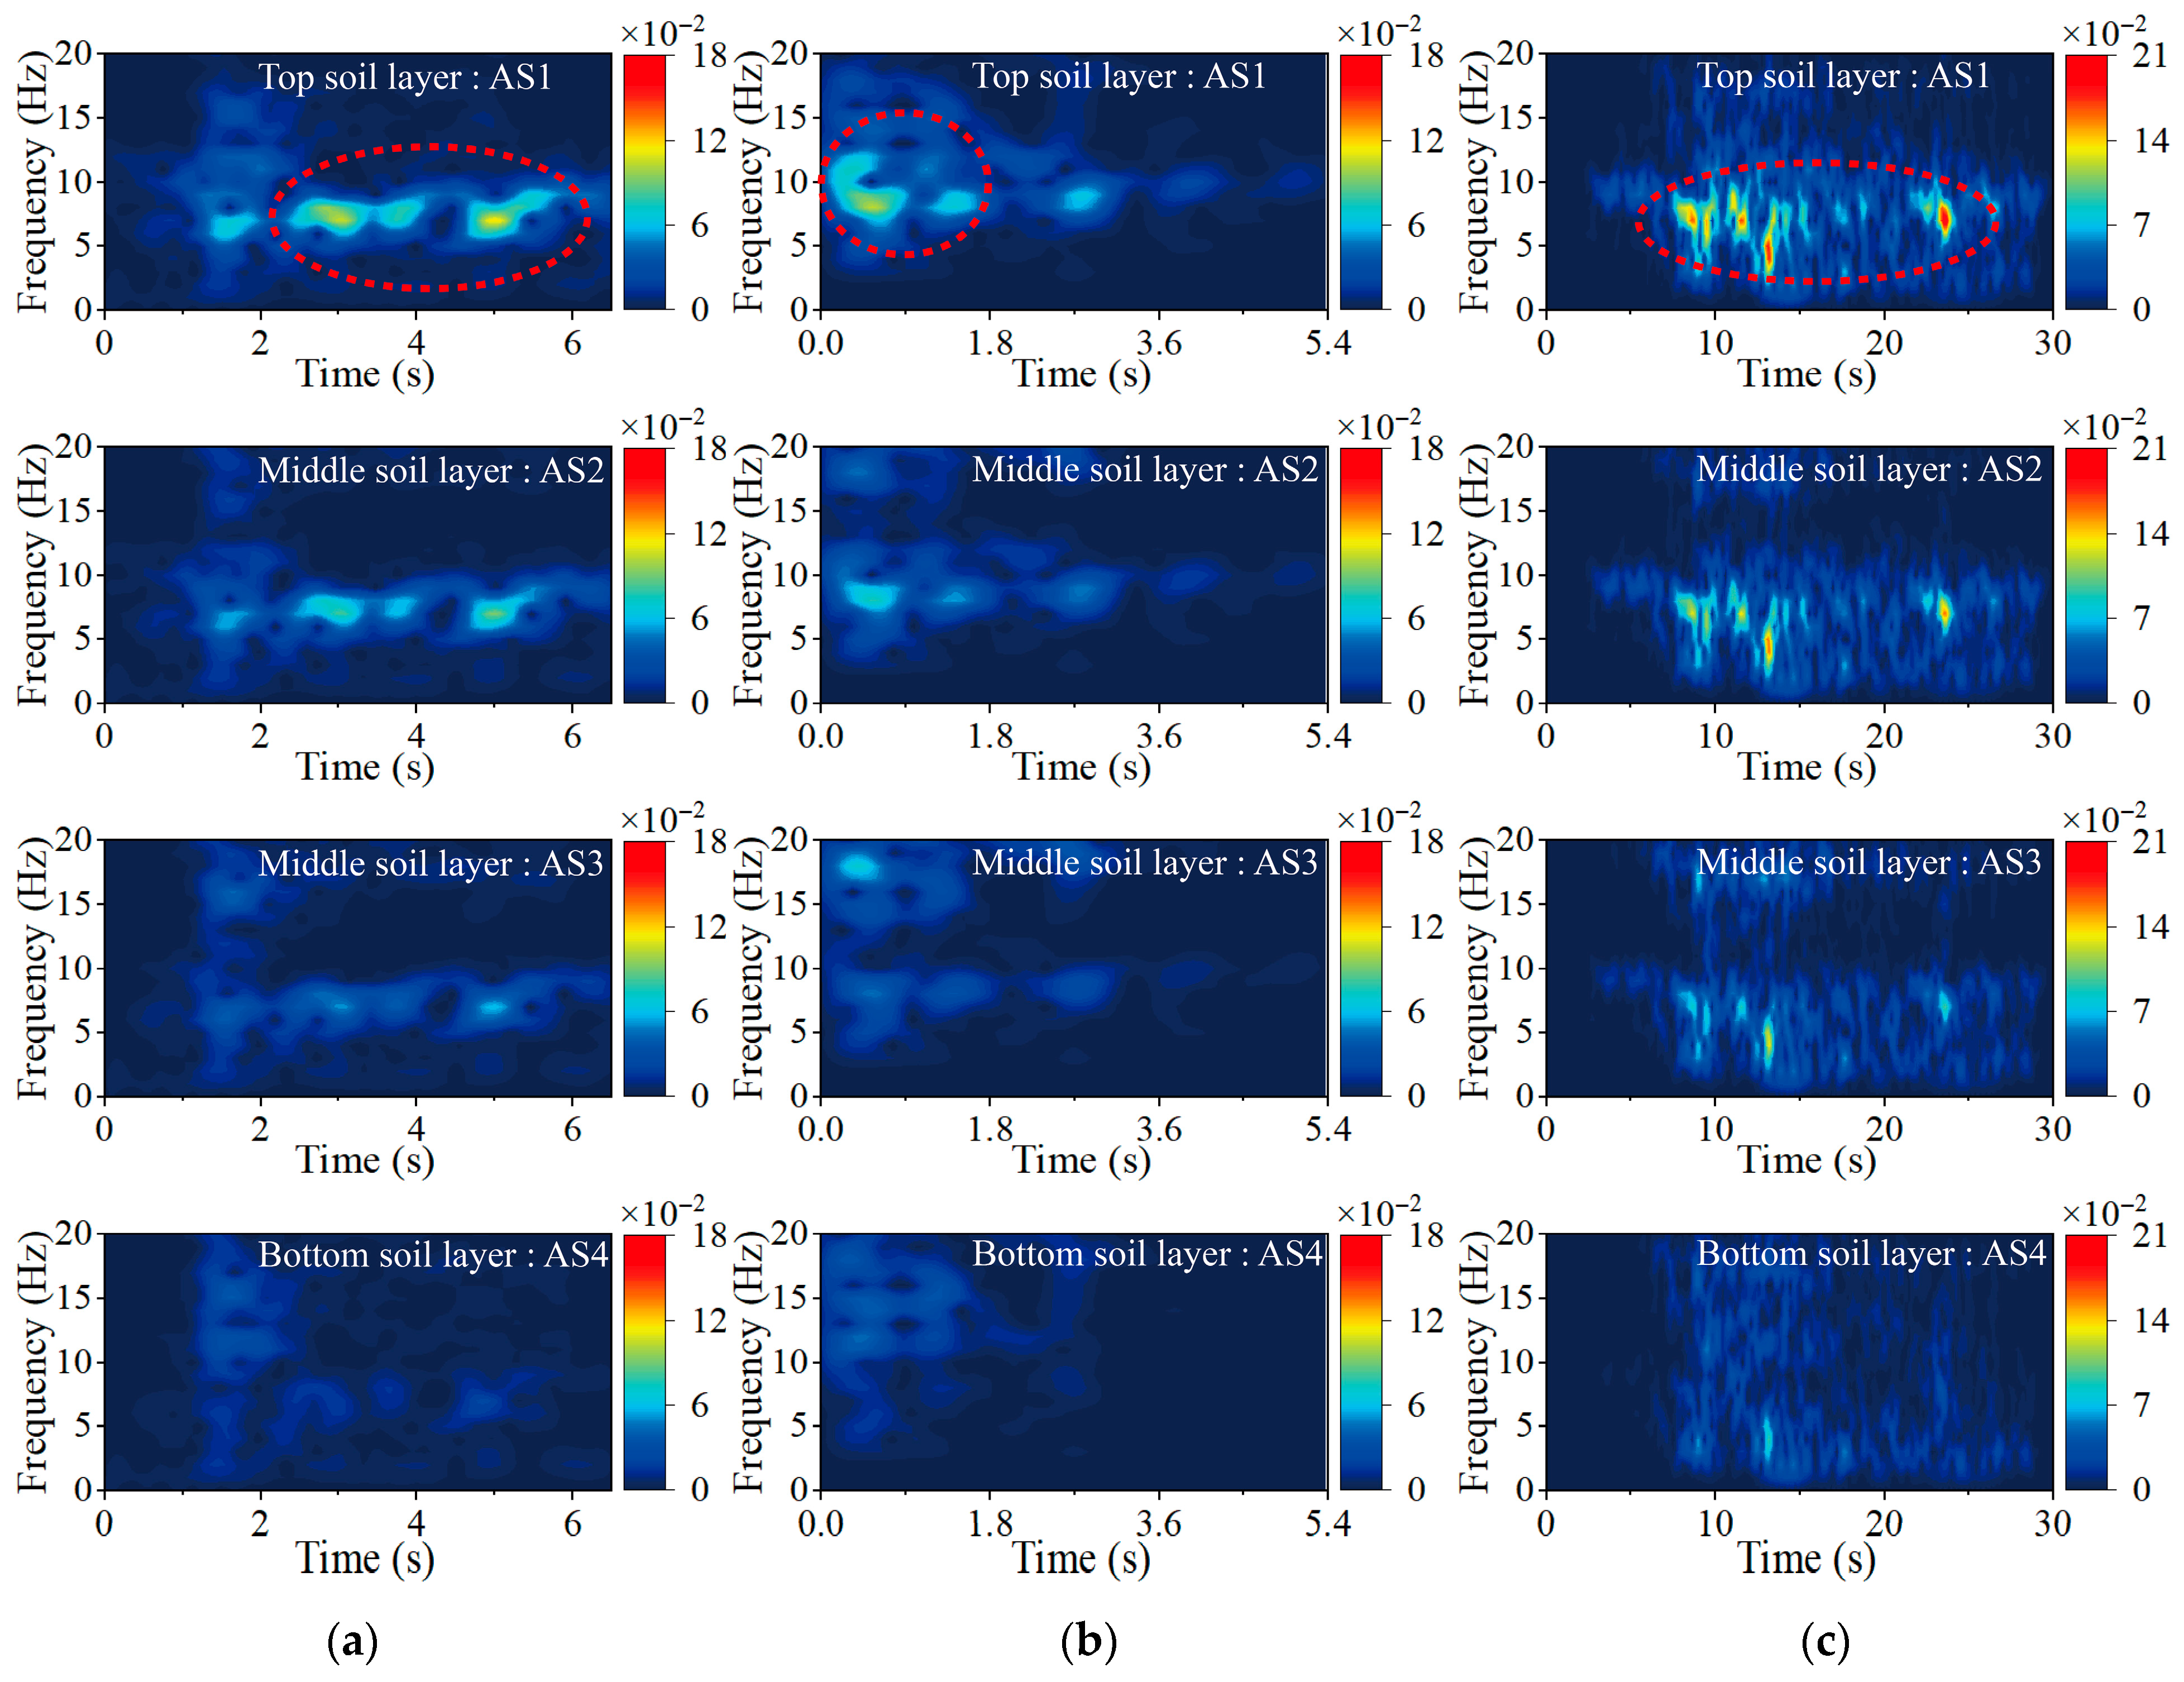
3.3. Time–Frequency Distribution and Evolution Analysis

Figure 10 presents the time–frequency evolution of ground motions during their propagation through soil under an input PGA of 0.4 g. The results show that as depth decreases, the time–frequency spectrum within the 4–10 Hz range exhibits significant amplification, and its peak frequency gradually approaches the site’s dominant frequency, consistent with the trends observed in the acceleration response spectra. Additionally, the peak time–frequency values of SHW and El Centro increase from 0.04 to approximately 0.12 as they propagate from the base to the surface. Both motions exhibit similar propagation trends. In contrast, for the far-field long-period ground motion HKD095, the peak time–frequency values increase from 0.07 to approximately 0.20, with the surface value reaching 1.66 times that of SHW. This indicates that soft soil sites exhibit stronger energy amplification effects under far-field long-period ground motions.

4. Experimental Results and Numerical Model Validation on the Soil–Underground Complex Interaction System

Previous results indicate that the time–frequency evolution of the soft soil site under the Shanghai artificial wave is similar to that under El Centro but differs significantly from that under the far-field long-period ground motion HKD095. The time–frequency energy of HKD095 is significantly higher than that of SHW. Therefore, this section focuses on the difference in response of the model structure under SHW and HKD095.

4.1. Experimental Results

To examine the influence of surrounding soil on the AMF distribution along the height of the model structure, AMFs of both the structure and the soil at corresponding elevations are obtained using vertical reference lines VL1 and VL2, as defined in Figure 3. The results are presented in Figure 11. The AMFs of the structure and soil are generally consistent, except at the base of the structure, where notable differences are observed. This indicates that the seismic response of the model structure is significantly influenced by the surrounding soil, with the overall structural response primarily governed by the soil’s restraining effect. In certain local regions, the kinematic behavior of the model structure may differ from that of the surrounding soil, resulting in local compression or detachment. As the peak input acceleration increases, the nonlinear behavior of the soil becomes more significant, leading to a reduction in the AMFs of the model structure due to increased damping. In addition, under far-field long-period ground motion HKD095, the AMFs of all stories are significantly higher than those under SHW, reaching approximately 1.13 to 1.39 times the SHW values.
Figure 12 presents the distribution of peak strain values at the bottom of columns and walls across all stories of the model structure. The peak strains in the columns and walls gradually increase from the first to the fifth story, due to the cumulative vertical load borne by the lower stories. The peak strains at the bottom of the columns are higher than those at the bottom of the walls, indicating that the columns experience greater stress responses under seismic loading. Under the far-field long-period ground motion HKD095, the strain responses of both the columns and the walls are significantly higher than those under SHW. The difference between the two cases increases with higher input ground motion intensity. At an input ground motion of 0.4 g, the peak strain in the columns under HKD095 is approximately 1.21 to 1.58 times that under SHW, while that in the walls is about 1.04 to 1.49 times higher.

4.2. Numerical Simulation and Validation

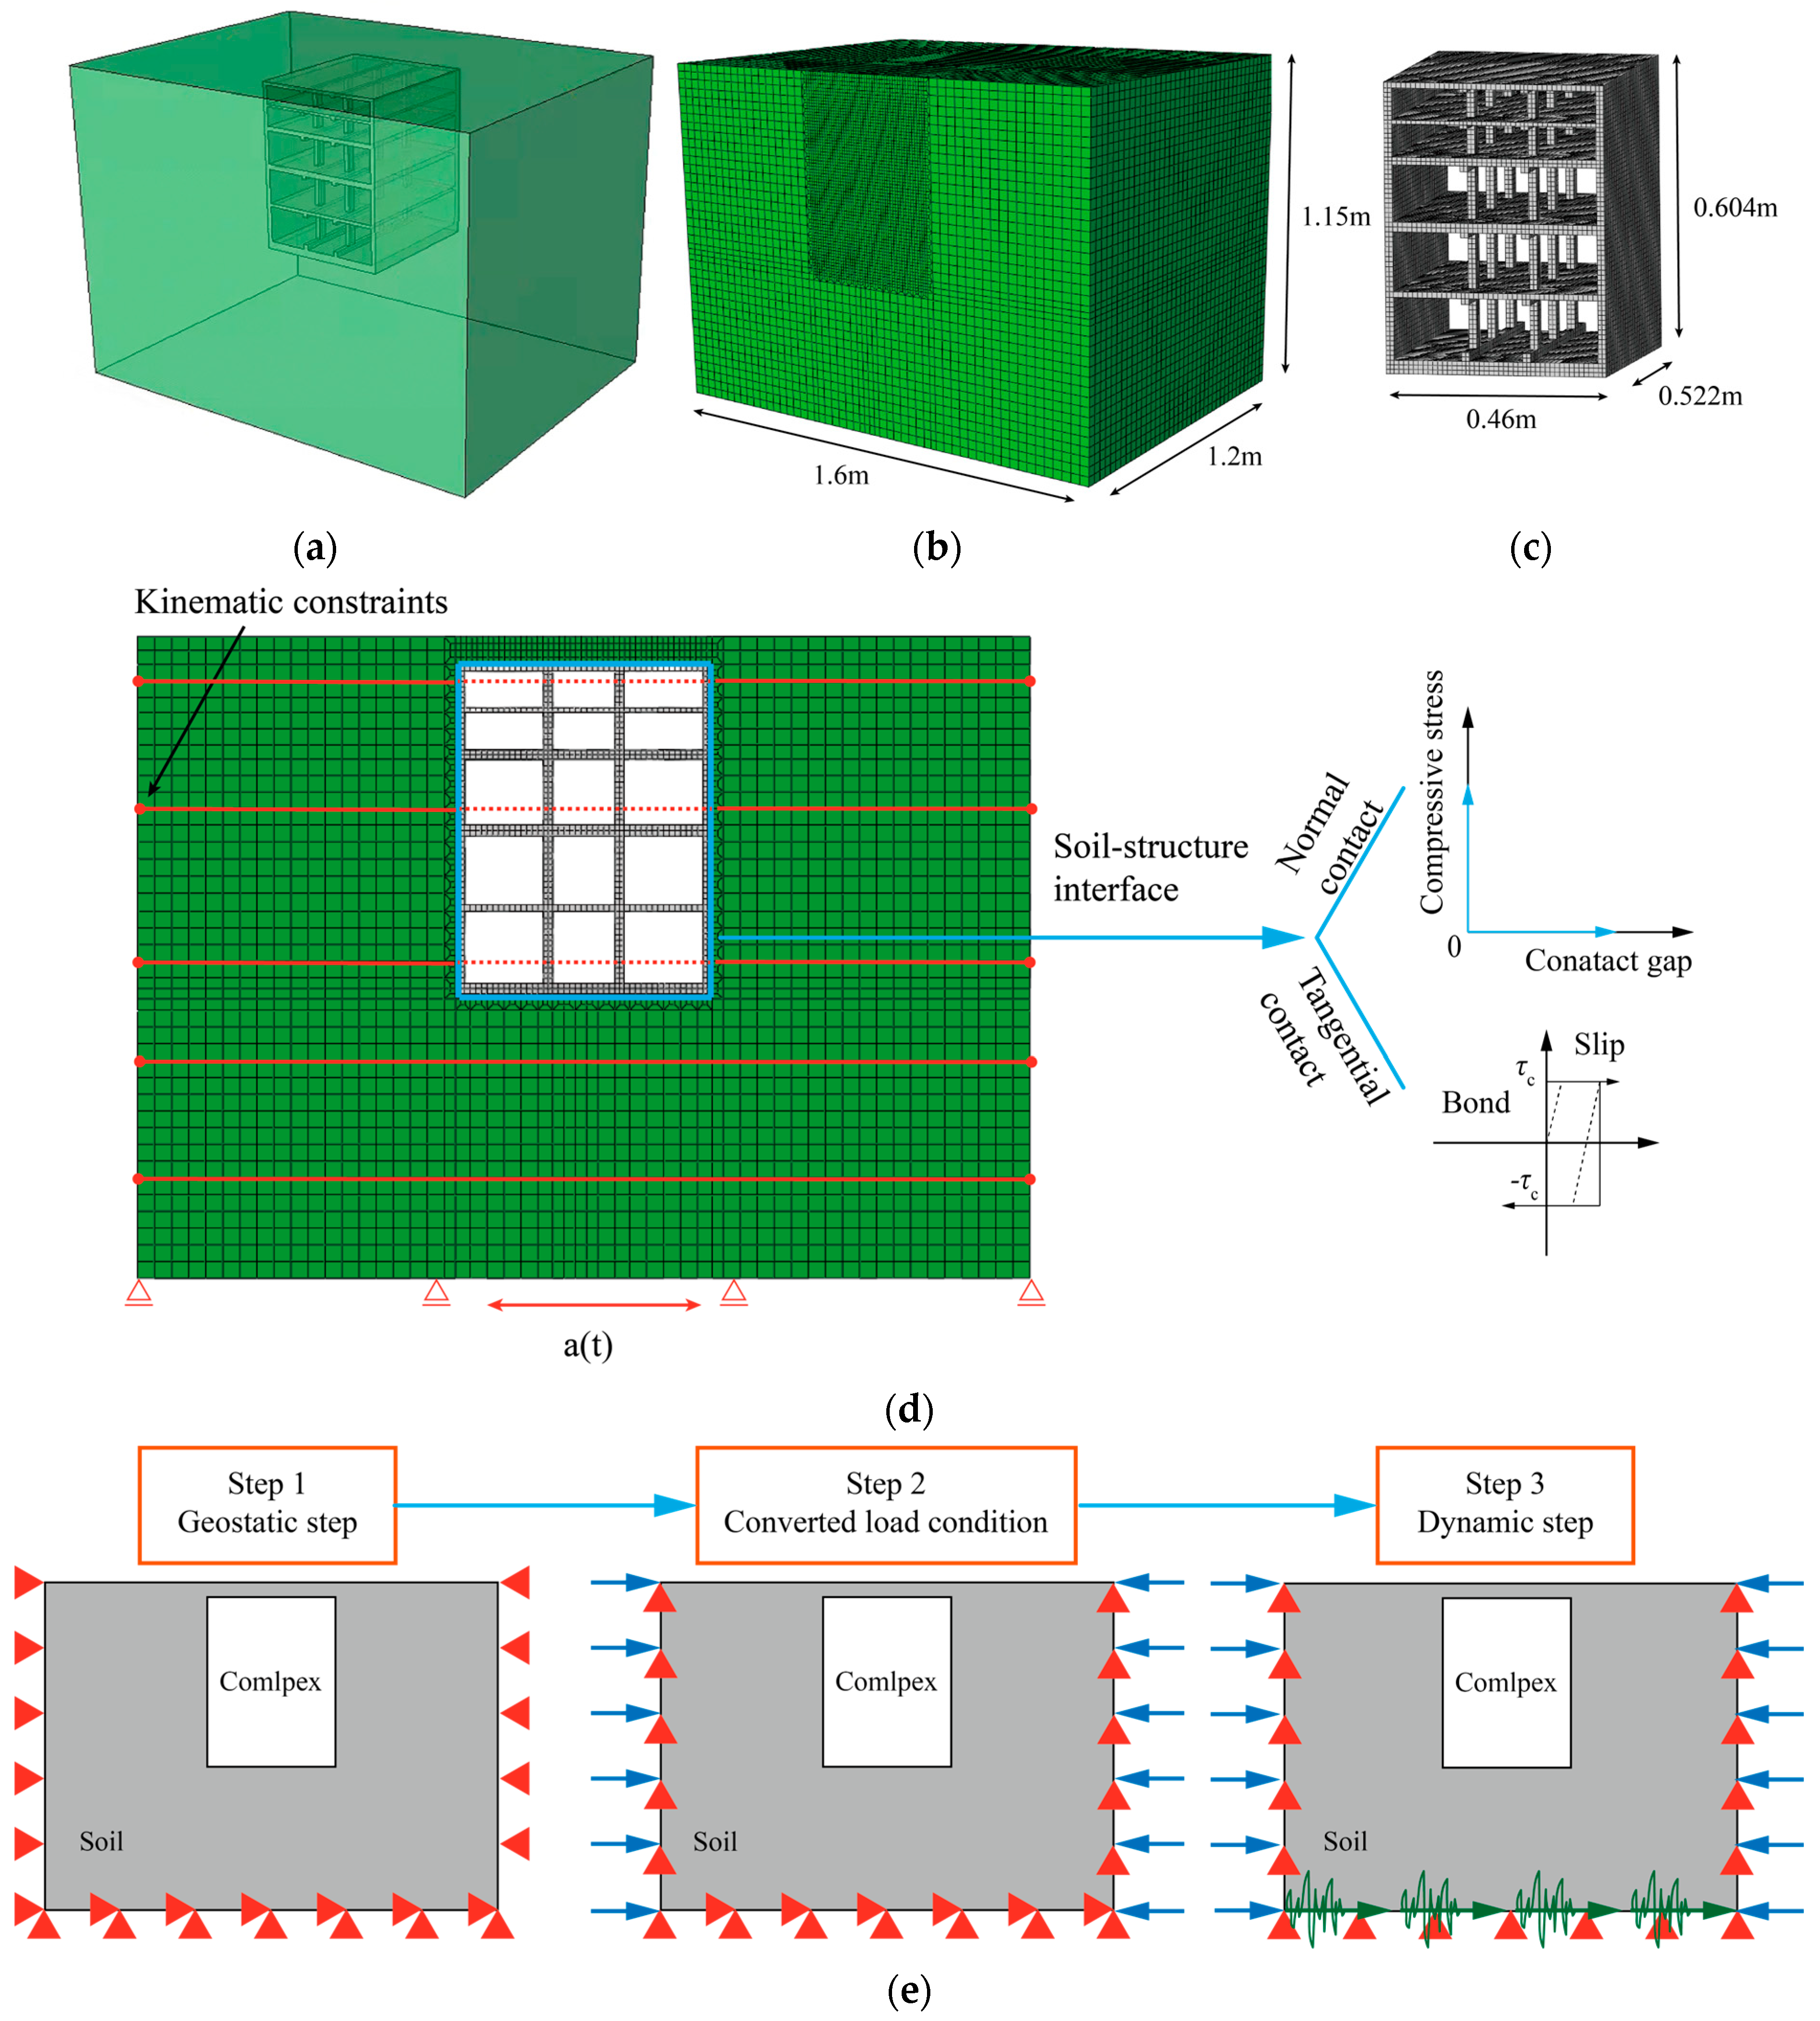
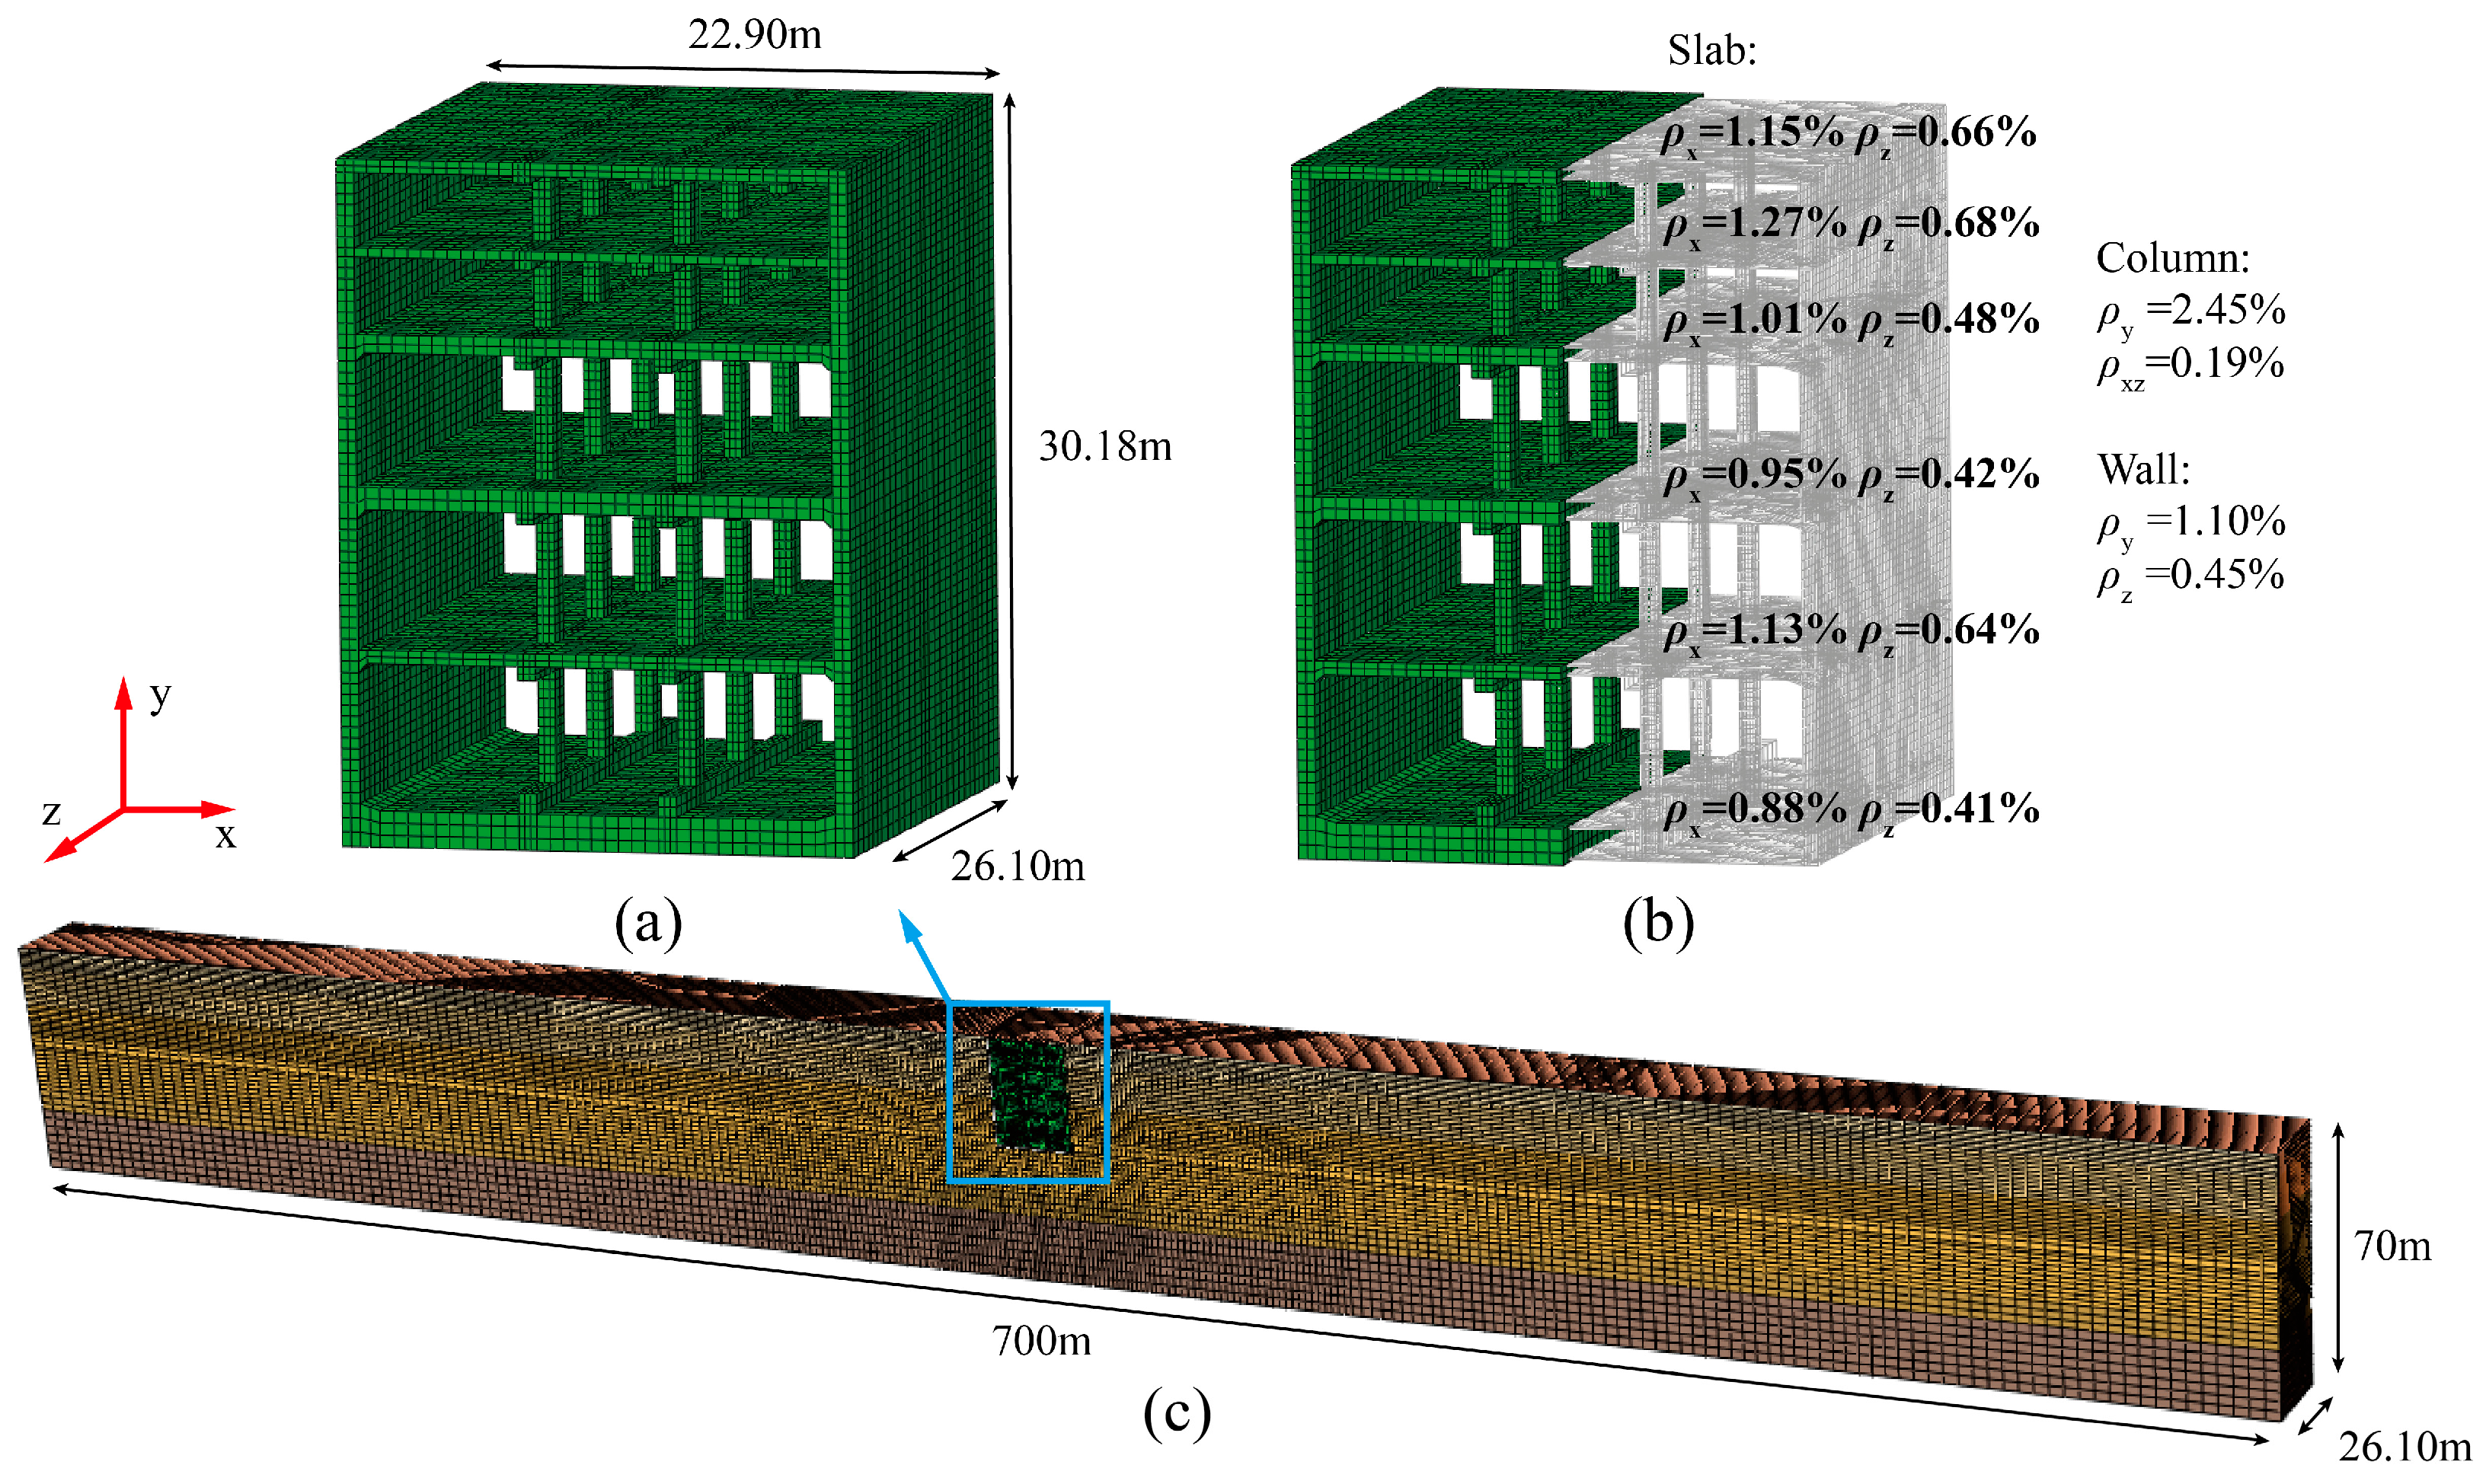
4.2.1. Establishment of the Finite Element Model (FEM)

A three-dimensional finite element model of the soil–underground complex model system is established using the finite element software ABAQUS/Standard version 6.14 [33], with its configuration illustrated in Figure 13a–d. The model soil’s density and maximum shear modulus, along with the curves of dynamic shear modulus and damping ratio with respect to shear strain, are provided in Section 2.2. In this paper, the Davidenkov model [34] is adopted to simulate the dynamic response of the soil, and the stress–strain relationship of the model soil is described by the following equation:
G / G max = 1 H γ = 1 γ / γ 0 2 B 1 + γ / γ 0 2 B A
τ γ = G γ = G max γ 1 H γ
where G is the dynamic shear modulus, G max is the maximum shear modulus, τ is the shear stress, γ is the shear strain, and γ 0 , A and B are fitting parameters with values of 9.09 × 10⁻⁴, 1.14, and 0.45, respectively.
The damping ratio of the model soil is calculated using the following equation:
ξ = 0.0121 + 0.18 × 1 G / G max 1.11
The nonlinear behavior of the soil is simulated in the numerical model through a user-defined material subroutine (UMAT). An elastic material model is used to simulate the structure made of organic glass, with a Young’s modulus of 3.3 GPa and a Poisson’s ratio of 0.3. An equivalent density, incorporating both the added masses and the mass of the organic glass, is assigned to the elastic material.
The model soil and structure are simulated using fully integrated eight-node brick elements C3D8. To ensure the computational accuracy of the simulation, the length of the soil elements l V in the vertical direction is controlled by l V < λ s / 8 = v s / ( 8 f s ) [35], where λ s is the shear wave wavelength, f s is the cut-off frequency, and v s is the shear wave velocity. Both the vertical and the horizontal mesh sizes of the model soil are set to 0.03 m. The mesh is locally refined in the soil regions adjacent to the structure, in accordance with finite element meshing requirements. Rayleigh damping [36] is applied in the numerical model to account for structural damping.
To simulate soil–structure interaction, a face-to-face contact technique is employed [19,37]. Normal contact between the soil and structure is defined as hard contact, allowing separation and pressure development upon contact, while tangential contact follows the Coulomb friction model, with a friction coefficient of 0.4. The bottom boundaries are constrained in the normal direction to simulate the container’s support on the soil. At the same time, Kinematic tie constraints are applied at the left and right boundaries to enforce synchronized movement of nodes at the same height, thereby eliminating relative displacement and achieving a simplified simulation of the laminar box [38,39,40].
Figure 13e illustrates the boundary condition transformation process used in the numerical simulation. Each simulation consists of three steps: a geostatic step, a converted load condition, and a dynamic step [41,42]. In the geostatic step, gravity is applied to the soil–underground complex model system. The bottom boundary is fully fixed, while side boundaries are constrained horizontally to extract reaction forces. In the converted load condition step, the side constraints are removed and replaced by the previously extracted reaction forces. In the dynamic step, bottom horizontal constraints are released, seismic motions are applied at the base, and side reaction forces are reintroduced. The input motion is derived from the acceleration recorded at point A0 on the shaking table surface.

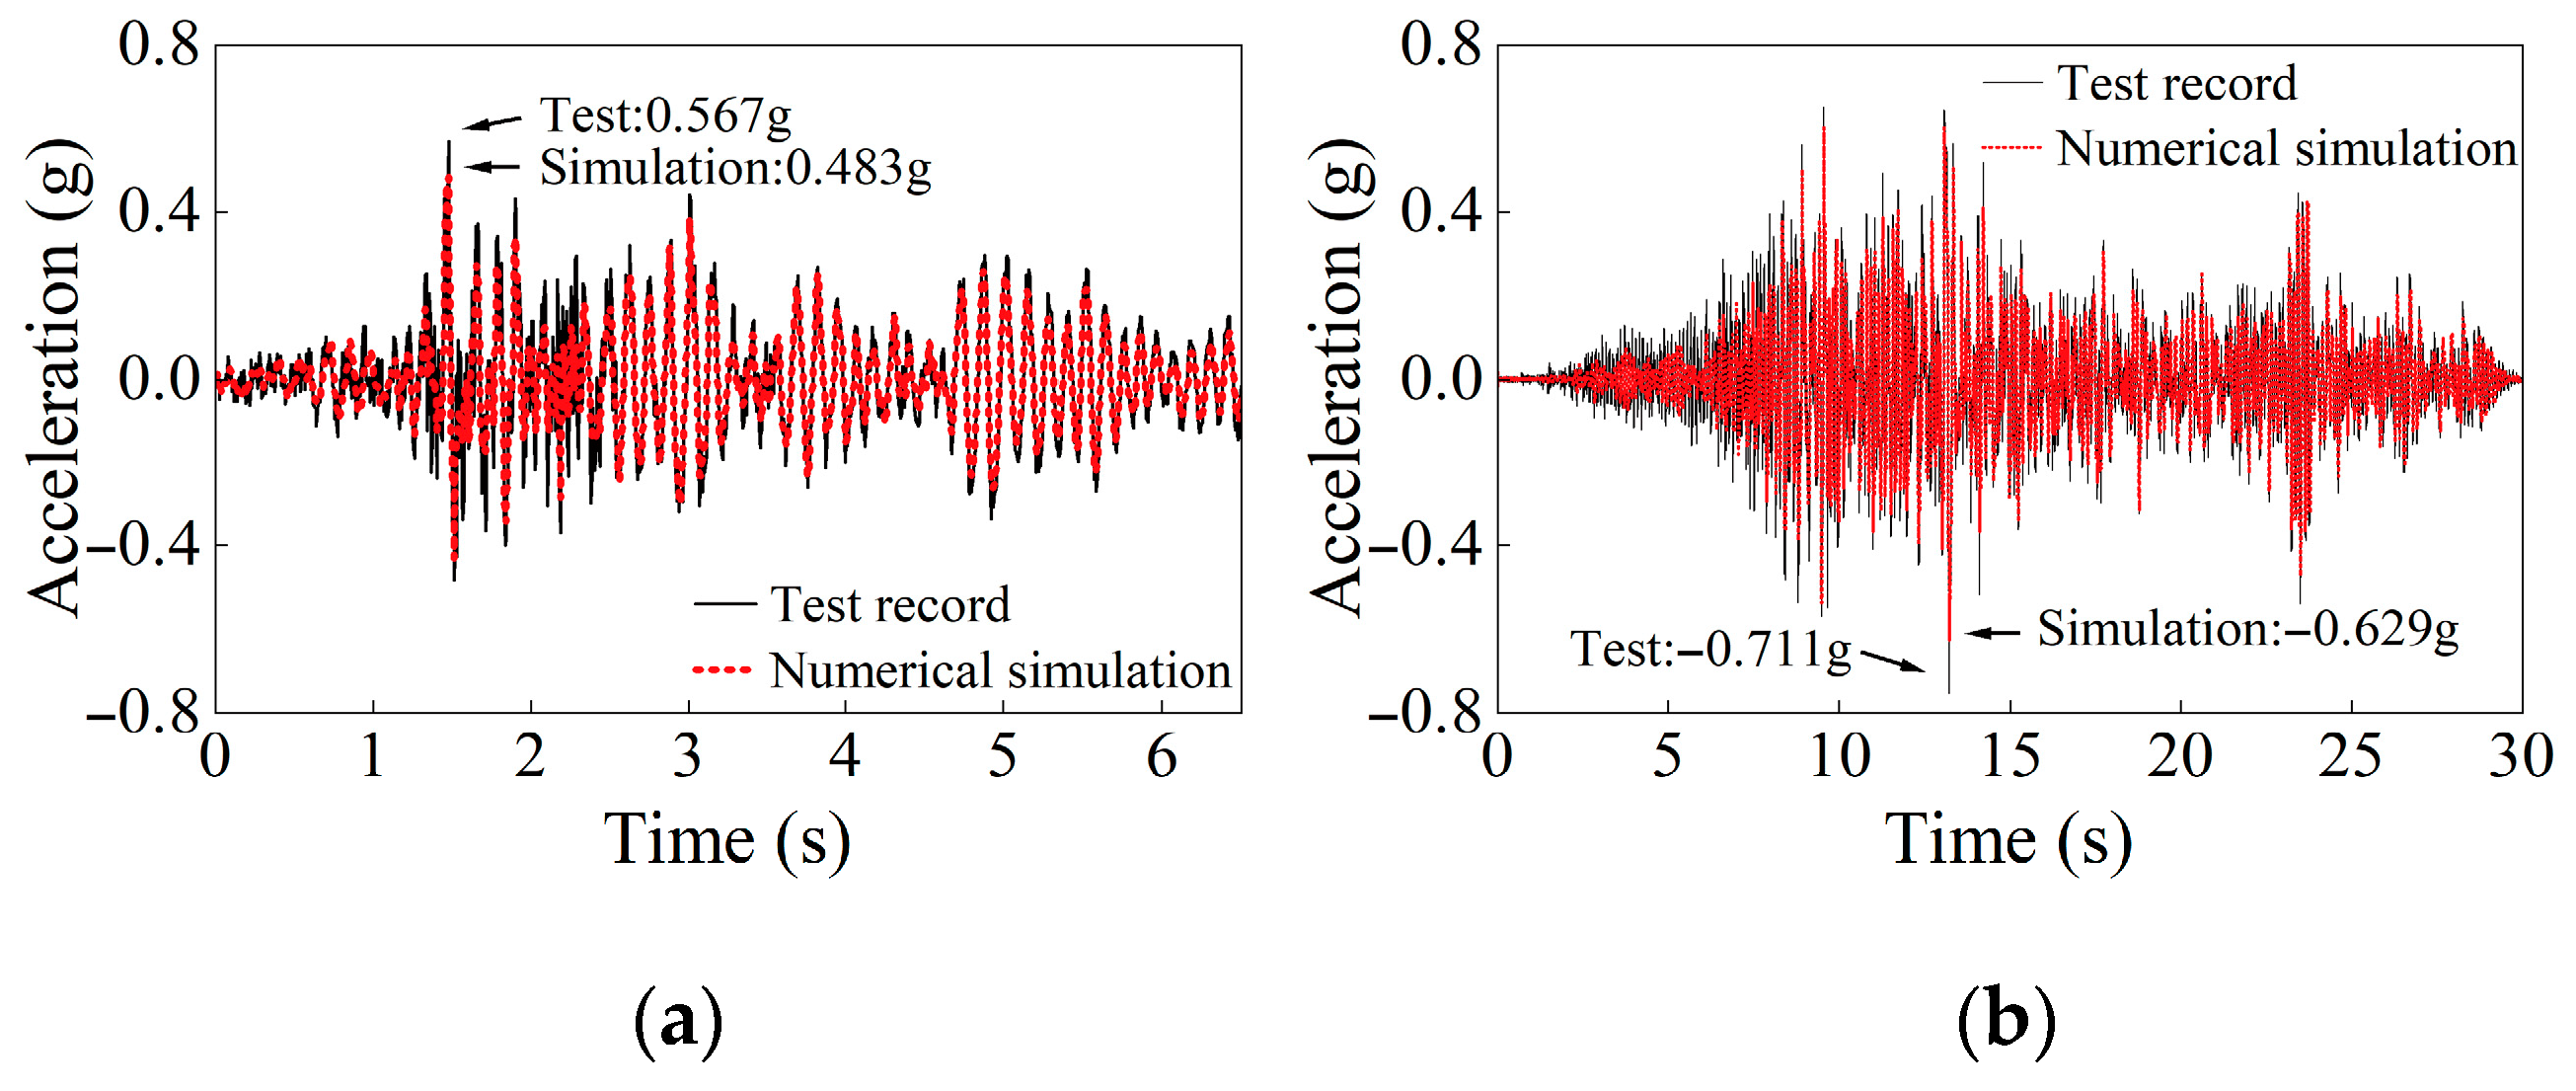
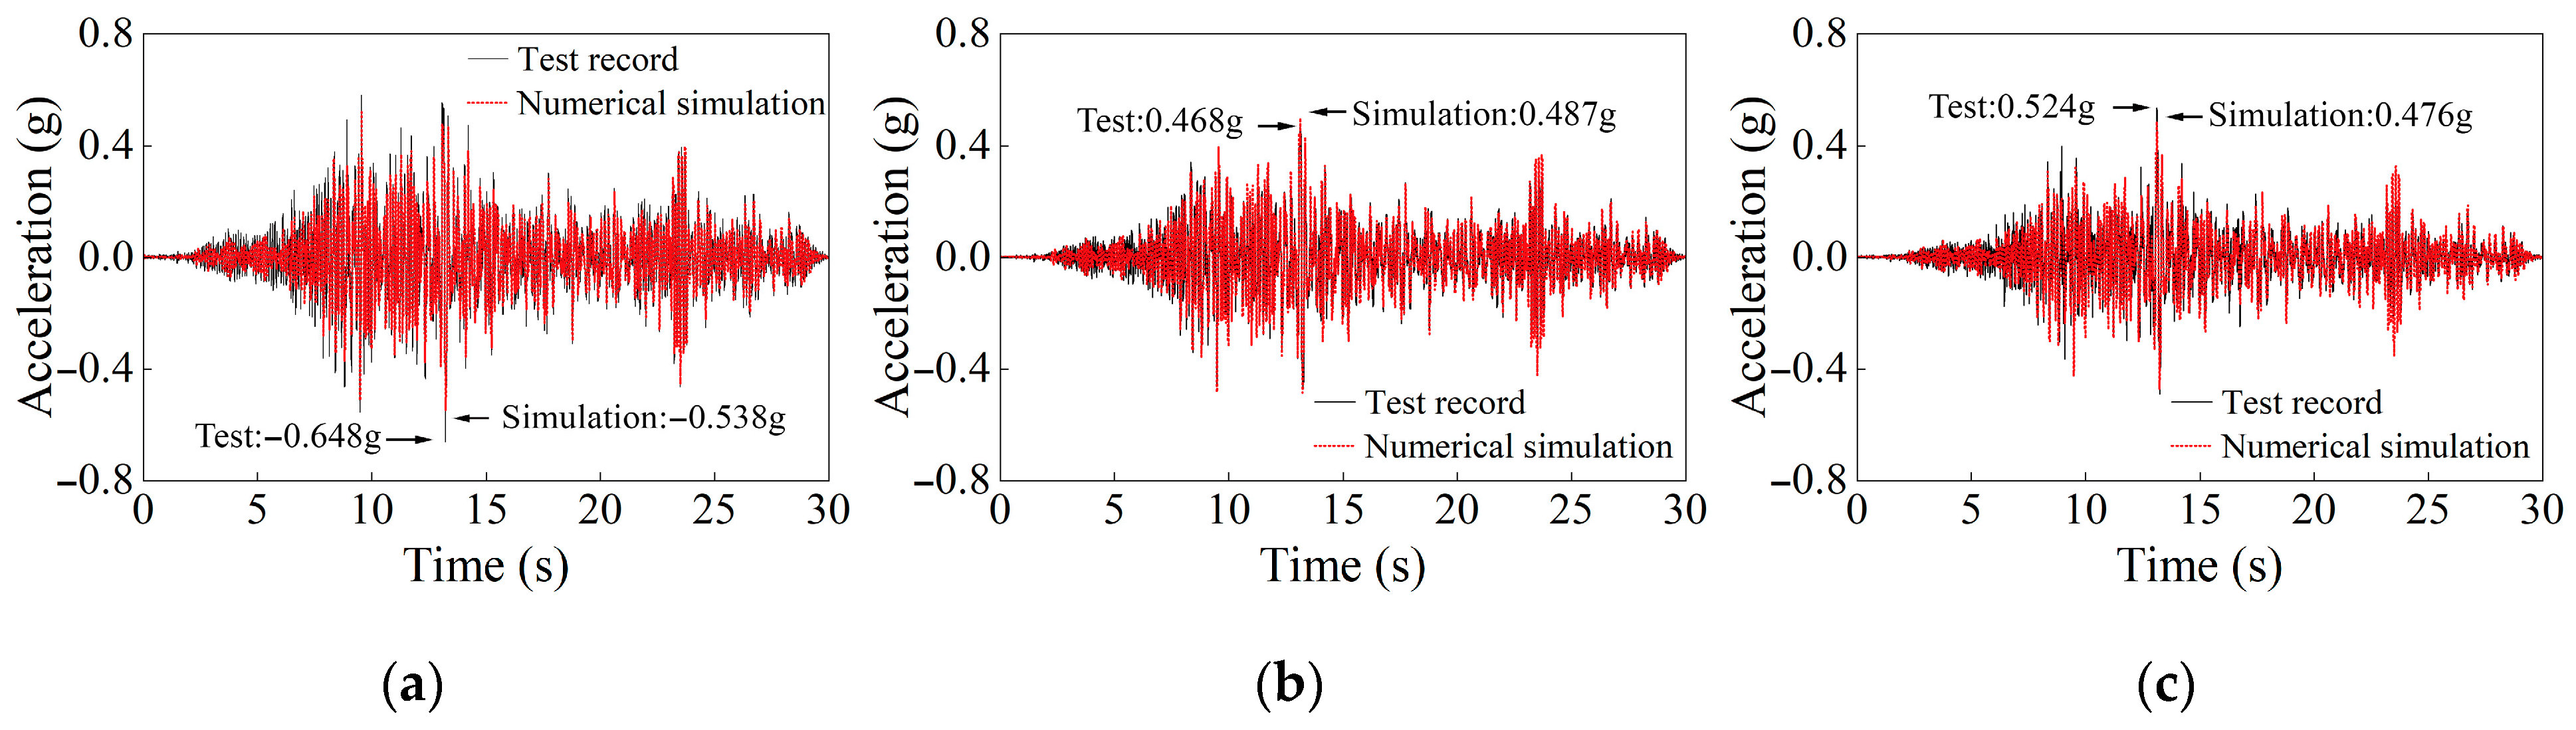
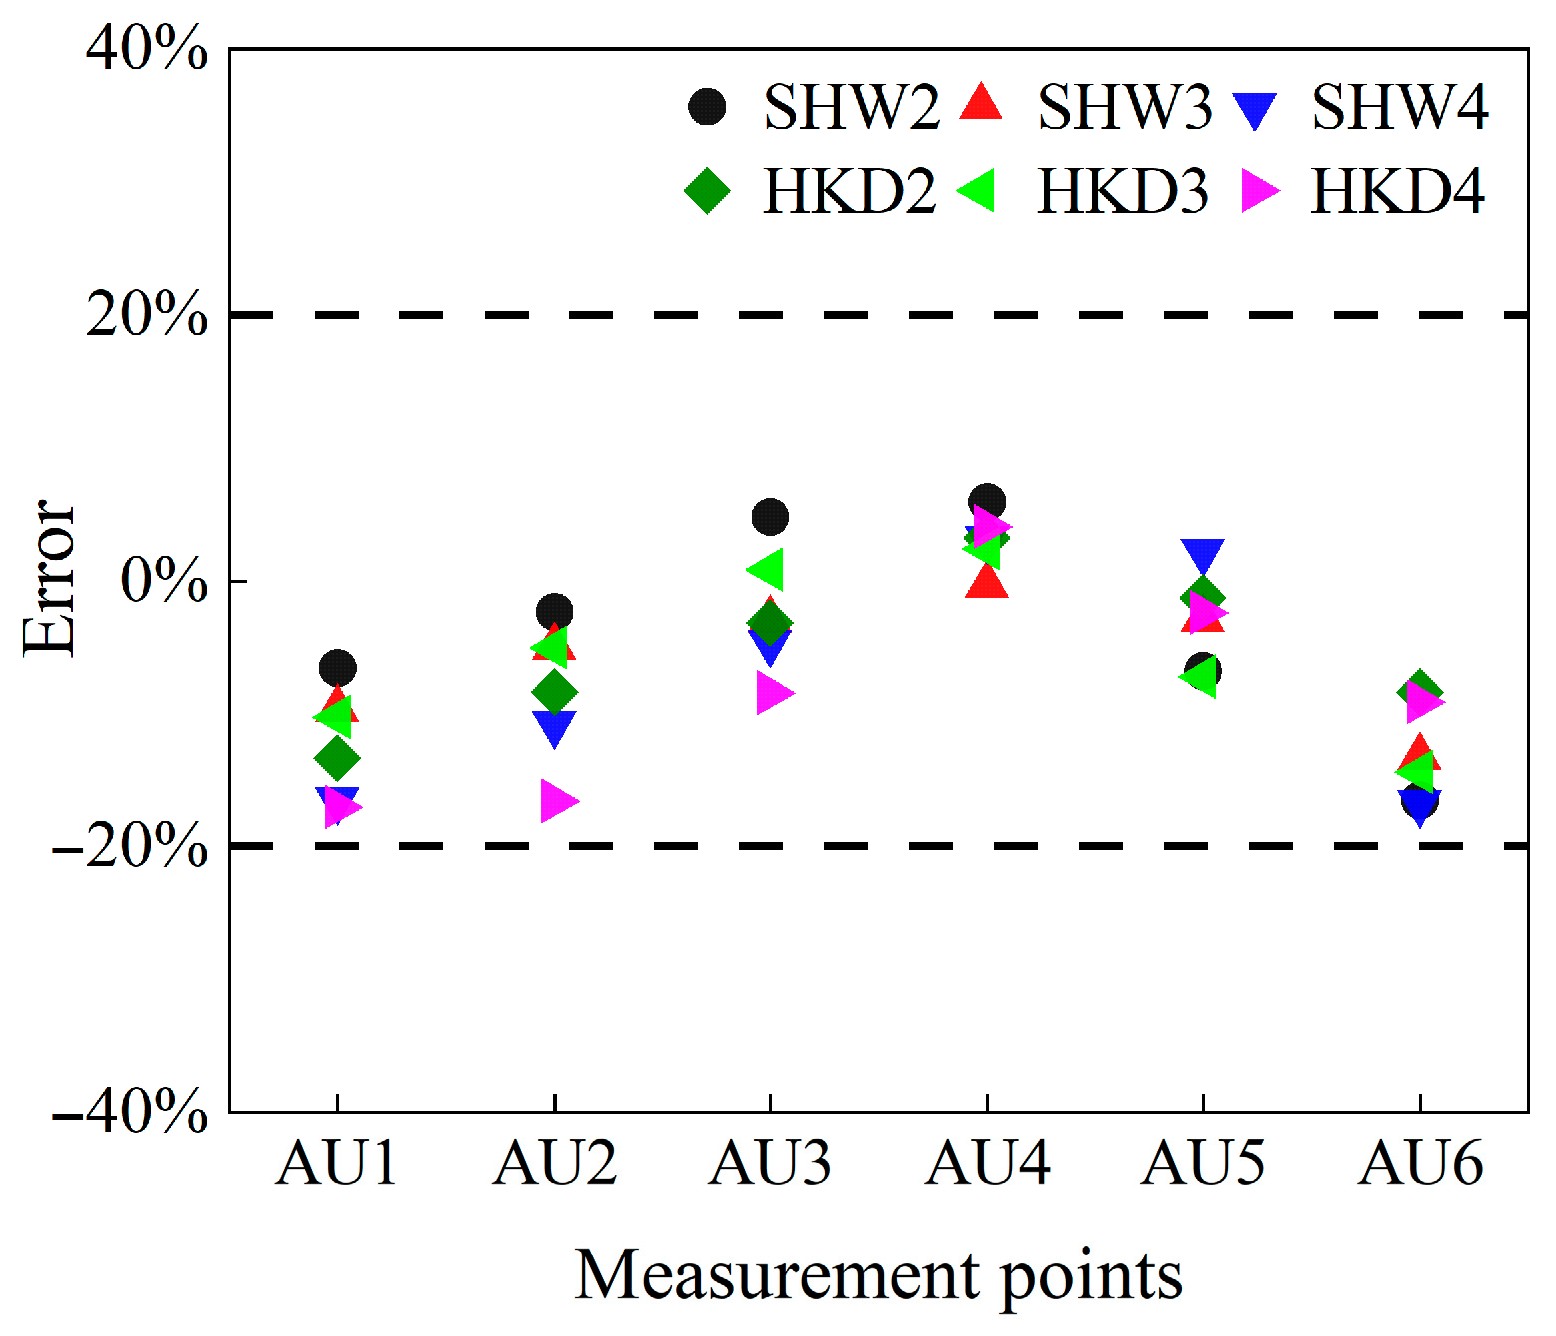
4.2.2. Numerical Simulation and FEM Validation of Model Tests

In this section, numerical simulations are conducted on the model test results subjected to SHW and the far-field long-period ground motion HKD095. In order to validate the effectiveness of the numerical soil model, Figure 14 presents a comparison between the simulated and experimental acceleration time histories at the soil surface, based on test cases SHW4 and HKD4. The free-field responses obtained from the numerical simulation and the experimental test are generally in good agreement. In cases SHW4 and HKD4, the peak acceleration response errors are 14.85% and 11.56%, respectively.
In order to validate the effectiveness of the soil–structure interaction system numerical model, Figure 15 and Figure 16 compare the simulation and experimental results for the acceleration time histories of each story of the model structure, referring to test cases SHW4 and HKD4. The acceleration waveforms and amplitudes from the simulations show good agreement with the experimental results. These results demonstrate that the finite element model effectively reproduces the seismic response of the soil–underground complex model system.
To quantitatively assess the discrepancy between simulation and experimental results, the deviation in peak acceleration at each story of the model structure is analyzed. The relative error between simulation and test results at each story is defined as:
E = S R R × 100 %
where R represents the test result and S denotes the numerical simulation. Figure 17 shows the relative errors of the peak acceleration response between the simulation and test results at each measurement point of the model structure. The relative errors range from −17.02% to +5.92%, all remaining within ±20%, which falls within the acceptable range reported in previous soil–structure interaction studies [36,43]. In summary, the proposed finite element model effectively captures the dynamic behavior of the model structure and provides a reliable tool for subsequent seismic response analyses.
Figure 18a shows the deformation of the model structure at the moment of maximum horizontal deformation in test case HKD4. The structure primarily exhibits horizontal shear deformation, with greater deformation observed in the lower three stories compared to the upper two. Figure 18b presents the Mises stress nephogram at the moment of peak stress in test case HKD4. Stress concentration primarily occurs at the column-to-slab and wall-to-slab connections, with the maximum Mises stress located at the base of the bottom-story columns. This observation is consistent with the strain response observed in the shaking table tests.

5. Seismic Damage Mechanism of the Underground Complex

To further investigate the seismic damage mechanism of the underground complex throughout the entire process from normal operation to severe damage, this paper extends the finite element modeling approach presented in the previous section, using the prototype structure from the shaking table test as the research subject. The Shanghai artificial wave SHW and far-field long-period seismic motion HKD095 are selected as seismic excitations, with peak acceleration amplitudes scaled to 0.035 g, 0.1 g, 0.2 g, 0.3 g, 0.4 g, and 0.6 g, to systematically analyze the structural deformation evolution, stress distribution, and development process of plastic damage. The complete process of seismic damage evolution in the five-story and three-span underground complex is thereby revealed.

5.1. Numerical Models of the Soil–Underground Complex Interaction System

A finite element model of the soil–underground complex interaction system is established based on the prototypical dimensions of the five-story and three-span underground complex to investigate its seismic damage mechanism. The cross-sectional dimensions of the underground complex are shown in Figure 19a: the main body of the structure has a width of 22.90 m and a height of 30.18 m. The axial direction includes three spans, with a total length of 26.10 m, and the thickness of the overlying soil layer is 0.80 m. A 70 m-thick soil profile was extracted for analysis in accordance with relevant standard recommendations [44]. The stratigraphic distribution at the site is illustrated in Figure 19b.
The concrete density of the structure in the finite element model is 2450 kg/m3. The strength class of the concrete used in the central columns is C45, while C35 concrete is used for the remaining structural members. Detailed material parameters are provided in Table 3. The concrete damage plasticity model [45] is employed to simulate the dynamic nonlinear behavior of concrete. Due to spatial constraints, only the uniaxial tension–compression stress–strain curves and damage factors curves of C45 concrete are provided, as shown in Figure 20. A bilinear model [46] is used to simulate the mechanical behavior of the steel reinforcement. The steel reinforcement has a density of 7800 kg/m3, a Young’s modulus of 200 GPa, a Poisson’s ratio of 0.3, a yield strength of 300 MPa, and a post-yield stiffness that is 2% of the initial stiffness.
The soil parameters are derived from borehole data obtained in Shanghai [47], and the physical properties of each soil layer are summarized in Table 4. The relationships between dynamic shear modulus, maximum shear modulus, damping ratio, and shear strain for each soil layer are adopted from Ref. [47] and are not presented here due to space limitations.
Figure 21 presents the three-dimensional finite element model of the soil–underground complex interaction system. To reduce wave reflections at the artificial boundary, the lateral boundary is positioned at ten times the soil depth [48], resulting in a lateral computational width of 700 m. The nonlinear dynamic properties of the soil, the soil–structure contact conditions, and boundary constraints are defined consistently with Section 4.2.

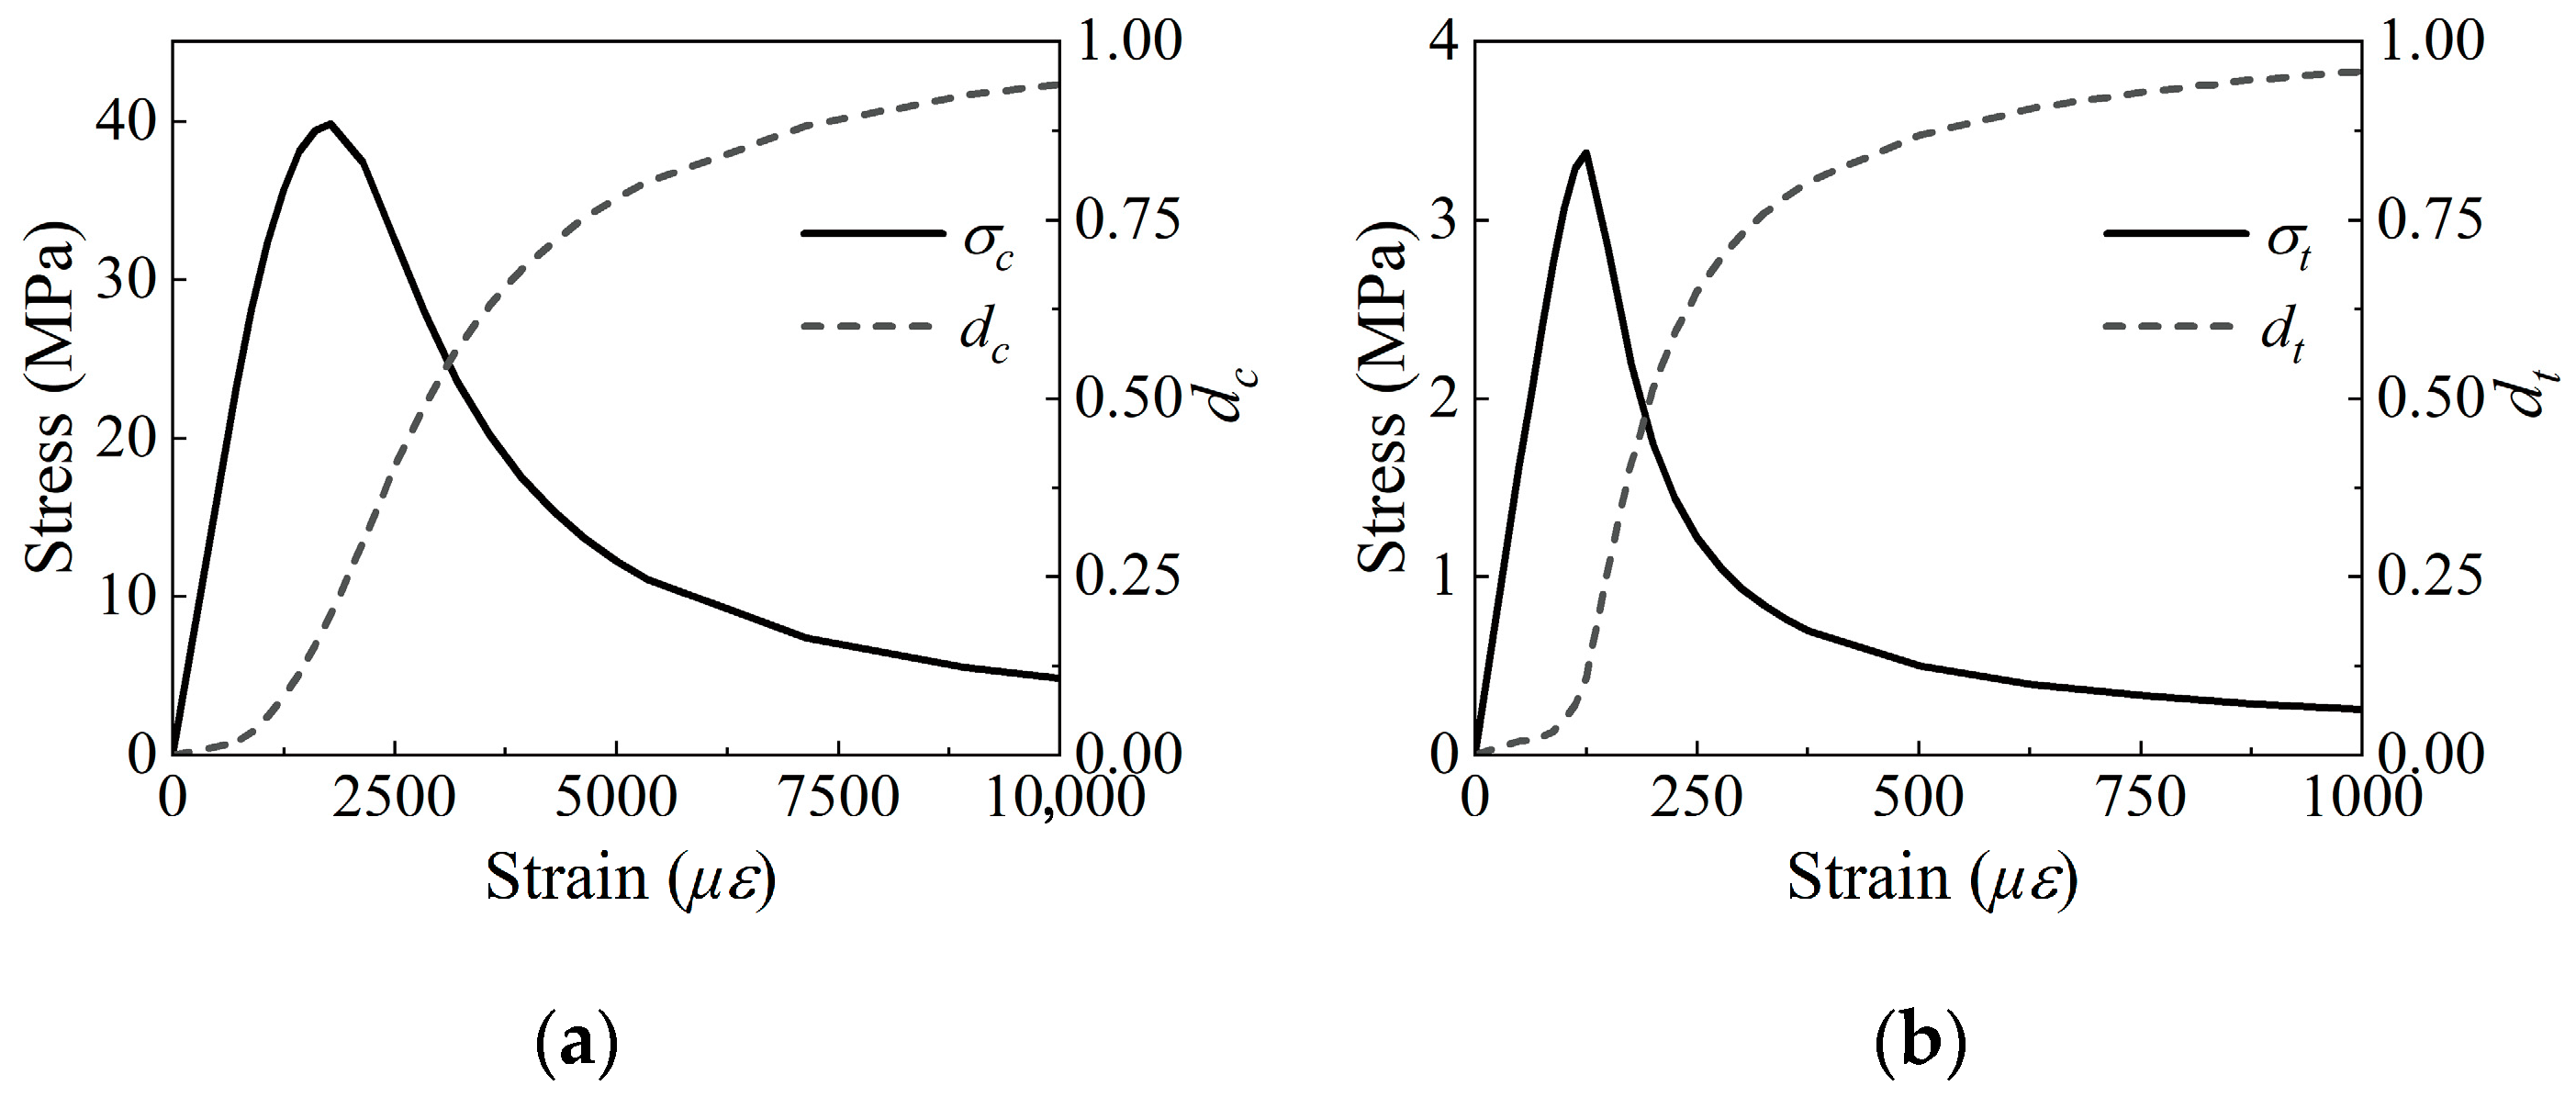
5.2. Structural Damage Mechanism

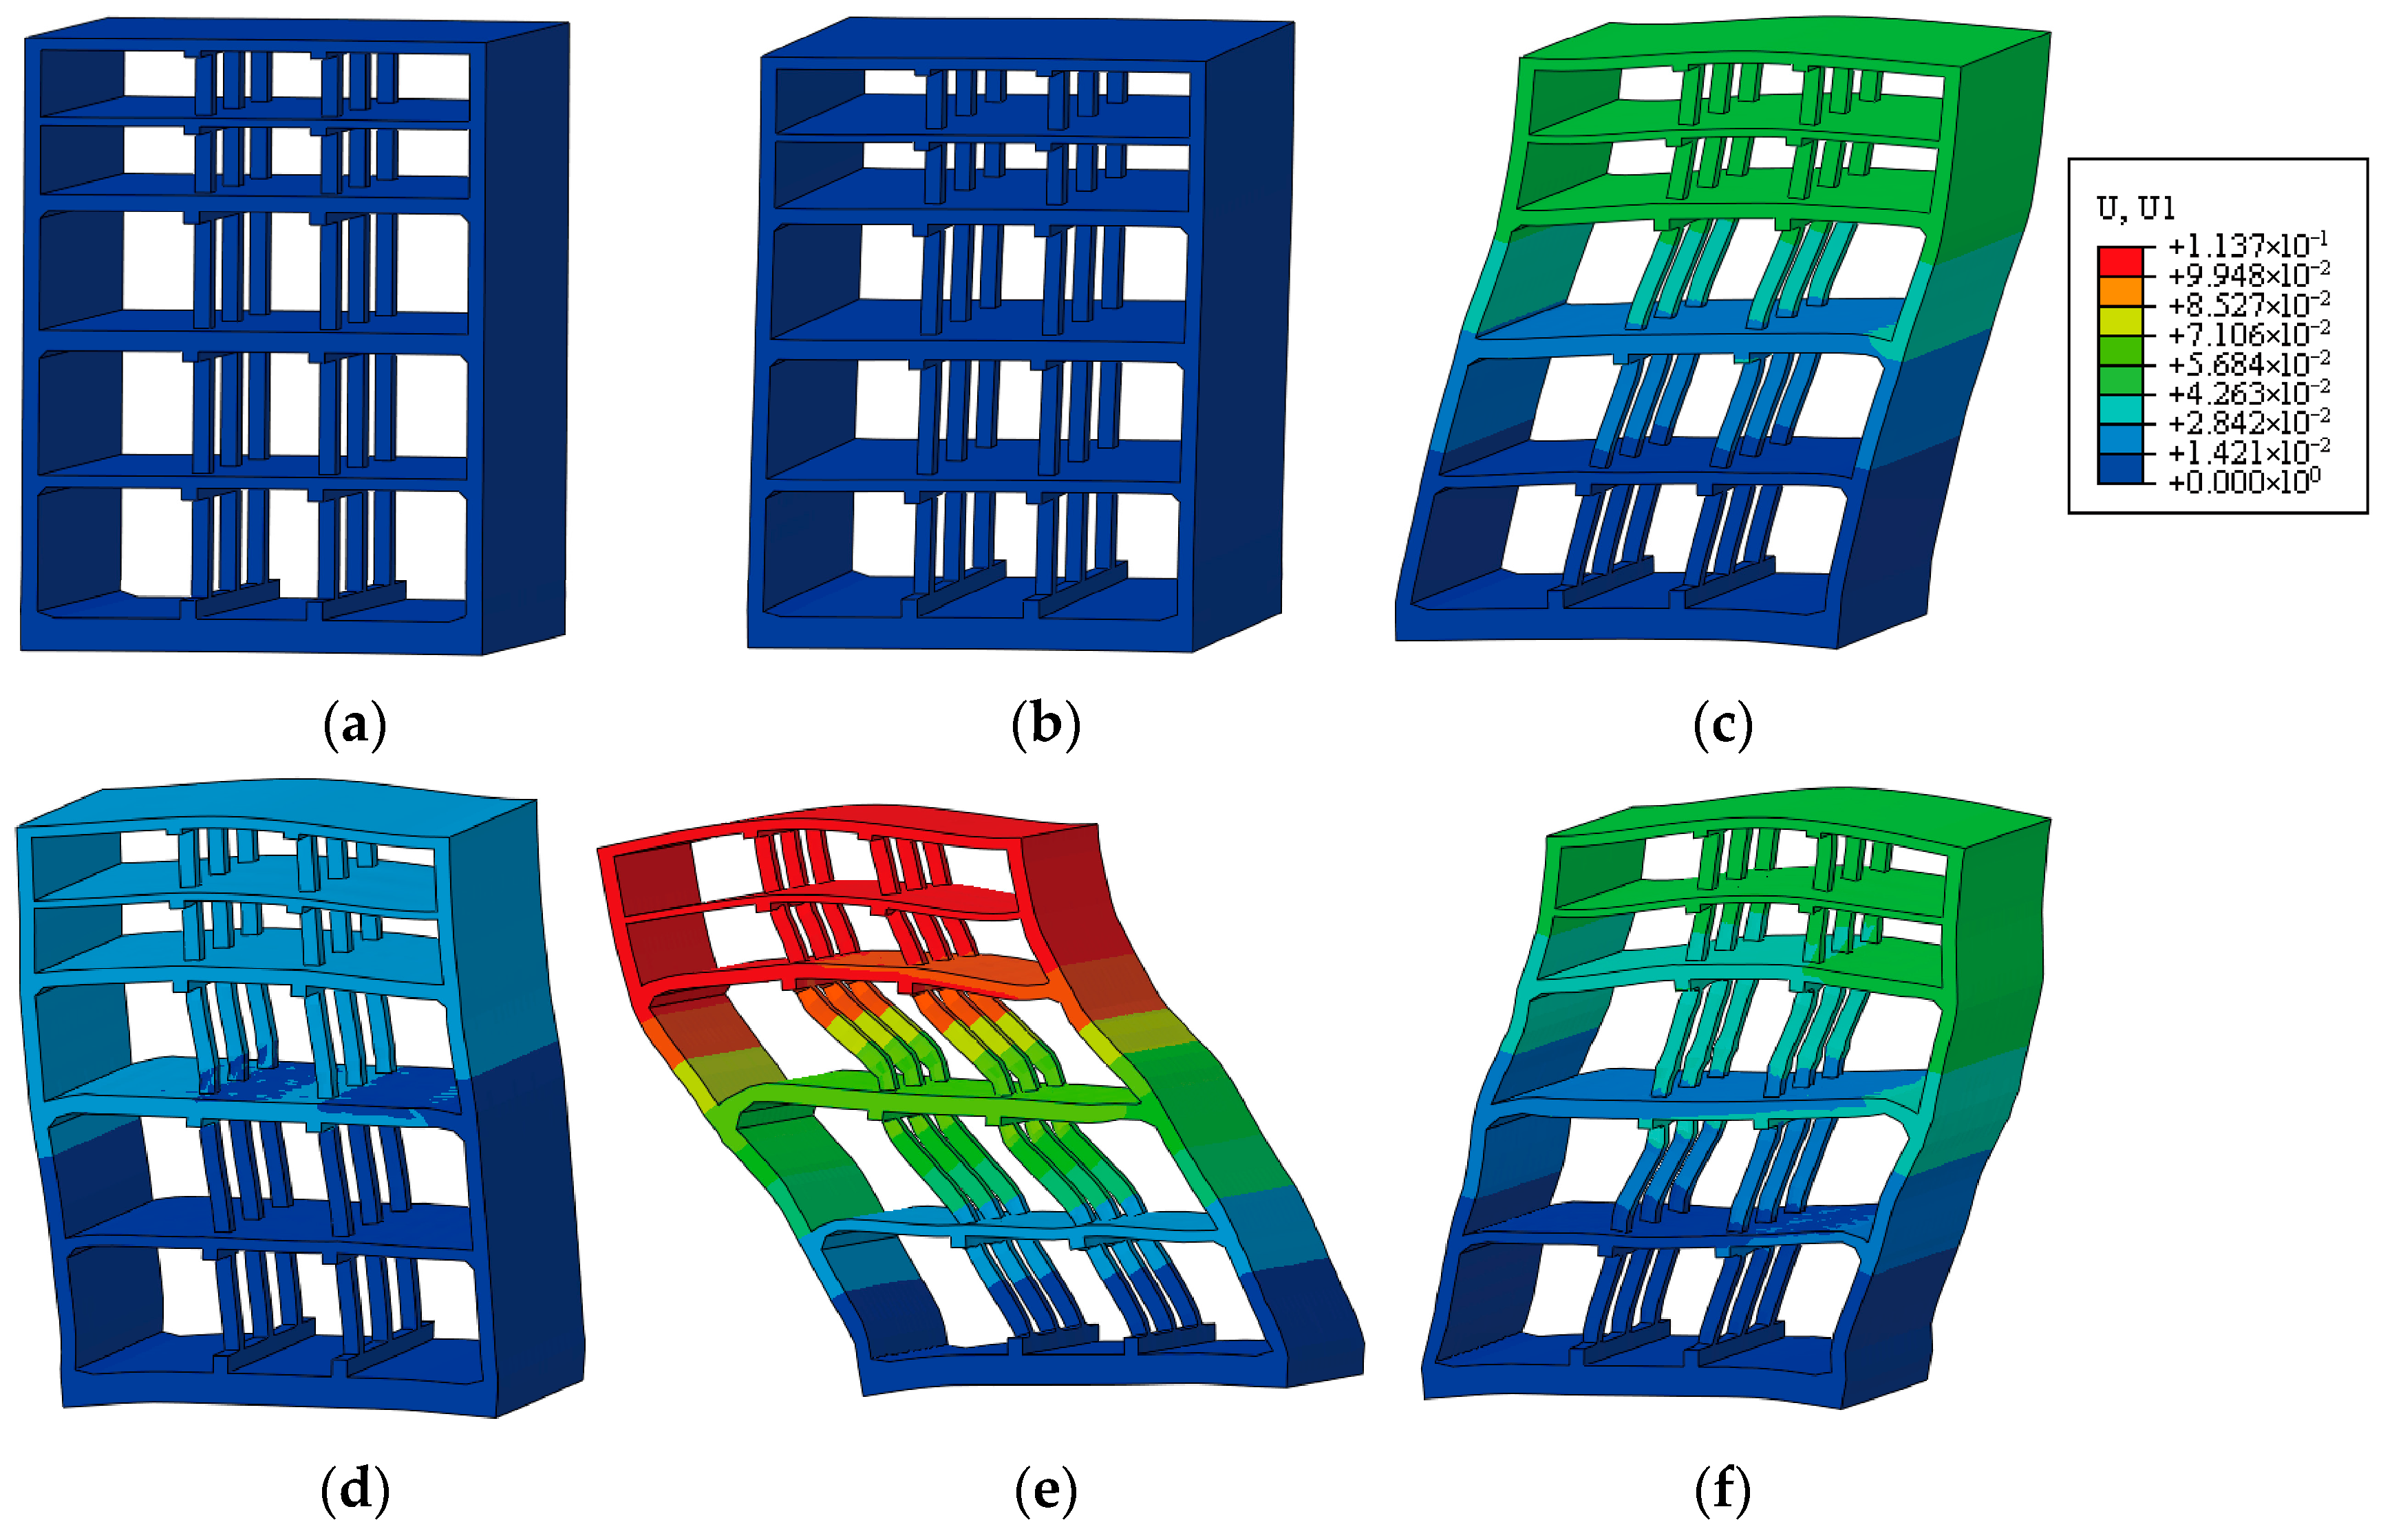
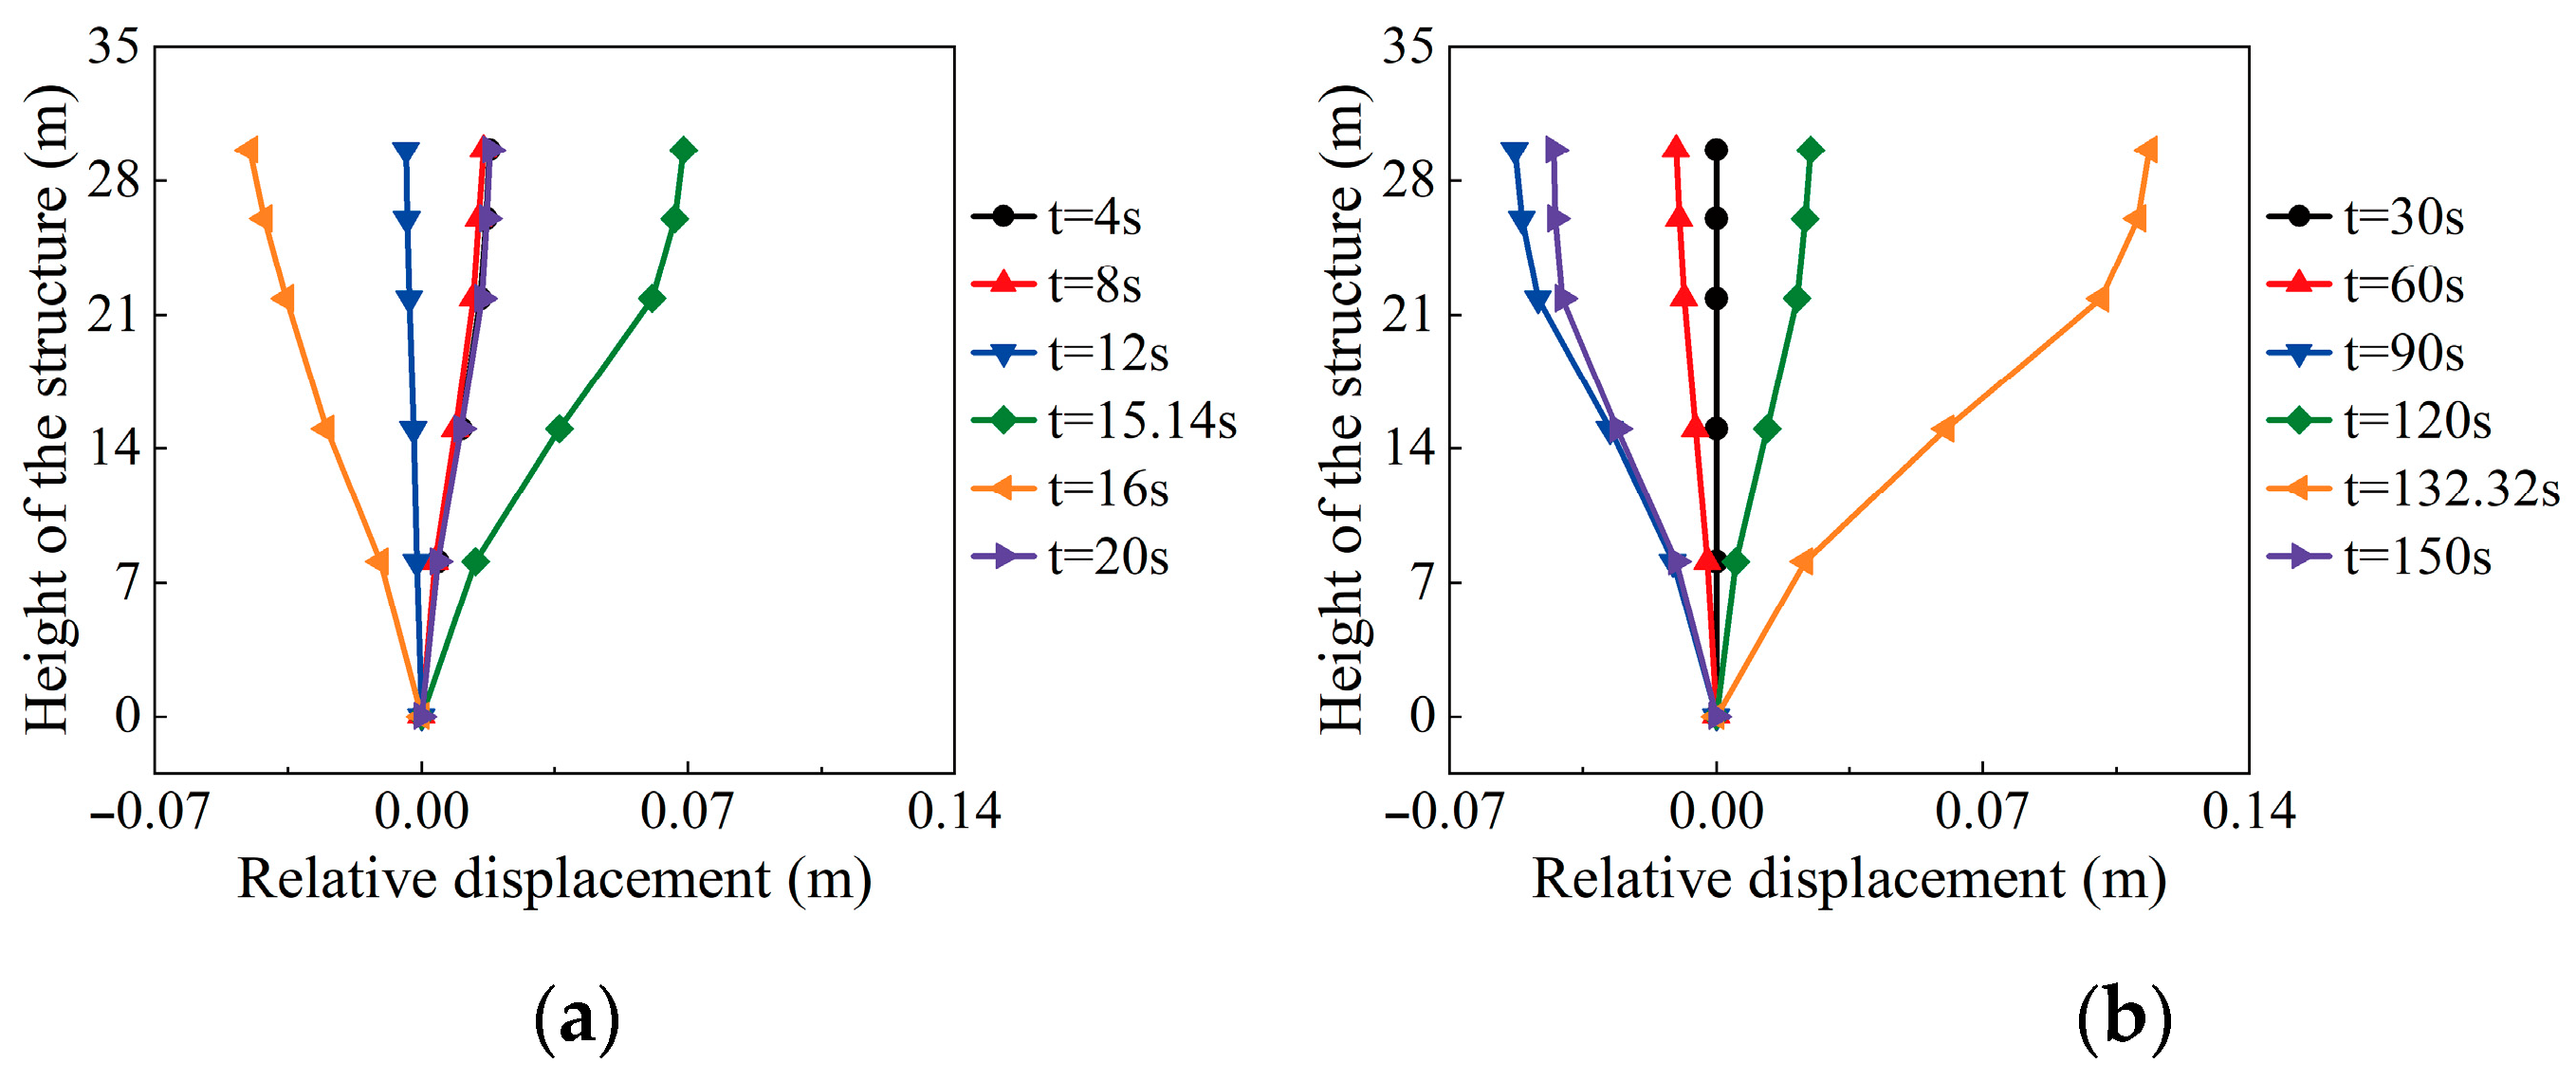
5.2.1. Structural Deformation Evolution

To investigate the deformation response characteristics of the underground complex structure under strong seismic excitation and to examine the deformation differences between different stories, a deformation evolution analysis is conducted in this section. The deformation profiles of the underground complex at typical time points under the Shanghai artificial wave SHW and the far-field long-period ground motion HKD095, with a peak acceleration of 0.4 g, are shown in Figure 22 and Figure 23, respectively. The legend “U1” denotes the horizontal relative displacement of the structure relative to the bottom slab. Under the SHW input, there is no significant structural deformation during the first 12 s due to the low input energy; for instance, the horizontal relative displacement of the top slab relative to the bottom slab is only 17.8 mm at 4 s and then gradually decreases. At t = 15.14 s, the structure exhibits significant horizontal shear deformation, with the horizontal relative displacement of the top slab reaching 68.9 mm, and the deformations at the column-to-slab and wall-to-slab connections increase progressively. At t = 16 s and 20 s, the horizontal deformation gradually decreases as the seismic excitation weakens. The overall deformation evolution of the structure under HKD095 is generally similar to that under SHW. During the first 60 s of the seismic input, its impact on the underground structure remains insignificant, and the horizontal relative displacement of the top slab stays below 10.5 mm at both 30 s and 60 s. At t = 132.32 s, the structure shows significant horizontal shear deformation, with the horizontal relative displacement of the top slab reaching 113.7 mm. At this point, the deformation of the column-to-slab and wall-to-slab connections increases notably, and the deformation of the floor slab becomes more evident.
To quantitatively compare the deformation differences between different stories of the structure under the two types of seismic motions, the distributions of horizontal relative displacements of slabs at each story of the underground complex, relative to the bottom slab, are shown in Figure 24. The results indicate that the horizontal deformation of the lower three stories is significantly larger than that of the upper two stories. This is mainly due to the fact that the story heights of the lower three stories are approximately twice those of the upper two stories, resulting in relatively lower lateral stiffness and consequently greater displacement responses. Moreover, the deformation of the structure under HKD095 is greater, with the maximum horizontal displacement of the top slab relative to the bottom slab reaching 1.65 times that under SHW.

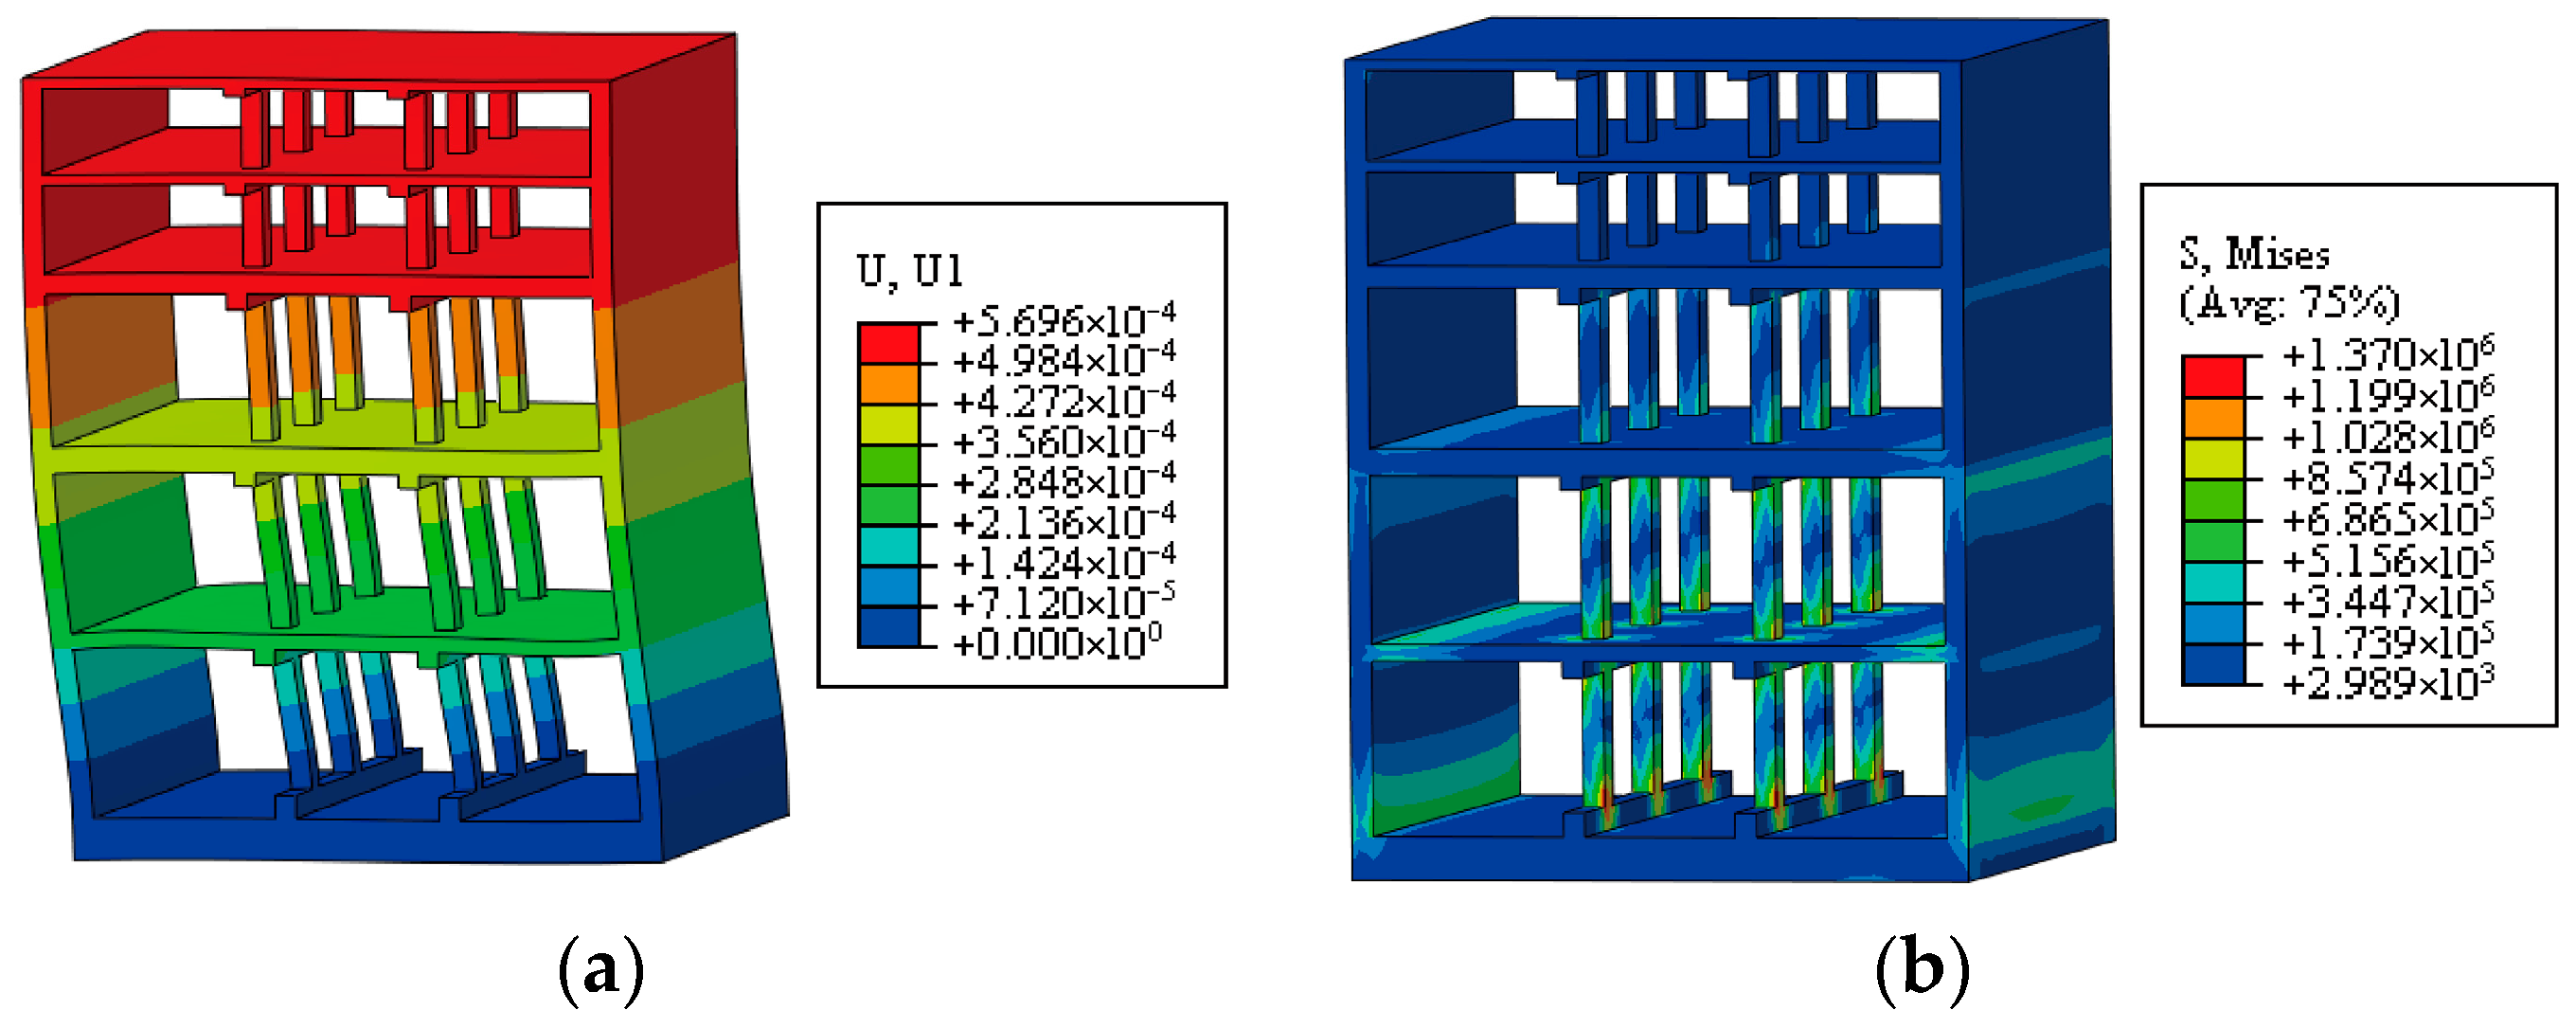
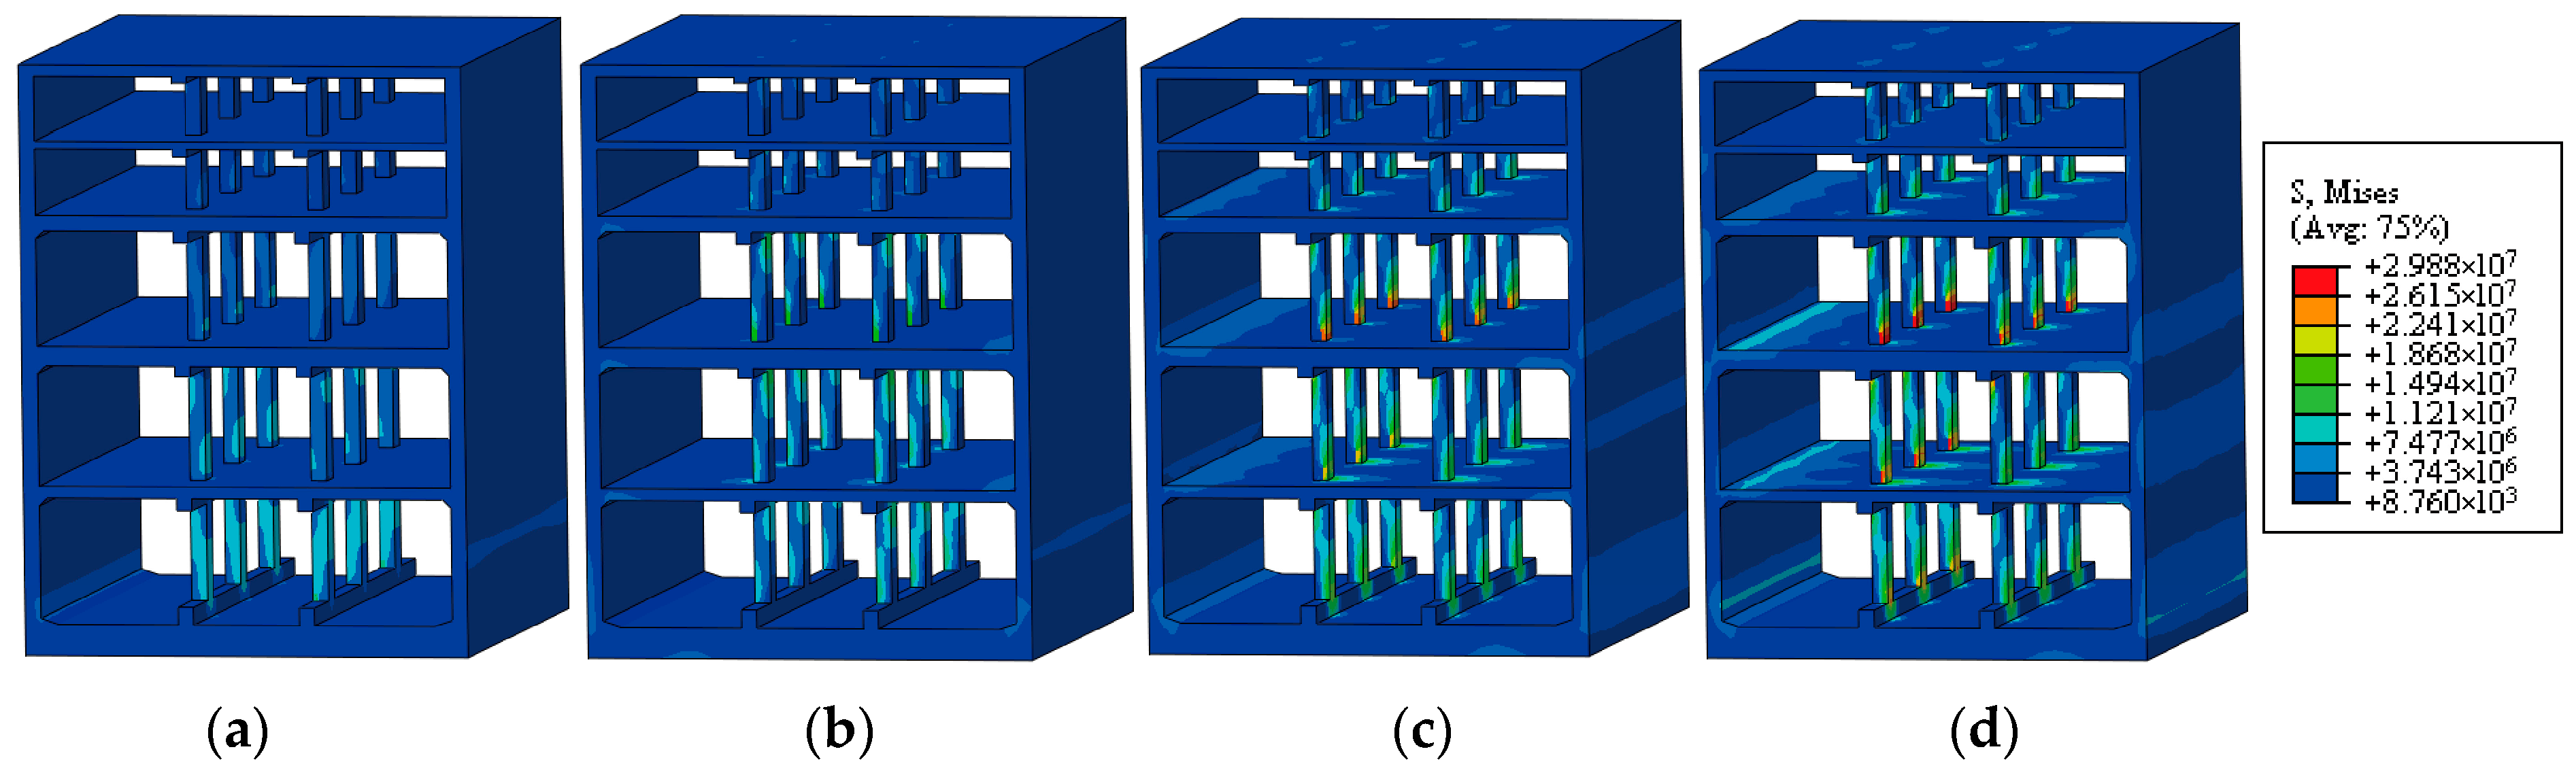
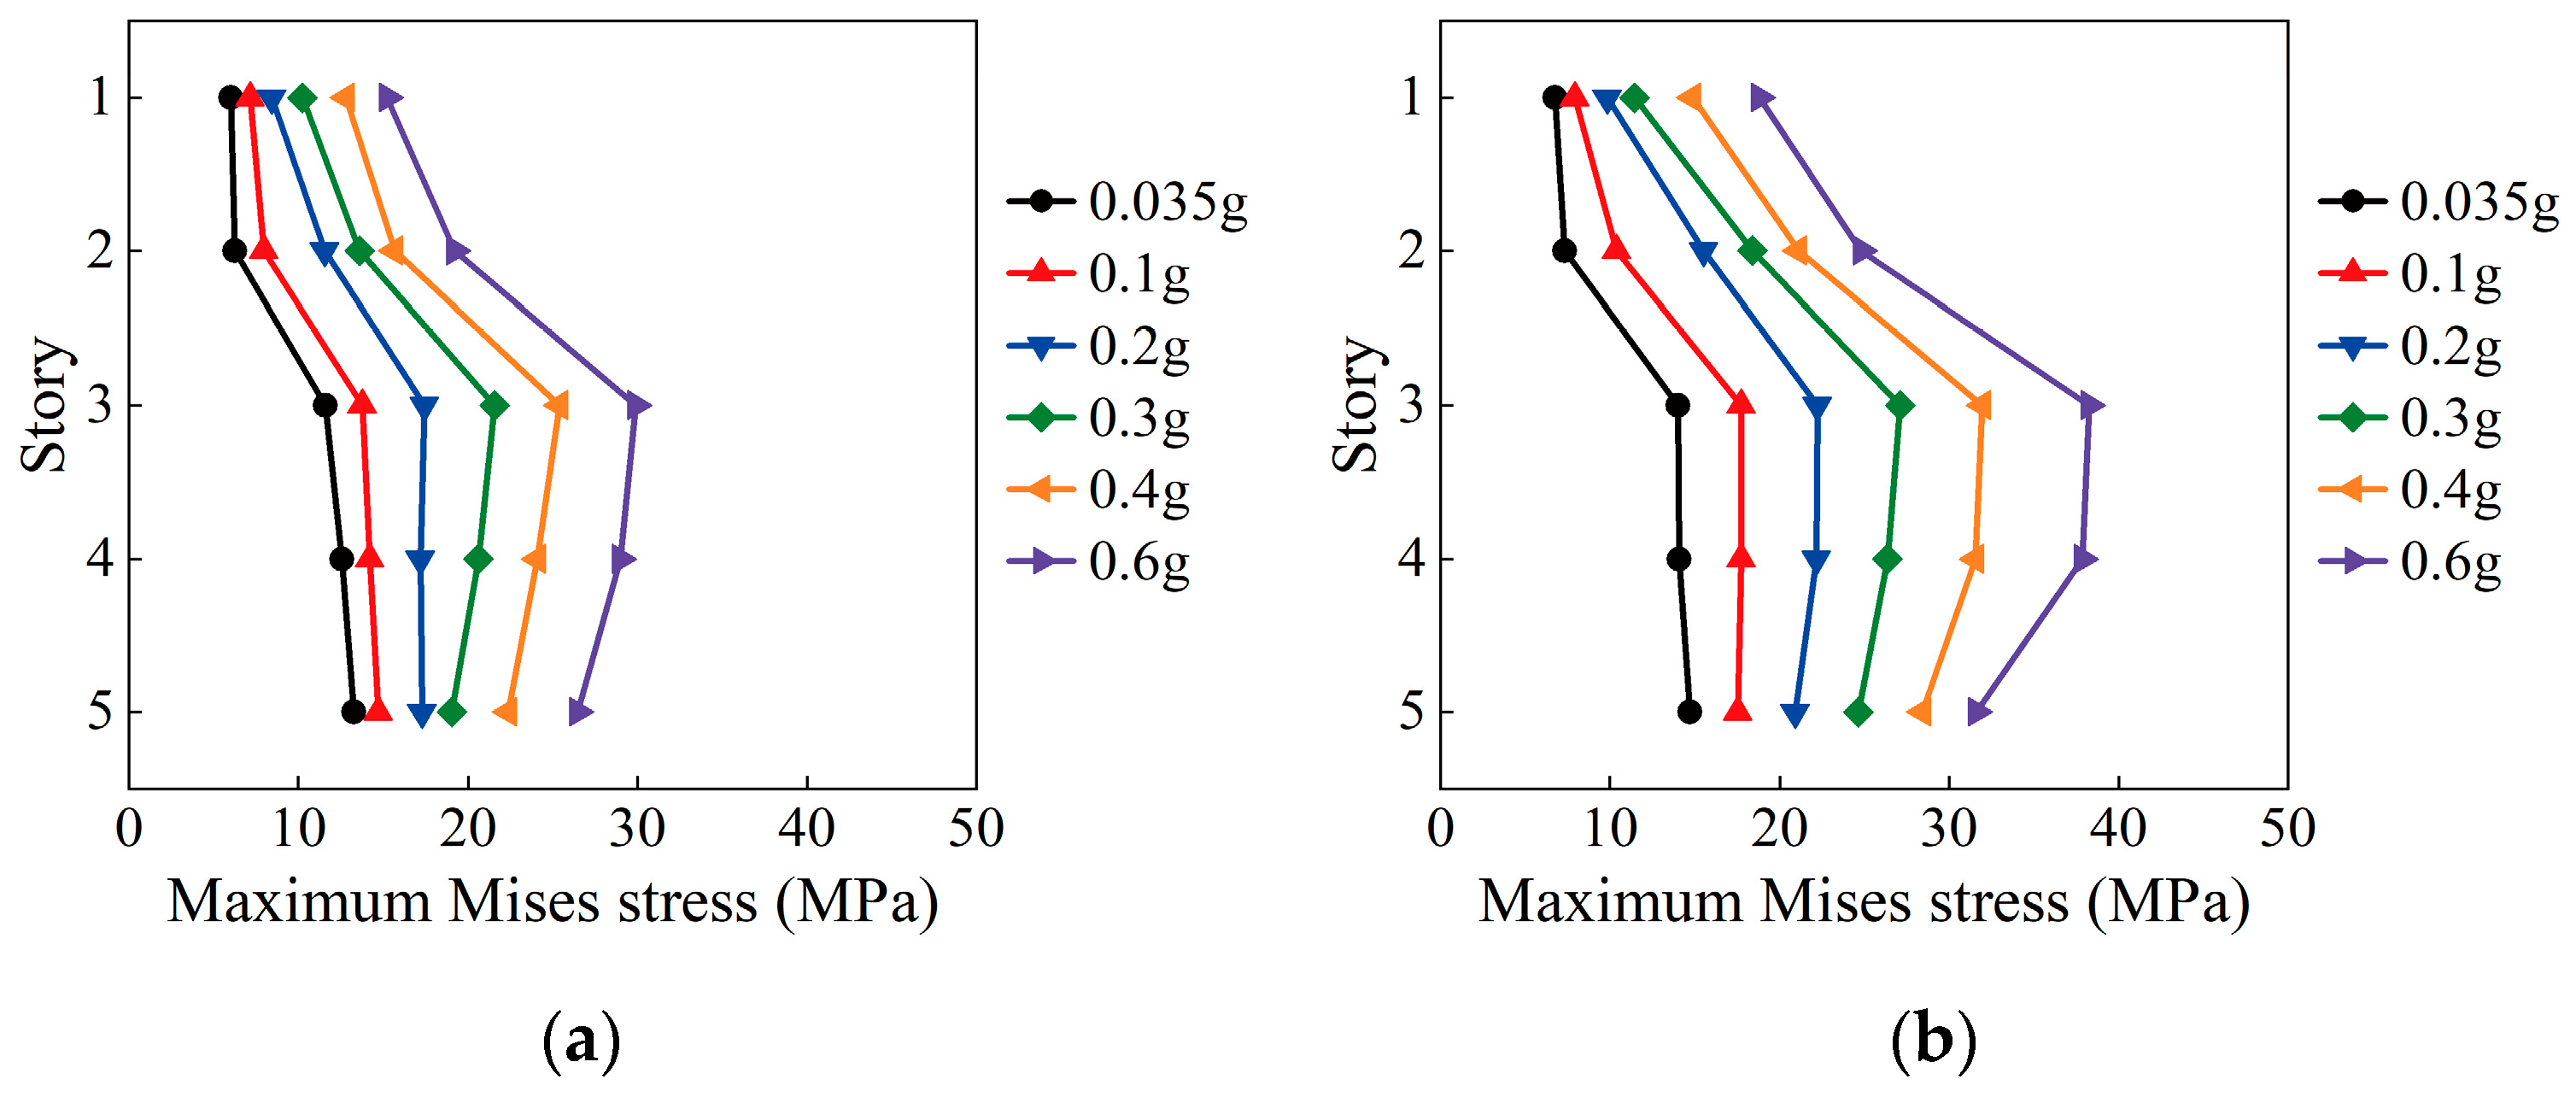
5.2.2. Stress Distribution and Damage Evolution Analysis

To investigate the stress distribution and damage evolution of the underground complex under different PGA inputs, a stress distribution analysis is conducted in this section. The Mises stress nephograms at the moments of maximum stress in the structural concrete are presented in Figure 25 and Figure 26 for the SHW and HKD095 inputs under different PGAs, respectively. The results indicate that the central column of the structure is the location of maximum Mises stress. Under the SHW input, the Mises stress at the column end reaches 13.27 MPa at a peak acceleration of 0.035 g, with the peak stress appearing at the end of the bottom-story column. The Mises stress increases as the input ground motion intensity increases. When the peak acceleration reaches 0.4 g, the peak stress appearing at the end of the third-story column, with the Mises stress reaching 25.38 MPa, exceeds the design axial compressive strength of C45 concrete, which is 21.1 MPa [49]. At a peak acceleration of 0.6 g, the Mises stress at the column end further increases to 29.88 MPa, surpassing the standardized axial compressive strength value of C45 concrete, which is 29.6 MPa [49]. The stress distribution characteristics of the structure under HKD095 are similar to those under SHW; however, the stress amplitudes under HKD095 are higher than those under SHW for the same PGA levels.
Figure 27 shows the peak Mises stresses at the ends of the central columns in each story under different PGA levels. The Mises stress in the central columns of the lower three stories is significantly higher than in the upper two. At a PGA of 0.035 g, the peak Mises stress in the central column appeared at the bottom story. As PGA increases, the stress response in the third and fourth stories rises significantly. This suggests that under strong seismic excitation, the third and fourth stories may sustain more severe damage than the bottom story. The central column stress under SHW is higher than that under the far-field long-period ground motion HKD095. At a PGA of 0.6 g, the peak Mises stresses in central columns under HKD095 are 1.28 times those under the Shanghai artificial wave.
In this section, the damage evolution of the underground complex structure is analyzed using the concrete compressive damage factor [50,51]. Based on the Mises stress distribution results described above, Figure 28 illustrates the damage evolution process of the underground complex at typical moments under seismic action, using case HKD095 with PGA = 0.4 g as an example. In this analysis, the compressive damage factor (DAMAGEC > 0) is taken as the criterion for identifying damage occurrence in the structure. Before the input of the seismic wave, the compressive damage factor in each region of the structure is zero. At t = 70 s, slight compressive damage first appears at the end of the bottom-story columns. At t = 90 s, more significant compressive damage is observed at the ends of the columns from the second to fifth stories, the base of the bottom-story side walls, and the slab edges of the third story. At t = 132.32 s, which corresponds to the moment of maximum horizontal deformation, the degree of compressive damage in these regions further increases, and compressive damage also occurs at the slab edges from the second to fourth stories, the tops of the top-story columns, and the connections between the side walls and the third-story slab. At this moment, the maximum value of the compressive damage factor at the ends of the third-story columns reaches 0.79. At t = 150 s, due to the continued effect of ground motion, both the extent and the degree of damage expand further. At t = 300 s, which corresponds to the end of the seismic motion, compressive damage occurs at the connections between the side walls and the second to fourth stories. Meanwhile, severe compressive damage is observed at the ends of the columns on the third and fourth stories. At this time, the maximum compressive damage factor appears at the bottom of the third-story columns, reaching 0.92. Compared with the HKD095 condition, the maximum compressive damage factor of the structure under SHW, with PGA = 0.4 g, is only 0.65. Therefore, the extent of damage in the underground complex under the far-field long-period ground motion HKD095 is significantly greater than that under the Shanghai artificial wave.

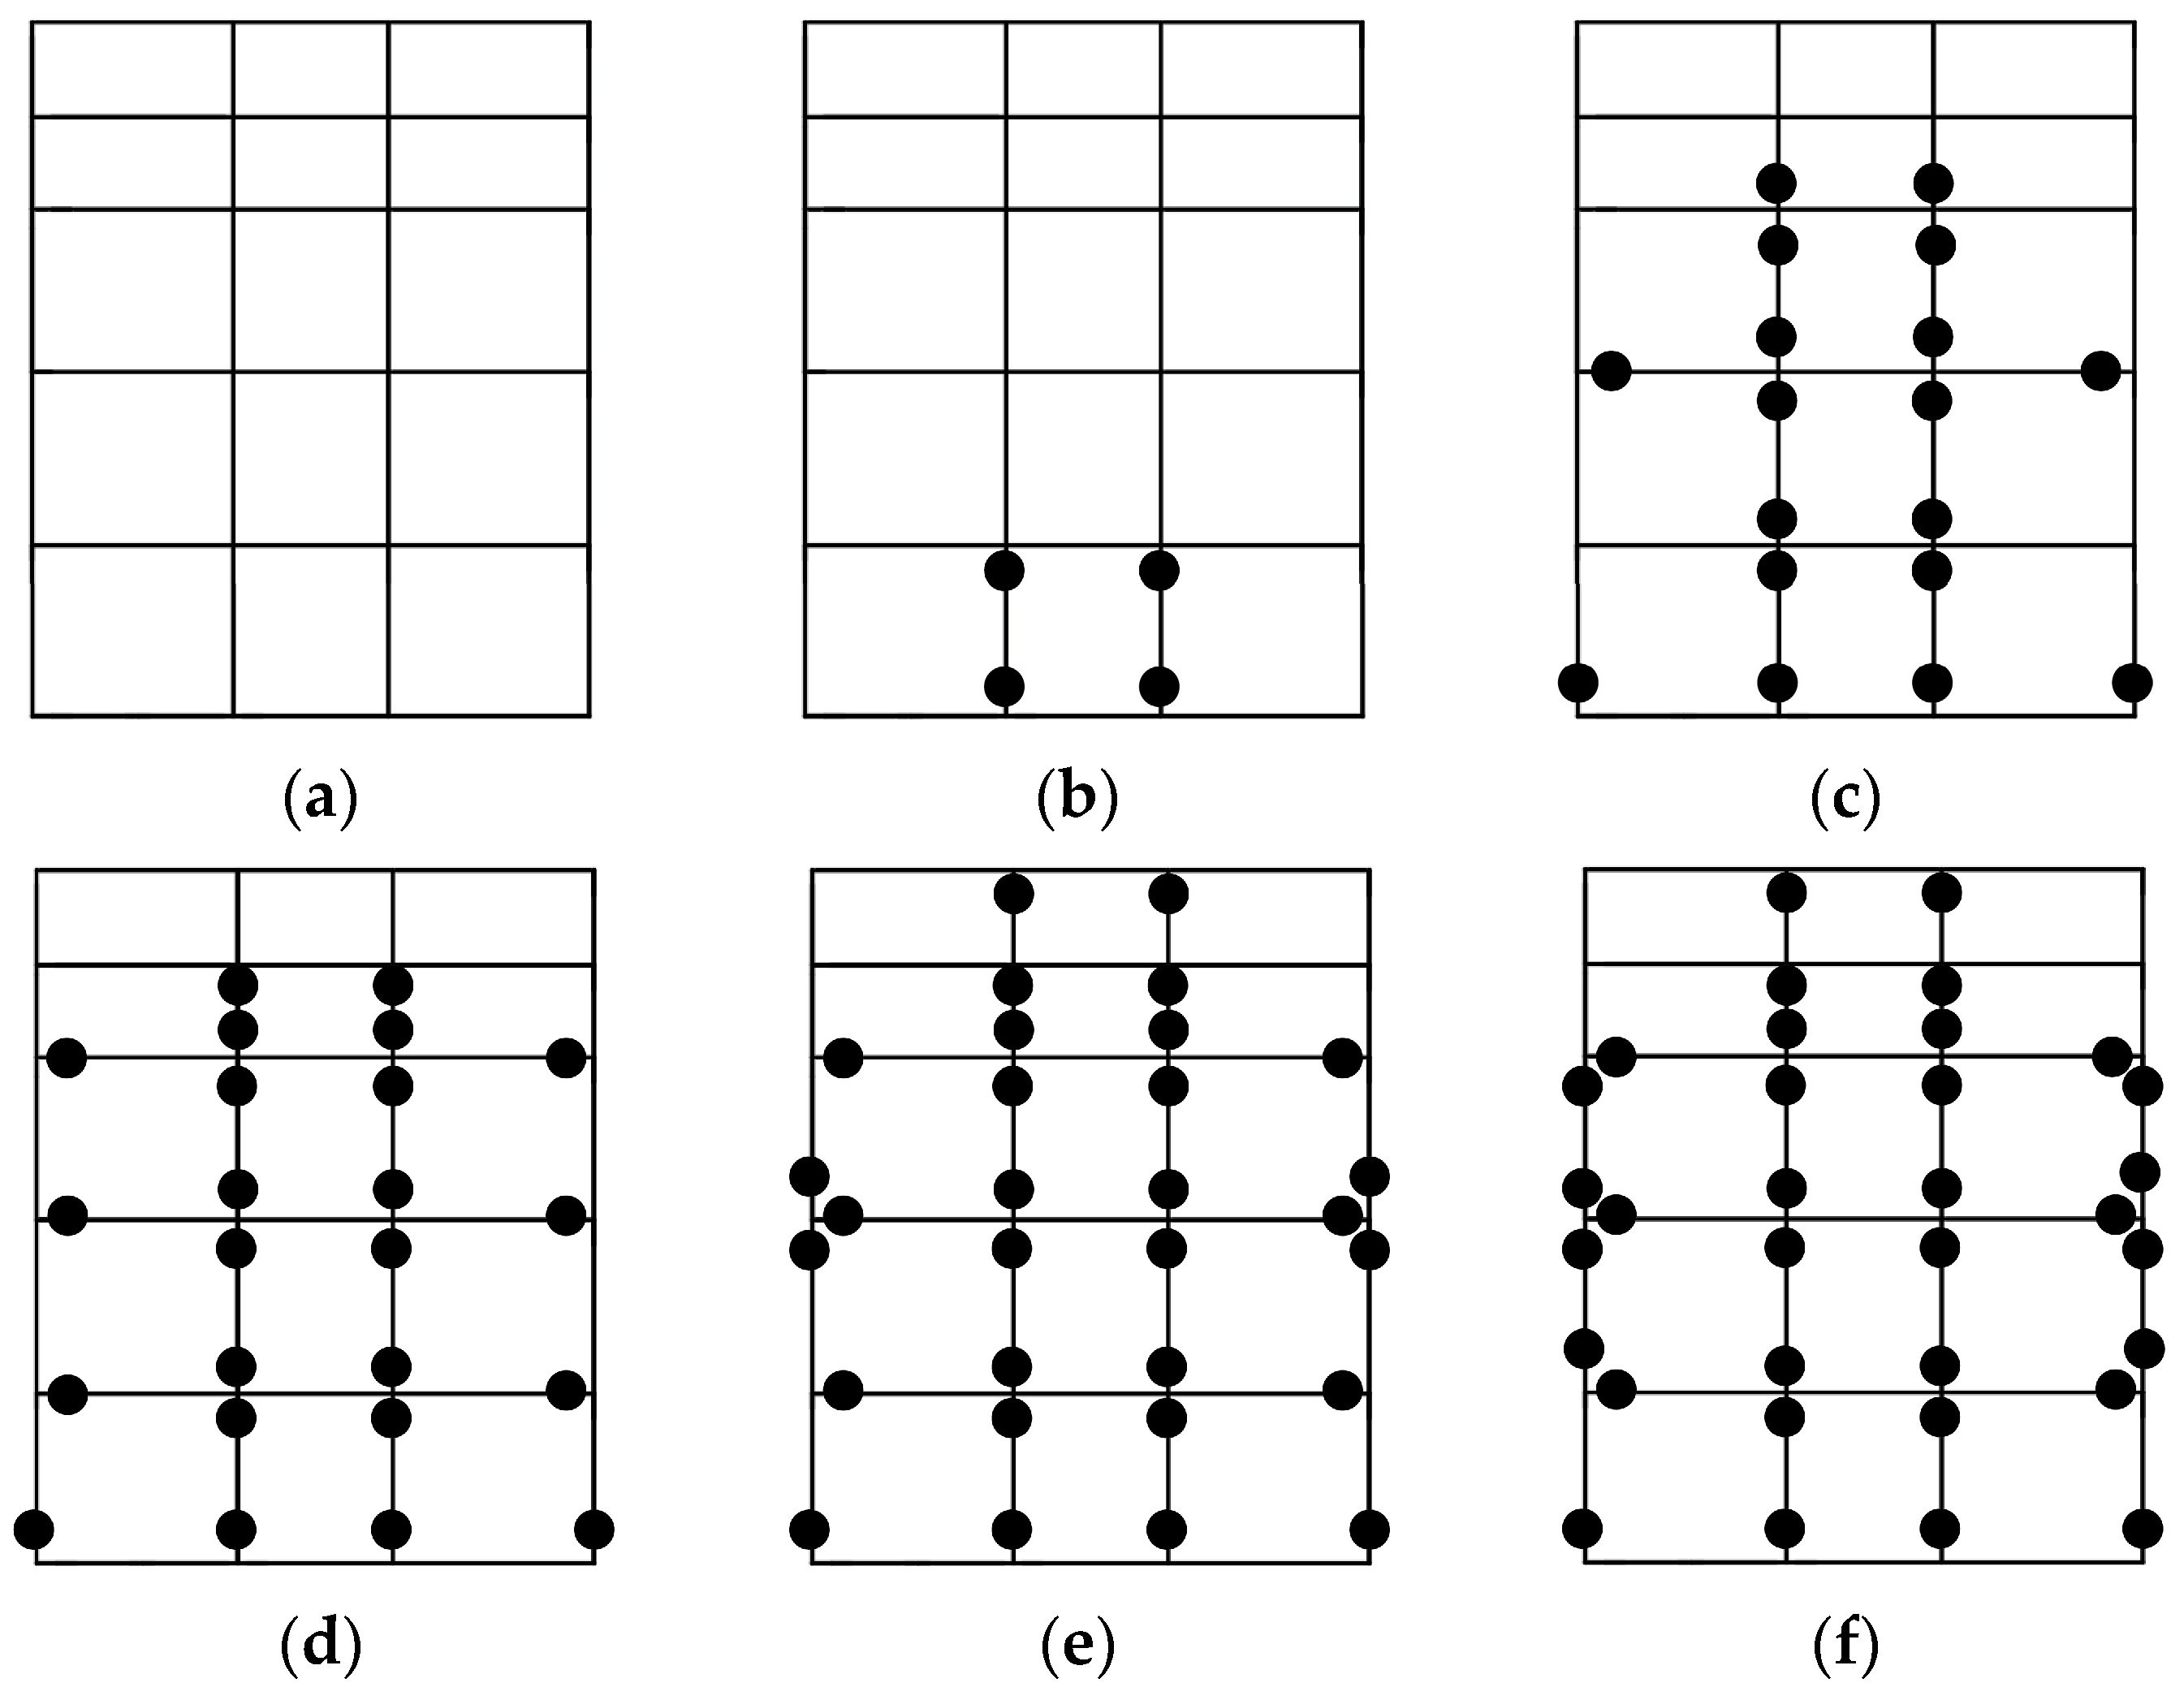
5.2.3. Development Process of Plastic Damage in the Structure

Based on the results of the preceding analysis, this section summarizes the development of plastic damage in the underground complex. The process of plastic damage development is illustrated in Figure 29. As shown in the figure, plastic damage mainly occurs at the column-to-slab and wall-to-slab connections. For the five-story and three-span underground complex examined in this paper, damage first appears at the ends of the bottom-story columns. This is followed by damage at the column ends on the upper stories, the base of the bottom-story side walls, and the third-story slab edges. With increasing seismic input energy, damage in these areas intensifies. Meanwhile, plastic damage also occurs at the edges of the slabs from the second to fourth stories and at the connections between the side walls and the third-story slabs. Finally, damage develops at the connections between the side walls and the slabs from the third to fourth stories.
During the development of the damage zones in the underground complex, plastic damage is most significant in the central column. Therefore, special attention should be given to the seismic performance of the central column in structural seismic design. In addition, plastic damage is concentrated in abrupt stiffness change zones, such as the column-to-slab and wall-to-slab connections. These critical connections should be thoroughly evaluated during seismic design. Moreover, the damage mechanism is closely related to the spatial configuration of the structure. In this example, the lower three stories experience greater displacement than the upper two, and the associated damage to columns, walls, and slabs is also more severe. Therefore, the impact of structural configuration on overall seismic performance should be carefully considered in structural design.

6. Conclusions

In this paper, systematic shaking table tests were designed and conducted on both the free field and the soil–underground complex interaction system. The time–frequency evolution characteristics of the free field response under various seismic motions were investigated. The seismic response behavior and damage mechanism of the underground complex were comprehensively analyzed by integrating shaking table tests with numerical simulations. The main conclusions are as follows:
(1)
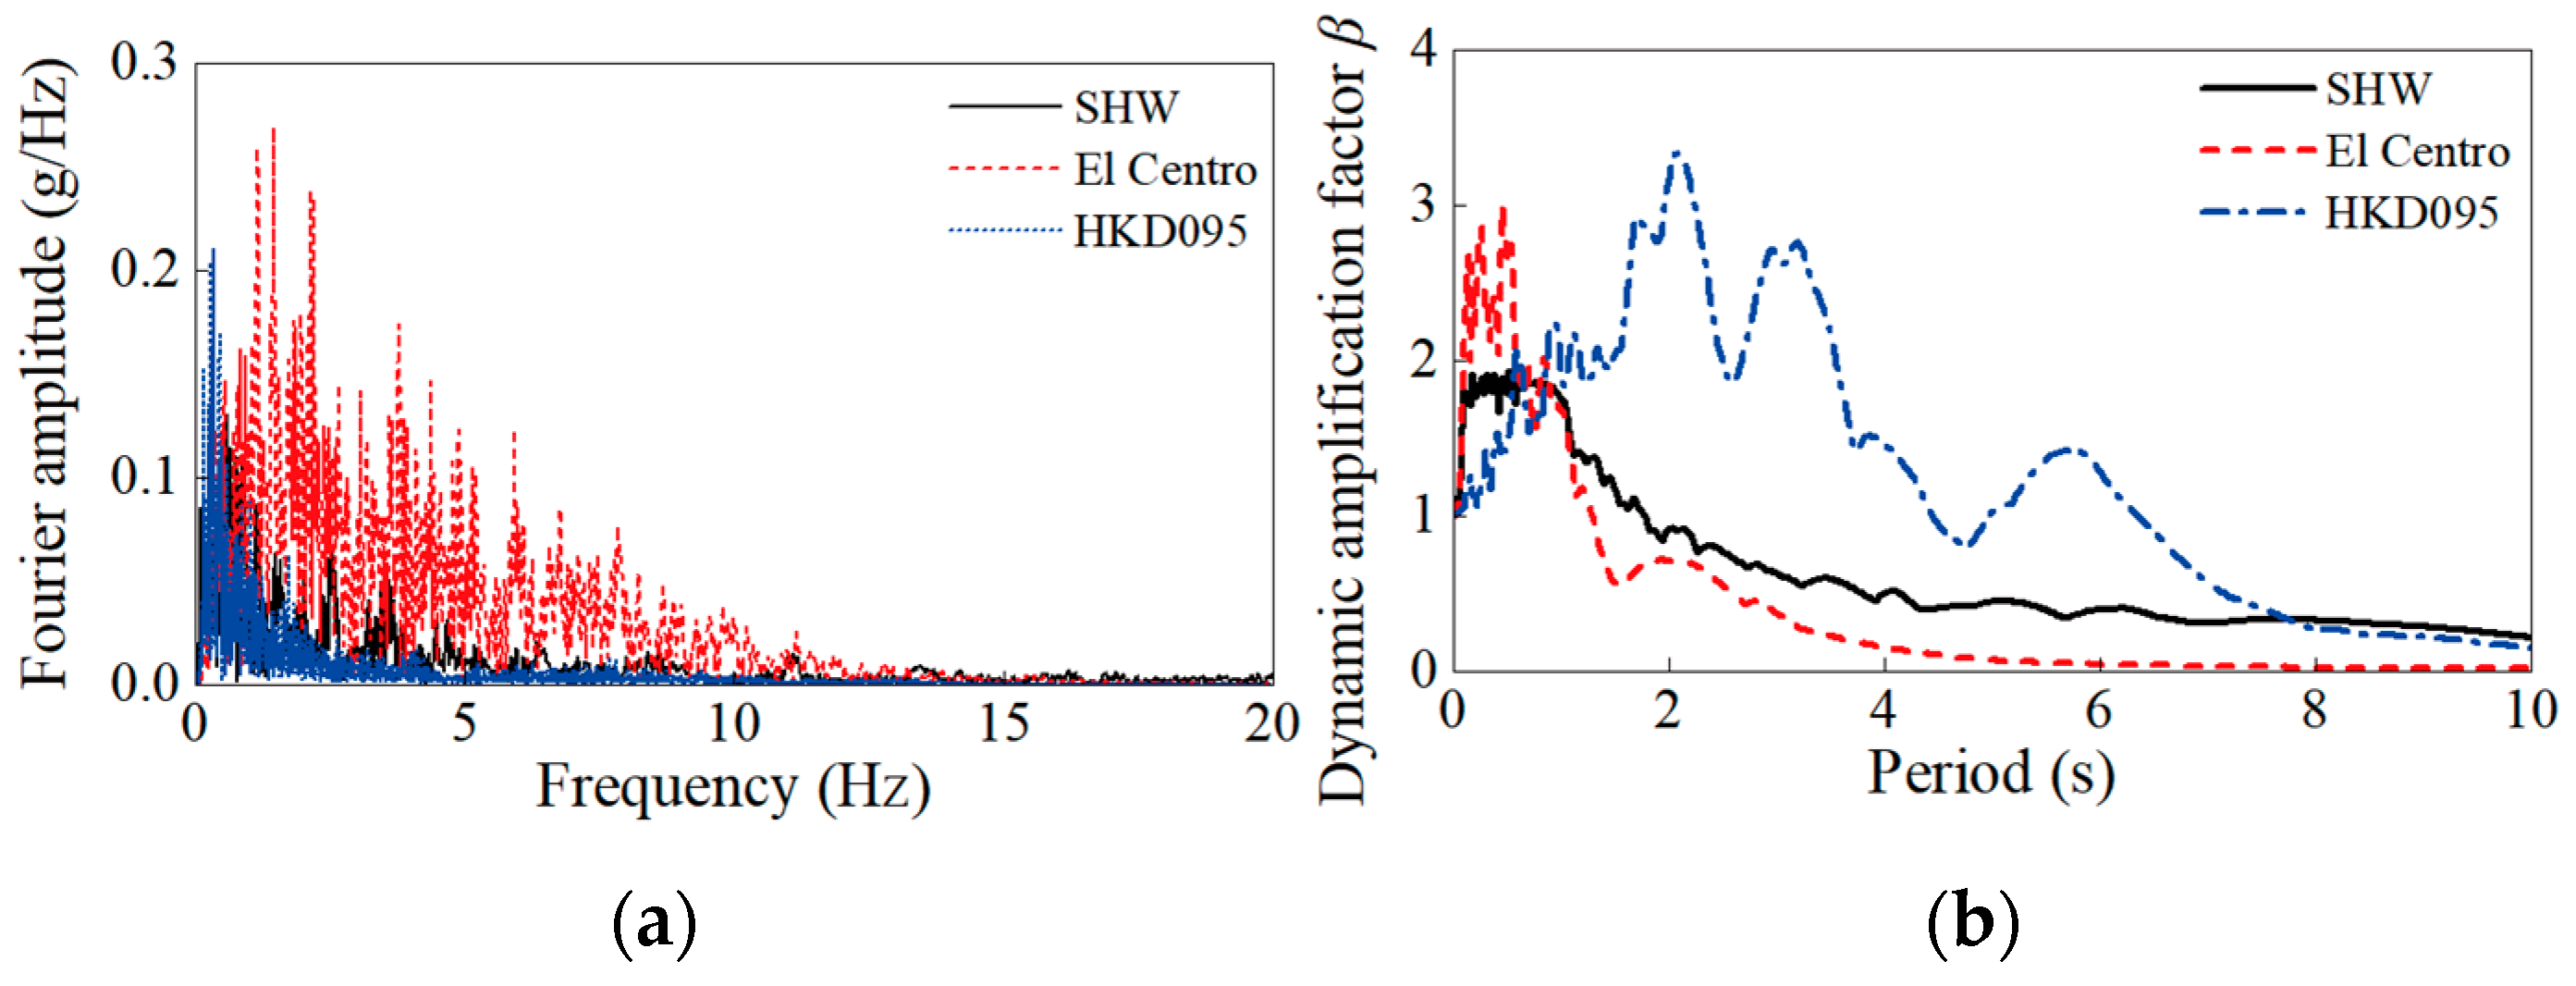
The acceleration amplification factor, response spectrum, and time–frequency evolution characteristics of the soft soil under the Shanghai artificial wave are similar to those under El Centro but differ notably from the far-field long-period ground motion HKD095. The peak time–frequency spectral energy under HKD095 reaches 1.66 times that of the Shanghai artificial wave. The time–frequency evolution of the soft soil indicates that the soft soil site exhibits a more significant energy amplification effect under far-field long-period seismic motions.
(2)
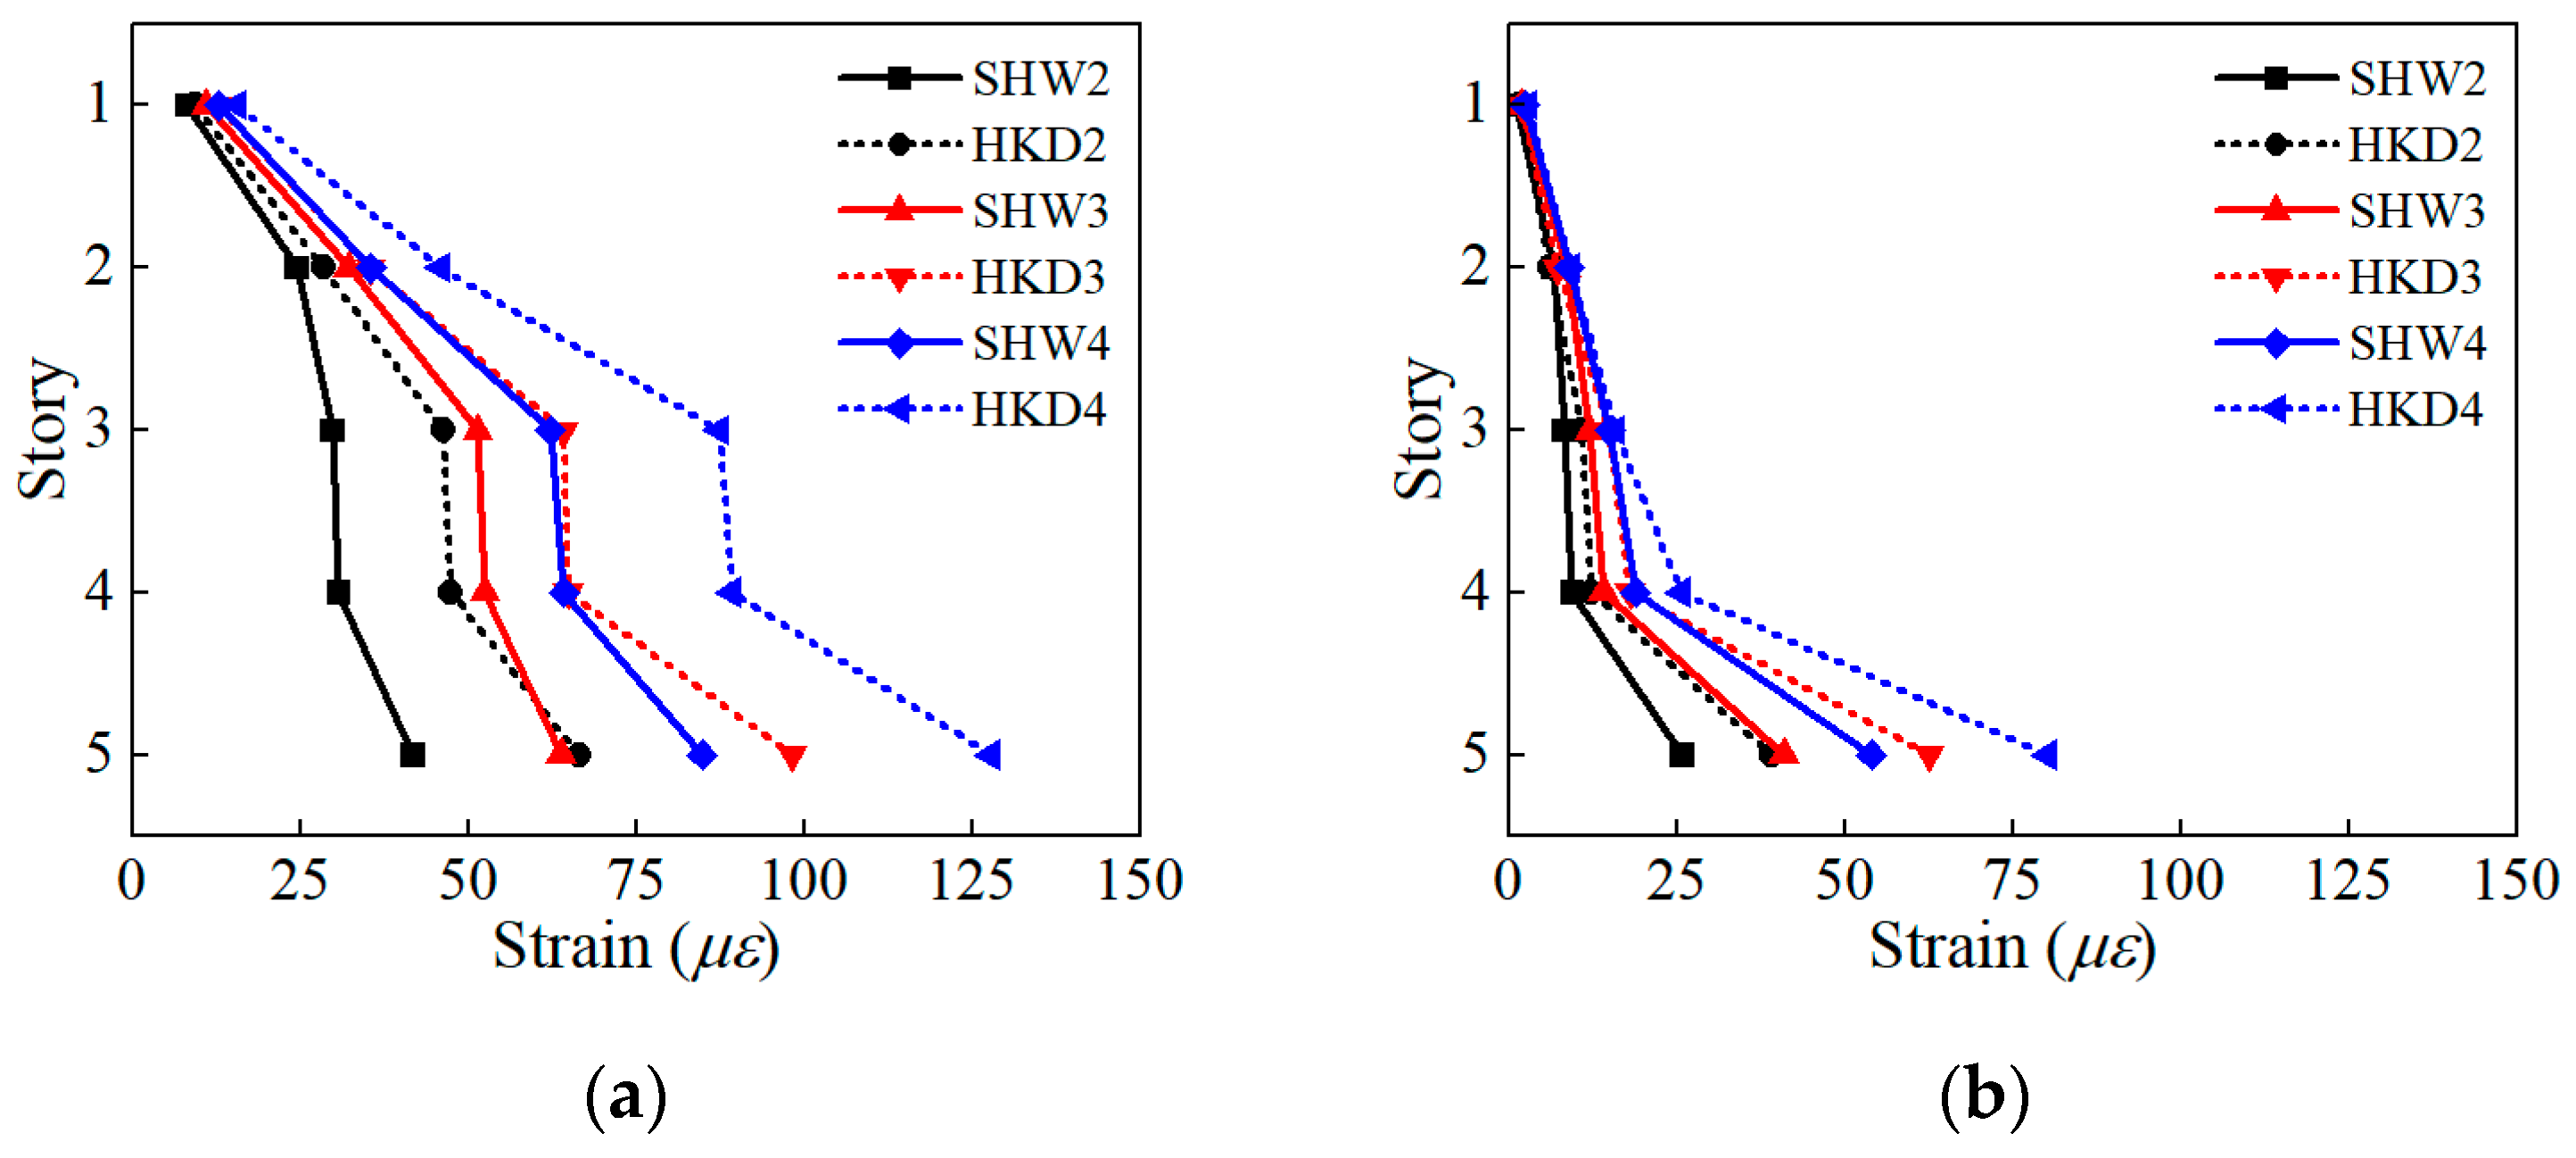
The acceleration amplification factors of the underground complex and surrounding soil are generally consistent, except for localized discrepancies. This indicates that the structural seismic response is primarily governed by the surrounding soil’s confinement effect, while localized extrusion and separation may occur at the soil–structure interface. The seismic deformation of the underground complex is dominated by shear behavior, with greater horizontal deformation under HKD095 than under the Shanghai artificial wave.
(3)
Plastic damage is primarily concentrated at the column-to-slab and wall-to-slab connections, where abrupt stiffness changes are located. Under strong seismic excitation, it first initiates at bottom-story column ends and then extends to these connections. For the five-story and three-span underground complex examined in this paper, the structural plastic damage progresses as follows: (i) ends of bottom-story columns, (ii) ends of columns from the second to fifth stories, base of bottom-story sidewalls and edges of third-story slabs, (iii) edges of second- to fourth-story slabs, and (iv) wall-to-slab connections from the third to fourth stories.
(4)
Under various types of seismic motions, the time–frequency evolution of the free field site response, structural deformation, stress distribution, and damage evolution of the underground complex all indicate that the response of the soft soil site and the structure under the far-field long-period seismic motion is significantly greater than that under the Shanghai artificial wave. Therefore, how to ensure the seismic safety of major engineering structures in soft soil sites under far-field strong seismic motions still requires further research in seismic design.

Author Contributions

Conceptualization, Q.C., Y.L. and X.C.; methodology, Q.C., Y.L. and X.C.; software, Y.L.; validation, Y.L.; formal analysis, Y.L. and X.C.; investigation, Y.L., C.L. and X.C.; writing—original draft preparation, Y.L. and X.C.; writing—review and editing, Q.C., Y.L. and X.C.; supervision, Q.C. and X.C. All authors have read and agreed to the published version of the manuscript.

Funding

This research was funded by the Basic Research Project of State Key Laboratory of Ministry of Science and Technology (Grant No. SLDRCE19A-02).

Data Availability Statement

The original contributions presented in this study are included in the article. Further inquiries can be directed to the corresponding author.

Acknowledgments

This research were conducted with the computing resources provided by Tongji University. The authors extend great thanks to the shaking table laboratory of Shanghai Jiao Tong University (SJTU) and Feng Yue for assistance in conducting the shaking table test.

Conflicts of Interest

The authors declare no conflicts of interest.

References

  1. Lu, K.; Zhang, L.; Li, S.; Huang, Y.P.; Ding, X.; Hao, J.N.; Huang, S.Q.; Li, X.J.; Lu, F.; Zhang, H.W. Urban rail transit in china: Progress report and analysis (2015–2023). Urban Rail Transit 2025, 11, 1–27. [Google Scholar] [CrossRef]
  2. Cheng, X.J.; Xu, X.; Hu, Z.N.; Jing, L.P.; Liang, H.A.; Cui, J. Seismic response of a liquefiable site-underground structure system. Buildings 2022, 12, 1751. [Google Scholar] [CrossRef]
  3. Chen, X.; Xiong, Z.M.; Ren, C.H.; Liu, Y. Experimental investigations of the seismic response of a large underground structure at a soft loess site. Buildings 2023, 13, 1710. [Google Scholar] [CrossRef]
  4. Iida, H.; Hiroto, T.; Yoshida, N.; Iwafuji, M. Damage to daikai subway station. Soils Found. 1996, 36, 283–300. [Google Scholar] [CrossRef]
  5. Wang, W.L.; Wang, T.T.; Su, J.J.; Lin, C.H.; Seng, C.R.; Huang, T.H. Assessment of damage in mountain tunnels due to the taiwan chi-chi earthquake. Tunn. Undergr. Space Technol. 2001, 16, 133–150. [Google Scholar] [CrossRef]
  6. Kontoe, S.; Zdravkovic, L.; Potts, D.M.; Menkiti, C.O. Case study on seismic tunnel response. Can. Geotech. J. 2008, 45, 1743–1764. [Google Scholar] [CrossRef]
  7. Yu, H.; Chen, J.; Bobet, A.; Yuan, Y. Damage observation and assessment of the longxi tunnel during the wenchuan earthquake. Tunn. Undergr. Space Technol. 2016, 54, 102–116. [Google Scholar] [CrossRef]
  8. Wu, C.Y.; Lu, D.C.; El Naggar, M.H.; Ma, C.; Li, Q.; Du, X.L. Upgrading seismic performance of underground frame structures based on potential failure modes. Soil Dyn. Earthq. Eng. 2022, 153, 107116. [Google Scholar] [CrossRef]
  9. Lazaridis, P.C.; Kavvadias, I.E.; Demertzis, K.; Iliadis, L.; Vasiliadis, L.K. Structural damage prediction of a reinforced concrete frame under single and multiple seismic events using machine learning algorithms. Appl. Sci. 2022, 12, 3845. [Google Scholar] [CrossRef]
  10. Quan, D.Z.; Chai, S.B.; Wang, Y.L.; Fan, Z.S.; Bu, Y.H. 3-d numerical simulation of seismic response of the induced joint of a subway station. Buildings 2023, 13, 1244. [Google Scholar] [CrossRef]
  11. Yang, J.; Zhuang, H.Y.; Zhang, G.Y.; Tang, B.Z.; Xu, C.J. Seismic performance and fragility of two-story and three-span underground structures using a random forest model and a new damage description method. Tunn. Undergr. Space Technol. 2023, 135, 104980. [Google Scholar] [CrossRef]
  12. Hou, C.; Jin, X.G.; Ge, Y.; He, J. Shaking table test on the seismic response of a frame-type subway station in composite soil. Int. J. Geomech. 2021, 21, 04021220. [Google Scholar] [CrossRef]
  13. Zhuang, H.Y.; Ren, J.W.; Miao, Y.; Jing, L.G.; Yao, E.L.; Xu, C.J. Seismic performance levels of a large underground subway station in different soil foundations. J. Earthq. Eng. 2021, 25, 2808–2833. [Google Scholar] [CrossRef]
  14. Yang, Y.F.; Cao, J.J.; Qu, R.Q.; Xu, Z.G. Numerical simulation of the seismic damage of daikai station based on pushover analyses. Buildings 2023, 13, 760. [Google Scholar] [CrossRef]
  15. Yamato, T.; Umehara, T.; Aoki, H.; Nakamura, S.; Ezaki, J.; Suetomi, I. Damage to daikai subway station of kobe rapid transit system and estimation of its reason during the 1995 hyogoken-nanbu earthquake. Doboku Gakkai Ronbunshu 1996, 1996, 303–320. [Google Scholar] [CrossRef]
  16. Lu, C.C.; Hwang, J.H. Nonlinear collapse simulation of daikai subway in the 1995 kobe earthquake: Necessity of dynamic analysis for a shallow tunnel. Tunn. Undergr. Space Technol. 2019, 87, 78–90. [Google Scholar] [CrossRef]
  17. Nguyen, V.Q.; Nizamani, Z.A.; Park, D.; Kwon, O.S. Numerical simulation of damage evolution of daikai station during the 1995 kobe earthquake. Eng. Struct. 2020, 206, 110180. [Google Scholar] [CrossRef]
  18. An, X.H.; Shawky, A.A.; Maekawa, K. The collapse mechanism of a subway station during the great hanshin earthquake. Cem. Concr. Compos. 1997, 19, 241–257. [Google Scholar] [CrossRef]
  19. Huo, H.; Bobet, A.; Fernández, G.; Ramírez, J. Load transfer mechanisms between underground structure and surrounding ground: Evaluation of the failure of the daikai station. J. Geotech. Geoenviron. Eng. 2005, 131, 1522–1533. [Google Scholar] [CrossRef]
  20. Ma, C.; Lu, D.C.; Du, X.L.; Qi, C.Z.; Zhang, X.Y. Structural components functionalities and failure mechanism of rectangular underground structures during earthquakes. Soil Dyn. Earthq. Eng. 2019, 119, 265–280. [Google Scholar] [CrossRef]
  21. Dong, R.; Jing, L.P.; Li, Y.Q.; Yin, Z.Y.; Wang, G.; Xu, K.P. Seismic deformation mode transformation of rectangular underground structure caused by component failure. Tunn. Undergr. Space Technol. 2020, 98, 103298. [Google Scholar] [CrossRef]
  22. Ma, C.; Lu, D.C.; Du, X.L.; Qi, C.Z. Seismic performance of a rectangular subway station with earth retaining system. Earthq. Eng. Eng. Vib. 2022, 21, 221–236. [Google Scholar] [CrossRef]
  23. Yue, F.; Liu, B.W.; Zhu, B.; Jiang, X.L.; Chen, L.; Liao, K. Shaking table test and numerical simulation on seismic performance of prefabricated corrugated steel utility tunnels on liquefiable ground. Soil Dyn. Earthq. Eng. 2021, 141, 106527. [Google Scholar] [CrossRef]
  24. Chen, Z.; Chen, W.; Li, Y.; Yuan, Y. Shaking table test of a multi-story subway station under pulse-like ground motions. Soil Dyn. Earthq. Eng. 2016, 82, 111–122. [Google Scholar] [CrossRef]
  25. Chen, S.; Zhuang, H.Y.; Qu, D.Z.; Yuan, J.; Zhao, K.; Ruan, B. Shaking table test on the seismic response of large-scale subway station in a loess site: A case study. Soil Dyn. Earthq. Eng. 2019, 123, 173–184. [Google Scholar] [CrossRef]
  26. Yu, H.T.; Yan, X.; Bobet, A.; Yuan, Y.; Xu, G.P.; Su, Q.K. Multi-point shaking table test of a long tunnel subjected to non-uniform seismic loadings. Bull. Earthq. Eng. 2018, 16, 1041–1059. [Google Scholar] [CrossRef]
  27. Yue, C.Z.; Zheng, Y.L.; Deng, S.X. Shaking table test study on seismic performance improvement for underground structures with center column enhancement. J. Earthq. Tsunami 2019, 13, 1950009. [Google Scholar] [CrossRef]
  28. Liu, S.T.; Lu, Z.; Li, P.Z.; Ding, S.W.; Wan, F. Shaking table test and numerical simulation of eddy-current tuned mass damper for structural seismic control considering soil-structure interaction. Eng. Struct. 2020, 212, 110531. [Google Scholar] [CrossRef]
  29. DGJ08-9-2013; Code for Seismic Design of Buildings. Tongji University Press: Shanghai, China, 2013.
  30. Wang, J.N.; Yang, J.; Zhuang, H.Y.; Ma, G.W.; Sun, Y.J. Seismic responses of a large unequal-span underground subway station in liquefiable soil using shaking table test. J. Earthq. Eng. 2022, 26, 8446–8467. [Google Scholar] [CrossRef]
  31. Kramer, S.L.; Stewart, J.P. Geotechnical Earthquake Engineering; CRC Press: Boca Raton, FL, USA, 2024; pp. 368–370. [Google Scholar] [CrossRef]
  32. Li, X.J.; Pan, D.G.; Huang, Y.; Cheng, Y.; Fu, X.Q. Shaking table test and numerical simulation of free field in sand-sawdust mixed soil. Soil Dyn. Earthq. Eng. 2023, 165, 107707. [Google Scholar] [CrossRef]
  33. ABAQUS Inc. Abaqus Analysis User’s Guide; ABAQUS 6.14 HTML Documentation; ABAQUS Inc.: Palo Alto, CA, USA, 2014. [Google Scholar]
  34. Martin, P.P.; Seed, H.B. One-dimensional dynamic ground response analyses. J. Geotech. Eng.-Asce 1982, 108, 935–952. [Google Scholar] [CrossRef]
  35. Li, W.T.; Chen, Q.J. Effect of vertical ground motions and overburden depth on the seismic responses of large underground structures. Eng. Struct. 2020, 205, 110073. [Google Scholar] [CrossRef]
  36. Chen, Q.J.; Hong, N.; Zhang, T.Y.; Zhao, Z.P. Experiment-based performance evaluation framework for isolated structures in underground subway station-soil-aboveground structure interaction system under seismic excitations. J. Build. Eng. 2022, 56, 104790. [Google Scholar] [CrossRef]
  37. Qiu, D.P.; Wang, P.; Ren, W.J.; Chen, J.Y.; Zhao, C.F. Seismic responses and failure mechanism of the superstructure-integrated underground structure considering the seismic aboveground-underground interaction. Soil Dyn. Earthq. Eng. 2023, 175, 108259. [Google Scholar] [CrossRef]
  38. Wu, W.F.; Ge, S.P.; Yuan, Y.; Ding, W.Q.; Anastasopoulos, I. Seismic response of subway station in soft soil: Shaking table testing versus numerical analysis. Tunn. Undergr. Space Technol. 2020, 100, 103389. [Google Scholar] [CrossRef]
  39. Xu, C.S.; Zhang, Z.H.; Li, Y.; Du, X.L. Validation of a numerical model based on dynamic centrifuge tests and studies on the earthquake damage mechanism of underground frame structures. Tunn. Undergr. Space Technol. 2020, 104, 103538. [Google Scholar] [CrossRef]
  40. Yan, G.Y.; Xu, C.S.; Zhang, Z.H.; Du, X.L.; Wang, X.L. Numerical analysis on seismic performance of underground structures in liquefiable interlayer sites from centrifuge shaking table test. Earthq. Eng. Eng. Vib. 2024, 23, 781–798. [Google Scholar] [CrossRef]
  41. Zhuang, H.Y.; Hu, Z.N.; Wang, X.L.; Chen, G.X. Seismic responses of a large underground structure in liquefied soils by fem numerical modelling. Bull. Earthq. Eng. 2015, 13, 3645–3668. [Google Scholar] [CrossRef]
  42. Cui, Z.D.; Zhang, L.J.; Hou, C.Y. Seismic behavior of subway station in the soft clay field before and after freeze-thaw cycle. Soil Dyn. Earthq. Eng. 2023, 175, 108222. [Google Scholar] [CrossRef]
  43. Chen, Q.J.; Zhang, T.Y.; Hong, N.; Huang, B. Seismic performance of a subway station-tunnel junction structure: A shaking table investigation and numerical analysis. KSCE J. Civ. Eng. 2021, 25, 1653–1669. [Google Scholar] [CrossRef]
  44. DG/TJ08-2064-2022; Standard for Seismic Design of Subway Structure. Tongji University Press: Shanghai, China, 2022.
  45. Lee, J.H.; Fenves, G.L. Plastic-damage model for cyclic loading of concrete structures. J. Eng. Mech.-ASCE 1998, 124, 892–900. [Google Scholar] [CrossRef]
  46. Chopra, A.K.; Chintanapakdee, C. Inelastic deformation ratios for design and evaluation of structures: Single-degree-of-freedom bilinear systems. J. Struct. Eng. 2004, 130, 1309–1319. [Google Scholar] [CrossRef]
  47. Wang, Y.C.; Chen, Q.J. Parametric fitting of soft soil sites’ davidenkov model based on pso algorithm and its application. J. Vib. Shock. 2019, 38, 8–16. [Google Scholar] [CrossRef]
  48. Chen, Q.J.; Chen, X.; Zhao, Z.P. Simulation of near-fault pulse-like ground motion and investigation of seismic response characteristics in subway stations. J. Earthq. Eng. 2024, 28, 3648–3680. [Google Scholar] [CrossRef]
  49. GB50010-2010; Code for Design of Concrete Structures. China Architecture & Building Press: Beijing, China, 2010.
  50. Zhuang, H.Y.; Zhao, C.; Chen, S.; Fu, J.S.; Zhao, K.; Chen, G.X. Seismic performance of underground subway station with sliding between column and longitudinal beam. Tunn. Undergr. Space Technol. 2020, 102, 103439. [Google Scholar] [CrossRef]
  51. Wei, S.M.; Wang, C.; Cui, Z.D.; Liang, F.Y.; Qin, T.X. Seismic behavior of a shallow underground station with internal soil erosion. Eng. Struct. 2025, 328, 119706. [Google Scholar] [CrossRef]
Figure 1. G / G max γ curves and ξ γ curves of the model soil.
Buildings 15 02380 g001
Figure 2. Underground complex model: (a) model structure; (b) cross-section of the model structure.
Buildings 15 02380 g002
Figure 3. Model layout and sensor scheme: (a) tests on the free field; (b) tests on the soil–underground complex interaction system.
Buildings 15 02380 g003
Figure 4. The experimental configuration for the soil–underground complex interaction system: (a) sensor layout of the model structure; (b) test site layout.
Buildings 15 02380 g004
Figure 5. Acceleration time histories of seismic motions: (a) Shanghai artificial wave SHW; (b) El Centro; (c) HKD095.
Buildings 15 02380 g005
Figure 6. Fourier amplitude spectra and response spectra of seismic motions: (a) Fourier amplitude spectra; (b) response spectra.
Buildings 15 02380 g006
Figure 7. Verification of boundary effects and experimental validity: (a) acceleration time histories of AS1, AS5, and AS8 in test case EL4; (b) experimental results and theoretical solution of the transfer function.
Buildings 15 02380 g007
Figure 8. Acceleration magnification factor (AMF) of the model soil: (a) PGA = 0.2 g; (b) PGA = 0.3 g; (c) PGA = 0.4 g.
Buildings 15 02380 g008
Figure 9. Acceleration response spectra of the model soil: (a) SHW4; (b) EL4; (c) HKD4.
Buildings 15 02380 g009
Figure 10. Time-frequency spectra of the model soil: (a) SHW4; (b) EL4; (c) HKD4.
Buildings 15 02380 g010
Figure 11. Acceleration magnification factor of the model structure and surrounding soil: (a) PGA = 0.2 g; (b) PGA = 0.3 g; (c) PGA = 0.4 g.
Buildings 15 02380 g011
Figure 12. Peak strain values of the model structure: (a) Column bottom at each story of the structure; (b) wall bottom at each story of the structure.
Buildings 15 02380 g012
Figure 13. Finite element model of the soil–underground complex interaction system based the experiments: (a) layout of the models; (b) the model soil; (c) the underground complex model; (d) the soil–structure interaction system; (e) boundary condition changing process.
Buildings 15 02380 g013
Figure 14. Comparison of acceleration time histories between numerical simulation and test records of the soil surface: (a) SHW4; (b) HKD4.
Buildings 15 02380 g014
Figure 15. Comparison of acceleration time histories between numerical simulation and test records of the model structure in case SHW4: (a) measurement point AU1; (b) measurement point AU4; (c) measurement point AU6.
Buildings 15 02380 g015
Figure 16. Comparison of acceleration time histories between numerical simulation and test records of the model structure in case HKD4: (a) measurement point AU1; (b) measurement point AU4; (c) measurement point AU6.
Buildings 15 02380 g016
Figure 17. Relative error of the peak acceleration response between the experimental and numerical results.
Buildings 15 02380 g017
Figure 18. Deformation and Mises stress nephograms of the model structure in case HKD4: (a) horizontal deformation nephogram (deformation scale factor = 100, unit: m); (b) Mises stress nephogram (unit: Pa).
Buildings 15 02380 g018
Figure 19. Engineering overview of the underground complex: (a) cross-section of the underground complex; (b) soil stratification of the site.
Buildings 15 02380 g019
Figure 20. Stress–strain curve and damage factors of the C45 concrete: (a) uniaxial compression; (b) uniaxial tension.
Buildings 15 02380 g020
Figure 21. Finite element model of the soil–underground complex interaction system: (a) the underground complex; (b) the layout of reinforcement; (c) the soil–structure interaction system.
Buildings 15 02380 g021
Figure 22. Deformation of the underground complex under SHW (deformation amplification factor = 100): (a) t = 4 s; (b) t = 8 s; (c) t = 12 s; (d) t = 15.14 s (moment of maximum deformation); (e) t = 16 s; (f) t = 20 s. (unit: m).
Buildings 15 02380 g022
Figure 23. Deformation of the underground complex under HKD095 (deformation amplification factor = 100): (a) t = 30 s; (b) t = 60 s; (c) t = 90 s; (d) t = 120 s; (e) t = 132.32 s (moment of maximum deformation); (f) t = 150 s. (unit: m).
Buildings 15 02380 g023
Figure 24. Horizontal relative displacement of each story of the underground complex relative to the bottom slab: (a) SHW; (b) HKD095.
Buildings 15 02380 g024
Figure 25. The Mises stress nephogram of the structure at the moment of peak stress under SHW: (a) PGA = 0.035 g; (b) PGA = 0.2 g; (c) PGA = 0.4 g; (d) PGA = 0.6 g.
Buildings 15 02380 g025
Figure 26. The Mises stress nephogram of the structure at the moment of peak stress under HKD095: (a) PGA = 0.035 g; (b) PGA = 0.2 g; (c) PGA = 0.4 g; (d) PGA = 0.6 g.
Buildings 15 02380 g026
Figure 27. The peak Mises stresses at the ends of the central columns: (a) SHW; (b) HKD095.
Buildings 15 02380 g027
Figure 28. Structural concrete compression damage factor nephogram under HKD095: (a) t = 0 s; (b) t = 70 s; (c) t = 90 s; (d) t = 132.32 s; (e) t = 150 s; (f) t = 300 s.
Buildings 15 02380 g028
Figure 29. The development process of plastic damage in the underground complex: (a) initial state before earthquake; (b) state i; (c) state ii; (d) state iii; (e) state iv; (f) state v.
Buildings 15 02380 g029
Table 1. Similarity ratios of the model structure and the model soil.
TypePhysical QuantitySymbolSimilarity Ratio
Geometry propertiesLength S l 0.02
Material properties of the model structureStrain S ε 1
Elastic modulus S E 0.1
Stress S σ = S E 0.1
Density S ρ = S σ / S a · S l 2.5
Mass S m = S σ · S l 2 / S a 2 × 10⁻⁵
Material properties of the model soilShear modulus S G 0.0147
Density S ρ 0.368
LoadingLinear load S q = S σ · S l 2 × 10⁻³
Area load S p = S σ 0.1
Dynamic propertiesDuration S T = S l 0.5 · S a 0.5 0.1
Frequency S f = S l 0.5 · S a 0.5 10
Velocity S v = S l · S a 0.5 0.2
Acceleration S a 2
Table 2. Test cases for the shaking table tests.
Test No.Ground MotionPeak Acceleration (g)Test No.Ground MotionPeak Acceleration (g)
WN1White noise0.05HKD3HKD0950.3
EL2El Centro0.2WN3White noise0.05
SHW2SHW0.2EL4El Centro0.4
HKD2HKD0950.2SHW4SHW0.4
WN2White noise0.05HKD4HKD0950.4
EL3El Centro0.3WN4White noise0.05
SHW3SHW0.3
Table 3. Material parameters of the concrete.
Concrete Strength GradeElastic Modulus (GPa)Poisson’s RatioDensity (kg/m3)Dilatancy AngleInitial Compression
Yield Stress (MPa)
Limited Compression Yield Stress (MPa)Limited Tensile Stress (MPa)
C3531.50.15240030°19.8532.053.01
C4533.50.15240030°23.1739.823.38
Table 4. Material parameters of the soft soil site.
Soil LayerDepth (m)Soil PropertyDensity (kg/m3)Shear Wave Velocity (m/s)Poisson’s Ratio
S11.00Miscellaneous fill1890740.40
S26.40Silty clay1850870.35
S317.66Muddy silty clay18301100.38
S444.06Silty clay18202200.35
S551.46Clay20401950.35
S670.00Silty fine sand19352250.30
Disclaimer/Publisher’s Note: The statements, opinions and data contained in all publications are solely those of the individual author(s) and contributor(s) and not of MDPI and/or the editor(s). MDPI and/or the editor(s) disclaim responsibility for any injury to people or property resulting from any ideas, methods, instructions or products referred to in the content.

