Article

Towards Selecting an Optimal Bonding Test Method for Rebar–Concrete: Comparison Between Pull-Out Test and Full-Beam Test

School of Architecture Engineering, Xi’an Technological University, No. 2 Xuefuzhonglu Road, Weiyang District, Xi’an 710021, China
*
Author to whom correspondence should be addressed.
Buildings 2025, 15(13), 2375; https://doi.org/10.3390/buildings15132375
Submission received: 28 April 2025 / Revised: 5 June 2025 / Accepted: 10 June 2025 / Published: 7 July 2025

Abstract

There are many methods for evaluating the bond behavior between rebar and concrete. For certain experimental purposes, selecting the ideal method for testing the rebar–concrete bonding properties is often a controversial problem. The most representative single-end pull-out test method and the full-beam test method were applied in this work to conduct bonding tests between rebar and concrete. Considering the influence of the concrete strength, bonding length, stirrup, and rebar slotting, these two testing strategies are compared and analyzed in terms of the specimen failure mode, bonding strength, bond–slip curve, and rebar stress distribution. Suggestions are offered regarding the selection of an appropriate method for evaluating the bond behavior between rebar and concrete based on an comparative analysis of the two tested approaches. The results presented herein provide a basis for the preparation of relevant test method standards.

1. Introduction

In the more than 100 years since the United States built the world’s first reinforced concrete structure in 1872, reinforced concrete structures have been the fastest developing and most widely used structural form in the field of structural engineering, owing to their convenience and economic value [1]. The bond between rebar and concrete represents the foundation that allows the two materials to bear the load together. The reliable bonding performance between these two materials is also an important condition to ensure the safety of the structure. Because reinforced concrete is commonly applied in practical engineering projects, this bonding problem has always been a high-priority concern of researchers and designers, and continuous technological progress has deepened the scientific community’s understanding of this bonding issue [2,3,4]. Currently, research regarding the bond behavior between rebar and concrete is primarily based on experimental investigations [5,6,7,8]. However, owing to the complex stress state and numerous influencing factors at the bonding interface between rebar and concrete [9,10,11], the existing bonding test methods cannot fully reflect the bonding state between rebar and concrete in actual structural specimens. The bond state between rebar and concrete can be considered in terms of the rebar end bonding and the local bonding. The former has a large change in stress distribution, while the latter has uniform bond stress distribution [12,13]. Based on these two types of bond states, many testing methods have been developed [14,15,16], including (i) the single-end center pull-out test (which is used to study rebar end bonding), (ii) the axial tension test (which is used to study the local bonds), and (iii) the beam test (which can be used to study the end bonding subjected to the bending moment and shear force, as well as the local bonding at mid-span of beam).
The pull-out test is the most widely used bonding test method, and it is described by two standards: ASTM C234-91a [17] (“single-end center pull-out test method”) and ASTM A370 [18] (“axial tension test method”). In fact, the ASTM C234-91a method is also recommended for evaluating the bond behavior between rebar and concrete by the Chinese code GB 50152-1992 [19]. The advantages of single-end center pull-out test are simple specimen preparation and easy measurement of test data, especially sensitive to the change of rebar shape features. It is the most widely used pull-out test method at present [20]. However, the bonding state between rebar and concrete in the single-end central pull-out test is considerably different from the actual stress state. Specifically, during the test, the rebar is under tension and the concrete is under compression, and these conditions are inconsistent with the bonding state in most practical engineering structures. In addition, the “hoop effect” caused by loading end restraint also induces a restraint effect on concrete cracking, thereby leading to a measured bond strength that is typically higher than the actual value. In contrast, the axial tension test is generally used to embed two rebars of the same grade but with different lengths (e.g., difference of 50 mm) in the center of the concrete prism specimen; then, tensile forces in opposing directions are simultaneously applied along the axial direction. This method creates constant tension in the concrete at the bonding interface between rebars and concrete, which is more consistent with the true stress state of rebar and concrete in actual structures. The axial tension test method is generally used to simulate the bonding mechanism between rebar and concrete in the mid-span of the beam. However, because of the cumbersome fabrication of specimens and the eccentric tension caused by inaccurate positioning of the rebar, there are little practical applications. Because the pull-out test cannot simulate the impacts of the bending moment and shear force on the bond behavior between rebar and concrete, the test results may differ from the actual bonding performance. Therefore, the beam test has been developed to evaluate the bonding state more precisely relative to the actual working condition.
The beam test method is an ideal testing strategy [14,21], which can accurately reflect the bond state in an actual structure. Compared with the pull-out test, the specimen fabrication required for the beam test is more complex and prone to shear failure, and therefore, stirrups must be configured. Stirrups perform several essential functions in beam bond tests. They prevent premature shear failure while providing lateral confinement that limits crack propagation, allowing for bond forces to transfer across splitting cracks. Most importantly, stirrups create stress conditions that better simulate actual structural elements, making test results more applicable to engineering design. The commonly used beam specimens can be divided into three types: (i) full-beam specimens with two half-beams connected by steel hinges; (ii) beam end bonding specimens with slots in the shear span area; (iii) beam specimens bonded in the pure bending section. The full-beam specimen with two half-beams connected by a steel hinge is the standard specimen recommended by RILEM-FIP-CEB [14]. The rebar in each half-beam has an unbonded area at the loading end and the free end, respectively. The tension area between the two half-beams is rebar, and the compression area is connected by a steel hinge (Figure 1a). Because the load transfer path of this kind of specimen is clear, the axial tension and bond stress of the rebar can be accurately calculated according to the stress balance conditions. The beam end bonding specimens with a slot in the shear span is the standard specimen recommended by AC1 Committee 208 (Figure 1b) [22]. The specimen is provided with grooves in the shear span of the beam to expose the rebar to concentrated load, and unbonded areas are set at the two free ends of the beam. The bonding length of the specimen needs to be controlled according to rebar diameter to ensure the debonding failure of the specimen. The beam specimen bonded in the pure bending section is to set two groups of splicing rebar in the tensile area of the beam (Figure 1c) [23,24]. The splicing position is in the pure bending section in the middle of the beam. The unbonded section from the splicing position to the free end is set for the full-length rebar to measure the slip value. The eccentric load caused by rebar splicing and the long unbonded section together lead to the testing accuracy of this kind of specimen being lower than that of the other two kinds of specimens.
In addition to the beam test, the beam end test also represents a desirable test method. The beam end test was originally proposed by Chana [25] and has since been improved upon by several researchers. Compared with beam specimens, beam end specimens are relatively simple to fabricate and are suitable for studying the bond between rebar and concrete in the shear span of reinforced concrete structures. Hanjari [26], Ožbolt [27], and Law [28] have carried out numerous bonding test studies using beam end specimens. The concrete at the bonding interface is subjected to large shear forces during the pulling process. If the specimen size, constraint size, bonding length, and other specimen parameters are not selected properly, this leaves the specimens prone to shear failure or shear-inadequate bond failure. In addition, when one of the corner rebars is loaded, the subsequent bonding failure load between the corner rebar and the concrete will inevitably be affected following the cracking of the protective layer and the disturbance of the stirrup [29].
Researchers have adopted the technique of slotting inside the rebar and arranging strain gauges to accurately measure the relative slip distribution between the rebar and concrete without breaking the bonding interface between the rebar and concrete [30,31]. This method requires the rebar to first be cut in half along its full length, and a milling groove must be added inside. Then, strain gauges are attached to the groove. Finally, the two halves of the rebar are brought together and welded into a single unit. Although this approach can maximize the protection of the bonding interface between the rebar and concrete, there are still some problems that cannot be ignored, including cumbersome processes and difficulty controlling the quality of welding.
At present, although many national codes related to reinforced concrete structures have given experiment methods for testing the bond performance between rebar and concrete, the recommended methods are quite different in standard specimens, loading systems, measurement systems, etc. In the code (GB 50152-92 [19] standard for test methods of concrete structures) issued by China in 1992, it was suggested that the pull-out test method be used as the test method for the bond performance between rebar and concrete, but this content was deleted in the latest revised code (GB/T 50152-2012) [20]. The above factors lead to different testing methods for bond performance between rebar and concrete selected by relevant researchers and designers in China. The disunity of test methods also leads to no comparability of measured test results. In addition, with the advent of new high-performance rebar and functional concrete, how to test the bond performance of these new materials has become the primary problem to be solved in the application of these materials. In order to obtain the influence of test methods on the bond performance between rebar and concrete and provide support for the selection of bond test methods, the present work applied the representative single-end pull-out test method and the full-beam test method to conduct bonding performance tests between rebar and concrete. The impact of the test methods and the bonding conditions (i.e., concrete strength, bonding length, stirrup configuration, and rebar slotting) on the failure mode, bonding strength, bonding stress distribution, and bond–slip behavior is reported. Moreover, some recommendations regarding how to select the appropriate test methods to evaluate the bonding performance between rebar and concrete are proposed.

2. Test Methodologies

2.1. Materials

Three groups, each comprising nine concrete cube specimens with dimensions of 100 mm × 100 mm × 100 mm, were prefabricated while preparing the bonding specimens. After curing under the same conditions as the bonding specimen (temperature 25 ± 5 °C and relative humidity 50–60%), the concrete strengths were measured at 7, 14, and 28 days, respectively [32]. The concrete proportion and cube compressive strengths are shown in Table 1. The cement used for C30 was P.C32.5R, and the cement used for C35 and C40 was P·O42.5R [33].
HRB400 rebars [34] with diameters of 16, 22, and 25 mm were selected as the principal rebars, and HRB400 rebars with diameters of 10 mm and HPB335 rebars with diameters of 8 mm were selected as the constructional rebars. The material properties of the steel rebars were measured [35], and the results are shown in Table 2.

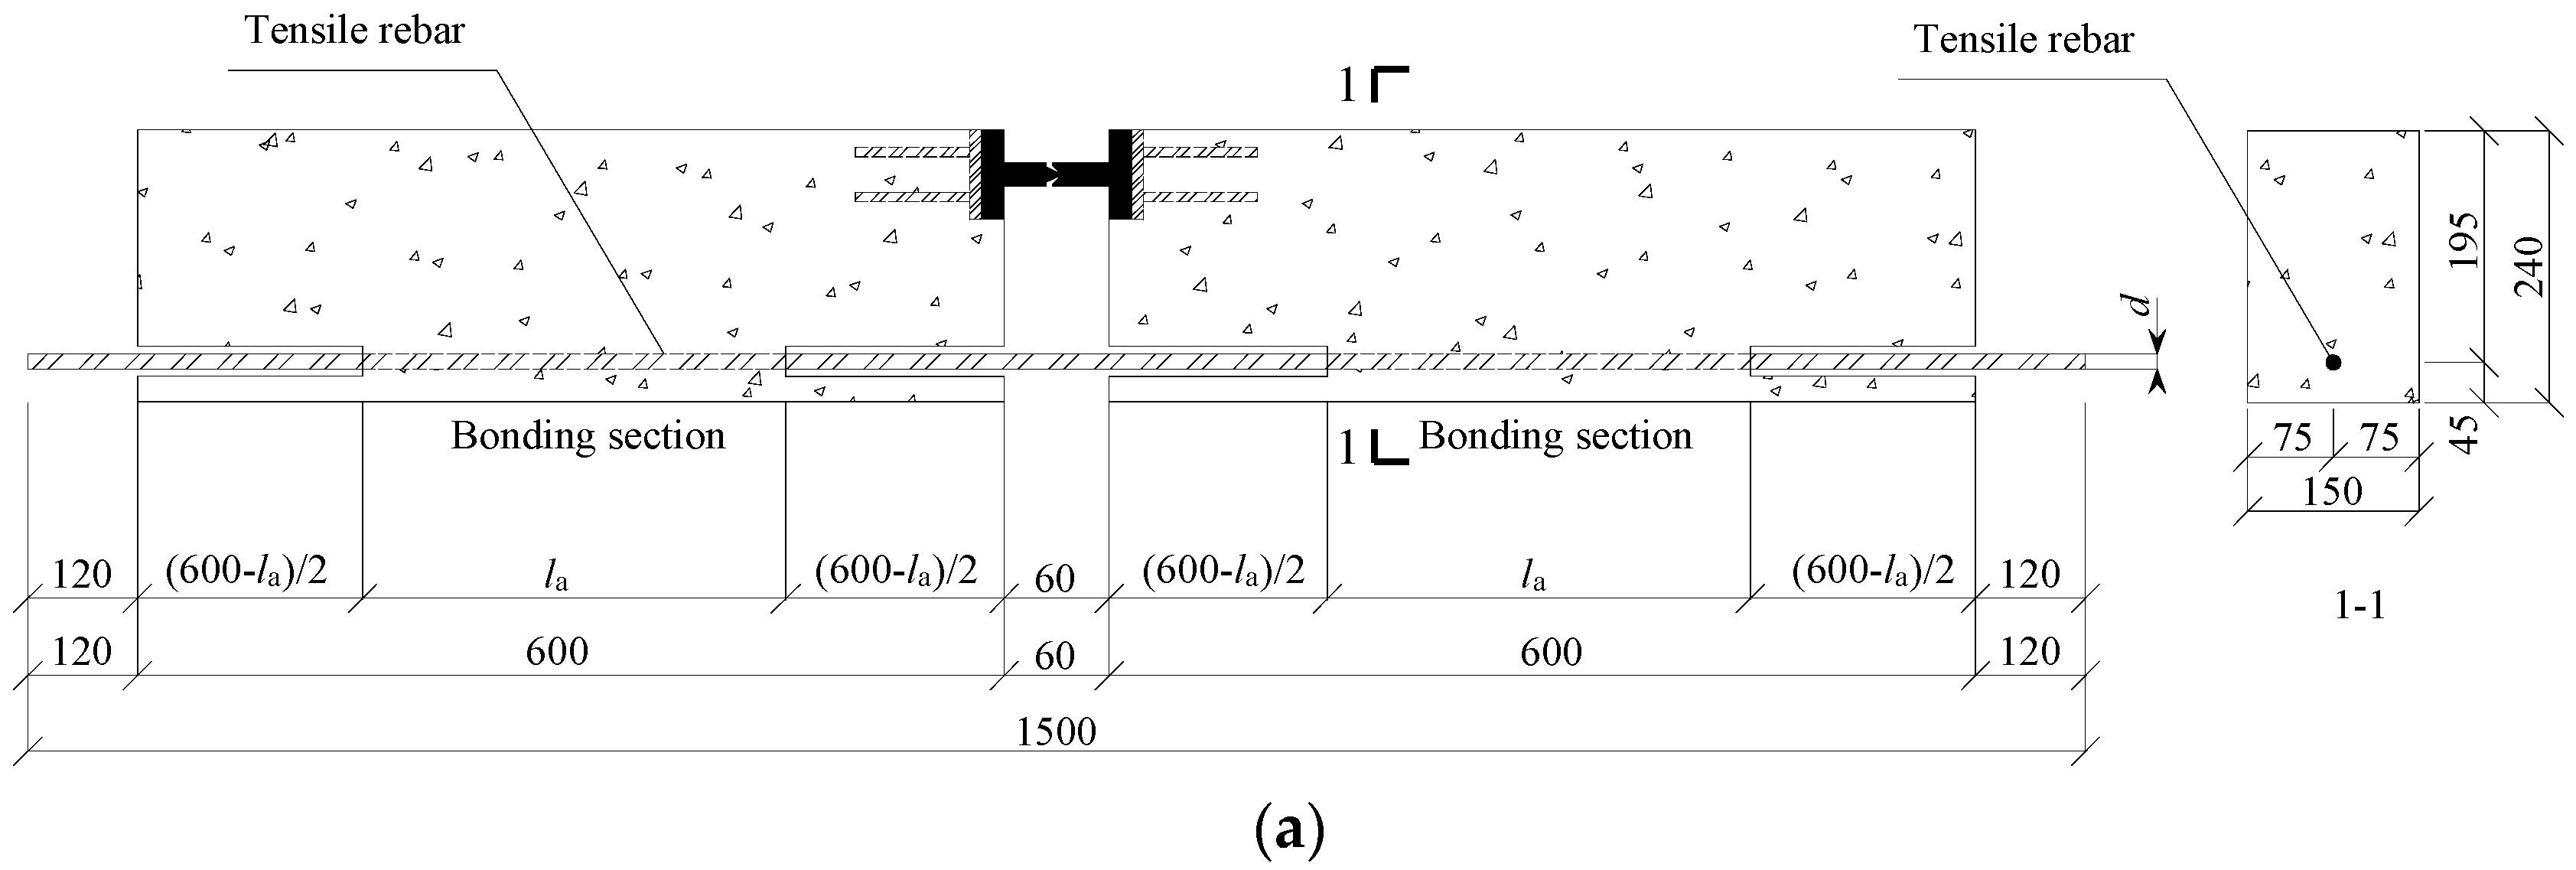
2.2. Bonding Specimen Preparation

The design parameters of pull-out specimen and beam specimen were selected according to the Chinese code GB 50152-1992 and RILEM-FIP-CEB, respectively. Based on the basic design parameters, the comparison specimens were prepared by considering the factors such as rebar diameter, bonding length, concrete strength, stirrups, and rebar grooving.

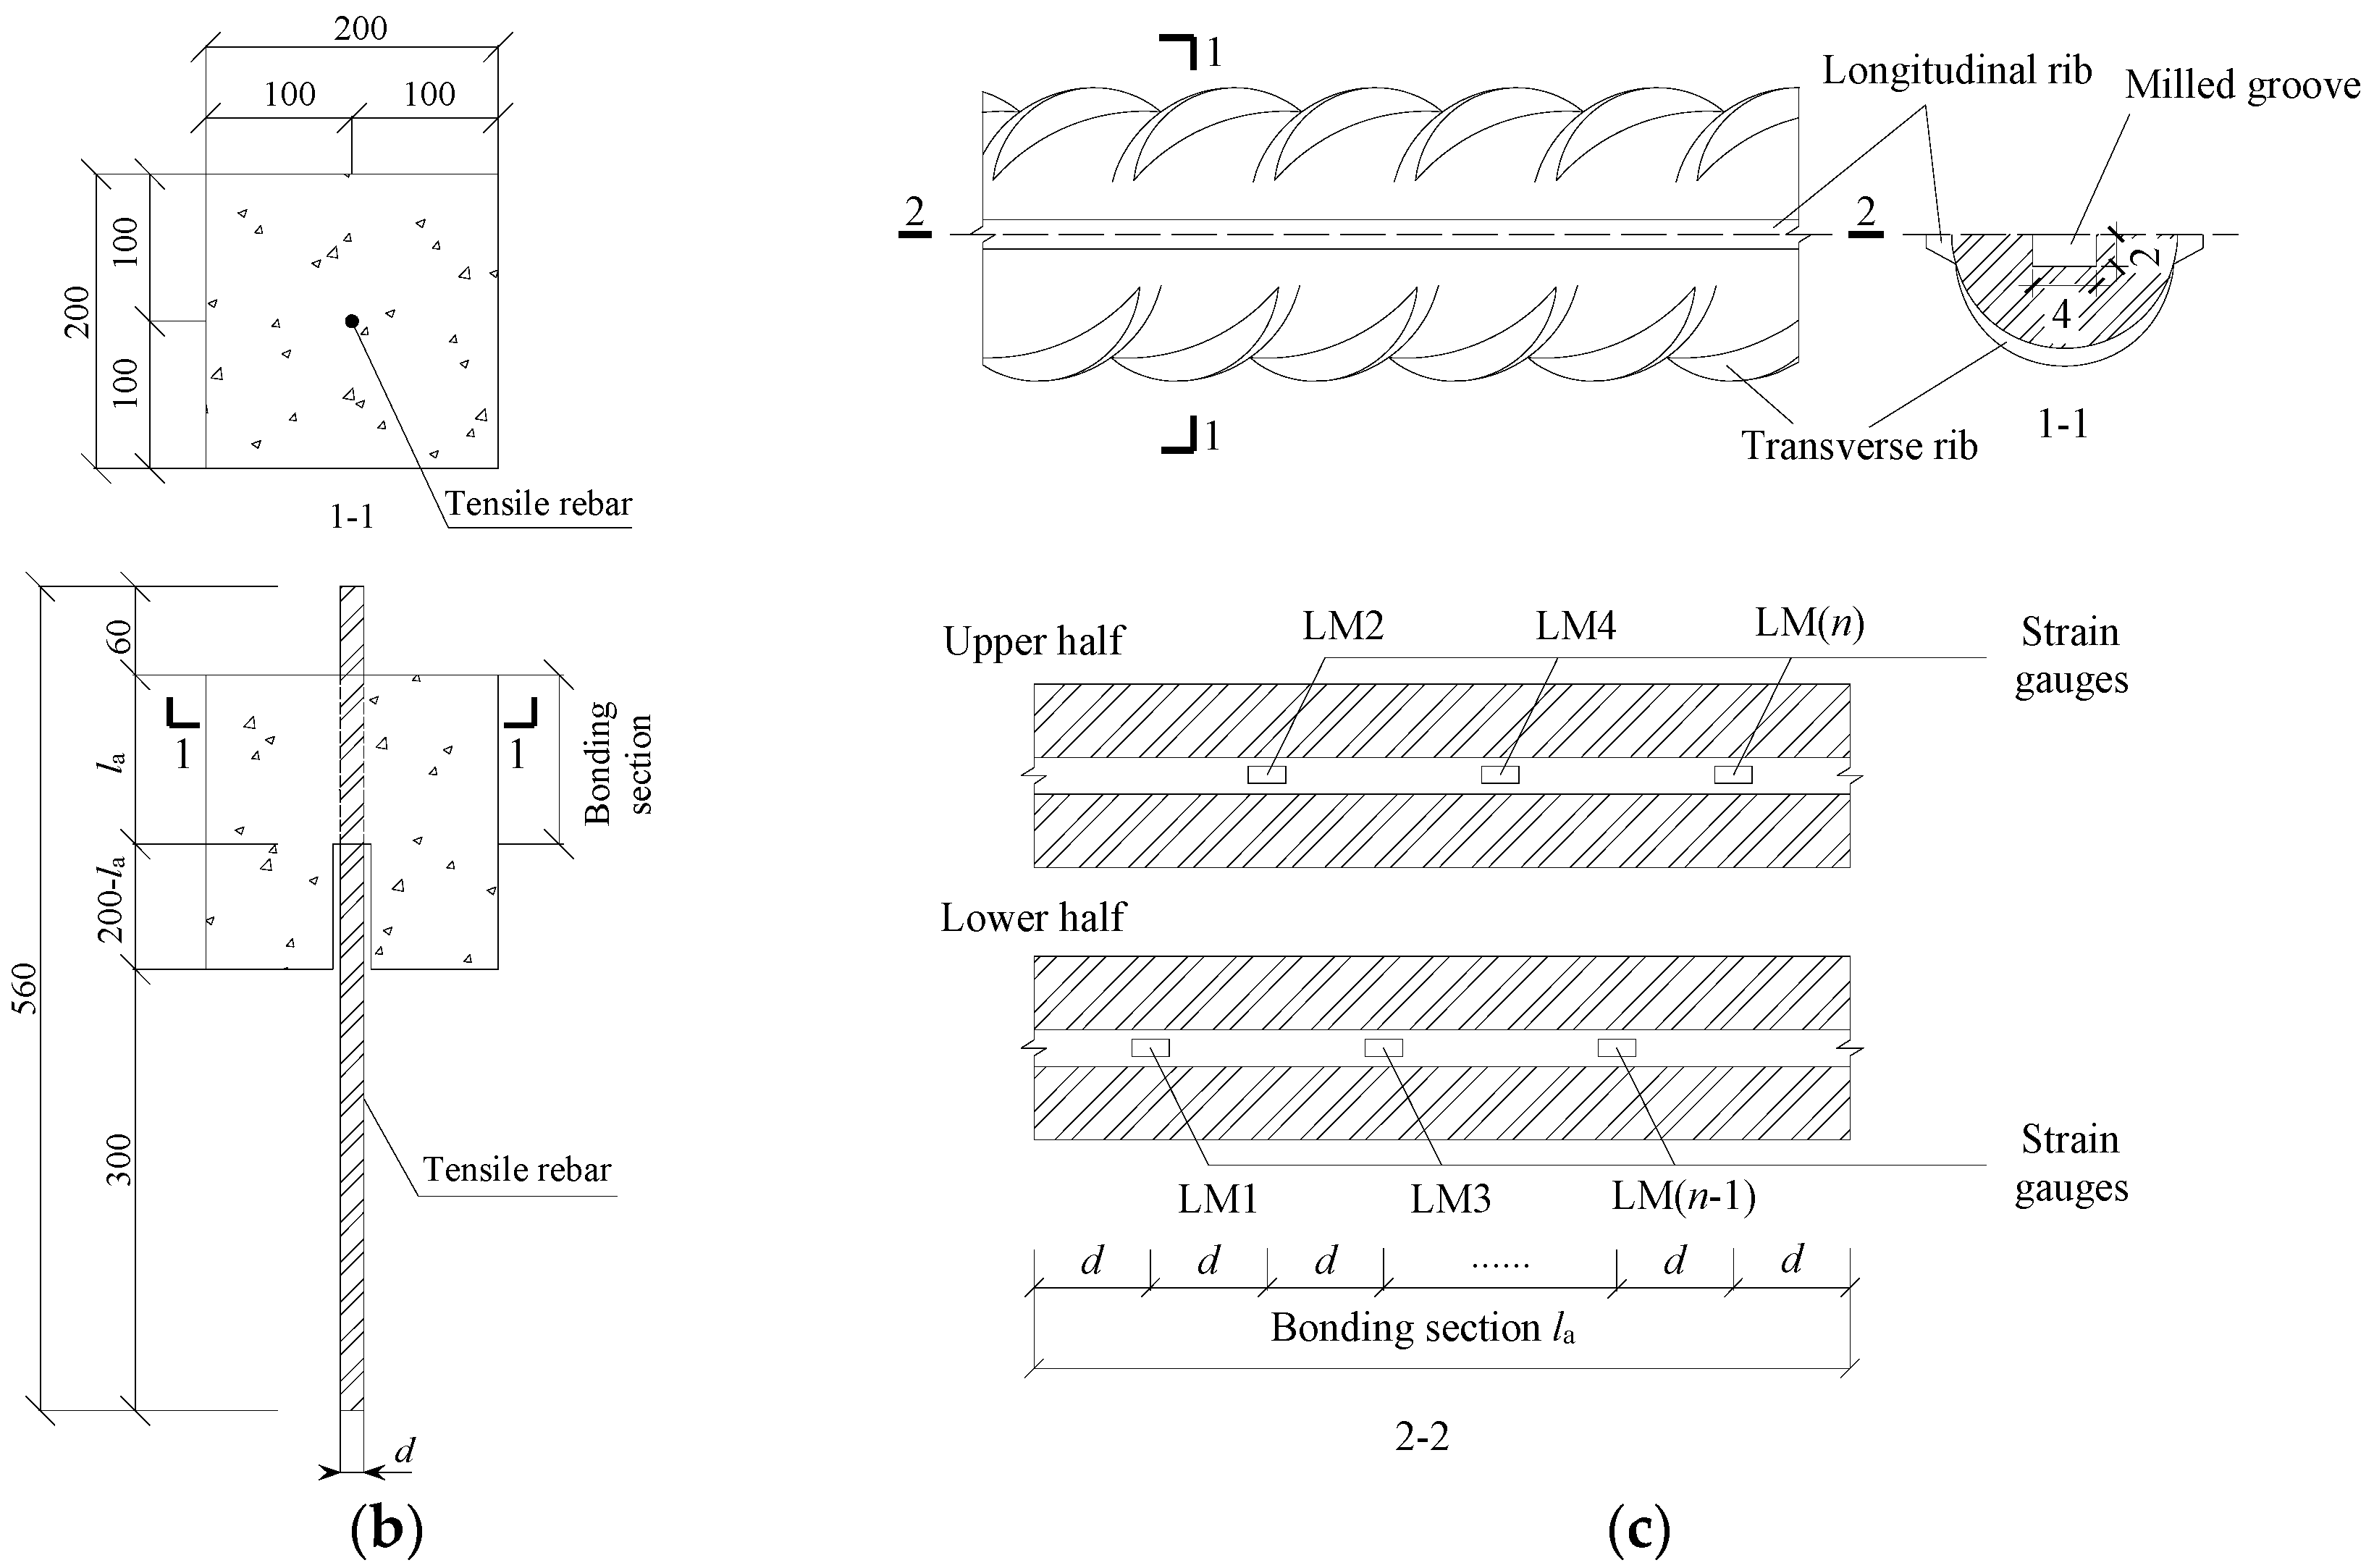
2.2.1. Principal Rebars

The length, location, and bonding section of the principal rebar in the pull-out test and beam test are shown in Figure 2a,b. The bonding lengths of rebar and concrete were 5d, 7d, and 10d (d is the rebar diameter). First, the rebar was cut in half along the longitudinal ribs, and then, a groove with a cross-sectional size of 4 mm × 2 mm was milled in the center of each half rebar. The 4, 6, or 9 strain gauges were arranged in the bonding section corresponding to bonding lengths of 5d, 7d, and 10d, respectively, as shown in Figure 2c. Finally, the strain gauges were sealed with a sealant, the rebars were brought together and welded into a single unit. To ensure welding does not affect local bond performance, sufficient distance was maintained between welding points and testing zones to preventing the heat-affected zone from extending into critical test sections. Meanwhile, carbon dioxide arc welding technology was employed to effectively reduce heat accumulation and conduction in the reinforcement bars.

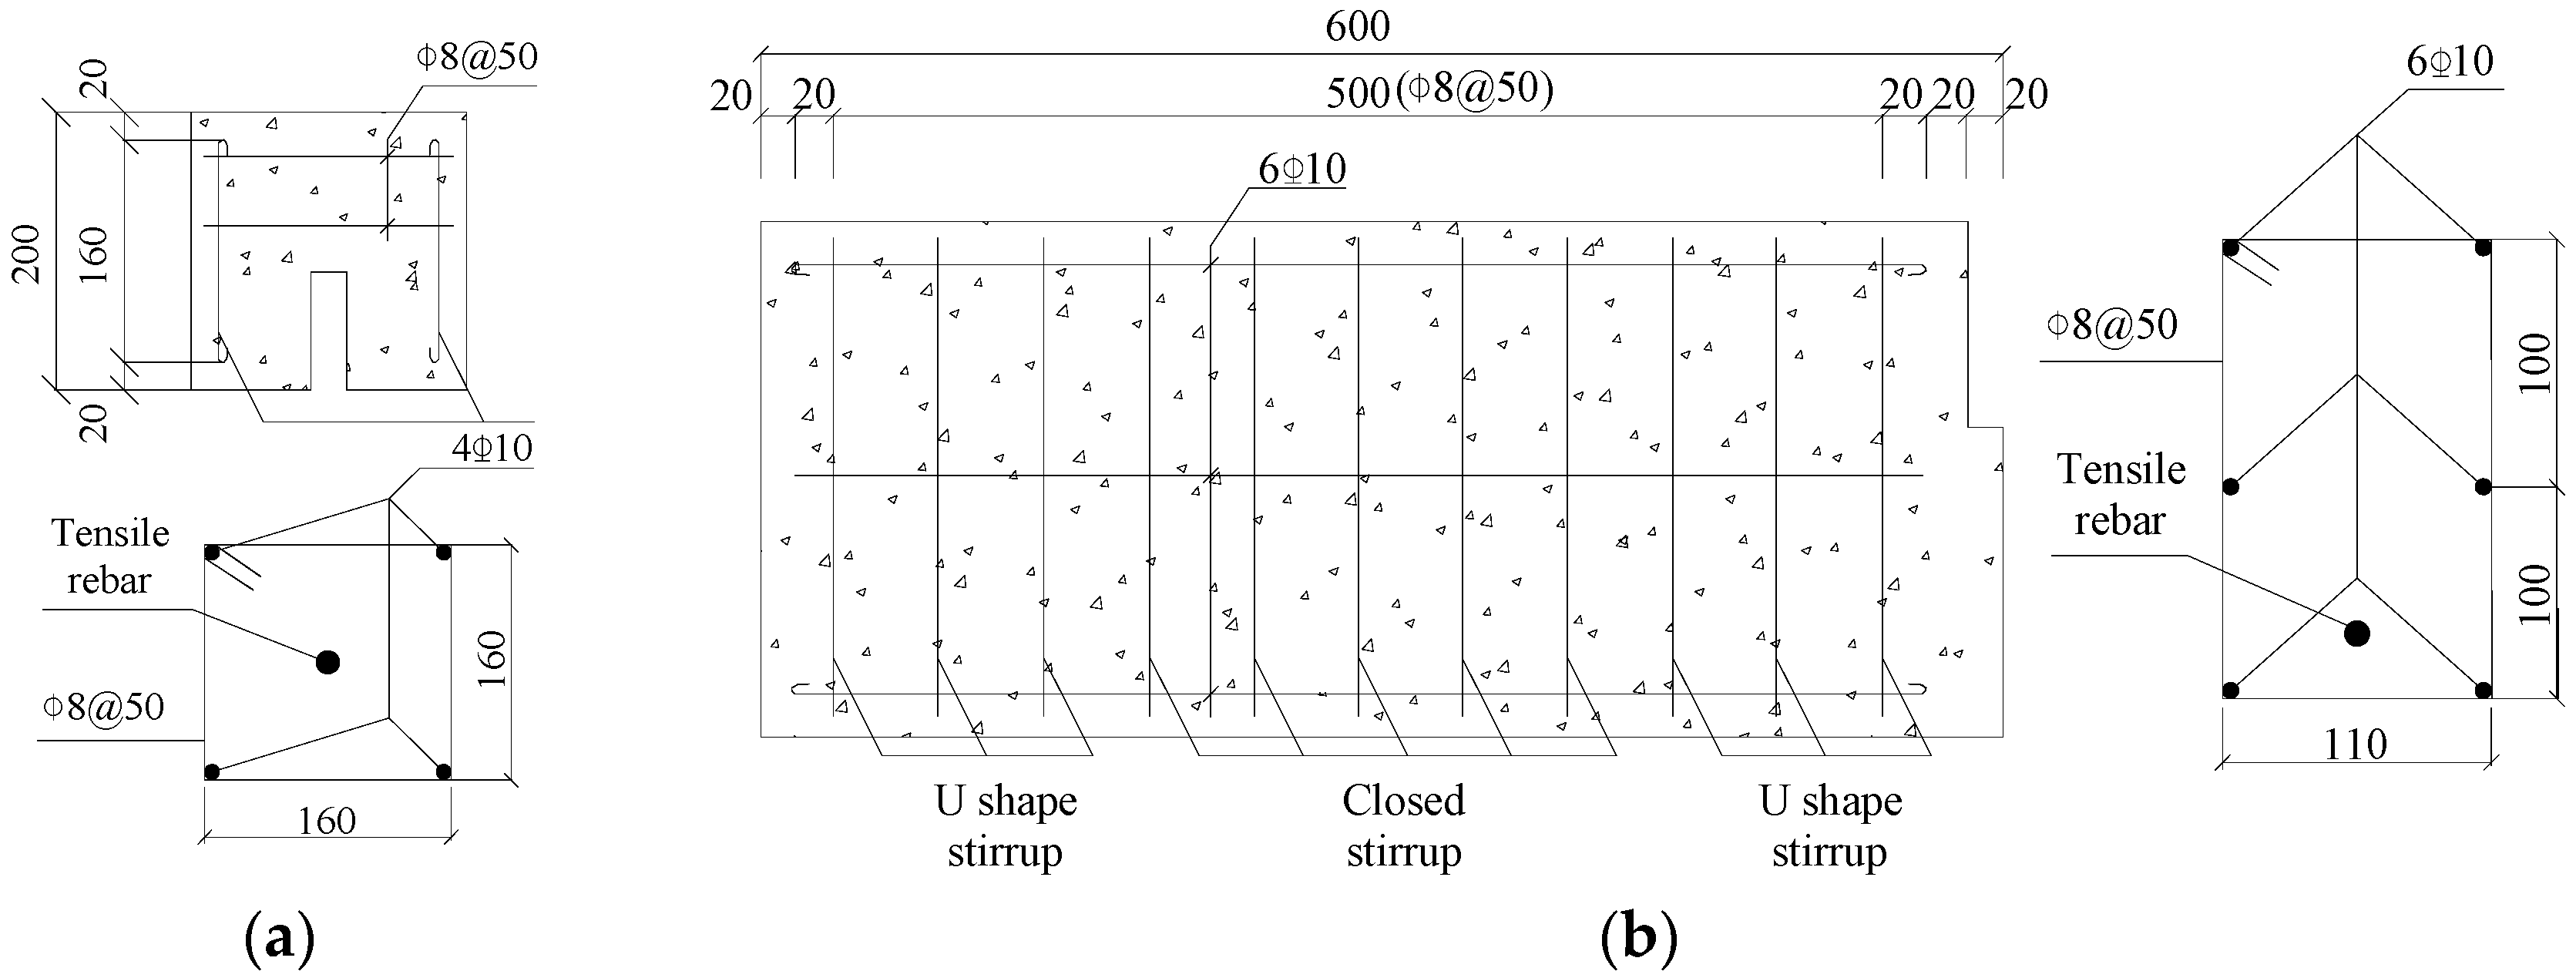
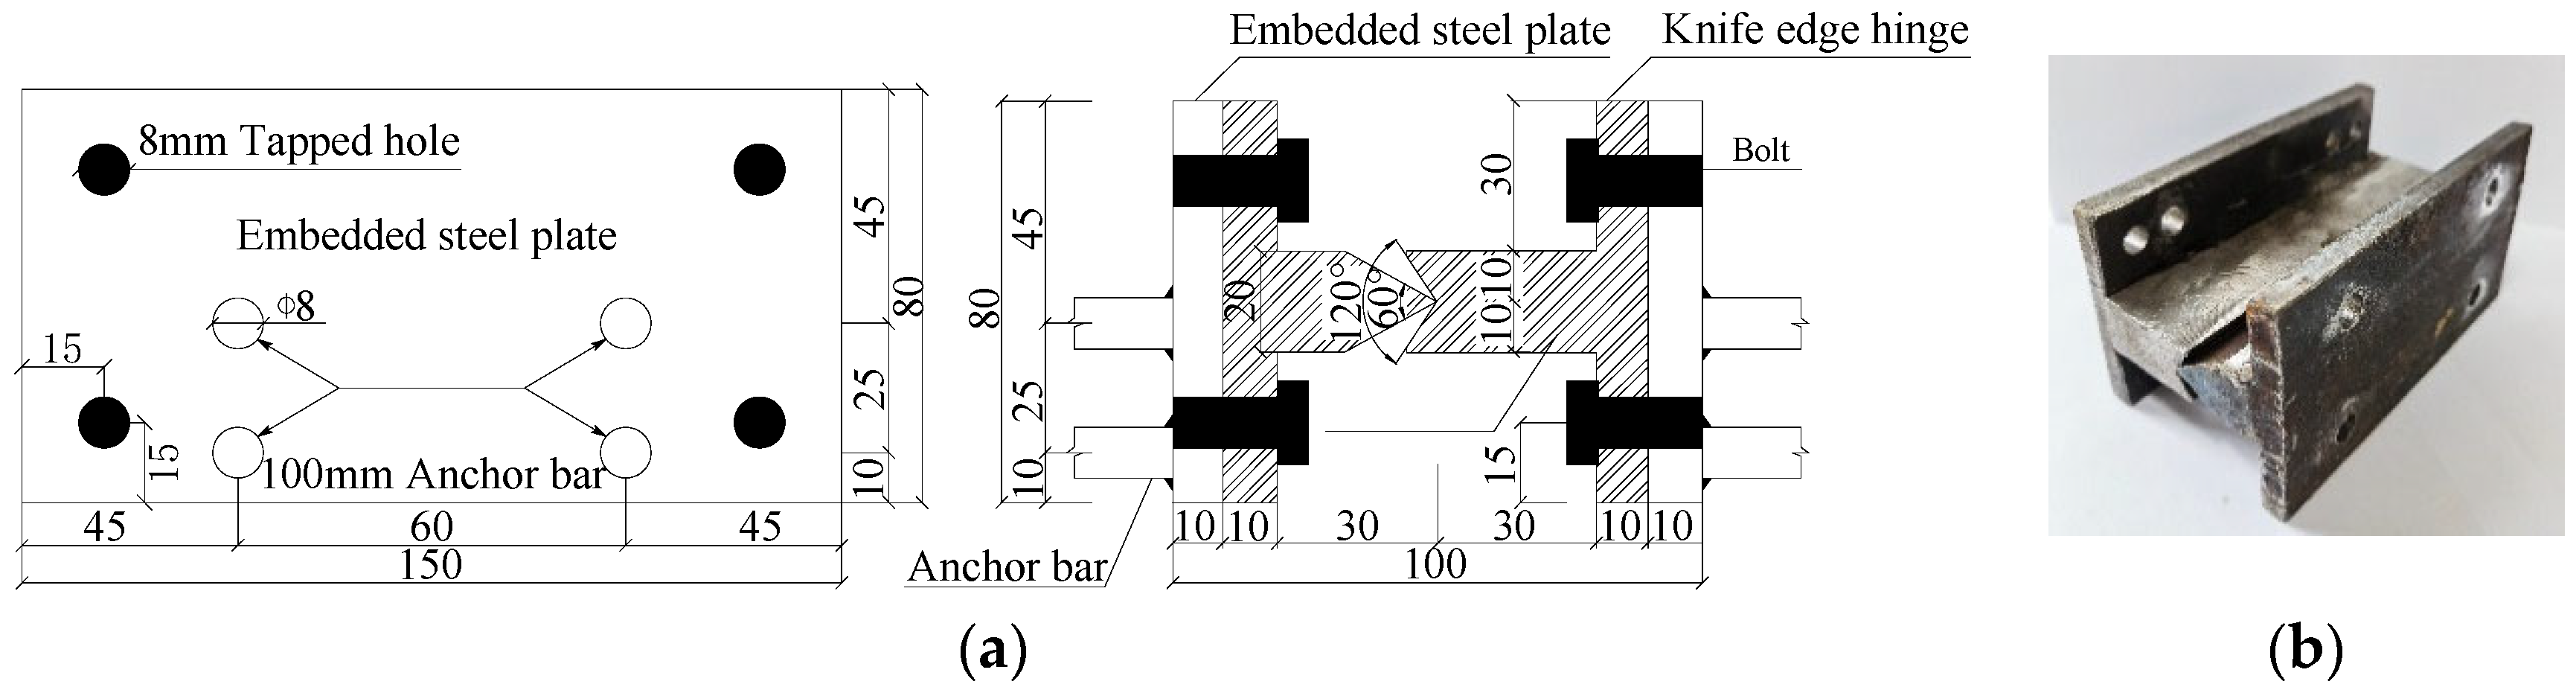
2.2.2. Stirrups and Steel Hinges
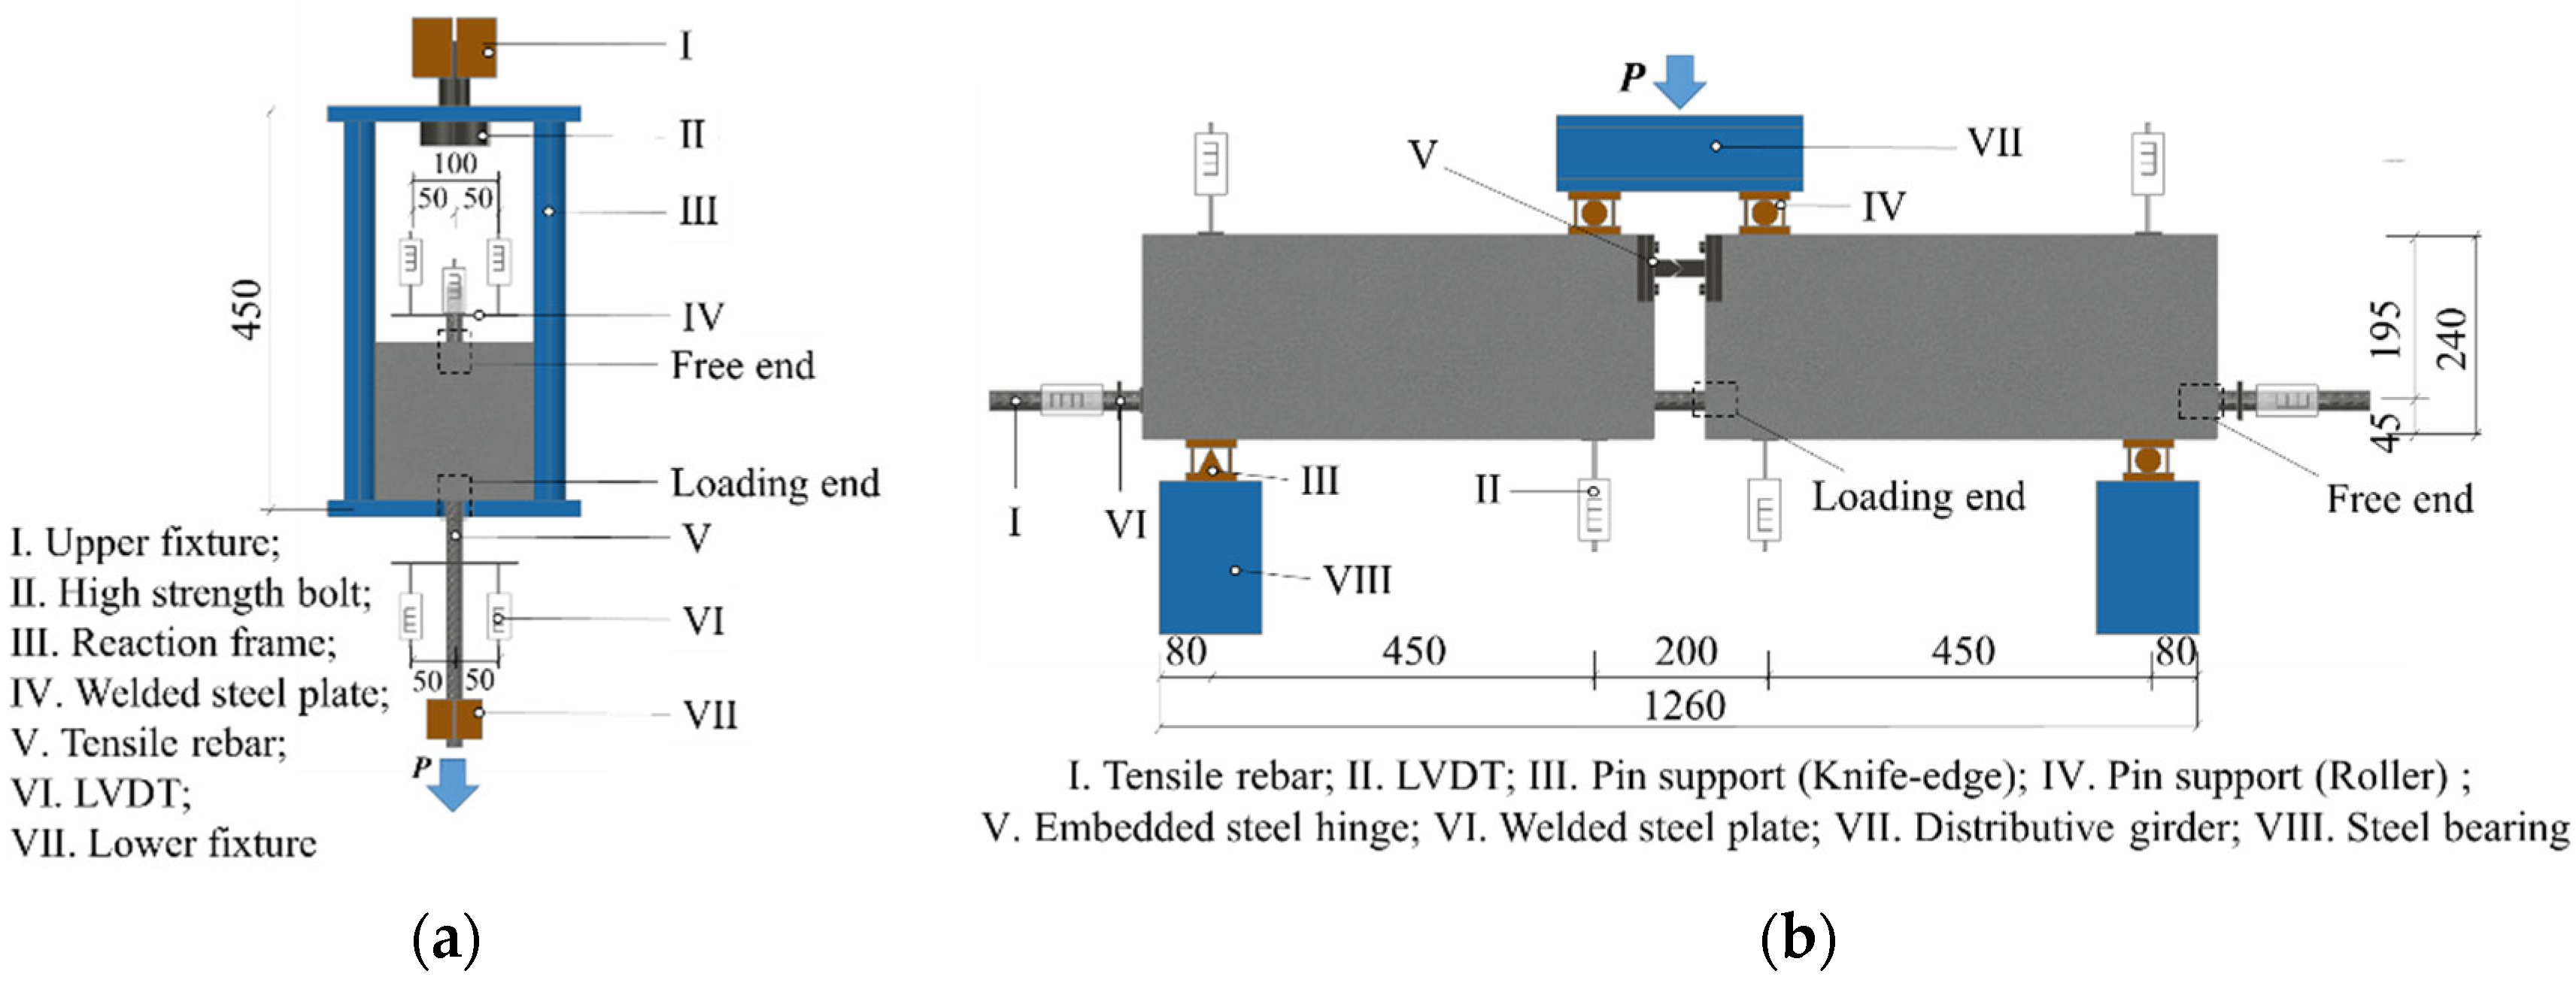
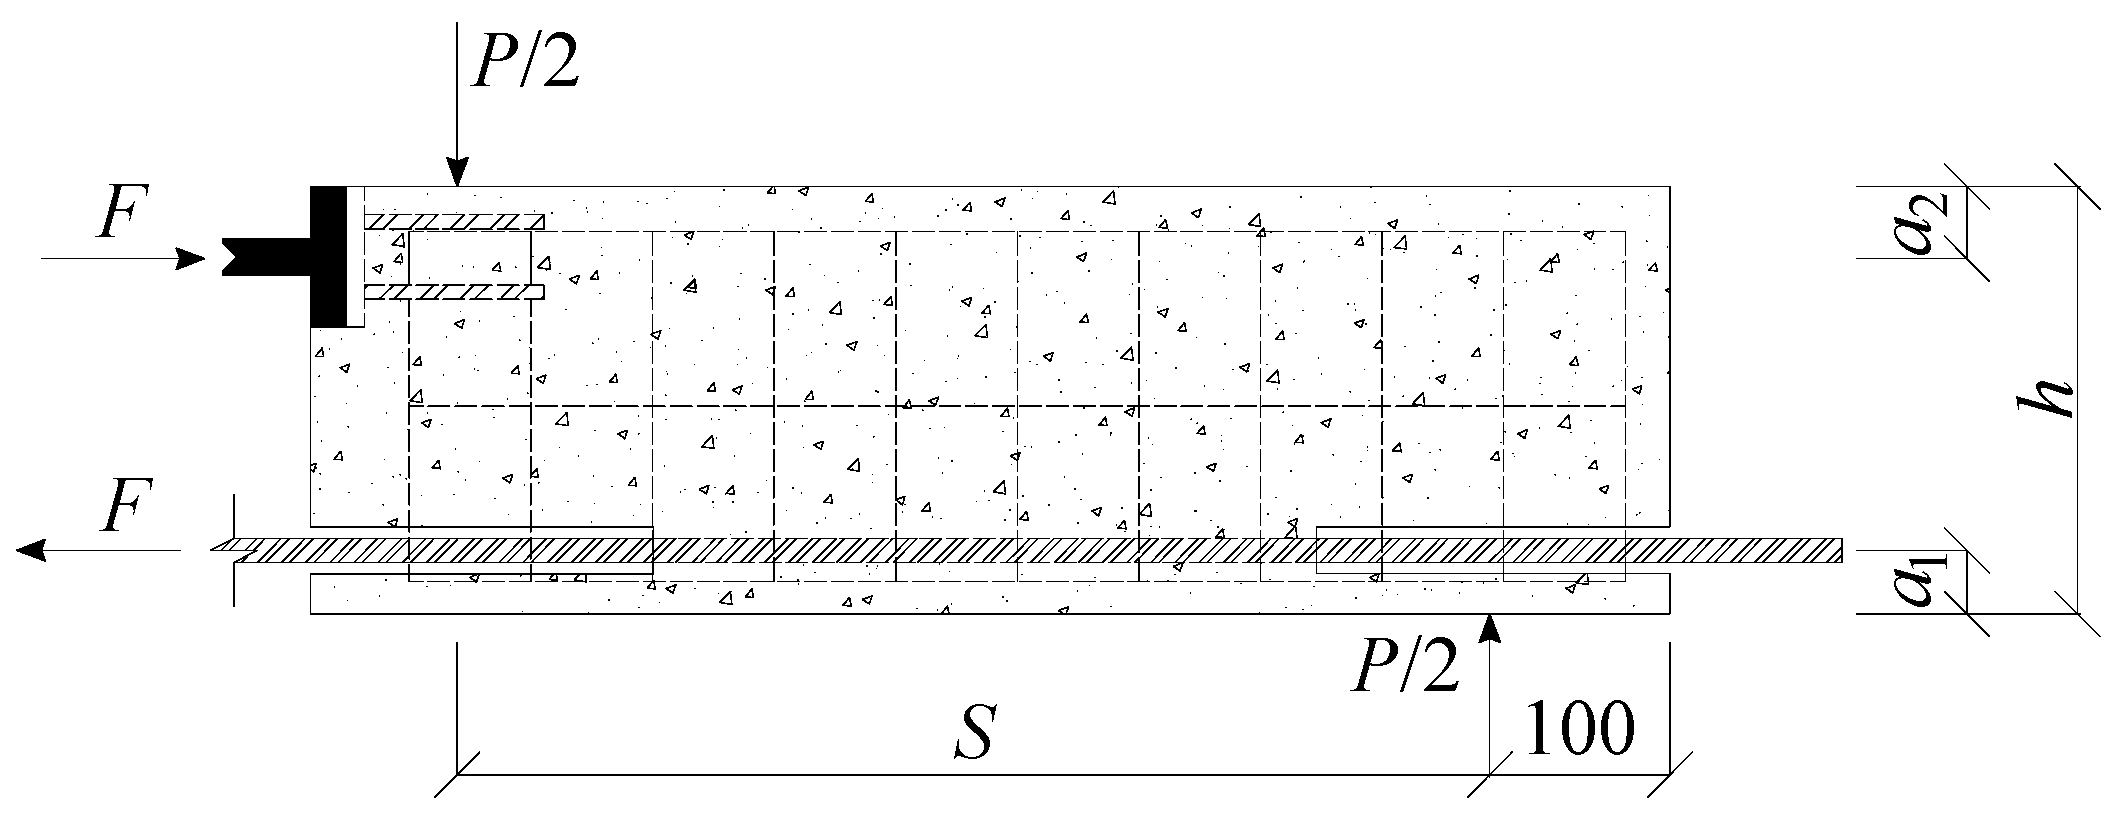
The constructional rebars used in the pull-out test and beam test were HRB400 rebars with diameters of 10 mm. The stirrups were HPB335 rebar with 8 mm diameters, the spacing was 50 mm (each beam specimen was equipped with 12 open stirrups and 10 ring stirrups), and the cover thickness was 20 mm, as shown in Figure 3. The constructional rebars and stirrups were supplied by Jiangsu Tianshun Metal Materials Group Co., Ltd. located in Yangzhong City, China. The steel hinges were composed of two parts: a pre-buried steel plate and a knife-edge steel hinge. A steel plate was set at the pre-set steel hinge position, and four plain bars (diameter = 8 mm; length = 100 mm) were welded on the back of each plate, which were inserted into the rebar cage and positioned with fixing glue. The other half of the steel hinge was connected with the embedded steel plate through bolts. as shown in Figure 4.
The bonding specimen grouping and design parameters are shown in Table 3. The pull-out specimens were divided into nine groups, and the beam specimens were divided into seven groups, with three specimens in each group, resulting in forty-eight specimens in total. The prepared bond specimens were cured in the room (temperature 25 ± 5 °C and relative humidity 50–60%) for 28 days and then loaded.

2.3. Loading System

In order to avoid the failure in a short time after the load reaches the peak value, which makes it difficult to measure the descending section of the load–displacement curve, the pull-out test and beam test both adopt the two-stage mixed loading mode of force–displacement control.
The pull-out tests employed a tensile testing machine to apply an axial load (maximum load = 1000 kN). Wet sand was selected to level the contact surface between the specimen and the reaction frame. First, the specimen was preloaded by applying 3 kN of tensile force [14] to ensure close contact between the specimen and the reaction frame. The formal loading first involved force-controlled loading (at a rate of 6 kN/min until 60% of the maximum load was applied on the specimen [15]), followed by displacement loading. The loading rate was 0.5 mm/min until the end of the loading [17], and the loading device and measuring point arrangement of the pull-out test are shown in Figure 5a.
The beam bonding test involves loading with an electro-hydraulic servo actuator (maximum range = 1000 kN) and a portal frame (supplied by Hangzhou Bangwei Mechanical and Electrical Control Engineering Co., Ltd., located in Hangzhou City, China), as shown in Figure 5b. The beam test adopted a force–displacement loading method, which first applied force-controlled loading at a rate of 0.1 kN/s and then changed to relative slip-controlled loading at a rate of 0.3 mm/min when the free end of the rebar slipped. The test is terminated when the following conditions occur: the load has dropped to about 30% of the peak load, and concrete splitting or rebar fractures are observed. The precise alignment system utilizes laser positioning devices (supplied by Hangzhou Bangwei Mechanical and Electrical Control Engineering Co., Ltd., located in Hangzhou City, China) to ensure complete collinearity between the loading line and specimen centerline, while adopting spherical hinge supports to enable six-degree-of-freedom fine-tuning that eliminates any initial eccentricity. For multi-point measurement and feedback control, symmetrical LVDT sensors (supplied by Hangzhou Bangwei Mechanical and Electrical Control Engineering Co., Ltd., located in Hangzhou City, China) are arranged on both sides of the loading points to monitor eccentricity changes in real time.

3. Test Observations and Results
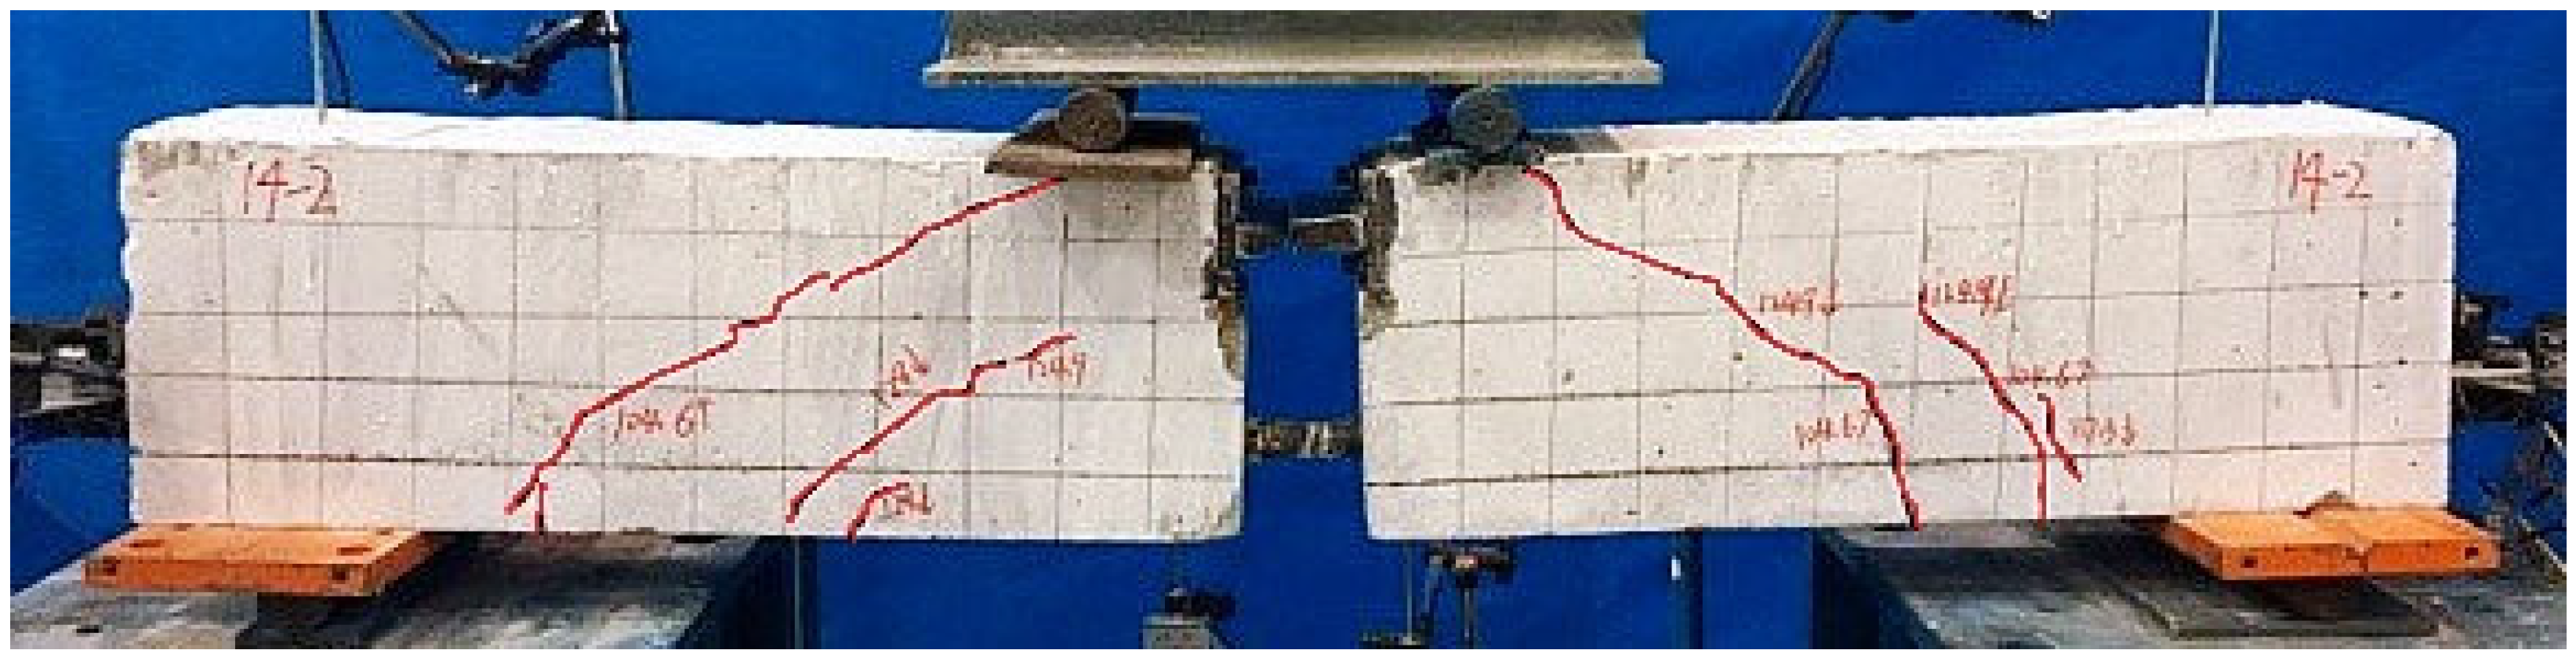
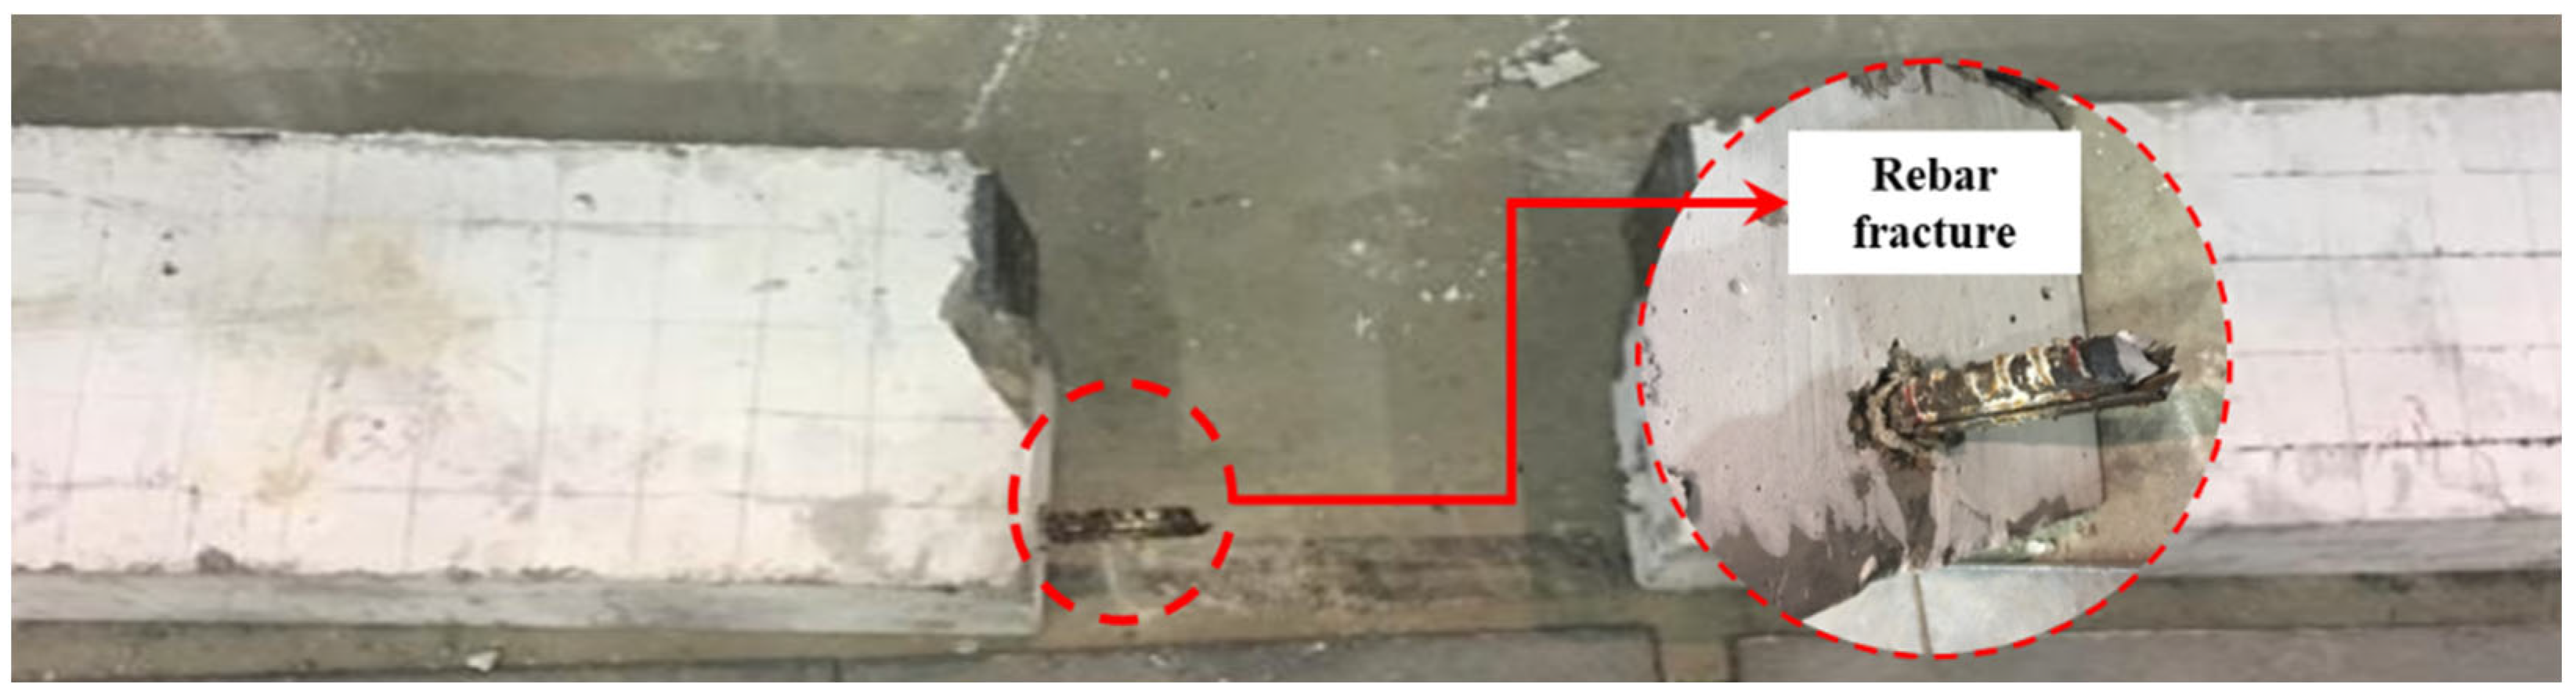
3.1. Failure Modes

The failure modes of pull-out specimens can be divided into debonding failure and concrete splitting failure. The specimens with small bonding length (i.e., 5d, 7d) and low concrete strength (C30) are prone to debonding failure (Figure 6). This type of specimen does not appear rebar slip until it is loaded near the peak load. When the load was reduced to about 30% of the peak load, the slip continued to increase, and the rebar was pulled out slowly. Some specimens that were pulled out only after the rebar reached its yield strength. The pull-out specimens with large rebar diameters (22 mm, 25 mm), large bonding lengths (10d), or high concrete strength (C35, C40) are prone to concrete splitting failure (Figure 7). There was no clear cracking of the concrete before the load reached its peak. Additionally, the free end and the loaded end did not slip. The specimens suddenly split after the load reached its peak. The concrete split into two or three pieces, and the splitting surface was marked with longitudinal and transverse ribs of the rebar, while concrete powder was observed in front of the rebar ribs (Figure 7a).
The failure modes of beam specimens include debonding, concrete splitting, splitting–debonding, and rebar fracture. Debonding failure occurred in specimens with small bonding lengths and concrete strengths, as shown in Figure 8, where the underlining denotes the slip of the specimen. As the load increased, no obvious splitting cracks were observed on the surface of the specimens. In this case, the free end slip was larger, while the deflection in the middle of the beam increased significantly. When the free end slip reached 3 mm, the bonding failure was considered to occur. Beam specimens with large diameter rebar are prone to concrete splitting failure (Figure 9). Due to low tensile strength of concrete, large cracks suddenly appeared in these specimens, and the cracks extended rapidly. The crack started from the loading point, extended vertically from the top of the specimen to the rebar, and developed into a 45° inclined crack with the rebar axis when it reached the steel hinge. Finally, the cracks were penetrated, and the corner concrete was peeled off. Specimens with splitting–debonding failure (Figure 10) produced obvious cracks, and the free end had a large slip. After the splitting crack was produced, it did not extend immediately due to the action of the stirrup. This type of failure mode occurs in specimens with medium bonding lengths and small rebar diameters. Rebar fracture failure was observed in specimens where the free end did not slip (or the slip was very small), and the rebar reached its tensile load and was broken at the half-beam connection (Figure 11). In this case, the specimen surface did not have cracks.
The distribution of failure modes of specimens in the performed tests is presented in Table 4. To distinguish between “debonding” and “concrete splitting” failure modes, the experimental study adopted the following identification criteria. Debonding failure was characterized by the following: interface slip exceeding 0.3mm with reinforcement free-end slip greater than 1.0 mm; load–slip curves exhibiting a gradual decrease with a decline rate less than 30%/mm; and observable longitudinal micro-cracks along the reinforcement direction on the specimen surface, typically not exceeding 0.1mm in width. In contrast, the quantitative criteria for concrete splitting included the following: crack widths perpendicular to the reinforcement direction exceeding 0.2 mm; load–time curves showing a sudden drop, with a magnitude greater than 40% occurring within 0.1 s; and specimen surfaces after failure displaying obvious branching cracks extending to the edge of the concrete cover.
The two bonding test methods differed in the bonding failure modes under the same bonding conditions. When the diameter of the rebar was small (16 mm) and the concrete strength grade was low, the failure mode of the specimens tested using the two applied methods generally showed characteristics of debonding failure. In contrast, when the rebar diameter exceeded 22 mm, the failure mode of the specimens subjected to the two test methods exhibited concrete splitting failure. For the specimens with a rebar diameter of 16 mm, a bonding length of 10d, and a concrete strength grade of C30, the specimens in the pull-out test suffered concrete splitting failure, while the specimens in the beam test suffered rebar fracture failure. This is due to the specimens in the beam test being equipped with stirrups, which limited the development of concrete cracks. During the beam test, the principal rebar was in a complex stress state in which tension, bending, and shear forces acted simultaneously, resulting in the fracture of the rebar at a load lower than its tensile limit. For specimens with concrete strength grades of C35 and C40, concrete splitting failure occurred following the pull-out test, and splitting–debonding failure occurred in the beam test. Due to the radial restraint of stirrups, the principal rebar in the beam specimen slips before the concrete crack fully expands. Comparing the P6-10d-C30 and P6-10d-C30-0 specimens reveals that the internal slotting of the rebar had no significant effect on the failure mode following the pull-out test, and both groups of specimens exhibited the concrete splitting failure. Notably, the failure mode of these specimens changed from concrete splitting failure to debonding failure after the configuration of stirrups for specimen P6-10d-C30 (P6-10d-C30-1). This result indicates that the stirrups played a significant role in inhibiting concrete cracking in the pull-out test.

3.2. Bond Strengths

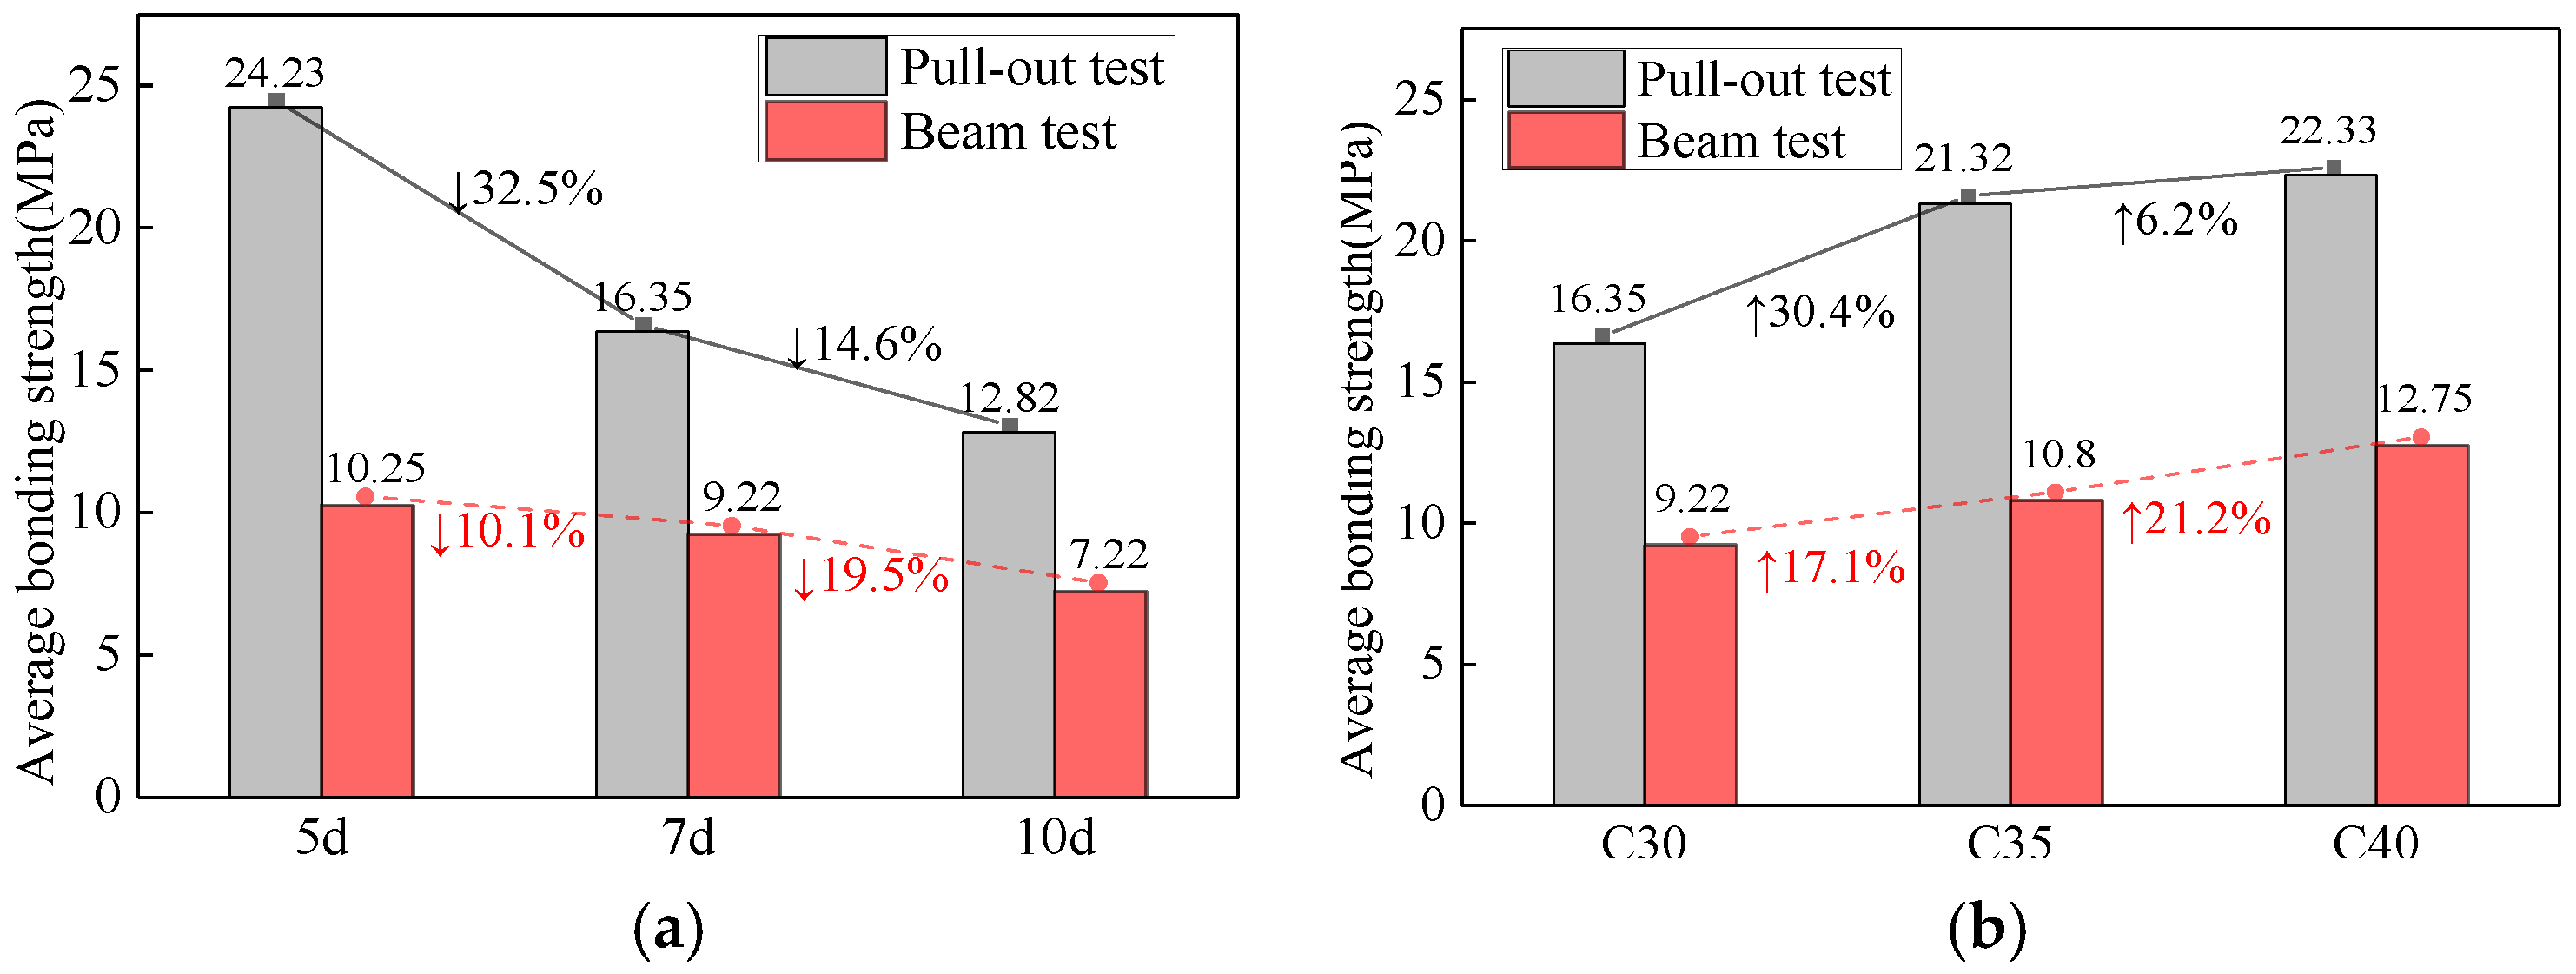
3.2.1. Average Bond Strength

The bond strength can be calculated using Equation (1) based on the ultimate load applied to the specimen collected by the testing machine:
τ u = F u π d l a
where τu is the bond strength (MPa), Fu is the ultimate load (N) (the maximum tensile force for the pull-out test, and in the beam test, it is determined using Equation (2)), d is the rebar diameter (mm), and la is the bonding length (mm). The measurement and calculation results are listed in Table 5.
The half-beam specimen considered for force analysis is shown in Figure 12. Based on static equilibrium principles, the tensile force of the principal rebar in beam specimens can be obtained using Equation (2). It assumes that the specimen is in static equilibrium, with the two half-beams connected through a hinge that accurately transmits pressure without generating additional bending moments. In addition, it also assumes that both the reinforcing bars and concrete follow a linear elastic behavior within the calculated load range based on planar section assumptions:
F = P s 2 ( h a 1 a 2 )
where s is the distance between the loading point of the beam and the reaction force (mm), a1 is the distance from the shaped center of the rebar to the bottom of the beam (mm), a2 is the distance from hinge point to the top surface of the beam (mm), and h is the beam height (mm).
The bond strengths of rebar and concrete measured by the pull-out test were higher than those measured by the beam test under the same bonding conditions. The maximum difference between the two methods was observed in specimens with 16 mm diameter rebar, 5d bonding length, and C30 concrete strength grade. For this group of specimens, the strength determined via the pull-out test was about 2.36 times the beam test strength. The smallest difference in bond strength measured by the two test methods occurred in the specimens with a rebar diameter of 25 mm, a bonding length of 7d, and a concrete strength grade of C30. In this group of specimens, the strength determined by the pull-out test was about 1.11 times that determined by the beam test. The standard deviation of the bond strengths of specimens with various bond conditions in the pull-out test ranged from 0.82 to 1.75 MPa, while the standard deviation of the bond strengths measured in the beam test ranged from 1.76 to 3.97 MPa. This indicated that the pull-out test method demonstrated better stability compared with the beam test. Furthermore, the rebar slotting had a negligible effect on the bond strength determined in the pull-out test. The average bond strength difference between the two groups of specimens (i.e., P6-10d-C30 and P6-10d-C30-0) was less than 10%. The effect of stirrup configuration on the bond strength measured in the pull-out test was significant. When stirrups were added to the same specimen configuration (P6-10d-C30-1), the failure mode changed from concrete splitting to bar pullout, confirming the decisive influence of lateral confinement on the failure mechanisms. The bond strength of the pull-out specimens increased by approximately 18.7% as a result of stirrup reinforcement.

3.2.2. Effect of Bonding Conditions

The effects of bonding length, concrete strength grade, and principal rebar diameter on the bond strength measured by the two test methods are presented in Figure 13. The bond strength measured by two test methods decreased as the length of the rebar-to-concrete bond increased. It is due to the different distribution of bond stress throughout the bonding length. The bond stress calculated in the pull-out test according to Equation (1) only represents the average bond stress between the rebar and concrete; however, the bond stress on the interface is not uniformly distributed within the bonding length. Numerous tests have shown that the bond stress is distributed along the bonding length in a curve, and there are peak points. During the initial loading, the bond stress is mainly concentrated near the loading end, and as the load increases, the bond stress is gradually transferred to the free end. During the transfer process, the peak of the bond stress is also transferred to the free end. Therefore, when the bonding length is short, the bond stress distribution is more uniform, and the high bond stress area accounts for more of the bonding length. This leads to a larger average bond stress. As the bonding length increases, the bond stress distribution becomes more uneven. When the length of the high bond stress area is shorter, the average bond strength is smaller. However, when the bonding length is greater than a critical value, the bond stress distribution does not change further; therefore, the average bond strength no longer changes. As the bonding length increased from 5d to 10d, the bond strength measured in the pull-out test decreased by about 47.1%, and the bond strength measured in the beam test decreased by about 29.6%. This indicates that the pull-out specimens were more sensitive to changes in the length of the bond between rebar and concrete. It is noteworthy that in the beam specimen, there was a case of rebar fracture (B6-10d-C30). However, the tensile strength of the principal rebar at this time was only 58.1 kN, and it had not yet reached its ultimate tensile strength (~108 kN). This is due to the complex stress state involving tensile, bending, and shear forces on the principal rebar in the beam test, as well as the weakening of its original tensile load-carrying capacity due to the slotting of the rebar.
The bond strength measured by both test methods showed an increasing trend as the strength grade of the concrete increased (Figure 13b). For example, when the concrete strength grade increased from C30 to C40, the bond strength measured by the pull-out test increased by about 36.4%, and the bond strength measured by the beam test increased by about 38.3%. This indicated that the sensitivities of the two bonding test methods in response to changes in concrete strength grade were similar. A higher concrete strength mainly increases the chemical bonding force and mechanical bite force between the rebars. Additionally, it requires a larger load to break the concrete in front of the rebar ribs, which makes the concrete more difficult to shear. Similarly, increasing the tensile strength of concrete also increases the circumferential tensile force required to produce internal cracks in the specimen, so internal cracks develop later. When the concrete strength exceeds a critical value, rebar failure will occur before debonding failure.
The bond strength measured by both testing methods decreased as the diameter of the rebar increased (Figure 13c). The increase in rebar diameter from 16 to 25 mm reduced the bond strength by about 48.9% in the pull-out test and by about 18.1% in the beam test. The change in the diameter of the rebar is essentially a change in the relative protective layer thickness (i.e., the ratio of protective layer thickness to rebar diameter). For pull-out specimens, the relative protective layer thickness decreased from 4.2 to 2.5 as the rebar diameter increased from 16 to 25 mm, whereas for beam specimens, the relative protective layer thickness decreased from 2.3 to 1.3 as the rebar diameter increased from 16 to 25 mm. The effect of the protective layer thickness on the bond strength can be explained approximately following the Lame solution for thick-walled cylinders in elastic mechanics. The circumferential tensile force of a thick-walled cylinder subjected to internal pressure can be calculated according to Equation (3) [36,37]:
σ = a 2 q b 2 a 2 b 2 r 2 + 1
where σ is the circumferential tension; q is the radial pressure in the cylinder, a and b are the inner and outer diameter of the cylinder, respectively, and r is the distance from a point on the cylinder to the center of the circle. a and b are replaced by the rebar diameter d and the thickness of the concrete protective layer c to obtain the simplified version shown in Equation (4):
σ = d / 2 2 r 2 1 + d / 2 2 + r 2 c + d / 2 2 d / 2 2
It can be seen from Equation (4) that the greater the protective layer thickness, the smaller the circumferential tension on the concrete. Correspondingly, the crack resistance of concrete is increased, thus obtaining greater bond strength. When the concrete protective layer thickness increases to a critical value, the concrete in front of the rib is sheared before the internal cracks expand to the surface. This results in debonding failure, and the bond strength is no longer affected by the circumferential tensile force, so the bond strength no longer increases with the further increase in the thickness of the concrete protective layer.

3.3. Bond–Slip Curves

The normalized and fitted bond–slip curves are shown in Figure 14 and Figure 15. The x-axis represents the ratio of the measured slip to the peak slip, and the y-axis is the ratio of the measured average bond stress to the average bond stress at the peak point. Since the bond–slip curves of the test specimens exhibiting debonding failure were different from those with concrete splitting failure (only a rising section of the curve was measured), these bond–slip curves were compared separately. In addition, the curves for the specimens experiencing the rebar fracture failure mode were not included in Figure 14 and Figure 15, and the beam test curves for the specimens exhibiting splitting–debonding failure were grouped into the debonding failure (Figure 15a).
It can be seen from Figure 14a and Figure 15a that for the specimens exhibiting debonding failure, the bond–slip curves measured by the pull-out test and the beam test were similar and can be divided into four stages. The first stage is the elastic section (origin to Point-1), which covers the region from when the load is first applied, and the bond force is mainly provided by the chemical cementation between the rebar and the concrete at the loaded end; as a result, the rebar does not experience obvious slippage. As the load increases, the bond force is gradually transferred to the free end until the chemical bonding force fails. The second stage comprises the slip section (Point-1 to Point-2), the bond stress is mainly provided by the build-in force and friction. The rebar cross-rib extrusion the concrete begins, and as the load continues to increase, the rib extrusion pressure also gradually increased. As a result, the concrete in front of the rib gradually failed, and the concrete around the cross-rib begins to show tiny internal cracks. This causes a reduction in the bond stiffness, and the bond–slip curve trends concave upward. The third stage is the Point-2-to-Point-3 stage. When the load reaches the peak, each concrete in front of the rib has been crushed, and the average bond stress begins to decline, thus allowing for large slips. The final stage is the residual deformation section (after point 3), which involves inter-rib concrete failure. The build-in force between the horizontal rib and the concrete has been lost, residual bonding force is mainly provided by friction. Therefore, the bond–slip curve is approximately horizontal while the rebar is finally pulled out. In addition, several differences distinguish the bond–slip curves obtained from the two test methods. First, the relative slip of the rebar and concrete appears earlier in the beam test than in the pull-out test. This indicates that the bond between rebar and concrete in the beam test is more likely to fail under complex stresses. Second, the slope of the rising section of the slip curve obtained from the beam test was generally smaller than that of the pull-out test. This indicates that the bond stiffness between the rebar and concrete in the beam test was less than that in the pull-out test. Finally, compared with the pull-out test, the concrete between the rebar ribs in the beam test was crushed following a smaller slip after reaching the peak point, and the curve entered the plateau phase (i.e., residual deformation section) earlier.
Figure 14b and Figure 15b reveals that the bond–slip curves measured by the pull-out test and the beam test were distinct for the specimens experiencing concrete splitting failure. The pull-out test curves had more significant randomness than the beam test curves. Some of the pull-out test curves showed a parabolic increase with decreasing slope, while the majority of the curves showed a linear increase. Due to the lack of stirrups, the crushing of concrete between the ribs and the splitting of concrete along the ribs in the pull-out test showed some randomness. When the crushing of the concrete between the rebar ribs preceded the full extension of the concrete crack along the rib direction, the bond–slip curve exhibited parabolic characteristics similar to the uniaxial compressive stress–strain curve of concrete. When the full extension of the concrete cracks along the cross-rib direction of the rebar preceded the crushing of concrete between the ribs, the bond–slip curve was linear, similar to the stress–strain curve of concrete under tension. In the beam test, the bond–slip curve was generally parabolic with a gradually decreasing slope. Due to the restraint of stirrups, when the radial cracks of concrete along the direction of the cross-ribs of the rebar are not fully expanded, the concrete between the ribs has been crushed. However, the specimen failure was caused by the rapid reduction in the bond capacity resulting from concrete splitting in the unbonded section; therefore, the falling section of the curve could not be measured.

3.4. Distribution of Bonding Stress

The reinforced concrete unit between the two measurement points was simplified for stress analysis, as shown in Figure 16. Assuming that the bonding stress is uniformly distributed on the surface of the unit column. The stress of the rebar at the measurement point is calculated using Equation (5):
σ s = E s ε s
The mechanical equilibrium conditions of the unit column are established based on Equation (6):
σ s , i + 1 σ s , i = π d Δ l τ ¯ i
Based on force equilibrium principles, the local bond stress through stress differences between adjacent measurement points along the rebar can be determined using Equation (7):
τ ¯ i = ( σ s , i + 1 σ s , i ) A s π d Δ l = ( ε s , i + 1 ε s , i ) E s A s π d Δ l   ( i = 1 , 2 , 3 , n 1 )
where As is the cross-sectional area of the rebar, d is the rebar diameter, σ s , i is the measured point’s rebar stress, ε s , i represents the measured point’s rebar strain, Δ l is the distance between two measurement points, and Es is the elasticity modulus of the rebar (2.0 × 10⁵ N/mm2).
According to the strain distribution within the bonding section (Figure 16), the local bonding stresses corresponding to various measurement point locations were calculated using Equations (6) and (7), and the distribution of the bonding stresses of the principal rebar produced in the two types of bond tests are shown in Figure 17 and Figure 18. It is important to note that individual strain gauges were broken because of certain unavoidable incidents during the tests, and the test data in Figure 17 and Figure 18 are single sets of complete data from each group rather than the average of three sets of test data.
Figure 17 and Figure 18 reveal that there are differences in the bonding stress distribution in the pull-out and beam tests under same bond conditions. In the pull-out test, the bonding stress of the rebar reached a maximum near the loaded end, which gradually decreased toward the free end. As the load increased, the bonding stress increased from the loaded end to the free end at a decreasing rate. In the beam test, the peak bonding stress of the rebar was distributed near the loading end, but as the loading increased, a second peak stress appeared near the free end of the rebar. Under the multiple actions of bending moment, shear force and axial tension, the cementing force between rebar and concrete in beam test provides resistance for a short time. When the cementing force failed, the bonding action between the rebar and concrete was primarily provided by the build-in force between the cross-ribs of the rebar and the concrete. During the initial stage of loading, the inter-rib concrete near the loading end was the first to extrude, whereas the inter-rib concrete near the free end was nearly unstressed at this point. Therefore, the peak bonding stress of the rebar at this stage was concentrated at the loading end. As the load increased, the inter-rib concrete at the near-loading end was gradually crushed, and radial cracks were produced along the cross-rib direction, thereby decreasing the bond stiffness between the rebar and concrete. When the inter-rib concrete at the near-loading end was completely crushed, it provided resistance from the bonding section near the free end where the inter-rib concrete had not been destroyed. A second peak point in the bonding stress occurred due to a small increase in the bond stiffness. However, this second peak was smaller than the peak stress at the loading end because the concrete between the ribs, which provided the resistance, already had partial damaged. In the pull-out test, the concrete near the loading end was subjected to the radial restraint of the steel plate, which enhanced the bond between concrete and rebar. In addition, the specimen was subjected to a single state of stress, and the cementing force between the rebar and the concrete works longer than the beam test. Therefore, the bonding stress of the rebar near the loading end of the pull-out test was the largest. When the load increased to a critical value, the cementing force failed, and the concrete between the ribs was crushed. The bond stiffness between the rebar and the concrete gradually decreased, so the second peak of the bonding stress of the rebar did not appear.
The bonding stress distribution of the rebar in both test methods showed similar responses to changes in the bonding length or the concrete strength. When the bonding length was short (5d) or the concrete strength grade was low (C30), the distribution of bonding stresses along the bonding section was more uniform and gradually develops into an uneven distribution from the loading end to the free end with the increase in bonding length and concrete strength. For the beam test, the double-peak profile of the bonding stress distribution gradually became less pronounced as the concrete strength increased. Compared with the specimens with smaller diameter principal rebars (e.g., P6-7d-C30, B6-7d-C30), the distribution of bonding stresses was more uniform for the specimens with relatively larger diameter rebars (e.g., P2-7d-C30, B2-7d-C30, P5-7d-C30, B5-7d-C30) in both test methods. Additionally, for the beam test, the double-peak feature of the bonding stress distribution became more and more significant as the rebar diameter increased.

4. Discussion

Following an analysis of the differences between the two types of bonding test methods, this report provides recommendations regarding how to select the appropriate test methods to evaluate the bonding performance between rebar and concrete.
(1)
The bond strength measured in the pull-out tests described herein is generally higher than that determined by the beam test; specifically, the bond strength of the pull-out test is about 1.11–2.36 times the bond strength of the beam test under the same bonding conditions. This indicates that the test results measured by the pull-out test method, with a single stress state at the bonding interface (ignoring bending and shear stress in actual state), cannot be directly used in structural design. If the pull-out test results are used to guide the structural design, they should be converted. However, it is important to note that the beam and pull-out tests show different failure modes when the bonding length is large (≥10d) or when the diameter of the rebar is large (≥22 mm). For these cases exhibiting distinct failure modes, the use of conversion factors to relate the two test methods’ bond strength results is not applicable.
(2)
The pull-out test demonstrated higher sensitivity than the beam test in response to changes in bonding conditions (e.g., bonding length, concrete strength grade, rebar diameter). For example, when the rebar diameter increased from 16 to 25 mm, the change in bond strength measured by the pull-out test method was 48.9%, whereas the change in bond strength measured by the beam test method was only 18.1%. Therefore, if the purpose of the test is to accurately determine the effect of changes in bonding conditions on the bond strength of rebar and concrete, it is most appropriate to use the pull-out method for testing.
(3)
In terms of the bond–slip characteristics, the bond–slip curves obtained from the beam test are more stable than those obtained by the pull-out test. Specifically, the curves obtained by the pull-out test show more significant dispersion when concrete splitting failure occurred in the specimens. Therefore, to generalize the bond–slip behavior of rebar and concrete from the test curves more easily, it is recommended to employ the beam test method to obtain the bond–slip curves of rebar and concrete.
(4)
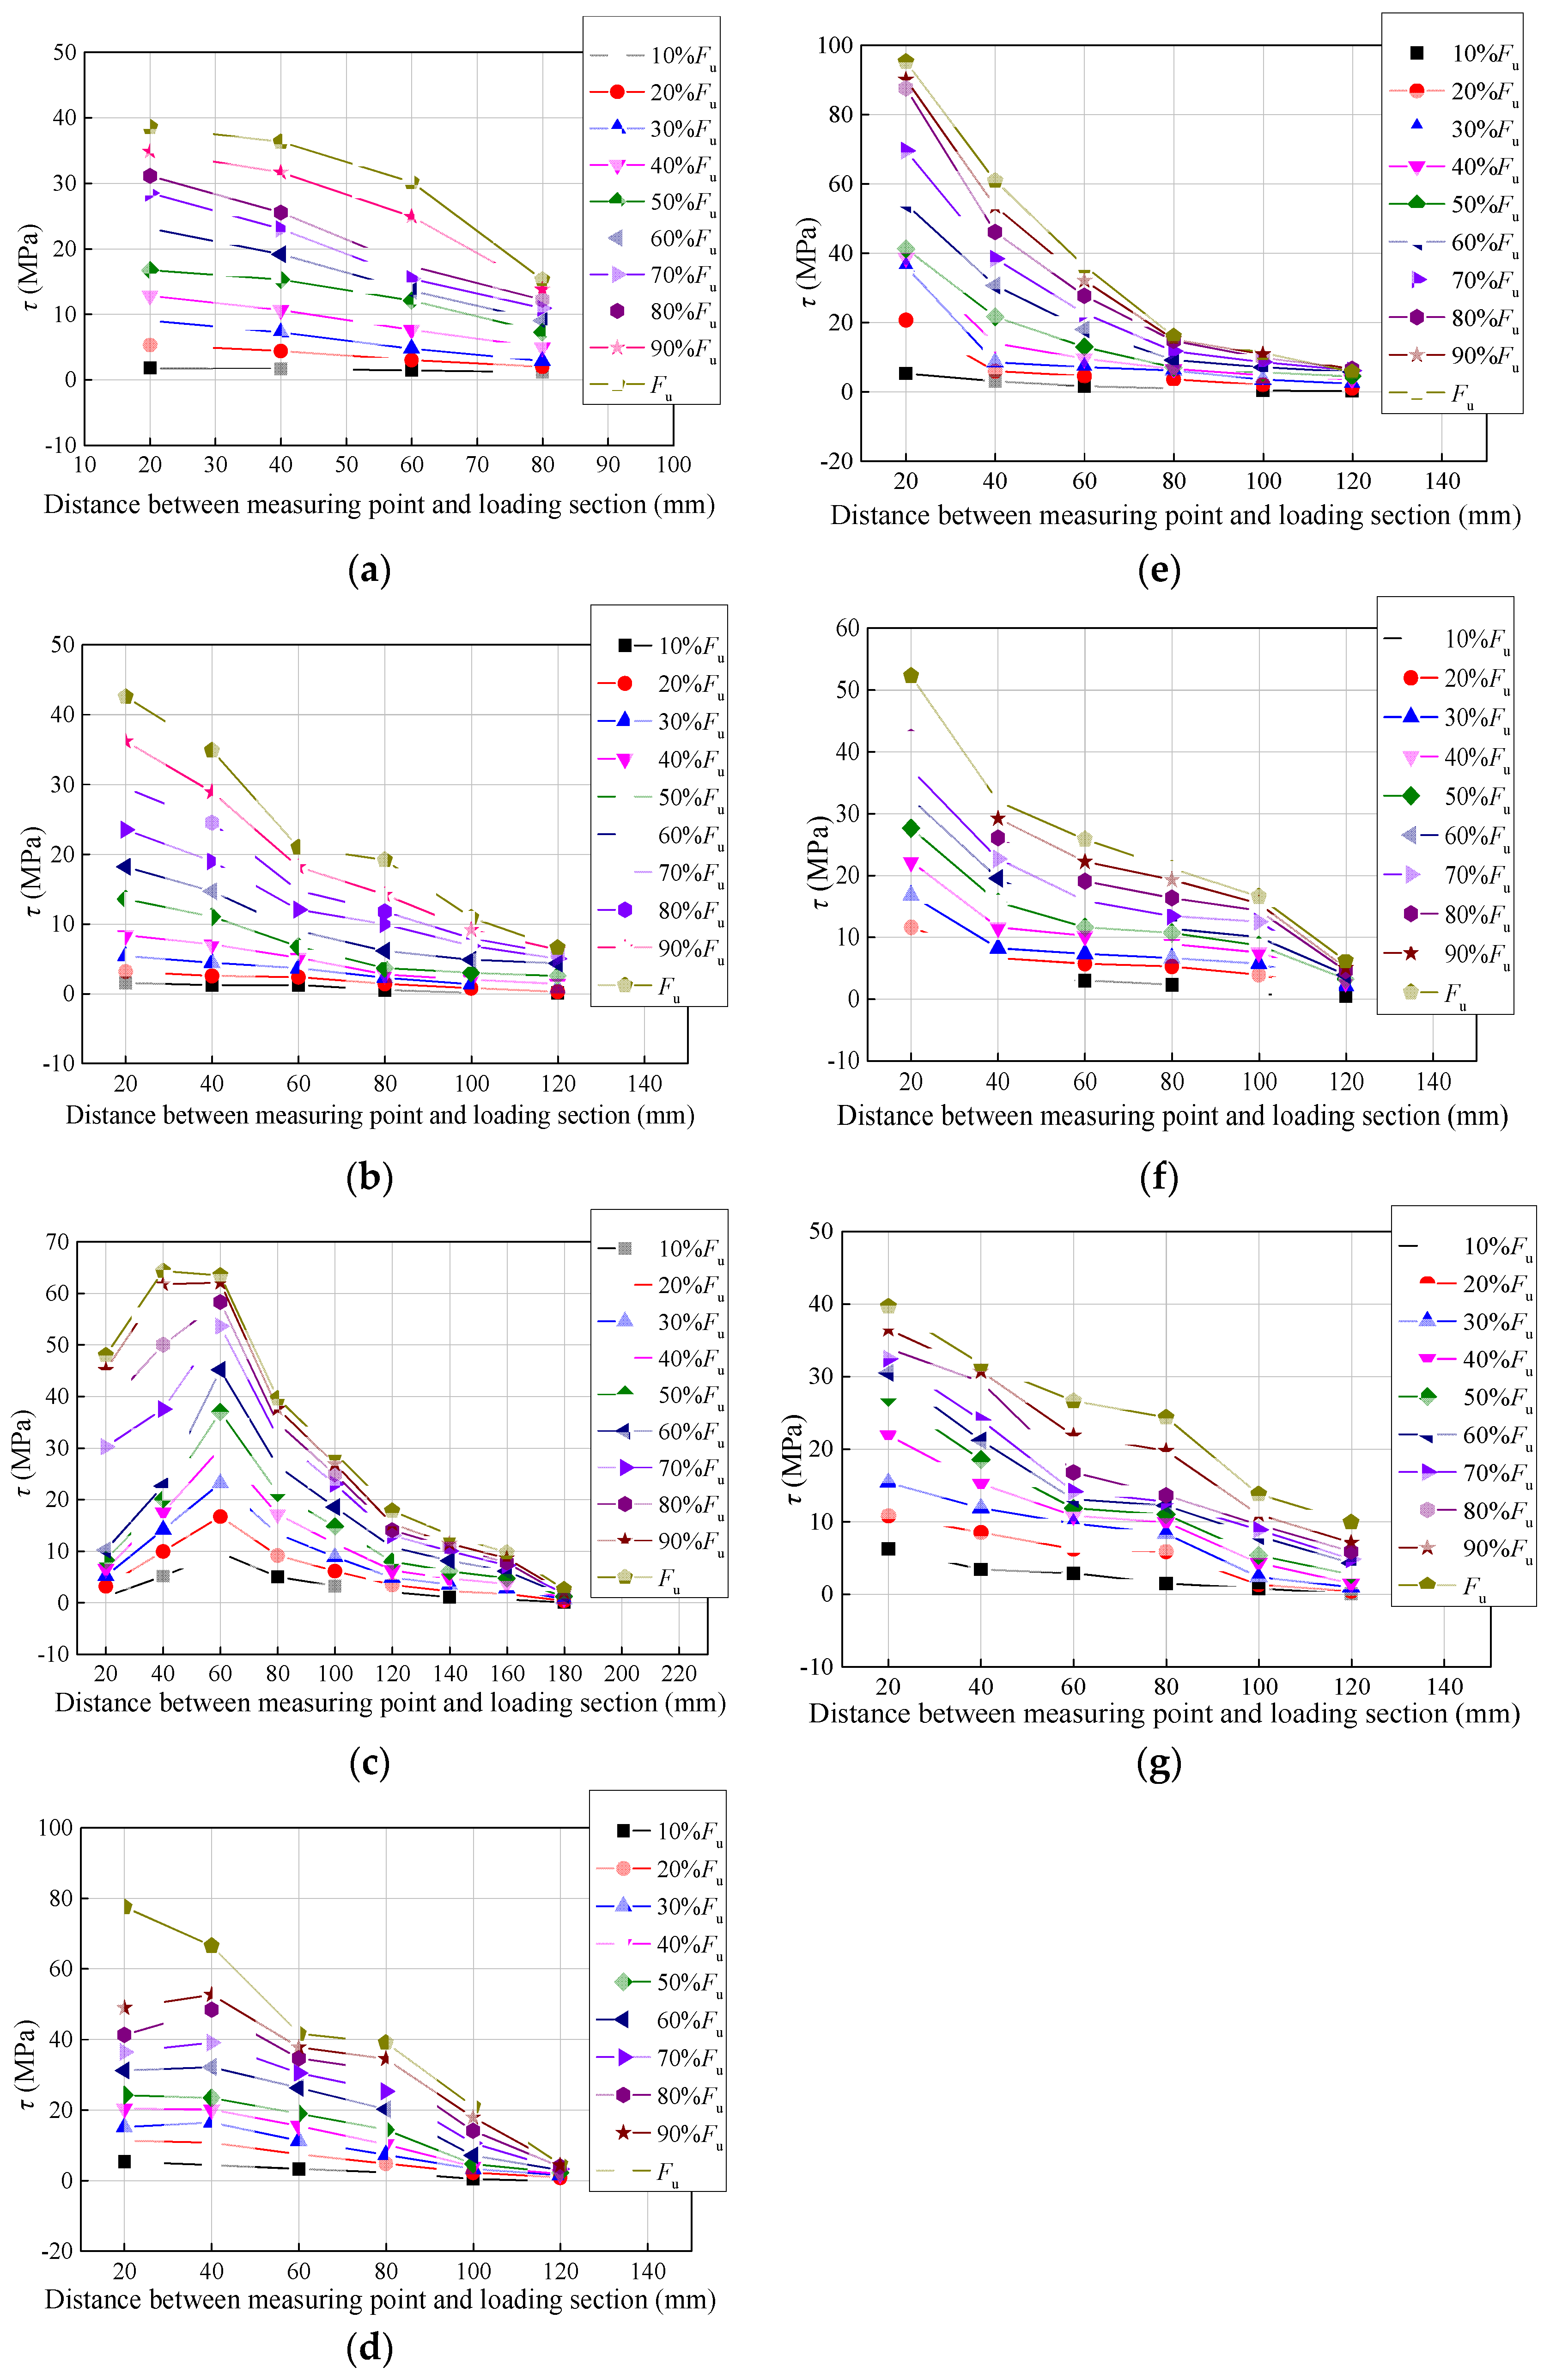
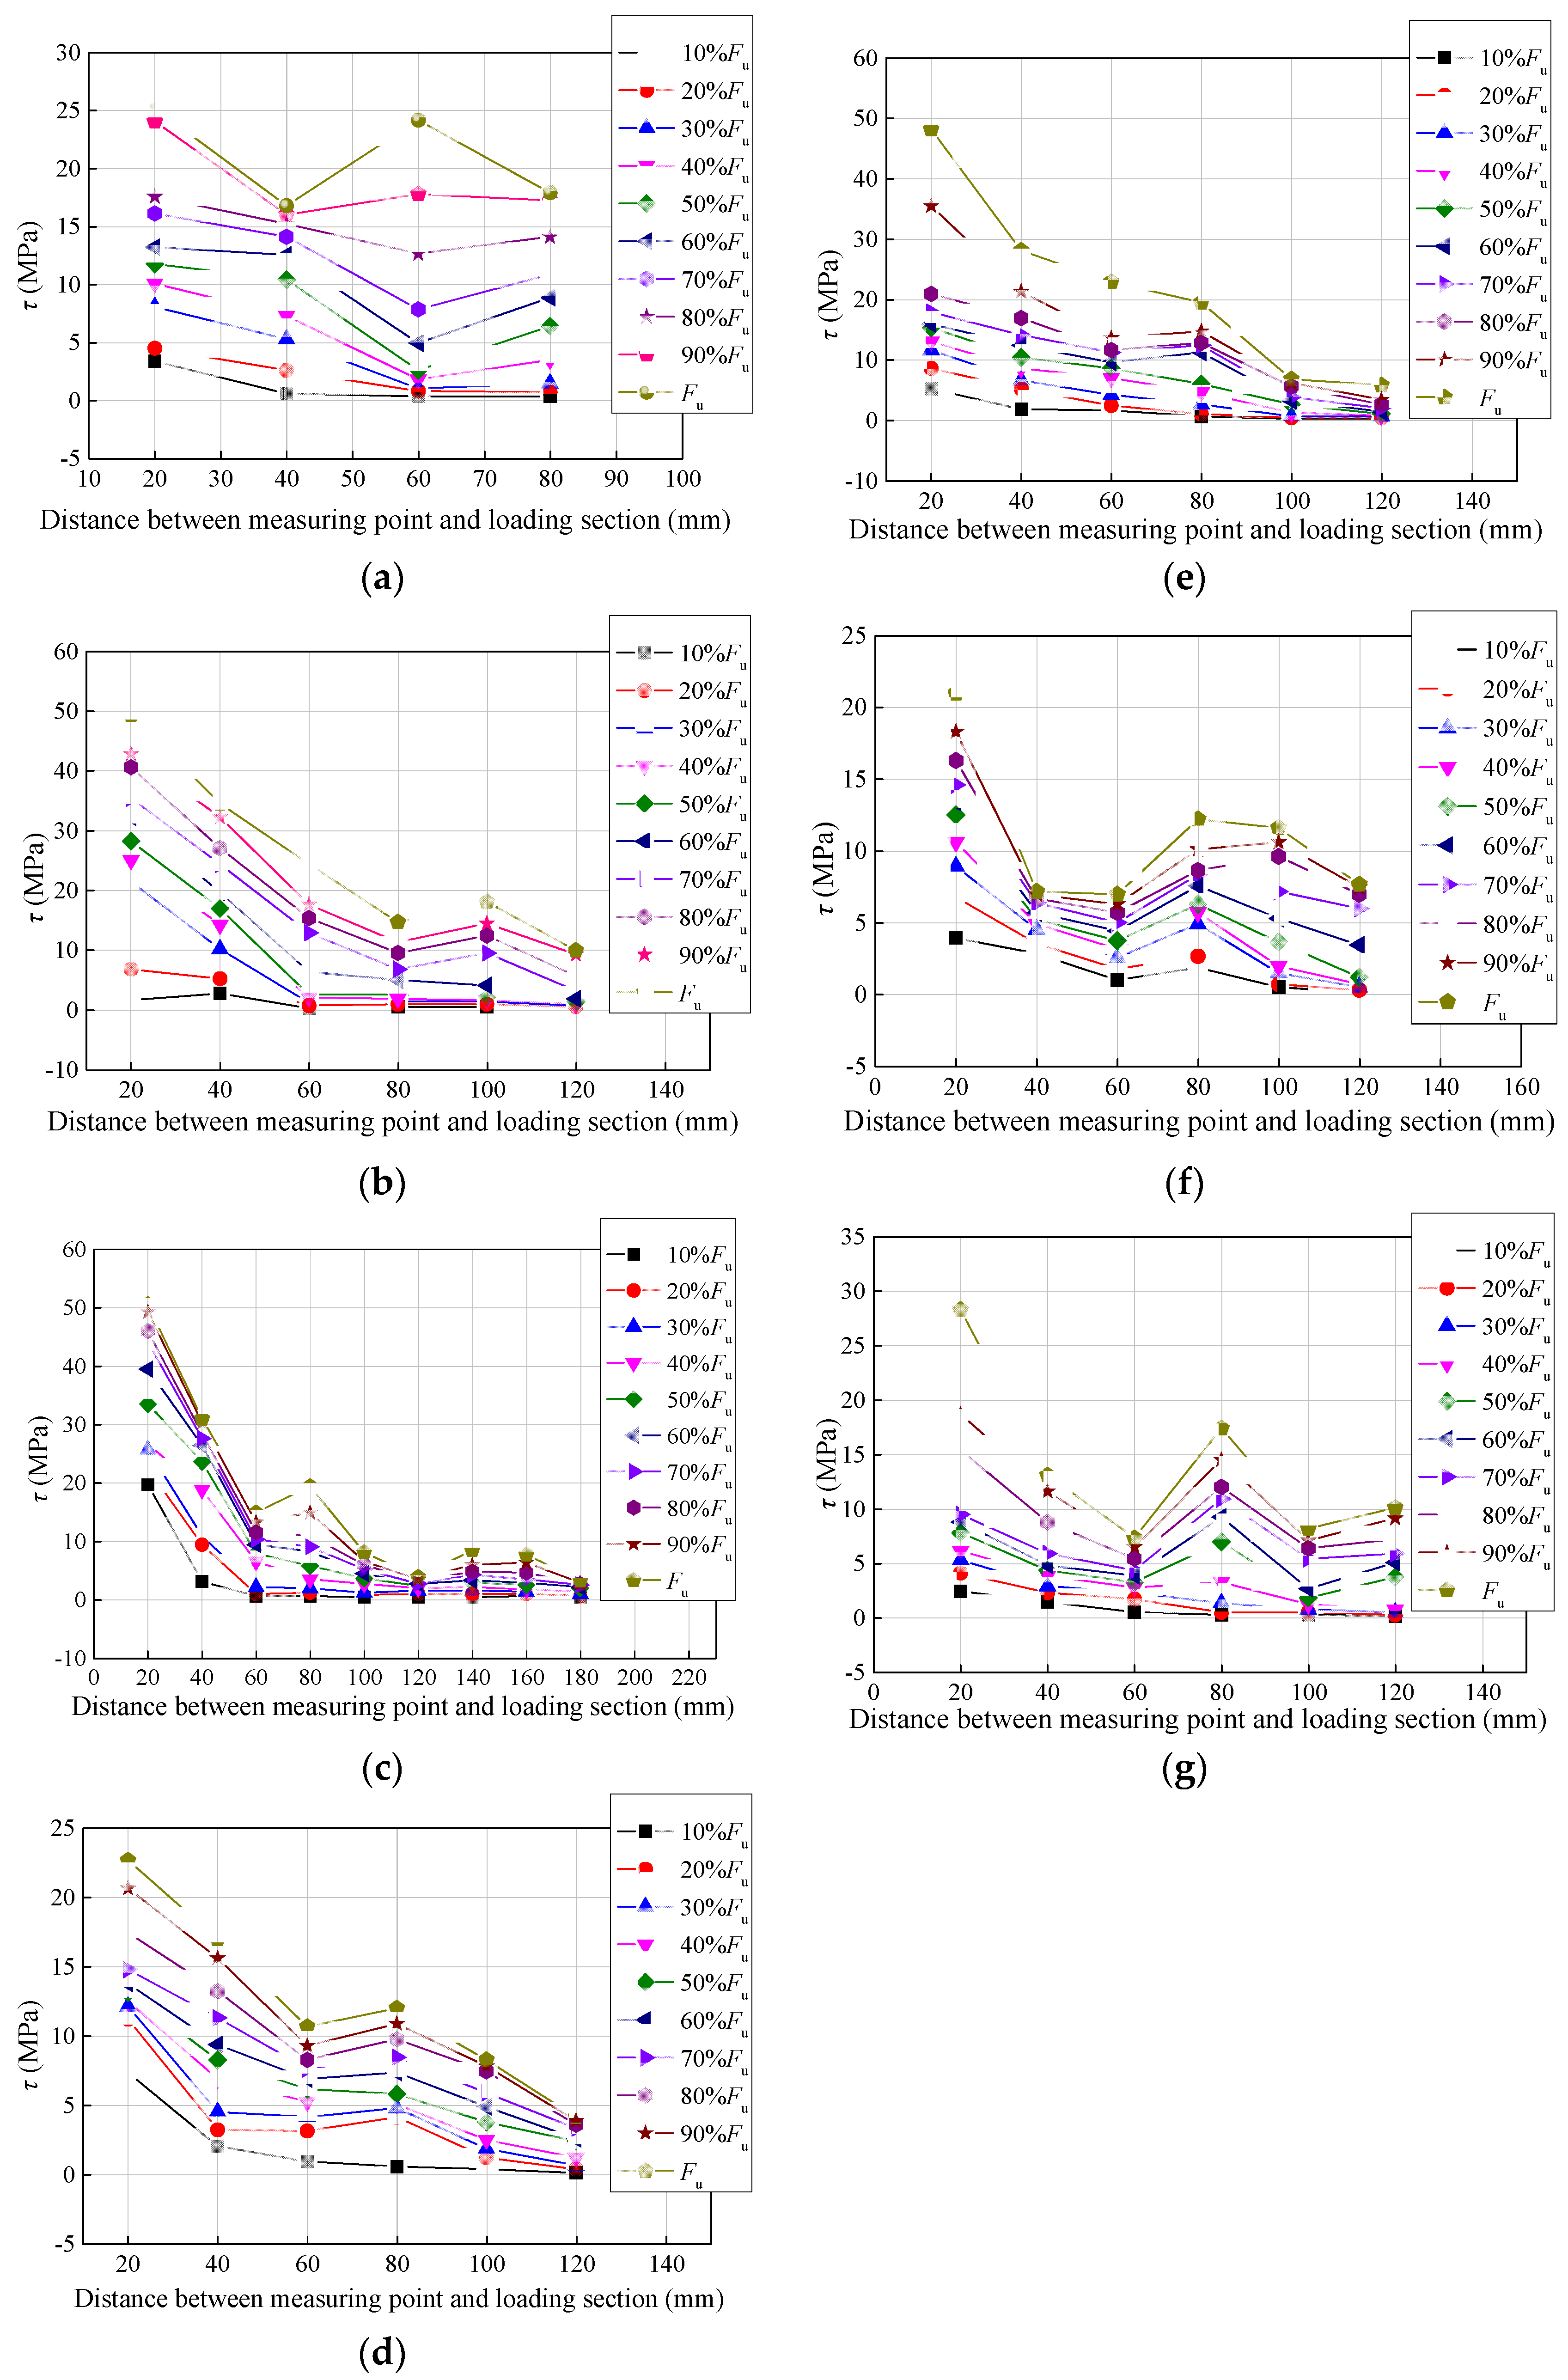
The bonding stress distribution in the bonding section decreases from the loaded end to the free end due to the “hoop effect” of the loaded plate in the pull-out test. During the early stage of loading, the bonding stress distribution of rebar in the beam test has the same distribution as that in the pull-out test. However, as the load increases, the bonding stress distribution in the beam test gradually develops a “double-peak” feature. Compared with the pull-out test, the bonding stress distribution of the rebar obtained by the beam test without the influence of the “hoop effect” of the loaded plate is closer to the actual stress state. Therefore, the beam test method is preferred to measure the distribution of bonding stresses in the bonding section.
(5)
The treatment of strain gauges applied internally after slotting the rebar has no significant effect on the determination of the bond strength between the rebar and the concrete in the pull-out test. It should be noted, however, that for some special cases (e.g., high concrete strength grade or large bonding length), the slotted rebar may fracture under loads below their ultimate tensile strength. In pull-out tests, the configuration of the specimen with stirrups may change its mode of failure, thereby significantly increasing its average bond strength. For tests where a uniform failure mode (e.g., debonding failure) is expected, concrete splitting failure of the specimen can be avoided by configuring the specimen with stirrups.
(6)
The influence of bond length on failure mode transition is an important phenomenon worthy of in-depth discussion. As bond length increases, the failure mode may transition from interfacial pullout failure at short lengths to concrete splitting failure at longer lengths. This transition stems from the cumulative effect of bond stress; when the length exceeds a critical value, the accumulation of radial tensile stress may trigger splitting of the concrete cover. It is recommended to analyze in detail the failure characteristics at different bond lengths, including crack development patterns and load–displacement curve differences, to accurately identify the transition point. This analysis has important engineering significance because splitting failure typically exhibits brittle behavior while pullout failure is relatively ductile. This mode transition should be considered in anchorage length design to ensure structural safety and ductility performance.
(7)
This study is subject to limitations in specimen quantity and laboratory conditions, which may impose certain constraints on statistical reliability and engineering applicability. Future research should expand the specimen scale, consider size effects and actual service environment influences, establish a systematic theoretical framework for correction factors, and integrate experimental data with numerical simulations to enhance the practical engineering value of the research findings and provide a more reliable theoretical basis for the improvement of relevant testing method standards.

5. Conclusions

A total of 27 pull-out bonding specimens and 21 beam bonding specimens were tested to evaluate the bond behaviors between rebar and concrete. The impact of the test methods and the bonding conditions on the failure mode, bonding strength, bonding stress distribution, and bond–slip behavior was reported. Moreover, some recommendations regarding how to select the appropriate test methods to evaluate the bonding performance between rebar and concrete were provided. From the above work, the following conclusions can be drawn:
(1)
For specimens with large bonding lengths or high concrete strength grades, there are differences in the failure modes observed by the pull-out test versus the beam test. The bond strengths of rebar and concrete obtained by the pull-out test were greater than those determined by the beam test under the same bonding conditions (1.11–2.36 times). Compared with the beam test method, the pull-out test method was more sensitive to changes in bonding length, concrete strength grade, and rebar diameter.
(2)
For specimens exhibiting debonding failure, the bond–slip curves of rebar and concrete measured by the pull-out test and the beam test were similar. For the specimens experiencing concrete splitting failure, both test methods failed to measure the falling section of the bond–slip curve, and the bond–slip curve obtained from the pull-out test showed more significant dispersion.
(3)
The maximum bonding stresses in the bonding section of the rebar in both the pull-out and beam tests appeared near the loading end. However, as the load increased, the bonding stress distribution of the rebar obtained from the pull-out test decreased from the loaded end to the free end, while the bonding stress distribution of the rebar in the beam test showed a double-peak characteristic.
(4)
The average bond strength of rebar and concrete measured by the pull-out test cannot be used directly in actual structural design; rather, it must be properly amended. The beam test method is more suitable than the pull-out test method for obtaining the bond–slip characteristics of the rebar and concrete, as well as the bonding stress distribution of the rebar in the bonding section.
(5)
The treatment of internal slotting of the rebar followed by the internal application of strain gauges has no appreciable effect on the bonding characteristics between the rebar and the concrete; however, for specimens with large bonding lengths and high concrete strength grades, the rebar may fracture at loads below their tensile limit.
(6)
In practical engineering applications, the beam test method should be prioritized for evaluating the bond performance between rebar and concrete, especially for important structures requiring precise understanding of rebar–concrete interface behavior. For high-strength concrete or large-diameter rebar components, special attention should be paid to the differences between test results and actual structural behavior, ensuring sufficient safety margins in design.

Author Contributions

Conceptualization, S.C.; methodology, C.L.; formal analysis, J.D.; investigation, Z.L.; writing—original draft preparation, S.C. All authors have read and agreed to the published version of the manuscript.

Funding

The research described in this paper was financially supported by the Natural Science Basic Research Program of Shaanxi (No. 2023-JC-QN-0479), Fundamental Research Funds for the Central Universities (No. 300102284501), the project of Shaanxi Outstanding Youth Science Foundation (2023-JC-JQ-47), the project of Shaanxi International Science and Technology Cooperation Program Project (2024GH-ZDXM-18), and the project of Shaanxi University Youth Innovation Team Program (2023).

Data Availability Statement

The original contributions presented in this study are included in the article. Further inquiries can be directed to the corresponding author.

Acknowledgments

The authors would like to extend thanks to the Natural Science Basic Research Program of Shaanxi and Fundamental Research Funds for the Central Universities.

Conflicts of Interest

The authors declare no conflicts of interest.

References

  1. Gkournelos, P.D.; Triantafillou, T.C.; Bournas, D.A. Seismic upgrading of existing reinforced concrete buildings: A state-of-the-art review. Eng. Struct. 2021, 240, 112273. [Google Scholar] [CrossRef]
  2. Phan, T.S.; Rossi, P.; Tailhan, J.L. Numerical modelling of the concrete/rebar bond. Cem. Concr. Comp. 2015, 59, 1–9. [Google Scholar] [CrossRef]
  3. Songpiriyakij, S.; Pulngern, T.; Pungpremtrakul, P.; Jaturapitakkul, C. Anchorage of steel bars in concrete by geopolymer paste. Mater. Design. 2011, 32, 3021–3028. [Google Scholar] [CrossRef]
  4. Kim, S.W.; Yun, H.D.; Park, W.S.; Jang, Y.I. Bond strength prediction for deformed steel rebar embedded in recycled coarse aggregate concrete. Mater. Design. 2015, 83, 257–269. [Google Scholar] [CrossRef]
  5. Hu, X.; Peng, G.; Niu, D.; Wu, X.; Zhang, L. Bond behavior between deformed steel bars and cementitious grout. Constr. Build. Mater. 2020, 262, 120810. [Google Scholar] [CrossRef]
  6. Baktheer, A.; Spartali, H.; Hegger, J.; Chudoba, R. High-cycle fatigue of bond in reinforced high-strength concrete under push-in loading characterized using the modified beam-end test. Cem. Concr. Comp. 2021, 118, 103978. [Google Scholar] [CrossRef]
  7. Jin, L.; Li, X.; Zhang, R.; Du, X. Bond-slip behavior between concrete and deformed rebar at elevated temperature: Mesoscale simulation and formulation. Int. J. Mech. 2021, 205, 106622. [Google Scholar] [CrossRef]
  8. Natino, M.R.; Yang, Y.; Nakamura, H.; Miura, T. Experimental study on bond behavior of corroded rebars coated by anti-corrosive materials in polymer cement mortar. Constr. Build. Mater. 2021, 300, 124228. [Google Scholar] [CrossRef]
  9. Alharbi, Y.R.; Galal, M.; Abadel, A.A.; Kohail, M. Bond behavior between concrete and steel rebars for stressed elements. Ain Shams Eng. J. 2020, 12, 1231–1239. [Google Scholar] [CrossRef]
  10. Xu, Y.L.; Shen, W.D.; Wang, H. Experimental research on bonding and anchoring performance of reinforced concrete. J. Build. Struct. 1994, 3, 26–37. (In Chinese) [Google Scholar]
  11. Darwin, D.; Graham, E.K. Effect of deformation height and spacing on bond strength of reinforcing bars. ACI Struct. J. 1993, 90, 646–657. [Google Scholar]
  12. Haskett, M.; Oehlers, D.J.; Ali, M.S.M. Local and global bond characteristics of steel reinforcing bars. Eng. Struct. 2008, 30, 376–383. [Google Scholar] [CrossRef]
  13. Huang, L.; Ye, H.; Xu, L.; Chi, Y. A mechanistic model for the nonlinear bond behavior of rebar in concrete. Eng. Struct. 2021, 231, 111715. [Google Scholar] [CrossRef]
  14. RILEM. Tentative Recommendations: Recommendations for Reinforcing Steel, Bond Test for Reinforcing Steel: 1-Beam Test (RC5) 2-Pull Out Test (RC6); CEB-FIP: Paris, France, 1972. [Google Scholar]
  15. Windisch, A. A modified pull-out test and new evaluation methods for a more real local bond-slip relationship. Mater. Struct. 1985, 18, 181–184. [Google Scholar] [CrossRef]
  16. Filho, F.M.D.A.; Debs, M.K.E.; Debs, A.L.H.C.E. Bond-slip behavior of self-compacting concrete and vibrated concrete using pull-out and beam tests. Mater. Struct. 2008, 41, 1073–1089. [Google Scholar] [CrossRef]
  17. ASTM C234-91; Standard Test Method for Comparing Concretes on the Basis of the Bond Developed with Reinforcing Steel. ASTM International: West Conshohocken, PA, USA, 2015.
  18. ASTM A370-21; Standard Test Methods and Definitions for Mechanical Testing of Steel Products. ASTM International: West Conshohocken, PA, USA, 2021.
  19. GB 50152-92; Standard for Test Methods of Concrete Structures. China Architecture & Building Press: Beijing, China, 1992. (In Chinese)
  20. GB/T 50152-2012; Standard for Test Methods of Concrete Structures. China Architecture & Building Press: Beijing, China, 2014. (In Chinese)
  21. ACI 408.2R-92; State-of-the-Art Report on Bond under Cyclic Loads. American Concrete Institute: Farmington Hills, MI, USA, 1992.
  22. Cabrera, J.G. Deterioration of concrete due to reinforcement steel corrosion. Cem. Concr. Comp. 1996, 18, 47–59. [Google Scholar] [CrossRef]
  23. Harajli, M.H.; Hamad, B.S.; Rteil, A.A. Effect of confinement on bond strength between steel bars and concrete. ACI Struct. J. 2004, 101, 595–603. [Google Scholar] [CrossRef]
  24. Harajli, M.H. Bond stress–slip model for steel bars in unconfined or steel, FRC, or FRP confined concrete under cyclic loading. J. Struct. Eng. 2009, 135, 509–518. [Google Scholar] [CrossRef]
  25. Chana, P.S. A test method to establish realistic bond stresses. Mag. Concrete Res. 1990, 42, 83–90. [Google Scholar] [CrossRef]
  26. Hanjari, K.Z.; Coronelli, D.; Lundgren, K. Bond capacity of severely corroded bars with corroded stirrups. Mag. Concrete Res. 2011, 63, 953–968. [Google Scholar] [CrossRef]
  27. Ožbolt, J.; Oršanić, F.; Balabanić, G. Modeling pull-out resistance of corroded rebar in concrete: Coupled three-dimensional finite element model. Cem. Concr. Comp. 2014, 46, 41–55. [Google Scholar] [CrossRef]
  28. Law, D.W.; Tang, D.; Molyneaux, T.K.; Gravina, R. Impact of crack width on bond: Confined and unconfined rebar. Mater. Struct. 2011, 44, 1287–1296. [Google Scholar] [CrossRef]
  29. Sharma, A.; Bošnjak, J.; Ožbolt, J.; Hofmann, J. Numerical modeling of rebar pull-out and cover splitting in fire-exposed beam-end specimens. Eng. Struct. 2016, 111, 217–232. [Google Scholar] [CrossRef]
  30. Liu, Y.; Wu, H.; Gao, Y.; Wang, W.; Wang, Z. Influence of macadamia nutshell particles on the apparent density and mechanical behavior of cement-based mortars. Constr. Build. Mater. 2024, 411, 134600. [Google Scholar] [CrossRef]
  31. Wang, L.; Yi, J.; Xia, H.; Fan, L. Experimental study of a pull-out test of corroded steel and concrete using the acoustic emission monitoring method. Constr. Build. Mater. 2016, 163, 170. [Google Scholar] [CrossRef]
  32. GB 50081-2002; Standard for Test Method of Mechanical Properties on Ordinary Concrete. China Architecture & Building Press: Beijing, China, 2002. (In Chinese)
  33. GB 175-2020; Common Portland Cement. China Architecture & Building Press: Beijing, China, 2020. (In Chinese)
  34. GB/T 228.1-2010; Metallic Materials-Tensile Testing-Part 1: Method of Test at Room Temperature. Standards Press of China: Beijing, China, 2010. (In Chinese)
  35. GB 1499.2-2018; Steel for the Rebar of Concrete—Part 2: Hot Rolled Ribbed Bars. China Architecture & Building Press: Beijing, China, 2018. (In Chinese)
  36. Skorobogatov, S.M. Influence of the geometry of deformed rebars on their bond strength in concrete. Proc. Inst. Civ. Eng. 1979, 67, 327–339. [Google Scholar] [CrossRef]
  37. Zhao, J.H.; Wang, M.F. Elastic Mechanics and Finite Element Method; Wuhan University of Technology Press: Wuhan, China, 2008. (In Chinese) [Google Scholar]
  38. Hong, X.J.; Zhang, Y. The fitting method of the smooth bond stress in the bond-slip test. Struct. Eng. 2000, 3, 44–48. (In Chinese) [Google Scholar]
Figure 1. Beam specimen in bonding performance test between rebar and concrete: (a) full-beam specimen with two half-beams connected by steel hinges; (b) beam end bonding specimen with slots in the shear span area; (c) beam specimen bonded in the pure bending section.
Buildings 15 02375 g001
Figure 2. Location of strain gauges and the bonding section of the rebars (unit: mm): (a) beam specimen; (b) pull-out specimen; (c) strain gauge location. Note: la = 5d, 7d, 10d; d = 16 mm, 22 mm, 25 mm.
Buildings 15 02375 g002aBuildings 15 02375 g002b
Figure 3. Constructional rebar and stirrup in specimens: (a) pull-out specimen; (b) beam specimen.
Buildings 15 02375 g003
Figure 4. Steel hinge in beam specimen: (a) design size; (b) steel hinges.
Buildings 15 02375 g004
Figure 5. Schematic diagram of bond test loading device and measurement point arrangement: (a) pull-out test; (b) beam test.
Buildings 15 02375 g005
Figure 6. Debonding failure of pull-out specimen.
Buildings 15 02375 g006
Figure 7. Concrete splitting failure of pull-out specimen: (a) the concrete splits into two pieces; (b) the concrete splits into three pieces.
Buildings 15 02375 g007
Figure 8. Debonding failure of beam specimen.
Buildings 15 02375 g008
Figure 9. Concrete splitting failure of beam specimen.
Buildings 15 02375 g009
Figure 10. Splitting–debonding failure of beam specimen.
Buildings 15 02375 g010
Figure 11. Rebar fracture failure of beam specimen.
Buildings 15 02375 g011
Figure 12. Mechanical analysis model of half-beams.
Buildings 15 02375 g012
Figure 13. Effect of bonding conditions on the bond strength: (a) bonding length; (b) concrete strength grade; (c) rebar diameter.
Buildings 15 02375 g013aBuildings 15 02375 g013b
Figure 14. Pull-out test bond–slip curve and fitting curve: (a) debonding failure; (b) concrete splitting.
Buildings 15 02375 g014
Figure 15. Beam test bond–slip curve and fitted curve: (a) debonding failure; (b) concrete splitting.
Buildings 15 02375 g015
Figure 16. Analytical model of the bond stress of rebar [38].
Buildings 15 02375 g016
Figure 17. Bonding stress distribution of rebar in pull-out test: (a) P6-5d-C30; (b) P6-7d-C30; (c) P6-10d-C30; (d) P6-7d-C35; (e) P6-7d-C40; (f) P2-7d-C30; (g) P5-7d-C30.
Buildings 15 02375 g017
Figure 18. Bonding stress distribution of rebar in beam test: (a) P6-5d-C30; (b) P6-7d-C30; (c) P6-10d-C30; (d) P6-7d-C35; (e) P6-7d-C40; (f) P2-7d-C30; (g) P5-7d-C30.
Buildings 15 02375 g018
Table 1. Mixture and compressive strength of concrete.
Strength GredeMixtureCuring Duration (MPa)
Cement–Sand–Stone–Water7 Days14 Days28 Days
C301:2.145:3.352:0.48021.3624.3131.69
C351:2.145:3.352:0.48028.5131.0235.32
C401:1.676:2.736:0.40035.4240.3741.07
Table 2. Mechanical properties of rebars.
Strength GradeDiameter d (mm)Yield Strength fy (N/mm2)Ultimate Strength f (N/mm2)Elasticity Modulus E (N/mm2)Yield Ratio
f/fy
Elongation After Fracture A
HPB3358341.8464.92.0 × 1051.3627.4%
HRB40010416.6562.82.0 × 1051.3526.7%
16418.3573.51.3727.3%
22427.9582.71.3625.9%
25433.6603.41.3926.1%
Table 3. Specimen parameters and grouping.
Specimen GroupingDiameter of Rebar (mm)Concrete StrengthBonding Length (mm)StirrupRebar Grooving
P6-5d-C3016C3080NoneYes
P6-7d-C3016C30112NoneYes
P6-10d-C3016C30160NoneYes
P6-7d-C3516C35112NoneYes
P6-7d-C4016C40112NoneYes
P2-7d-C3022C30154NoneYes
P5-7d-C3025C30175NoneYes
P6-10d-C30-016C30160NoneNo
P6-10d-C30-116C30160φ8@50No
B6-5d-C3016C3080φ8@50Yes
B6-7d-C3016C30112φ8@50Yes
B6-10d-C3016C30160φ8@50Yes
R6-7d-C3516C35112φ8@50Yes
B6-7d-C4016C40112φ8@50Yes
B2-7d-C3022C30154φ8@50Yes
B5-7d-C3025C30175φ8@50Yes
Note: P represents pull-out specimens; B represents beam specimens; 6, 2, and 5, respectively, represent the 16 mm, 22 mm, and 25 mm nominal diameters of the stressed rebar; 5d, 7d, and 10d represent the bonding lengths of 5 times, 7 times, or 10 times the diameter of the rebar; C30, C35, and C40 represent the strength grade of the concrete.
Table 4. Distribution of specimen failure modes.
Pull-Out TestBeam Test
Specimen groupingFailure modeSpecimen groupingFailure mode
P6-5d-C30DebondingB6-5d-C30Debonding
P6-7d-C30DebondingB6-7d-C30Debonding
P6-10d-C30Concrete splittingB6-10d-C30Rebar fracture
P6-10d-C30-0Concrete splitting--
P6-10d-C30-1Debonding--
P6-7d-C35Concrete splittingB6-7d-C35Pull out after splitting
P6-7d-C40Concrete splittingB6-7d-C40Pull out after splitting
P2-7d-C30Concrete splittingB2-7d-C30Concrete splitting
P5-7d-C30Concrete splittingB5-7d-C30Concrete splitting
Note: The failure mode of each group of specimens is the representative failure mode for the group of three specimens, i.e., if two specimens in the group experienced debonding failure and one endured concrete splitting failure, the representative failure mode of the group is considered debonding failure.
Table 5. Average bond strength.
Pull-Out TestBeam Test
GroupingF1 (kN)τ1 (MPa)SD1 (MPa)GroupingF2 (kN)τ2 (MPa)SD2 (MPa)τ1/τ2
P6-5d-C3097.724.23 1.09B6-5d-C3041.210.25 3.972.36
P6-7d-C3094.416.351.75B6-7d-C3051.99.22 2.281.77
P6-10d-C30104.112.82 1.22B6-10d-C3058.17.22 1.761.78
P6-10d-C30-090.811.380.88-----
P6-10d-C30-1122.315.221.25-----
P6-7d-C35123.321.32 1.33B6-7d-C3560.810.80 2.741.97
P6-7d-C40131.322.33 0.82B6-7d-C4071.812.75 3.651.75
P2-7d-C30141.713.22 0.98B2-7d-C3093.78.80 2.781.50
P5-7d-C30114.58.35 1.41B5-7d-C30103.87.55 1.851.11
Note: F1 and F2 are the ultimate loads measured by the pull-out test and beam test, respectively. τ1 and τ2 are the mean bond stress corresponding to the pull-out test and beam test, respectively. SD1 and SD2 are the standard deviations of bond stress corresponding to the pull-out test and beam test, respectively.
Disclaimer/Publisher’s Note: The statements, opinions and data contained in all publications are solely those of the individual author(s) and contributor(s) and not of MDPI and/or the editor(s). MDPI and/or the editor(s) disclaim responsibility for any injury to people or property resulting from any ideas, methods, instructions or products referred to in the content.

