Article

Early-Strength Controllable Geopolymeric CLSM Derived by Shield Tunneling Muck: Performance Optimization and Hydration Mechanism of GGBFS–CS Systems

1
CCCC Second Highway Consultants Co., Ltd., Wuhan 430056, China
2
Research and Development Center on Tunnel and Underground Space Technology, CCCC, Wuhan 430056, China
3
College of Civil and Transportation Engineering, The Underground Polis Academy, Shenzhen University, Shenzhen 518060, China
4
School of Architecture and Civil Engineering, Jiangsu University of Science and Technology, Zhenjiang 212100, China
*
Author to whom correspondence should be addressed.
Buildings 2025, 15(13), 2373; https://doi.org/10.3390/buildings15132373
Submission received: 9 June 2025 / Revised: 30 June 2025 / Accepted: 2 July 2025 / Published: 6 July 2025
(This article belongs to the Section Building Materials, and Repair & Renovation)

Abstract

The large-scale reuse of shield tunneling muck remains a major challenge in urban construction. This study proposes a geopolymeric-controlled low-strength material (GC-CLSM) utilizing shield tunneling muck as the primary raw material and a novel alkali-activated binder composed of ground granulated blast-furnace slag (GGBFS) and carbide slag (CS). Emphasis is placed on early-age strength development and its underlying mechanisms, which were often overlooked in previous CLSM studies. Among the tested mixtures, a GGBFS:CS ratio of 80:20 yielded the best balance between early and long-term strength. Its 1-day UCS reached 1.18–1.75 MPa, representing a 6.3–23.6-fold increase over the low-CS reference (90:10), which achieved only 0.05–0.31 MPa. However, excessive CS content (e.g., 60:40) led to a significant reduction in the 28-day strength—up to nearly 50% compared with the 90:10 mix—due to impaired microstructural densification. Microstructural analyses (pore-solution pH, SEM, EDS, XRD, FTIR, LF-NMR) confirmed that higher CS levels enhanced early C–A–S–H gel formation by increasing OH and Ca2+ availability while compromising long-term structure. Additionally, the GC-CLSM system reduced carbon emissions by 68.6–70.3% per ton of treated shield tunneling muck compared with conventional cement-based CLSM. Overall, this study offers a sustainable and performance-driven approach for the valorization of shield tunneling muck, enabling the development of early-strength controllable, low-carbon CLSM for infrastructure applications.

1. Introduction

With the rapid development of urban infrastructure, shield tunneling has become a dominant method for underground construction in modern cities. However, this process generates a large volume of excavated spoil, commonly referred to as shield tunneling muck, the disposal of which poses a growing challenge due to limited urban land resources [1,2,3]. It is estimated that over 50 million cubic meters of such muck are produced annually in urban areas [4]. Shield tunneling muck is typically characterized by poor mechanical properties, high moisture content, and potential contamination. Improper disposal can lead to secondary hazards such as slope instability and environmental pollution [5,6]. Therefore, there is an urgent need to develop efficient and environmentally sustainable strategies for its reuse.
Converting shield tunneling muck into controlled low-strength material (CLSM) is considered one of the most promising strategies for its large-scale reuse. CLSM is a highly flowable, self-compacting, and strength-controllable backfill material [7,8,9,10] that has been widely applied in various geotechnical and infrastructure scenarios, including utility trench backfilling, road and airport subbase construction, tunnel backgrouting, abutment fills, abandoned well sealing, and soft ground improvement [11,12]. Previous studies have explored the use of ordinary Portland cement (OPC) as a binder to stabilize shield tunneling muck for CLSM applications, systematically evaluating properties such as flowability, unconfined compressive strength (UCS), bleeding, setting time, density, and shrinkage. These investigations confirm the significant potential of cement-stabilized shield tunneling muck as a viable CLSM formulation [13,14,15].
However, the high carbon emissions associated with cement production hinder the achievement of carbon neutrality targets [16,17,18]. In recent years, growing attention has been directed toward replacing cement with geopolymer-based binders for CLSM production, aiming to reduce the carbon footprint while promoting the high-value utilization of industrial by-products [19,20]. This approach offers considerable environmental and resource recovery benefits. For instance, Sun et al. [21] developed an underwater-applicable CLSM using alkali-activated ground granulated blast-furnace slag (GGBFS) combined with a small amount of cement, achieving a flowability of over 270 mm and a 28-day UCS of 1–2 MPa. Zhao et al. [22] used alkali-activated GGBFS and fly ash to stabilize shield tunneling muck, producing a CLSM with a 28-day strength of 1.84 MPa, a bleeding rate below 4.91%, and excellent flow characteristics. Zhang et al. [23] prepared a CLSM by activating GGBFS with alkalis to stabilize dredged sludge, achieving 3-day and 28-day strengths of 80.8 kPa and 157.6 kPa, respectively, and significantly improved flowability by incorporating 0.4% polycarboxylate superplasticizer. Park et al. [24] developed a CLSM using alkali-activated circulating fluidized bed combustion ash. At the optimal mix ratio, the compressive strength reached 0.98 MPa at 7 days and 3.65 MPa at 28 days. Chompoorat et al. [25] prepared a CLSM using alkali-activated fly ash and steel slag for pavement applications. They found that a fly ash-to-slag ratio of 80:20 exhibited the most favorable performance, with a 28-day strength of 3.5 MPa. Jiang et al. [26] produced a CLSM using an alkali-activated blend of red mud, slag, and iron tailing sand and further elucidated the underlying reaction mechanisms. Despite the encouraging advancements in geopolymer-based CLSM systems, prior research has largely centered on long-term strength performance [27,28], with insufficient focus on enhancing early-age strength. However, in real-world construction, CLSM is commonly used in applications that require rapid backfilling and early traffic loading, making early strength a critical factor for operational efficiency and safety [29,30]. The relatively low early-age reactivity of conventional geopolymer binders remains a key challenge, underscoring the importance of optimizing binder composition to improve early performance.
To develop a high-performance CLSM with controllable early-age strength, this study utilized shield tunneling muck as the primary material and introduced a composite alkali-activated binder composed of two industrial by-products: GGBFS and carbide slag (CS). The resulting material is referred to as GC-CLSM, a geopolymeric-controlled low-strength material incorporating GGBFS and CS. By adjusting the GGBFS-to-CS ratio, the fresh properties of the GC-CLSM—including flowability, bleeding rate, and setting time—were systematically evaluated, with particular emphasis on its early-strength-development behavior. To further elucidate the underlying mechanisms of strength regulation, a suite of microstructural characterization techniques—including pore-solution pH monitoring, scanning electron microscopy (SEM), energy-dispersive spectroscopy (EDS), X-ray diffraction (XRD), Fourier transform infrared (FTIR) spectroscopy, and low-field nuclear magnetic resonance (LF-NMR)—was employed to investigate the hydration process and microstructural evolution of the GC-CLSM system.

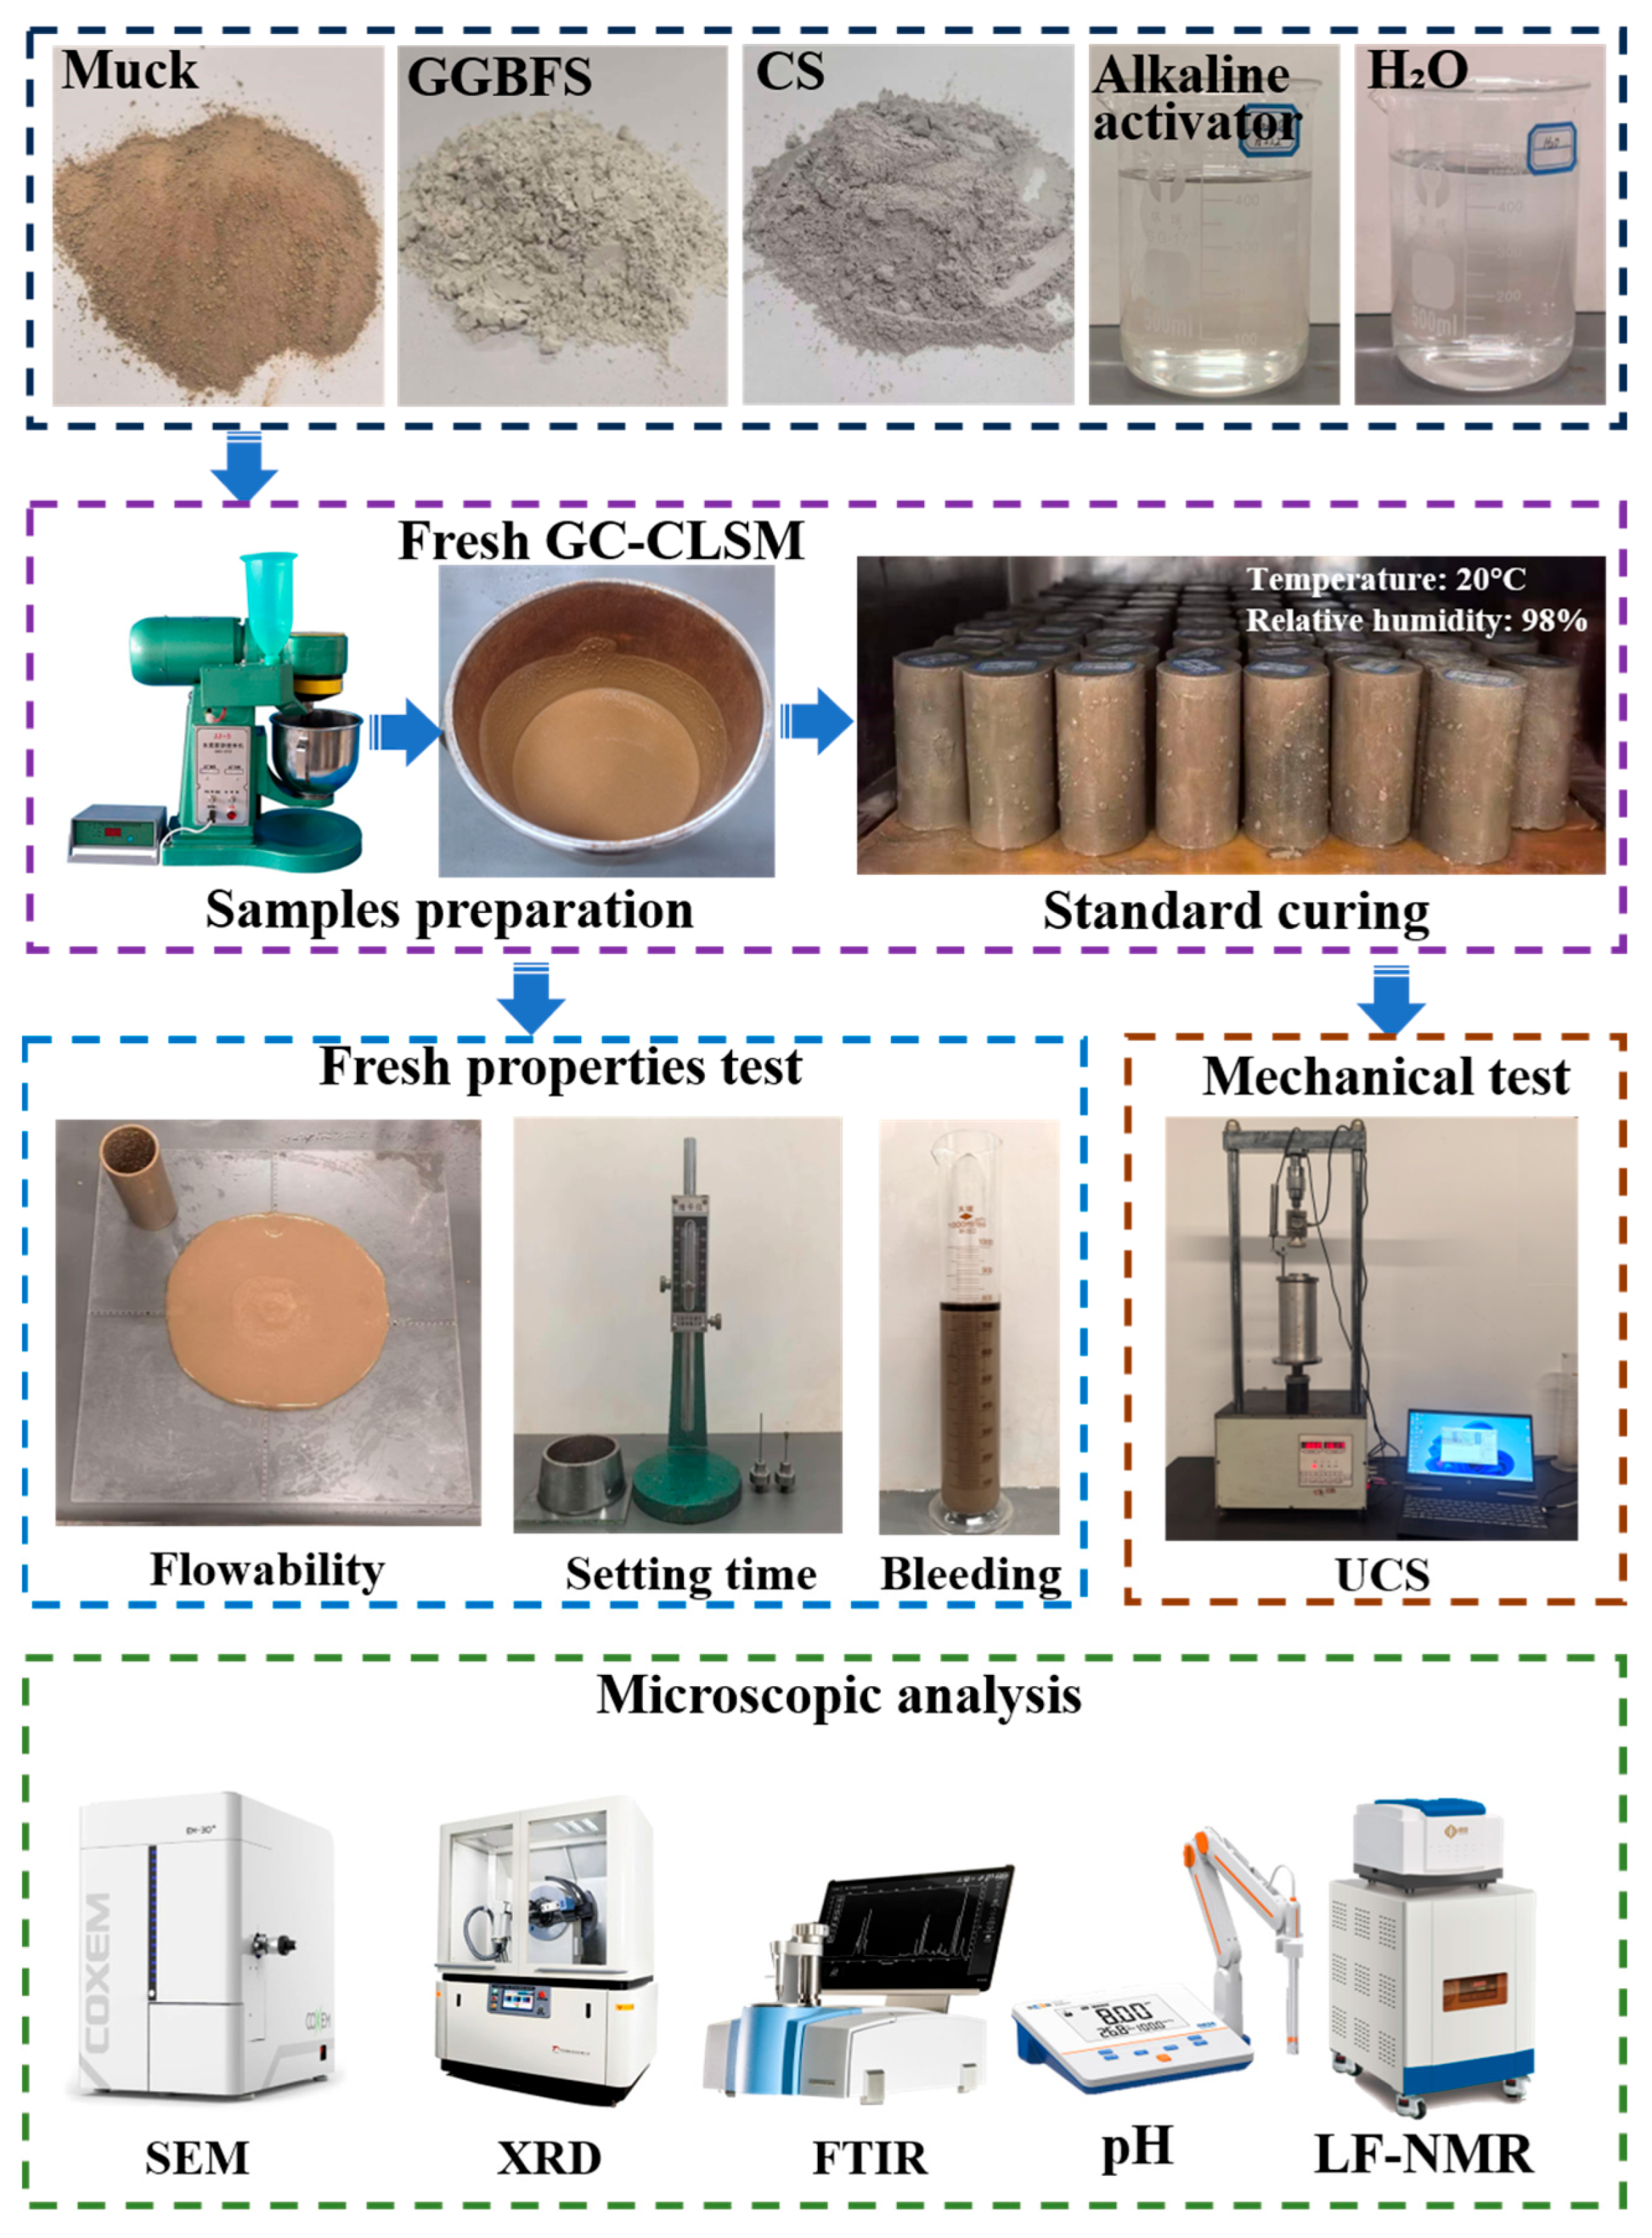
2. Materials and Methods

2.1. Materials

The shield tunneling muck used in this study was sourced from a metro tunneling project. After natural air-drying, the muck was sieved through a 2 mm mesh and then oven-dried at 105 °C for 24 h before being used as the base material for GC-CLSM preparation. The processed shield tunneling muck had a liquid limit of 33.35%, a plastic limit of 21.48%, and a specific gravity of 2.63. X-ray diffraction (XRD) and X-ray fluorescence (XRF) (Table 1 and Figure 1a) revealed that the primary mineral phases of the shield tunneling muck were quartz and calcite, indicating a composition dominated by siliceous and carbonate components. In addition, the XRF analysis detected trace levels of metal oxides such as MnO (0.07%), V2O5 (0.03%), Cr2O3 (0.02%), and Rb2O (0.01%), with a total content of less than 0.15 wt.%. These elements were present in very low concentrations and posed minimal environmental risk according to the typical regulatory thresholds for heavy metals in construction materials. Ground granulated blast-furnace slag (GGBFS) and carbide slag (CS) were used as the precursor materials for the alkali activation. The GGBFS, supplied by Hebei Jingye Group, was a by-product of ironmaking and was used after drying and grinding. The XRD analysis showed that the GGBFS was predominantly amorphous, as evidenced by a broad hump between 20° and 35° (2θ), with minor crystalline phases such as calcite and anorthite occasionally present. The CS was collected from a carbide production facility in Guangxi Province and served as an industrial by-product rich in calcium. According to the XRD results, the CS mainly contained the crystalline phases of calcite and Ca(OH)2.
Figure 1b illustrates the particle size distributions and characteristic particle diameters (D10, D50, D90) of the shield tunneling muck, GGBFS, and CS. The shield tunneling muck had D10, D50, and D90 values of 21.02 μm, 48.31 μm, and 108.33 μm, respectively. The corresponding values for the GGBFS were 1.53 μm, 9.79 μm, and 28.65 μm, and for CS, they were 3.67 μm, 20.63 μm, and 74.13 μm. The alkaline activator was prepared using a combination of sodium hydroxide (NaOH) and sodium silicate solution (Na2SiO3), adjusted to a modulus of 1.2. Analytical-grade NaOH was provided by Xilong Scientific Co., Ltd. (Shantou, China), and the sodium silicate solution (modulus 3.3) was obtained from Wuxi Weichi New Material Technology Co., Ltd. (Wuxi, China).

2.2. Fresh Properties of GC-CLSM

To evaluate the fresh properties of the GC-CLSM, tests were conducted on flowability, bleeding rate, and initial and final setting times. The flowability was measured in accordance with ASTM D6103 [31] using a flow cylinder with a height of 150 mm and an internal diameter of 75 mm. The freshly mixed GC-CLSM slurry was placed into the cylinder mold, and then the mold was lifted vertically to allow free flow of the material. The maximum horizontal spread and the spread in the perpendicular direction were recorded, and their average was taken as the flow value, which reflects the workability and flow behavior of the material.
The bleeding rate was determined following the procedure described in ASTM C940 [32]. The freshly mixed slurry was poured into a 1000 mL graduated cylinder, and the top was sealed with plastic wrap to minimize evaporation. The volume of free water accumulating at the surface was recorded at intervals until it stabilized. The bleeding rate was then calculated as the percentage of the free water volume relative to the total slurry volume, indicating the material’s stability and resistance to segregation.
The initial and final setting times were tested according to ASTM C403 [33] using the penetration resistance method. The penetration resistance was measured at regular intervals, and the times required to reach 3.5 MPa (initial set) and 27.6 MPa (final set) were recorded to characterize the setting behavior of the GC-CLSM.
For all fresh property tests, measurements were performed on a single batch per mix design based on a systematic gradient of GGBFS:CS ratios. A large number of mix trials were conducted to validate the observed trends, as shown in Table 2. All tests were carried out under tightly controlled laboratory conditions to ensure the consistency and reliability of the results.

2.3. Mechanical Property Testing

Unconfined compressive strength (UCS) tests were conducted in accordance with ASTM D2166/D2166M-13 [34]. Freshly prepared GC-CLSM slurry was cast into cylindrical molds with a diameter of 39.1 mm and a height of 80 mm to fabricate test specimens. After casting, the specimens were immediately sealed with plastic wrap to prevent moisture loss and placed in a curing chamber maintained at 98% relative humidity and 20 °C temperature. Following 24 h of curing under these conditions, the specimens were demolded carefully and returned to the curing chamber, where the same temperature and humidity were maintained until the designated testing ages. At each curing age, UCS tests were performed on three replicate specimens, and the average values were reported to ensure statistical reliability. The UCS tests were carried out using a fully automated unconfined compression testing machine manufactured by Nanjing Soil Instrument Factory (Nanjing, China). The consistent curing environment ensured the uniform hydration and strength development of the GC-CLSM specimens.

2.4. Microstructural Characterization

To investigate the influence of the GGBFS-to-CS ratio on the alkalinity of the GC-CLSM system, pore-solution pH tests were conducted following the centrifugation method described by Vollpracht et al. [35]. Fresh GC-CLSM slurry samples were collected at reaction times of 0.5, 1, 1.5, 2, 2.5, 3, 3.5, 4, 4.5, 5, 5.5, and 6 h. The pore solution was extracted using a centrifuge at 3000 rpm for 5 min, and the pH was immediately measured to evaluate the temporal evolution of the slurry alkalinity under different mix ratios.
Scanning electron microscopy (SEM) and energy-dispersive spectroscopy (EDS) analyses were performed using a COXEM EM-30 PLUS instrument (COXEM Co., Ltd., Daejeon, Republic of Korea) to examine the morphologies and microstructures of the hydration products in the selected specimens cured for 1 day. X-ray diffraction (XRD) was conducted using a TD-3500 diffractometer (Dandong Tongda Technology Co., Ltd., Dandong, China) to identify the crystalline phases present in paste samples cured for 1 and 28 days, thereby confirming the development of hydration products. Fourier transform infrared (FTIR) spectroscopy was carried out using a Bruker ALPHA II spectrometer (Bruker Optik GmbH, Ettlingen, Germany) to analyze the molecular structure and identify the functional groups associated with the hydration products. In addition, low-field nuclear magnetic resonance (LF-NMR) measurements were carried out using a MicroMR12-040V instrument (Suzhou Niumag Analytical Instrument Co., Ltd., Suzhou, China) to analyze the pore structure evolution. The pore size distributions of the specimens cured for 1 and 28 days were investigated to assess the microstructural changes over time.

2.5. GC-CLSM Preparation and Mix Design

Figure 2 illustrates the detailed preparation procedure and testing workflow for the GC-CLSM specimens. All GC-CLSM mixtures were prepared using a JJ-5 planetary mortar mixer (Wuxi Xiyi Building Material Instrument Co., Ltd., Wuxi, China). The mixing procedure was as follows: First, the pre-weighed dry components (shield tunneling muck, GGBFS, and CS) were added to the mixing bowl and dry-mixed at a low speed (140 rpm) for 30 s. Then, the pre-prepared alkali activator solution and water were gradually added while continuing the low-speed mixing for another 30 s. After that, the mixer was switched to high speed (285 rpm) for 60 s, followed by edge scraping and an additional 30 s of high-speed mixing to ensure a homogeneous slurry.
The fresh properties of the GC-CLSM slurry—including flowability, setting time, and bleeding rate—were evaluated immediately after mixing. The mechanical performance was assessed through UCS testing. For the microstructural analysis, various techniques including SEM, EDS, XRD, FTIR spectroscopy, LF-NMR, and pore-solution pH measurements were employed to investigate the reaction mechanisms and internal structure of the material at the early stages.
Table 2 presents the detailed mix design scheme for the GC-CLSM specimens. A total of 15 mix designs were developed using alkali-activated GGBFS and CS as binders to stabilize the shield tunneling muck. All binder contents are expressed as percentages of the dry mass of the shield tunneling muck. In all mixes, the total mass of the GGBFS and CS (dry basis) was fixed at 20% of the dry muck mass while the alkaline activator (NaOH + Na2SiO3) was added at 5%. These dosages were determined based on preliminary optimization tests in which binder contents of 15, 20, and 25% and activator dosages of 3, 5, and 7% were compared. The selected combination of 20% binder and 5% activator provided a good balance between strength, workability, and economic feasibility while avoiding issues such as excessive heat generation or insufficient activation.
Five different GGBFS-to-CS ratios were designed to investigate their effects on early-age strength and fresh properties: 100:0, 90:10, 80:20, 70:30, and 60:40. These ratios represent a systematic and incremental substitution of GGBFS by carbide slag in 10% steps, enabling clear observation of performance trends and transitional behaviors without introducing drastic compositional changes between mixes. For clarity, the mixtures are designated as G100C0, G90C10, G80C20, G70C30, and G60C40, respectively. Additionally, three water-to-solid (W/S) ratios of 40, 45, and 50% were employed to examine the influence of water content on both the fresh and early-age hardened properties of the GC-CLSM. In this study, the W/S ratio is consistently defined as the mass ratio of the total water—including mixing water and the water contained within the alkaline activator—to the total mass of the solids, comprising the shield tunneling muck, GGBFS, and CS.

3. Results

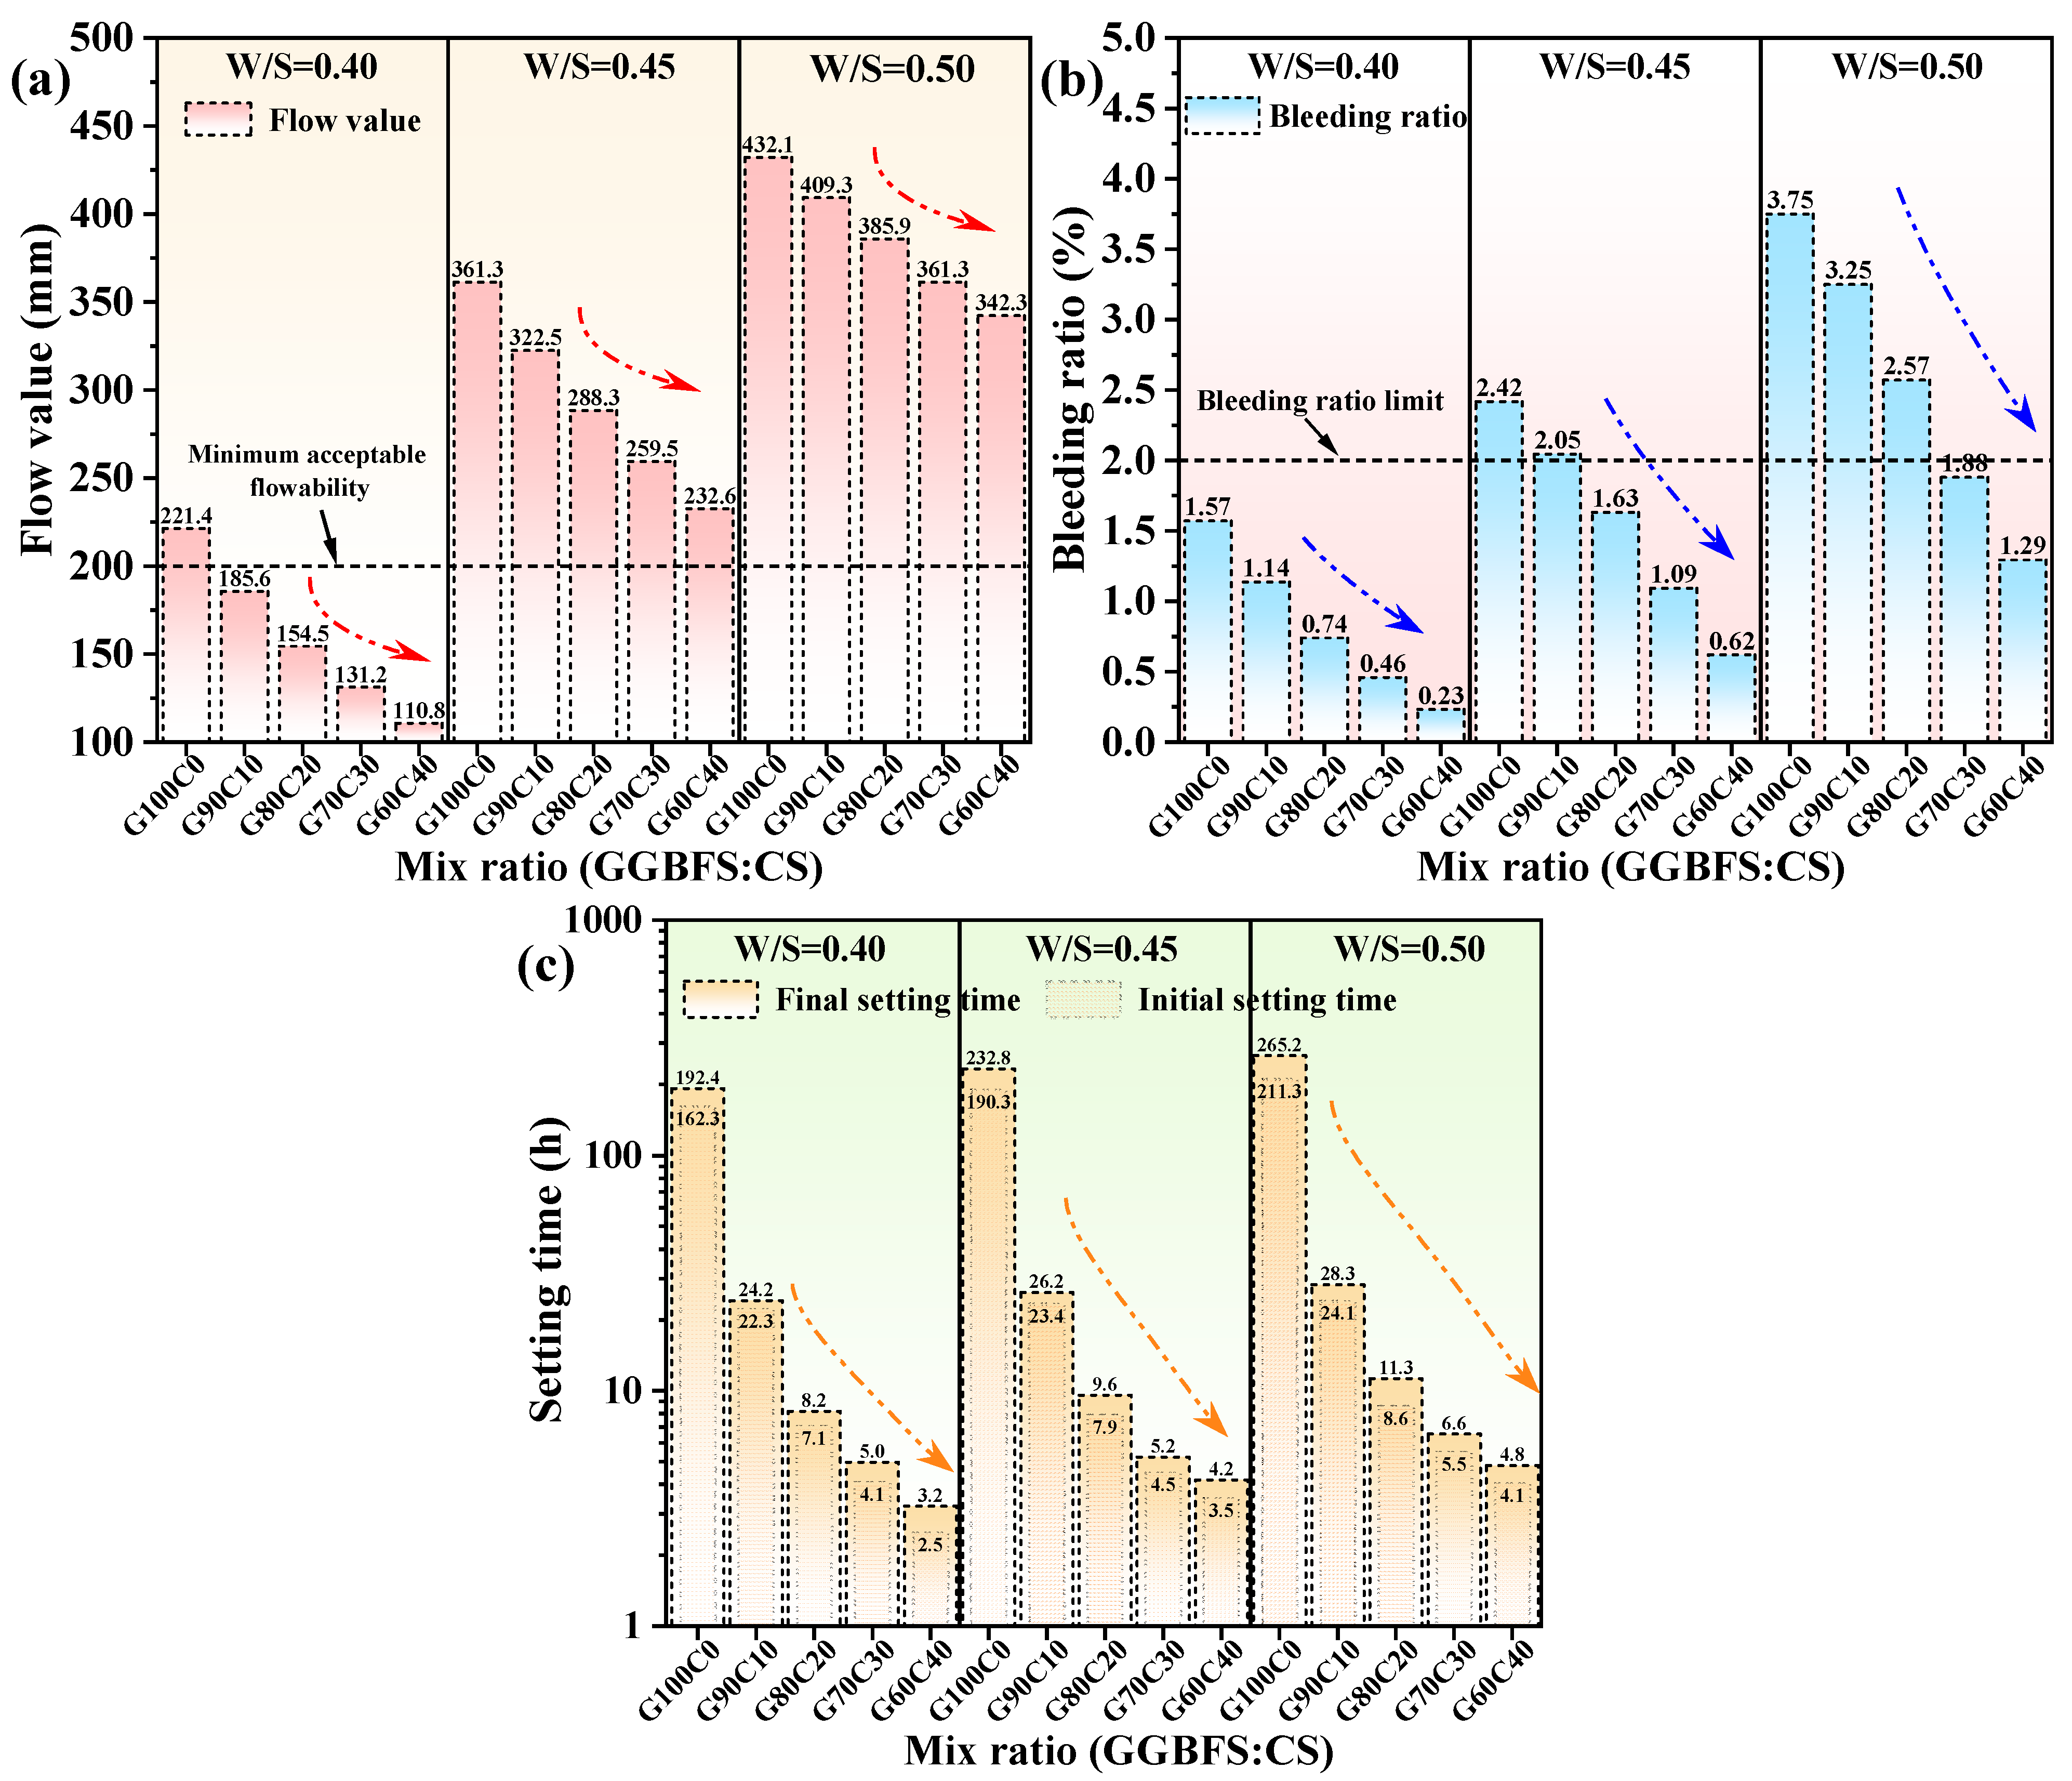
3.1. Fresh Properties

Figure 3a–c illustrate the flowability, bleeding rate, and setting characteristics of the GC-CLSM with varying W/S ratios and GGBFS:CS ratios. The results demonstrate consistent trends in all fresh properties in response to changes in both the W/S and binder composition. Specifically, increasing the W/S ratio from 40 to 50% has led to improved flowability, higher bleeding rates, and extended initial and final setting times. In contrast, reducing the GGBFS:CS ratio from 100:0 to 60:40 has resulted in decreased flowability and bleeding rate, accompanied by shortened initial and final setting times.
As the CS content increases (i.e., with decreasing GGBFS:CS ratios), the flowability values tend to drop below the 200 mm threshold specified in engineering guidelines. To provide a practical benchmark, engineering guidelines and ASTM D6103 [31] generally recommend a flowability of above 200 mm, a bleeding rate of below 2%, and a setting time within 12 h for CLSM applications. As demonstrated in Figure 3, these performance requirements can be effectively satisfied by tailoring the W/S ratio and GGBFS:CS ratio, thereby confirming the tunability and engineering applicability of the GC-CLSM’s fresh properties.
Taking the group with a W/S ratio of 45% as an example, when the GGBFS:CS ratio decreases from 100:0 to 60:40, the flow value drops from 361.3 to 232.6 mm, the bleeding rate decreases from 2.42 to 0.62%, the initial setting time is shortened dramatically from 190.3 to 3.5 h, and the final setting time from 232.8 to 4.2 h. These results demonstrate that the incorporation of CS markedly accelerates early-stage hydration kinetics, thereby altering the fresh properties of the GC-CLSM. Compared with conventional CLSM, which typically exhibits an initial setting time of 6–12 h, appropriately adjusting the GGBFS:CS ratio can significantly shorten the setting time, offering clear advantages in construction scenarios where early-strength development is required. The underlying mechanisms of this behavior are discussed in detail in Section 4.

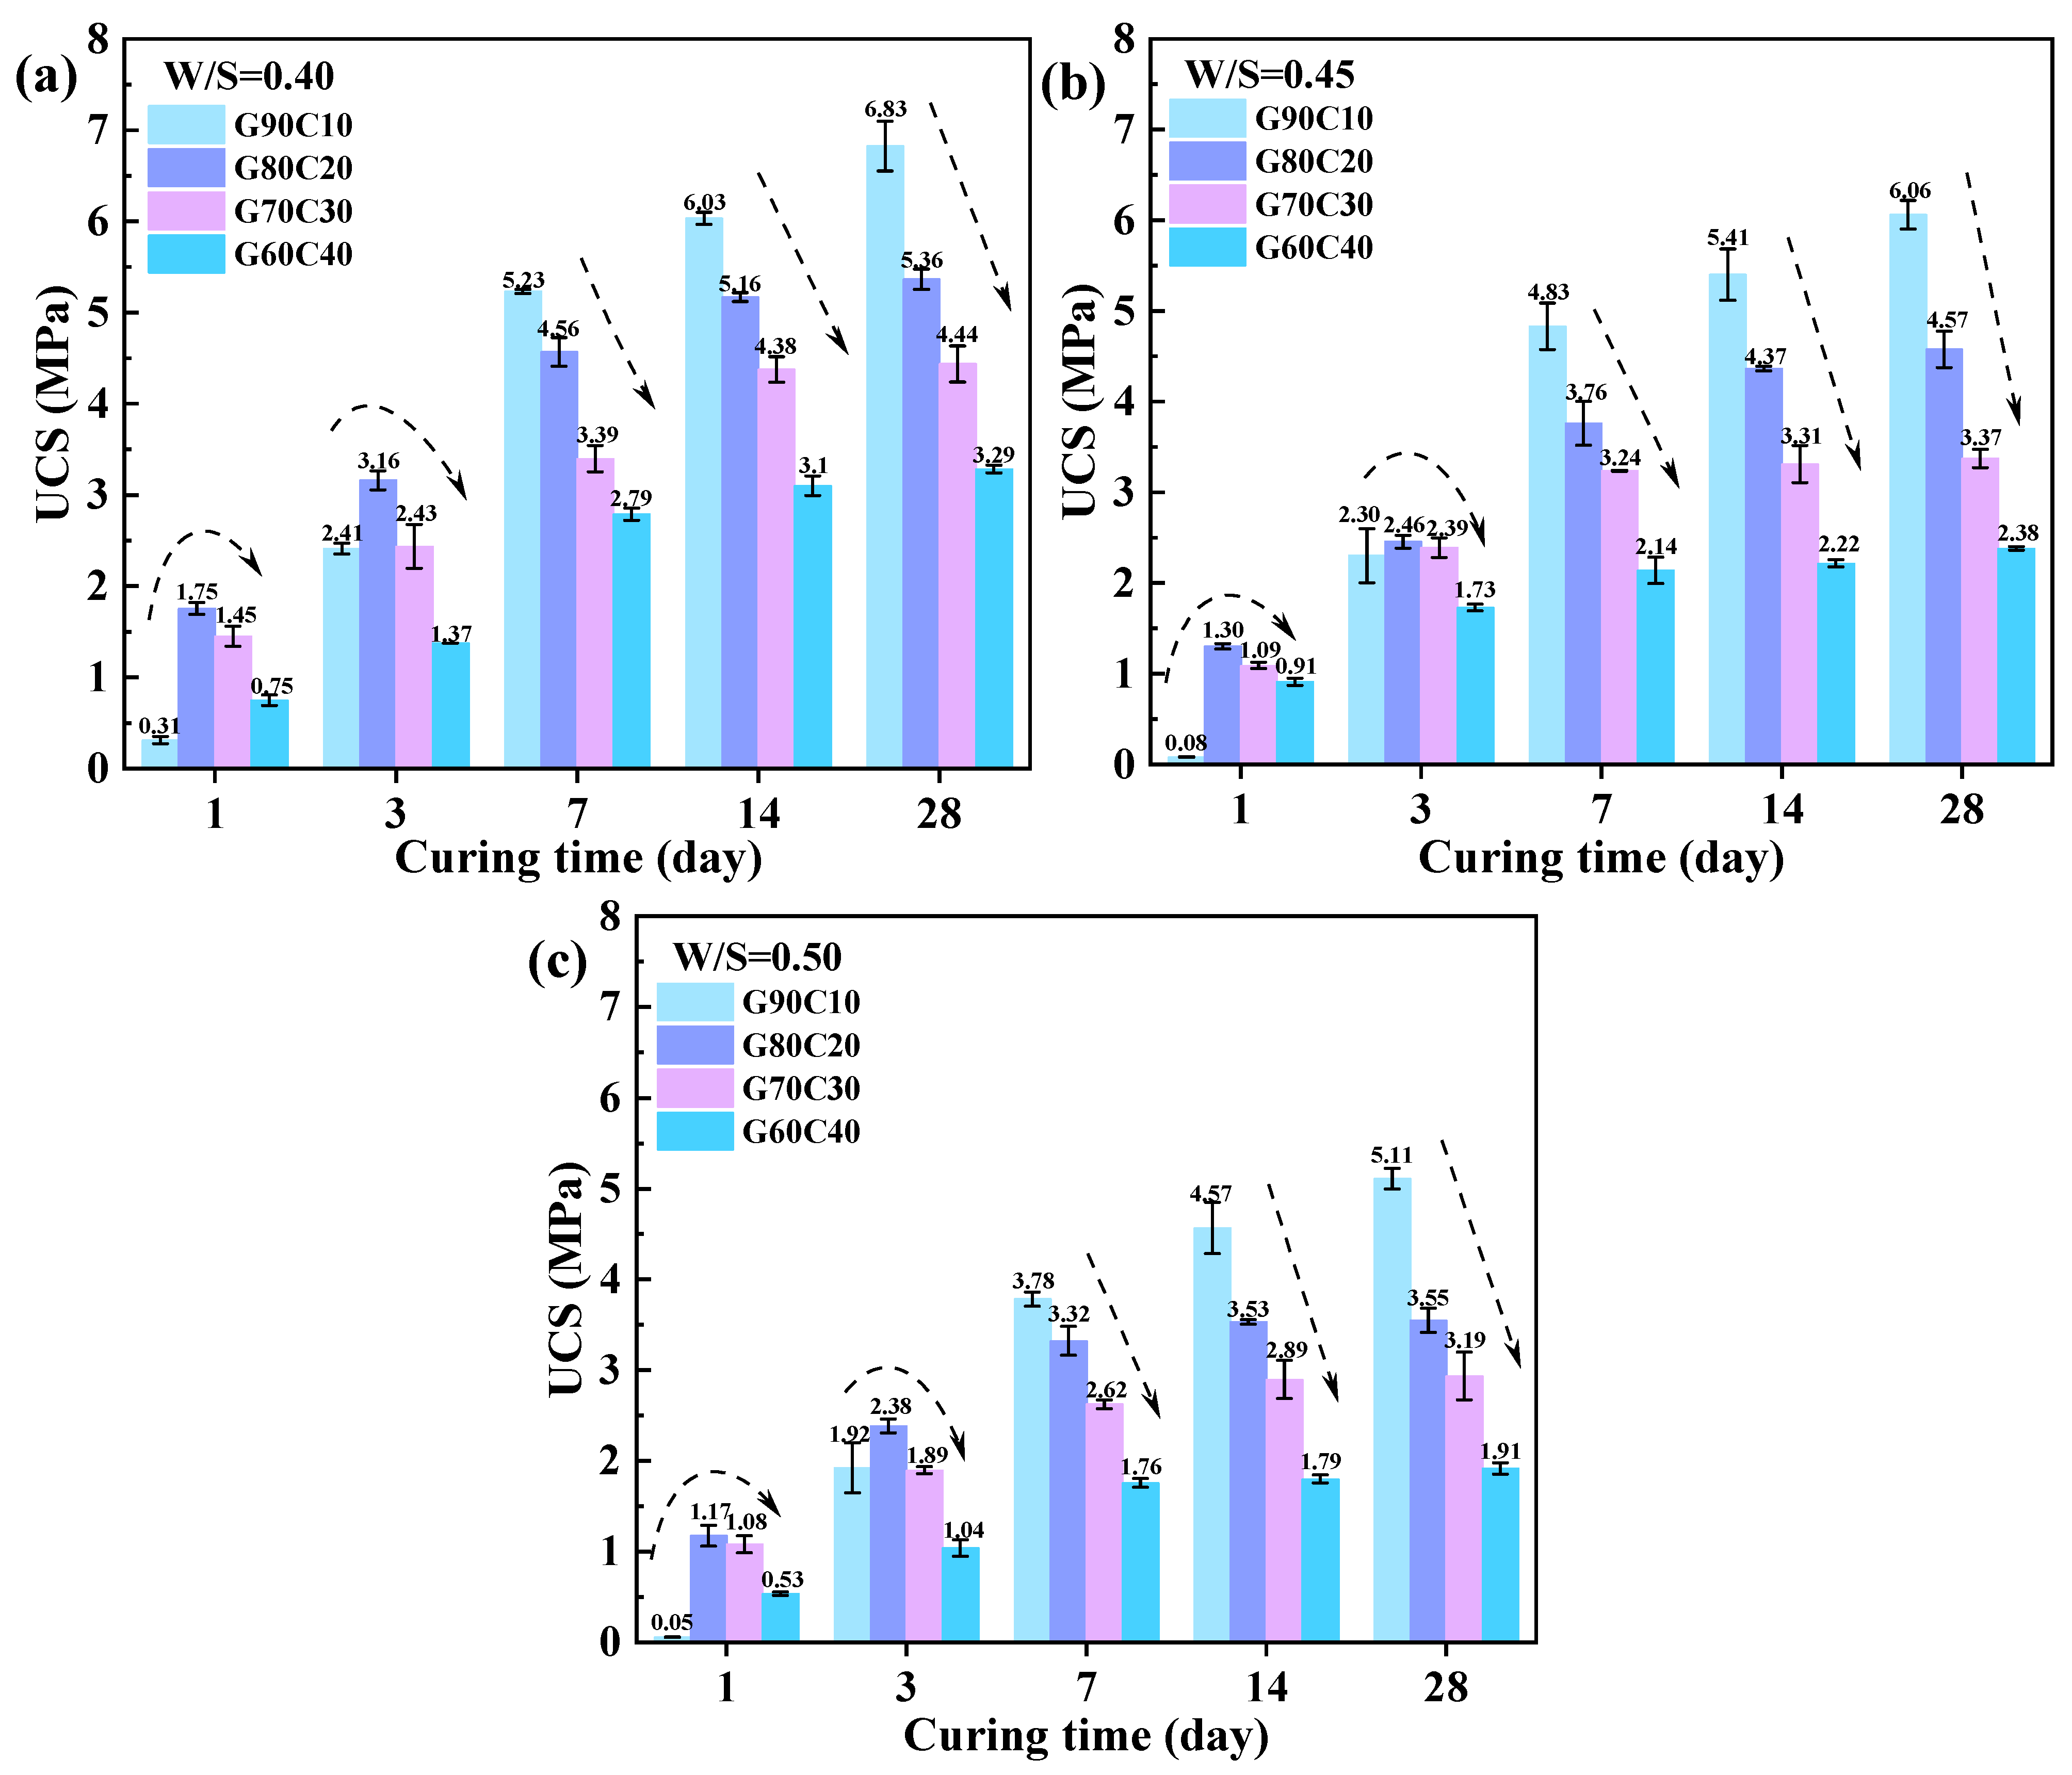
3.2. Mechanical Properties

Figure 4 illustrates the development of the UCS of the GC-CLSM at different GGBFS:CS ratios (90:10, 80:20, 70:30, and 60:40) and three W/S ratios (40, 45, and 50%) over curing ages of 1, 3, 7, 14, and 28 days. In general, the UCS increases with the curing time for all mixtures. At a given GGBFS:CS ratio, the UCS at a W/S ratio of 40% is consistently higher than those under 45% and 50%, indicating that a lower W/S ratio promotes hydration and enhances matrix densification.
More importantly, the GGBFS:CS ratio plays a critical role in both the early and long-term strength development of the GC-CLSM. At a W/S ratio of 45%, the 1-day UCS values for the G90C10, G80C20, G70C30, and G60C40 mixtures were 82.80 kPa, 1303.55 kPa, 1090.95 kPa, and 911.93 kPa, respectively, indicating that the incorporation of an appropriate amount of CS significantly enhances early strength. Among these, G80C20 exhibited the most favorable early-age performance.
However, while increasing CS content improves early strength, excessive CS appears to impair long-term strength development. At the same W/S ratio, the 28-day UCS values were 6060.83 kPa for G90C10, 4576.25 kPa for G80C20, 3373.32 kPa for G70C30, and 2382.91 kPa for G60C40, indicating a declining trend with higher CS content. This reduction is likely due to inhibited formation or continuation of strength-contributing hydration products. The same pattern was observed across all three W/S ratios and is further discussed in Section 4.
Figure 5 presents the stress–strain responses of the four mixtures at a representative W/S ratio of 45%. Overall, the GC-CLSM exhibits distinct characteristics of low deformability and brittle failure. All specimens showed failure strains below 3.15%, and most curves displayed a sharp stress drop immediately after reaching peak stress, indicating a lack of significant plastic deformation. These features are consistent with other geopolymer-based CLSM systems and suggest that the GC-CLSM is prone to brittle failure. Therefore, in applications involving dynamic or impact loads, additional reinforcement strategies—such as geocell confinement [36]—may be necessary to improve ductility and mitigate brittle failure risks.

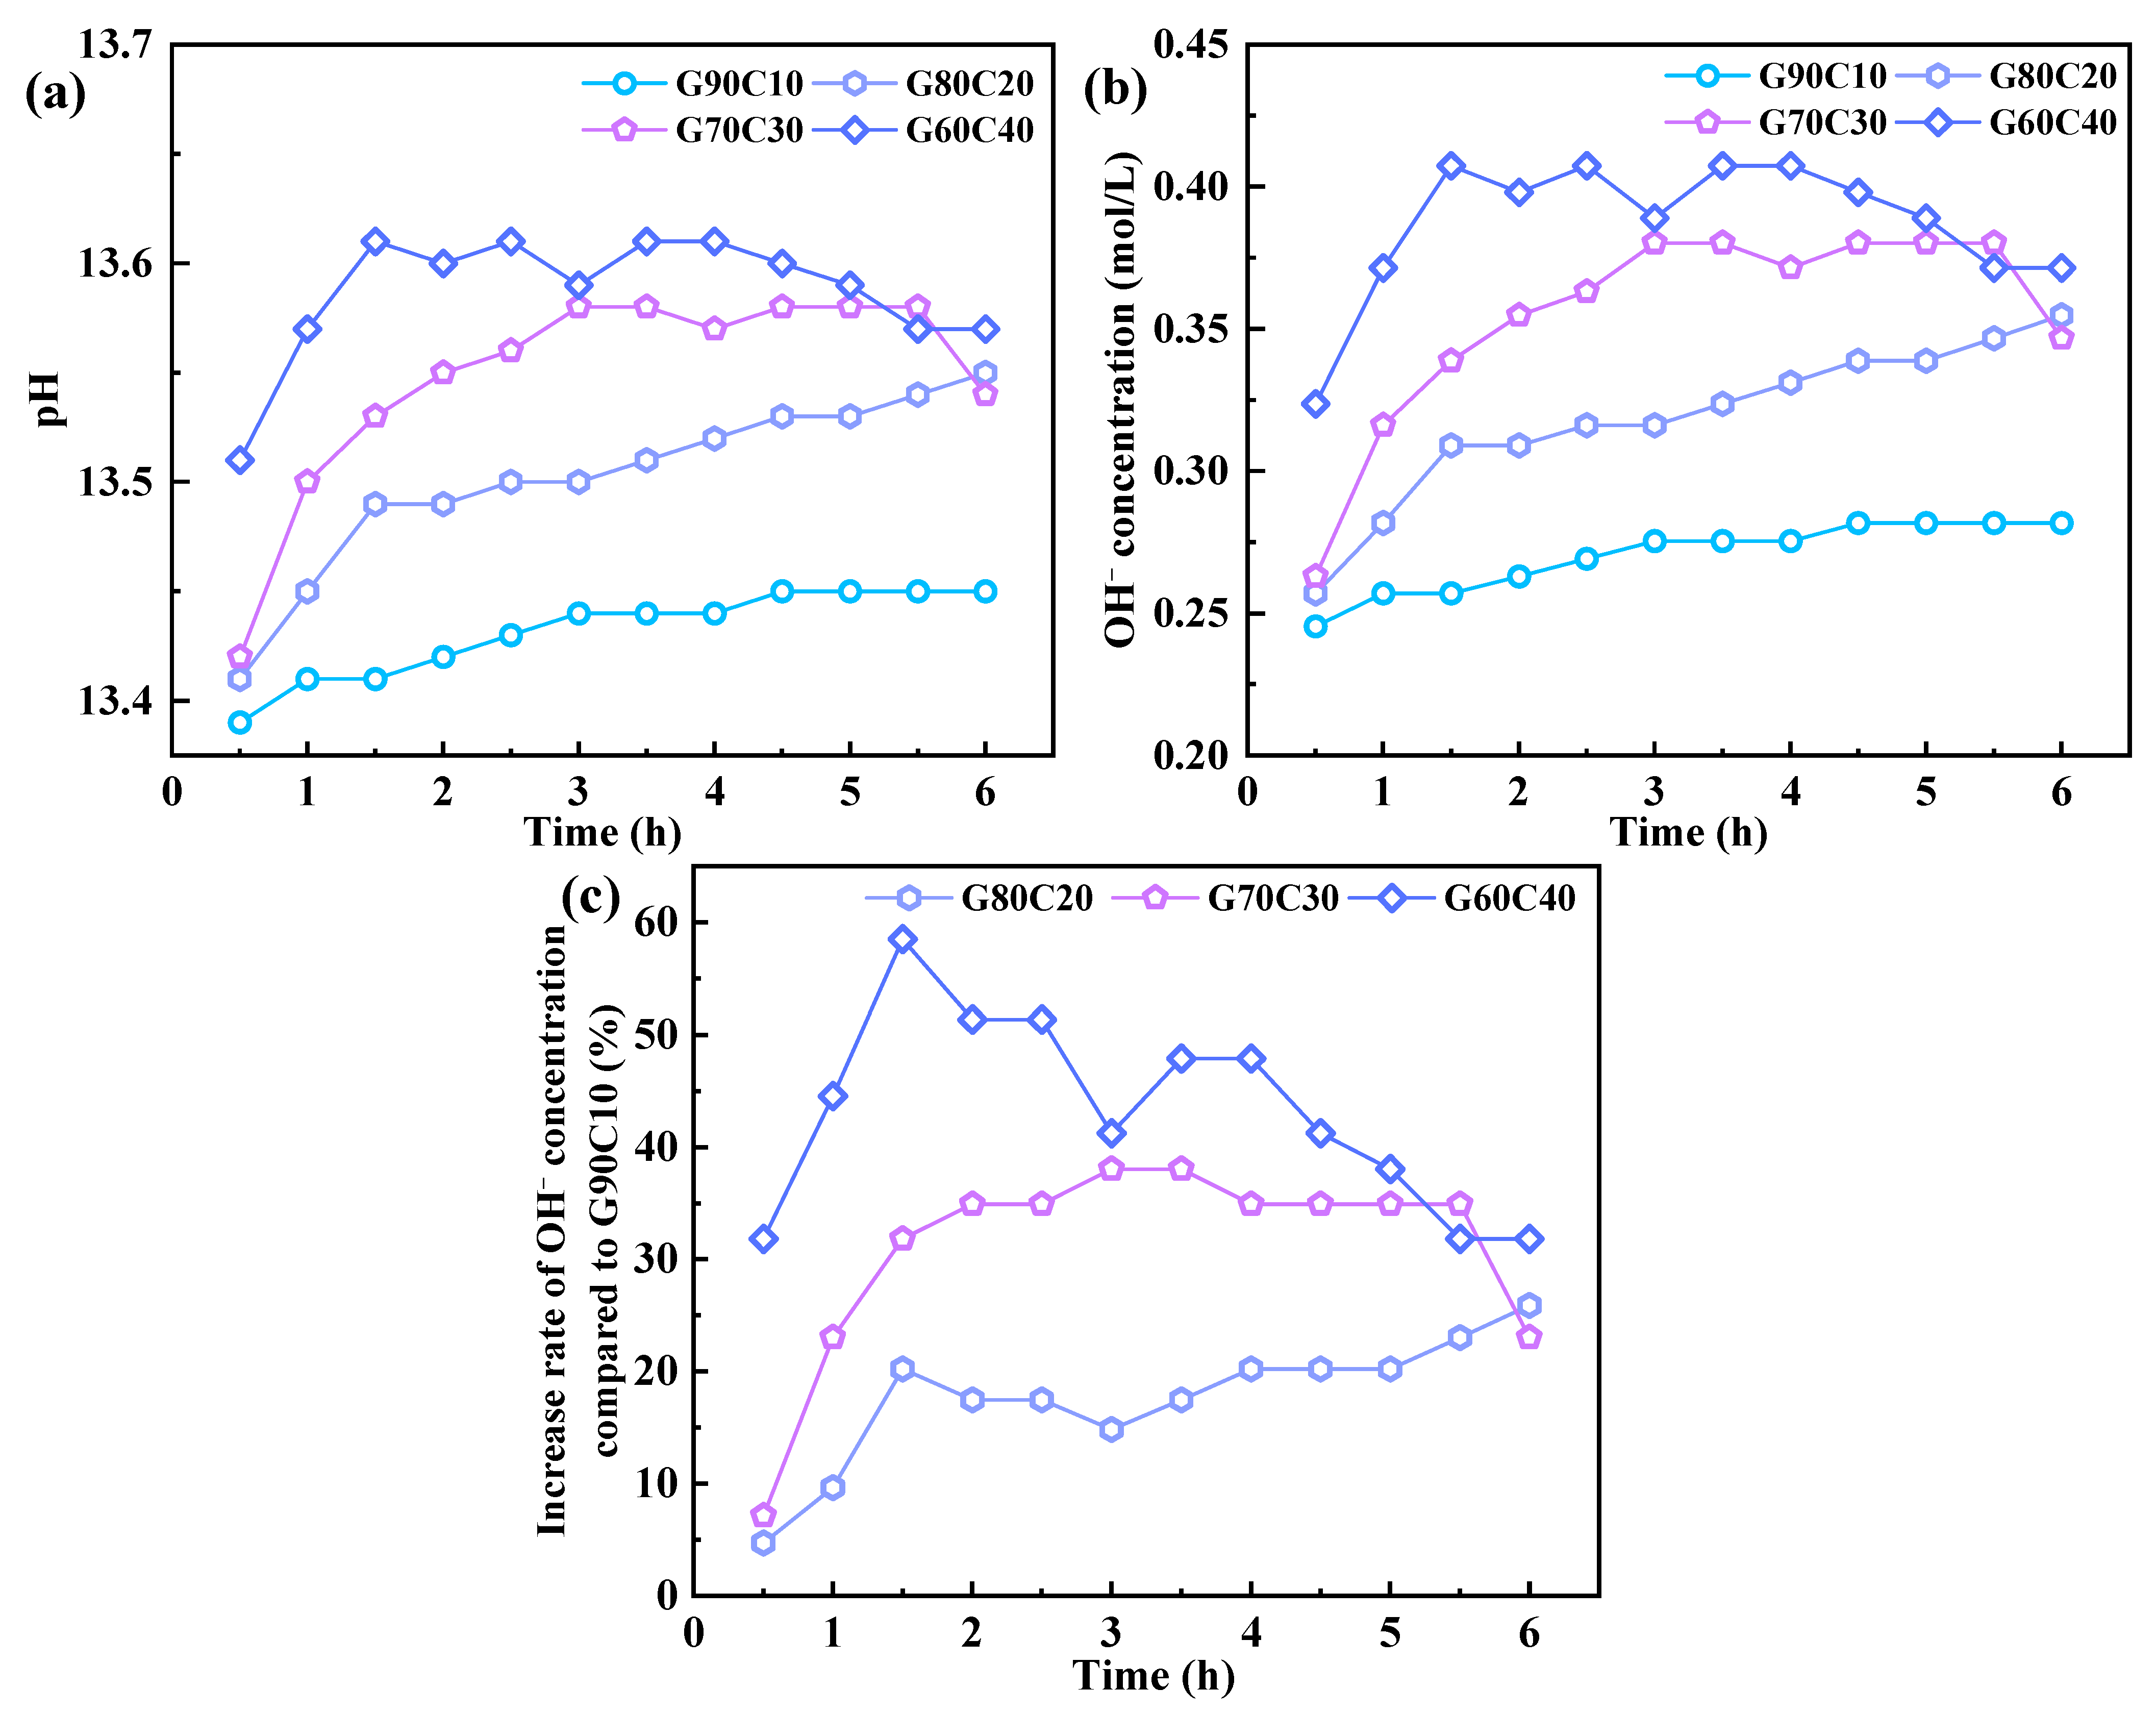
3.3. pH of Pore Water

To further reveal the hydration reactivity of the GC-CLSM under different GGBFS:CS ratios, Figure 6a,b present the evolution of the pore water pH and OH concentration within the first 6 h for G90C10, G80C20, G70C30, and G60C40. Overall, both the pH and OH concentrations increased over time as the alkali activation progressed. With the increasing CS content, the pore water exhibited higher alkalinity. For instance, at 1.5 h, the pH values of G90C10, G80C20, G70C30, and G60C40 were 13.41, 13.49, 13.53, and 13.63, respectively; the corresponding OH concentrations were 0.257, 0.309, 0.339, and 0.407 mol/L.
Figure 6c further quantifies this enhancement using the relative increase rate of OH concentration (ROH−), defined in Equation (1), by comparing each mix with G90C10. The calculated ROH− values for G80C20, G70C30, and G60C40 ranged from 4 to 26%, 7 to 38%, and 32 to 58%, respectively, indicating substantial increases in alkalinity with the CS addition. This quantitatively confirms the intensified early-age reaction environment in high-CS systems, which aligns well with the observed trends in 1-day UCS results.
R OH = O H X     O H G 90 C 10 O H G 90 C 10 × 100 %
O H G 90 C 10 refers to the OH concentration in the pore solution of G90C10, while O H X represents the OH concentration in G80C20, G70C30, or G60C40, respectively.

3.4. Microstructural Characteristics

Figure 7 and Figure 8 present the 1-day microstructures and corresponding EDS results of GC-CLSM specimens with different GGBFS:CS ratios (90:10, 80:20, 70:30, and 60:40). As shown in Figure 7, all samples exhibit dense, flocculent gel morphologies on the surface, which are more pronounced in the G80C20, G70C30, and G60C40 samples. This observation is consistent with the UCS results in Figure 4, where increasing the CS content enhanced the 1-day strength, suggesting a greater quantity of hydration products.
To ensure representativeness, low-magnification SEM scanning was used to locate typical, defect-free regions, after which EDS spots were selected on characteristic flocculent gels to identify the dominant hydration products. EDS spots were then selected on the flocculent gels (Figure 8) to characterize the dominant hydration products, yielding Ca/Si and Al/Si atomic ratios ranging from 0.61 to 1.11 and 0.19 to 0.45, respectively—consistent with typical C–A–S–H gels [37,38,39]. Notably, the Na/Si ratios in G90C10 are significantly higher, ranging from 0.45 to 0.78, while those in G80C20, G70C30, and G60C40 are consistently lower (0 to 0.40). This indicates that in G90C10, unreacted NaOH and Na2SiO3 remain concentrated near the C–A–S–H gels due to insufficient early-stage reaction.
In contrast, in samples with higher CS content, the release of Ca(OH)2 increases OH concentration (as confirmed in Figure 6), which accelerates GGBFS dissolution and leads to more complete Na+ consumption during C–A–S–H formation. This explains the observed lower Na/Si ratios in these samples and further supports the enhanced early-strength development in CS-rich mixtures.
Figure 9 presents the XRD patterns of GC-CLSM specimens cured for 1 day and 28 days alongside the pattern of the raw shield tunneling muck, which serves as the primary material in the mixture. The results show that varying the GGBFS:CS ratio has not significantly altered the crystalline phases detected by the XRD. The presence of the C–A–S–H gel, as identified in Figure 7 and Figure 8, is not clearly visible in Figure 9 due to its typical manifestation as a broad hump in the 27–30° range, which is overlapped and obscured by the strong quartz peaks originating from the shield tunneling muck. In contrast, a pronounced peak at approximately 29.4° corresponding to calcite (CaCO3) is evident in all mixes. This is expected, considering the high CS content in the binder system—residual Ca2+ and alkalis readily carbonate upon air exposure, forming calcite as a secondary product.
This observation is further supported by the FTIR spectra presented in Figure 10, which provide more definitive evidence for the formation of the C–A–S–H gel and the occurrence of carbonation—features that are difficult to detect via XRD due to their amorphous nature. Specifically, a broad absorption band centered around 1000 cm−1 [40,41,42], attributed to the asymmetric stretching of Si–O–T (T = Si or Al) bonds, can be observed in all specimens, indicating the presence of polymerized aluminosilicate gels (C–A–S–H). Additionally, a distinct absorption peak at 1440 cm−1 [43,44], corresponding to the asymmetric stretching of carbonate ions (CO32−), increases in intensity from 1 day to 28 days, confirming progressive carbonation. These findings corroborate the XRD results and suggest that while the crystalline phases have remained largely unchanged, significant microstructural evolution has occurred in the amorphous phase domain, including gel development and secondary carbonate formation.
Figure 11 illustrates the pore structure characteristics of the GC-CLSM specimens. Figure 11a,b show the pore size distributions after 1-day and 28-day curing, respectively. Two distinct pore families are identified: pores in the range of 0.2–1000 nm, attributed to gel pores within the C–A–S–H structure and capillary pores between hydration products, and pores in the 1–30 μm range, which are likely related to entrapped air voids and microcracks [45,46,47,48]. A comparison of Figure 11a,b reveals a clear leftward shift in the pore size distribution over time, indicating that large pores associated with air voids and microcracks gradually decrease in size and volume. This evolution suggests a progressive filling of the pore space by hydration products during curing, leading to a more refined microstructure. Such densification significantly reduces permeability and enhances resistance to water and chemical ingress, thereby improving the long-term durability of the GC-CLSM.
On the other hand, Figure 11b also indicates that increasing the CS content has resulted in a higher proportion of large pores (notably in the 0.5–20 μm range), as observed in the G60C40 mix. This trend suggests that excessive CS may increase material permeability and negatively affect durability.
Figure 11c presents the total porosity of the GC-CLSM specimens. At 1 day, the porosity first decreases and then increases with the increasing CS content, mirroring the trend observed in the 1-day UCS results shown in Figure 4. Among the mixtures, G80C20 exhibits the lowest porosity (34.1%) and the highest early strength (2.46 MPa). At 28 days, the porosity increases progressively with higher CS content, which is again consistent with the UCS trend in Figure 4. G90C10 shows the highest long-term strength (6.06 MPa) and the lowest porosity (32.0%), while G60C40—with the highest CS content—exhibits the highest porosity (41.2%) and the lowest 28-day strength (2.38 MPa). These results suggest that excessive CS content may lead to a more porous and loosely packed microstructure, thereby compromising the mechanical strength.

4. Discussion

4.1. Effect of the CS-to-GGBFS Ratio on Early-Strength Development

The results above demonstrate that increasing the CS content significantly enhances the early-age strength of the GC-CLSM. To eliminate the confounding effect of varying GGBFS contents across different mix designs, a normalization approach was adopted: all UCS values were linearly adjusted based on the relative GGBFS content, aligning them to the G90C10 level [49]. Under the assumption of equivalent GGBFS content, the influence of the CS-to-GGBFS ratio on the strength evolution could be isolated and analyzed. The normalized values were then expressed as strength ratios relative to G90C10, as shown in Figure 12a–c for the three W/S ratios (40, 45, and 50%).
Figure 12 clearly shows that increasing the CS ratio has dramatically boosted the 1-day strength. For instance, under the W/S ratio of 45%, the 1-day strength ratios of G80C20, G70C30, and G60C40 have reached 17.71, 16.94, and 16.52, respectively, indicating that CS strongly promotes early hydration. Notably, this enhancement becomes more pronounced at higher W/S ratios: at a W/S ratio of 50%, the 1-day strength ratios of G80C20, G70C30, and G60C40 have increased further to 23.62, 24.84, and 14.34, respectively.
However, the strength enhancement effect diminishes over time and even reverses beyond 7 days. For example, in the case of G80C20 at a W/S ratio of 45%, the strength ratios at 1, 3, 7, 14, and 28 days are 17.71, 1.20, 1.00, 0.91, and 0.85, respectively, suggesting that while CS accelerates early-strength development, its contribution to long-term strength is limited and may even be detrimental. This trend is particularly evident in G60C40 (CS/GGBFS = 66.67%), where the 28-day strength ratios have dropped to 0.72, 0.59, and 0.56 at W/S ratios of 40%, 45%, and 50%, respectively—indicating up to 50% strength loss due to excessive CS content, which likely disrupts long-term structural densification.
In contrast, moderate CS dosages, such as in G80C20 (CS/GGBFS = 25%), demonstrated a more balanced performance. Its 28-day strength ratios remained relatively acceptable at 0.88, 0.85, and 0.78 for the 40%, 45%, and 50% W/S groups, respectively, while the 1-day strength ratios were markedly elevated, reaching 6.30, 17.71, and 23.62, respectively. These results highlight that an optimal CS-to-GGBFS ratio can produce a synergistic effect, significantly enhancing early strength without severely compromising long-term performance.
In summary, increasing the CS-to-GGBFS ratio to approximately 25% enables GC-CLSM to achieve both excellent early-age strength performance and acceptable long-term mechanical stability. Among all tested mixtures, this ratio provides an optimal balance—offering more than tenfold improvements in 1-day UCS while maintaining minimal strength loss at 28 days. These findings suggest that this composition has strong potential for practical engineering applications, particularly in scenarios requiring rapid backfilling or early-age load-bearing capacity under temporary traffic conditions. The significant enhancement in early strength may contribute to improved construction efficiency, reduced downtime, and accelerated project schedules in infrastructure and underground utility installation. However, further field validation and long-term performance monitoring under realistic service conditions are necessary to confirm its suitability for full-scale engineering implementation.

4.2. Impact of CS Content on Strength-Controlling Mechanisms

The previous results have demonstrated that increasing the CS-to-GGBFS ratio significantly enhanced the 1-day strength of the GC-CLSM. However, beyond a certain threshold, the early-strength gain plateaued, and the long-term strength tended to decline. To clarify the underlying mechanisms, this section discusses the effects of the CS-to-GGBFS ratio on strength development from three perspectives.
First, the reasons behind the remarkable enhancement in early strength at moderate CS dosages are attributed to chemical activation effects. As shown in Figure 6, increasing the CS content has markedly elevated the OH concentration in the pore solution, which has accelerated the depolymerization of the GGBFS glass phase and promoted the rapid release of reactive species such as [Si(OH)4] and [Al(OH)4] [50,51,52,53]. Simultaneously, the CS provides an abundant source of Ca2+, which facilitates the rapid formation of C–A–S–H gel. This enhanced ionic environment not only speeds up the initial reaction kinetics but also contributes to rapid gel nucleation and growth. As a result, the 1-day UCS is substantially increased. This rapid hydration process also leads to the decreased flowability, reduced bleeding, and shortened setting times observed in Figure 3. In contrast, G90C10, with lower OH and Ca2+ concentrations, exhibits sluggish early-age reactions, as supported by the EDS analysis in Figure 8, which revealed unreacted alkali activator residue—corresponding to its much lower 1-day UCS.
Second, when the CS proportion exceeds an optimal level, the early-strength gain becomes less pronounced. As shown in Figure 12, the 1-day strength ratio reaches a peak at a CS-to-GGBFS ratio of 25% (G80C20), while further increasing the CS content to 66.67% (G60C40) has resulted in a decline. This trend, reflected in Figure 4b and Figure 11c, is likely linked to the pore structure formed by the rapidly precipitated C–A–S–H gel. Despite the fact that the 1-day UCS of G60C40 (911.93 kPa) is more than 10 times higher than that of G90C10 (82.8 kPa), their 1-day porosities differ by only 2.3% (46.9% vs. 49.2%). This small difference in porosity, despite large differences in strength, suggests that not all early-formed C–A–S–H gel is structurally efficient. This suggests that while the early-formed C–A–S–H gel in G60C40 increases strength, it may be structurally loose or poorly packed. The overproduction of poorly connected gel and uneven interface bonding likely explains the diminished efficiency in early-strength enhancement at high CS contents. Furthermore, excessive CS may lead to a heterogeneous microstructure with poor interfacial bonding and increased internal flaws, reducing the mechanical efficiency of the hydration products.
Finally, the negative impact of high CS content on long-term strength is attributed to the microstructural quality and stability of the hydration products. While excessive CS accelerates early hydration and promotes abundant C–A–S–H gel formation, the resulting gel tends to be loosely packed, poorly interconnected, and more disordered [54,55]. In contrast, although G90C10 exhibits slower initial hydration, it undergoes more controlled and uniform gel development, leading to improved long-term packing density and mechanical performance. This is supported by the pore structure evolution shown in Figure 11c, where G60C40 exhibits a noticeably higher porosity at 28 days, indicating a less compact microstructure. In addition, carbonation effects may further compromise the long-term performance of high-CS mixtures such as G60C40. The more-porous matrix and higher Ca(OH)2 content make these specimens more susceptible to carbonation [56]. The formation of CaCO3 may locally densify certain regions but often introduces heterogeneity, internal stress, or even microcracks, particularly when occurring in a loosely bonded gel system [57,58]. This is further supported by the FTIR spectra shown in Figure 10, which display distinct carbonate-related bands (e.g., ~1440 cm−1), indicating that carbonation has occurred during the reaction process.

4.3. Carbon Emission Analysis of GC-CLSM

The above results demonstrate that the GC-CLSM exhibits favorable performance and offers a promising pathway for the valorization of shield tunneling muck. To further assess its environmental advantages, this section compares the carbon emissions of the GC-CLSM with those of conventional cement-based CLSM, as shown in Figure 13.
Four GGBFS-to-CS ratios (90:10, 80:20, 70:30, and 60:40) were considered. The carbon emission factors of GGBFS, CS, and sodium silicate were assumed to be 0.072 kg CO2-eq/kg, 0.010 kg CO2-eq/kg, and 0.970 kg CO2-eq/kg, respectively. Based on these values, the total carbon emissions of the GC-CLSM ranged from 66.37 to 70.09 kg CO2-eq per ton of shield tunneling muck. For comparison, a control case using ordinary Portland cement CLSM (OPC-CLSM) was calculated based on a carbon emission factor of 0.894 kg CO2-eq/kg for the OPC. The corresponding total emission was 223.5 kg CO2-eq per ton of shield tunneling muck. This indicates that GC-CLSM can reduce carbon emissions by approximately 68.6 to 70.3% compared with OPC-CLSM, demonstrating clear environmental advantages.
It is worth noting that sodium silicate accounted for 82 to 86% of the total emissions in the GC-CLSM formulations, suggesting that future optimization of the alkali activator composition could further enhance the sustainability of the system.

5. Conclusions

This study proposes a novel and sustainable approach for the large-scale reuse of shield tunneling muck by developing a geopolymeric-controlled low-strength material (GC-CLSM) using two industrial by-products: ground granulated blast-furnace slag (GGBFS) and carbide slag (CS). Through systematic investigation of mix proportions, hydration behavior, and microstructural evolution, the following conclusions can be drawn:
(1)
The proposed GC-CLSM system exhibited excellent early-age strength performance, meeting practical engineering needs such as rapid backfilling and temporary load-bearing. The optimal GGBFS:CS ratio was determined to be 80:20, at which the GC-CLSM achieved a 1-day UCS of 1.17–1.75 MPa and a 28-day UCS of 3.55–5.36 MPa, demonstrating both rapid strength development and satisfactory long-term performance.
(2)
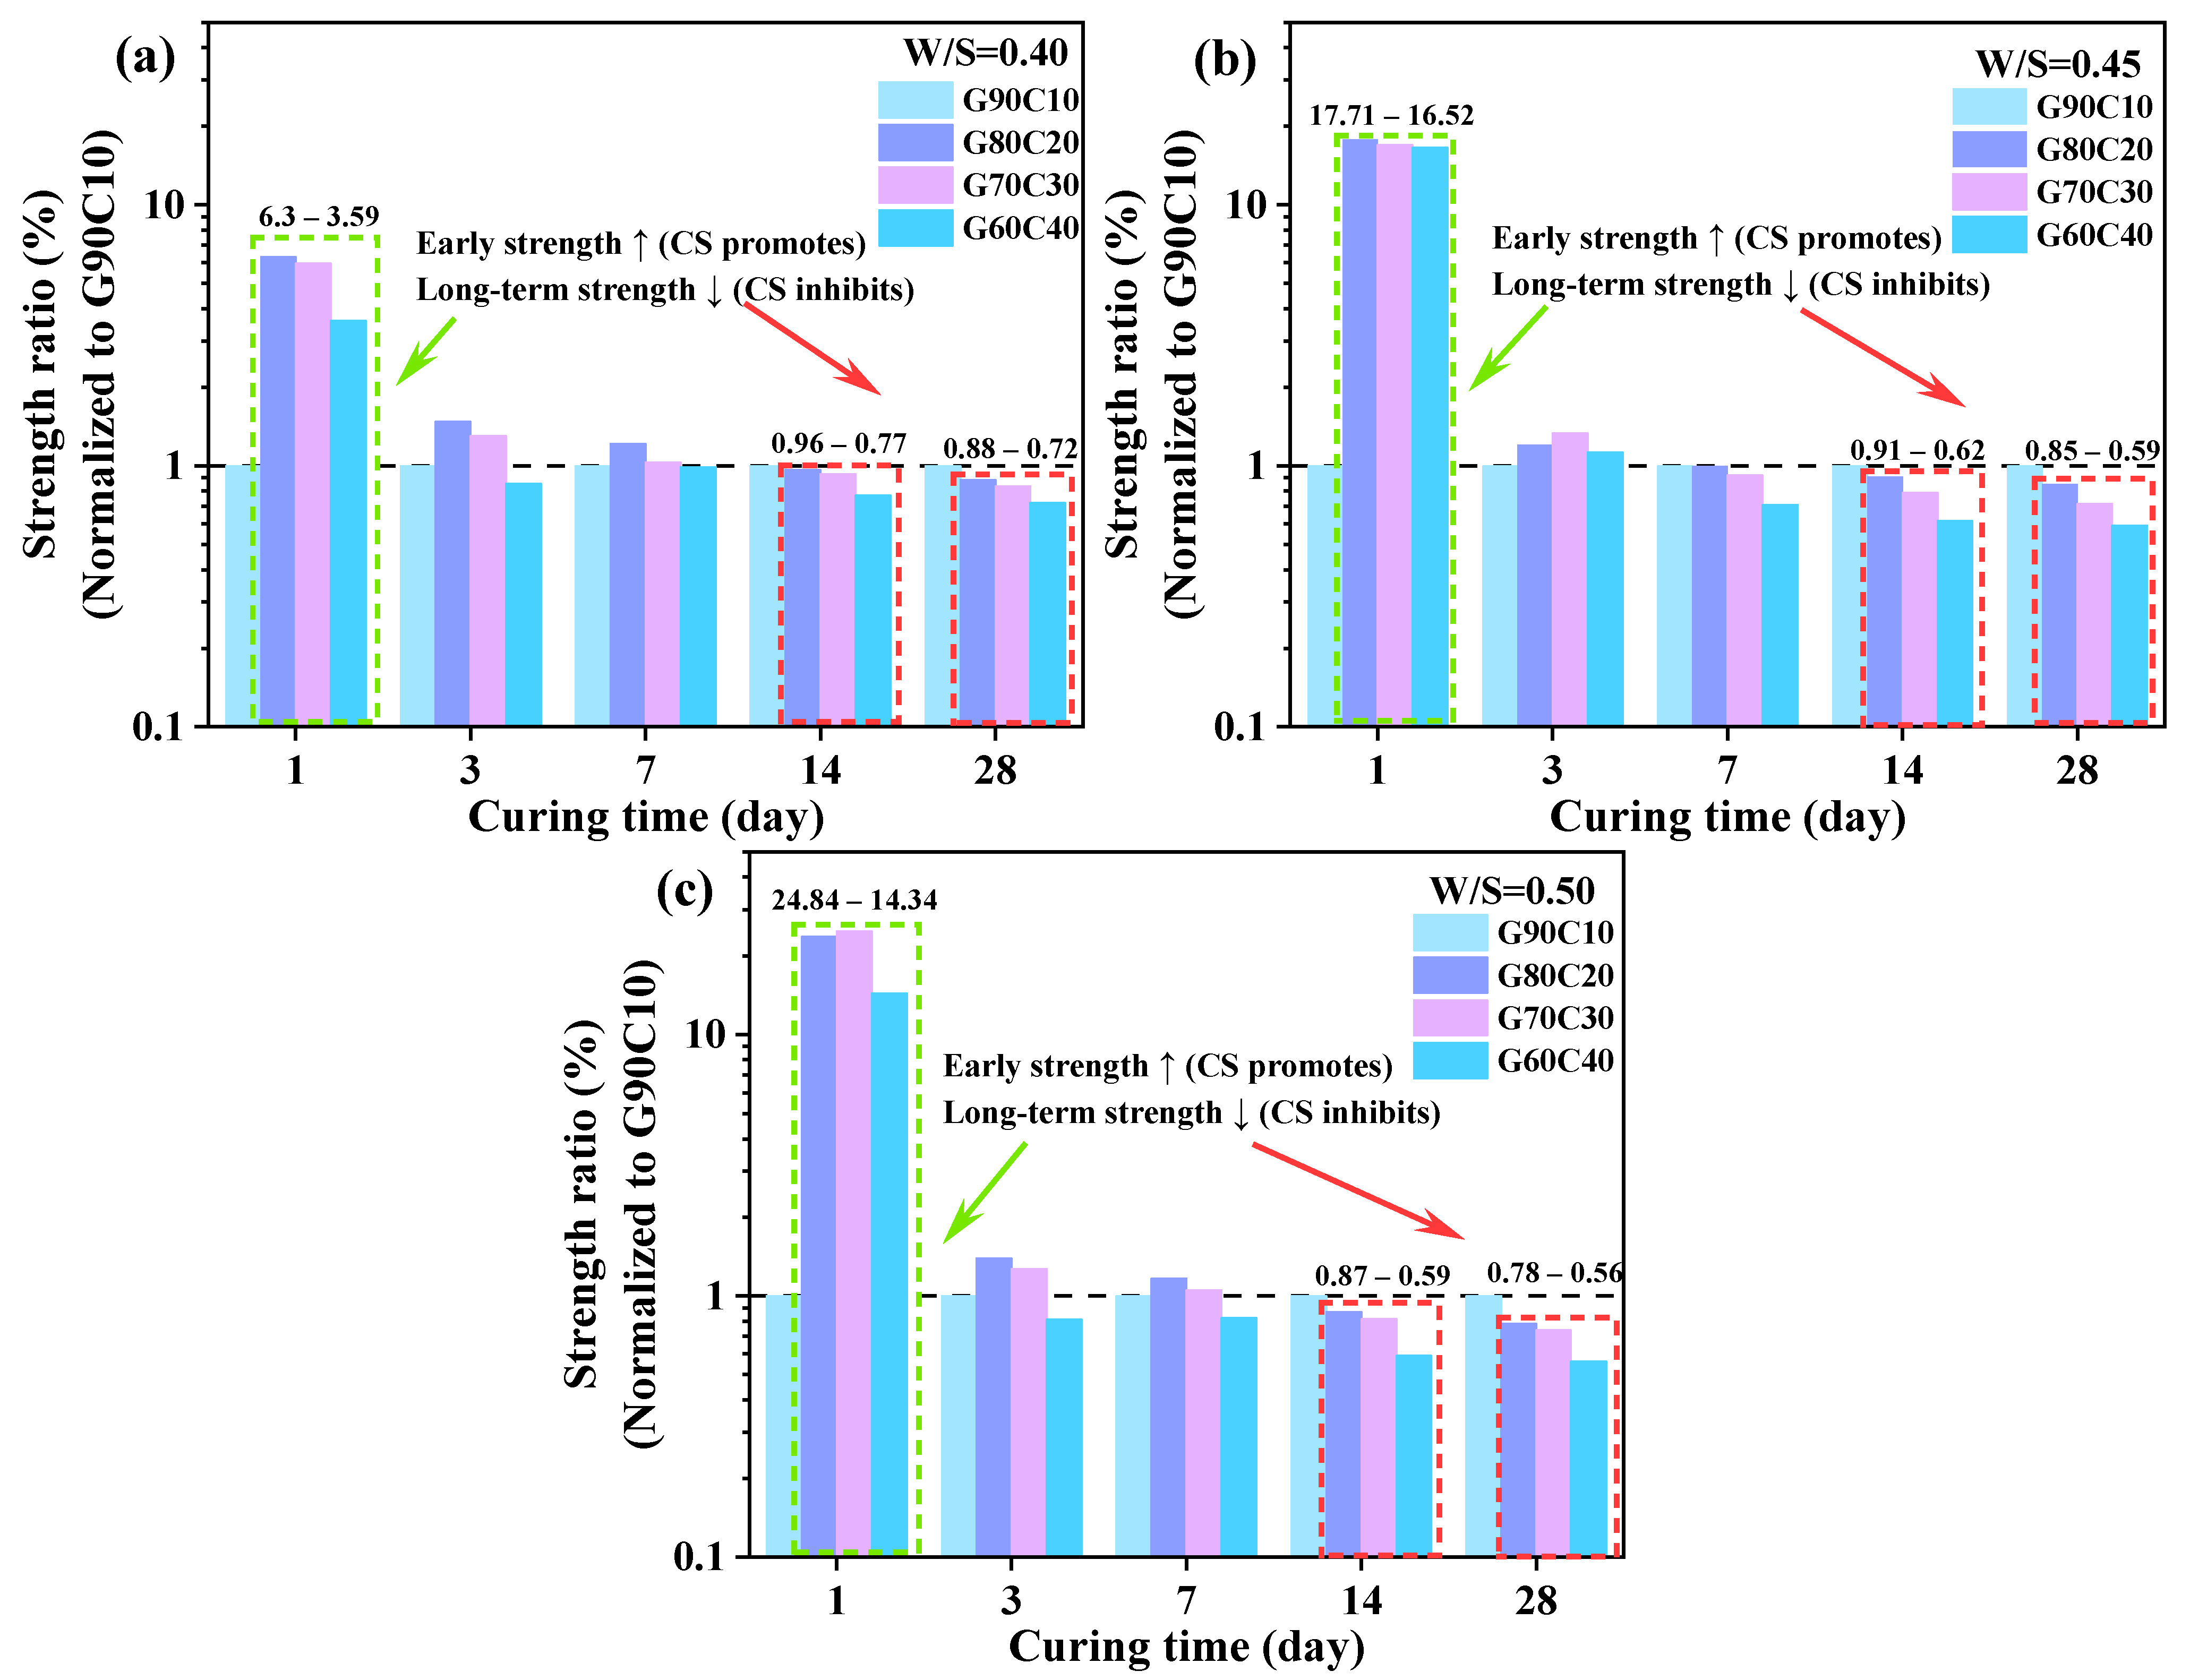
The GGBFS:CS ratio is critical in balancing early and long-term strength development. A moderate CS content (e.g., G80C20) significantly enhanced the early strength—achieving 6.3 to 23.6 times that of the low-CS reference—while incurring an acceptable 28-day strength loss of approximately 20%. In contrast, excessive CS addition (e.g., G60C40) still provided notable early-strength gains but resulted in substantial 28-day strength reductions, with losses of up to 50%.
(3)
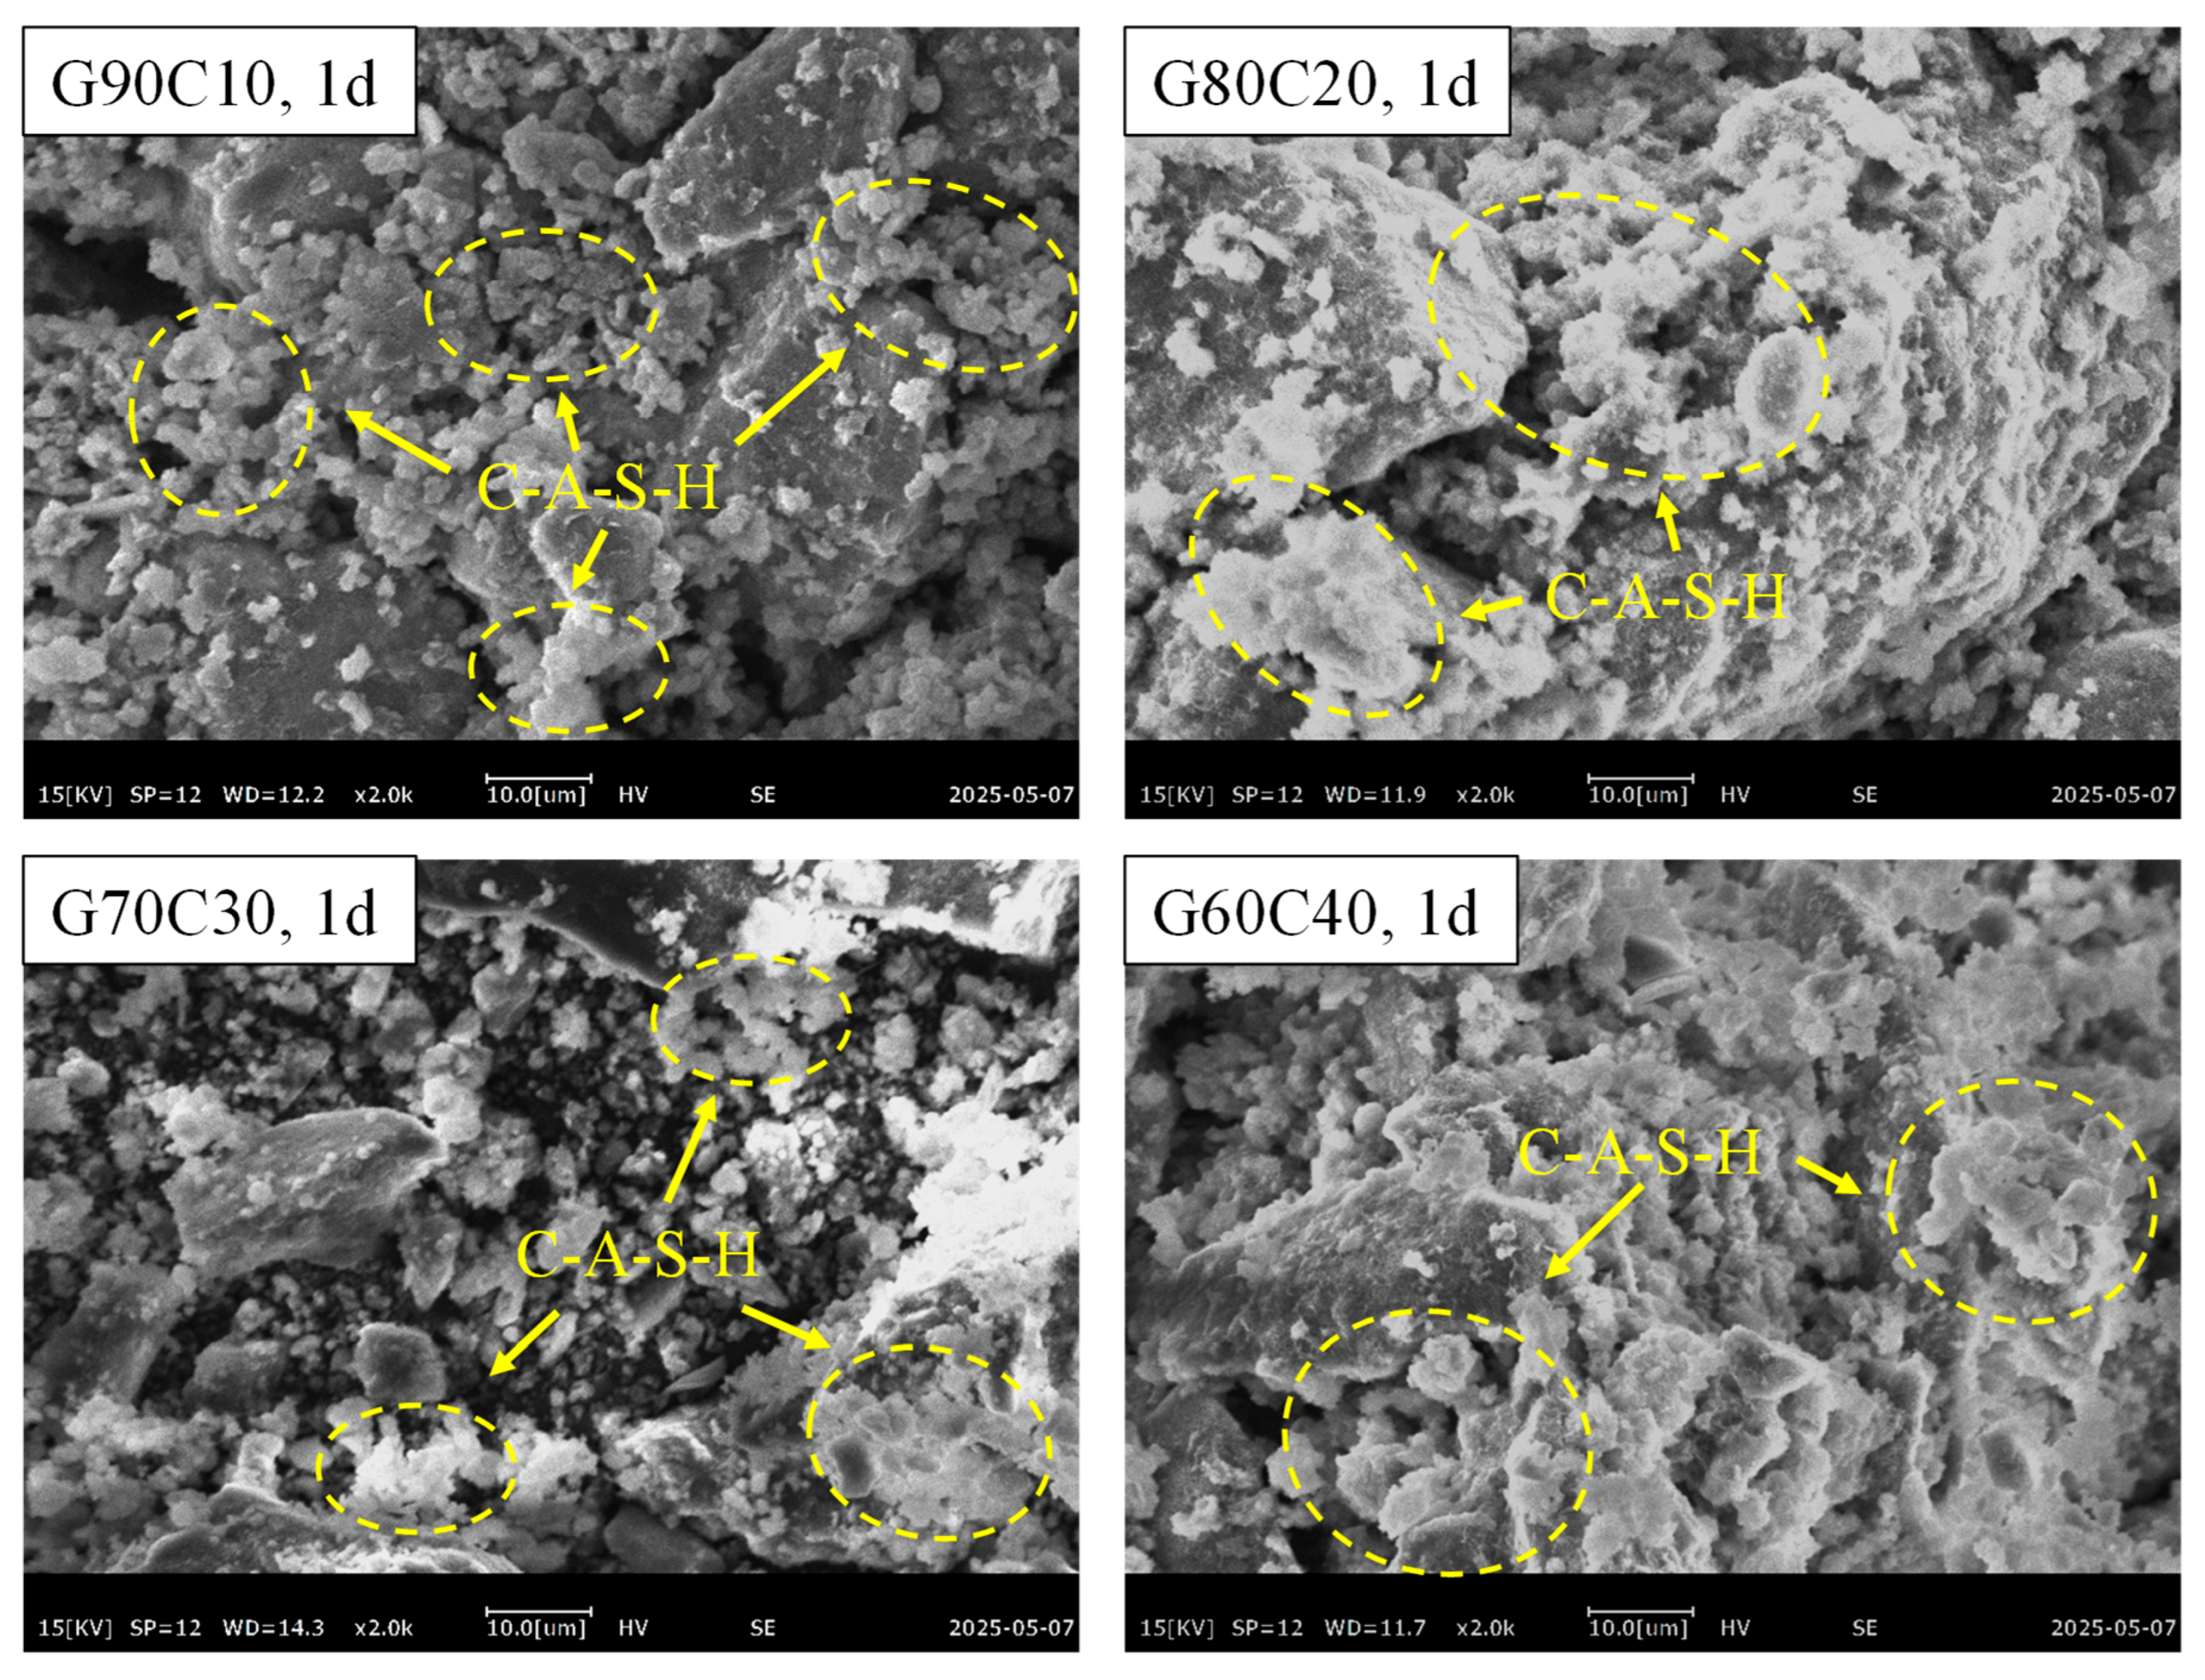
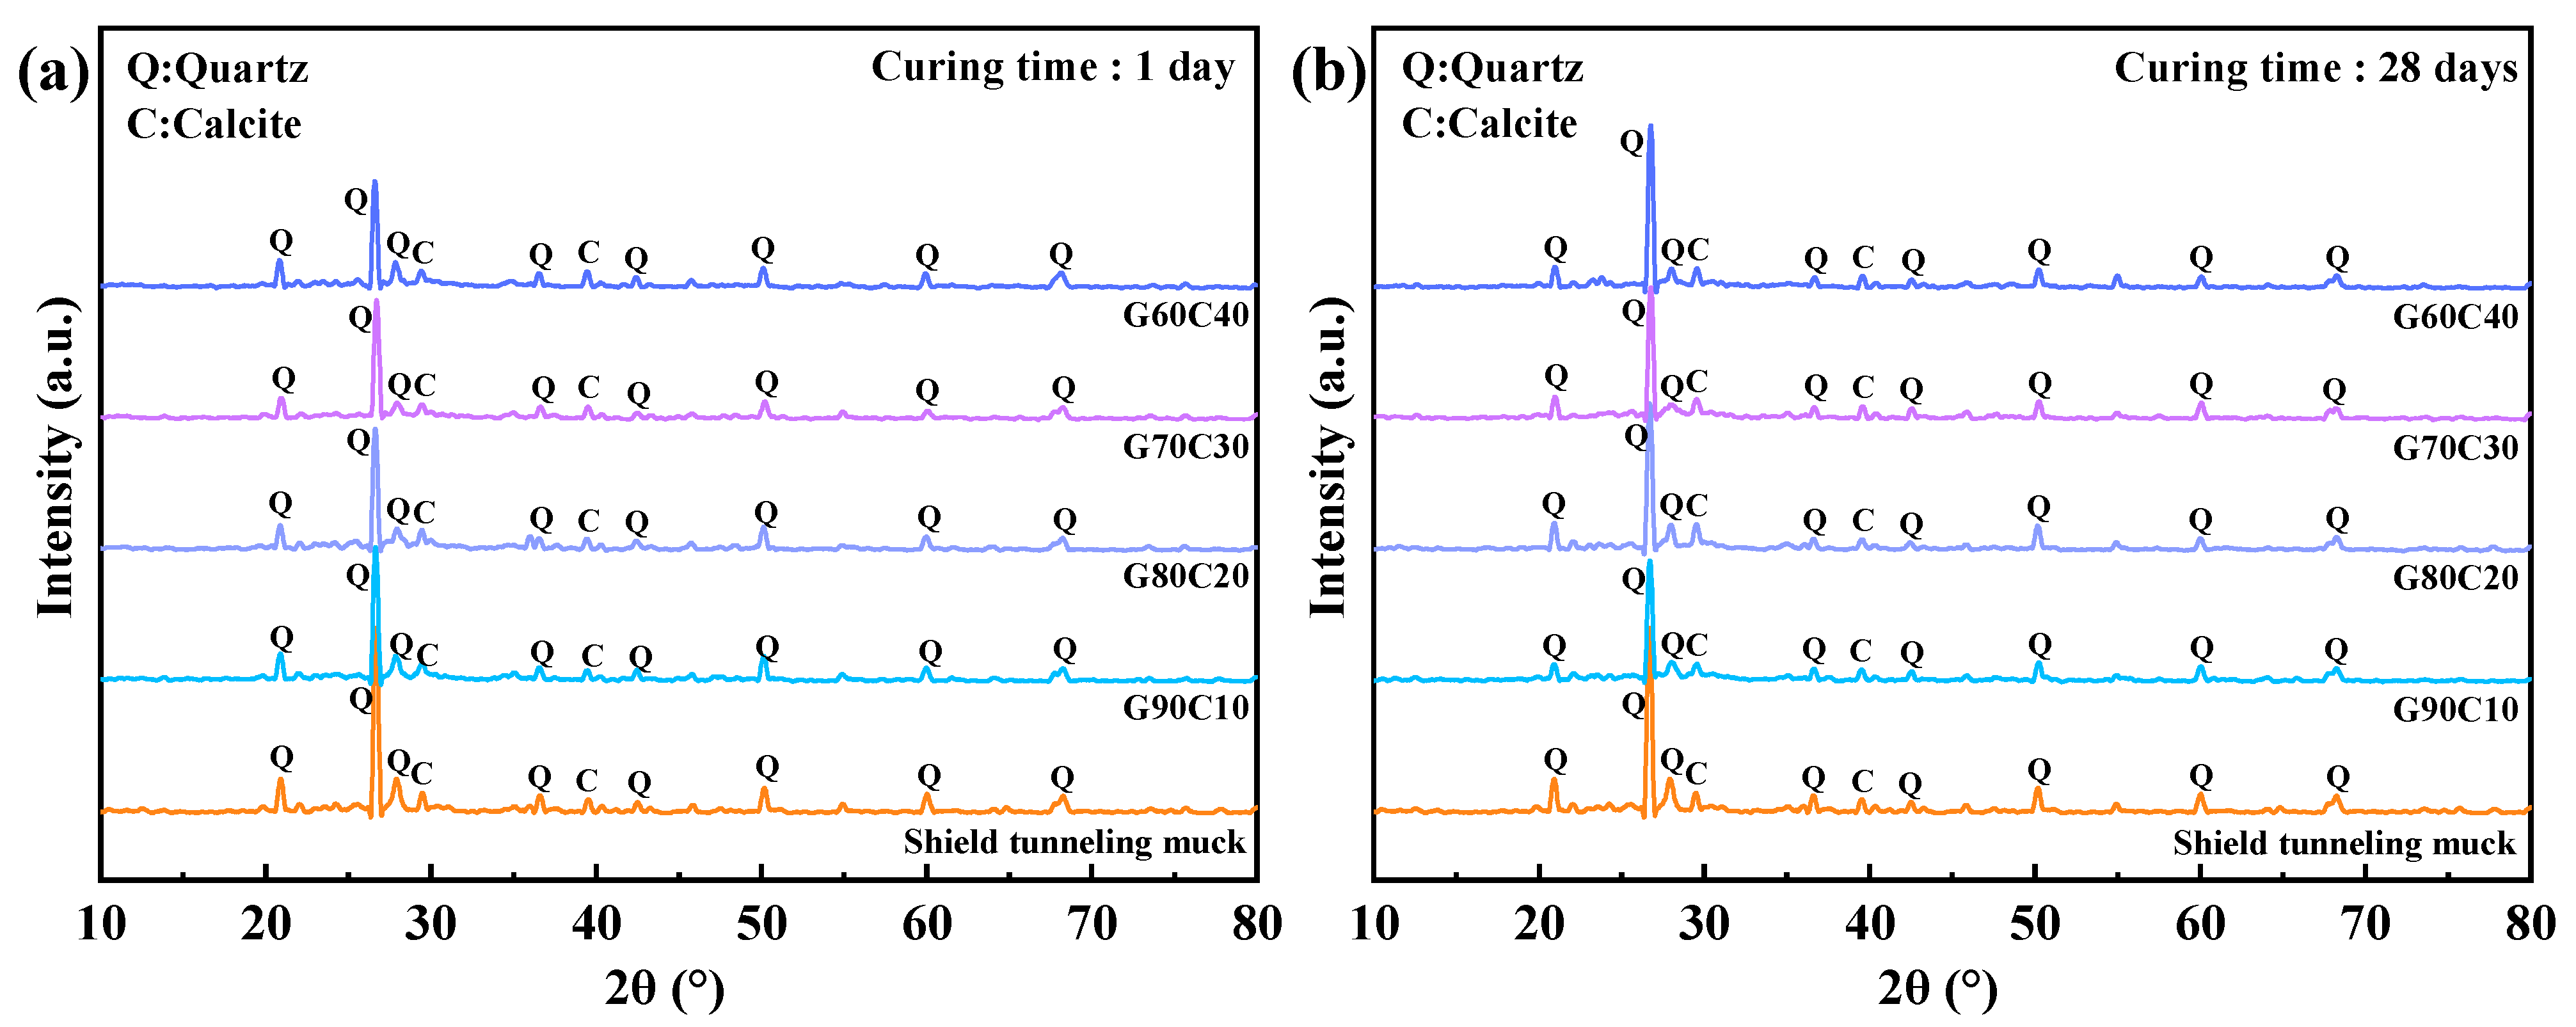
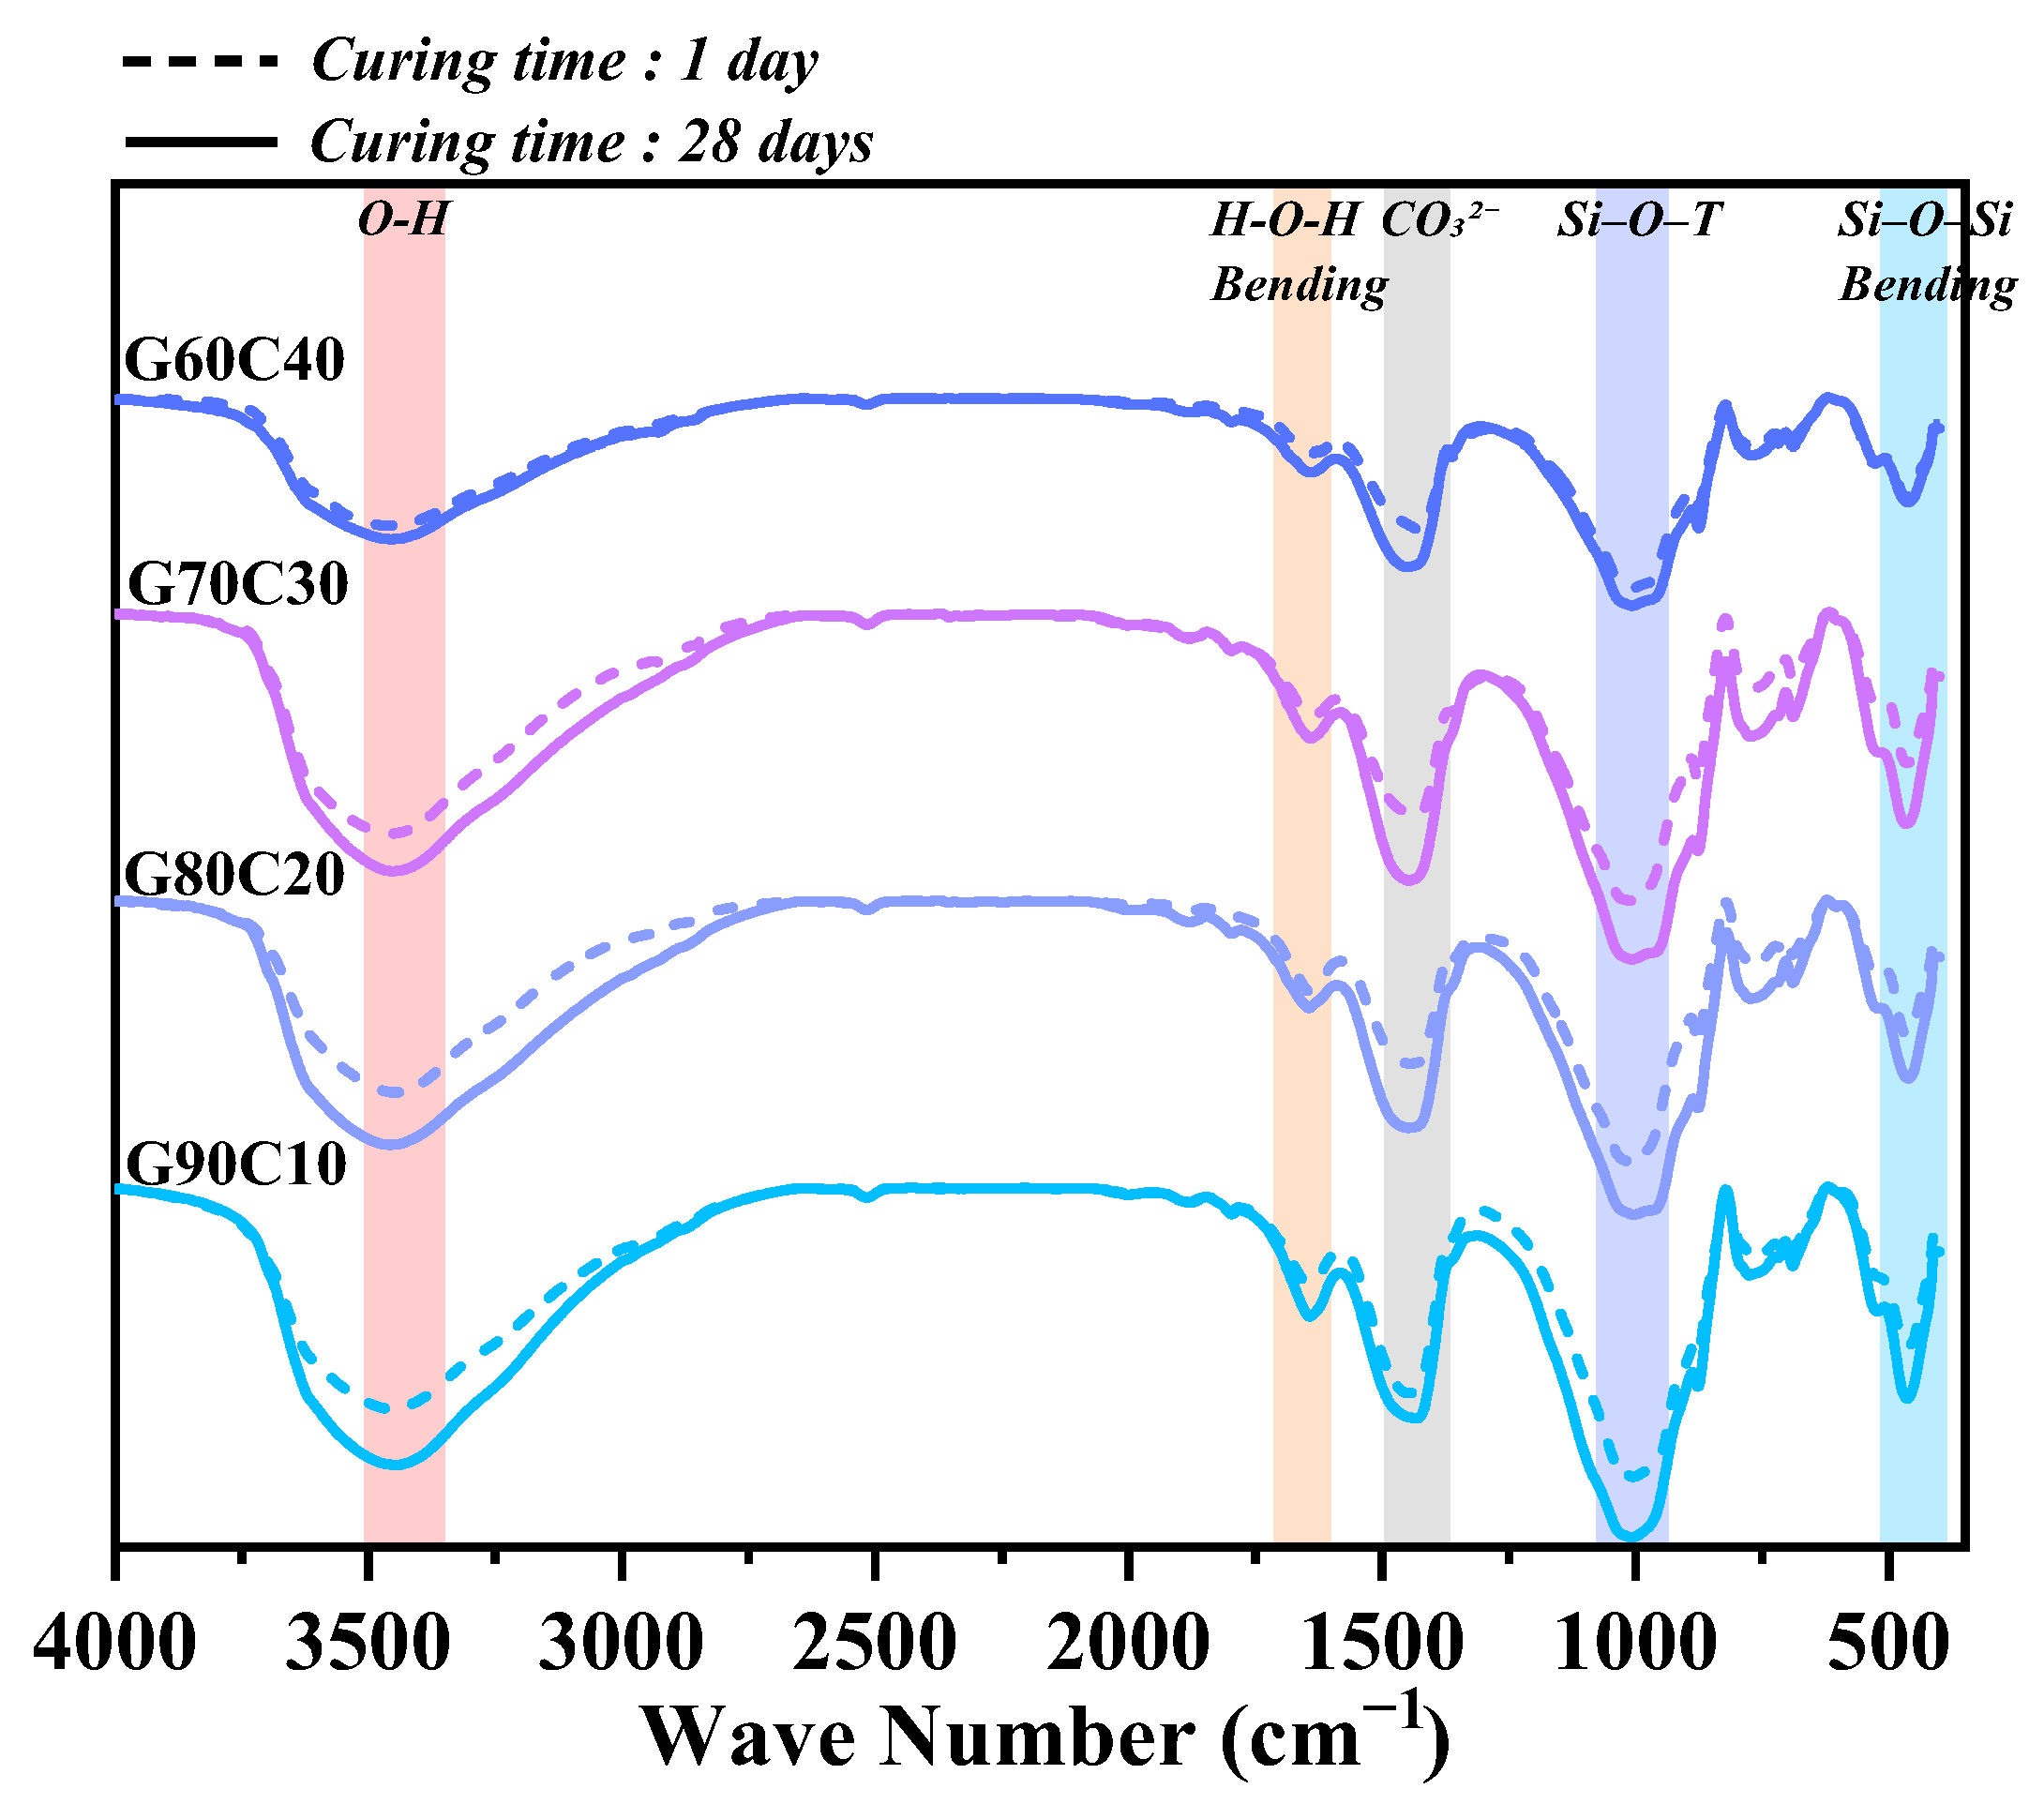
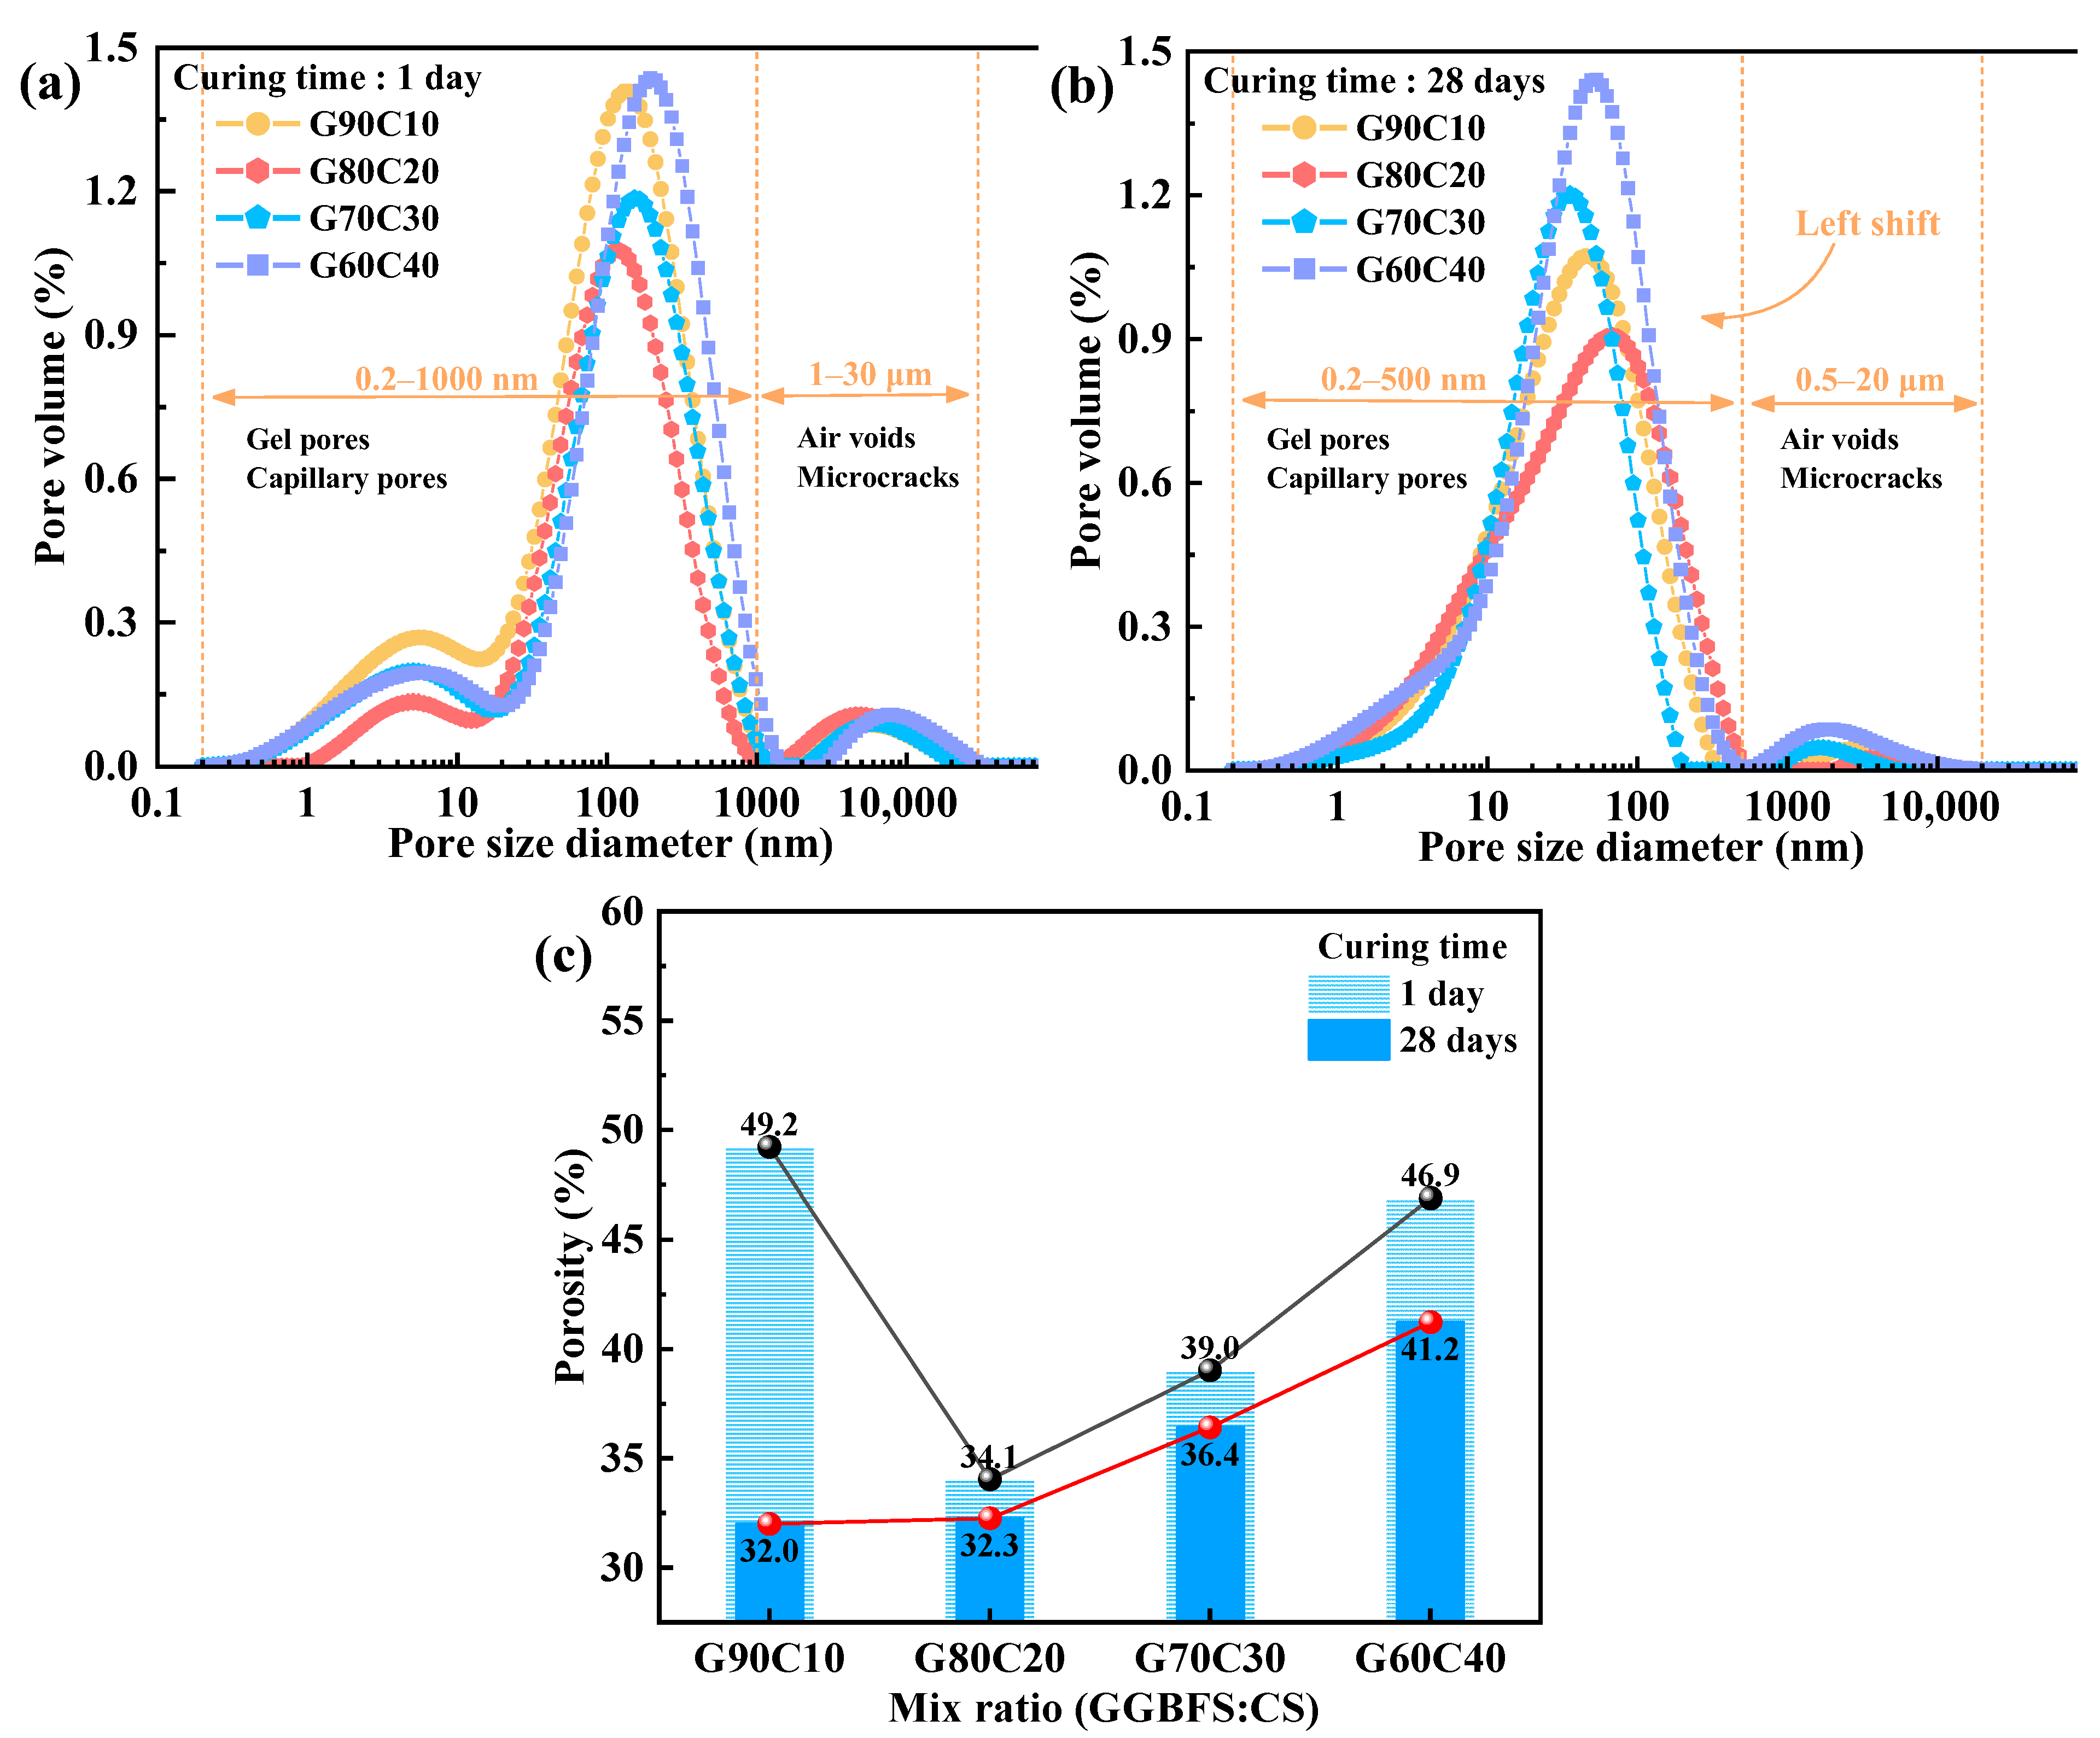
The underlying mechanism of strength regulation is attributed to the synergy between alkalinity and Ca2+ supply. Increased CS content elevates pore-solution OH concentration and provides readily available Ca2+, accelerating GGBFS dissolution and promoting rapid C–A–S–H gel formation. However, excessive CS leads to loosely packed gel and non-uniform pore structures, as confirmed by SEM, EDS, FTIR spectroscopy, and LF-NMR, which impair long-term strength development.
(4)
The GC-CLSM system developed in this study achieved a substantial reduction in carbon emissions—by approximately 68.6% to 70.3%—compared with conventional cement-based CLSM, highlighting its strong potential for sustainable construction applications.
While the GC-CLSM developed in this study exhibits excellent early-age performance and notable environmental benefits, several practical challenges remain. Variability in the composition of shield tunneling muck and industrial by-products like CS may affect performance consistency in real-world applications, necessitating site-specific characterization and adaptive mix design. Moreover, the observed brittle failure behavior underlines the need for improved ductility, particularly under dynamic loading conditions. Future research should not only focus on enhancing mechanical adaptability and sustainability—such as through the use of low-carbon or waste-derived alkali activators—but also systematically investigate the long-term durability of GC-CLSM under environmental exposures, including carbonation, sulfate attacks, and freeze–thaw cycles.

Author Contributions

Conceptualization, J.L. and S.W.; methodology, S.D. and S.W.; formal analysis, S.D.; investigation, J.Z. and X.S.; resources, J.Z.; data curation, J.Z.; writing—original draft preparation, J.L.; writing—review and editing, J.L. and S.W.; visualization, S.D.; supervision, J.L.; project administration, J.Z.; funding acquisition, X.S. All authors have read and agreed to the published version of the manuscript.

Funding

This research was funded by the National Natural Science Foundation of China, grant numbers 52422004, 52179108 and the Shenzhen Science and Technology Program of Shenzhen City, grant number KCXFZ20211020164013020.

Data Availability Statement

All data generated or analyzed during this study are included in the main manuscript and its Appendix A.

Conflicts of Interest

Authors Jiguo Liu and Jun Zhang were employed by the company CCCC Second Highway Consultants Co., Ltd. The remaining authors declare that the research was conducted in the absence of any commercial or financial relationships that could be construed as a potential conflict of interest.

Abbreviations

The following abbreviations are used in this manuscript:
CLSMControlled low-strength material
OPCOrdinary Portland cement
UCSUnconfined compressive strength
GGBFSGround granulated blast-furnace slag
CSCarbide slag
SEMScanning electron microscopy
XRDX-ray diffraction
XRFX-ray fluorescence
FTIRFourier transform infrared
LF-NMRLow-field nuclear magnetic resonance

Appendix A

To enhance clarity and completeness, this Appendix A provides supplementary data that complement the figures and tables presented in the main text. In particular, additional details are included for datasets that may appear limited or insufficiently resolved in the manuscript, ensuring greater transparency and reproducibility of the experimental results.
Table A1. Flow values of GC-CLSM under varying GGBFS:CS ratios and W/S ratios.
Mix Ratio
(GGBFS:CS)
Flow Value (mm)
W/S = 0.40W/S = 0.45W/S = 0.50
G100C0221.4361.3432.1
G90C10185.6322.5409.3
G80C20154.5288.3385.9
G70C30131.2259.5361.3
G60C40110.8232.6342.3
Table A2. Bleeding rates of GC-CLSM under varying GGBFS:CS ratios and W/S ratios.
Mix Ratio
(GGBFS:CS)
Bleeding Ratio (%)
W/S = 0.40W/S = 0.45W/S = 0.50
G100C01.572.423.75
G90C101.142.053.25
G80C200.741.632.57
G70C300.461.091.88
G60C400.230.621.29
Table A3. Setting times of GC-CLSM under varying GGBFS:CS ratios and W/S ratios.
Mix Ratio
(GGBFS:CS)
Setting Time (h)
W/S = 0.40W/S = 0.45W/S = 0.50
InitialFinalInitialFinalInitialFinal
G100C0162.3192.4190.3232.8211.3265.2
G90C1022.324.223.426.224.128.3
G80C207.18.27.99.68.611.3
G70C304.15.04.55.25.56.6
G60C402.53.23.54.24.14.8
Table A4. pH values of pore solution of GC-CLSM under varying GGBFS:CS ratios.
Time (h)pH
G90C10G80C20G70C30G60C40
0.513.3913.4113.4213.51
113.4113.4513.513.57
1.513.4113.4913.5313.61
213.4213.4913.5513.6
2.513.4313.513.5613.61
313.4413.513.5813.59
3.513.4413.5113.5813.61
413.4413.5213.5713.61
4.513.4513.5313.5813.6
513.4513.5313.5813.59
5.513.4513.5413.5813.57
613.4513.5513.5413.57

References

  1. Wang, W.; Wang, N.; Bao, Y.; Wang, Q.; Chang, X.; Sha, F.; Chen, X. Research and Implementation of Eco-Grouting Material Derived from Shield Tunneling Muck. Case Stud. Constr. Mater. 2024, 21, e03852. [Google Scholar] [CrossRef]
  2. Sharghi, M.; Jeong, H. The Potential of Recycling and Reusing Waste Materials in Underground Construction: A Review of Sustainable Practices and Challenges. Sustainability 2024, 16, 4889. [Google Scholar] [CrossRef]
  3. Wu, T.; Gao, Y.; Huang, C.; Jin, A.; Qu, X.; Ji, M.; Zhou, Y.; Li, J. In Situ Resource Reutilization of Earth Pressure Balance (EPB) Shield Muck for the Generation of Novel Synchronous Grouting Materials. Constr. Build. Mater. 2024, 421, 135737. [Google Scholar] [CrossRef]
  4. Zhao, H.; Mao, Y.; Jiang, M.; Dong, X.; Wang, T.; Xue, Y. Sustainable Production of Lightweight Ceramics from Shield Tunnel Muck and Phosphorus Tailings Enhanced by CaO/SiO2 Ratios. Constr. Build. Mater. 2025, 482, 141738. [Google Scholar] [CrossRef]
  5. Cheng, B.; Chang, R.; Yin, Q.; Li, J.; Huang, J.; Chen, H. A PSR-AHP-GE Model for Evaluating Environmental Impacts of Spoil Disposal Areas in High-Speed Railway Engineering. J. Clean. Prod. 2023, 388, 135970. [Google Scholar] [CrossRef]
  6. Sun, X.; Zhang, H.; Han, Z.; Huang, S.; Wu, S.; Tian, Z.; Chen, X.; Wang, C.; Dong, Z. Mechanism of Geopolymeric Solidification in Shield-Tunnelling Slurry from Diverse Sources: The Role of Bentonite Adsorption in Influencing the Reaction Process. Constr. Build. Mater. 2024, 431, 136627. [Google Scholar] [CrossRef]
  7. Devaraj, V.; Mangottiri, V.; Balu, S. Sustainable Utilization of Industrial Wastes in Controlled Low-Strength Materials: A Review. Environ. Sci. Pollut. Res. 2022, 30, 14008–14028. [Google Scholar] [CrossRef]
  8. Wang, C.; Li, Y.; Wen, P.; Zeng, W.; Wang, X. A Comprehensive Review on Mechanical Properties of Green Controlled Low Strength Materials. Constr. Build. Mater. 2023, 363, 129611. [Google Scholar] [CrossRef]
  9. Ibrahim, M.; Rahman, M.K.; Najamuddin, S.K.; Alhelal, Z.S.; Acero, C.E. A Review on Utilization of Industrial By-Products in the Production of Controlled Low Strength Materials and Factors Influencing the Properties. Constr. Build. Mater. 2022, 325, 126704. [Google Scholar] [CrossRef]
  10. Parhi, S.K.; Dwibedy, S.; Panda, S.; Panigrahi, S.K. A Comprehensive Study on Controlled Low Strength Material. J. Build. Eng. 2023, 76, 107086. [Google Scholar] [CrossRef]
  11. Blanco, A.; Pujadas, P.; Cavalaro, S.H.P.; Aguado, A. Methodology for the Design of Controlled Low-Strength Materials. Application to the Backfill of Narrow Trenches. Constr. Build. Mater. 2014, 72, 23–30. [Google Scholar] [CrossRef]
  12. Li-Jeng, H.; Her-Yung, W.; Yeong-Nain, S.; Duc-Hien, L. Earth Pressure and Settlement Analysis of Trench Ducts Backfilled with Controlled Low Strength Materials. Procedia Eng. 2016, 142, 174–181. [Google Scholar] [CrossRef]
  13. Zhao, G.; Pan, X.; Yan, H.; Tian, J.; Han, Y.; Guan, H.; Liu, B.; Wang, S. Utilization of High Fine-Grained Shield Tunnel Spoil in CLSM and Effect of Foam Agent Content on Properties. Constr. Build. Mater. 2024, 423, 135836. [Google Scholar] [CrossRef]
  14. Zhang, C.; Yang, J.; Xie, Y.; Fu, J.; Wang, S.; Yin, J. Utilization of Tunnel Spoils as a Lightweight Filling Material for the Voids behind Tunnel Excavation Contour. J. Clean. Prod. 2022, 372, 133559. [Google Scholar] [CrossRef]
  15. Zhang, T.; Jianming, Y.; Wang, W.; Chen, P.; Chen, C.; Wu, Z.; Wei, J.; Yu, Q. Efficient Utilization of Waste Shield Slurry and CDW Fines to Prepare Eco-Friendly Controlled Low-Strength Material. J. Clean. Prod. 2024, 444, 141343. [Google Scholar] [CrossRef]
  16. Cheng, D.; Reiner, D.M.; Yang, F.; Cui, C.; Meng, J.; Shan, Y.; Liu, Y.; Tao, S.; Guan, D. Projecting Future Carbon Emissions from Cement Production in Developing Countries. Nat. Commun. 2023, 14, 8213. [Google Scholar] [CrossRef]
  17. Sousa, V.; Bogas, J.A.; Real, S.; Meireles, I. Industrial Production of Recycled Cement: Energy Consumption and Carbon Dioxide Emission Estimation. Environ. Sci. Pollut. Res. 2022, 30, 8778–8789. [Google Scholar] [CrossRef] [PubMed]
  18. Liao, S.; Wang, D.; Xia, C.; Tang, J. China’s Provincial Process CO2 Emissions from Cement Production during 1993–2019. Sci. Data 2022, 9, 165. [Google Scholar] [CrossRef]
  19. Zhao, G.; Guan, H.; Yan, H.; Ruan, Y.; Han, Y.; Pan, X.; Tian, J.; Liu, B. An Innovative Sustainable Solution: Recycling Shield-Discharge Waste Soil as Fine Aggregate to Produce Eco-Friendly Geopolymer-Based Flowable Backfill Materials. Environ. Technol. Innov. 2024, 36, 103857. [Google Scholar] [CrossRef]
  20. Jeremiah, J.J.; Abbey, S.J.; Booth, C.A.; Kashyap, A. Geopolymers as Alternative Sustainable Binders for Stabilisation of Clays—A Review. Geotechnics 2021, 1, 439–459. [Google Scholar] [CrossRef]
  21. Sun, X.; Liu, W.; Chen, X.; Wu, S.; Chen, G.; Bi, Y.; Chen, Z. Sustainable Solutions: Transforming Waste Shield Tunnelling Soil into Geopolymer-Based Underwater Backfills. J. Clean. Prod. 2024, 445, 141363. [Google Scholar] [CrossRef]
  22. Zhao, G.; Pan, X.; Yan, H.; Tian, J.; Han, Y.; Guan, H.; Ruan, Y.; Liu, B.; Chen, F. Optimization and Characterization of GGBFS-FA Based Alkali-Activated CLSM Containing Shield-Discharged Soil Using Box-Behnken Response Surface Design Method. Case Stud. Constr. Mater. 2024, 21, e03800. [Google Scholar] [CrossRef]
  23. Zhang, S.; Jiao, N.; Ding, J.; Guo, C.; Gao, P.; Wei, X. Utilization of Waste Marine Dredged Clay in Preparing Controlled Low Strength Materials with Polycarboxylate Superplasticizer and Ground Granulated Blast Furnace Slag. J. Build. Eng. 2023, 76, 107351. [Google Scholar] [CrossRef]
  24. Park, S.M.; Lee, N.K.; Lee, H.K. Circulating Fluidized Bed Combustion Ash as Controlled Low-Strength Material (CLSM) by Alkaline Activation. Constr. Build. Mater. 2017, 156, 728–738. [Google Scholar] [CrossRef]
  25. Chompoorat, T.; Thepumong, T.; Nuaklong, P.; Jongvivatsakul, P.; Likitlersuang, S. Alkali-Activated Controlled Low-Strength Material Utilizing High-Calcium Fly Ash and Steel Slag for Use as Pavement Materials. J. Mater. Civ. Eng. 2021, 33, 04021178. [Google Scholar] [CrossRef]
  26. Jiang, M.; Qian, Y.; Sun, Q. Preparation of Controlled Low-Strength Materials from Alkali-Excited Red Mud-Slag-Iron Tailings Sand and a Study of the Reaction Mechanism. Environ. Sci. Pollut. Res. 2022, 30, 22232–22248. [Google Scholar] [CrossRef]
  27. Mahamaya, M.; Jain, S.; Das, S.K.; Paul, R. Engineering Properties of Cementless Alkali Activated CLSM Using Ferrochrome Slag. J. Mater. Civ. Eng. 2023, 35, 4022441. [Google Scholar] [CrossRef]
  28. Zhou, Y.; Huo, M.; Zhang, L.; Guan, Q. Strength Development and Solidification Mechanism of Soils with Different Properties Stabilized by Cement-Slag-Based Materials. Case Stud. Constr. Mater. 2024, 21, e04034. [Google Scholar] [CrossRef]
  29. Ling, T.-C.; Kaliyavaradhan, S.K.; Poon, C.S. Global Perspective on Application of Controlled Low-Strength Material (CLSM) for Trench Backfilling—An Overview. Constr. Build. Mater. 2018, 158, 535–548. [Google Scholar] [CrossRef]
  30. Kaliyavaradhan, S.K.; Ling, T.-C.; Guo, M.-Z. Upcycling of Wastes for Sustainable Controlled Low-Strength Material: A Review on Strength and Excavatability. Environ. Sci. Pollut. Res. 2022, 29, 16799–16816. [Google Scholar] [CrossRef]
  31. ASTM D6103; Standard Test Method for Flow Consistency of Controlled Low Strength Material (CLSM). ASTM International: West Conshohocken, PA, USA, 2017.
  32. ASTM C940; Standard Test Method for Expansion and Bleeding of Freshly Mixed Grouts for Preplaced-Aggregate Concrete in the Laboratory. ASTM International: West Conshohocken, PA, USA, 2016.
  33. ASTM C403; Standard Test Method for Time of Setting of Concrete Mixtures by Penetration Resistance. ASTM International: West Conshohocken, PA, USA, 2016.
  34. ASTM D2166/D2166M-13; Standard Test Method for Unconfined Compressive Strength of Cohesive Soil. ASTM International: West Conshohocken, PA, USA, 2013.
  35. Vollpracht, A.; Lothenbach, B.; Snellings, R.; Haufe, J. The Pore Solution of Blended Cements: A Review. Mater. Struct. 2016, 49, 3341–3367. [Google Scholar] [CrossRef]
  36. Sun, X.; Zhang, M.; Sheikh, I.R.; Chen, C.; He, J.; Chen, F.; Chen, X.; Guan, J.; Wu, S.; Dong, Z. Geocell-Reinforced Pourable Geopolymeric Clayey Waste Slurry: Performance as a Roadway Layer under Cyclic Loading. Transp. Geotech. 2025, 54, 101610. [Google Scholar] [CrossRef]
  37. Kapeluszna, E.; Kotwica, Ł.; Różycka, A.; Gołek, Ł. Incorporation of Al in C-A-S-H Gels with Various Ca/Si and Al/Si Ratio: Microstructural and Structural Characteristics with DTA/TG, XRD, FTIR and TEM Analysis. Constr. Build. Mater. 2017, 155, 643–653. [Google Scholar] [CrossRef]
  38. Pardal, X.; Pochard, I.; Nonat, A. Experimental Study of Si–Al Substitution in Calcium-Silicate-Hydrate (C-S-H) Prepared under Equilibrium Conditions. Cem. Concr. Res. 2009, 39, 637–643. [Google Scholar] [CrossRef]
  39. Hong, S.-Y.; Glasser, F.P. Alkali Sorption by C-S-H and C-A-S-H Gels. Cem. Concr. Res. 2002, 32, 1101–1111. [Google Scholar] [CrossRef]
  40. Jha, A.K.; Kumar, D.; Sivapullaiah, P.V. Influence of Fly Ash on Geotechnical Behaviour of Red Mud: A Micro-Mechanistic Study. Geotech. Geol. Eng. 2020, 38, 6157–6176. [Google Scholar] [CrossRef]
  41. Razeghi, H.R.; Safaee, F.; Geranghadr, A.; Ghadir, P.; Javadi, A.A. Investigating Accelerated Carbonation for Alkali Activated Slag Stabilized Sandy Soil. Geotech. Geol. Eng. 2024, 42, 575–592. [Google Scholar] [CrossRef]
  42. Antunes Boca Santa, R.A.; Bernardin, A.M.; Riella, H.G.; Kuhnen, N.C. Geopolymer Synthetized from Bottom Coal Ash and Calcined Paper Sludge. J. Clean. Prod. 2013, 57, 302–307. [Google Scholar] [CrossRef]
  43. Li, Z.; Ikeda, K. Compositions and Microstructures of Carbonated Geopolymers with Different Precursors. Materials 2024, 17, 1491. [Google Scholar] [CrossRef]
  44. Harirchi, P.; Yang, M. Exploration of Carbon Dioxide Curing of Low Reactive Alkali-Activated Fly Ash. Materials 2022, 15, 3357. [Google Scholar] [CrossRef]
  45. Wang, S.; Su, J.; Wu, Z.; Ma, W.; Li, Y.; Hui, H. Silty Clay Stabilization Using Metakaolin-Based Geopolymer Binder. Front. Phys. 2021, 9, 769786. [Google Scholar] [CrossRef]
  46. Yan, D.; Xie, L.; Qian, X.; Ruan, S.; Zeng, Q. Compositional Dependence of Pore Structure, Strengthand Freezing-Thawing Resistance of Metakaolin-Based Geopolymers. Materials 2020, 13, 2973. [Google Scholar] [CrossRef] [PubMed]
  47. Chen, S.; Ruan, S.; Zeng, Q.; Liu, Y.; Zhang, M.; Tian, Y.; Yan, D. Pore Structure of Geopolymer Materials and Its Correlations to Engineering Properties: A Review. Constr. Build. Mater. 2022, 328, 127064. [Google Scholar] [CrossRef]
  48. Liu, B.; Yang, J.; Li, D.; Xing, F.; Fang, Y. Effect of a Synthetic Nano-CaO-Al2O3-SiO2-H2O Gel on the Early-Stage Shrinkage Performance of Alkali-Activated Slag Mortars. Materials 2018, 11, 1128. [Google Scholar] [CrossRef] [PubMed]
  49. Mastoi, A.K.; Hameed, S.; Ali, M.; Traore, A.F. Machine Learning–Based Prediction of Unconfined Compressive Strength and Contaminant Leachability in Dredged Contaminated Sediments for Land Reclamation Projects. Environ. Sci. Pollut. Res. 2025, 32, 8160–8182. [Google Scholar] [CrossRef]
  50. Nikolić, I.; Drinčić, A.; Djurović, D.; Karanović, L.; Radmilović, V.V.; Radmilović, V.R. Kinetics of Electric Arc Furnace Slag Leaching in Alkaline Solutions. Constr. Build. Mater. 2016, 108, 1–9. [Google Scholar] [CrossRef]
  51. Snellings, R. Solution-Controlled Dissolution of Supplementary Cementitious Material Glasses at PH 13: The Effect of Solution Composition on Glass Dissolution Rates. J. Am. Ceram. Soc. 2013, 96, 2467–2475. [Google Scholar] [CrossRef]
  52. Yang, G.; Li, C.; Xie, W.; Yue, Y.; Kong, C.; Li, X. Effect of Carbide Slag and Steel Slag as Alkali Activators on the Key Properties of Carbide Slag-Steel Slag-Slag-Phosphogypsum Composite Cementitious Materials. Front. Mater. 2024, 11, 1353004. [Google Scholar] [CrossRef]
  53. Song, S.; Jennings, H.M. Pore Solution Chemistry of Alkali-Activated Ground Granulated Blast-Furnace Slag11This Paper Was Originally Submitted to Advanced Cement Based Materials. The Paper Was Received at the Editorial Office of Cement and Concrete Research on 12 November 1998 and Accepted in Final Form on 16 November 1998. Cem. Concr. Res. 1999, 29, 159–170. [Google Scholar] [CrossRef]
  54. Bernal, S.A.; Provis, J.L.; Rose, V.; Mejía de Gutierrez, R. Evolution of Binder Structure in Sodium Silicate-Activated Slag-Metakaolin Blends. Cem. Concr. Compos. 2011, 33, 46–54. [Google Scholar] [CrossRef]
  55. Gebregziabiher, B.S.; Thomas, R.; Peethamparan, S. Very Early-Age Reaction Kinetics and Microstructural Development in Alkali-Activated Slag. Cem. Concr. Compos. 2015, 55, 91–102. [Google Scholar] [CrossRef]
  56. Bernal, S.A.; Provis, J.L. Durability of Alkali-Activated Materials: Progress and Perspectives. J. Am. Ceram. Soc. 2014, 97, 997–1008. [Google Scholar] [CrossRef]
  57. Lamaa, G.; Duarte, A.P.C.; Silva, R.V.; de Brito, J. Carbonation of Alkali-Activated Materials: A Review. Materials 2023, 16, 3086. [Google Scholar] [CrossRef]
  58. Zhang, X.; Long, K.; Liu, W.; Li, L.; Long, W.-J. Carbonation and Chloride Ions’ Penetration of Alkali-Activated Materials: A Review. Molecules 2020, 25, 5074. [Google Scholar] [CrossRef] [PubMed]
Figure 1. (a) XRD patterns; (b) Particle size distribution of shield tunneling muck, GGBFS, and CS.
Buildings 15 02373 g001
Figure 2. Workflow for GC-CLSM preparation, testing procedures, and analytical methods.
Buildings 15 02373 g002
Figure 3. Fresh properties of GC-CLSM under varying GGBFS:CS ratios and water contents: (a) flow value; (b) bleeding rate; and (c) initial and final setting times. Arrows denote the observed trends.
Buildings 15 02373 g003
Figure 4. UCS development of GC-CLSM with varying GGBFS:CS ratios at different W/S ratios: (a) 40%; (b) 45%; and (c) 50%. The black dashed arrows indicate strength development trends.
Buildings 15 02373 g004
Figure 5. Stress–strain behavior of GC-CLSM mixtures at a W/S ratio of 45% and various curing ages: (a) 1 day; (b) 3 days; (c) 7 days; (d) 14 days; and (e) 28 days.
Buildings 15 02373 g005
Figure 6. Evolution of pore-solution alkalinity for GC-CLSM with different GGBFS:CS ratios: (a) pH development over time; (b) OH concentration development over time; and (c) ROH−.
Buildings 15 02373 g006
Figure 7. SEM images of 1-day GC-CLSM at different GGBFS:CS ratios.
Buildings 15 02373 g007
Figure 8. EDS analysis of flocculent gel regions in 1-day GC-CLSM under various GGBFS:CS ratios.
Buildings 15 02373 g008
Figure 9. XRD patterns of GC-CLSM cured with different GGBFS:CS ratios: (a) 1 day; (b) 28 days.
Buildings 15 02373 g009
Figure 10. FTIR spectra of GC-CLSM cured for 1 and 28 days with different GGBFS:CS ratios.
Buildings 15 02373 g010
Figure 11. Pore characteristics of GC-CLSM under different GGBFS:CS ratios: (a) 1-day pore size distribution; (b) 28-day pore size distribution; and (c) total porosity at 1 and 28 days.
Buildings 15 02373 g011
Figure 12. Strength ratios of GC-CLSM mixtures normalized to G90C10 under different GGBFS:CS ratios and W/S ratios: (a) 40%; (b) 45%; and (c) 50%.
Buildings 15 02373 g012
Figure 13. Carbon emissions per ton of shield tunneling muck treated with OPC-CLSM and GC-CLSM systems.
Buildings 15 02373 g013
Table 1. Main chemical compositions of shield tunneling muck, GGBFS, and CS.
MaterialsSiO2
(%)
Al2O3
(%)
CaO
(%)
Fe2O3
(%)
TiO2
(%)
SO3
(%)
MnO
(%)
V2O5
(%)
CrO3
(%)
Rb2O
(%)
Shield tunneling muck70.3312.668.813.990.760.010.070.030.020.01
GGBFS31.7614.4248.660.361.402.380.46---
CS3.491.7893.160.520.090.89--0.02-
Table 2. Mix design matrix for GC-CLSM with varying GGBFS:CS ratios and W/S ratios.
No.SampleGGBFS:CS
Ratio
GGBFS
(%)
CS
(%)
CS/GGBFS
Ratio
(%)
Alkaline Activator
(%)
W/S
(%)
1G100C0100:02000540
2G90C1090:1018211.11540
3G80C2080:2016425540
4G70C3070:3014642.86540
5G60C4060:4012866.67540
6G100C0100:02000545
7G90C1090:1018211.11545
8G80C2080:2016425545
9G70C3070:3014642.86545
10G60C4060:4012866.67545
11G100C0100:02000550
12G90C1090:1018211.11550
13G80C2080:2016425550
14G70C3070:3014642.86550
15G60C4060:4012866.67550
Disclaimer/Publisher’s Note: The statements, opinions and data contained in all publications are solely those of the individual author(s) and contributor(s) and not of MDPI and/or the editor(s). MDPI and/or the editor(s) disclaim responsibility for any injury to people or property resulting from any ideas, methods, instructions or products referred to in the content.

