Article

Study on Multi-Objective Optimization of Construction of Yellow River Grand Bridge

1
Henan Jiaozheng Expressway Co., Ltd., Zhengzhou 450016, China
2
School of Water Conservancy and Transportation, Zhengzhou University, Zhengzhou 450001, China
*
Author to whom correspondence should be addressed.
Buildings 2025, 15(13), 2371; https://doi.org/10.3390/buildings15132371
Submission received: 6 May 2025 / Revised: 2 July 2025 / Accepted: 4 July 2025 / Published: 6 July 2025
(This article belongs to the Section Construction Management, and Computers & Digitization)

Abstract

As an important transportation hub connecting the two sides of the Yellow River, the Yellow River Grand Bridge is of great significance for strengthening regional exchanges and promoting the high-quality development of the Yellow River Basin. However, due to the complex terrain, changeable climate, high sediment concentration, long construction duration, complicated process, strong dynamic, and many factors affecting construction. It often brings many problems, including low quality, waste of resources, and environmental pollution, which makes it difficult to achieve the balance of multiple objectives at the same time. Therefore, it is very important to carry out multi-objective optimization research on the construction of the Yellow River Grand Bridge. This paper takes the Yellow River Grand Bridge on a highway as the research object and combines the concept of “green construction” and the national policy of “carbon neutrality and carbon peaking” to construct six major construction projects, including construction time, cost, quality, environment, resources, and carbon emission. Then, according to the multi-attribute utility theory, the objectives of different attributes are normalized, and the multi-objective equilibrium optimization model of construction time-cost-quality-environment-resource-carbon emission of the Yellow River Grand Bridge is obtained; finally, in order to avoid the shortcomings of a single algorithm, the particle swarm optimization algorithm and the simulated annealing algorithm are combined to obtain the simulated annealing particle swarm optimization (SA-PSO) algorithm. The multi-objective equilibrium optimization model of the construction of the Yellow River Grand Bridge is solved. The optimization result is 108 days earlier than the construction period specified in the contract, which is 9.612 million yuan less than the maximum cost, 6.3% higher than the minimum quality level, 11.1% lower than the maximum environmental pollution level, 4.8% higher than the minimum resource-saving level, and 3.36 million tons lower than the maximum carbon emission level. It fully illustrates the effectiveness of the SA-PSO algorithm for solving multi-objective problems.

1. Introduction

In recent years, China’s large-scale infrastructure construction is developing in the direction of more professional, more standardized, and more green environmental protection, which indicates that in the construction process of engineering projects, we can no longer blindly compress the construction period or reduce the cost but need to seek the optimal balance of multiple main control objectives. The Yellow River Grand Bridge passes through the Yellow River floodplain. It is difficult to construct since it has a long construction period, consumes a lot of resources, and has a special construction environment. So it is difficult to achieve multi-objective balance [1]. Therefore, it is of great practical significance to conduct multi-objective equilibrium optimization research on the construction of the Yellow River Grand Bridge.
At present, many scholars have conducted research on the multi-objective optimization problems of engineering projects. Zhang Fengli [2] took the maintenance of emergency diesel engines in a nuclear power plant as the research object and established a multi-objective optimization model with the objective of execution cost and maintenance duration under the premise of considering multi-dimensional maintenance resources. A. Afshar [3] proposed a heuristic optimal scheduling model by taking the trade-off analysis of time and cost as an important aspect of construction project planning and control, which focuses on the two key objectives of time and cost. Then, Khaled El-Rayes [4] transformed the traditional two-dimensional time-cost trade-off analysis into an advanced three-dimensional time-cost-quality trade-off analysis, minimizing the cost and time spent in the construction process while ensuring the highest level of building quality. Zhang Lianying [5] aimed at the uncertain factors existing in actual engineering projects. Through the fuzzy description of the interrelationships among the three objective functions of project duration, cost, and quality, a fuzzy equilibrium optimization model based on these three was established. Liu Jia [6] conducted a systematic study on the multi-objective trade-off optimization of construction project duration, cost, and quality based on the fuzzy set theory and established a multi-objective trade-off optimization model of construction duration, cost, and quality under uncertain conditions. Xundi [7] pointed out that previous studies mainly focused on project planning and control, focusing only on cost-time trade-offs, while project quality research based on mathematical methods was very limited. Therefore, a trade-off model for time-cost-quality performance was proposed. In order to maximize the comprehensive benefits of municipal road construction and reduce the impact of construction on the surrounding residents, Tao Jingyu [8] introduced the environmental protection objective and constructed a multi-objective optimization model that includes construction period, quality, cost, and environmental protection. In order to solve the quality and safety issues in the planning stage, Abhilasha [9] constructed a decision-making model involving construction period, cost, quality, and safety factors and verified the effectiveness of the model using specific engineering projects. In order to solve the time, cost, quality, and resource trade-off issues, Duc-HocTran [10] integrated a scheduling module (M1) to determine all project goals, including time, cost, quality, and resources, and verified the performance of the model. Zeng Qiang [11] proposed a multi-objective optimization scheduling method for tasks in large-scale engineering projects. On the basis of the three major objectives of project duration; cost; and quality, safety, and environmental issues were added, and an optimization model based on the five major objectives was obtained. Li Xuelin [12], based on the multi-objective optimization theory, established a multi-objective optimization model for engineering projects covering project duration, cost, quality, resources, environment, and safety.
In solving multi-objective problems, intelligent optimization algorithms are gradually replacing traditional optimization methods. L. A. Zadeh [13] was the first to use the linear weighting method to solve this type of problem. Next, Y. Y. Haime [14] proposed a method to simplify multi-objective problems into single-objective problems by setting constraints and named it the constraint method. J. Schaffer [15] took the lead in introducing genetic algorithms into the research of multi-objective optimization and innovatively proposed a vector-evaluated genetic algorithm. Liu Ling [16] explored the non-linear relationship between the cost and function of engineering projects that change over time. On this basis, a multi-objective optimization model was constructed using the linear weighting method, and the optimal solution of the model was obtained through the genetic algorithm. Huo Yuyu [17], based on the NSGA-II algorithm, established a multi-objective equilibrium optimization model of duration-robustness-resources of technical interfaces in an uncertain environment, obtained a series of Pareto optimal solution sets, and achieved coordinated optimization of various objectives. Zhuo Jinsong [18] and others constructed a linear model of duration, cost, and quality for a certain construction engineering project and optimized it using the standard particle swarm algorithm, verifying the practicality of the particle swarm algorithm in solving multi-objective optimization problems. Gao Ying [19] integrated the idea of the simulated annealing algorithm into the standard particle swarm algorithm and introduced the sudden jump mechanism in this algorithm, which greatly enhanced the rapid convergence ability of the particle swarm algorithm in the search space. Ukoima Kelvin Nkalo [20] proposed and utilized an improved multi-objective particle swarm optimization algorithm by integrating the ant colony algorithm into the particle swarm algorithm to optimize the solar–wind–battery hybrid renewable energy system in rural communities of Rivers State, Nigeria. Wu Yuefeng [21] combined the traditional grey wolf optimization algorithm with the shuffled frog leaping algorithm to conduct multi-objective optimization for micro-service container scheduling. Most of the abovementioned studies adopted a single algorithm for solution, which has certain limitations. Although some scholars have already attempted to combine two different intelligent algorithms, they failed to achieve practical application in the multi-objective optimization of bridge construction projects.
In summary, it can be seen that domestic and foreign scholars have continuously applied new technologies and methods to the solution of multi-objective optimization problems based on in-depth studies of multi-objective optimization theory for engineering projects and have extended their research scope to engineering construction. The research on multi-objective optimization problems at home and abroad is undergoing important evolution, which is mainly reflected in two aspects as follows:
(1)
In the study of multi-objective systems, research on multi-objectives has gradually expanded to comprehensive investigations, including multiple dimensions such as safety, resources, the environment, and carbon emissions. Additionally, methods for studying the relationships between objectives are shifting from traditional linear models to non-linear models, aiming to reveal the complex interactions among construction duration, cost, and quality and make them more consistent with engineering practices.
(2)
In terms of solving multi-objective problems, intelligent optimization algorithms are gradually replacing traditional optimization methods. However, most studies only use a single algorithm for solving, which has certain limitations. Although some scholars have attempted to combine two different intelligent algorithms, this approach has not been practically applied in multi-objective optimization for bridge construction projects.
Therefore, in order to fill the gap in multi-objective optimization research for bridge construction and solve various problems caused by the complex terrain, changeable climate, high sediment content, and complicated construction procedures in the Yellow River Basin, including low quality, resource waste, and environmental pollution, so as to achieve the balance of multiple objectives. This article aims to combine the environment, resource, and carbon emission goals in green construction with the traditional three goals, conduct a comprehensive analysis, build a multi-objective balanced optimization model that is consistent with engineering reality, and combine the particle swarm algorithm and simulated annealing algorithm. Combined with this, the multi-objective optimization model for the construction of the Yellow River Grand Bridge is solved to find more ideal construction decisions.

2. Research Method

2.1. Construction of Multi-Objective Equilibrium Optimization Model for Construction of Yellow River Grand Bridge

In this paper, by understanding the general situation of the construction of the Yellow River Grand Bridge and aiming at the construction process, characteristics, and requirements of the Yellow River Grand Bridge, the target system of the bridge construction management and the functional relationship between the objectives (construction time, cost, quality, environment, resources, and carbon emissions) are analyzed one by one, the influencing factors and functional relationship are clarified, and the corresponding models are established respectively. Among them, the construction time target model is constructed by the network plan diagram method; the cost target model is formulated according to the cost expenditure mode; the various factors that affect the construction quality are considered to establish the quality target model; an environmental target model is created based on the impact of construction activities on the environment; and the resource target model is established according to the resource-saving degree. The carbon emission target model is established by calculating the carbon emission of the construction process.

2.1.1. Time Target Model

The construction time (referred to as “T”) refers to the entire time required from the beginning of the project to its completion [22]. The key to optimizing the construction time is to clarify the total construction period of the project, which can be calculated through the network planning diagram method. In the network planning diagram, if the duration of a certain task is changed or its start and end times are adjusted, it will affect the total project duration, and such work is defined as critical work. The path consisting of key tasks is called the critical path, and the critical path determines the completion time of the entire project. Based on the analysis of the network planning diagram, the construction time can be expressed as the cumulative value of the duration of all processes on the critical path in the diagram [23]. Taking into account construction quality and cost-effectiveness, the duration of each process has its minimum and maximum limits. Then, the construction time target model of the Yellow River Grand Bridge is as follows:
T = L m L i L m t i , s . t . t i min t i t i max
where T is the total construction time of the Yellow River Grand Bridge, L is the set of all paths in the project network plan, L m is the set of all processes on the critical path, t i is the construction time of the i-th process on the critical path, t i min is the shortest time of the i-th process, and t i max is the longest time of the i-th process.

2.1.2. Cost Target Model

The construction cost of the Yellow River Grand Bridge can be seen as consisting of two major parts: direct cost and indirect cost. Direct costs are related to the cost of the construction project itself and constitute the main component of project cost, including labor cost, material purchase fees, and construction equipment usage fees. Indirect costs refer to expenses incurred during project implementation that cannot be directly attributed to a specific project category. Such costs are usually not directly related to the project entity, such as management personnel’s salary, daily office expenses, and travel and transportation expenses. Therefore, the total construction cost calculation formula of the Yellow River Grand Bridge is as follows:
C = C z + C j
where C z is the direct cost and C j is the indirect cost.
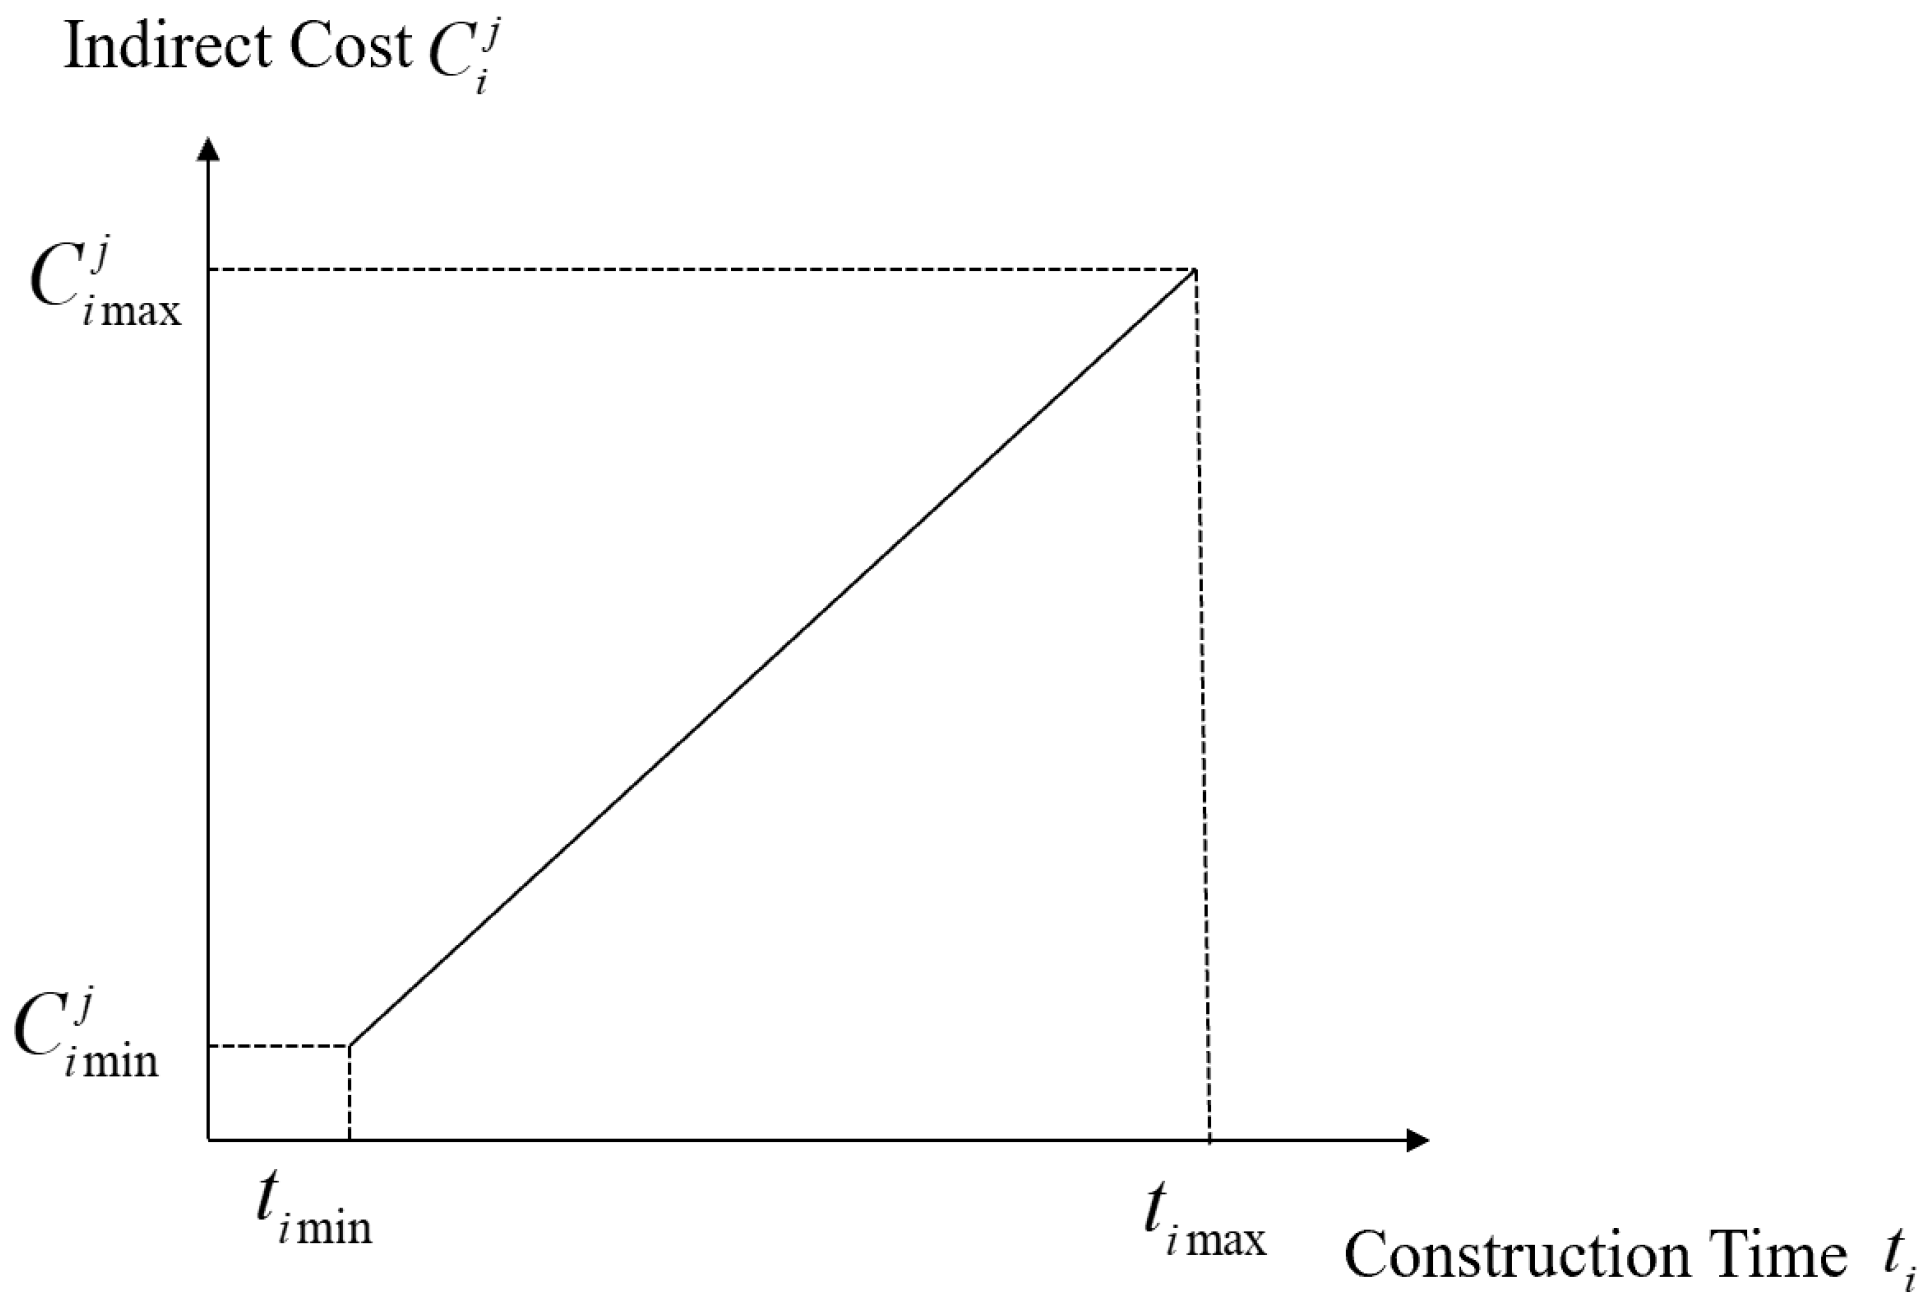
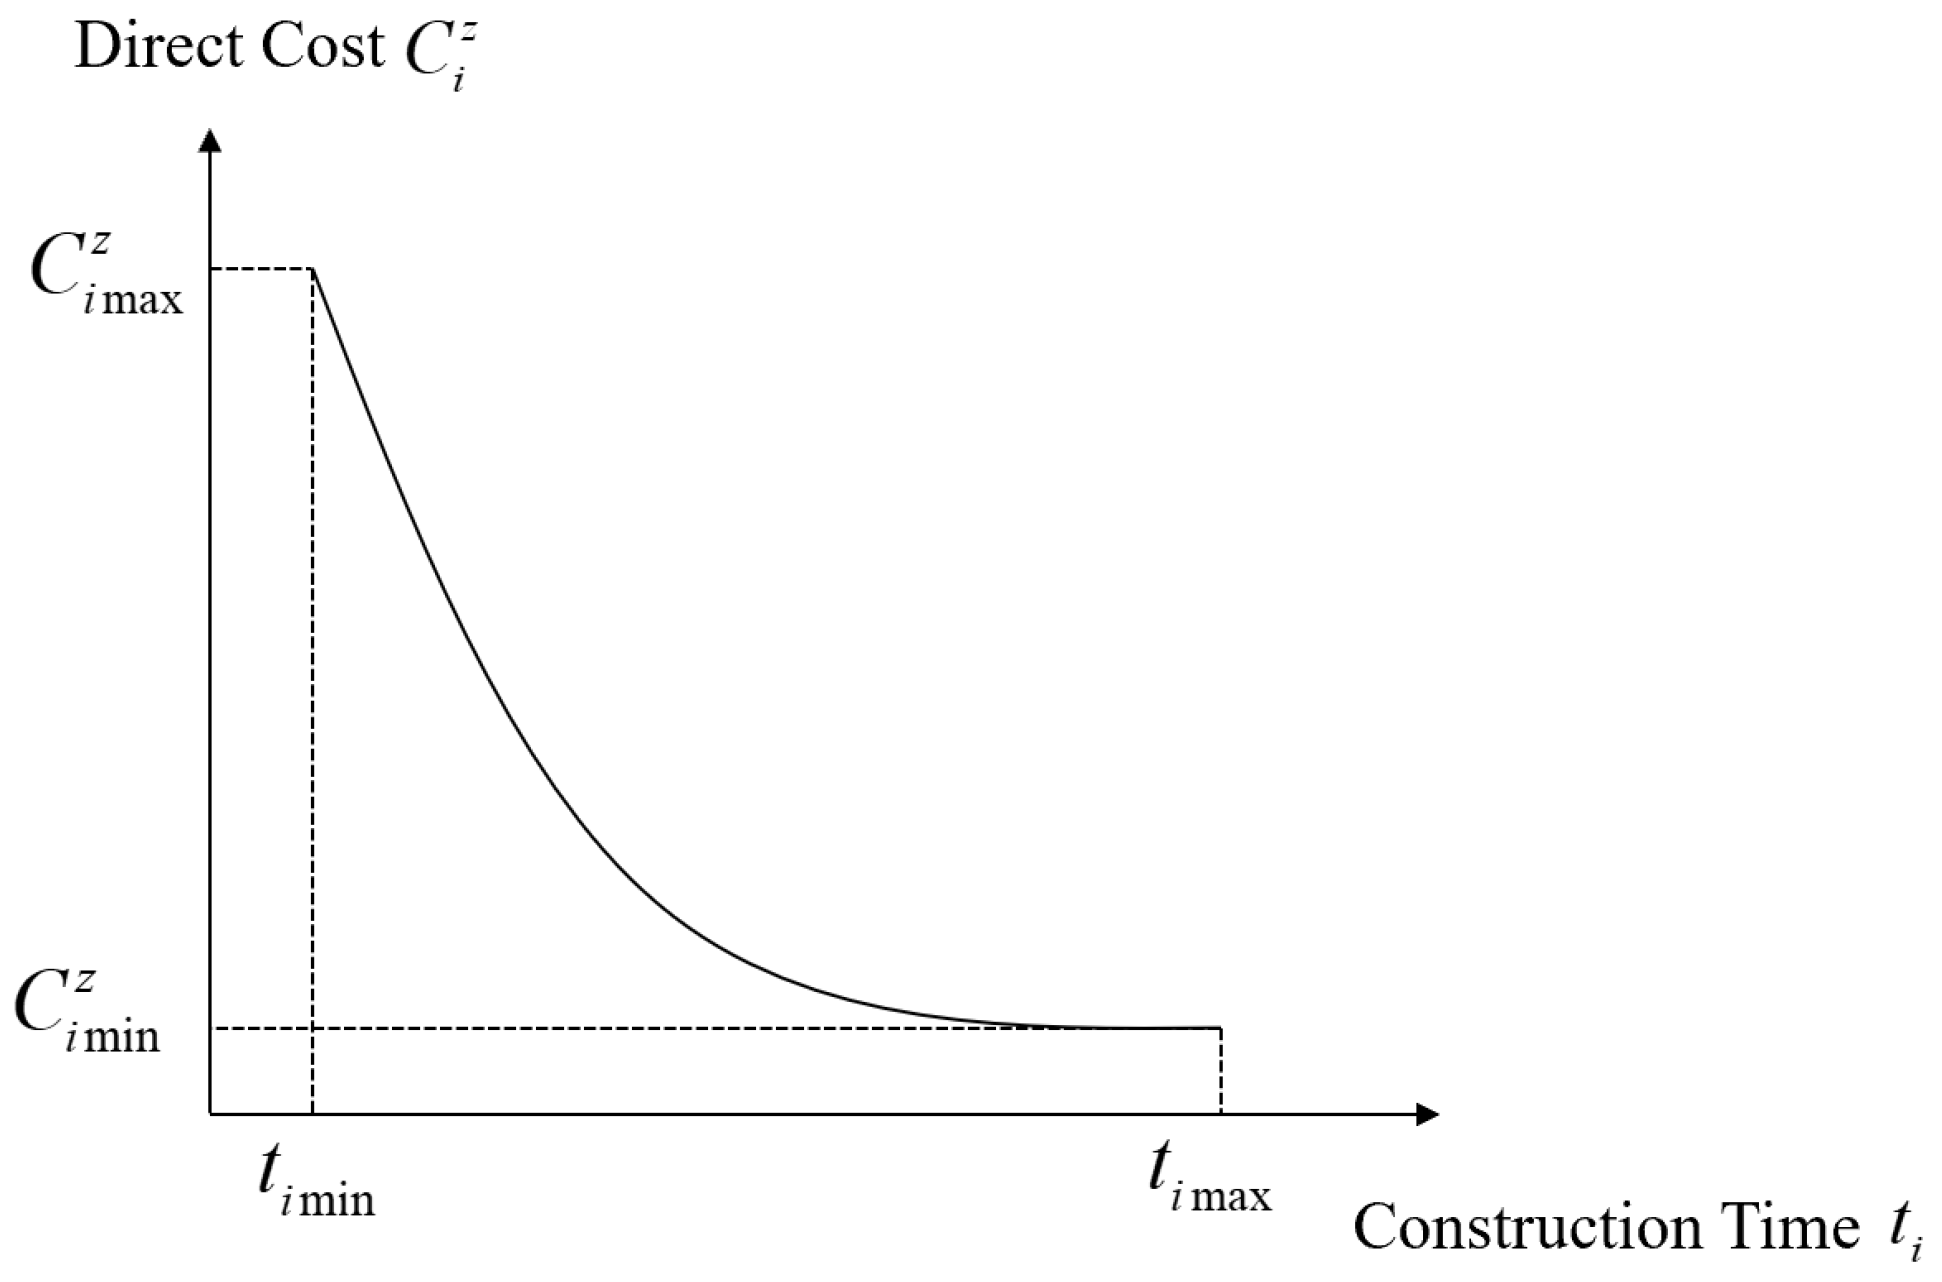
A large number of engineering practices have shown that if the construction time is compressed in order to complete the specified project volume, the amount of labor, turnover materials, and equipment will be increased, resulting in an increase in cost. The tighter the construction time, the greater the increase in direct cost. As the process construction time increases, management personnel’s salary expenses, travel expenses, and other expenses will increase accordingly, that is, indirect costs will increase accordingly. Therefore, this article uses a quadratic concave function to represent the mathematical relationship between process duration and direct costs and expresses the relationship between process duration and indirect costs as a linear increasing curve, as shown in Figure 1 and Figure 2.
Therefore, the relationship between construction time and direct cost can be expressed as Equation (3).
C i z = C i max z C i min z t i max t i min 2 t i t i max 2 + C i min z s . t . t i min t i t i max
where t i is the time required to complete the i-th process, C i max z is the maximum direct cost required to complete the i-th process, C i min z is the minimum direct cost required to complete the i-th process, and C i z is the direct cost to complete the i-th process.
The relationship between process construction time and indirect cost can be expressed by Equation (4):
C i j = C i max j C i min j t i max t i min t i t i max + C i max j s . t . t i min t i t i max
where t i is the time required to complete the i-th process, C i max j is the maximum indirect cost required to complete the i-th process, C i min j is the minimum indirect cost required to complete the i-th process, and C i j is the indirect cost to complete the i-th process.
Therefore, the construction cost target model of the Yellow River Grand Bridge can be obtained as follows:
C = C z + C j = i = 1 m ( C i z + C i j ) = i = 1 m C i max z C i min z t i max t i min 2 t i t i max 2 + C i min z + C i max j C i min j t i max t i min t i t i max + C i max j

2.1.3. Quality Goal Model

When exploring the relationship between process construction time and construction quality, this article points out that if process construction time is compressed, it may lead to a decrease in quality levels and reach the lowest level of quality when the process construction time is the shortest. As the construction time of the process is extended, each link can be carried out in a more orderly manner, thereby gradually improving the construction quality. However, there is a critical point in the relationship between construction quality and process construction time. Once this point is exceeded, even if the construction period is continued to be extended, it will not bring about further improvements in quality. Instead, it may lead to a significant increase in project costs and reduce the economics of the project benefits [24]. Accordingly, this article assumes that there is a proportional relationship between process time and construction quality as a quadratic function. The relationship between process construction time and construction quality level is shown in Figure 3.
According to the quadratic function curve relationship, the quality target model can be obtained as Formula (6):
Q i = Q i min Q i max ( t i min t i max ) 2 ( t i t i max ) 2 + Q i max
Q i min = k = 1 n q norm , k × D q i k , Q i max = 1
where t i min   <   t i   <   t i max and Q i min   <   Q i   <   Q i max , and D q i k is the lowest score of the kth quality influencing factor of process i.

2.1.4. Environmental Goal Model

In recent years, Chinese scholars have conducted a large amount of research in the field of environmental target optimization of engineering projects. Chen Yumei [25] used a quadratic function model to describe the relationship between environmental goals and process construction time, pointing out that the increase in process construction time will lead to an increase in costs and an improvement in environmental protection levels. Wang Ting [26] considered the linear relationship between the environmental protection index and the construction time and proposed that the construction time is the main factor in assessing the degree of construction pollution, and the impact on the environment increases with the duration of the process. Based on this, this article assumes that there is a linear relationship between the duration of the process and the degree of impact on the environment, as shown in Figure 4.
According to Figure 4, it can be obtained that when t i t i min , t i max , the equation for calculating the environmental pollution impact degree of process i is as follows:
P i = p i × t i
The overall environmental pollution degree of the Yellow River Grand Bridge project is determined by the superimposed environmental pollution degree of each process, and the final environmental pollution degree is as follows:
P = i = 1 m P i = i = 1 m p i t i

2.1.5. Resource Target Model

As shown in Figure 5, this article stipulates that when the process construction time is the longest, the resource-saving degree is optimal, and when the process construction time is the shortest, the resource-saving degree is the worst, and the optimal resource-saving degree is 1. As the construction process continues to advance, workers’ enthusiasm may decrease, and process and technical problems will gradually appear. Therefore, resource conservation does not simply increase with time. Therefore, this paper uses the form of a quadratic function to describe the relationship between process resource-saving degree and the duration of the process. The relationship between the resource-saving degree and the time of the i-th process is represented by the quadratic function curve R i = a t i 2 + b t i + c , where a, b, and c are the curve coefficients.
As can be seen from the figure above, when t i = 0 , R i = 0 , when t i = t i min , R i = R i min , and when t i = t i max , R i = R i max , the above relation is substituted into the quadratic function expression, and the coefficients are obtained:
a = R i max t i min R i min t i max t i max t i min t i max t i min , b = R i min t i max 2 R i max t i min 2 t i max t i min t i max t i min , c = 0
Therefore, it can be concluded that the relationship between resource-saving degree and duration of the i process is as follows:
R i = R i max t i min R i min t i max t i max t i min t i max t i min t i 2 + R i min t i max 2 R i max t i min 2 t i max t i min t i max t i min t i s . t . t i min t i t i max , R i min R i R i max
where R i is the resource-saving degree of the i-th process and R i max is the maximum resource savings for the i-th process.
Let ω r i be the weight of the resource-saving degree of the i-th process in the overall resource-saving degree of the construction of the Yellow River Grand Bridge; then the resource target model can be expressed as Equation (11).
R = i = 1 m ω r i R i = i = 1 m ω r i × R i max t i min R i min t i max t i max t i min t i max t i min t i 2 + R i min t i max 2 R i max t i min 2 t i max t i min t i max t i min t i

2.1.6. Carbon Emission Target Model

In the construction of railways, roads, bridges, and other infrastructure, the main source of carbon emissions is direct or indirect construction operations. Most studies attribute these sources of carbon emissions to the mining, production, processing, use, and transportation of building materials (such as earthmoving and gravel) and the use of construction equipment (such as road rollers, loaders, and dump trucks) [27]. The carbon emission target studied in this paper refers to the carbon emission generated by various mechanical equipment used in the production of building materials and construction during the whole construction process of the main bridge of the Yellow River, which is calculated by using the carbon emission factor method. For details, see Equation (12).
G = j = 1 N ( A D j × E F j )
where G is the total carbon emission (tCO2e), A D j is the number of the j type of construction machinery and equipment (workbench), E F j is the carbon emission factor of the j type construction machinery and equipment (tCO2e/platform), and N is the number of categories of mechanical equipment.
When consulting the relevant construction materials of the project, it is found that the energy consumed by the main machinery used in the construction process of the Yellow River Grand Bridge is mainly gasoline, diesel, and electricity. In order to simplify the data processing process, this paper only calculates the carbon emission factors of the common construction machinery using these energy sources so as to obtain the carbon emission factors of the construction machinery and equipment of each shift [28]. The specific results are shown in Table 1.
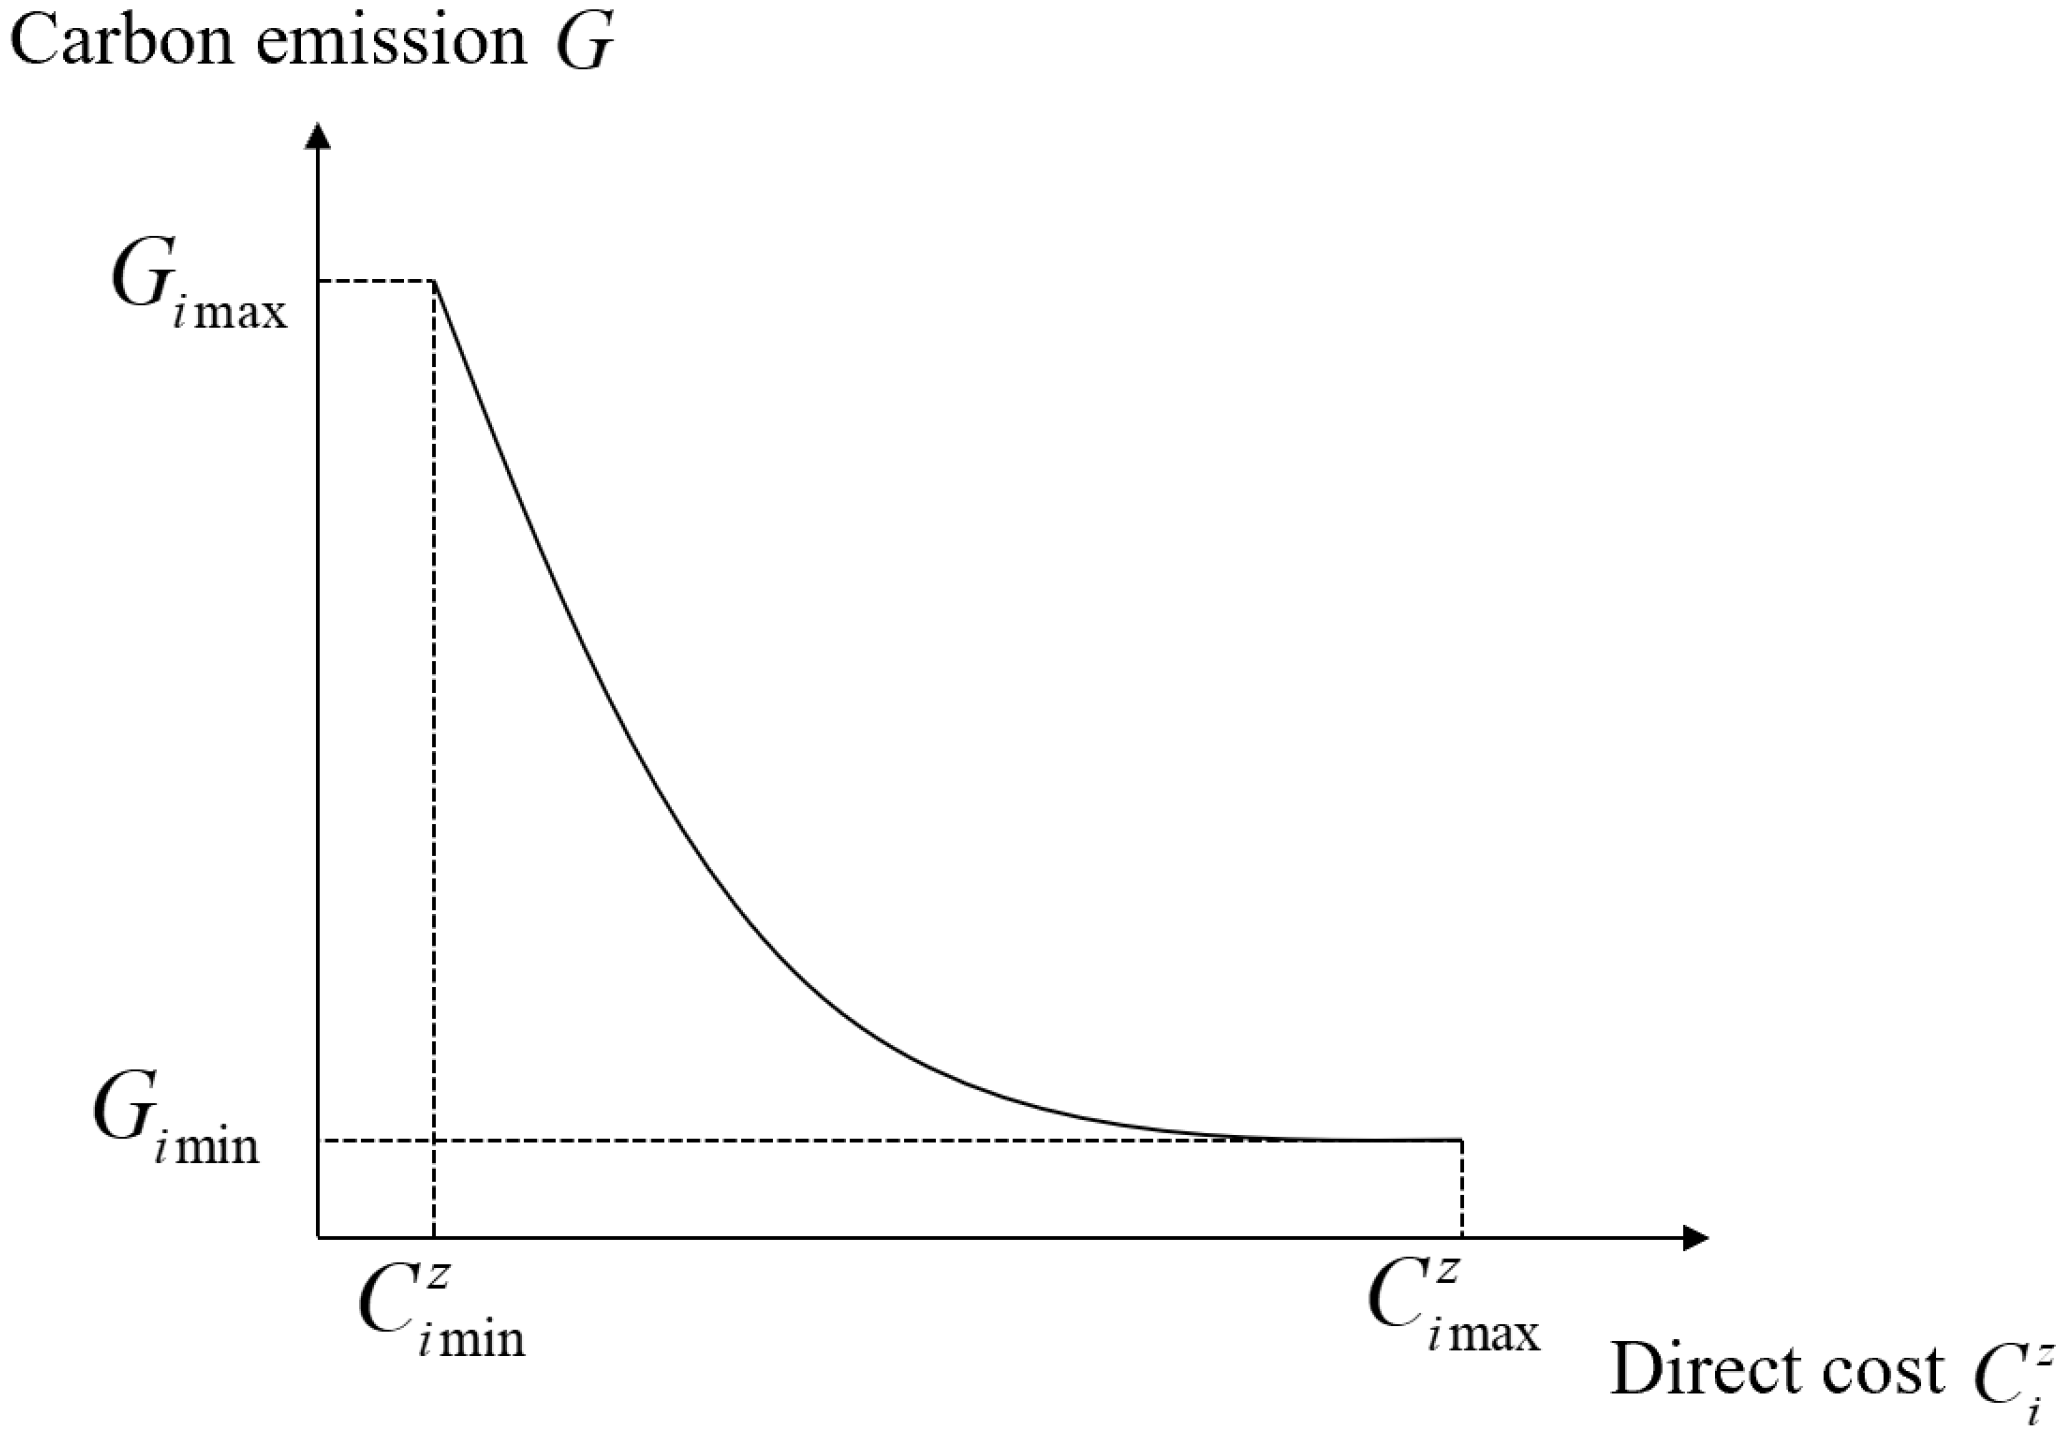
According to the above analysis, the carbon emission factors of different types of construction machinery are different. Due to the high cost of new environmental protection materials and environmental protection machinery, when the cost input is low, fewer environmental protection materials and machinery can be used and more carbon emissions will be generated; when the cost input is high, more carbon reduction measures can be taken and fewer carbon emissions will be generated. And the cost of purchasing construction materials and machinery is a direct cost. According to the law of diminishing marginal utility, when the cost input of carbon reduction measures gradually increases, the impact speed of input cost on carbon emission will also slow down due to the obstacles of ecological management and mandatory regulations related to construction. Therefore, the relationship between carbon emission and input cost can be obtained, as shown in Figure 6.
Using G i to represent the carbon emissions produced by the i-th process of the Yellow River Grand Bridge, the functional relationship between the carbon emissions of this process and the direct cost of input is as follows:
G i = G i max G i min C i max z C i min z 2 C i z C i max z 2 + G i min s . t . C i min z C i z C i max z
where G i max and G i min represent the maximum and minimum carbon emissions of process i, respectively. According to Formula (3), it can be deduced that the functional relationship between process carbon emissions and its construction time is as follows:
G i = b a t i t i max 2 + c 2 + G i min a = C i max z C i min z t i max t i min 2 , b = G i max G i min C i max z C i min z 2 , c = C i min z C i max z
The values of the maximum carbon emission G i max and the minimum carbon emission G i min are determined by Equation (12). Therefore, the Yellow River Grand Bridge construction time-carbon emission target model can be written as follows:
G = i = 1 m G i = i = 1 m b a t i t i max 2 + c 2 + G i min

2.1.7. Construction of Multi-Objective Equilibrium Optimization Model for the Construction of the Yellow River Grand Bridge

The purpose of the comprehensive model optimization of the construction of the Yellow River Grand Bridge is to establish a multi-objective comprehensive optimization model of “shorter construction time, lower cost, higher quality, lower environmental pollution, higher resource saving, and lower carbon emission” under the requirements of the project contract and specifications. Since the six targets all have different attributes, there are many inconveniences in the multi-objective optimization analysis, so it is necessary to apply the multi-attribute utility function theory to normalize the attributes of each target [29].
Multi-attribute utility function U = U T , C , Q , E , R , G can be regarded as the combination of several single-attribute utility functions. For the manager of the construction project, the utility function comprehensively considers the sum of all target values. The higher the utility value, the greater the overall benefit of the project. The construction of a single-attribute utility function is the basis for the construction of a multi-attribute utility function. Therefore, it is necessary to establish a corresponding single-attribute utility function for each target in the construction process of the Yellow River Grand Bridge and then construct the multi-attribute utility function of the project according to the additivity principle of utility function [30] and record it as follows:
U T , C , Q , E , R , G = k T U T + k C U C + k Q U Q + k E U E + k R U R + k G U G
Among them, k T   , k C , k Q , k E , k R , and k G respectively, represent the weight of project duration, cost, quality, environmental protection, resource conservation, and carbon emission goals in multiple goals, reflecting managers’ preferences for each goal. And k T   + k C   + k Q   + k E   + k R   + k G   = 1 .
This paper uses a quadratic function on the interval 0–1 to express the single objective utility function of the construction project of the Yellow River Grand Bridge [31]. Taking the construction time goal as an example, it is set that when the construction time T = T max , the corresponding utility value of the goal is 0. When T = T min , the utility value is 1. Therefore, the quadratic concave utility function of the construction time goal is expressed as follows:
U T = ( T T max ) 2 ( T max T min ) 2 , T min T T max   0 , T T min , T max
In the same way, the quadratic utility function of the five objectives of cost, quality, environment, resources, and carbon emission can be obtained. Since the six main control objectives have the same importance, it is specified that k T = k C = k Q = k E = k R = k G = 1 / 6 . Then the multi-objective comprehensive utility optimization model for the construction of the Yellow River Grand Bridge can be written as follows:
f = max 1 6 T T max 2 T max T min 2 + 1 6 C C max 2 C max C min 2 + 1 6 Q Q min 2 Q max Q min 2 + 1 6 E E max 2 E max E min 2 + 1 6 R R min 2 R max R min 2 + 1 6 G G max 2 G max G min 2 T min T T max , T i min T i T i max C min C C max , C i min C i C i max Q min Q Q max , Q i min Q i Q i max E min E E max , E i min E i E i max R min R R max , R i min R i R i max G min G G max , G i min G i G i max
According to the model established in this paper, the longer the construction period, the higher the cost, the better the quality, and the higher the degree of environmental pollution. Since the construction of engineering projects often aims at a short construction period, low cost, good quality, and a low degree of environmental pollution, there are conflicts among the objectives of construction period, cost, quality, and environment. When considering six objectives, the established model tries to be close to the actual engineering situation, but there is still a certain idealization.

2.2. Algorithm Implementation

In the process of function optimization, the particle swarm optimization (PSO) algorithm continuously adjusts the position and velocity of particles through information sharing between particles to approximate the optimal solution [32]. However, the PSO algorithm is easy to converge in advance and fall into local optimum, and the convergence speed is slow in the later stage of the algorithm, and the search accuracy is insufficient [33]. In contrast, the simulated annealing (SA) algorithm has strong global search ability and can accept low-quality solutions with a certain probability, helping the algorithm to jump out of the shackles of local optimal solutions and improve search accuracy [34]. However, its convergence speed is affected by the high initial annealing temperature, which is relatively slow. In view of these characteristics of the PSO and the SA algorithm, this paper adopts a hybrid algorithm, simulated annealing particle swarm optimization (SA-PSO) algorithm, which combines the advantages of both algorithms [35]. The algorithm combines the probabilistic jump mechanism of the simulated annealing algorithm, aiming to solve the premature problem of the PSO algorithm and accelerate the convergence speed of the SA algorithm so as to enhance the performance of the whole algorithm [36].
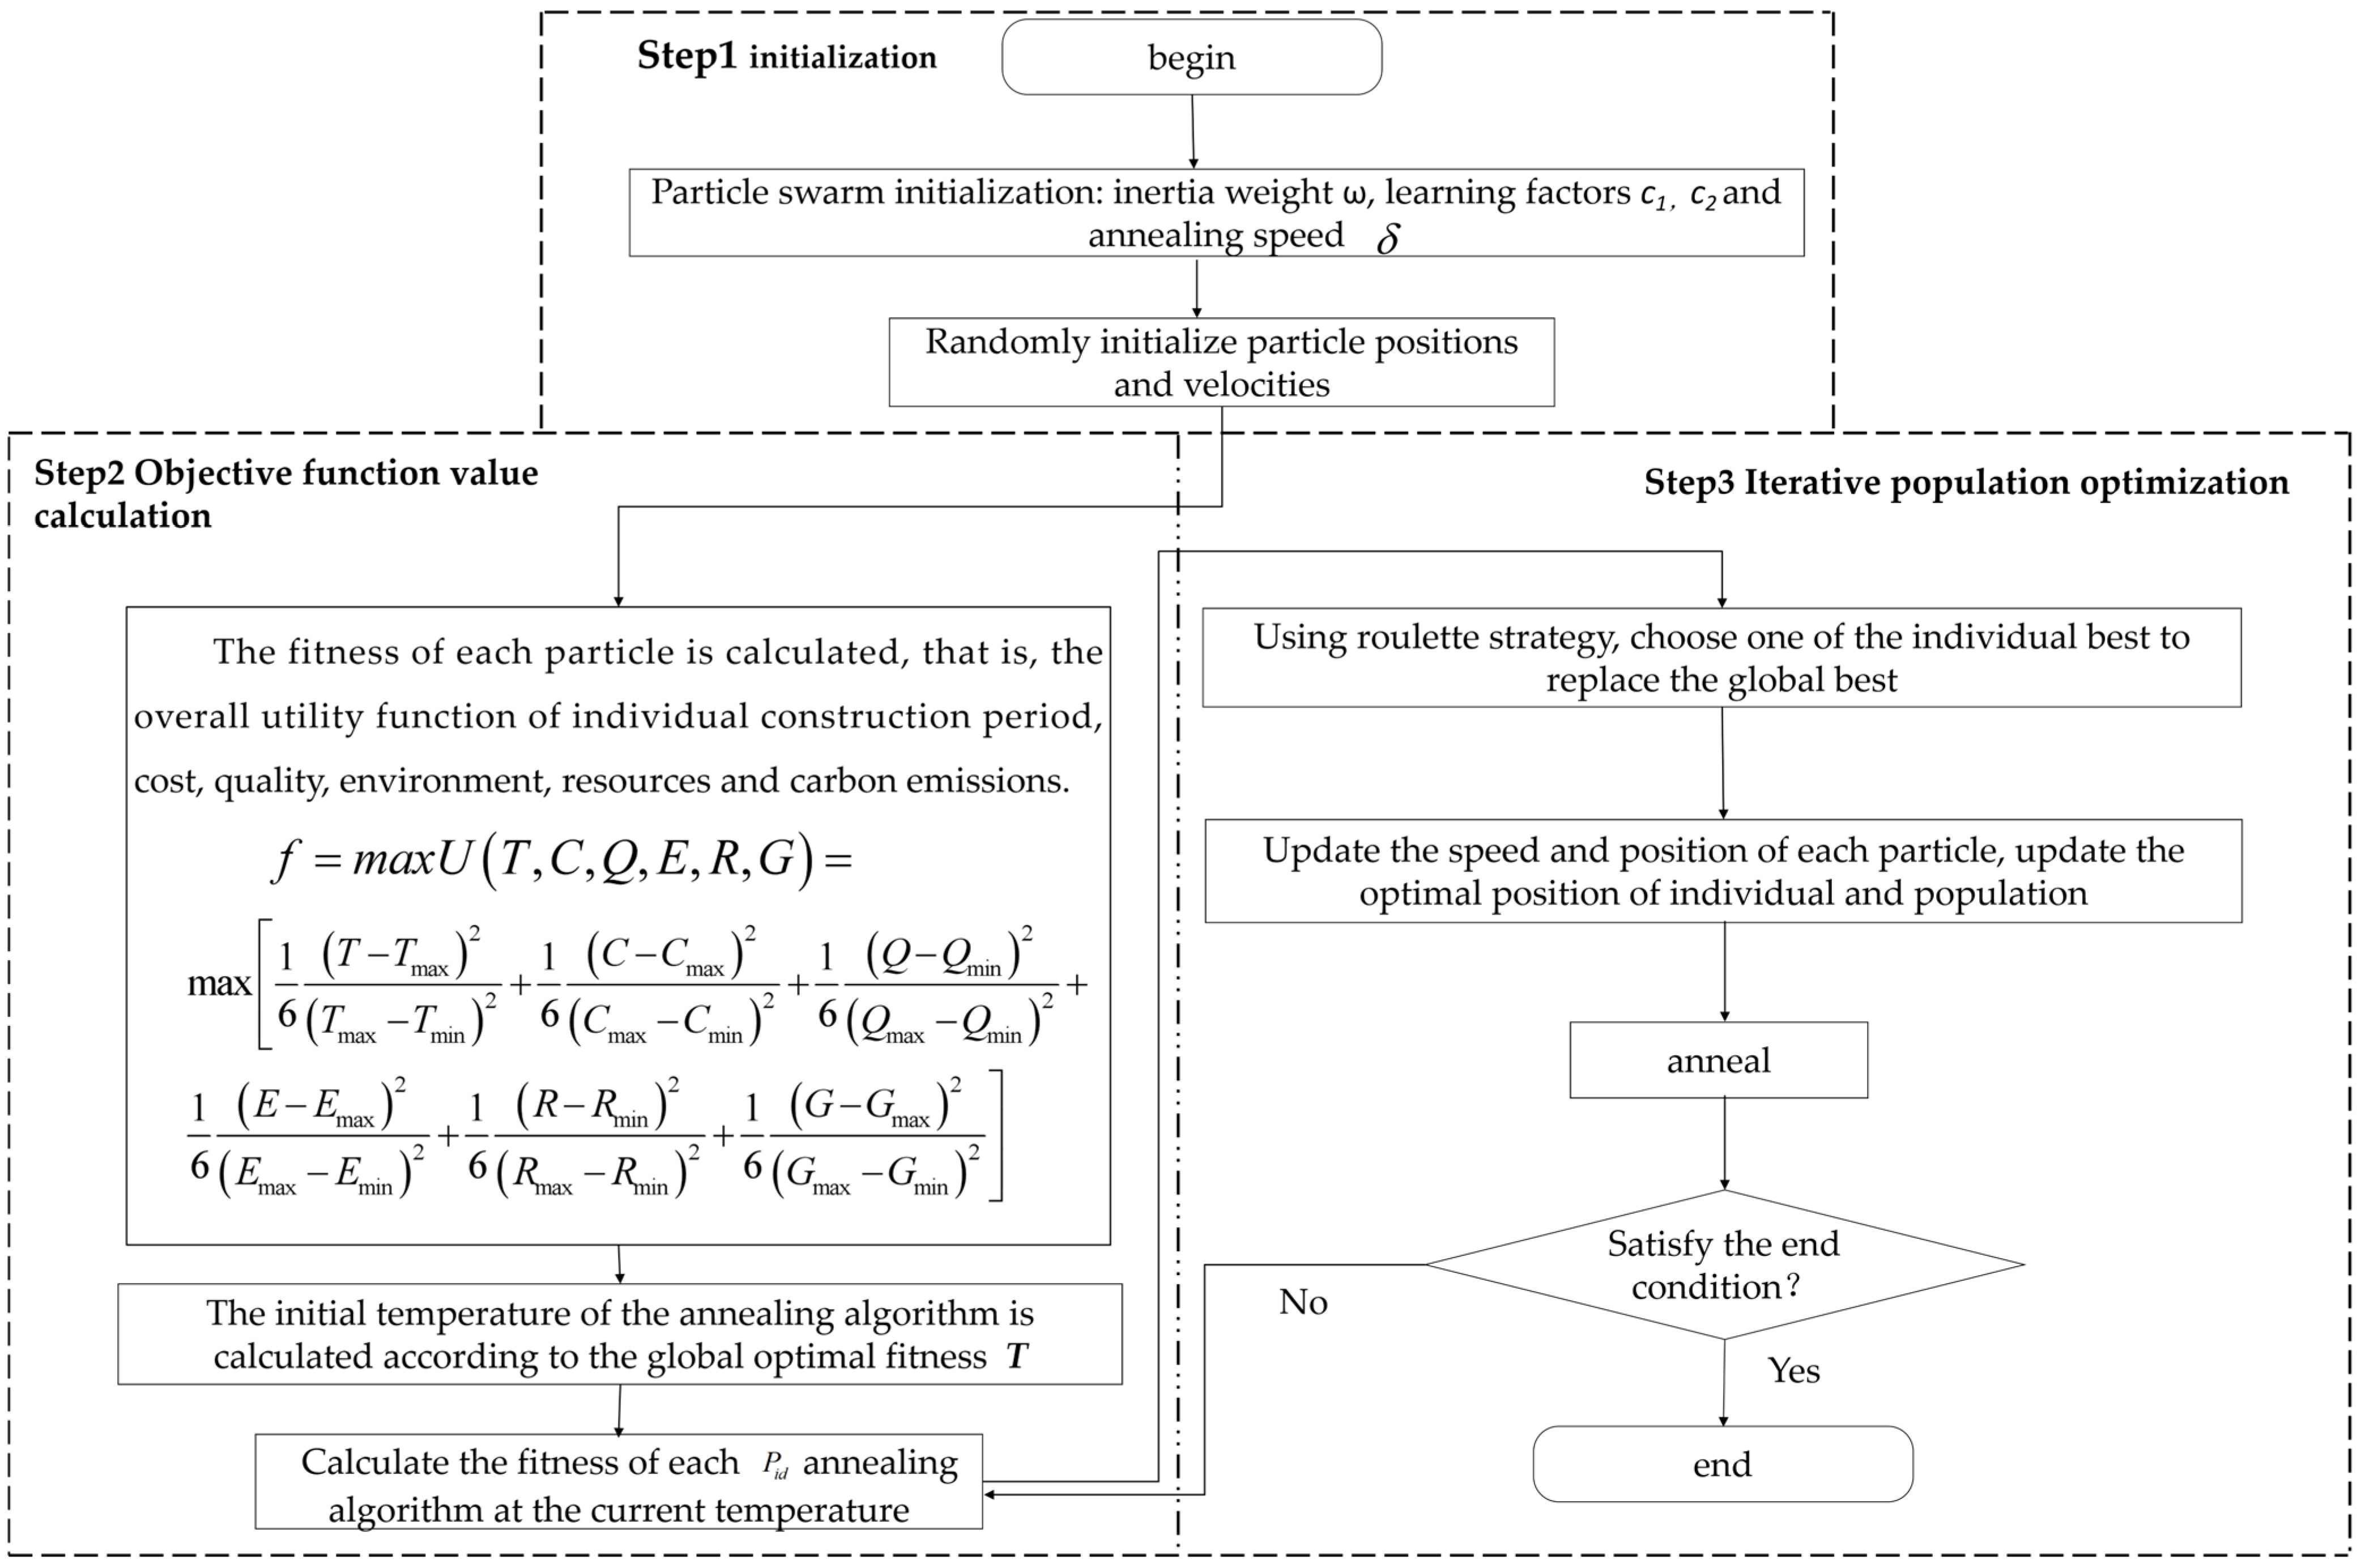
The process of simulating annealing particle swarm optimization for multi-objective optimization of the construction of the Yellow River Bridge is divided into three parts. The first part is the initialization of parameters, the second part is the calculation of the objective function, and the third part is the population iteration optimization operation [37]. The specific steps are as follows:
(1)
The inertia weight ω , learning factor c 1 , c 2 , annealing rate δ , number of iterations t, particle swarm size N, and other parameters were initialized [38];
(2)
N particles are randomly generated in the solution space; each particle has a different speed and position, and the dimension of the particle search space is D. In this project, the entire construction process of the bridge is divided into several processes, so D is the number of processes, and the object of optimization research is the construction duration of each process [39]. Then the particle’s initial position can be represented as x i 0 = x 1 0 , x 2 0 , , x D 0 , and the initial velocity can be expressed as ν i 0 = ν 1 0 , ν 2 0 , , ν D 0 .
(3)
Calculate the fitness of each particle i in the population, that is, max U T , C , Q , E , R , G . Record the position P i d , global optimal position P p d , fitness f P i d , and global optimal fitness f P p d for each (i th) particle [40].
(4)
The initial annealing temperature T is calculated based on the global optimal fitness f P p d .
(5)
Mark the function of the fitness of the annealing algorithm as f S A x , and calculate the fitness of the annealing algorithm under the optimal position P i d of each particle at the current temperature T [41].
(6)
Use the roulette selection mechanism to select one from the optimal particle position P i d to replace the global optimal position P p d , and mark it as the new global optimal position P r d .
(7)
Replace P p d with P r d , substitute it into the particle swarm velocity calculation formula, and update the velocity of each particle.
(8)
Recalculate the fitness of each particle, and update the individual optimal position P i d of each particle and the global optimal position P p d of the entire particle swarm accordingly [42].
(9)
Carry out the annealing operation.
(10)
Determine whether the termination condition is met. If it is met, stop the search and output the return value. If it is not met, go to step (5).
The implementation flowchart of the simulated annealing particle swarm algorithm (SA-PSO) in the multi-objective problem of the Yellow River Bridge construction is shown in Figure 7.

3. Result Analysis

3.1. Determination of Model Parameters

Based on the established utility functions for each objective, after calculation (the specific calculation process is shown in Appendix A), the multi-objective equilibrium utility model for the construction of the Yellow River Grand Bridge can be obtained as follows:
f = max 1 6 T 1407 2 1407 1237 2 + 1 6 C 243,790.6 2 243,790.6 242,773.2 2 + 1 6 Q 0.7701 2 1 0.7701 2 + 1 6 E 5314.18 2 5314.18 4672.97 2 + 1 6 R 0.7594 2 1 0.7594 2 + 1 6 G 46.19 2 46.19 42.75 2
constraint conditions are:
s . t . 1237 T 1407 242,773.2 C 243,790.6 0.7701 Q 1 4672.97 E 5314.18 0.7594 R 1 42.75 G 46.19

3.2. Model Solving

3.2.1. Algorithm Parameter Setting

In this paper, in order to realize the multi-objective equilibrium optimization of the construction time, cost, quality, environment, resources, and carbon emission objectives that meet the construction requirements of the Yellow River Grand Bridge, after establishing the multi-objective equilibrium optimization model, the particle swarm optimization algorithm and the simulated annealing particle swarm optimization algorithm are used to solve the model.
The construction process of the Yellow River Grand Bridge is divided into 20 processes, and the construction time of each process is regarded as the decision variable X, which together constitutes a 20-dimensional decision variable, and the particle dimension is 20. Because the reasonable setting of parameter values will affect the quality of the solution results, it is necessary to set some parameters of the algorithm reasonably before solving the model. The main parameters are set in Table 2.
The program input of the PSO and SA-PSO algorithms was carried out using MATLAB2021a, and relevant parameters were substituted. The iteration times were set as 300, 500, 800, 1000, and 1500 for testing. The running speed was relatively stable at 1000 times, so the maximum iteration times of the algorithm was determined to be 1000 times. The feasible domains of the particle in this paper are x min , x max D , respectively, which refer to the shortest and longest completion time of the process, as follows:
x min 20 = 28 , 113 , 143 , 139 , 171 , 55 , 21 , 49 , 52 , 55 , 21 , 49 , 52 , 203 , 232 , 236 , 168 , 145 , 28 , 24
x max 20 = 35 , 127 , 160 , 157 , 184 , 63 , 33 , 60 , 61 , 63 , 33 , 60 , 61 , 221 , 257 , 262 , 193 , 159 , 33 , 30

3.2.2. Construction Model Solution Based on PSO Algorithm

The PSO algorithm is used to solve the multi-objective equilibrium optimization model of the Yellow River Grand Bridge. After 1000 iterations, the operation is stopped. Figure 8 is the fitness function image optimized by the PSO algorithm.
As shown in Figure 8, after about 120 iterations, the fitness value of the population began to converge. When the number of iterations reached about 200 times, the population began to really converge and tend to be stable. At the same time, the maximum fitness value of the model was output at the command window. Moreover, at 0.4099, at this time, the objective function was optimal, the six objectives also achieved a relative balance, and there was an optimal solution. The optimal construction duration of each process is shown in Table 3.
When each process is constructed in strict accordance with the time listed in Table 3, each goal can be relatively optimal. At this time, the construction period of the whole project is 1316 days, 94 days earlier than the construction period stipulated in the contract. The cost is 2431.251 million yuan, which is 6.655 million yuan lower than the highest cost. The quality level is 0.817, which is 6.09% higher than the lowest quality level. The degree of environmental pollution is 4931.4, which is 7.2% lower than the maximum degree of environmental pollution. The degree of resource conservation is 0.873, which is 14.9% higher than the lowest resource conservation, and the carbon emission is 437,900 tons. It is 24,000 tons lower than the maximum carbon emission, and all the optimization values are within the target quantification range, which fully demonstrates the effectiveness of the PSO algorithm for solving multi-objectives.

3.2.3. Construction Model Solution Based on SA-PSO Algorithm

The improved particle swarm optimization algorithm, namely, the simulated annealing particle swarm optimization algorithm, is used to solve the multi-objective equilibrium optimization model of the Yellow River Grand Bridge. After 1000 iterations, the operation is stopped. Figure 9 is the fitness function image generated by the SA-PSO algorithm.
As shown in Figure 9, after about 200 iterations, the fitness value of the population began to converge and tended to be stable. At the same time, the maximum fitness value of 0.5497 was output at the command window, and the six objectives reached a relatively balanced optimal value. And T , C , Q , E , R , G = 1302 ,   242,829.4 ,   0.819 ,   4721.7 ,   0.796 ,   42.83 , the optimal construction in each process is shown in Table 4.
When each process is constructed in strict accordance with the time listed in Table 4, each target can be relatively optimal. At this time, the entire construction period of the project is 1302 days, 108 days ahead of the construction period stipulated in the contract; the cost is 2428.294 million yuan, which is 9612 million yuan less than the highest cost; and the quality level is 0.819. It is 6.3% higher than the lowest quality level, the environmental pollution degree is 4721.4, 11.1% lower than the maximum environmental pollution degree, the resource-saving degree is 0.796, 4.8% higher than the minimum resource-saving degree, and the carbon emission is 428,300 tons, which is 33,600 tons lower than the maximum carbon emission. All the optimization values are within the target quantification range. The effectiveness of the SA-PSO algorithm for solving multiple objectives is fully demonstrated.

3.2.4. Comparative Analysis of Optimization Results

In order to verify that the SA-PSO algorithm has better optimization performance than the PSO algorithm, the optimization results obtained by the two algorithms are compared, as shown in Table 5 and Table 6.
It can be seen from Section 3.1 that the critical path of the construction of the Yellow River Grand Bridge is A-B-D-G-H-I-O-P-Q-R-S-T. According to Table 5, the duration of each process on the critical path obtained by the PSO algorithm is A(34)-B(114)-D(142)-G(29)-H(55)-I(57)-O(242)-P(247)-Q(180)-R(156)-S(31)-T(29). The duration of each process on the critical path obtained by the SA-PSO algorithm is A(32)-B(115)-D(144)-G(23)-H(58)-I(54)-O(239)-P(241)-Q(187)-R(149)-S(32)-T(28). Compared with the PSO algorithm, the duration of the SA-PSO is 14 days less.
From Table 6, it can be seen that the optimal solution obtained by the improved particle swarm optimization algorithm is superior to the basic particle swarm optimization algorithm in the utility value of the equilibrium optimization model. Compared with the results obtained by the PSO algorithm, the construction period is reduced by 14 days, the cost is reduced by 2.957 million yuan, the carbon emission is reduced by 0.96 million tons, the degree of environmental pollution is reduced by 4.3%, and the two objectives of quality and resource saving are basically the same. For the construction project requirements of the Yellow River Grand Bridge, the particle swarm optimization algorithm and the simulated annealing particle swarm optimization algorithm can achieve multi-objective equilibrium optimization to a certain extent. However, the simulated annealing particle swarm optimization algorithm is more obvious than the particle swarm optimization algorithm in the optimization effect.
The comparative study shows that the multi-objective equilibrium optimization model of the construction of the Yellow River Bridge constructed in this paper is feasible and effective. The simulated annealing particle swarm optimization algorithm also shows good solution performance, which proves the superiority of the algorithm.

4. Conclusions

(1)
By analyzing the status quo of the multi-objective optimization management objective system and optimization algorithm of domestic and foreign construction projects, combining the concept of sustainable development and the dual carbon policy of our country, innovatively regarding carbon emission as one of the goals of the multi-objective problem of bridge construction, and clarifying the process of the construction of the Yellow River Grand Bridge. Time limit, cost, quality, environment, resources, and carbon emissions are the six main control objectives of the relationship between the mutual constraints and mutual influence.
(2)
Combined with the actual construction situation, construction environment, and relevant construction data of the Yellow River Grand Bridge, qualitative or quantitative analysis is carried out on the six main control targets, and the target model is established. The construction process of the Yellow River Grand Bridge is divided into 20 processes, and the target accounting of construction period, cost, quality, environment, resources, and carbon emission is carried out according to each target model according to the specific construction data. Based on the multi-attribute utility theory, the utility function of each target is obtained, and the multi-objective equilibrium utility optimization model of the Yellow River Bridge is constructed.
(3)
In view of the characteristic of insufficient local search ability in the Particle Swarm Optimization (PSO) algorithm, the idea of probabilistic sudden jumps in the Simulated Annealing (SA) algorithm is introduced into the PSO algorithm to form the Simulated Annealing Particle Swarm Optimization (SA-PSO) algorithm, thus overcoming the drawback of premature convergence in the PSO algorithm. The PSO algorithm and the SA-PSO algorithm are, respectively, used to solve the multi-objective balanced optimization model of the Yellow River Grand Bridge. The optimal construction time for each working procedure and the optimal results that each objective can achieve are obtained.
(4)
To address the issue of difficult multi-objective balance in the construction process of the Yellow River Grand Bridge, this paper establishes six target models for construction period, cost, quality, environment, resources, and carbon emissions. Based on the multi-attribute utility theory, it normalizes each target model and constructs a multi-objective equilibrium utility optimization model for the Yellow River Grand Bridge. Finally, the Particle Swarm Optimization (PSO) algorithm and the Simulated Annealing Particle Swarm Optimization (SA-PSO) algorithm are used to solve the model, respectively. It is found that both algorithms can achieve relative balance of multiple objectives by optimizing construction time so as to shorten the construction period, reduce costs, improve construction quality, reduce environmental pollution, save resources, and reduce carbon emissions. However, by comparing the optimization results of the two algorithms, it can be seen that the SA-PSO algorithm has a better optimization effect: compared with the results of the PSO algorithm, the construction period is shortened by 14 days, the cost is reduced by 2.957 million yuan, the carbon emissions are reduced by 9600 tons, the degree of environmental pollution is reduced by 4.3%, and the two objectives of quality and resource conservation are basically the same. This verifies the superiority of the improved algorithm and provides a theoretical basis for construction parties and managers to make better decisions in project multi-objective management.

5. Prospect

The multi-objective optimization problem in bridge engineering construction has always been a hot topic in the transportation industry. In recent years, with the deepening of the concept of sustainable development, the promotion of green construction technologies, and the implementation of the Dual Carbon policy, environment, resources, and carbon emissions have gradually become the main control objectives for multi-objective optimization. Based on this, this paper takes the Jiaoping Expressway Yellow River Super Large Bridge as a case study, establishes a multi-objective equilibrium optimization model for construction period-quality-cost-environment-resources-carbon emissions in its construction, and uses the Simulated Annealing Particle Swarm Optimization (SA-PSO) algorithm to solve the model. However, due to limitations in personal capabilities, data availability, and the complexity of the Yellow River Bridge project itself, there are still many shortcomings that need further improvement and in-depth research.
(1)
Incomplete consideration in analyzing influencing factors and constructing objective models
When analyzing the influencing factors of each objective and constructing objective models in combination with the actual construction of the Yellow River Super Large Bridge, the consideration was not comprehensive enough, especially for the three objectives of quality, environment, and resources. Only a few representative influencing factors were selected, lacking consideration of other relevant influencing factors. Moreover, the established models are relatively idealized. It is necessary to deeply engage with engineering practices, consider multiple perspectives comprehensively, and ensure that the constructed models can better guide project construction.
(2)
Inadequate accounting of carbon emissions
Due to conditional limitations, the research on carbon emissions only accounted for the carbon emissions from three parts of the construction process: building material production, material transportation, and mechanical construction. Carbon emissions from workers’ production and daily life, lighting facilities, and other aspects throughout the project construction process were ignored. In future research, it is necessary to further supplement and improve this aspect.

Author Contributions

Conceptualization: J.H.; Investigation: J.H.; Data curation: J.J.; Formal analysis: J.J.; Methodology: M.W.; Software: M.W.; Writing—original draft: M.W.; Validation: Q.L.; Writing—review & editing: Q.L. All authors have read and agreed to the published version of the manuscript.

Funding

This research received no external funding.

Data Availability Statement

Due to engineering privacy considerations, the data cannot be made publicly available.

Conflicts of Interest

Author Jing Hu and Jinke Ji were employed by the company Henan Jiaozheng Expressway Co., Ltd. The authors declare that the research was conducted in the absence of any commercial or financial relationships that could be construed as a potential conflict of interest.

Appendix A. Correlation Data Preprocessing

Due to the special geographical location, multiple superstructure types, and complex construction technology and technology of the Yellow River Super Bridge in this project, only the representative main bridge is selected as the research object to illustrate the application of the method in this paper. The construction of the main bridge of the Yellow River Bridge is mainly divided into four stages, which are the construction preparation period, the construction period of the main bridge substructure, the construction period of the main bridge superstructure, and the construction end period. The key construction technologies include steel beam manufacturing, stacking and transportation, bridge panel prefabrication and transportation, pile foundation construction, platform construction, pier construction, steel main beam pushing construction, and bridge panel installation. According to the actual construction situation, the construction process is divided into 20 processes. The construction contents of each process and the preceding processes are shown in Table A1.
Table A1. Breakdown table of the construction process of the main bridge of the Yellow River Grand Bridge.
Construction PhaseOperation NumberProcess ContentTight Pre-Operation
Construction preparation periodAConstruction preparation-
BConcrete and steel structure processingA
CBridge deck precastB
DPile foundation steel cage processingB
EConstruction of main and branch trestlesA
Main bridge substructure constructionFConstruction of the 2nd, 3rd, and 6th pile foundationsE
GConstruction of the 2nd, 3rd, and 6th cofferdamsF
HConstruction of the 2nd, 3rd, and 6th joint bearing platformsG
IConstruction of the 2nd, 3rd, and 6th piersH
JConstruction of the 1st, 4th, and 5th pile foundationsD, I
KConstruction of the 1st, 4th, and 5th cofferdamsJ
LConstruction of the 1st, 4th, and 5th joint bearing platformsK
MConstruction of the 1st, 4th, and 5th piersL
Main bridge superstructure constructionNAssembly platform and lifting beam equipment erectionE
OThe 2nd, 3rd, and 6th unit jacking constructionN, I
PConstruction of the 1st, 4th, and 5th jointsM, O
QInstall bridge deckC, P
RBridge deck paving and ancillary engineering constructionQ
Construction finishing periodSLoad testR
TDelivery and acceptanceS
According to Table A1, the network plan diagram for the construction of the main bridge of the Yellow River Bridge can be obtained, as shown in Figure A1:
Figure A1. Network plan of the construction process of the main bridge of the Yellow River Bridge.
Buildings 15 02371 g0a1
According to Figure A1 and Table A1, it can be seen that the critical path for the construction of the Yellow River Grand Bridge is A-B-D-G-H-I-O-P-Q-R-S-T (the path has been bolded in the network plan).
Through calculation, it can be concluded that the shortest construction period of the Yellow River Bridge is 1237 days, and the longest construction period is 1407 days (the contract period is 1410 days). The construction indirect cost is 54,000 yuan/day, the minimum total cost is 2427.732 million yuan, and the highest total cost is 2437.906 million yuan. The lowest quality level of construction is 0.7701, and the highest quality level is 1. The minimum environmental pollution degree is 4672.97, and the maximum environmental pollution degree is 5314.18. The minimum resource-saving degree is 0.7594, and the maximum resource-saving degree is 1. The maximum carbon emission is about 461,900 tons, and the minimum carbon emission is about 427,500 tons.

References

  1. Zhang, T. Research on Construction Quality Control Technology of Yellow River Bridge Based on Reliability Theory. Master’s Thesis, Zhengzhou University, Zhengzhou, China, 2023. [Google Scholar]
  2. Zhang, F.; Gu, R.; Zhu, F. Optimal Scheduling of Multi-dimensional Overhaul Resources for High-safety Equipment. Manuf. Autom. 2024, 46, 69–77. [Google Scholar]
  3. Afshar, A.; Ziaraty, A.K.; Kaveh, A.; Sharifi, F. Nondominated Archiving Multicolony Ant Algorithm in Time-Cost Trade-Off Optimization. J. Constr. Eng. Manag. 2009, 135, 668–674. [Google Scholar] [CrossRef]
  4. El-Rayes, K.; Kandil, A. Time-Cost-Quality Trade-Off Analysis for Highway Construction. J. Constr. Eng. Manag. 2005, 131, 477–486. [Google Scholar] [CrossRef]
  5. Zhang, L.; Yue, Y. Fuzzy Equilibrium Optimization of Duration-Cost-Quality and Its Pareto Solutions. J. Tongji Univ. (Nat. Sci.) 2013, 41, 303–308+316. [Google Scholar]
  6. Liu, J.; Liu, Y.; Shi, Y. Research on the Optimization Method of Trade-offs among Construction Project Duration, Cost and Quality Based on Fuzzy Set Theory. J. Beijing Jiaotong Univ. (Soc. Sci. Ed.) 2017, 16, 30–38. [Google Scholar]
  7. Diao, X.; Li, H.; Zeng, S.; Tam, V.W.; Guo, H. A Pareto Multi-Objective Optimization Approach for Solving Time-Cost-Quality Tradeoff Problems. Technol. Econ. Dev. Econ. 2011, 17, 22–41. [Google Scholar] [CrossRef]
  8. Tao, J. Research on Multi-Objective Optimization of Municipal Road Construction Management. Master’s Thesis, Southwest Jiaotong University, Chengdu, China, 2022. [Google Scholar]
  9. Panwar, A.; Jha, K.N. Integrating Quality and Safety in Construction Scheduling Time-Cost Trade-Off Model. J. Constr. Eng. Manag. 2021, 147, 04020160. [Google Scholar] [CrossRef]
  10. Tran, D.-H.; Luong-Duc, L.; Duong, M.-T.; Le, T.-N.; Pham, A.-D. Opposition multiple objective symbiotic organisms search (OMOSOS) for time, cost, quality and work continuity tradeoff in repetitive projects. J. Comput. Des. Eng. 2018, 5, 160–172. [Google Scholar] [CrossRef]
  11. Zeng, Q.; Yang, Y.; Wang, X.; Zhao, C. A Multi-objective Optimization Scheduling Method for Tasks in Large-scale Engineering Projects. Comput. Eng. Appl. 2021, 46, 217–221+248. [Google Scholar]
  12. Li, X.; Wang, Z.; Liu, X.; Mao, J. Multi-objective Optimization of Engineering Projects Based on Vector Evaluated Genetic Algorithm. Port Waterw. Eng. 2023. [Google Scholar]
  13. Zadeh, L. Optimality and Nonscalar-Valued Performance Criteria. IEEE Trans. Control 1963, 8, 59–60. [Google Scholar] [CrossRef]
  14. Haimes, Y.Y. The Surrogate worth Trade-Off Method and Its Extensions. In Muitiple Criteria Decision Making Theory and Application, Proceedings of the Third Conference Hagen, Königswinter, Germany, 20–24 August 1979; Springer: Berlin/Heidelberg, Germany, 1979. [Google Scholar]
  15. Schaffer J, D. Multiple objective optimization with vector evaluated genetic algorithms. In Proceedings of the First International Conference on Genetic Algorithms and Their Applications, Pittsburgh, PA, USA, 24–26 July 1985; Psychology Press: East Sussex, UK, 2014; pp. 93–100. [Google Scholar]
  16. Liu, L.; Wei, X.; Li, M. Research on comprehensive equilibrium optimization of green building project management. Math. Pract. Theory 2014, 44, 48–55. [Google Scholar]
  17. Huo, Y.; Bao, X.; Li, A.; Ban, X.; Xu, J. Research on the Multi-objective Collaborative Optimization of Construction Processes for Railway Engineering Technical Interfaces. J. China Railw. Soc. 2024, 46, 183–192. [Google Scholar]
  18. Zhuo, J.; Lu, H. Research on multi-objective optimization problems of engineering projects based on particle swarm algorithm. J. Eng. Manag. 2017, 31, 101–106. [Google Scholar]
  19. Gao, Y.; Xie, S. Particle swarm optimization algorithm based on simulated annealing. Comput. Eng. Appl. 2004, 35, 47–50. [Google Scholar]
  20. Wen, J. Research on Multi-Objective Optimization of Engineering Projects Based on Improved Particle Swarm Algorithm. Master’s Thesis, Xi’an University of Architecture and Technology, Xi’an, China, 2023. [Google Scholar]
  21. Wu, Y. Multi-Objective Optimization Problem of Microservice Container Scheduling Based on Improved Grey Wolf Algorithm. Master’s Thesis, Dalian Jiaotong University, Dalian, China, 2023. [Google Scholar]
  22. Han, H. Research on engineering project optimization based on target PSO algorithm. J. Southwest Univ. (Nat. Sci. Ed.) 2023, 45, 167–177. [Google Scholar]
  23. Ma, C.; Zhang, S.; Li, Y.; Chen, H. Multi-objective Equilibrium Optimization of Large-scale Engineering Projects Considering Risks. Comput. Eng. 2013, 39, 270–273+278. [Google Scholar]
  24. Gao, Y.; Li, H.; Wang, N. Multi-objective Fuzzy Equilibrium Optimization of Engineering Projects under Uncertain Conditions. Math. Pract. Theory 2010, 40, 152–159. [Google Scholar]
  25. Chen, Y. Multi-Objective Equilibrium of Green Construction Project Based on GA-PSO Algorithm Optimization Research. Master’s Thesis, Yangzhou University, Yangzhou, China, 2019. [Google Scholar]
  26. Wang, Y.; Li, Y. Research on the Multi-objective Equilibrium Optimization of Green Construction Management in Engineering Projects. Comput. Eng. Appl. 2010, 46, 7–10. [Google Scholar]
  27. Wang, L.; Chen, R.; Dai, L.; Tu, R. Research on the Optimization of Multi-objective Maintenance Decision-making for Bridge Groups Oriented to the Low-carbon Concept. China J. Highw. Transp. 2024, 37, 188–200. [Google Scholar]
  28. Wang, Y.; Tian, R.; Li, S.; Liu, N. Carbon Emission Calculation Method for the Construction Period of Concrete Bridges Considering the Collinearity of Multiple Explanatory Variables. J. Civ. Environ. Eng. (Chin. Engl.) 2024, 27, 368504251326839. [Google Scholar]
  29. Wang, Z.; Xu, M.; Wang, P.; Cheng, A.; Zhao, W.; Chen, Z. Optimization of Roadway Support Based on Multi-attribute Utility Theory. Sci. Technol. Eng. 2019, 19, 64–69. [Google Scholar]
  30. Rueda-Benavides, J.; Khalafalla, M.; Miller, M.; Gransberg, D. Cross-asset prioritization model for transportation projects using multi-attribute utility theory: A case study. Int. J. Constr. Manag. 2023, 23, 2746–2755. [Google Scholar] [CrossRef]
  31. Lin, T.; Jia, L.; Dong, Y.; Zhang, J. A Decision-making Algorithm for Bridge Comprehensive Performance Maintenance Based on Multi-attribute Utility. J. Basic Sci. Eng. 2023, 31, 1278–1296. [Google Scholar]
  32. Zhang, B.; Liang, Y. Research on Discrete Flexible Job-shop Scheduling Problem Based on an Improved Multi-objective PSO Algorithm. Modul. Mach. Tool Autom. Manuf. Tech. 2022, 36, 33–37. [Google Scholar]
  33. Liu, L.; Jiang, L.; Zhang, B. Multi-radar Optimal Site Layout Based on Improved Simulated Annealing with Optimal Neighborhood Search. J. Southeast Univ. (Nat. Sci. Ed.) 2024, 54, 1322–1329. [Google Scholar]
  34. Shao, L.; Wang, Z.; Li, C. An Optimization Algorithm for Mine Ventilation Based on Simulated Annealing and Improved Particle Swarm. J. Syst. Simul. 2021, 33, 2085–2094. [Google Scholar]
  35. Xie, R. Research on Resource Monitoring and Scheduling Based on Hybrid Particle Swarm Optimization Algorithm in Cloud Platform. Inf. Comput. (Theor. Ed.) 2024, 36, 6–9+29. [Google Scholar]
  36. Mirmozaffari, M.; Hejazi, S.M.; Karamizadeh, N.; Montazeri, A. A mixed-integer non-linear no-wait open-shop scheduling model for minimizing makespan and total tardiness in manufacturing. Decis. Anal. J. 2024, 10, 100403. [Google Scholar] [CrossRef]
  37. Mao, Z.; Wang, W.; Fang, K.; Huang, D. Research on Human-Machine Collaborative Assembly Line Balancing Problem Based on Simulated Annealing Algorithm. Control Decis. 2024, 39, 3366–3374. [Google Scholar]
  38. Chen, S. Research on Bus Scheduling Method Based on Simulated Annealing Algorithm. Master’s Thesis, Beijing University of Posts and Telecommunications, Beijing, China, 2018. [Google Scholar]
  39. Chen, Y.; You, W. GNSS Height Anomaly Fitting Based on BP Neural Network Optimized by Simulated Annealing Particle Swarm Optimization Algorithm. Geomat. Spat. Inf. Technol. 2025, 48, 16–19. [Google Scholar]
  40. Mei, Y. Optimal Scheduling of Microgrid Based on Simulated Annealing Particle Swarm Optimization Algorithm. Mod. Inf. Technol. 2025, 9, 134–138. [Google Scholar] [CrossRef]
  41. Zhang, C.; Ma, G. Parameter Identification Method of Permanent Magnet Synchronous Motor Based on Simulated Annealing Particle Swarm Optimization Algorithm. Micromotors 2024, 57, 18–23. [Google Scholar] [CrossRef]
  42. Gong, Z.; Liu, Q.; Ji, J.; Liu, C.; Teng, Z. Research on emergency resource optimal regulation method based on improved particle swarm optimization algorithm. Electron. Des. Eng. 2024, 32, 45–49. [Google Scholar] [CrossRef]
Figure 1. Direct cost versus construction time graph.
Buildings 15 02371 g001
Figure 2. Indirect cost versus construction time graph.
Buildings 15 02371 g002
Figure 3. Process construction time and process quality relationship diagram.
Buildings 15 02371 g003
Figure 4. The relationship between construction environment impact and construction time.
Buildings 15 02371 g004
Figure 5. The relationship between resource-saving degree and duration of a certain process.
Buildings 15 02371 g005
Figure 6. The relationship between process carbon emission and direct cost.
Buildings 15 02371 g006
Figure 7. SA-PSO algorithm is used to solve the multi-objective optimization flowchart of Yellow River Grand Bridge construction.
Buildings 15 02371 g007
Figure 8. Optimization result of PSO algorithm. Note: 适应度 is Fitness, PSO适应度曲线 is PSO Fitness Curve, 终止代数 is Termination Generation, 进化代数 is Evolutionary Generation.
Buildings 15 02371 g008
Figure 9. Optimization result of the SA-PSO algorithm. Note: 适应度 is Fitness, SA-PSO适应度曲线 is PSO Fitness Curve, 终止代数 is Termination Generation, 进化代数 is Evolutionary Generation.
Buildings 15 02371 g009
Table 1. Carbon emission factors of main machinery and equipment in the construction of the Yellow River Grand Bridge.
Machine NamePerformance SpecificationCarbon Emission Factor tCO2e/Platform
Crawler bulldozer75 kW1.45 × 10−1
Crawler-type single-bucket excavator2.0 m31.62 × 10−1
Concrete mixer250 L2.73 × 10−2
Concrete spreaderRadius = 20 m6.82 × 10−2
Ac arc welding machine32 kVA7.73 × 10−2
Ac butt welding machine75 kVA1.24 × 10−1
100 kVA9.77 × 10−2
Steel strand drawing equipment-1.3 × 10⁻²
truck8 t9.12 × 10−2
15 t1.92 × 10−1
Dump truck3 t6.96 × 10−2
Crawler crane15 t7.59 × 10−2
Truck crane5 t5.71 × 10−2
12 t7.85 × 10−2
16 t9.21 × 10−2
20 t9.87 × 10−2
75 t2.3 × 10−1
Light wheel roller6–8 t1.55 × 10−2
10–12 t2.7 × 10−2
Motorized air compressor9 m3/min1.55 × 10−1
Concrete jet-1.23 × 10⁻²
Concrete transfer pump60 m3/h1.95 × 10−1
Gantry crane120 t2.72 × 10−1
Rotary drillD3000 mm8.21 × 10−1
Mud mixer-7.8 × 10⁻³
Single-barrel slow-moving winch80 kN5.43 × 10−2
Double-barrel slow-moving winch250 kN2.59 × 10−1
Electric multistage water pumpD150 mm2.42 × 10−1
Prestressed stretcher65 t1.3 × 10−2
90 t1.3 × 10−2
500 t1.3 × 10−2
Flatbed trailer set20 t1.17 × 10−1
100 t2.59 × 10−1
Cable press-5.72 × 10⁻²
Asphalt mixing equipment30 t/h2.79 × 100
Asphalt distributor4000 L7.61 × 10−2
Table 2. Set the main parameters of the SA-PSO algorithm.
AlgorithmLearning Factor c 1 Learning Factor c 2 Population Size N Inertia Weight ω Annealing Rate δ Particle Renewal Rate v max Particle Renewal Rate v min
PSO1.494451.494451000.8-0.5−0.5
SA-PSO1.491.491000.80.90.5−0.5
Table 3. Optimization results of each process duration.
Description of operationABCDEFG
Construction time341141501421765829
Description of operationHIJKLMN
Construction time555759305457214
Description of operationOPQRST
Construction time2422471801563129
Table 4. Optimization results of each process duration.
Process nameABCDEFG
Duration321151481441715923
Process nameHIJKLMN
Duration585455315960208
Process nameOPQRST
Duration2392411871493228
Table 5. Comparison of optimization results of each process duration between the PSO algorithm and the SA-PSO algorithm.
Process nameABCDEFG
PSO algorithm optimal construction time341141501421765829
SA-PSO algorithm optimal construction time321151481441715923
Process nameHIJKLMN
PSO algorithm optimal construction time555759305457214
SA-PSO algorithm optimal construction time585455315960208
Process nameOPQRST
PSO algorithm optimal construction time2422471801563129
SA-PSO algorithm optimal construction time2392411871493228
Table 6. Comparison of all objective optimization results between the PSO algorithm and the SA-PSO algorithm.
Process NameTCQERG
PSO algorithm1316243125.10.8174931.40.87343.79
SA-PSO algorithm1302242829.40.8194721.70.79642.83
Disclaimer/Publisher’s Note: The statements, opinions and data contained in all publications are solely those of the individual author(s) and contributor(s) and not of MDPI and/or the editor(s). MDPI and/or the editor(s) disclaim responsibility for any injury to people or property resulting from any ideas, methods, instructions or products referred to in the content.